the Creative Commons Attribution 4.0 License.
the Creative Commons Attribution 4.0 License.
 | 21 Aug 2023
Experiments of the efficacy of tree ring blue intensity as a climate proxy in central and western China
Yonghong Zheng
Huanfeng Shen
Rory Abernethy
To investigate the potential value of tree ring blue intensity as a robust climate proxy in central and western China, four species from five sites were assessed. As well as latewood inverted blue intensity, we also examined earlywood blue intensity. To explore the sensitivity of using different extraction parameter settings using the software CooRecorder, seven percentile (P) variant settings for earlywood blue intensity and latewood inverted blue intensity were used, namely P50 : 50, P60 : 40, P70 : 30, P80 : 20, P85 : 15, P90 : 10, and P95 : 5. Age-dependent spline was used for all, and the positive trends were not retained. Correlation analysis was applied between the tree ring parameter chronologies and monthly/seasonal mean temperature, precipitation, and self-calibrated Palmer drought severity index variables. Linear regression was also used to further highlight the potential of developing climate reconstructions using these species. Only subtle differences were found between the different percentile extraction variants. As has been shown for many other Northern Hemisphere studies, latewood inverted blue intensity expresses a strong positive relationship with growing-season temperatures (the two southern sites explain almost 56 % of the temperature variance when combined). However, the low latitude of these sites shows an exciting potential for regions south of 30∘ N that are traditionally not targeted for temperature reconstructions. Earlywood blue intensity also shows good potential to reconstruct hydroclimate parameters in some humid areas.
- Article
(6826 KB) - Full-text XML
-
Supplement
(1092 KB) - BibTeX
- EndNote


Tree ring blue intensity (BI), also sometimes called blue reflectance, was initially explored as a substitute for maximum latewood density (MXD). It has been shown to express a similar dendroclimatic potential to density parameters and is relatively inexpensive and easy to produce (Yanosky and Robinove, 1986; Björklund et al., 2015, 2019; Reid and Wilson, 2020; Kaczka et al., 2018; Wilson et al., 2014). Sheppard et al. (1996) first confirmed that reflected-light image analysis could provide a substitute for X-ray densitometry for dendroclimatology and derived the first reflected-light-based temperature reconstruction. These earlier studies (Sheppard et al., 1996; Yanosky and Robinove, 1986) used video-camera-based systems for image capture. McCarroll et al. (2002) later showed that a scanner-based system could be used to capture suitable digital images and assessed the suitability of mean, maximum, and minimum reflectance values for red, green, and blue visible light, as well as ultraviolet bands, by correlating the reflectance data with maximum density, which showed that minimum blue reflectance was the most robust proxy measure of latewood density. McCarroll et al. (2002) proposed that the minimum blue light reflectance measured the amount of light absorbed by lignin in the latewood cell walls. Campbell et al. (2007, 2011) advanced the scanner-based system method (McCarroll et al., 2002) by avoiding reliance on specialist image analysis software and utilized the commercial and widely used software WinDENDRO™ to confirm that minimum blue intensity measurements from resin-extracted Scots pine laths provided a robust and reliable surrogate for maximum density and summer temperatures. Compared to WinDENDRO™, a lower-cost alternative for measuring BI was incorporated into the CooRecorder and CDendro software package, by which several early experiments were conducted, and protocols were proposed (Rydval et al., 2014; Wilson et al., 2012, 2014). This approach is now becoming more and more popular in the tree ring community (Kaczka and Wilson, 2021).
BI-based tree ring research, focusing on both climate and ecology-based studies, has been widely carried out in Europe (Helama et al., 2013; Babst et al., 2009; McCarroll et al., 2002; Campbell et al., 2007; Rydval et al., 2014; Dolgova, 2016; Fuentes et al., 2018) and North America (Wilson et al., 2014; Wiles et al., 2019; Harley et al., 2021; Heeter et al., 2021; Wilson et al., 2019; Wang et al., 2020). Recently, some attempts have been made to explore the utility of BI for dendroclimatology in Australia (Wilson et al., 2021; Brookhouse and Graham, 2016; Blake et al., 2020; O'Connor et al., 2022) and Asia (Buckley et al., 2018; Cao et al., 2022; Davi et al., 2021). As the biggest territory in Asia, China has several types of climates due to different geographical zones, providing a golden opportunity to conduct BI-based dendroclimatic experimental research. To date, tree ring metrics, such as tree ring width (RW), stable isotopes, and density have been used in a very unbalanced way in China. A recent review (He et al., 2019) detailing advances in dendroclimatology in China showed that tree ring width, stable oxygen, stable carbon, and density account for 73 %, 13 %, 7 %, and 7 % of all reviewed chronologies from China respectively, with BI not being mentioned at all. In fact, BI-based dendroclimate research has been extremely rare in China to date (Cao et al., 2022, 2020). It is obvious that there are significant gaps in and opportunities for BI-based dendroclimate research in China.
Building on Rydval et al. (2014), who provided a methodological guide for the generation of BI data using CooRecorder, we present here extended experiments exploring the sensitivity of using a range of percentile extraction parameterizations for both dark (latewood) and light (earlywood) pixels for BI data generation. Our study utilizes samples from four conifer species from western and central China (Fig. 1) and assesses the potential of these species for BI-based dendroclimate research.
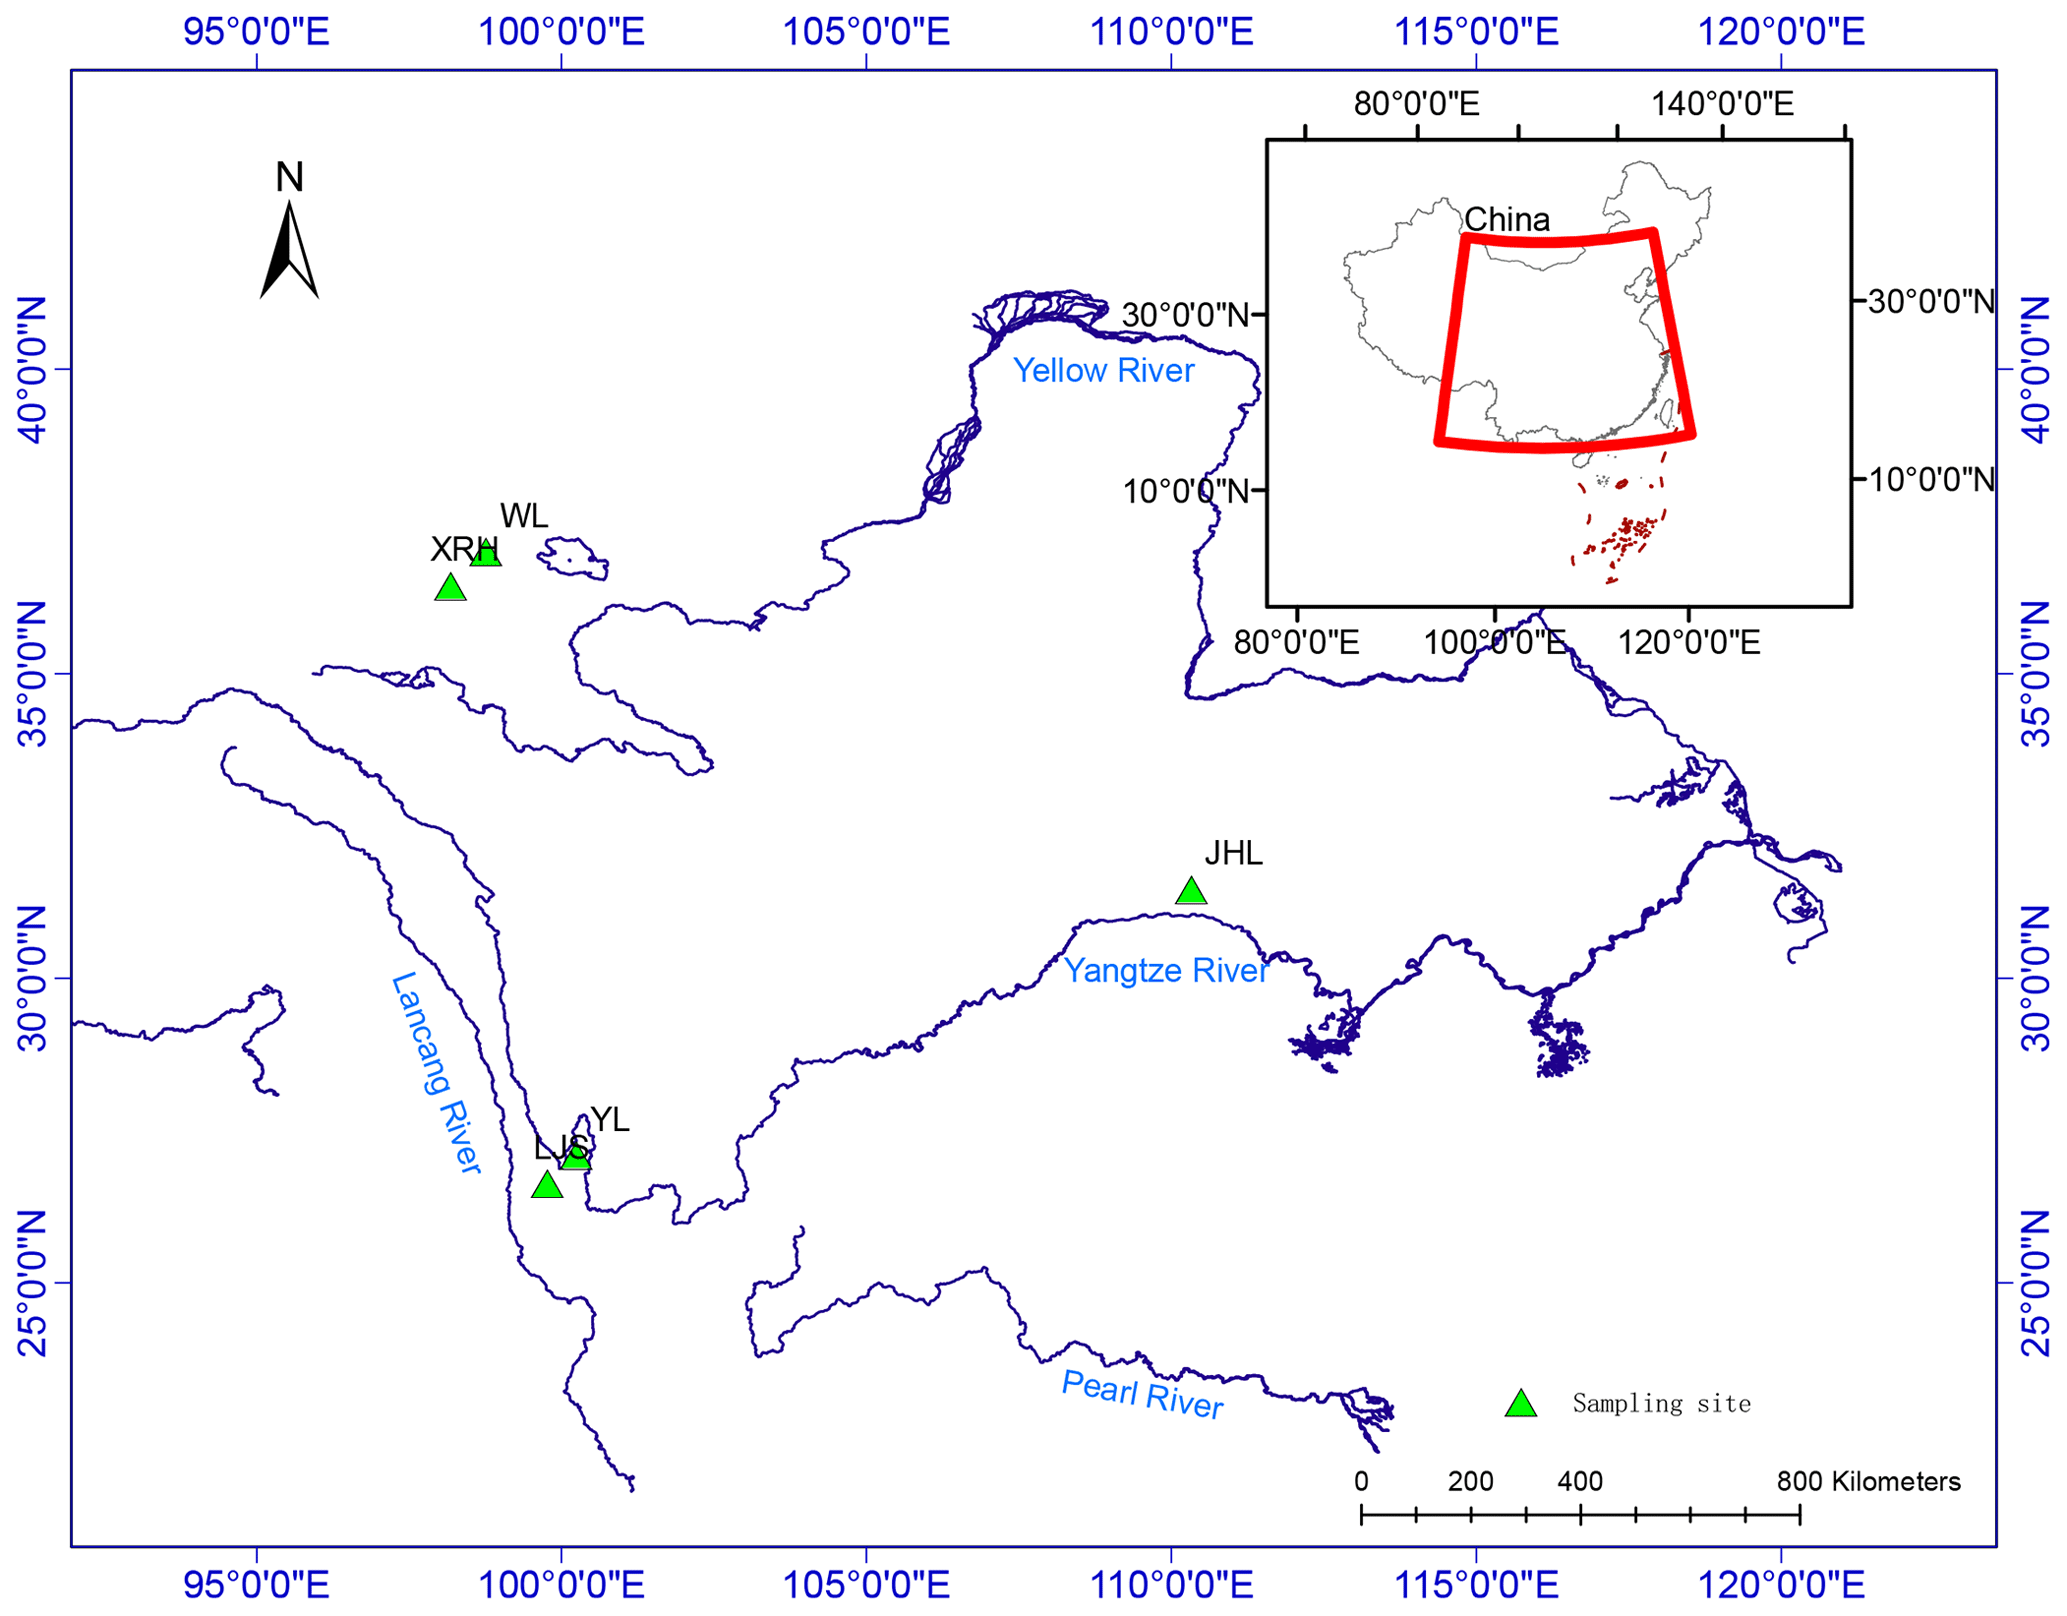
Figure 1Map of the study area showing sampling sites.
2.1 Study location and sample information
For this study, increment cores were taken between 2013 and 2021 for four coniferous tree species from five sites across China (Table 1): Picea crassifolia from Wulan County (WL) and Xiariha (XRH) in Dulan County of Qinghai Province, Abies fargesii from Jinhouling (JHL) of Shennongjia Mountain in Hubei Province, and Picea likiangensis and Abies fargesii var. faxoniana from Yulong Snow Mountain (YL) and Laojunshan (LJS) in Yunnan Province.
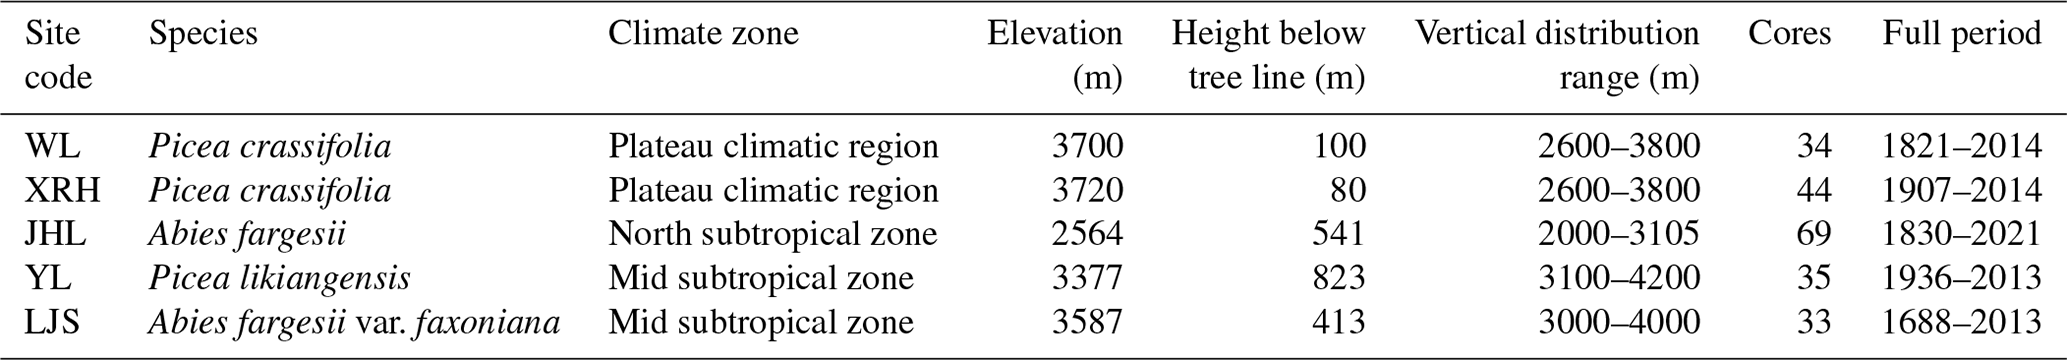
The climatological context of the sampled sites is very diverse. Using the CRU TS4.05 (Harris et al., 2020) climate data grid (1991–2020), annual mean temperatures for WL, XRH, JHL, YL, and LJS are −3.43, 2.34, 15.40, 6.15, and 7.28 ∘C, while total annual precipitation is 203.78, 265.05, 1041.24, 870.14, and 935.00 mm respectively (Fig. 2). The sites, therefore, represent a range from high-elevation cold and dry sites (e.g., WL and XRH are located in a high-elevation arid plateau climatic region) to lower-elevation warm and humid locations (JHL).
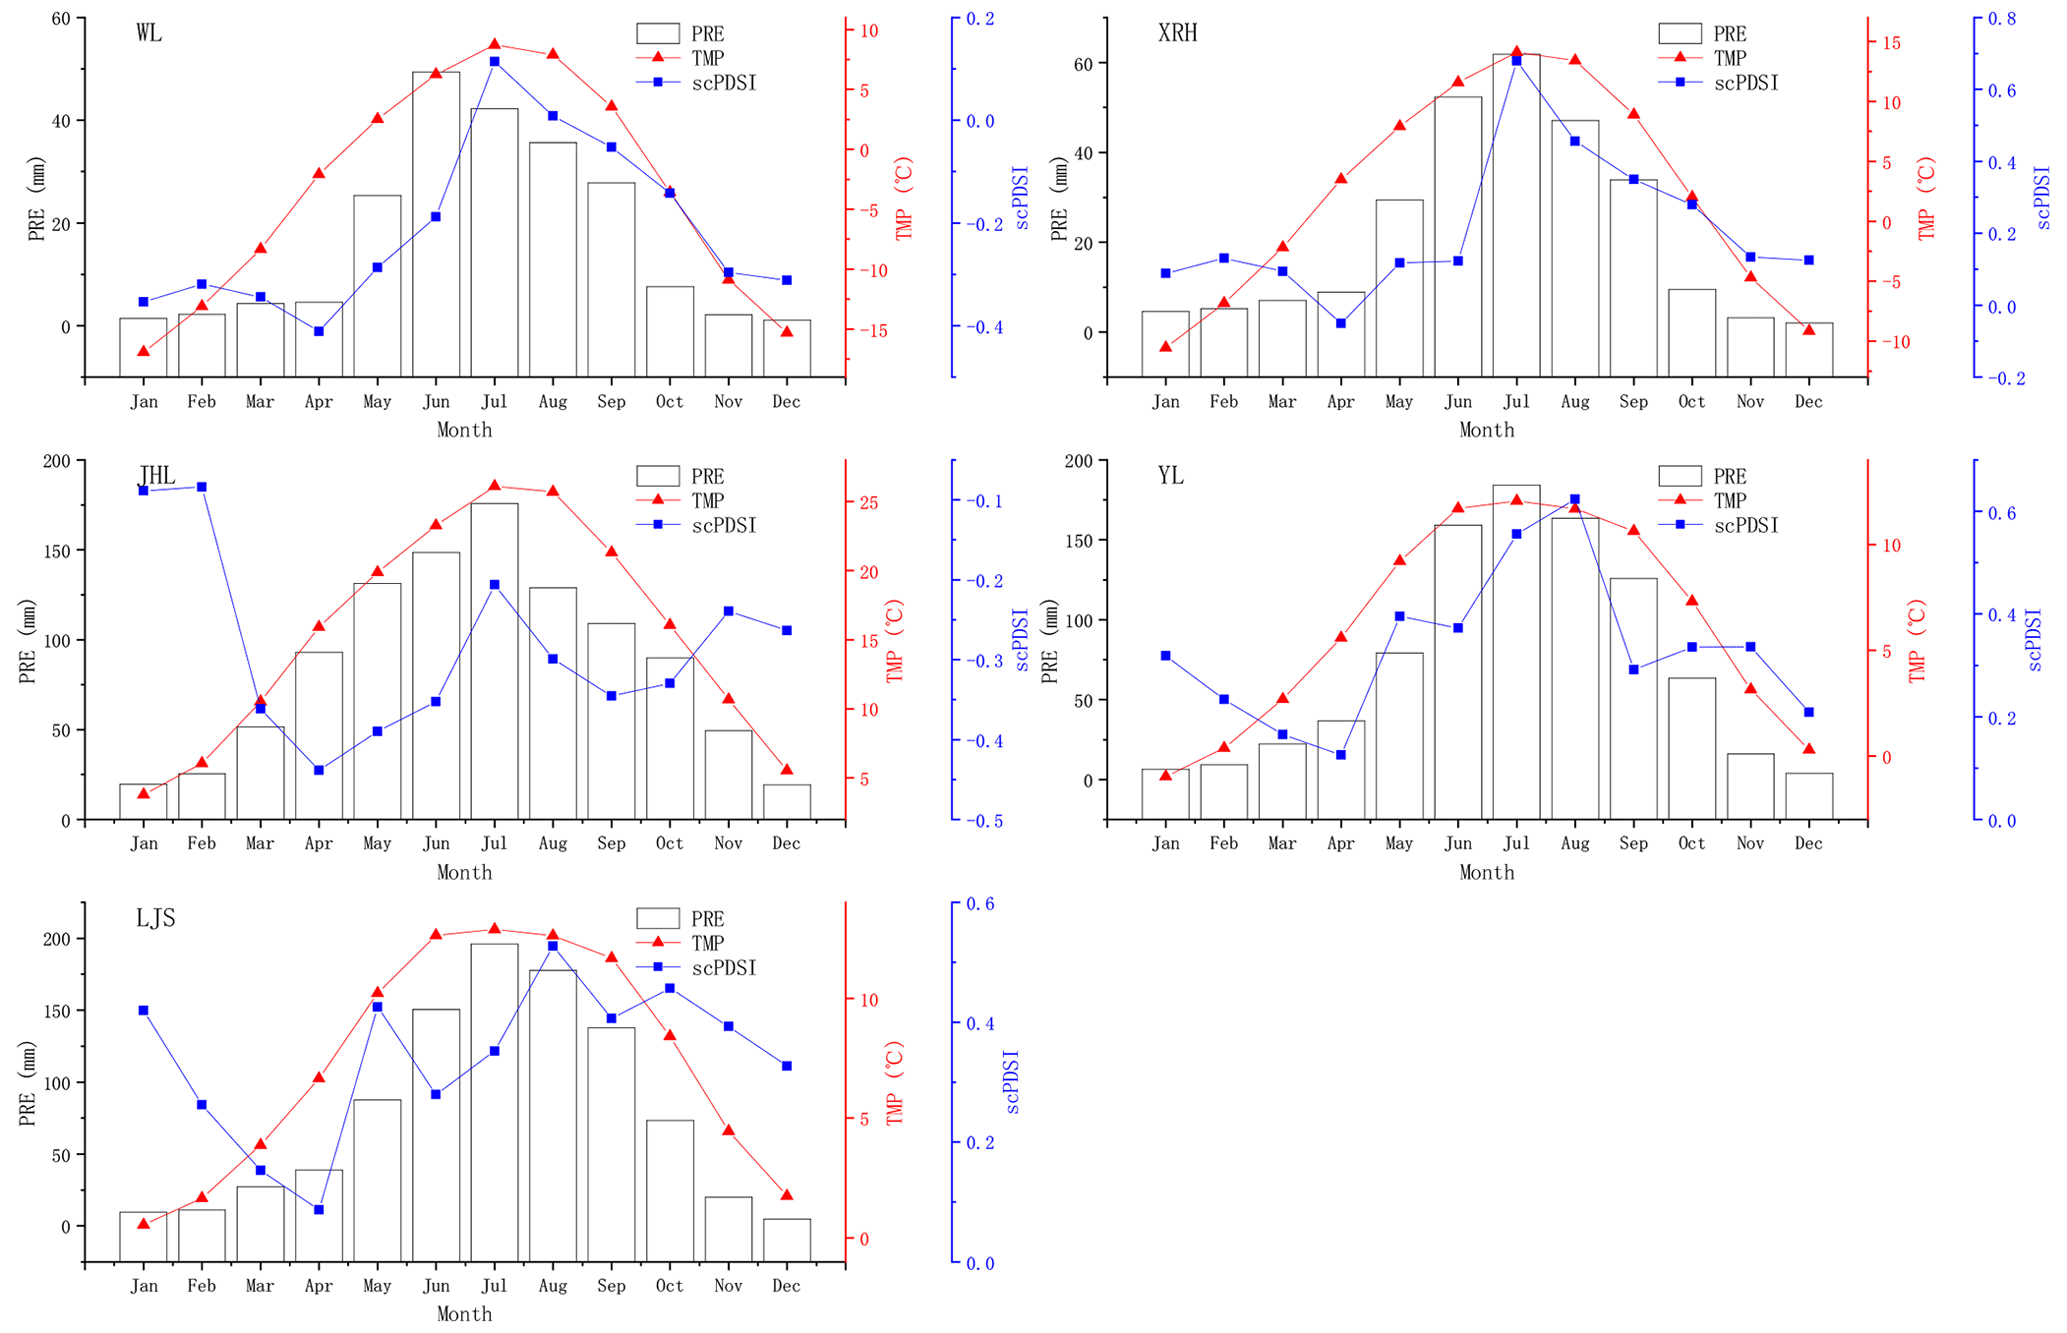
Figure 2Monthly mean (calculated over the 1991–2020 period) temperatures, precipitation, and scPDSI climate diagrams summarizing the climatology at the five sampling sites.
2.2 Tree ring data
As the spruce and fir samples do not express a visible heartwood–sapwood color change, no pre-treatment (i.e., resin extraction) was performed (Dolgova, 2016; Wilson et al., 2019). The mounted cores were sanded from 240 to 800 grit grade before being scanned with a flatbed Epson V850 Pro scanner. The scanner was calibrated using the SilverFast scanner software to the IT8 color card target (IT8.7/2) printed on Kodak Professional Endura paper. This calibration step is important to ensure consistency between labs as well as address the potential temporal instability in the power or intensity of the light because bulbs tend to fade over time, leading to a potential drift in blue intensity values (Campbell et al., 2011).
All tree ring samples were scanned at 3200 DPI (dots per inch) with the scanner covered by a box (with matt black side walls) to minimize bias from external ambient light and internal box reflections of light (Rydval et al., 2014). The scanned digital image of each sample was then imported into CooRecorder, and the ring boundaries were marked by both manual and automatic placement (Maxwell and Larsson, 2021). COFECHA (Grissino-Mayer, 2001) was utilized to validate the reliability of the tree ring dating. Inverted latewood blue intensity (Rydval et al., 2014) data were generated using frame specification parameters controlling the “window” from which reflectance intensity measurements were derived (width–limiting factor–position–deepness–margin, 300–3–5–500–0.5). Earlywood blue intensity data were generated using frame specifications (200–3–0–500–0.5). A range of percentile (P) values for earlywood BI (EWB) and latewood inverted BI (LWBinv) were used to extract different light and dark wood reflection intensity information, including P50 : 50, P60 : 40, P70 : 30, P80 : 20, P85 : 15, P90 : 10, and P95 : 5. This novel approach was explored to test whether there is a methodological influence on the relationship between the variable BI parameters and climate variables for varying percentile extraction options for these parameters. To develop the chronologies, both the LWBinv and EWB data, along with the RW data, were detrended using an age-dependent spline (ADS) without retention of positive trends (Melvin et al., 2007). The spline had an initial starting 50-year spline, which better captures the juvenile and long-term trajectory of radial growth compared to more rigid approaches like negative exponential functions.
2.3 Climate data
Considering most meteorological stations were not founded before the 1950s in study areas, monthly climate data for the period 1951–2012, including mean temperature (TMP), precipitation (PRE), and self-calibrating Palmer drought severity index (scPDSI), were extracted from the CRU TS4.05 climate data grid (http://climexp.knmi.nl/, last access: 17 September 2022) with a resolution of 0.5∘ × 0.5∘. We used the mean of the four gridded points closest to each sampling site.
2.4 Data analysis
To assess the different statistical qualities between the tree ring variable chronology variants, the coefficient of variation (CV), first-order autocorrelation (AC1), and mean inter-series correlation (Rbar) were evaluated. CV, which is the ratio of the standard deviation to the mean, quantifies the relative variance of the chronologies. It is useful to compare variance between data sets with different units (i.e., ring width vs. BI) or with widely different means. The higher the CV, the greater the relative dispersion around the mean. AC1 measures the persistent structure in time series (i.e., the year-to-year correlation of a time series with itself at lag 1). The higher the AC1, the stronger the relationship between consecutive years of data. Rbar is the mean inter-series correlation of all possible detrended bivariate pairs of tree ring series in a chronology. The higher the Rbar, the stronger the common signal in the data that makes up the chronology. To further explore the potential of these tree species and variables for dendroclimatic research, correlation analysis was conducted between tree ring chronologies and monthly/seasonal variables of each climate variable within the common time interval 1951–2012 (Table 1), utilizing the R software (version 4.2.2; R Core Team, 2022) along with the R packages “lattice” (Sarkar, 2008) and “zoo” (Zeileis and Grothendieck, 2005). Finally, multiple linear regression was performed for the strongest tree ring parameter vs. climate relationships that are biologically most meaningful to highlight the potential for dendroclimatic reconstruction for these tree species.
3.1 Chronology statistical properties
Compared to the tree ring EWB and LWBinv, RW chronologies exhibit a larger amplitude of fluctuations (Fig. S1 in the Supplement). CV is much higher for RW than EWB and LWBinv (Fig. 3a), an observation detailed for other studies comparing RW with BI parameters (Wilson et al., 2021, 2014). The CV values for LWBinv are similar to EWB. These relatively lower variance values are one reason why the signal strength statistics are often weaker for BI parameters than other parameters such as RW and MXD as any non-climatic signal (e.g., wood discoloration) could have a large impact on the Rbar values (see below).
AC1 values for RW are also higher compared to EWB and LWBinv (Fig. 3b), a well-known property of RW chronologies (Lücke et al., 2019). The YL site shows significantly lower values, leading to a much broader range for EWB. Overall, LWBinv AC1 values are generally lower, again agreeing with other studies (Reid and Wilson, 2020; Kaczka et al., 2018) assessing both LWBinv and MXD which generally express low first autocorrelation for conifers from temperature-sensitive sites. This is a desirable property as LWBinv often correlates strongly with summer temperatures and also expresses low AC1.
The range in Rbar values between RW and LWBinv is larger than EWB (Fig. 3c). RW expresses the highest overall Rbar values – with the WL RW data showing a very strong common signal and the LJS data the weakest. EWB and LWBinv express much weaker signal strength, with median values for LWBinv marginally higher than EWB. LWBinv expresses a much greater range than EWB, with WL expressing a strong common signal where only about 13 cores are needed to attain an expressed population signal (EPS) of 0.85. LJS on the other hand shows a very weak common signal where theoretically more than 50 cores are needed to attain an EPS of 0.85 (Wilson and Elling, 2004). The weaker common signal of the BI parameters has been noted in several studies (Wilson et al., 2021; Wiles et al., 2019; Blake et al., 2020; Harley et al., 2021), with both EWB and LWB requiring greater sample replication than RW to reach widely accepted thresholds of chronology reliability (Blake et al., 2020; Harley et al., 2021). However, as has been shown in several previous studies, the weaker common signal in BI chronologies does not necessarily mean that the climate signal is weaker than RW (Wilson et al., 2019; Rydval et al., 2014).
Figure 3CV, AC1, and Rbar for each ADS detrended chronology – delineated by parameter, BI percentile extraction, and site.
The differences in CV, AC1, and Rbar values are subtle between the different percentile extraction chronology versions (Fig. 3 and Table S1 in the Supplement). There appears to be little consistency as to which of the percentile extraction methods leads to consistent high or low values of CV, AC1, and Rbar. For EWB, the highest CV values are noted for the P50 : 50 variants (P60 : 40 shows the same value for YL) except for JHL, where P70 : 30 expresses the highest CV value. Regarding LWB, once again, the P50 : 50 variants exhibit higher CV values (except for XRH, where P60 : 40 and P70 : 30 show the same value, and for JHL, where P60 : 40 shows the same value). However, LJS deviates from this trend, with the P85 : 15 to P95 : 5 variants showing the highest values. For AC1, there appears to be no consistent pattern of high and low values between each percentile variant for both BI parameters. However, either P50 : 50 or P95 : 5 variants express the highest value except for XRH EWB and YL LWBinv. In terms of Rbar, the WL EWB and XRH EWB variants demonstrate the highest value for P50 : 50. The LJS EWB variant shows the highest value for both P50 : 50 and P95 : 05. The JHL EWB variant exhibits the highest value for P70 : 30, while the YL EWB variant displays the highest value for P95 : 5. For LWBinv, the results are equally variable. Overall, the chronology characteristics based on different extraction percentiles vary minimally, suggesting that the percentile extraction settings are not a significant methodological factor for either EWB or LWBinv data generation.
3.2 Climate response of the chronology variants
The strength of correlations between the RW chronologies and monthly TMP, PRE, and scPDSI varies substantially across the different sites (Fig. S2). Over the period 1951–2012, WL RW expresses significant positive correlations with scPDSI for January through August (Figs. 4a, S2), which may result from the relatively dry conditions indicated by the negative scPDSI values for this location (Fig. 2). WL RW explains 37.4 % of the January–August scPDSI variance. Except for June TMP at LJS, the correlations between RW and climate for XRH, JHL, YL, and LJS are not significant as the climatic influence on RW is mixed, and hence no reconstruction of past climate, using this parameter, is possible in these regions.
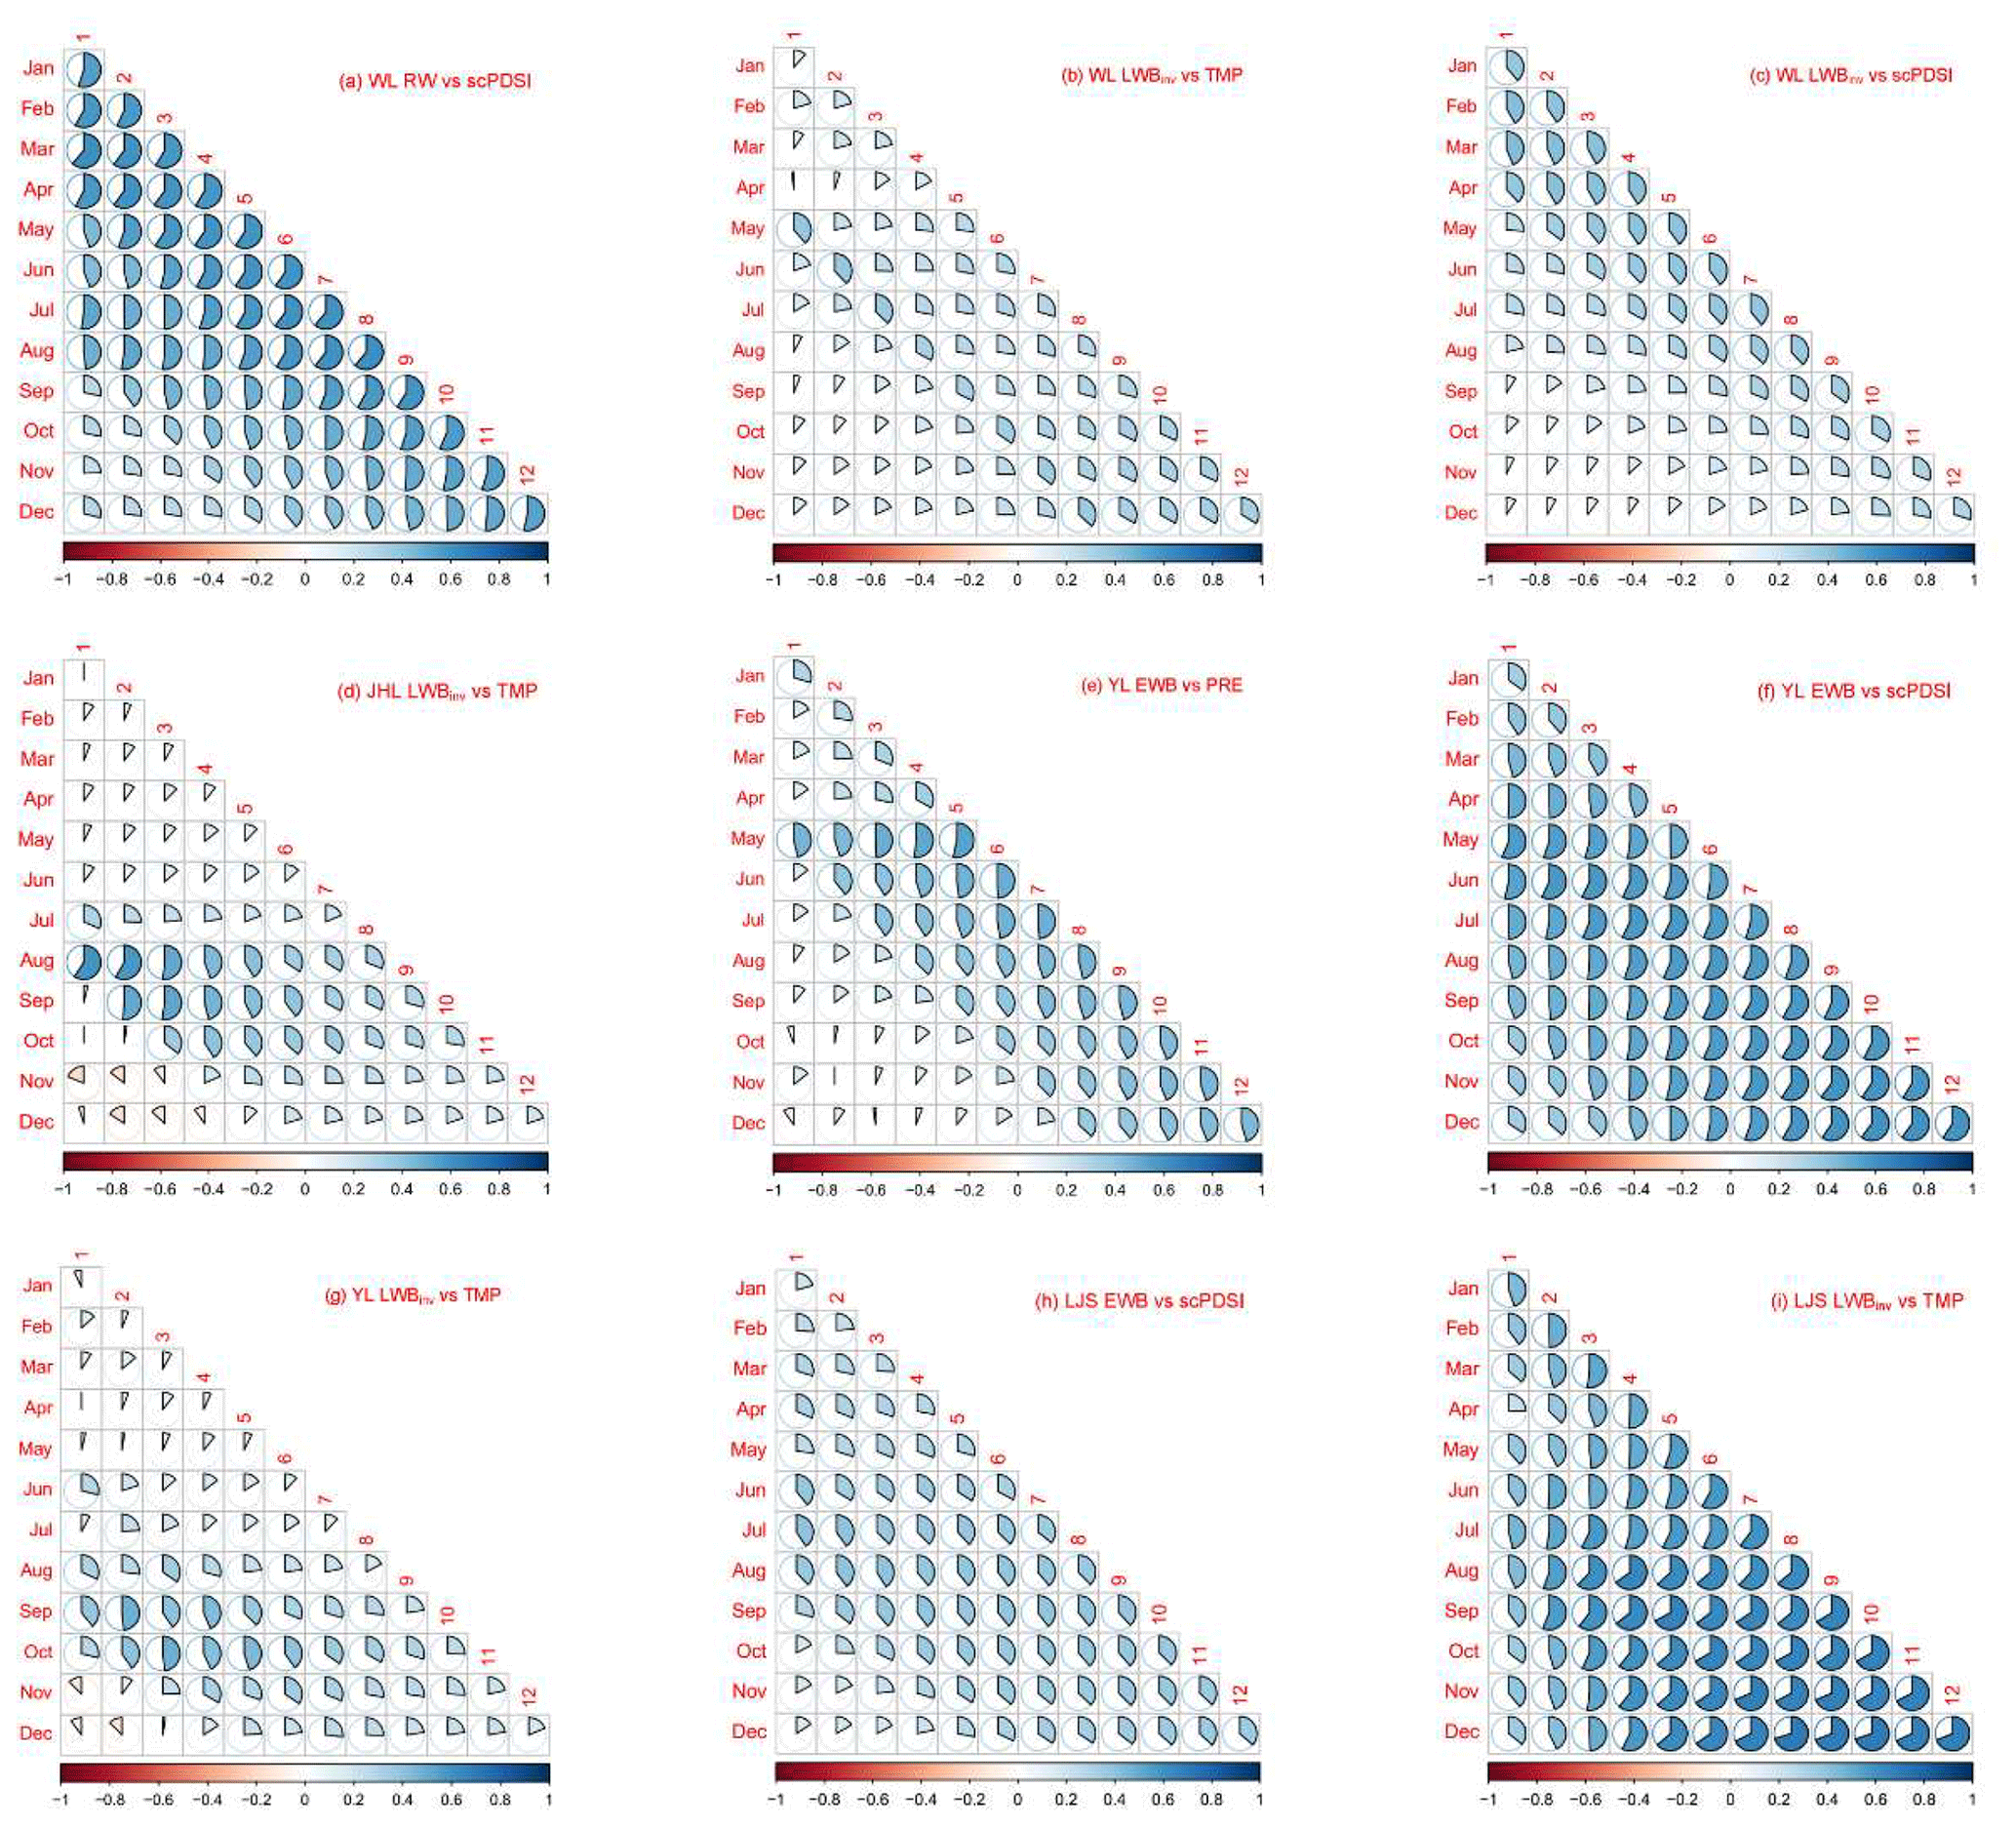
Figure 4Correlation analysis of select parameter ADS chronologies against different climate targets for different end months (along the y axis) and different season lengths (the number along the diagonal line). Both the ratio and color of the shaded portion of the pie denotes the correlation coefficient. The P85 : 15 variants were used for these examples.
EWB measures the max intensity values of the light pixels, reflecting the lumen size of the earlywood – i.e., large vacuole and thin cell walls – and so reflecting tree ring minimum density (Buckley et al., 2018). EWB exhibits diverse responses to TMP, PRE, and scPDSI, with the strongest response observed for TMP and scPDSI and the weakest response observed for PRE. For TMP, there are no significant positive correlations (Fig. S3), which may result from a higher spring TMP promoting tree growth (Zheng et al., 2016). The observed negative correlations with TMP could suggest that inverted EWB data, which would reflect minimum density, could be worth exploring for future studies. For PRE, only October at JHL and May at YL show a significant positive influence respectively (Fig. S4). Although the first finding at JHL is biologically meaningless as earlywood had already formed before October, the results for YL are encouraging and align with recent research in Sweden, where precipitation calibrations based on BI can explain 20 % more hydroclimatic variance compared to ring width (Seftigen et al., 2020). scPDSI expresses a universal positive influence on EWB at all sites except WL (Fig. S5). A positive relationship with PRE (Fig. S4) and a negative response to TMP (Fig. S3) indicate that drought conditions are the main limiting factor for the variability of lumen size (Begović et al., 2020).
For LWBinv, although the sample sites are not located near the upper tree line, a significant TMP response is noted for all the sampling sites (Fig. S3), which suggests the possibility of enhancing the climate response of BI chronologies via sampling closer to the upper tree line (Heeter et al., 2021). Especially significant is the relationship between LWBinv and August TMP (r=0.595 for P85 : 15) at JHL (Fig. S3). To eliminate the potential inflation of correlation values due to coherent low-frequency trends between time series, we also calculated the correlation after first differencing both LWBinv and August TMP. The first differenced correlations are even stronger at >0.68, suggesting that there is some degree of dissimilarity at decadal and longer timescales between BI and the climate data (Wilson et al., 2019; Blake et al., 2020). The positive relation between LWBinv and TMP is analogous to the positive relation between MXD and growing-season temperature (Briffa et al., 2002). The strongest inverse influence shown by PRE on LWBinv is identified at the comparatively humid sites JHL and YL, which fits in with the positive temperature response of LWBinv with TMP and the inverse correlation between PRE and TMP. Though the correlations between LWBinv and scPDSI are relatively weak, significant positive correlations with scPDSI are observed for WL during January through April, while inverse correlations are noted for YL during the autumn.
We utilized the single-month correlation function analysis (Figs. S3–S5) and systematic correlation function analysis results (Fig. 4) to identify the optimal, and biologically most relevant, single-month or seasonal window to maximize the tree ring parameter and climate relationships. We then use this single month or season to test how the correlation value between these optimized relationships changed for the different percentile variants. Overall, there is no one single percentile combination for EWB and LWBinv that stands out for those monthly and seasonal relationships that express the strongest correlations (Fig. 5). Utilizing different ratios, such as P50 : 50, P60 : 40, P85 : 15, P90 : 10, and P95 : 5, can potentially yield optimal results in certain circumstances, as illustrated in Fig. 5, although the differences are subtle. However, as higher-resolution methods are employed for image capture, we urge the community to continue experimenting with varying percentile extraction settings to help provide a theoretical basis for optimal settings.
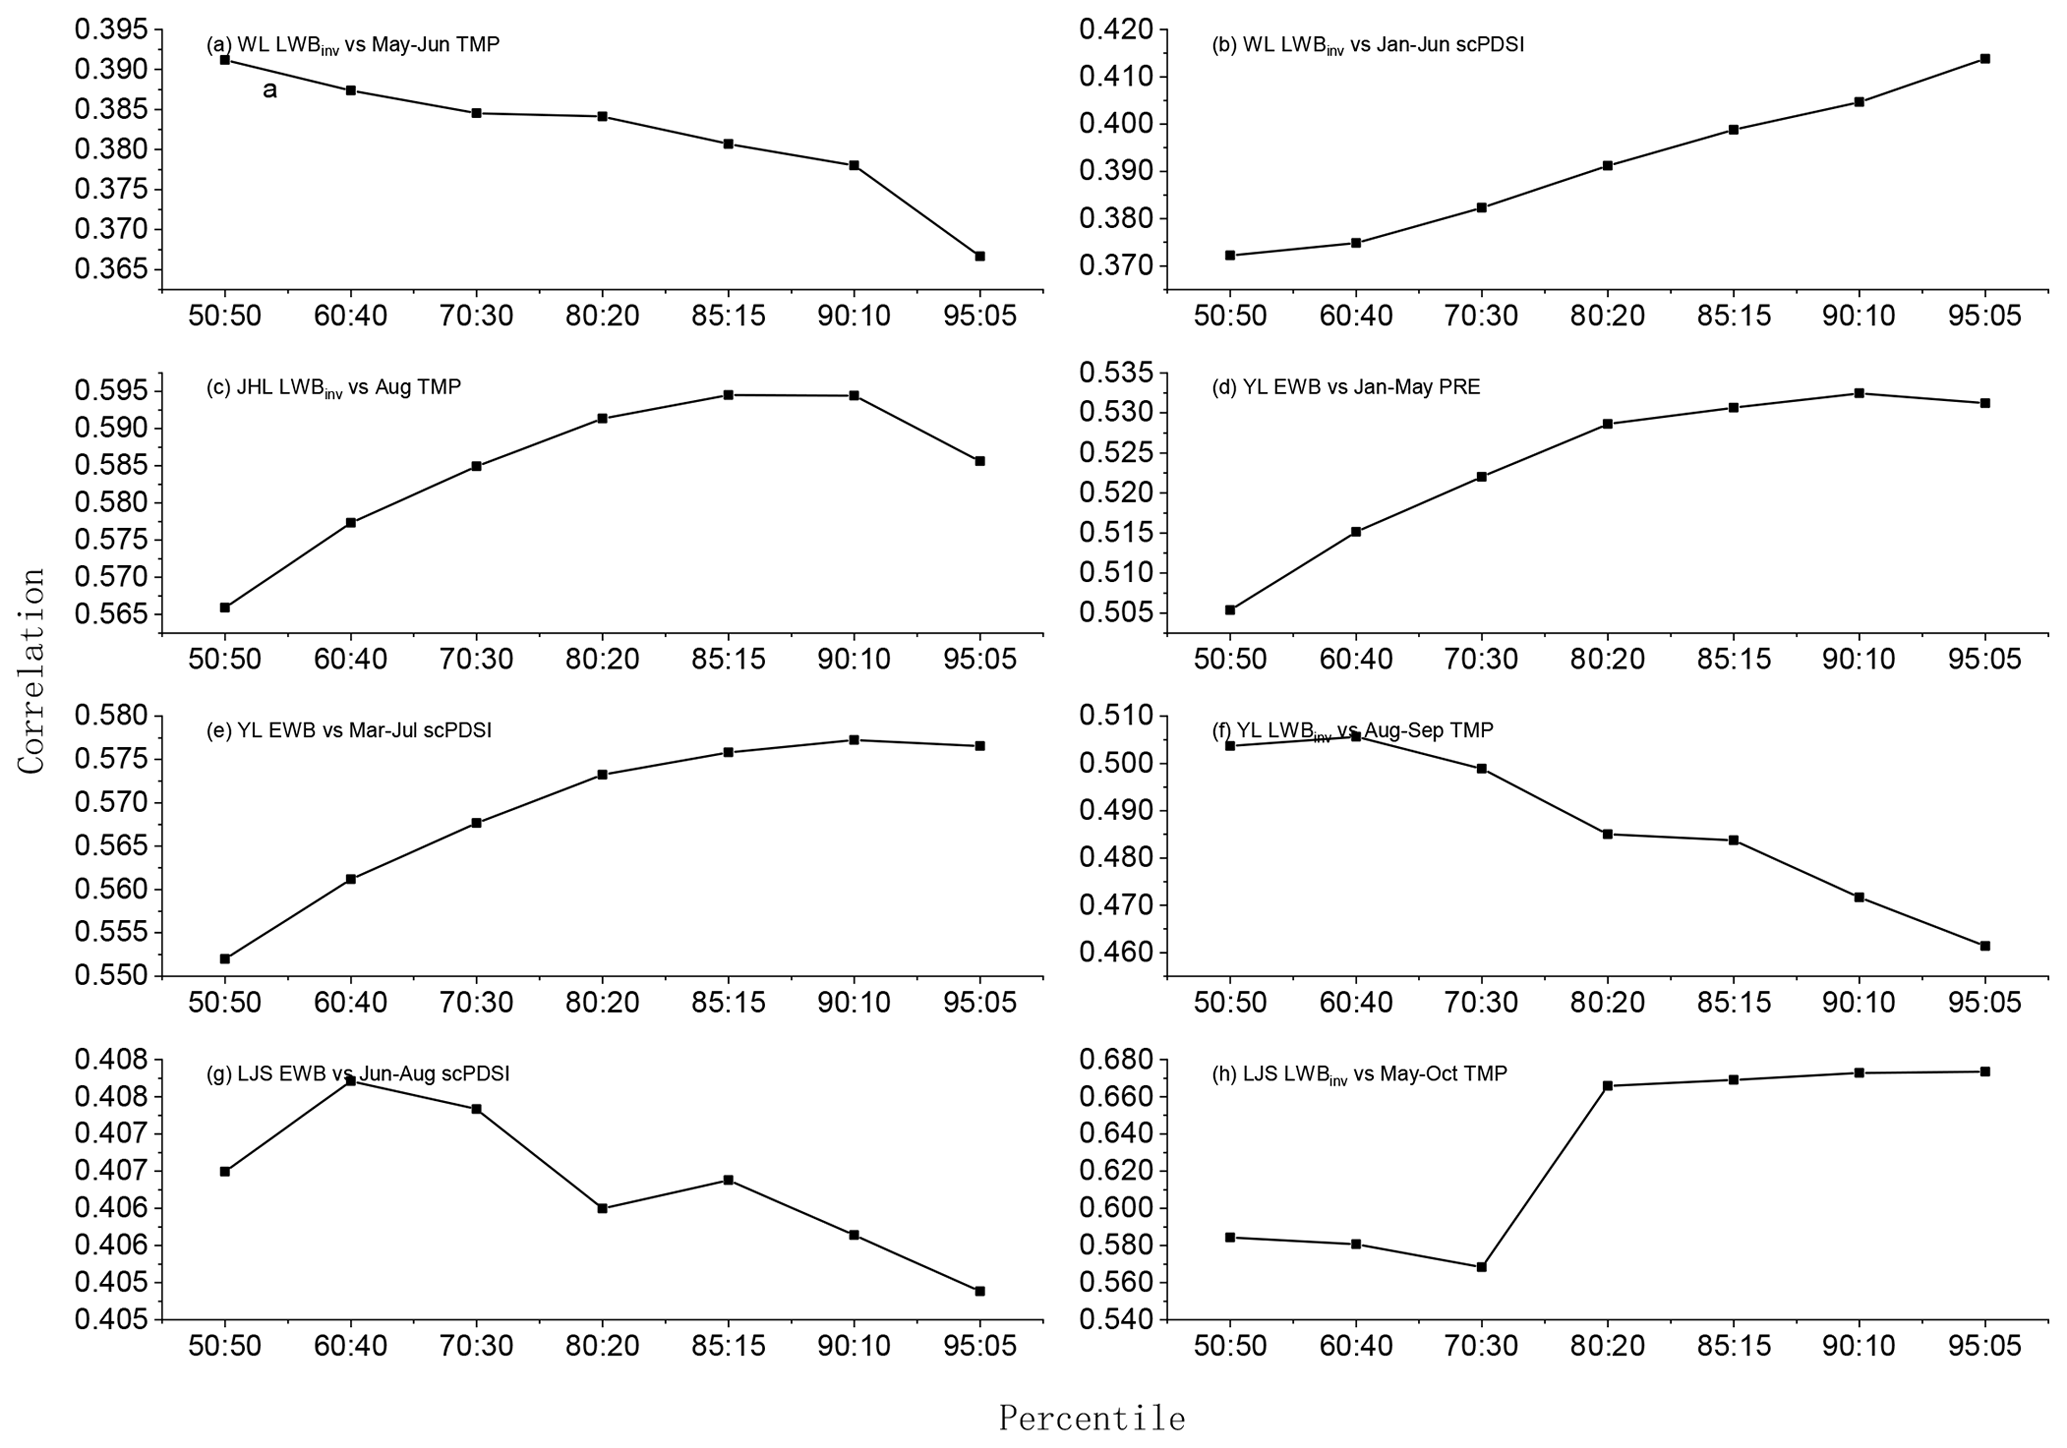
Figure 5Correlations for different percentile extraction variants for those parameter chronologies and climate variables that express the strongest signal.
LWBinv, which has proven to be a robust proxy for summer temperature at high-northern-latitude reconstruction TMP (Björklund et al., 2015; Wilson et al., 2019; Harley et al., 2021), can also express very strong TMP signals for the mid-to-low latitudes (Heeter et al., 2021). However, most BI studies to date are still primarily geographically restricted to high latitudes. More studies are needed to evaluate the applicability of BI methods across different regions, especially at high-elevation, low-latitude locations, where certain tree species still produce distinct annual growth rings (Buckley et al., 2018; Heeter et al., 2020). The lower-latitude sites, including JHL, YL, and LJS in central and southwestern China, with a collective strong TMP signal response in LWBinv (Figs. 4 and S3), show great potential to reconstruct past temperatures for these relatively lower latitudes. The cool and rather humid climate regime of YL, a site type that traditionally has been overlooked in tree ring studies for hydroclimate, shows great potential when using EWB due to the strong implicit hydroclimatic signal expressed with PRE (Figs. 5d and S4) and scPDSI (Figs. 5e and S5). This observation, along with similar results for southern Sweden, confirms the importance and potential of both EWB and LWBinv for understanding hydroclimate variability in regions with a humid climate (Seftigen et al., 2020).
Finally, we use simple and stepwise multiple regression of multi-site-parameter BI data to highlight the improvement, by using data from multiple sites, over these single-parameter results (Fig. 6). Focusing on regionally grouped data sets, EWB data from YL explain 37 % of the April–June (AMJ) scPDSI variance. Although these results are modest, we hypothesize that expanding the number of sites and including RW data would result in substantially improved scPDSI reconstructions for this region. Further, by also using the LWBinv data from LJS and YL, the multiple regression combination of these data results in an extremely strong calibration with June–October mean temperatures (, Fig. 6), with the reconstruction representing a large region of low-latitude China. These results demonstrate the considerable potential of using BI to enhance current RW-based climate reconstructions in China.
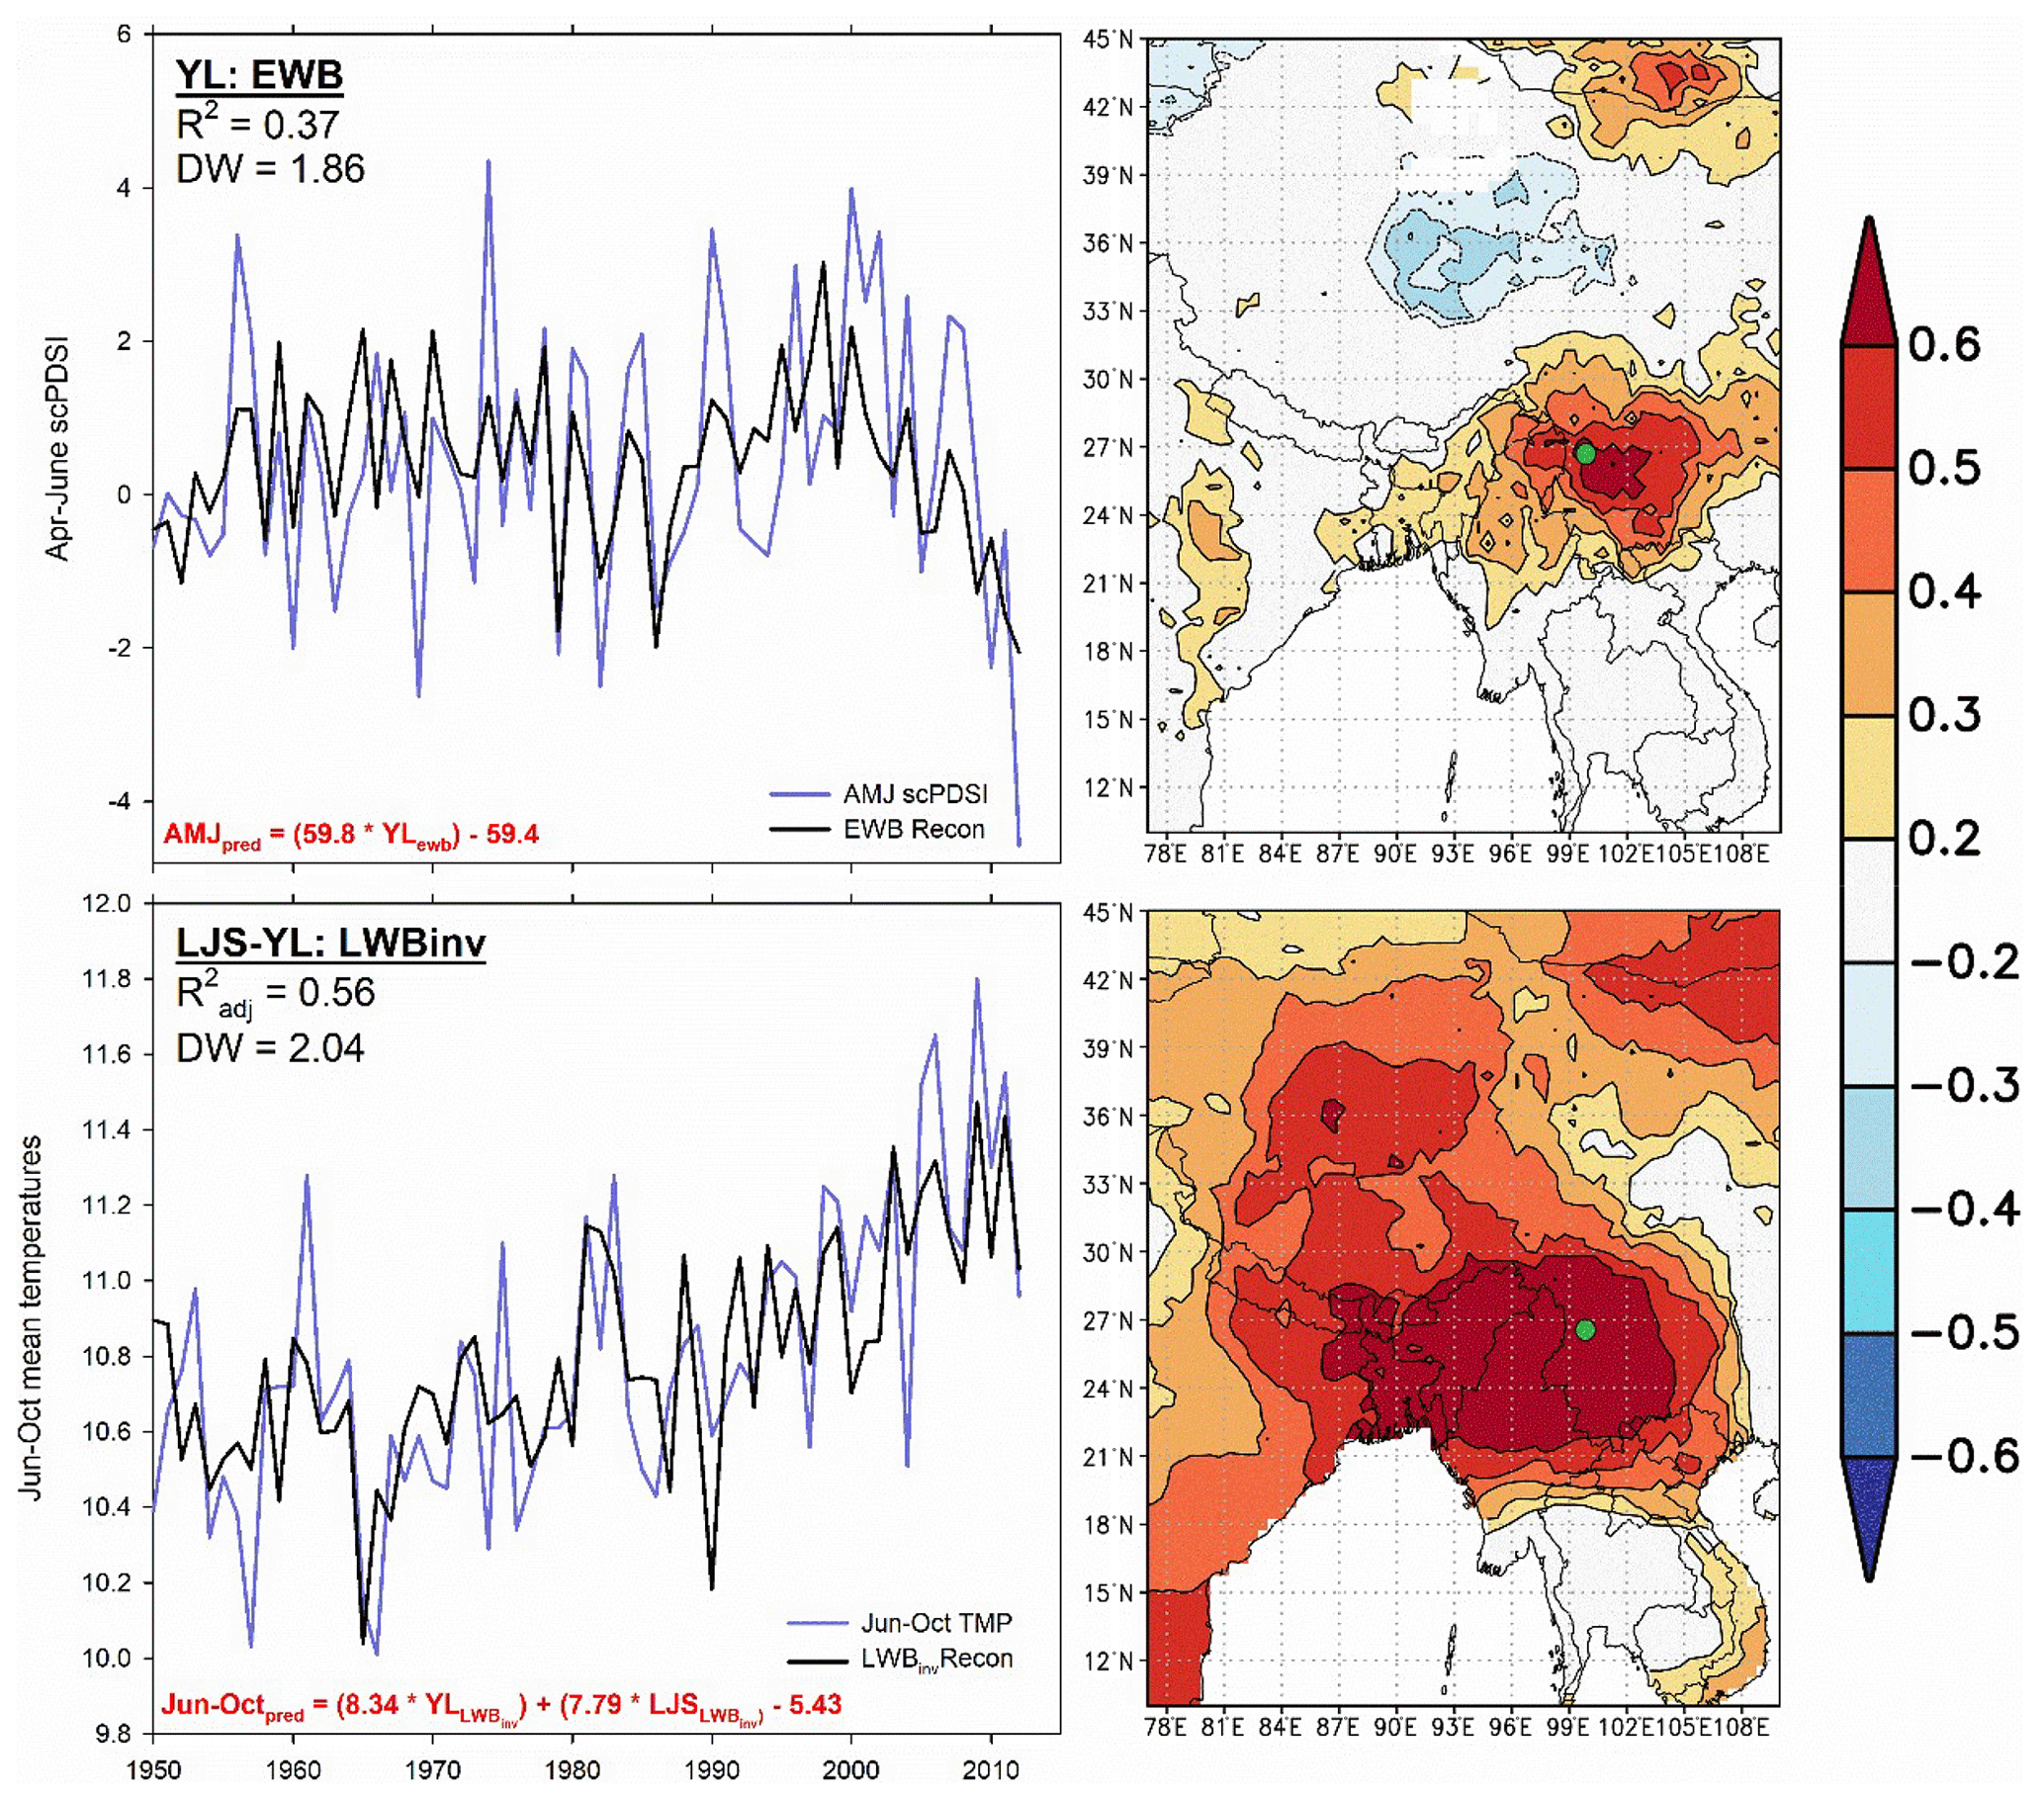
Figure 6Experimental simple and multiple regression calibration (1951–2012) results for LJS and YL. P85 : 15 variants used.
In this study, we measured RW, EWB, and LWBinv for five sites in western and central China to investigate the potential application of BI variables to enhance dendroclimate research. We have focused on species (Picea and Abies) that express no visible color change from the heartwood to sapwood, thus minimizing trend biases in the BI data. We further explored how sensitive the results are to different percentile extraction parameter settings for attaining blue intensity data using CooRecorder. The results presented herein strongly indicate that BI parameters will enable a significant improvement upon RW-based dendroclimatic reconstructions in China. Perhaps the most compelling factor of the BI method is that tests can be easily and quickly made on multiple samples, sites, and species from varying locations, so a broader picture of the potential of measuring multiple tree ring parameters from many species can be easily tested. Our results indicate the following, in agreement with most other Northern Hemisphere studies exploring conifer response to climate (Rydval et al., 2014; Heeter et al., 2021): that LWBinv expresses a positive relationship with growing-season temperatures. Despite data from only two sites, the combined information from sites LJS and YL explains almost 56 % of the temperature variance, which is on par with some of the strongest calibrations noted in the Northern Hemisphere (Wilson et al., 2016). However, these results are particularly exciting due to the low-latitude location of these sites where traditionally temperature reconstructions are poorly constrained at latitudes south of 30∘ N (Anchukaitis et al., 2017; Wilson et al., 2016). We hypothesize that these results would improve by sampling more trees and sampling more sites closer to the upper tree line.
EWB is still a relatively untested parameter in dendroclimatology. Our experiments strongly suggest that this parameter could greatly enhance reconstructions of past hydroclimate, especially scPDSI, over those relying solely on RW data. Further research is, however, needed as to whether EWB should be inverted in the same way as LWB data as this has implications for what wood anatomical features the EWB data are actually measuring – i.e., the lumen size or the cell wall thickness.
Experiments using different percentile extraction parameters for EWB and LWBinv did not identify a clear optimal set of settings for the BI data extraction, so we encourage the community to continue further experimentation with different data extraction parameterizations in CooRecorder, as our current results were produced from scanned images. It is entirely possible that as labs start experimenting with higher-resolution image capture methods (e.g., ATRICS, Levanič, 2007), different extraction parameters may be needed to improve climate response.
The challenge now is to expand the network of Chinese BI chronologies with more species and locations but also identify preserved wood sources that will allow a significant extension back in time. Finding older stands of trees is of course a priority, but that is not always possible in regions where humans have lived for a significant length of time. The focus must therefore be on extending the shorter living chronologies using preserved material from historic buildings (Wilson et al., 2004) or natural environments where wood is preserved, such as in anoxic lake sediments or river gravels. Moreover, as several long chronologies have been produced by other labs, an important and feasible way of creating long climate-sensitive BI chronologies would be through inter-lab collaboration allowing the reprocessing of extant samples.
All raw data for pictures and tables can be provided by the first author upon request.
The supplement related to this article is available online at: https://doi.org/10.5194/bg-20-3481-2023-supplement.
YZ, HS, and RW planned the campaign; YZ and HS sampled the tree ring samples; YZ and RA performed the measurements; YZ analyzed the data and wrote the manuscript draft; RW reviewed and edited the manuscript.
The contact author has declared that none of the authors has any competing interests.
Publisher’s note: Copernicus Publications remains neutral with regard to jurisdictional claims in published maps and institutional affiliations.
We thank Penghai Wu, Shuqiang Meng, Ziwen Zhao, and Zhengsheng Hu for helping to sample tree rings.
This paper was funded by the China Scholarship Council (grant no. 202006275018), the National Natural Science Foundation of China (NSFC, project no. 41771227), and Key Technology Projects of the Hubei Provincial Company of the China National Tobacco Corporation (grant nos. 027Y2021-020 and 027Y2022-006). Rob Wilson was further funded by the NSF/NERC project (grant no. NE/W007223/1 – Understanding Trans-Hemispheric Modes of Climate Variability: A Novel Tree-Ring Data Transect spanning the Himalaya to the Southern Ocean).
This paper was edited by Anja Rammig and reviewed by two anonymous referees.
Anchukaitis, K. J., Wilson, R., Briffa, K. R., Büntgen, U., Cook, E. R., D'Arrigo, R., Davi, N., Esper, J., Frank, D., and Gunnarson, B.: Last millennium Northern Hemisphere summer temperatures from tree rings: Part II, spatially resolved reconstructions, Quaternary Sci. Rev., 163, 1–22, https://doi.org/10.1016/j.quascirev.2017.02.020, 2017.
Babst, F., Frank, D., Büntgen, U., Nievergelt, D., and Esper, J.: Effect of sample preparation and scanning resolution on the Blue Reflectance of Picea abies, Trace Proc., 7, 188–195, https://doi.org/10.2312/GFZ.b103-09038, 2009.
Begović, K., Rydval, M., Mikac, S., Čupić, S., Svobodova, K., Mikoláš, M., Kozak, D., Kameniar, O., Frankovič, M., and Pavlin, J.: Climate-growth relationships of Norway Spruce and silver fir in primary forests of the Croatian Dinaric mountains, Agr. Forest Meteorol., 288, 108000, https://doi.org/10.1016/j.agrformet.2020.108000, 2020.
Björklund, J., Gunnarson, B. E., Seftigen, K., Zhang, P., and Linderholm, H. W.: Using adjusted blue intensity data to attain high-quality summer temperature information: a case study from Central Scandinavia, Holocene, 25, 547–556, https://doi.org/10.1177/0959683614562434, 2015.
Björklund, J., von Arx, G., Nievergelt, D., Wilson, R., Van den Bulcke, J., Günther, B., Loader, N., Rydval, M., Fonti, P., and Scharnweber, T.: Scientific merits and analytical challenges of tree-ring densitometry, Rev. Geophys., 57, 1224–1264, https://doi.org/10.1029/2019RG000642, 2019.
Blake, S. A., Palmer, J. G., Björklund, J., Harper, J. B., and Turney, C. S.: Palaeoclimate potential of New Zealand Manoao colensoi (silver pine) tree rings using Blue-Intensity (BI), Dendrochronologia, 60, 125664, https://doi.org/10.1016/j.dendro.2020.125664, 2020.
Brookhouse, M. and Graham, R.: Application of the minimum blue-intensity technique to a Southern-Hemisphere conifer, Tree Ring Res., 72, 103–107, https://doi.org/10.3959/1536-1098-72.02.103, 2016.
Briffa, K. R., Osborn, T. J., Schweingruber, F. H., Jones, P. D., Shiyatov, S. G., and Vaganov, E. A.: Tree-ring width and density data around the Northern Hemisphere: Part 1, local and regional climate signals, Holocene, 12, 737–757, https://doi.org/10.1191/0959683602hl587rp, 2002.
Buckley, B. M., Hansen, K. G., Griffin, K. L., Schmiege, S., Oelkers, R., D'Arrigo, R. D., Stahle, D. K., Davi, N., Nguyen, T. Q. T., and Le, C. N.: Blue intensity from a tropical conifer's annual rings for climate reconstruction: an ecophysiological perspective, Dendrochronologia, 50, 10–22, https://doi.org/10.1016/j.dendro.2018.04.003, 2018.
Campbell, R., McCarroll, D., Loader, N. J., Grudd, H., Robertson, I., and Jalkanen, R.: Blue intensity in Pinus sylvestris tree-rings: developing a new palaeoclimate proxy, Holocene, 17, 821–828, https://doi.org/10.1177/0959683607080523, 2007.
Campbell, R., McCarroll, D., Robertson, I., Loader, N. J., Grudd, H., and Gunnarson, B.: Blue intensity in Pinus sylvestris tree rings: a manual for a new palaeoclimate proxy, Tree Ring Res., 67, 127–134, https://doi.org/10.3959/2010-13.1, 2011.
Cao, X., Fang, K., Chen, P., Zhang, P., Björklund, J., Pumijumnong, N., and Guo, Z.: Microdensitometric records from humid subtropical China show distinct climate signals in earlywood and latewood, Dendrochronologia, 64, 125764, https://doi.org/10.1016/j.dendro.2020.125764, 2020.
Cao, X., Hu, H., Kao, P. k., Buckley, B. M., Dong, Z., Chen, X., Zhou, F., and Fang, K.: Improved spring temperature reconstruction using earlywood blue intensity in southeastern China, Int. J. Climatol., 42, 6204–6220, https://doi.org/10.1002/joc.7585, 2022.
Davi, N. K., Rao, M. P., Wilson, R., Andreu-Hayles, L., Oelkers, R., D'Arrigo, R., Nachin, B., Buckley, B., Pederson, N., and Leland, C.: Accelerated recent warming and temperature variability over the past eight centuries in the Central Asian Altai from blue intensity in tree rings, Geophys. Res. Lett., 48, e2021GL092933, https://doi.org/10.1029/2021GL092933, 2021.
Dolgova, E.: June–September temperature reconstruction in the Northern Caucasus based on blue intensity data, Dendrochronologia, 39, 17–23, https://doi.org/10.1016/j.dendro.2016.03.002, 2016.
Fuentes, M., Salo, R., Björklund, J., Seftigen, K., Zhang, P., Gunnarson, B., Aravena, J.-C., and Linderholm, H. W.: A 970-year-long summer temperature reconstruction from Rogen, west-central Sweden, based on blue intensity from tree rings, Holocene, 28, 254–266, https://doi.org/10.1177/0959683617721322, 2018.
Grissino-Mayer, H. D.: Evaluating crossdating accuracy: a manual and tutorial for the computer program COFECHA, Tree Ring Res., 57, 205–221, http://hdl.handle.net/10150/251654 (last access: 1 June 2022), 2001.
Harley, G. L., Heeter, K. J., Maxwell, J. T., Rayback, S. A., Maxwell, R. S., Reinemann, T. E., and Taylor, A. H.: Towards broad-scale temperature reconstructions for Eastern North America using blue light intensity from tree rings, Int. J. Climatol., 41, E3142–E3159, https://doi.org/10.1002/joc.6910, 2021.
Harris, I., Osborn, T. J., Jones, P., and Lister, D.: Version 4 of the CRU TS monthly high-resolution gridded multivariate climate dataset, Sci. Data, 7, 1–18, https://doi.org/10.6084/m9.figshare.11980500, 2020.
He, M., Yang, B., Bräuning, A., Rossi, S., Ljungqvist, F. C., Shishov, V., Grießinger, J., Wang, J., Liu, J., and Qin, C.: Recent advances in dendroclimatology in China, Earth-Sci. Rev., 194, 521–535, https://doi.org/10.1016/j.earscirev.2019.02.012, 2019.
Heeter, K. J., Harley, G. L., Maxwell, J. T., McGee, J. H., and Matheus, T. J.: Late summer temperature variability for the Southern Rocky Mountains (USA) since 1735 CE: applying blue light intensity to low-latitude Picea engelmannii Parry ex Engelm, Climatic Change, 162, 965–988, https://doi.org/10.1007/s10584-020-02772-9, 2020.
Heeter, K. J., Harley, G. L., Maxwell, J. T., Wilson, R. J., Abatzoglou, J. T., Rayback, S. A., Rochner, M. L., and Kitchens, K. A.: Summer temperature variability since 1730 CE across the low-to-mid latitudes of western North America from a tree ring blue intensity network, Quaternary Sci. Rev., 267, 107064, https://doi.org/10.1016/j.quascirev.2021.107064, 2021.
Helama, S., Arentoft, B. W., Collin-Haubensak, O., Hyslop, M. D., Brandstrup, C. K., Mäkelä, H. M., Tian, Q., and Wilson, R.: Dendroclimatic signals deduced from riparian versus upland forest interior pines in North Karelia, Finland, Ecol. Res., 28, 1019–1028, https://doi.org/10.1007/s11284-013-1084-3, 2013.
Kaczka, R. J. and Wilson, R.: I-BIND: International Blue intensity network development working group, Dendrochronologia, 68, 125859, https://doi.org/10.1016/j.dendro.2021.125859, 2021.
Kaczka, R. J., Spyt, B., Janecka, K., Beil, I., Büntgen, U., Scharnweber, T., Nievergelt, D., and Wilmking, M.: Different maximum latewood density and blue intensity measurements techniques reveal similar results, Dendrochronologia, 49, 94–101, https://doi.org/10.1016/j.dendro.2018.03.005, 2018.
Levanič, T.: ATRICS – A new system for image acquisition in dendrochronology, Tree Ring Res., 63, 117–122, https://doi.org/10.3959/1536-1098-63.2.117, 2007.
Lücke, L. J., Hegerl, G. C., Schurer, A. P., and Wilson, R. J. J. O. C.: Effects of memory biases on variability of temperature reconstructions, J. Climate, 32, 8713–8731, https://doi.org/10.1175/JCLI-D-19-0184.1, 2019.
Maxwell, R. S. and Larsson, L.-A.: Measuring tree-ring widths using the CooRecorder software application, Dendrochronologia, 67, 125841, https://doi.org/10.1016/j.dendro.2021.125841, 2021.
McCarroll, D., Pettigrew, E., Luckman, A., Guibal, F., and Edouard, J.-L.: Blue reflectance provides a surrogate for latewood density of high-latitude pine tree rings, Arct. Antarct. Alp. Res., 34, 450–453, https://doi.org/10.1080/15230430.2002.12003516, 2002.
Melvin, T. M., Briffa, K. R., Nicolussi, K., and Grabner, M.: Time-varying-response smoothing, Dendrochronologia, 25, 65–69, https://doi.org/10.1016/j.dendro.2007.01.004, 2007.
O'Connor, J. A., Henley, B. J., Brookhouse, M. T., and Allen, K. J.: Ring-width and blue-light chronologies of Podocarpus lawrencei from southeastern mainland Australia reveal a regional climate signal, Clim. Past, 18, 2567–2581, https://doi.org/10.5194/cp-18-2567-2022, 2022.
R Core Team: R: a language and environment for statistical computing, R foundation for statistical computing, Vienna [software], https://www.r-project.org (last access: 17 August 2023), 2022.
Reid, E. and Wilson, R.: Delta blue intensity vs. maximum density: A case study using Pinus uncinata in the Pyrenees, Dendrochronologia, 61, 125706, https://doi.org/10.1016/j.dendro.2020.125706, 2020.
Rydval, M., Larsson, L.-Å., McGlynn, L., Gunnarson, B. E., Loader, N. J., Young, G. H., and Wilson, R.: Blue intensity for dendroclimatology: should we have the blues? Experiments from Scotland, Dendrochronologia, 32, 191–204, https://doi.org/10.1016/j.dendro.2014.04.003, 2014.
Sarkar, D.: Lattice: multivariate data visualization with R, Springer, New York, ISBN 978-0-387-75968-5, 2008.
Seftigen, K., Fuentes, M., Ljungqvist, F. C., and Björklund, J.: Using Blue Intensity from drought-sensitive Pinus sylvestris in Fennoscandia to improve reconstruction of past hydroclimate variability, Clim. Dynam., 55, 579–594, https://doi.org/10.1007/s00382-020-05287-2, 2020.
Sheppard, P. R., Graumlich, L. J., and Conkey, L. E. J. T. H.: Reflected-light image analysis of conifer tree rings for reconstructing climate, Holocene, 6, 62–68, https://doi.org/10.1177/095968369600600107, 1996.
Wang, F., Arseneault, D., Boucher, É., Galipaud Gloaguen, G., Deharte, A., Yu, S., and Trou-kechout, N.: Temperature sensitivity of blue intensity, maximum latewood density, and ring width data of living black spruce trees in the eastern Canadian taiga, Dendrochronologia, 64, 125771, https://doi.org/10.1016/j.dendro.2020.125771, 2020.
Wiles, G. C., Charlton, J., Wilson, R. J., D'Arrigo, R. D., Buma, B., Krapek, J., Gaglioti, B. V., Wiesenberg, N., and Oelkers, R.: Yellow-cedar blue intensity tree-ring chronologies as records of climate in Juneau, Alaska, USA, Can. J. Forest Res., 49, 1483–1492, https://doi.org/10.1139/cjfr-2018-0525, 2019.
Wilson, R. and Elling, W.: Temporal instability in tree-growth/climate response in the Lower Bavarian Forest region: implications for dendroclimatic reconstruction, Trees, 18, 19–28, https://doi.org/10.1007/s00468-003-0273-z, 2004.
Wilson, R., Loader, N., Rydval, M., Patton, H., Frith, A., Mills, C., Crone, A., Edwards, C., Larsson, L., and Gunnarson, B. E.: Reconstructing Holocene climate from tree rings: The potential for a long chronology from the Scottish Highlands, Holocene, 22, 3–11, https://doi.org/10.1177/0959683611405237, 2012.
Wilson, R., Rao, R., Rydval, M., Wood, C., Larsson, L.-Å., and Luckman, B. H.: Blue Intensity for dendroclimatology: The BC blues: A case study from British Columbia, Canada, Holocene, 24, 1428–1438, https://doi.org/10.1177/0959683614544051, 2014.
Wilson, R., Anchukaitis, K., Briffa, K. R., Büntgen, U., Cook, E., D'arrigo, R., Davi, N., Esper, J., Frank, D., and Gunnarson, B.: Last millennium northern hemisphere summer temperatures from tree rings: Part I: The long term context, Quaternay Sci. Rev., 134, 1–18, https://doi.org/10.1016/j.quascirev.2015.12.005, 2016.
Wilson, R., Anchukaitis, K., Andreu-Hayles, L., Cook, E., D'Arrigo, R., Davi, N., Haberbauer, L., Krusic, P., Luckman, B., and Morimoto, D.: Improved dendroclimatic calibration using blue intensity in the southern Yukon, Holocene, 29, 1817–1830, https://doi.org/10.1177/0959683619862037, 2019.
Wilson, R., Allen, K., Baker, P., Boswijk, G., Buckley, B., Cook, E., D'Arrigo, R., Druckenbrod, D., Fowler, A., Grandjean, M., Krusic, P., and Palmer, J.: Evaluating the dendroclimatological potential of blue intensity on multiple conifer species from Tasmania and New Zealand, Biogeosciences, 18, 6393–6421, https://doi.org/10.5194/bg-18-6393-2021, 2021.
Wilson, R. J., Esper, J., and Luckman, B. H.: Utilising historical tree-ring data for dendroclimatology: a case study from the Bavarian Forest, Germany, Dendrochronologia, 21, 53–68, https://doi.org/10.1078/1125-7865-00041, 2004.
Yanosky, T. M. and Robinove, C. J.: Digital image measurement of the area and anatomical structure of tree rings, Can. J. Bot., 64, 2896–2902, https://doi.org/10.1139/b86-382, 1986.
Zeileis, A. and Grothendieck, G.: Zoo: S3 infrastructure for regular and irregular time series, J. Stat. Softw., 14, 1–27, https://doi.org/10.18637/jss.v014.i06, 2005.
Zheng, Y., Shao, X., Lu, F., and Li, Y.: February–May temperature reconstruction based on tree-ring widths of Abies fargesii from the Shennongjia area in central China, Int. J. Biometeorol., 60, 1175–1181, https://doi.org/10.1007/s00484-015-1111-x, 2016.