the Creative Commons Attribution 4.0 License.
the Creative Commons Attribution 4.0 License.
 | 13 Sep 2023
Canopy gaps and associated losses of biomass – combining UAV imagery and field data in a central Amazon forest
Adriana Simonetti
Raquel Fernandes Araujo
Carlos Henrique Souza Celes
Flávia Ranara da Silva e Silva
Joaquim dos Santos
Niro Higuchi
Susan Trumbore
Daniel Magnabosco Marra
Understanding mechanisms of tree mortality and the dynamics of associated canopy gaps is relevant for robust estimates of carbon balance in forests. We combined monthly RGB images acquired from an unoccupied aerial vehicle with field surveys to identify gaps in an 18 ha plot installed in an old-growth central Amazon forest. We measured the size and shape of gaps and analyzed their temporal variation and correlation with rainfall over a period of 28 months. We further described associated modes of tree mortality (i.e., snapping, uprooting and standing dead) and branch fall and quantified associated losses of biomass. In total, we detected 32 gaps either in the images or field ranging in area from 9 to 835 m2. Relatively small gaps (< 39 m2) opened by branch fall were the most frequent (11 gaps). Out of 18 gaps for which both field and image data were available, three could not be detected remotely. Gaps observed in the field but not captured on the imagery were relatively small and mainly formed by the fall of branches from live and standing dead trees. Our data show that ∼ 17 % of the tree-mortality and branch-fall events only affected the lower canopy and the understory of the forest and are likely neglected by top-of-the-canopy assessments. Regardless of the detection method, the size distribution was best described by a lognormal function for gaps starting from the smallest detected size (9 and 10 m2 for field and imagery data, respectively), and the Weibull and Power functions for gaps larger than 25 m2. Properly assessing associated confidence intervals requires larger sample sizes. Repeated field measurements reveal that gap area does not differ significantly among modes of tree mortality or branch fall in central Amazon forests, with the last contributing the least to biomass loss. Predicting mechanisms of gap formation based on associated area and biomass loss remains challenging, which highlights the need for larger datasets. The rate of gap area formation was positively correlated with the frequency of extreme rainfall events, which may be related to a higher frequency of storms propagating extreme rain and wind gusts. While remote sensing has proven to be an accurate and precise method for mapping gaps compared to field data (i.e., ground truth), it is important to note that our sample size was relatively small. Therefore, the extrapolation of these results beyond our study region and landscape shall be made cautiously. Apart from improving landscape assessments of carbon balance, regional information on gap dynamics and associated mechanisms of formation are fundamental to address forest responses to altered disturbance regimes resulting from climate change.
Please read the corrigendum first before continuing.
-
Notice on corrigendum
The requested paper has a corresponding corrigendum published. Please read the corrigendum first before downloading the article.
-
Article
(2463 KB)
- Corrigendum
-
Supplement
(542 KB)
-
The requested paper has a corresponding corrigendum published. Please read the corrigendum first before downloading the article.
- Article
(2463 KB) - Full-text XML
- Corrigendum
-
Supplement
(542 KB) - BibTeX
- EndNote


Tropical forests store roughly 25 % of terrestrial biomass carbon stocks (Pan et al., 2013). The maintenance of these stocks depends on dynamic processes that regulate the growth and mortality of trees (Brienen et al., 2015; McDowell et al., 2018). Reports of increased tree mortality in tropical and temperate regions raise questions about the influence of climate change on the dynamics and functioning of old-growth forests (Laurance et al., 2004; Phillips and Gentry, 1994; Allen et al., 2015). In the tropics, climate change is related to increased frequency and intensity of extreme events, such as convective storms and droughts (Feng et al. 2023; Tan et al., 2015; Allen et al., 2015; IPCC, 2021), that can increase rates of tree mortality and branch fall, thereby altering patterns of forest biomass and carbon (Laurance et al., 2004; Chambers et al., 2013; McDowell et al., 2018). Thus, understanding mechanisms of tree mortality and gap formation is fundamental to upscale estimates of carbon balance and to anticipate the response of forests to climate scenarios (Clark et al., 2017; Leitold et al., 2018).
Gaps are natural openings in the forest canopy caused by falling trees and/or branches (Brokaw, 1982; Whitmore, 1989). Such disturbances exert great influence on the dynamics and functioning of tropical forests, as they alter structure (Kellner et al., 2009), natural regeneration (Grubb, 1977; Kellner and Asner, 2014; Magnabosco Marra et al., 2014a), species diversity and functional composition (Denslow, 1987; Magnabosco Marra et al., 2014b, 2018), soil carbon and nutrients (Santos et al., 2016; Vitousek and Denslow, 1986), and productivity (Baker et al., 2004). The size of gaps can vary from a few square meters to thousands of hectares, depending on the mechanism of formation (Nelson et al., 1994; Fontes et al., 2018; Magnabosco Marra et al., 2018; Esquivel-Muelbert et al., 2020; Araujo et al., 2017, 2021b), and defines the amount of light and other key resources during succession (Denslow, 1980, 1987; Schliemann and Bockheim, 2011). In addition to being influenced by mechanisms of formation, the size and shape of gaps can also be influenced by local climate, extreme weather events, topography, soil, forest structure and species composition (Denslow, 1987; Magnabosco Marra et al., 2014b; Araujo et al., 2021b; Cushman et al., 2022). Apart from improving assessments of carbon stocks and balance, quantifying the size distribution of gaps informs key processes regulating forest structure and diversity and related functions (Jucker, 2022).
Extreme wind and rain are major mechanisms of tree damage and mortality in the Amazon forests (Nelson et al., 1994; Chambers et al., 2013; Magnabosco Marra et al., 2018; Urquiza Muñoz et al., 2021; Negrón-Juárez et al., 2023). Gaps opened by extreme wind and rain can have areas greater than 3000 ha (Nelson et al., 1994; Espírito-Santo et al., 2014; Negrón-Juárez et al., 2010, 2018, 2023). Recent studies have identified windthrow hotspots (Negrón-Juárez et al., 2023), with their frequency influenced by climate-sensitive atmospheric phenomena such as convective potential energy (CAPE) (Feng et al., 2023). Previous studies reported a higher frequency of gaps during wet months, even in drought years, which suggests a positive correlation between precipitation and tree mortality (Fontes et al., 2018; Aleixo et al., 2019). Additionally, satellite data support the fact that large-scale windthrows (Magnabosco Marra et al., 2014b) visible on Landsat imagery (Negrón-Juárez et al., 2011) occurred more frequently between September and February, which are months marked by extreme rainfall (e.g., > 30 mm h−1; Negrón-Juárez et al., 2010, 2017).
In the field, a gap can be defined by an opening in the forest canopy extending from the upper stratum to an average height of 2 m aboveground (Brokaw, 1982). Traditionally, studies of gap dynamics and geometry (e.g., area, perimeter and shape) have relied on observations made as part of forest inventories (Brokaw, 1982; Hubbell et al., 1999). However, gap-forming events can be stochastic, and obtaining robust information on their frequency and geometry based on a small number of plots and infrequent surveys is a challenging task (Fontes et al., 2018).
In the Amazon, studies using remote sensing have shown that small gaps are more frequent than relatively larger events, such as those associated with convective storms (Nelson et al., 1994; Chambers et al., 2013; Araujo et al., 2017; Dalagnol et al., 2021; Gorgens et al., 2023). However, the use of intermediate spatial resolution data such as Landsat (30 m × 30 m pixel, 0.09 ha) does not allow for mapping the smaller and more frequent disturbances (e.g., < 0.1 ha), including those only affecting the lower canopy of the forest. As demonstrated for the region of Manaus (Brazil), Landsat images are only sensitive in detecting mortality events involving from 6 to 8 fallen trees (Negrón-Juárez et al., 2011; Chambers et al., 2013). This mismatch between the monitoring of gap dynamics using forest inventory and satellite data covering large regions and periods of time constrains the existing knowledge on the mechanisms of the formation of relatively smaller and more frequent gaps and thus of their influence on landscape patterns of forest dynamics and biomass balance.
The photogrammetry computed from unoccupied aerial vehicle (UAV) imagery, commonly known as drones, is a promising alternative to assess the full gradient of gap size and geometry. In addition to a more detailed description of size and geometry, successive UAV imaging allows for monitoring gap dynamics at higher spatial and temporal resolutions than that provided by satellite imagery, often limited by cloud cover and relatively long revisiting times (Getzin et al., 2014; Araujo et al., 2021b; Senf, 2022). However, optical remote sensors usually have a limited detection of the lower canopy of dense forests. Therefore, the monitoring of gap dynamics using optical data (including UAV imagery high spatial and temporal resolution) must be validated on the field.
Here, we combined continuous forest inventories with UAV high-resolution photogrammetry to quantify the relative contribution of mechanisms of gap formation such as different modes of tree mortality and branch fall, and to compute associated losses of biomass in an 18 ha Amazon forest. The combination of high spatial resolution imagery and field data offered us a unique opportunity to describe the seasonality of tree-mortality events and possible interactions with extreme weather events and their relevance for the maintenance of carbon stocks. We addressed the following questions: (i) how sensitive is RGB photogrammetry acquired with UAV for the detection of gaps? (ii) Is there a difference in the size distribution and geometry of gaps measured with RGB photogrammetry and forest inventory? (iii) Are gap geometry and biomass losses influenced by modes of tree mortality? (iv) Is the rate and size of gap formation related to rainfall?
2.1 Study area
The study was conducted on a permanent plot (2∘36′47′′ S; 60∘08′41′′ W) monitored within the projects Wind–Tree Interaction in the Amazon (INVENTA) and the Amazon Tall Tower Observatory (ATTO) (Fig. 1a). This plot (hereafter referred to as INVENTA plot) is located at the Estação Experimental de Silvicultura Tropical (EEST) from the Instituto Nacional de Pesquisas da Amazônia (INPA), a reserve with 21 000 ha of contiguous old-growth forest (Fig. 1b). The EEST is accessible via the local road ZF-2, located at kilometer 50 of the BR-174 highway north of Manaus, Brazil (Fig. 1c). The INVENTA plot has a size of 18 ha (600 m × 300 m) and is divided into 450 subplots of 20 m × 20 m. The INVENTA plot was established in 2000 as part of the Jacaranda Project (Pinto et al., 2003). At the time it started, all trees, palms and lianas with DBH (diameter at breast height, 1.3 m) ≥ 5 cm were recorded. In 2017, prior to the start of INVENTA, all trees and palms with DBH ≥ 10 cm were remeasured to provide a robust baseline for the development of further research.
The canopy trees in our study region are 28.65 m ± 0.46 m tall (mean ± standard deviation) (Araujo, 2019). The forest understory and canopy are dense and closed. The richness of 10 cm DBH trees in this region can exceed 280 species ha−1 (Oliveira and Mori, 1999). The INVENTA plot has an undulating topography typical of the region, including areas of plateau (predominantly clay soil), slope and valley (sandy soils). The mean annual precipitation and temperature in the Manaus region are 2231 ± 118 mm yr−1 and 26.9 ± 0.17 ∘C, respectively (1970–2016 period) (Magnabosco Marra et al., 2018). The region experiences 3 consecutive months (mostly commonly from July to September) with less than 100 mm of rainfall (Negrón-Juárez et al., 2017; Wu et al., 2016).
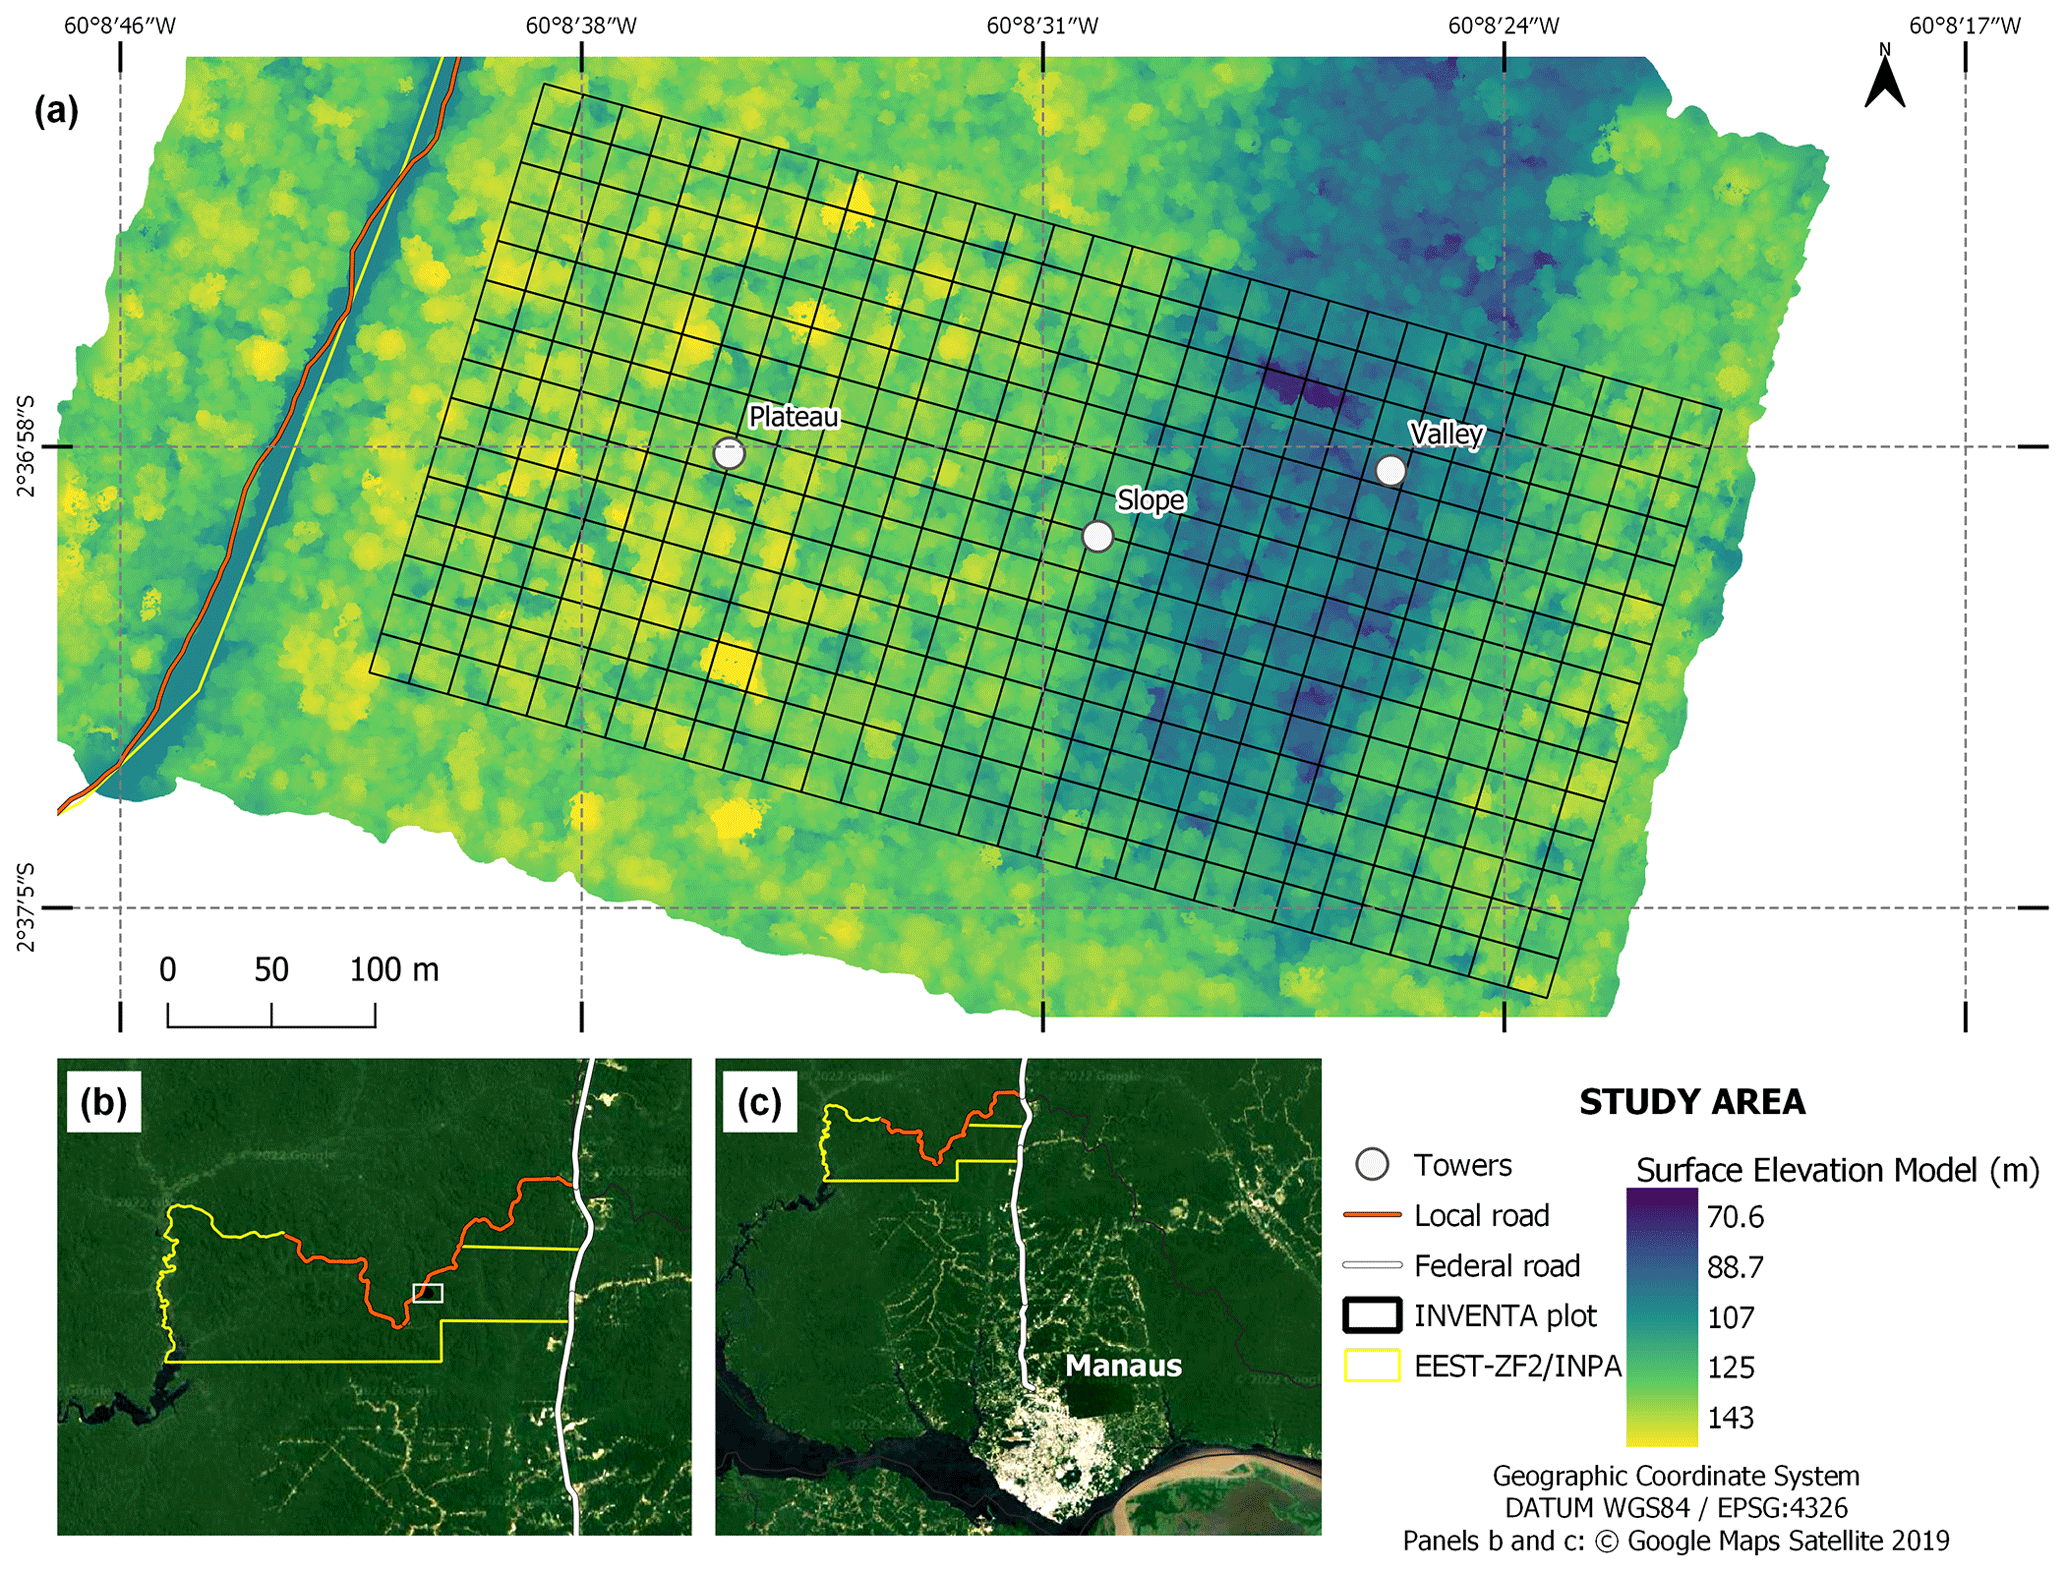
Figure 1INVENTA plot with an area of 18 ha (300 m × 600 m), located ∼ 50 km north of Manaus, central Amazon, Brazil. Elevation refers to the canopy surface model generated from photogrammetry of RGB images acquired with an UAV.
2.2 Acquisition and processing of remote sensing data
Imagery data were collected monthly, between September 2018 and January 2021 (28 months), using a digital RGB camera deployed on the DJI Phantom 3 and 4 UAVs (see details on acquisition period in Table S1). The flight plans were programmed using the DJI Ground Station application installed on a tablet device (Apple, model A1489), which was connected to the aircraft remote control and configured for automated flight from predefined waypoints. The camera lens has a field of view (FOV) angle of 94∘, and the pictures generated have a resolution of 12 Mp, with maximum dimensions of 4000 pixels × 3000 pixels. The overflights were performed at 100 m height above the ground, with an approximate speed of 9.9 m s−1, in order to generate images with ∼ 100 m width at canopy height. Photographs were captured every 2 s with 85 % and 70 % longitudinal and lateral overlap, respectively. The camera was calibrated on each flight to reduce the effects of varying illumination within and between flights. To ensure homogeneous images and diffuse lighting conditions throughout the studied period, whenever possible, flights were performed in mid-morning and/or late afternoon (further details on imagery acquisition are available in Text S1).
The acquired photos were processed using the software Agisoft Metashape (version 1.5.2) (AGISOFT LLC., St Petersburg, Russia). This software aligns photos using the Scale-Invariant Feature Transform (SIFT) algorithm (Lowe, 2004), which allows for ratifying photos with a bending angle greater than 3 degrees. Through this procedure, photos were aligned from overlapping common features (i.e., textures). Further, these aligned points were given X, Y and Z coordinates, and the parallax effect seen on the overlapping photos was used for reproducing the stereoscopic (3D) view based on the structure from motion (SfM) method. After creating the 3D point network, a dense cloud of XYZ points was generated to fill empty spaces (i.e., dense point cloud). From the dense point cloud, a digital surface model (DSM) and an orthomosaic were generated. The DSM is a digital geographic dataset that represents surface elevations with horizontal and vertical (X, Y, Z) coordinates (Iglhaut et al., 2019). The orthomosaic reproduces the real dimensions of objects (Araujo et al., 2020), with horizontal spatial resolution ranging from 3 to 7 cm.
The orthomosaic and DSM were aligned vertically and horizontally using the georeferencing process from lidar data collected for the same area as part of the EBA project (Ometto et al., 2023). The workflow consisted of creating a georeferenced project based on control points extracted from lidar. Subsequential flights were matched using the “Align Chunks” tool available in Agisoft Metashape (see further details in Text S2).
Detection of canopy gaps
Canopy gaps within the UAV images were identified through the combination of DSM change analysis, visual interpretation of the orthomosaics (Fig. 2) and field data. Initially, we resampled the pixel resolution of photos to 1 m, and the difference image was calculated for all pairs to obtain a raster product (i.e., difference image) describing changes in canopy height among time intervals.
In order to compare our data with previous studies, the area of the identified gaps was computed as the region where the canopy lost > 10 m in height over continuous areas > 5 m2, with an area perimeter ratio greater than 0.6. This was also the smallest gap size reported in previous studies (Runkle and Yetter, 1987; Getzin et al., 2014). By computing the area perimeter ratio, we were able to remove artifacts associated with slight changes on the positions of individual trees in subsequential pairs of images, both due to wind-driven canopy shifts and changes in tree alignment (Araujo et al., 2021b). Therefore, the criterion for gap identification was based on the analysis of gap size and shape. Finally, successive pairs of orthomosaics covering subplots (i.e., 400 m2) were visually checked. When necessary, we edited the pre-delineated polygons by removing false gaps related to image noise (Araujo et al., 2021b).
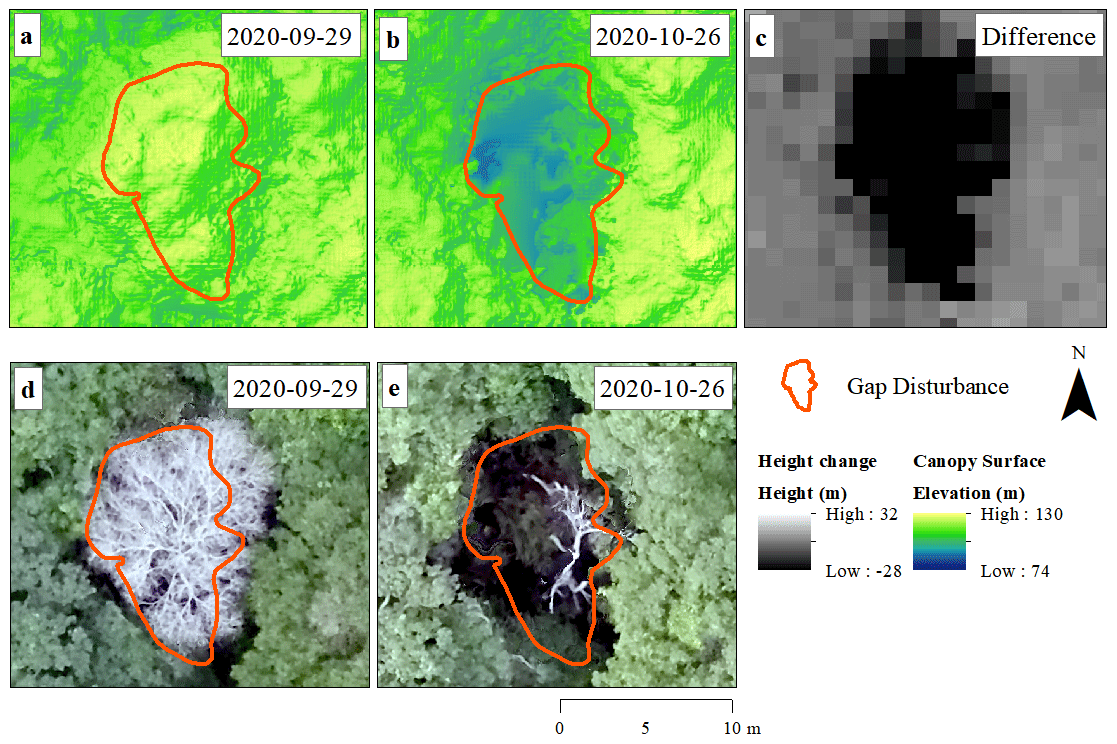
Figure 2Canopy gaps identified from surface models and orthomosaics computed from photogrammetric analyses of UAV imagery. Elevation model for a studied gap on two successive flights from 29 September 2020 (a) and 26 October 2020 (b). The difference in surface elevation between flights (black area) indicates a reduction in canopy height (c). RGB orthomosaics from the same area for consecutive months (d, e).
2.3 Field surveys for evaluating remotely sensed gaps
Field data were collected bimonthly (Sect. 2.3.1) and included the identification and description of gaps formed between November 2019 and January 2021 (14 months) (see details in Table S1). Initially, we identified and marked on the images all gaps formed before the studied period to create a reference baseline. The identification and description of gaps in the field were conducted by walking the entire plot. To minimize errors and ensure a precise counting and description of gaps, field campaigns were always carried out by the same team using trails of 10 m distance from each other.
We used the definition by Brokaw (1982) (i.e., gap in the forest canopy extending from the upper stratum to an average height of 2 m above ground) to compute and measure gaps in the field. This is a classical and practical method, which allows comparing our findings with those from fundamental work conducted in other tropical forests. In addition to confirming the gaps identified in the images, the field surveys included detailed walking of the entire plot to identify gaps possibly not detected remotely. The delimitation of gaps in the field was made by taking the coordinates (distance and azimuth) from the near center to the edges of the gap. We defined the boundaries of gaps by projecting the canopy aperture to the ground. For distance and azimuth measurements, a TruPulse 360B laser rangefinder (Laser Technology) was used. The center of the studied gaps was defined in the field, and respective coordinates were collected by averaging Global Navigation Satellite System (GNSS) points. From the center of the gap, the acquisition of eight directions and distances to the boundary was done counterclockwise, with the first measurement pointing north (360∘ and/or 0∘). The data from each gap were vectorized in QGIS Geographic Information System (version 3.4.13) (Open Source Geospatial Foundation Project, http://qgis.osgeo.org, last access: 5 April 2022). We then calculated the geometric features of identified gaps including area, perimeter and shape complexity index.
Mechanisms of gap formation and biomass estimation
After delimiting gaps, we measured forest-structure attributes. For dead trees, the tag number, number of plot and subplot, tree DBH, and the mode of mortality were recorded. We described modes of tree mortality based on previous studies conducted in our study region (Magnabosco Marra et al., 2014b; Ribeiro et al., 2014, 2016): (i) standing dead – trees without leaves and/or presence of sap and/or exudates in the trunk (standing dead trees can form or expand gaps through falling branches or the later breakage of the main stem); (ii) snapping – trees that died from the mechanical rupture of the stem, with sap/exudates often still present at the portion connected to the roots, exposed wood fibers and no clear damaged or exposed roots; and (iii) uprooting – uprooted trees (i.e., roots partially or fully exposed at the ground surface) with the main trunk usually intact and still connected to the crown, often with fresh leaves and sap/exudates.
Tree biomass was estimated using an allometric equation calibrated locally that has DBH as the sole predictor (Magnabosco Marra et al., 2016). For branches with diameter ≥ 5 cm, the volume was obtained by combining the Smalian (measuring diameters at the base and top) and Hohenwald (relative section length division) cubing methods (Lima et al., 2012; Gimenez et al., 2017). Most of the branches had no fresh vegetative material that allowed taxonomical identification to the species level. Thus, we estimated branch biomass by multiplying the measured volume of branches by the mean wood-density value compiled for our study region (0.735, 0.480, 1.000 g cm−3; mean, minimum and maximum, respectively) (Magnabosco Marra et al., 2016).
2.4 Rainfall data
Rainfall data covering the studied period were acquired from a rain gauge installed about 2 km from the INVENTA plot. Total daily precipitation was annotated manually. The dry season was defined as the months in which total rainfall was lower than the monthly average throughout the monitored period. For that, we used a threshold rainfall of < 200 mm (July, August, September and October) because there were no consecutive months with rainfall ≤ 100 mm (Negrón-Juárez et al., 2017; Wu et al., 2016) (Fig. S1) during the studied period. We also identified days with extreme rain events, which were defined as those when the accumulated precipitation was higher than the 99th percentile calculated for the entire studied period.
2.5 Data analysis
2.5.1 Remote sensing and field detection of gaps
Field data acquired by using the definition of Brokaw (1982) were considered as ground truth. To evaluate the robustness of our remote method of gap detection we used a confusion matrix. Further, we calculated the percentiles of accuracy (a), precision (p), recall (r) and F1 Score (F) (Eqs. 1–4) (Dalagnol et al., 2021), where TP is true positive, TN is true negative, FP is false positive and FN is false negative:
The total number of correct detections is expressed as a percentile. The p percentile indicates the ratio of positive predictions performed correctly based on all positive predictions (including false ones). The r percentile is used to access the ratio of correct positive predictions in relation to all positive predictions. The F1 Score (F) is the harmonic mean between p and r (i.e., the mean between the errors of commission and omission). High F values indicate higher agreement between gaps identified remotely and in the field.
2.5.2 Geometry and size structure of gaps
We quantified gap height and area from the DSM of the forest canopy. Gaps formed during the period for which only the UAV monitoring was carried were validated during a single field campaign. The area of these gaps was also measured according to Brokaw's (1982) method. We also calculated the gap shape complexity index (GSCI = perimeter sqrt (area 4 π)), whose smallest reference value is 1.0 for describing a circle (Getzin et al., 2012, 2014). We tested how height loss was correlated with the area of the gaps using Pearson's correlation. We used a paired t test to compare the log-transformed gap geometry (area, perimeter and shape complexity index) calculated from our UAV imagery and field data.
The size distribution of gaps identified in the field and remotely were described using four probability distributions: exponential, power-law (or Pareto), Weibull and lognormal. We used a bootstrap with 1000 interactions for calculating the confidence interval of the different fits (Araujo et al., 2021a). The parsimony of the fitted models was assessed using the Akaike information criterion (AIC) (Burnham and Anderson, 2002). We also assessed the best fit using the Kolmogorov–Smirnov statistic to compare the maximum difference in the cumulative probability distributions between the observed and the fitted data (Carvalho, 2015). Fits were obtained by using absolute values of frequency (Araujo et al., 2021a). We tested the size class distributions from the smallest gap size found in both methods (9 and 10 m2 for field data and UAV imagery, respectively). We also fitted the distribution model only for gaps ≥ 25 m2 to test for possible differences related to the relatively higher proportion of small-sized gaps in our dataset.
2.5.3 Mechanisms of gap formation and biomass losses
Combining high-resolution remote sensing with forest inventory data allowed us to identify and differentiate among gaps formed by the death of single trees, tree clusters and branch fall. For the comparative statistical analyses of the mechanisms, the area of gaps was calculated from the UAV imagery data. We counted and determined the area of gaps formed by each of these modes of tree mortality and branch fall. The main mode of tree mortality was determined from detailed observations as described in Sect. 2.3.1. We tested for possible differences in area and released biomass among mechanisms of gap formation using Analysis of Variance (ANOVA) for two-tailed Student's t test on the log-transformed area and biomass. Before that, we checked whether variables met assumptions for normality (Shapiro–Wilk test) and homogeneity of variance (Levene test).
2.5.4 Correlations between gap frequency and area with precipitation
We assessed the correlation between gap frequency and area with cumulative precipitation and the occurrence of extreme rainfall events using local data (see Sect. 2.4). The area and frequency of gaps were calculated from the UAV data acquired between September 2018 and January 2021 (28 months). We further calculated the rate of gap area formation by dividing the summed area of all gaps by the duration of the respective time intervals during which the gaps were observed (11–80 d). We expressed the rate of gap area formation in hectares per month. The gap frequency rate was also computed from the summed area over the different time intervals and expressed as a percentage per month. The temporal variation of gap area and frequency was normalized by the time in months between each pair of images. We also confirmed that these data met assumptions for normality (Shapiro–Wilk test) and homogeneity of variance (Levene test). We correlated these log-transformed variables using Pearson's correlation.
3.1 Sensitivity of gap detection
We remotely detected 32 gaps formed between September 2018 and January 2021 (Fig. 3). Out of that, 14 gaps were formed during the monitoring period for which no simultaneous field data were acquired. Another 18 gaps were formed during the period for which we conducted the remote and field monitoring simultaneously (November 2019 to January 2021).
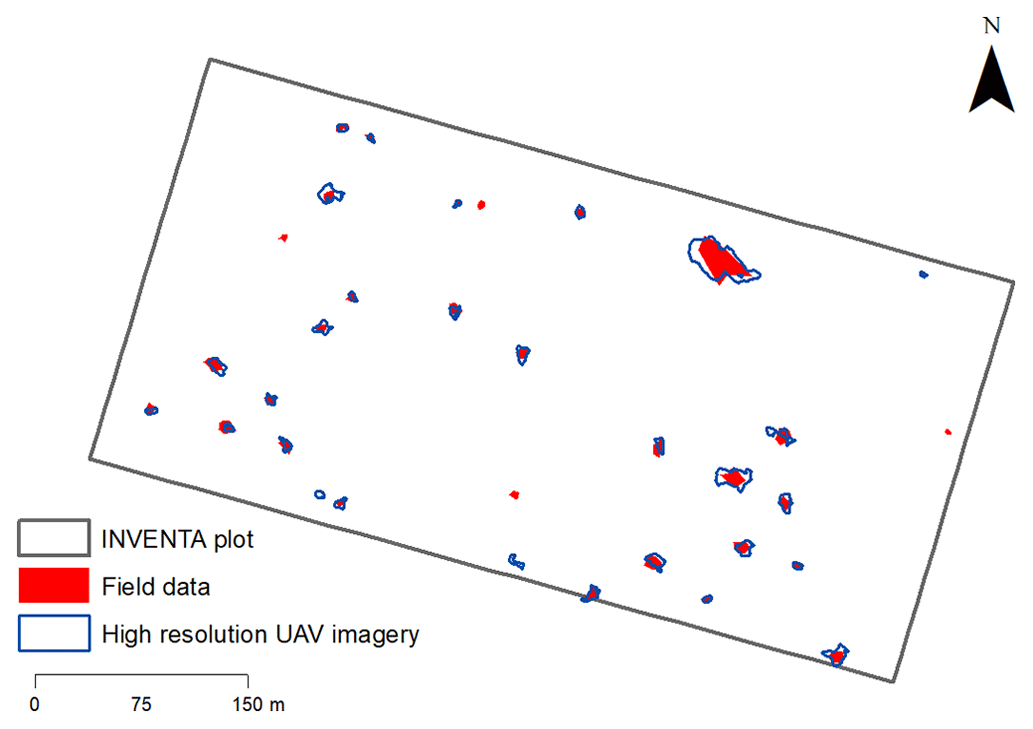
Figure 3Map including the location of 32 canopy gaps identified with UAV photogrammetry and inventory plot surveys (“field data”) in the INVENTA plot (total area of 18 ha) located in the central Amazon, Brazil, during the period from 18 September 2018 to 19 January 2021 (28 months).
For the 18 gaps for which field (i.e., ground truth) and UAV data were collected simultaneously, 14 gaps were detected using both methods, three gaps were only detected in the field and one was only detected in the imagery (Table S2). The accuracy, precision, recall sensitivity and F1 score obtained with our remote sensing UAV method were 77.78 %, 93.33 %, 82.36 % and 87.50 %, respectively.
Out of the three gaps detected exclusively from field data, two were formed by the fall of standing dead trees (total area of 15 and 26 m2) and one by branch fall (20 m2). These gaps, which were not visible on either the difference images or the orthomosaics, indicate an absence of detectable change in the upper canopy. The single gap only detected from imagery data was formed by the partial loss of the crown of a standing dead tree. Importantly, this gap does not fit the definition by Brokaw (1982), in which gaps are considered an opening that extends from the upper canopy to the understory.
3.2 Patterns of gap geometry and size structure
The size of gaps identified remotely and, in the field, during September 2018 and January 2021 varied from 10.37 to 834.65 m2 and from 9.59 to 580.65 m2, respectively (Table 1, Fig. S2a). UAV-inferred gap size exceeded the field-inferred gap size substantially for the largest gap (difference of 254 m2). On average, the difference was 11.5 m2 (17 % of mean field gap size) but non-significant (p=0.85). Nonetheless, gap perimeter and shape complexity index (GSCI) varied significantly between methods (p=0.01 and p≤0.001, respectively) (Table S3).
Table 1Geometric attributes of gaps detected over a period of 28 months in the INVENTA plot, central Amazon, Brazil.
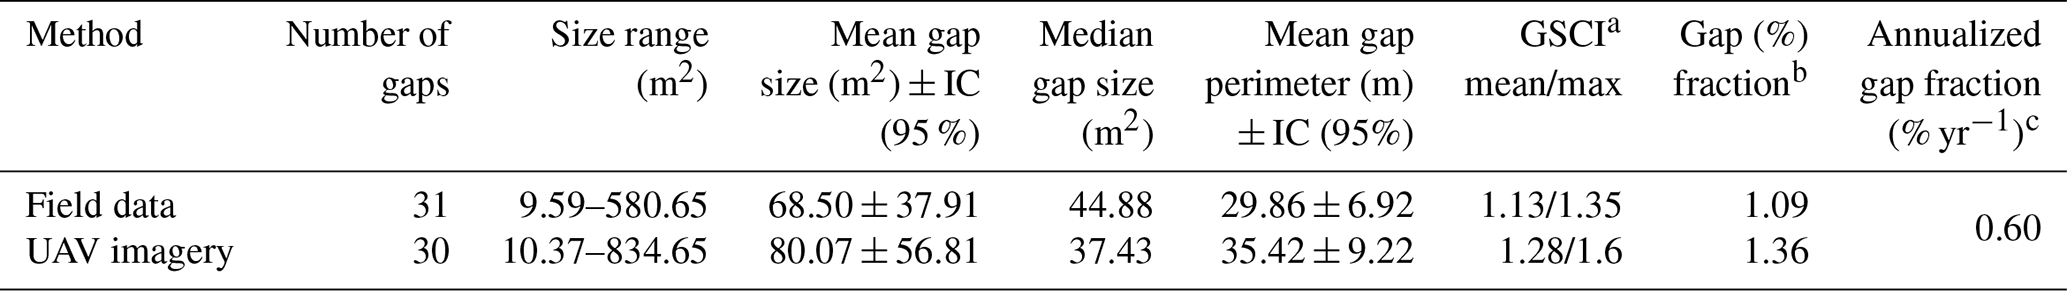
a Gap Shape Complexity Index (GSCI = perimeter sqrt (area 4π)), whose smallest reference value is 1.0 for describing a circle (Getzin et al., 2012, 2014). b Gap fraction is given by the sum of the area of gaps identified over the studied period of 28 months divided by the total monitored area (i.e., INVENTA plot/18 ha). c Annual gap fraction is given by the sum of the area of identified gaps on an annual basis (i.e., INVENTA plot/18 ha/duration of study).
Approximately 50 % of gaps described within the 28 months for which field and imagery data were available had a total area of ≤ 40 m2. This result indicates that, in our study site, relatively small gaps are the most frequent canopy disturbance (Table S4). Although more frequent, these relatively small disturbances accounted for only ∼ 16 % of the cumulated gap area.
Gap size was positively related to reductions in canopy height (Fig. 4). The two gaps with the lowest values of height loss (i.e., 1.13 and 2.13 m) were only detected in the field (Fig. 4).
The size distribution of 29 gaps larger than 9 m2 (field data) and 10 m2 (UAV data) was best described by the lognormal function (Figs. 5, S2, Table S5). The distribution of gaps larger than 25 m2 was best described by the Weibull and power-law function in both methods (Table S5, Fig. S2b).
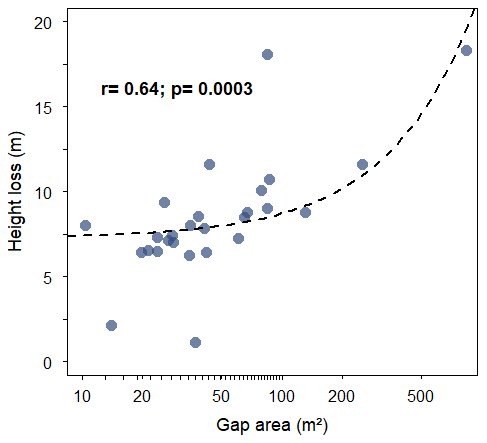
Figure 4Relationship between mean canopy height loss and gap area in the INVENTA plot, central Amazon, Brazil, over the period from 18 September 2018 to 19 January 2021. Gap area was calculated from the UAV imagery data. The x axis is log-scaled.
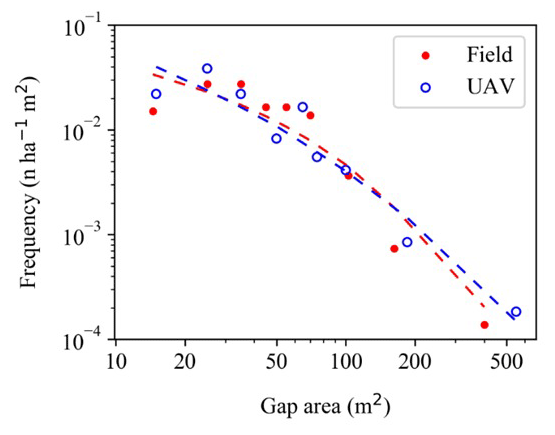
Figure 5Size distribution of gaps formed in the INVENTA plot, central Amazon, Brazil, over the period from 18 September 2018 to 19 January 2021. Gaps were measured from inventory plot surveys (red) and UAV imagery data (blue). Both datasets were fit using a lognormal function (dotted lines).
3.3 Mechanisms of gap formation and biomass losses
All mechanisms of gap formation accounted for a substantial share of the gaps created (from ∼ 20 % for standing dead trees to ∼ 35 % for branch falls). By contrast, the contribution to total gap area was highly asymmetric, with ∼ 60 % accounted for by tree snapping and < 10 % by standing dead trees. This result indicates that tree snapping was the most important mechanism of gap formation in respect to the overall disturbed area (Table 2).
Branch fall, uprooting, snapping and standing dead trees accounted for 53 %, 10 %, 7 % and 10 % of the number of gaps detected on the imagery, respectively. For gaps only identified from field data, these mechanisms accounted for 60 %, 10 %, 7 % and 3 %, respectively.
We found no clear differences in the area attributed to gaps formed by branch fall and the different modes of tree mortality (p=0.2) (Fig. 6a). However, we found strong evidence that the biomass released in gaps formed by tree snapping was higher than that associated with gaps formed by branch fall (p=0.02) (Fig. 6b). Furthermore, the biomass loss was not related to gap area (Fig. S3a) and GSCI (Fig. S3b). The overall loss of biomass in our studied gaps (1.35 Mg ha−1 yr−1) accounts for 0.88 % of the stocks in an old-growth forest contiguous to our plot (355.67 ± 34.53 Mg ha−1) (mean ± standard deviation) (Amaral et al., 2019).
Table 2Relative contribution of the different mechanisms of gap formation observed in the INVENTA plot, central Amazon, Brazil, between September 2018 and January 2021.
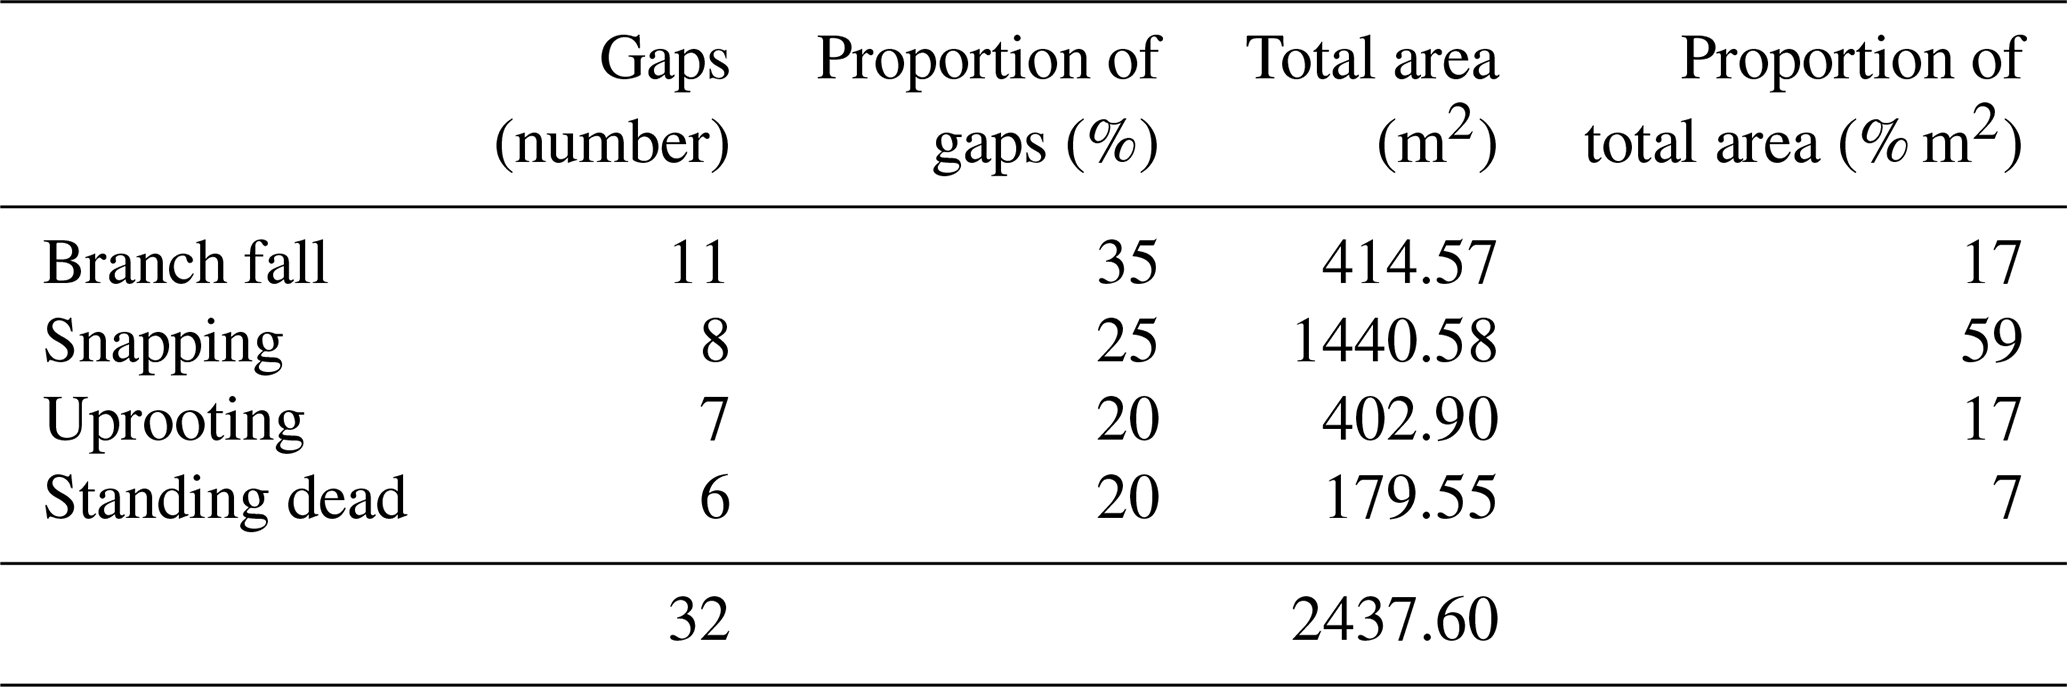
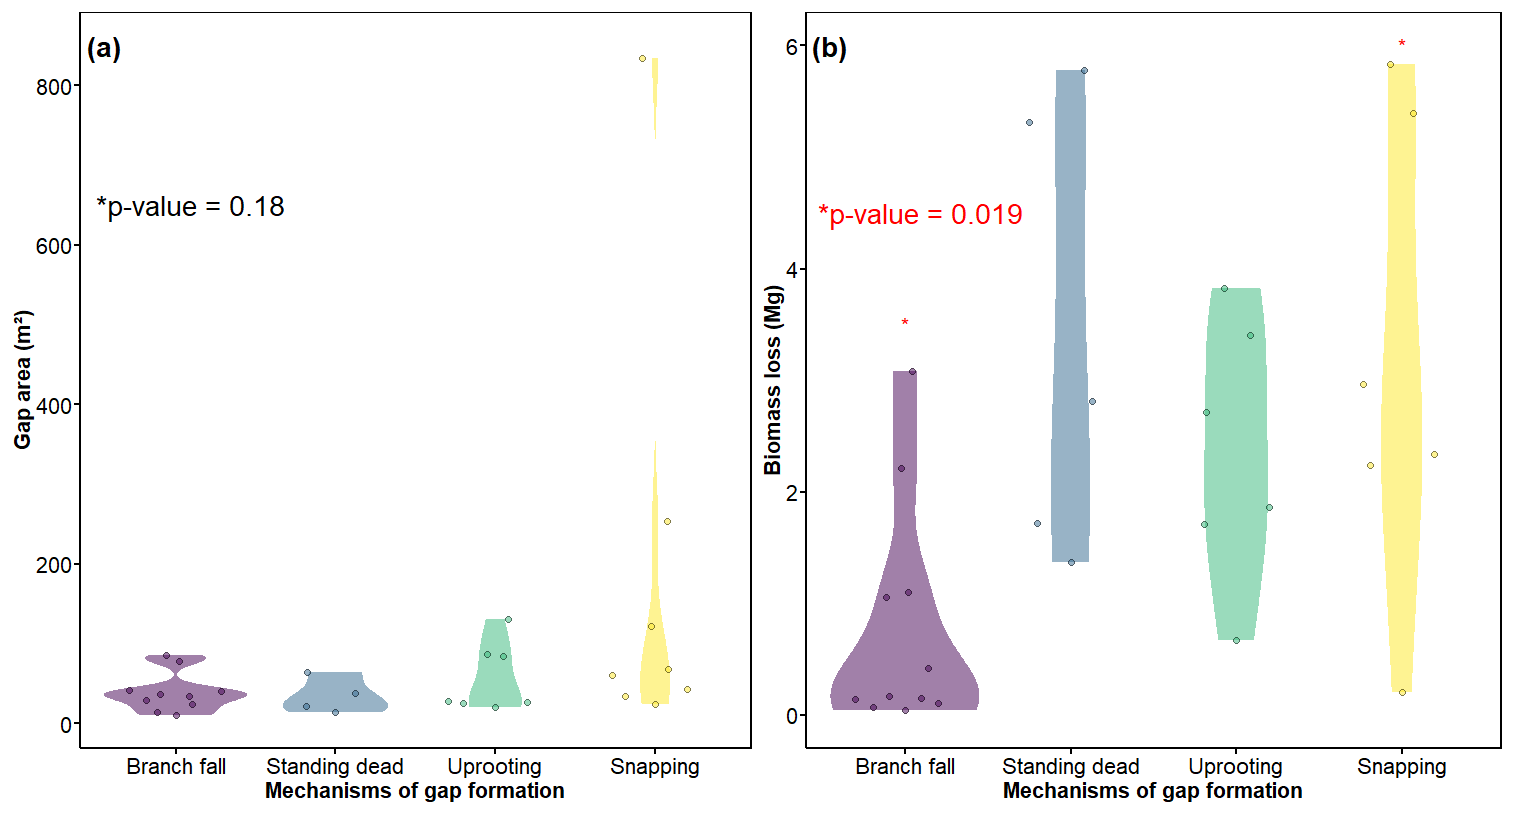
Figure 6Gap area (a) and biomass loss (b) for mechanisms of gap formation studied in the INVENTA plot, central Amazon, Brazil, over the period from 18 September to 19 January 2021. The area of gaps was calculated from the UAV imagery data. We detected significant differences in biomass loss for branch fall and snapping only (b).
3.4 Rainfall seasonality and gap formation
The gap frequency and area rates were calculated using all 32 gaps identified during the studied period, which were derived from the analysis of UAV imagery. Although gap frequency and area rate varied among the 28-month period of monitoring, our data do not support that monthly rainfall influenced these metrics (p=0.8081 and p=0.4193; Fig. 7a and b, respectively). However, our data show that monthly gap formation was marginally correlated with gap area rate for days with extreme rainfall events (67.08 mm d−1) (r=0.37 and p=0.058) (Fig. S4). The time interval accumulating the largest gap area (24 October to 27 December 2018) included two extreme rainfall events: 104 mm d−1 on 20 October and 76 mm d−1 on 8 November 2018 (Fig. S4).
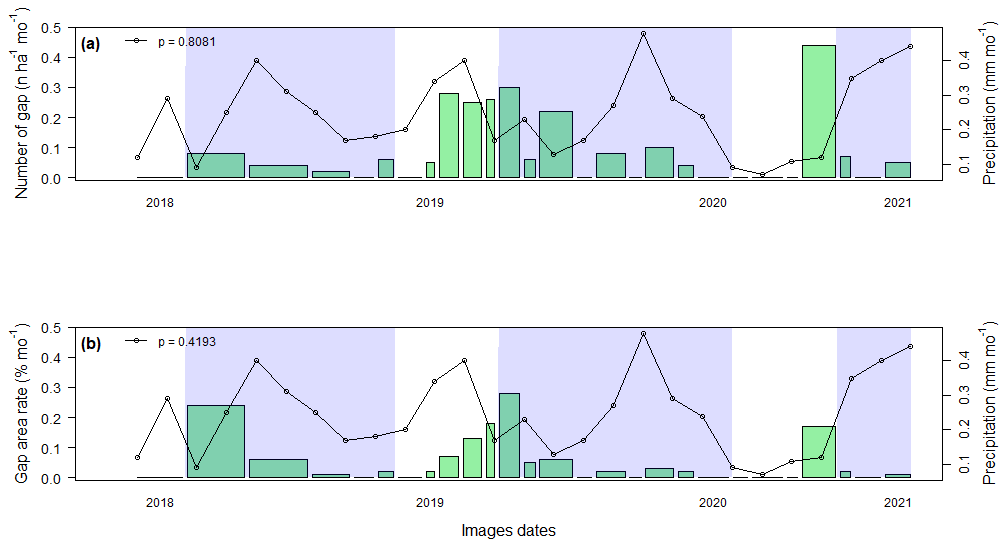
Figure 7Seasonality of canopy gaps formed in the INVENTA plot, central Amazon, Brazil, during the period from 18 September to 19 January 2021. Gap frequency (a) and the cumulative rate of gap area formed over the observation (b). The Y2 axis (right) is the cumulative precipitation for each pair of time intervals between images (straight line with dots). The blue shading indicates the rainy season (September to June) for each year. The total area of each green rectangle is proportional to the total area of the gaps formed during the respective interval.
4.1 Detection is influenced by modes of tree mortality, branch fall and consequent gap features
We detected 17 and 16 gaps from field and imagery data, respectively; 14 gaps were identified from both methods. In a few cases, gaps detected from UAV imagery data (i.e., losses of canopy height) could not be detected from field surveys and did not fit the classical definition proposed by Brokaw (1982). While we found no evidence supporting strong divergences between the UAV and field data, this shall be tested beyond our study region and ideally with datasets spanning larger areas and longer periods of time. This will allow addressing further questions on the seasonality and landscape importance of canopy disturbance.
Gaps observed in the field but not captured on the imagery (three) were relatively small and mainly formed by the fall of branches from live and standing dead trees. Nonetheless, branch fall impacted relatively smaller areas and resulted in relatively lower biomass losses. It is important to note that the sensitivity for detecting gaps was influenced by modes of tree mortality, which also lead to specific effects on species composition in regenerating patches of forest (Putz et al., 1983; Chao et al., 2009).
Our remote sensing approach provides detailed data on the upper canopy of the forest but no information on the understory. In our study, gaps were defined as canopy openings with total area > 5 m2 and with reductions of canopy height > 10 m. These thresholds were established based on the nominal resolution of our processed imagery (1 m) and the scale at which the forest inventories were conducted, i.e., tree level. Overall, the fall of branches and/or standing dead trees produced damage mostly in the upper canopy, while the understory remained intact. Therefore, upper canopy gaps detected remotely were not always detected on the ground using the definition by Brokaw. This pattern shows that apart from covering relatively larger areas at low costs, UAV photogrammetry is an efficient method for monitoring gap dynamics, with detailed information on upper canopy disturbance often not visible in median- to low-resolution optical imagery.
We believe our approach of combining field with remote sensing data provides interesting insights on concepts and methods for quantifying gaps and their effects on forest dynamics in dense tropical forests. Nonetheless, classical methods based on field observations are efficient for detecting gaps extending from the lower canopy to the understory of the forest and crucial for validating remote tools and for quantifying and modeling associated losses of biomass. High-resolution photogrammetry allows for more precise measurements of size attributes and further attributes of gaps, including those restricted to the upper canopy and/or causing minor damage. Although more frequent, small-scale disturbances not implying tree mortality such as branch fall and defoliation are often neglected in forest inventories (Zuleta et al., 2023). In this context, our study contributes novel knowledge on the importance of relatively small and more frequent gaps to ecosystem processes such as forest succession and carbon balance. Quantifying the size distribution of gaps and their landscape importance is crucial to understand how forests respond to shifts in the disturbance regimes trigged by climate change and land use.
To our knowledge, this is the first study quantifying biomass losses associated with understory gaps. We demonstrated that these gaps contribute relatively little to landscape patterns of biomass. Still, future studies are required to address their importance to processes regulating patterns of species composition and diversity. UAV photogrammetry has a relatively low cost, is simpler to process and thus can feasibly be repeated in other regions of interest. Future studies may expand the existing knowledge on the size distribution and dynamics of gaps by combining sensors with different resolutions. UAV imagery combined with lidar can be used to trace and quantify the regional importance of relatively smaller but more frequent events of tree damage and mortality that are not detectable by median- to low-resolution optical satellite imagery such as Landsat (Negrón-Juárez et al., 2011; Chambers et al., 2013).
4.2 Gap geometry and size structure: differences between imagery and field data
Our tests comparing gaps detected from UAV photogrammetry and field data are rarely found in the literature (Yue et al., 2019), especially for dense tropical forest. Although understory gaps can be missed, the results of our research confirm the suitability and robustness of UAV photogrammetry for monitoring canopy dynamics in closed-canopy forests. When combined with continuous forest inventory, UAV photogrammetry at high temporal resolution can also reveal associated mechanisms of gap formation and released biomass. However, the differences we found in perimeter and GSCI between imagery and field data indicate that the shape of gaps identified remotely and in the field can diverge. In our study, the differences between these methods are likely due to describing field-identified gaps as polygons that always had eight vertices. This contrasts with our remote estimates, on which losses of height (z value) and gap geometry were computed from 1 m2 pixels and for polygons which had a varying number of vertices. The shape of gaps measured in the field tended to be elliptical (Runkle, 1982) and triangular (Eysenrode et al., 1998).
To date, most methods describing the shape and area of gaps focused on a two-dimensional projection of the canopy to the forest floor. In these two-dimensional assessments, there are three main assumptions: (i) most of the gaps have an uniform elliptical shape, (ii) the shape of irregular gaps can be approximated with several measurements and (iii) the area of irregular-shaped gaps can be only be calculated from hemispherical photos (Schliemann and Bockheim, 2011). Here, we applied high-resolution imagery to assess gap geometry more detailed and beyond the number of vertices commonly applied in traditional field measurements. Vepakomma et al. (2008) combined lidar point cloud and field data from a boreal forest and also reported great differences in the shape of gaps derived from these two approaches. According to these authors, the more complex the shape and perimeter, the greater the difference between the remote and field measurements (i.e., ground truth). Although the area of the gaps did not vary between our two methods, the reported variations in perimeter and GSCI revealed that imagery data allow for more complex shapes that can better represent natural disturbances (Lertzman and Krebs, 1991; Gagnon et al., 2004). This was true for our study region, for which gaps detected from imagery data had a greater variety of shapes, often irregular. The shape is an important feature for understanding the structure and dynamics of tropical forests (Jucker, 2022), which is important for determining microsite resource availability (Canham et al., 1994) from the center to the edge of gaps (Gagnon et al., 2004). For the Amazon, there is still little research on how the shape of gaps varies across environmental and disturbance gradients (Malhi and Román-Cuesta, 2008).
The higher frequency of relatively small gaps we report here corroborates other studies that used different detection and classification methods (Lawton and Putz, 1988; Brokaw, 1982; Yavitt et al., 1995; Vepakomma et al., 2008; Asner et al., 2013; Leitold et al., 2018; Dalagnol et al., 2021; Gorgens et al., 2023). The power-law distribution had the steepest slope among the other tested functions. The distribution fit with remote data had a relatively lower slope, i.e., of a higher frequency of gaps larger than 100 m. The frequency of gaps larger than 10 m2 was a bit better captured by a lognormal function. The confidence of these fittings could be improved by using larger sample sizes. However, this is the first study combining UAV and field data to assess the size distribution canopy gaps in terra-firme Amazon forests. This can be explained by the size threshold we use for defining our gaps. The relatively lower density of small canopy disturbances compared to what would be expected under a power function may be partially explained by lower detection frequencies, i.e., measurement bias (Araujo et al., 2021b). This may be more important for gaps < 10 m2. Still, our results show that, independent of the detection method, the best fit describing the size frequency of gaps from 9 to 835 m2 in our study region was achieved with a lognormal function. As confirmed by our synchronized forest inventories, we believe that this pattern was not biased by gaps eventually not detected from imagery data. Furthermore, the lognormal distribution pattern was also observed for gap size distributions in various forest types with field monitoring of the size frequency distribution (Naka, 1982; Runkle, 1982; Yamamoto, 2000). This confirms the potential of UAV imagery for similar monitoring of the distribution of field data at the local scale.
4.3 Ecosystem importance of mechanisms of gap formation and associated losses of tree biomass
Repeated field measurements allowed us to quantify the relative importance of modes of tree mortality (i.e., standing dead, snapping and uprooting) and branch fall. Our results show that biomass losses did not differ among mechanisms of gap formation but were relatively smaller in more frequent gaps formed by branch fall. Nonetheless, we could not distinguish different gap formation based on the gap area and associated losses of biomass. These unclear differences indicate that quantifying the importance of varying mechanisms of gap formation (referring to the vectors that cause damage or death to trees and, consequently, gap formation) and modes of tree mortality (referring to mortality forms such as standing dead, snapped, and uprooted trees) is a challenging task that requires larger sample sizes and imagery data with higher spatial and spectral resolution.
Our findings corroborate those from a previous study conducted in Santarém (also in the Brazilian Amazon) using repeated high-density lidar data (Leitold et al., 2018). This study revealed that biomass losses due to single and multiple branch-fall events accounted for only 20 % of the estimated biomass loss from canopy and understory trees. Similarly, in Panama, branch fall was associated with 43.5 % of gaps formed over a 5-year period but only for 23 % of the total disturbed area (Araujo et al., 2021b). The consistency of these findings across different tropical forests highlights the importance of tree mortality and canopy structure for regulating biomass stocks and balance.
To our knowledge, this is the first study combining remote gap detection with direct measures of biomass (i.e., branches) and estimates based on a locally adjusted allometry. Almost half of the aboveground biomass of tropical forests (42 %, range of 12 %–76 % across forests) is lost due to damage to live trees (Zuleta et al., 2023). If climate change results in a higher frequency of storms and extreme winds (Feng et al., 2023; Negrón-Juárez et al., 2023), branch-fall and tree-mortality rates can also be expected to increase. This may affect carbon stocks and balance, as well as the functional composition of these forests at the landscape level (Magnabosco Marra et al., 2018; Urquiza Muñoz et al., 2021).
4.4 Extreme wind and rainfall as a potential mechanism of gap formation
In our study site, the gap area and frequency rates varied over time. The gaps formed during a single period of less than a month (21 October to 1 November 2020) accounted for 20.4 % of the total disturbed area. Still, we did not find a correlation between gap area and frequency rates with the accumulated precipitation over time. Fontes et al. (2018) reported a strong positive correlation (r=0.85) of cumulative precipitation and tree mortality over a 1-year period on a forest contiguous to our study site, which may be related to interannual variability of the rainfall (Marengo et al., 2009). Nonetheless, we found a positive correlation between gap area rate and the frequency of extreme rainfall events. As in our study site, the frequency of rainfall events above the 98th percentile (24.3 mm h1) explained a large fraction of the variation in rates of gap area over measurement intervals (r=0.46) for a tropical forest in Panama (Araujo et al., 2021b). We also understand that a comprehensive assessment of the influence of precipitation on gap formation requires longer-term data addressing seasonal and interannual variability.
As recently reported for the Amazon, areas with stronger winds and more frequent lightning have larger gaps (Reis et al., 2021). Extreme winds and rain can cause extensive damage (single gaps > 10 ha) in the forest (Negrón-Juárez et al., 2018; Espírito-Santo et al., 2014; Magnabosco Marra et al., 2014a), but the size distribution and landscape effects of small-scale storm-related disturbances are more challenging to study. Convective rainfall and extreme wind gusts promote crown damage, snapping and uprooting from individual to large clusters of trees (Magnabosco Marra et al. 2014b; Negrón-Juárez et al. 2011; Chambers et al. 2013). As the vulnerability of forests to extreme wind and rainfall varies across Amazon regions (Negrón-Juárez et al., 2018; Urquiza Muñoz et al., 2021), projected shifts on the intensity and frequency of these events can also be expected to have particular effects on current patterns of tree mortality and biomass.
In addition to seasonal patterns of rainfall and wind, gap formation is also affected by local topography and soil (De Toledo et al., 2011). In central Amazon forests, despite little variation associated directly with soil and slope, tree mortality due to uprooting and snapping can increase with more frequent storms (De Toledo et al., 2012). If climate change alters the frequency and intensity of tropical storms, detailed information on soil attributes, topography and also mechanical properties of tree species (Ribeiro et al. 2016) may be fundamental to improve estimates of mortality and associated losses of biomass across Amazon regions.
Scaling down is the first step to scale up processes and mechanisms regulating forest dynamics and functioning. This requires robust and validated remote sensing tools and method integrating regional variability of forest and environmental attributes. However, optical sensors with wide spatial coverage, relatively short revisiting time and long data series are still limited in the Amazon. For example, in Landsat images, mortality events involving clusters with fewer than six to eight trees cannot be identified (Negrón-Juárez et al., 2011; Chambers et al., 2013). Furthermore, the smallest gap size found in our study was 10 m2 using a 1 m2 elevation model and 2 cm resolution orthomosaics. The spatial resolution of Sentinel-2 is 10 m, while that of Planet is 3 to 5 m. Therefore, the smallest gap size would correspond to just 1 pixel in Sentinel-2, potentially resulting in a possible underestimation of small gaps. Extensive field inventory provides even more valuable information for scaling down (Fontes et al., 2018). However, it is necessary to develop pre-established field protocols that are reproducible and functional. These limitations can be mitigated by expanding drone-imaging coverage areas and increasing spectral information on targets, which should be the focus of future work. In conjunction with the geometric patterns of gaps, as described in our study, higher spectral resolution can contribute not only to accurately distinguishing tree-mortality modes and branch fall but also to improving landscape estimates of biomass loss and recovery. Larger drones with the capacity to carry sensors designed to collect data across a broader spectrum range are fundamental for enhancing existing methods and establishing routines that enable detailed assessments of canopy dynamics and associated processes in dense and diverse tropical forests.
By combining high temporal and spatial resolution UAV imagery with detailed field data integrating landscape variations of topography and soil, our study provides novel and fundamental knowledge for understanding how tree-mortality processes affect the structure and dynamics of Amazon forests. Mechanisms of gap formation could only be distinguished in the field. Tree snapping was associated with higher losses of biomass. Although with relatively lower losses of biomass, branch fall was the most frequent mechanism of gap formation. Our findings highlight the importance of merging field and remote sensing data for assessing landscape processes regulating forest dynamics and carbon cycles. Future studies could advance current knowledge by generating proxies for distinguishing mechanisms of gap formation using remote sensing.
The R code needed to replicate the analyses presented in this paper is archived in the following Zenodo data repository: https://doi.org/10.5281/zenodo.8298693 (Simonetti, 2023).
The lidar data that support this study are openly available at https://doi.org/10.5281/zenodo.7636454 (Ometto et al., 2023). Other data are available upon request to and agreement with the co-authors.
The supplement related to this article is available online at: https://doi.org/10.5194/bg-20-3651-2023-supplement.
AS and DMM planned and designed the research; AS, RFA and CHSC collected the drone data; AS, RFA, CHSC and FRdSeS processed the drone imagery; AS and FRdSeS collected the field data; AS, DMM, RFA and CHSC analyzed the data; and AS and DMM wrote the paper with the support from all authors.
The contact author has declared that none of the authors has any competing interests.
Publisher’s note: Copernicus Publications remains neutral with regard to jurisdictional claims in published maps and institutional affiliations.
We thank the field-workers of the Forest Management Laboratory of the National Institute for Amazonian Research for their support during our surveys. We also thank the editor, Martin De Kauwe, as well as to the reviewers, Ricardo Dal Agnol da Silva and one anonymous referee, for their constructive suggestions.
This study is part of the Wind–Tree Interaction Project (INVENTA) and the Amazon Tall Tower Observatory (ATTO), funded by the Max Planck Institute for Biogeochemistry; the German Federal Ministry of Education and Research (BMBF, contracts 01LB1001A and 01LK1602A); the Brazilian Ministry of Science, Technology and Innovation (MCTI/FINEP, contract 01.11.01248.00); and the Max Planck Society (MPG). Our study site is also supported by the INCT Madeiras da Amazônia.
The article processing charges for this open-access publication were covered by the Max Planck Society.
This paper was edited by Martin De Kauwe and reviewed by Ricardo Dal Agnol da Silva and one anonymous referee.
Aleixo, I., Norris, D., Hemerik, L., Barbosa, A., Prata, E., Costa, F., and Poorter, L.: Amazonian rainforest tree mortality driven by climate and functional traits, Nat. Clim. Change, 9, 384–388, https://doi.org/10.1038/s41558-019-0458-0, 2019.
Allen, C. D., Breshears, D. D., and McDowell, N. G.: On underestimation of global vulnerability to tree mortality and forest die-off from hotter drought in the Anthropocene, Ecosphere, 6, 1–55, https://doi.org/10.1890/ES15-00203.1, 2015.
Amaral, M., Lima, A., Higuchi, F., dos Santos, J., and Higuchi, N.: Dynamics of Tropical Forest Twenty-Five Years after Experimental Logging in Central Amazon Mature Forest, Forests, 10, 89, https://doi.org/10.3390/f10020089, 2019.
Araujo, R. F., Nelson, B. W., Celes, C. H. S., and Chambers, J. Q.: Regional distribution of large blowdown patches across Amazonia in 2005 caused by a single convective squall line, Geophys. Res. Lett., 44, 7793–7798, https://doi.org/10.1002/2017GL073564, 2017.
Araujo, R. F., Chambers, J. Q., Celes, C. H. S., Muller-Landau, H. C., dos Santos, A. P. F., Emmert, F., Ribeiro, G. H. P. M., Gimenez, B. O., Lima, A. J. N., Campos, M. A. A., and Higuchi, N.: Integrating high resolution drone imagery and forest inventory to distinguish canopy and understory trees and quantify their contributions to forest structure and dynamics, PLoS One, 15, 1–16, https://doi.org/10.1371/journal.pone.0243079, 2020.
Araujo, R. F., Celes, C. H. S., Negrón-Juárez, R. I., and Muller-Landau, H. C.: Analysis codes and datasets: Strong temporal variation in treefall and branchfall rates in a tropical forest is related to extreme rainfall: results from five years of monthly drone data for a 50 ha plot, https://doi.org/10.5281/zenodo.5786740, last access: 16 December 2021a.
Araujo, R. F., Grubinger, S., Celes, C. H. S., Negrón-Juárez, R. I., Garcia, M., Dandois, J. P., and Muller-Landau, H. C.: Strong temporal variation in treefall and branchfall rates in a tropical forest is related to extreme rainfall: Results from 5 years of monthly drone data for a 50 ha plot, Biogeosciences, 18, 6517–6531, https://doi.org/10.5194/bg-18-6517-2021, 2021b.
Araujo, R. F. de: Estrutura do dossel, dinâmica florestal e fenologia foliar com uso de aeronave remotamente pilotada na Amazônia Central, PhD thesis, Instituto Nacional De Pesquisas Da Amazônia (INPA), Brazil, 84 pp., 2019.
Asner, G. P., Kellner, J. R., Kennedy-Bowdoin, T., Knapp, D. E., Anderson, C., and Martin, R. E.: Forest Canopy Gap Distributions in the Southern Peruvian Amazon, PLoS One, 8, e60875, https://doi.org/10.1371/journal.pone.0060875, 2013.
Baker, T. R., Phillips, O. L., Malhi, Y., Almeida, S., Arroyo, L., Di Fiore, A., Erwin, T., Higuchi, N., Killeen, T. J., Laurance, S. G., Laurance, W. F., Lewis, S. L., Monteagudo, A., Neill, D. A., Núñez Vargas, P., Pitman, N. C. A., Silva, J. N. M., and Vásquez Martínez, R.: Increasing biomass in Amazonian forest plots, Philos. T. R. Soc. B, 359, 353–365, https://doi.org/10.1098/rstb.2003.1422, 2004.
Brienen, R. J. W., Phillips, O. L., Feldpausch, T. R., Gloor, E., Baker, T. R., Lloyd, J., Lopez Gonzalez, G., Monteagudo Mendoza, A., Malhi, Y., Lewis, S. L., and Vásquez, R.: Long-term decline of the Amazon carbon sink, Nature, 519, 344–348, https://doi.org/10.1038/nature14283, 2015.
Brokaw, N. V. L.: The Definition of Treefall Gap and Its Effect on Measures of Forest Dynamics, Biotropica, 14, 158–160, https://doi.org/10.2307/2387750, 1982.
Burnham, K. P. and Anderson, D. R.: Multimodel inference: A Practical Information-Theoretic Approach, 488 pp., ISBN: 13 978-0387953649, 2002.
Canham, C. D., Finzi, A. C., Pacala, S. W., and Burbank, D. H.: Causes and consequences of resource heterogeneity in forests: interspecific variation in light transmission by canopy trees, Can. J. Forest Res., 24, 337–349, https://doi.org/10.1139/x94-046, 1994.
Carvalho, L.: An Improved Evaluation of Kolmogorov's Distribution, J. Stat. Softw., 65, 1–3, https://doi.org/10.18637/jss.v065.c03, 2015.
Chambers, J. Q., Negron-Juarez, R. I., Marra, D. M., Di Vittorio, A., Tews, J., Roberts, D., Ribeiro, G. H. P. M., Trumbore, S. E., and Higuchi, N.: The steady-state mosaic of disturbance and succession across an old-growth central Amazon forest landscape, P. Natl. Acad. Sci. USA, 110, 3949–3954, https://doi.org/10.1073/pnas.1202894110, 2013.
Chao, K. J., Phillips, O. L., Monteagudo, A., Torres-Lezama, A., and Vásquez Martínez, R.: How do trees die? Mode of death in northern Amazonia, J. Veg. Sci., 20, 260–268, https://doi.org/10.1111/j.1654-1103.2009.05755.x, 2009.
Clark, D. A., Asao, S., Fisher, R., Reed, S., Reich, P. B., Ryan, M. G., Wood, T. E., and Yang, X.: Reviews and syntheses: Field data to benchmark the carbon cycle models for tropical forests, Biogeosciences, 14, 4663–4690, https://doi.org/10.5194/bg-14-4663-2017, 2017.
Cushman, K. C., Detto, M., García, M., and Muller-Landau, H. C.: Soils and topography control natural disturbance rates and thereby forest structure in a lowland tropical landscape, Ecol. Lett., 25, 1126–1138, https://doi.org/10.1111/ele.13978, 2022.
Dalagnol, R., Wagner, F. H., Galvão, L. S., Streher, A. S., Phillips, O. L., Gloor, E., Pugh, T. A. M., Ometto, J. P. H. B., and Aragão, L. E. O. C.: Large-scale variations in the dynamics of Amazon forest canopy gaps from airborne lidar data and opportunities for tree mortality estimates, Sci. Rep., 11, 1388, https://doi.org/10.1038/s41598-020-80809-w, 2021.
Denslow, J. S.: Gap Partitioning among Tropical Rainforest Trees, Biotropica, 12, 47–55, https://doi.org/10.2307/2388156, 1980.
Denslow, J. S.: Tropical Rainforest gaps and tree species diversity, Annu. Rev. Ecol. Evol. Syst., 18, 431–51, 1987.
De Toledo, J. J., Magnusson, W. E., Castilho, C. V., and Nascimento, H. E. M.: How much variation in tree mortality is predicted by soil and topography in Central Amazonia?, Forest Ecol. Manag., 262, 331–338, https://doi.org/10.1016/j.foreco.2011.03.039, 2011.
De Toledo, J. J., Magnusson, W. E., Castilho, C. V., and Nascimento, H. E. M.: Tree mode of death in Central Amazonia: Effects of soil and topography on tree mortality associated with storm disturbances, Forest Ecol. Manag., 263, 253–261, https://doi.org/10.1016/j.foreco.2011.09.017, 2012.
Espírito-Santo, F. D. B., Gloor, M., Keller, M., Malhi, Y., Saatchi, S., Nelson, B., Junior, R. C. O., Pereira, C., Lloyd, J., Frolking, S., Palace, M., Shimabukuro, Y. E., Duarte, V., Mendoza, A. M., López-González, G., Baker, T. R., Feldpausch, T. R., Brienen, R. J. W., Asner, G. P., Boyd, D. S., and Phillips, O. L.: Size and frequency of natural forest disturbances and the Amazon forest carbon balance, Nat. Commun., 5, 1–6, https://doi.org/10.1038/ncomms4434, 2014.
Esquivel-Muelbert, A., Phillips, O. L., Brienen, R. J. W., Fauset, S., Sullivan, M. J. P., Baker, T. R., Chao, K. J., Feldpausch, T. R., Gloor, E., Higuchi, N., Houwing-Duistermaat, J., Lloyd, J., Liu, H., Malhi, Y., Marimon, B., Marimon Junior, B. H., Monteagudo-Mendoza, A., Poorter, L., Silveira, M., Torre, E. V., Dávila, E. A., del Aguila Pasquel, J., Almeida, E., Loayza, P. A., Andrade, A., Aragão, L. E. O. C., Araujo-Murakami, A., Arets, E., Arroyo, L., Aymard C, G. A., Baisie, M., Baraloto, C., Camargo, P. B., Barroso, J., Blanc, L., Bonal, D., Bongers, F., Boot, R., Brown, F., Burban, B., Camargo, J. L., Castro, W., Moscoso, V. C., Chave, J., Comiskey, J., Valverde, F. C., da Costa, A. L., Cardozo, N. D., Di Fiore, A., Dourdain, A., Erwin, T., Llampazo, G. F., Vieira, I. C. G., Herrera, R., Honorio Coronado, E., Huamantupa-Chuquimaco, I., Jimenez-Rojas, E., Killeen, T., Laurance, S., Laurance, W., Levesley, A., Lewis, S. L., Ladvocat, K. L. L. M., Lopez-Gonzalez, G., Lovejoy, T., Meir, P., Mendoza, C., Morandi, P., Neill, D., Nogueira Lima, A. J., Vargas, P. N., de Oliveira, E. A., Camacho, N. P., Pardo, G., Peacock, J., Peña-Claros, M., Peñuela-Mora, M. C., Pickavance, G., Pipoly, J., Pitman, N., Prieto, A., Pugh, T. A. M., Quesada, C., Ramirez-Angulo, H., de Almeida Reis, S. M., Rejou-Machain, M., Correa, Z. R., Bayona, L. R., Rudas, A., Salomão, R., Serrano, J., Espejo, J. S., Silva, N., Singh, J., Stahl, C., Stropp, J., Swamy, V., Talbot, J., ter Steege, H., et al.: Tree mode of death and mortality risk factors across Amazon forests, Nat. Commun., 11, 5515, https://doi.org/10.1038/s41467-020-18996-3, 2020.
Eysenrode, D. S., Bogaert, J., Hecke, P. Van, and Impens, I.: Influence of tree-fall orientation on canopy gap shape in an Ecuadorian rain forest, J. Trop. Ecol., 14, 865–869, https://doi.org/10.1017/S0266467498000625, 1998.
Feng, Y., Negrón-Juárez, R. I., Romps, D. M., and Chambers, J. Q.: Amazon windthrow disturbances are likely to increase with storm frequency under global warming, Nat. Commun., 14, 101, https://doi.org/10.1038/s41467-022-35570-1, 2023.
Fontes, C. G., Chambers, J. Q., and Higuchi, N.: Revealing the causes and temporal distribution of tree mortality in Central Amazonia, Foreset Ecol. Manag., 424, 177–183, https://doi.org/10.1016/j.foreco.2018.05.002, 2018.
Gagnon, J. L., Jokela, E. J., Moser, W., and Huber, D. A.: Characteristics of gaps and natural regeneration in mature longleaf pine flatwoods ecosystems, Forest Ecol. Manag., 187, 373–380, https://doi.org/10.1016/j.foreco.2003.07.002, 2004.
Getzin, S., Wiegand, K., and Schöning, I.: Assessing biodiversity in forests using very high-resolution images and unmanned aerial vehicles, Method. Ecol. Evol., 3, 397–404, https://doi.org/10.1111/j.2041-210X.2011.00158.x, 2012.
Getzin, S., Nuske, R. S., and Wiegand, K.: Using Unmanned Aerial Vehicles (UAV) to Quantify Spatial Gap Patterns in Forests, 6, 6988–7004, https://doi.org/10.3390/rs6086988, 2014.
Gimenez, B. O., dos Santos, L. T., Gebara, J., Celes, C. H. S., Durgante, F. M., Lima, A. J. N., Santos, J. dos, and Higuchi, N.: Tree climbing techniques and volume equations for Eschweilera (Matá-Matá), a hyperdominant genus in the Amazon Forest, Forests, 8, 154, https://doi.org/10.3390/f8050154, 2017.
Gorgens, E. B., Keller, M., Jackson, T., Marra, D. M., Reis, C. R., de Almeida, D. R. A., Coomes, D., and Ometto, J. P.: Out of steady state: Tracking canopy gap dynamics across Brazilian Amazon, Biotropica, 55, 755–766, https://doi.org/10.1111/btp.13226, 2023.
Grubb, P. J.: the Maintenance of Species-Richness in Plant Communities: the Importance of the Regeneration Niche, Biol. Rev., 52, 107–145, https://doi.org/10.1111/j.1469-185x.1977.tb01347.x, 1977.
Hubbell, S. P., Foster, R. B., O'Brien, S. T., Harms, K. E., Condit, R., Wechsler, B., Wright, S. J., and de Lao, S. L.: Light-Gap Disturbances, Recruitment Limitation, and Tree Diversity in a Neotropical Forest, Science, 283, 554–557, https://doi.org/10.1126/science.283.5401.554, 1999.
Iglhaut, J., Cabo, C., Puliti, S., Piermattei, L., O'Connor, J., and Rosette, J.: Structure from Motion Photogrammetry in Forestry: a Review, Curr. For. Report., 5, 155–168, https://doi.org/10.1007/s40725-019-00094-3, 2019.
IPCC: Summary for Policymakers, in: Climate Change 2021: The Physical Science Basis. Contribution of Working Group I to the Sixth Assessment Report of the Intergovernmental Panel on Climate Change, edited by: Masson-Delmotte, V., Zhai, P., Pirani, A., Connors, S. L., Péan, C., Berger, S., Caud, N., Chen, Y., Goldfarb, L., Gomis, M. I., Huang, M., Leitzell, K., Lonnoy, E., Matthews, J. B. R., Maycock, T. K., Waterfield, T., Yelekçi, O., Yu, R., and Zhou, B., Cambridge University Press, https://doi.org/10.1017/9781009157896.001, 2021.
Jucker, T.: Deciphering the fingerprint of disturbance on the three-dimensional structure of the world's forests, New Phytol., 233, 612–617, https://doi.org/10.1111/nph.17729, 2022.
Kellner, J. R. and Asner, G. P.: Winners and losers in the competition for space in tropical forest canopies, Ecol. Lett., 17, 556–562, https://doi.org/10.1111/ele.12256, 2014.
Kellner, J. R., Clark, D. B., and Hubbell, S. P.: Pervasive canopy dynamics produce short-term stability in a tropical rain forest landscape, Ecol. Lett., 12, 155–164, https://doi.org/10.1111/j.1461-0248.2008.01274.x, 2009.
Laurance, W. F., Oliveira, A. A., Laurance, S. G., Condit, R., Nascimento, H. E. M., Sanchez-Thorin, A. C., Lovejoy, T. E., Andrade, A., D'Angelo, S., Ribeiro, J. E., and Dick, C. W.: Pervasive alteration of tree communities in undisturbed Amazonian forests, Nature, 428, 171–175, https://doi.org/10.1038/nature02383, 2004.
Lawton, R. O. and Putz, F. E.: Natural Disturbance and Gap-Phase Regeneration in a Wind-Exposed Tropical Cloud Forest, Ecology, 69, 764–777, https://doi.org/10.2307/1941025, 1988.
Leitold, V., Morton, D. C., Longo, M., Dos-Santos, M. N., Keller, M., and Scaranello, M.: El Niño drought increased canopy turnover in Amazon forests, New Phytol., 219, 959–971, https://doi.org/10.1111/nph.15110, 2018.
Lertzman, K. P. and Krebs, C. J.: Gap-phase structure of a subalpine old-growth forest, Can. J. Forest Res., 21, 1730–1741, https://doi.org/10.1139/x91-239, 1991.
Lima, A. J. N., Suwa, R., De Mello Ribeiro, G. H. P., Kajimoto, T., Dos Santos, J., Da Silva, R. P., De Souza, C. A. S., De Barros, P. C., Noguchi, H., Ishizuka, M., and Higuchi, N.: Allometric models for estimating above- and below-ground biomass in Amazonian forests at São Gabriel da Cachoeira in the upper Rio Negro, Brazil, Forest Ecol. Manag., 277, 163–172, https://doi.org/10.1016/j.foreco.2012.04.028, 2012.
Lowe, D. G.: Distinctive Image Features from Scale-Invariant Keypoints, Int. J. Comput. Vis., 60, 91–110, https://doi.org/10.1023/B:VISI.0000029664.99615.94, 2004.
Magnabosco Marra, D., Chambers, J. Q., Higuchi, N., Trumbore, S. E., Ribeiro, G. H. P. M., Dos Santos, J., Negrón-Juárez, R. I., Reu, B., and Wirth, C.: Large-scale wind disturbances promote tree diversity in a Central Amazon forest, PLoS One, 9, e103711, https://doi.org/10.1371/journal.pone.0103711, 2014a.
Magnabosco Marra, D., Fagg, C. W., Pereira, B. A. da S., and Felfili, J. M.: Trees and environmental variables influence the natural regeneration of sesonally dry tropical forest in Central Brazil, Neotrop. Biol. Conserv., 9, 62–77, https://doi.org/10.4013/nbc.2014.92.01, 2014b.
Magnabosco Marra, D., Higuchi, N., Trumbore, S. E., Ribeiro, G. H. P. M., Dos Santos, J., Carneiro, V. M. C., Lima, A. J. N., Chambers, J. Q., Negrón-Juárez, R. I., Holzwarth, F., Reu, B., and Wirth, C.: Predicting biomass of hyperdiverse and structurally complex central Amazonian forests – A virtual approach using extensive field data, Biogeosciences, 13, 1553–1570, https://doi.org/10.5194/bg-13-1553-2016, 2016.
Magnabosco Marra, D., Trumbore, S. E., Higuchi, N., Ribeiro, G. H. P. M., Negrón-Juárez, R. I., Holzwarth, F., Rifai, S. W., dos Santos, J., Lima, A. J. N., Kinupp, V. F., Chambers, J. Q., and Wirth, C.: Windthrows control biomass patterns and functional composition of Amazon forests, Glob. Change Biol., 24, 5867–5881, https://doi.org/10.1111/gcb.14457, 2018.
Malhi, Y. and Román-Cuesta, R. M.: Analysis of lacunarity and scales of spatial homogeneity in IKONOS images of Amazonian tropical forest canopies, Remote Sens. Environ., 112, 2074–2087, https://doi.org/10.1016/j.rse.2008.01.009, 2008.
Marengo, J. A., Jones, R., Alves, L. M., and Valverde, M. C.: Future change of temperature and precipitation extremes in South America as derived from the PRECIS regional climate modeling system, Int. J. Climatol., 29, 2241–2255, https://doi.org/10.1002/joc.1863, 2009.
McDowell, N., Allen, C. D., Anderson-Teixeira, K., Brando, P., Brienen, R., Chambers, J., Christoffersen, B., Davies, S., Doughty, C., Duque, A., Espirito-Santo, F., Fisher, R., Fontes, C. G., Galbraith, D., Goodsman, D., Grossiord, C., Hartmann, H., Holm, J., Johnson, D. J., Kassim, A. R., Keller, M., Koven, C., Kueppers, L., Kumagai, T., Malhi, Y., McMahon, S. M., Mencuccini, M., Meir, P., Moorcroft, P., Muller-Landau, H. C., Phillips, O. L., Powell, T., Sierra, C. A., Sperry, J., Warren, J., Xu, C., and Xu, X.: Drivers and mechanisms of tree mortality in moist tropical forests, New Phytol., 219, 851–869, https://doi.org/10.1111/nph.15027, 2018.
Naka, K.: Community dynamics of evergreen broadleaf forests in southwestern Japan. I. Wind damaged trees and canopy gaps in an evergreen oak forest, Bot. Mag. Tokyo, 95, 385–399, https://doi.org/10.1007/BF02489476, 1982.
Negrón-Juárez, R. I., Chambers, J. Q., Guimaraes, G., Zeng, H., Raupp, C. F. M., Marra, D. M., Ribeiro, G. H. P. M., Saatchi, S. S., Nelson, B. W., and Higuchi, N.: Widespread Amazon forest tree mortality from a single cross-basin squall line event, Geophys. Res. Lett., 37, 1–5, https://doi.org/10.1029/2010GL043733, 2010.
Negrón-Juárez, R. I., Chambers, J. Q., Marra, D. M., Ribeiro, G. H. P. M., Rifai, S. W., Higuchi, N., and Roberts, D.: Detection of subpixel treefall gaps with Landsat imagery in Central Amazon forests, Remote Sens. Environ., 115, 3322–3328, https://doi.org/10.1016/j.rse.2011.07.015, 2011.
Negrón-Juárez, R. I., Jenkins, H. S., Raupp, C. F. M., Riley, W. J., Kueppers, L. M., Marra, D. M., Ribeiro, G. H. P. M., Monteiro, M. T. F., Candido, L. A., Chambers, J. Q., and Higuchi, N.: Windthrow variability in central Amazonia, Atmosphere, 8, 1–17, https://doi.org/10.3390/atmos8020028, 2017.
Negrón-Juárez, R. I., Holm, J. A., Marra, D. M., Rifai, S. W., Riley, W. J., Chambers, J. Q., Koven, C. D., Knox, R. G., McGroddy, M. E., Di Vittorio, A. V., Urquiza-Muñoz, J., Tello-Espinoza, R., Muñoz, W. A., Ribeiro, G. H. P. M., and Higuchi, N.: Vulnerability of Amazon forests to storm-driven tree mortality, Environ. Res. Lett., 13, 054021, https://doi.org/10.1088/1748-9326/aabe9f, 2018.
Negrón-Juárez, R. I, Magnabosco-Marra, D., Feng, Y., Urquiza-Muñoz, J. D., Riley, W. J., and Chambers, J. Q.: Windthrow characteristics and their regional association with rainfall, soil, and surface elevation in the Amazon, Environ. Res. Lett., 18, 014030, https://doi.org/10.1088/1748-9326/acaf10, 2023.
Nelson, B. W., Kapos, V., Adams, J. B., Oliveira, W. J., and Braun, O. P. G.: Forest Disturbance by Large Blowdowns in the Brazilian Amazon, Ecology, 75, 853–858, https://doi.org/10.2307/1941742, 1994.
Oliveira, A. A. D. E. and Mori, S. A.: A central Amazonian terra firme forest, I. High tree species richness on poor soils, Biodivers. Conserv., 8, 1219–1244, https://doi.org/10.1023/A:1008908615271, 1999.
Ometto, J., Gorgens, E. B., Pereira, F. R. d. S., Sato, L., Assis, M. L. R., Cantinho, R., Longo, M., Jacon, A. D., and Keller, M.: L1A – Discrete airborne LiDAR transects collected by EBA in the Brazilian Amazon (Mato Grosso, Amazonas e Pará), Version v20230303, Zenodo [data set], https://doi.org/10.5281/zenodo.7636454, 2023.
Pan, Y., Birdsey, R. A., Phillips, O. L., and Jackson, R. B.: The structure, distribution, and biomass of the world's forests, Annu. Rev. Ecol. Evol. Syst., 44, 593–622, https://doi.org/10.1146/annurev-ecolsys-110512-135914, 2013.
Phillips, O. L. and Gentry, A. H.: Increasing Turnover Through Time in Tropical Forests, Science, 263, 954–958, https://doi.org/10.1126/science.263.5149.954, 1994.
Pinto, A. C. M., Higuchi, N., Iida, S., Santos, J., Ribeiro, R. J., Rocha, R. M., and Silva, R. P. P.: Padrão de distribuição espacial de espécies florestais que ocorrem na região de Manaus – AM, in: Projeto Jacaranda Fase II – Pesquisas Florestais na Amazônia Central, edited by: INPA, Manaus, 1–20, 2003.
Putz, F. E., Coley, P. D., Lu, K., Montalvo, A., and Aiello, A.: Uprooting and snapping of trees: structural determinants and ecological consequences, Can. J. Forest Res., 13, 1011–1020, https://doi.org/10.1139/x83-133, 1983.
Reis, C. R., Jackson, T. D., Bastos Gorgens, E., Dalagnol, R., Jucker, T., Henrique Nunes, M., and Pierre Ometto, J.: Forest structure and degradation drive canopy gap sizes across the Brazilian Amazon, bioRxiv, 2021.05.03.442416, https://doi.org/10.1101/2021.05.03.442416, 2021.
Ribeiro, G. H. P. de M., Suwa, R., Magnabosco Marra, D., Lima, A. J. N., Kajimoto, T., Ishizuka, M., and Higuchi, N.: Allometry for Juvenile Trees in an Amazonian Forest after Wind Disturbance, Japan Agric. Res. Q. JARQ, 48, 213–219, https://doi.org/10.6090/jarq.48.213, 2014.
Ribeiro, G. H. P. M., Chambers, J. Q., Peterson, C. J., Trumbore, S. E., Marra, D. M., Wirth, C., Cannon, J. B., Négron-juárez, R. I., Lima, A. J. N., Paula, E. V. C. M. De, Santos, J., and Higuchi, N.: Forest Ecology and Management Mechanical vulnerability and resistance to snapping and uprooting for Central Amazon tree species, Forest Ecol. Manag., 380, 1–10, https://doi.org/10.1016/j.foreco.2016.08.039, 2016.
Runkle, J. R.: Gap Regeneration in Some Old-growth Forests of the Eastern United States, Ecology, 62, 1041–1051, https://doi.org/10.2307/1937003, 1982.
Runkle, J. R. and Yetter, T. C.: Treefalls Revisited: Gap Dynamics in the Southern Appalachians, Ecology, 68, 417–424, https://doi.org/10.2307/1939273, 1987.
Santos, L. T., Marra, D. M., Trumbore, S., Camargo, P. B. De, Lima, A. J. N. N., Ribeiro, G. H. P. M. P. M., Santos, J., Higuchi, N., Dos Santos, L. T., Marra, D. M., Trumbore, S., De Camargo, P. B., Negrón-Juárez, R. I., Lima, A. J. N. N., Ribeiro, G. H. P. M. P. M., Dos Santos, J., and Higuchi, N.: Windthrows increase soil carbon stocks in a central Amazon forest, Biogeosciences, 13, 1299–1308, https://doi.org/10.5194/bg-13-1299-2016, 2016.
Schliemann, S. A. and Bockheim, J. G.: Methods for studying treefall gaps: A review, Forest Ecol. Manag., 261, 1143–1151, https://doi.org/10.1016/j.foreco.2011.01.011, 2011.
Senf, C.: Seeing the System from Above: The Use and Potential of Remote Sensing for Studying Ecosystem Dynamics, Ecosystems, 25, 1719–1737, https://doi.org/10.1007/s10021-022-00777-2, 2022.
Simonetti, A.: Canopy gaps and associated losses of biomass – combining UAV imagery and field data in a Central Amazon forest, Zenodo [code], https://doi.org/10.5281/zenodo.8298693, 2023.
Sombroek, W.: Spatial and Temporal Patterns of Amazon Rainfall, AMBIO A J. Hum. Environ., 30, 388–396, https://doi.org/10.1579/0044-7447-30.7.388, 2001.
Tan, J., Jakob, C., Rossow, W. B., and Tselioudis, G.: Increases in tropical rainfall driven by changes in frequency of organized deep convection, Nature, 519, 451–454, https://doi.org/10.1038/nature14339, 2015.
Urquiza Muñoz, J. D., Magnabosco Marra, D., Negrón-Juarez, R. I., Tello-Espinoza, R., Alegría-Muñoz, W., Pacheco-Gómez, T., Rifai, S. W., Chambers, J. Q., Jenkins, H. S., Brenning, A., and Trumbore, S. E.: Recovery of Forest Structure Following Large-Scale Windthrows in the Northwestern Amazon, Forests, 12, 667, https://doi.org/10.3390/f12060667, 2021.
Vepakomma, U., St-Onge, B., and Kneeshaw, D.: Spatially explicit characterization of boreal forest gap dynamics using multi-temporal lidar data, Remote Sens. Environ., 112, 2326–2340, https://doi.org/10.1016/j.rse.2007.10.001, 2008.
Vitousek, P. M. and Denslow, J. S.: Nitrogen and Phosphorus Availability in Treefall Gaps of a Lowland Tropical Rainforest, J. Ecol., 74, 1167, https://doi.org/10.2307/2260241, 1986.
Whitmore, T. C.: Canopy Gaps and the Two Major Groups of Forest Trees, Ecology, 70, 536–538, https://doi.org/10.2307/1940195, 1989.
Wu, J., Albert, L. P., Lopes, A. P., Restrepo-Coupe, N., Hayek, M., Wiedemann, K. T., Guan, K., Stark, S. C., Christoffersen, B., Prohaska, N., Tavares, J. V., Marostica, S., Kobayashi, H., Ferreira, M. L., Campos, K. S., Dda Silva, R., Brando, P. M., Dye, D. G., Huxman, T. E., Huete, A. R., Nelson, B. W., and Saleska, S. R.: Leaf development and demography explain photosynthetic seasonality in Amazon evergreen forests, Science, 351, 972–976, https://doi.org/10.1126/science.aad5068, 2016.
Yamamoto, S.-I.: Invited Review Forest Gap Dynamics and Tree Regeneration, J. Forest Res, 5, 223–229, 2000.
Yavitt, J. B., Battles, J. J., Lang, G. E., and Knight, D. H.: The canopy gap regime in a secondary Neotropical forest in Panama, J. Trop. Ecol., 11, 391–402, https://doi.org/10.1017/S0266467400008853, 1995.
Yue, W., Juyu, L., Zhaochen, Z., Jianbo, H., Ji, Y., Yong, L., and Wanhui,
Y.: Forest Plots Gap and Canopy Structure Analysis Based on Two UAV Images
![]() , Trop. Geogr., 39, 553–561,
https://doi.org/10.13284/j.cnki.rddl.003148, 2019.
, Trop. Geogr., 39, 553–561,
https://doi.org/10.13284/j.cnki.rddl.003148, 2019.
Zuleta, D., Arellano, G., McMahon, S. M., Aguilar, S., Bunyavejchewin, S., Castaño, N., Chang-Yang, C., Duque, A., Mitre, D., Nasardin, M., Pérez, R., Sun, I., Yao, T. L., Valencia, R., Krishna Moorthy, S. M., Verbeeck, H., and Davies, S. J.: Damage to living trees contributes to almost half of the biomass losses in tropical forests, Glob. Change Biol., 1–12, https://doi.org/10.1111/gcb.16687, 2023.
The requested paper has a corresponding corrigendum published. Please read the corrigendum first before downloading the article.
- Article
(2463 KB) - Full-text XML
- Corrigendum
-
Supplement
(542 KB) - BibTeX
- EndNote