the Creative Commons Attribution 4.0 License.
the Creative Commons Attribution 4.0 License.
 | 13 Sep 2023
Spawner weight and ocean temperature drive Allee effect dynamics in Atlantic cod, Gadus morhua: inherent and emergent density regulation
Anna-Marie Winter
Nadezda Vasilyeva
Artem Vladimirov
Stocks of Atlantic cod, Gadus morhua, show diverse recovery responses when fishing pressure is relieved. The expected outcome of reduced fishing pressure is that the population regains its size. However, there are also cod stocks that seem to be locked in a state of low abundance from which population growth does not occur (or only slowly occurs). A plausible explanation for this phenomenon can be provided by the Allee effect, which takes place when recruitment per capita is positively related to population density or abundance. However, because of methodological limitations and data constraints, such a phenomenon is often perceived as being rare or non-existent in marine fish.
In this study, we used time series of 17 Atlantic cod stocks to fit a family of population equations that consider the abundance of spawners, their body weight and sea water temperature as independent components of recruitment. The developed stock-recruitment function disentangles the effects of spawner abundance, spawner weight and temperature on recruitment dynamics and captures the diversity of density dependencies (compensation, Allee effect) of the recruitment production in Atlantic cod.
The results show for 13 cod stocks an inherent spawner-abundance-related Allee effect. Allee effect strength, i.e., the relative change between maximum and minimum recruitment per capita at low abundance, was increased when recruitment production was suppressed by unfavorable changes in water temperature and/or in spawner weight. The latter can be a concomitant of heavy fishing or a result of temperature-related altered body growth. Allee effect strength was decreased when spawner weight and/or temperature elevated recruitment production. We show how anthropogenic stress can increase the risk of Allee effects in stocks where ocean temperature and/or spawner weight had been beneficial in the past but are likely to unmask and strengthen an inherent Allee effect under future conditions.
- Article
(13834 KB) - Full-text XML
- BibTeX
- EndNote


Almost every ecosystem is affected by rising anthropogenic pressure (Jones et al., 2018). Climate change, fishing and pollution put the ocean under an increasing level of stress. In order to secure global food production from wild fisheries, scientists and policy makers are therefore shifting their focus to the rebuilding of depleted fish stocks (Costello et al., 2020). Fast growth at low abundance gives a population the ability to recover from disturbances and make it resilient to environmental and anthropogenic alterations (Dulvy et al., 2004; Mace et al., 2008; Lande, 1994). Thus, the premise behind most fisheries management strategies and recovery plans is that the primary factor inhibiting recovery is fishing. However, several marine fish stocks show surprisingly little response to restrictions of fishing pressure (Hutchings, 2015; Hutchings and Reynolds, 2004), and some stocks, such as the northern cod, have remained depleted for decades despite a commercial fishing moratorium (Department Fisheries and Oceans, 2019). Further, traditional assumptions about stationarity and stability of fisheries production from the oceans is challenged by changes in productivity regimes in the majority of fish stocks (Britten et al., 2017; Hilborn et al., 2014; Vert-Pre et al., 2013), which makes predictions about fisheries recovery difficult.
Capturing and understanding the abundance and dynamics of marine fish at low abundance is challenged by a scarce data availability (Pepin, 2016), and most global biomass data sets are based on stock-assessment models (Ricard et al., 2012). Some stock-assessment models consider recruitment – juveniles old enough to be caught in a fishery – as a stochastic process (Nielsen and Berg, 2014). In other assessment models, the production of juveniles is simulated with a stock-recruitment model which relates recruitment to spawning stock biomass (SSB) – the biomass of adult and mature females – in a function (Ricker, 1954; Beverton and Holt, 1957). The functional form for per capita production is then considered linear, because log-transformed the relationship can be linearized. SSB is the product of spawner abundance and spawner weight and is taken as a proxy for the stock's reproductive potential in general. It generally does not consider any mechanisms of non-linearity or shifts in the linkage between reproductive potential and SSB and its components (i.e., weight, probability of maturation). In addition, environmental variables, if included in stock-recruitment models, are usually considered linear, density-independent terms (Stiasny et al., 2016; Gröger et al., 2009; Stige et al., 2013; Ottersen et al., 2013). Non-linear interactions between the different factors of the stock-recruitment model can mask or mitigate the recruitment prediction, which can affect and limit the perceived prediction of the stock's trajectory (Devine et al., 2014; Glaser et al., 2014). Thus, the urgent question remains of how the different components of the stock-recruitment model, individually and together, affect recruitment production, particularly at low abundance.
A potential mechanism that can lead to a productivity shift is the Allee effect (Jiang and Shi, 2010; Dai et al., 2012; Dakos et al., 2012). In depleted fish populations, the Allee effect has been suggested as an explanation for the observed lack of recovery when fishing was substantially reduced (Hutchings, 2001, 2015). The Allee effect is an inverse density dependence between the per capita growth rate and population abundance or density when the population is small (Courchamp et al., 1999; Hutchings, 2015). In contrast to the compensatory per capita growth rate caused by the release from density-dependent control, the per capita growth rate drops below the Allee effect threshold, leading to a decline in population productivity. For terrestrial populations, Allee effects have been intensively studied (Armstrong and Wittmer, 2011; Vortkamp et al., 2020; Courchamp et al., 2008), but in marine fish many (meta-)studies have failed to find a statistically significant Allee effect, because of scarce data at low abundance or poor statistical methodology (Perälä and Kuparinen, 2017; Liermann and Hilborn, 1997; Myers et al., 1995; Hilborn et al., 2014; Sibly et al., 2005; Gregory et al., 2010). As a result, there remains a great deal of uncertainty surrounding the prevalence of Allee effects in fishes.
Alterations in population productivity can also be caused when fishing changes the population's demography and targets specific phenotypic and productivity-related traits (Enberg et al., 2009; Trippel, 1995; Beamish et al., 2006). Fishing often targets the largest, oldest individuals, and when the remaining younger fish do not have the same productivity per unit biomass as older fish, for example, because smaller and younger fish are less fertile and less experienced spawners, the population shifts to a lower-productivity regime (Hutchings, 2005; Murawski et al., 2001; Marteinsdottir and Thorarinsson, 1998; Beamish et al., 2006). Under a left-tailed age–size structure, the population can rely less on the increased quantity and quality of reproductive output by older, experienced and large fish (Marteinsdottir and Steinarsson, 1998; Hixon et al., 2013; Birkeland and Dayton, 2005; Murawski et al., 2001). In contrast, population productivity can be increased when strong and persisting selective fishing results in an evolutionary adaptation to high mortality, leading to an evolutionary pressure towards faster life histories, such as earlier maturation, reduced post-maturation growth and increased reproductive investment (Nussle et al., 2016; Dunlop et al., 2015). Stronger devotion to reproductive output can, however, also increase the survival cost of reproduction, resulting in higher natural mortality, a shorter life span and reduced production of recruitment per spawner life (Kuparinen et al., 2012). For Atlantic cod, Gadus morhua, there is strong evidence that targeting the largest and oldest individuals leads to an age–size truncation (Svedäng and Hornborg, 2017; Law, 2000; Ottersen, 2008; Shelton et al., 2015), juvenation and a productivity change (Dunlop et al., 2015; Heino et al., 2015; Sharpe and Hendry, 2009; Ottersen et al., 2014; Svedäng and Hornborg, 2017).
Temperature can also influence recruitment production, indirectly by changing body growth and food availability and directly by affecting egg and juvenile survival, which has led to a skewed population demography of smaller-sized individuals (Cheung et al., 2013; Daufresne et al., 2009; Tu et al., 2018) with repercussions for population productivity and resilience. Temperature change has the potential of altering Allee effect dynamics, for example, by suppressing recruitment production (Winter et al., 2020) or increasing adult mortality (Berec, 2019). Therefore, if strong stock depletion is accompanied by changes in spawner weight and sea temperature, recruitment dynamics are likely to change, and patterns of an Allee effect could emerge, be strengthened or masked. This questions the common assumption that Allee effects are time invariant but requires a model that can adjust to such temporal changes in productivity (Perälä and Kuparinen, 2017; Tirronen et al., 2022).
In order to better predict future resource availability and adapt management accordingly, it is important to understand how anthropogenic stressors, such as fishing and climate change, affect recruitment dynamics. In this study, we therefore focused on the stock-recruitment relation, where we considered changes in spawner weight and sea temperature in addition to spawner abundance for modeling the recruitment production in 17 Atlantic cod stocks. Atlantic cod is a commercially highly valuable species, supporting a long-standing fishery. While the different cod stocks display an extraordinary high diversity in life-history traits, geographical range and socio-economic context, each stock has experienced high rates of exploitation followed by strong biomass declines (Frank et al., 2016; Lilly et al., 2008). Between the early 1960s and the early 1990s, the combined spawning stock biomass of northwest Atlantic cod stocks is estimated to have declined by more than 90 % (Hutchings and Rangeley, 2011), and many stocks have remained at unsustainable levels since then, despite reductions in directed fishing pressure (Hutchings, 2015). In the North Atlantic Ocean, direction and intensity of the recruitment response to ocean warming depends on the stock's geographical position (Mantzouni and Mackenzie, 2010; Planque and Fredou, 1999; Drinkwater, 2005; Brander, 2010). Changes in recruitment production have been attributed to age–size truncation but also Allee effects (Marshall et al., 2006; Neuenhoff et al., 2018; Van Leeuwen et al., 2008; Dean et al., 2019; Buren et al., 2014; Rose, 2004), though the little empirical evidence has led to a general low acceptance of Allee effects in Atlantic cod.
Based on the literature and preliminary stock data analysis, we hypothesize that consideration of spawner abundance, spawner weight and sea surface temperature (SST) as components of the stock-recruitment function should give insight about the Allee effect dynamics in Atlantic cod. Our objective is to describe the data with an alternative stock-recruitment approach that can disentangle and quantify the impact of spawner abundance, weight and SST on recruitment in order to reveal potential drivers of Allee effects. In contrast to many conventional stock-recruitment models, we do not use SSB as an aggregate but consider heterogeneity in recruitment production among spawners of different weight. Though maternal effects have been included in models before, we here allow for stock-specific, non-linear spawner weight abundance as well as SST effects on recruitment. We link the stock-recruitment function to an age-structured population model, which is parametrized for each stock separately. While common stock-recruitment models consider the Allee effect as a static, density-dependent population property, this approach allows an Allee effect to also emerge or disappear from changes in spawner weight and sea temperature. While our approach to model development is not intended to replace existing stock-assessment practice, it can be used to reveal potential mechanisms affecting population dynamics. Finally, we relate the presence and strength of the Allee effects to stock recovery to discuss the role of Allee effects for rebuilding from depletion. In this study each individual stock is for the first time analyzed for the potential of Allee effect dynamics with the same approach and criteria.
2.1 Data
For the 17 Atlantic cod stocks that are located in the North Atlantic Ocean (see Appendix A, Fig. A1), we extracted time series on recruitment, SSB, age-specific abundance, fishing mortality and life-history traits (weight, probability of maturation and natural mortality) from publicly available assessment reports issued by the different fisheries institutions responsible (ICES, International Council for the Exploration of the Sea, http://www.ices.dk, last access: 14 August 2023; DFO, Department of Fisheries and Oceans Canada, https://www.dfo-mpo.gc.ca, last access: 14 August 2023; NAFO, Northwest Atlantic Fisheries Organization, https://www.nafo.int, last access: 14 August 2023; and NOAA's Northeast Fisheries Science Center, https://www.nefsc.noaa.gov, last access: 14 August 2023). Stock-specific number of age classes (5–13 classes), recruitment age (age 1–3) and the different length of time series available (17–68 years) were considered in the model (Appendix B, Table B1). Gaps in the time series of life-history traits were completed by taking the average or using data from different reports in order to keep the time series as long as possible.
A time series of SST, from each stock's geographical location, was extracted from NOAA's Physical Sciences Laboratory (NOAA_ERSST_V4 data, Huang et al., 2015). Average annual SST varies between around 3 ∘C in the northern North Atlantic Ocean where northeast Arctic (NE Arctic) and the Norwegian coastal cod stock are located and around 15 ∘C in the southernmost area of Atlantic cod (Flemish Cap stock; Appendix A, Fig. A1). See Appendix B for a summary and description of the data and the sources used.
2.2 Population dynamics
We used an age-structured population model (Caswell, 2001) to describe the population dynamics of the different Atlantic cod stocks. The model was parametrized for each stock separately and structured according to the stocks' age classes , with A the stock-specific maximum age class. Note that the first age class describes recruitment, while the age of recruitment aR varies among stocks (Appendix B, Table B1).
Recruitment production N(y,1) depends on the abundance of individuals in age class a in spawning year ys, N(ys,a), accounting for their age-specific probability of maturation P(ys,a) and their individual weight when spawning W(ys,a). Because for various Atlantic cod stocks variation in recruitment production has been linked to changes in SST (Drinkwater, 2005; Planque and Fredou, 1999; Brander, 2010), we further considered the recruitment production function R to be influenced by SST as follows:
where the year of spawning is defined as .
Except for the just-produced recruitment, each age class is exposed to age-specific fishing mortality F(y,a) and natural mortality M(y,a). Thus, the abundance of each class is shown by
The oldest age class A is considered a plus group and accumulates all fish of the stock-specific maximum age class and older, described by Eq. (3):
2.3 Stock-recruitment function with separable effects
In contrast to the classical stock-recruitment models using spawning stock biomass, SSB, as an aggregate (Ricker, 1954; Beverton and Holt, 1957), abundance and weight of spawners were considered separately for recruitment production. Thus, the per unit biomass fecundity and recruitment production were not assumed to be equivalent among spawners of different weight. Further, alternatively to models that do consider maternal effects (Shelton et al., 2015; Marteinsdottir and Thorarinsson, 1998; Brunel, 2010), stock-specific and non-linear effects of spawner weight were considered. We did this by introducing a stock-recruitment function with three separable effects on the recruitment production in Atlantic cod, which are the (1) effect of age-specific abundance of spawners, (2) effect of changes in average weight of spawners and (3) effect of SST. Without significantly increasing the data demand in comparison to most conventional stock-recruitment models, the introduced stock-recruitment function is able to capture the difference in significance, strength and direction of either effect between stocks. Thus, it is able to simulate the diversity in density dependences in the recruitment production of Atlantic cod stocks. Note that the introduced stock-recruitment model relies on time series of SSB for validation, and the SSB data themselves are a result of a stock-assessment model and its respective model assumptions.
To isolate the effect of abundance changes of the spawning population on recruitment production from the effect of deviations in spawner weights, we introduced SSBN, given by Eq. (4):
which is similar to SSB but is calculated with historic-average age-specific weights, , obtained by taking for each age class the average of its weight time series.
Because probability of maturation does not change much over time, we are confident that SSBN mainly captures the impact of spawner abundance. Our stock-recruitment function has a basic demographic component, H(SSBN), defined by Eq. (5), which uses SSBN as an argument:
Parameter SSB0 is the position of the inflection point of the recruitment abundance function. Parameter k is the steepness of the curve at point SSB0, which defines the type of recruitment production function, which can be either purely compensatory (k < 2) or with a depensatory region (k > 2). In the latter case, the corresponding recruitment per capita function would have a minimum that indicates the presence of an Allee effect with SSB0 in this case being an Allee effect threshold. See Appendix C Fig. C1 for a schematic figure with all parameters explained.
The use of H(SSBN) with different parameter values results in recruitment per capita function with both compensatory and depensatory dynamics of different steepness, including predator-pit-like Allee effects (Appendix C, Fig. C1). It can therefore capture the diversity in recruitment dynamics of the different Atlantic cod stocks.
To take into account the effect of deviations in spawner weight with time on recruitment production we introduced a spawner weight component of the stock-recruitment (SR) function, defined by
Equation (6) captures the year-specific deviations of spawner weights from the historical average. It can be interpreted as a proxy for spawner fitness. While most conventional stock-recruitment models assume fecundity and recruitment production to increase linearly with spawner weight (Hilborn and Walters, 1992; Hutchings, 2005), in this study we allow for a non-linear dependence. We do this by introducing the exponent c, which quantifies the effect deviations from average spawner weight have on recruitment production. While c=1 shows cases of linearity, as in most conventional stock-recruitment models using SSB as an aggregate but also many models considering maternal effects (Brunel, 2010; Shelton et al., 2015; Marteinsdottir and Thorarinsson, 1998), c>1 means that increasing spawner weight leads to an unproportional strong increase in recruitment production (and vice versa decreasing spawner weight leads to an unproportional strong decrease in recruitment; convex down), and c<1 implies an unproportional slow increase in recruitment production with increasing spawner weight (convex up). Appendix C Fig. C1 shows the effect of parameter c on the function.
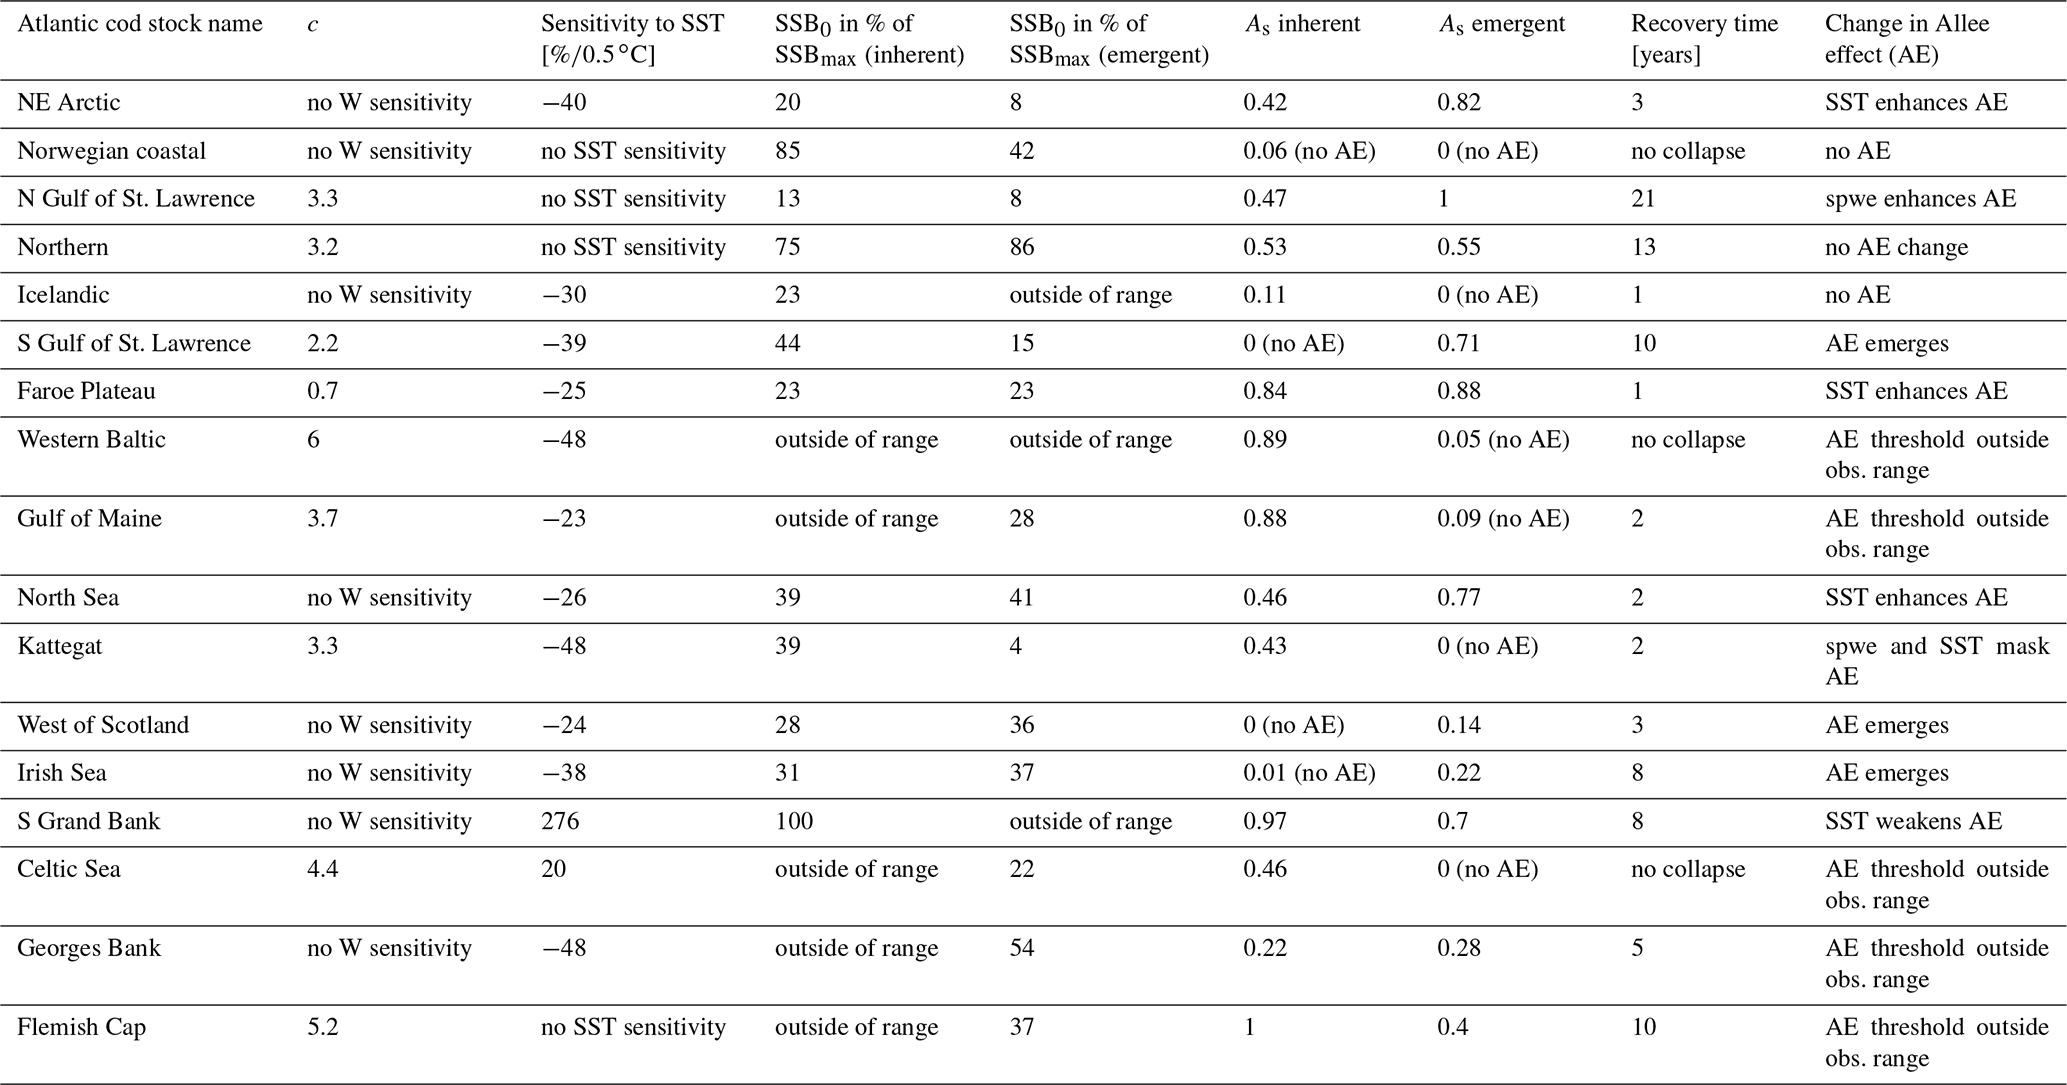
Table 1Fitted stock-recruitment model estimates and Allee effect characteristics for all Atlantic cod stocks. c describes the strength of linearity between spawner weight change and recruitment production (and is thus a proxy for weight (W) sensitivity); sensitivity to SST describes the change in recruitment per capita with 0.5 ∘C based on current ambient SST. SSB0 is the Allee effect threshold (or the inflection point if no Allee effect is present), and As is the Allee effect strength, which we differentiate between only abundance related (inherent) and related to SST and/or spawner weight changes (emergent). The recovery time is estimated as the number of years where SSB is below 20 % of maximum SSB and fishing pressure is below average fishing pressure.
The third component of the stock-recruitment function captures the effect of ambient SST, which is described by a Lorentz function:
where SST0 is the SST optimum value and b is the sensitivity to SST. Because the recruitment response to SST anomalies is stock-specific, the bell-shaped Lorentz function was chosen in contrast to the conventional approach of modeling a monotonic temperature dependence effect (Planque et al., 2003; Clark et al., 2003; Hilborn and Walters, 1992), though recent studies do recognize its time variance (Ottersen et al., 2013; Stige et al., 2013; Szuwalski et al., 2015; Olsen et al., 2011). Laurel et al. (2017) recently applied a Lorentz function to describe growth dependence on SST and size in juvenile Arctic cod. A Gaussian function did not perform well, because some stocks show a nearly linear response to SST increase. Parameter b of the Lorentz function describes the width of the temperature optimum curve. See Appendix C Fig. C1 for a graphical description of each parameter effect. We estimated temperature sensitivity (Table 1) as the ratio between recruitment at a 0.5 ∘C SST increase and recruitment at present SST. In Table 1 we show it as a percent change of projected recruitment from SST of the last analyzed data point (2018).
Considering the three effects on recruitment production, the stock-recruitment function for modeling all studied 17 Atlantic cod stocks can thus be formulated as
where ys is the year of spawning. Constant L′ is the recruitment production at stock-specific average SSB, average SST and average spawner weight, defined as , where L is a normalization parameter needed to reduce the scale of the different cod stocks. The stock-specific coefficients L, k, SSB0, c, b and SST0 were fitted by an optimization procedure using time series of SSB (see below). The exact values of the coefficients are given in Appendix C Table C1.
2.4 Definition of the Allee effect strength
The Allee effect is defined as a decline in the individual growth rate or recruitment per capita ratio, Rcap, at small population density or abundance (Courchamp et al., 1999; Hutchings, 2015). The threshold below which recruitment per capita decreases is termed the Allee effect threshold. If the individual growth rate decreases to zero at a positive population abundance, the Allee effect is usually considered strong (Berec et al., 2007; Hutchings, 2015). Here, we estimated the Allee effect strength, As, as the ratio between Rcap at the Allee effect threshold SSB0 and the minimum Rcap at SSBN below the Allee effect threshold (Eq. 9). Without an Allee effect, SSB0 is simply the inflection point. We considered SSBN in order to focus on spawner abundance, because Allee effects are density- or abundance-dependent phenomena. At the Allee effect threshold, Rcap is maximal, and the corresponding biomass is SSB0. Because all stocks show to some extent a decline in the per capita growth rate (Fig. 3), an Allee effect can be quantified for each stock as the decline in recruitment per capita relative to its maximum so that . When there is no Allee effect As=0 and As=1 when recruitment per capita declines to 0. Appendix C Fig. C1 shows a scheme of the definition:
2.5 Optimization and model validation
The model of cod population dynamics, formulated as a system of Eqs. (1)–(8), has six stock-specific coefficients, L, k, SSB0, c, b and SST0, which were obtained by an optimization procedure, fitting simulated SSB to time series of SSB data. The optimization was accomplished by maximizing a logarithmic likelihood function (see Appendix D, Eq. D1) with an algorithm comprised of a sequence of Latin hypercube, Monte Carlo and Nelder–Mead methods, which is common practice in stock-assessment models (Nielsen and Berg, 2014; Cadigan, 2015). Model performance with the different stock-recruitment effects was compared with model fitting errors (root mean squared logarithmic error, RMSLE) and the Akaike information criterion (AIC; Appendix D, Table D1). We also compared simulated recruitment data with the recruitment and total biomass time series from stock assessments (Appendix D, Figs. D1–D3). Overall, simulations are well within the range of the recruitment data and documented confidence intervals. For details on the optimization procedure and validation of the model fit see Appendix D.
Model building, optimization and analysis were performed in R (R Core Team, 2017).
Stock-assessment data analysis resulted in a density plot of raw stock-assessment data from all 17 cod stocks (Fig. 1), which suggested the highest probability for a decrease in recruitment per capita at below-average spawner abundance, indicating patterns of an Allee effect (Fig. 1a). Interestingly, most data points accumulate in the area of the Allee effect threshold (Fig. 1a, white area), where SSB degradation can have strong repercussions for population and management. In particular at low spawner abundance, below the Allee effect threshold, recruitment per capita ratios are accompanied by temperatures above the average experienced SST (Fig. 1b, red shading), as well as a below-average spawner weight (Fig. 1c, blue shading). This led us to a hypothesis that spawner weight and SST could have effects on recruitment production at low abundance, which motivated the developed model.
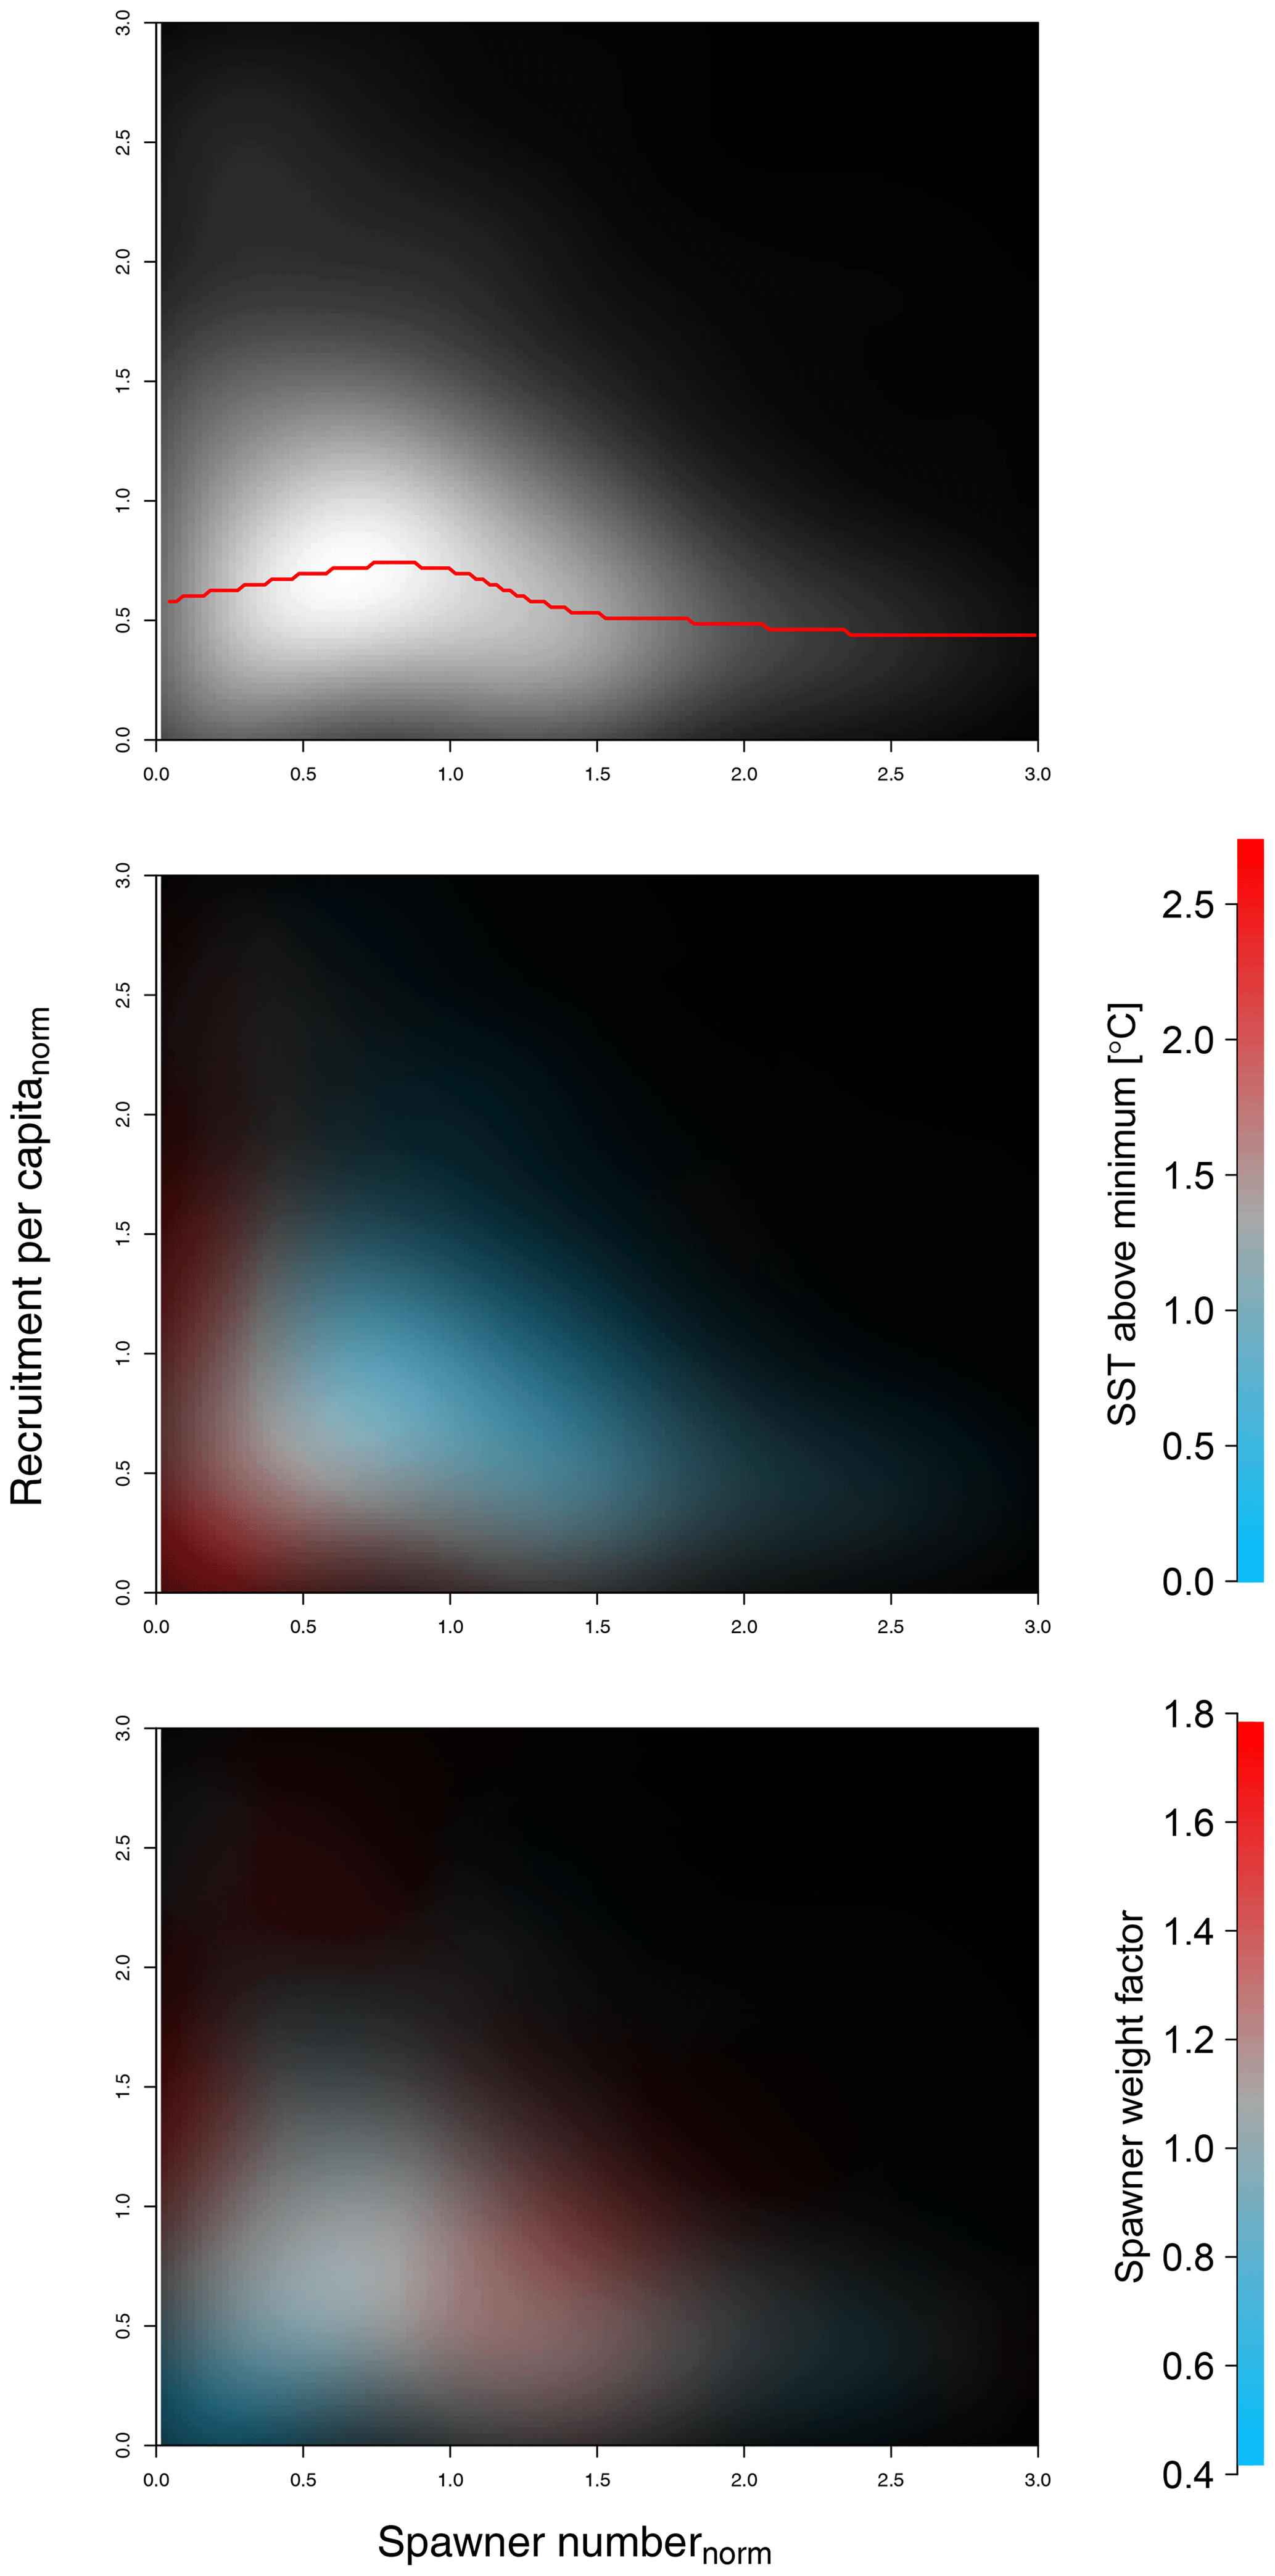
Figure 1Density plot of stock-assessment data of normalized recruitment per capita ratios (y axis) and normalized spawner abundance (x axis). Panel (a) shows all data, with probability density shown as brightness, where the red line shows the most probable recruitment per capita; colors in panel (b) show in addition the sea surface temperature (SST) in comparison to average experienced SST (red indicates above-average SST, blue indicates below-average SST); and in panel (c) colors show the spawner weight in comparison to average spawner weight (blue indicates below-average-weighing spawners and red indicates above-average-weighing spawners).
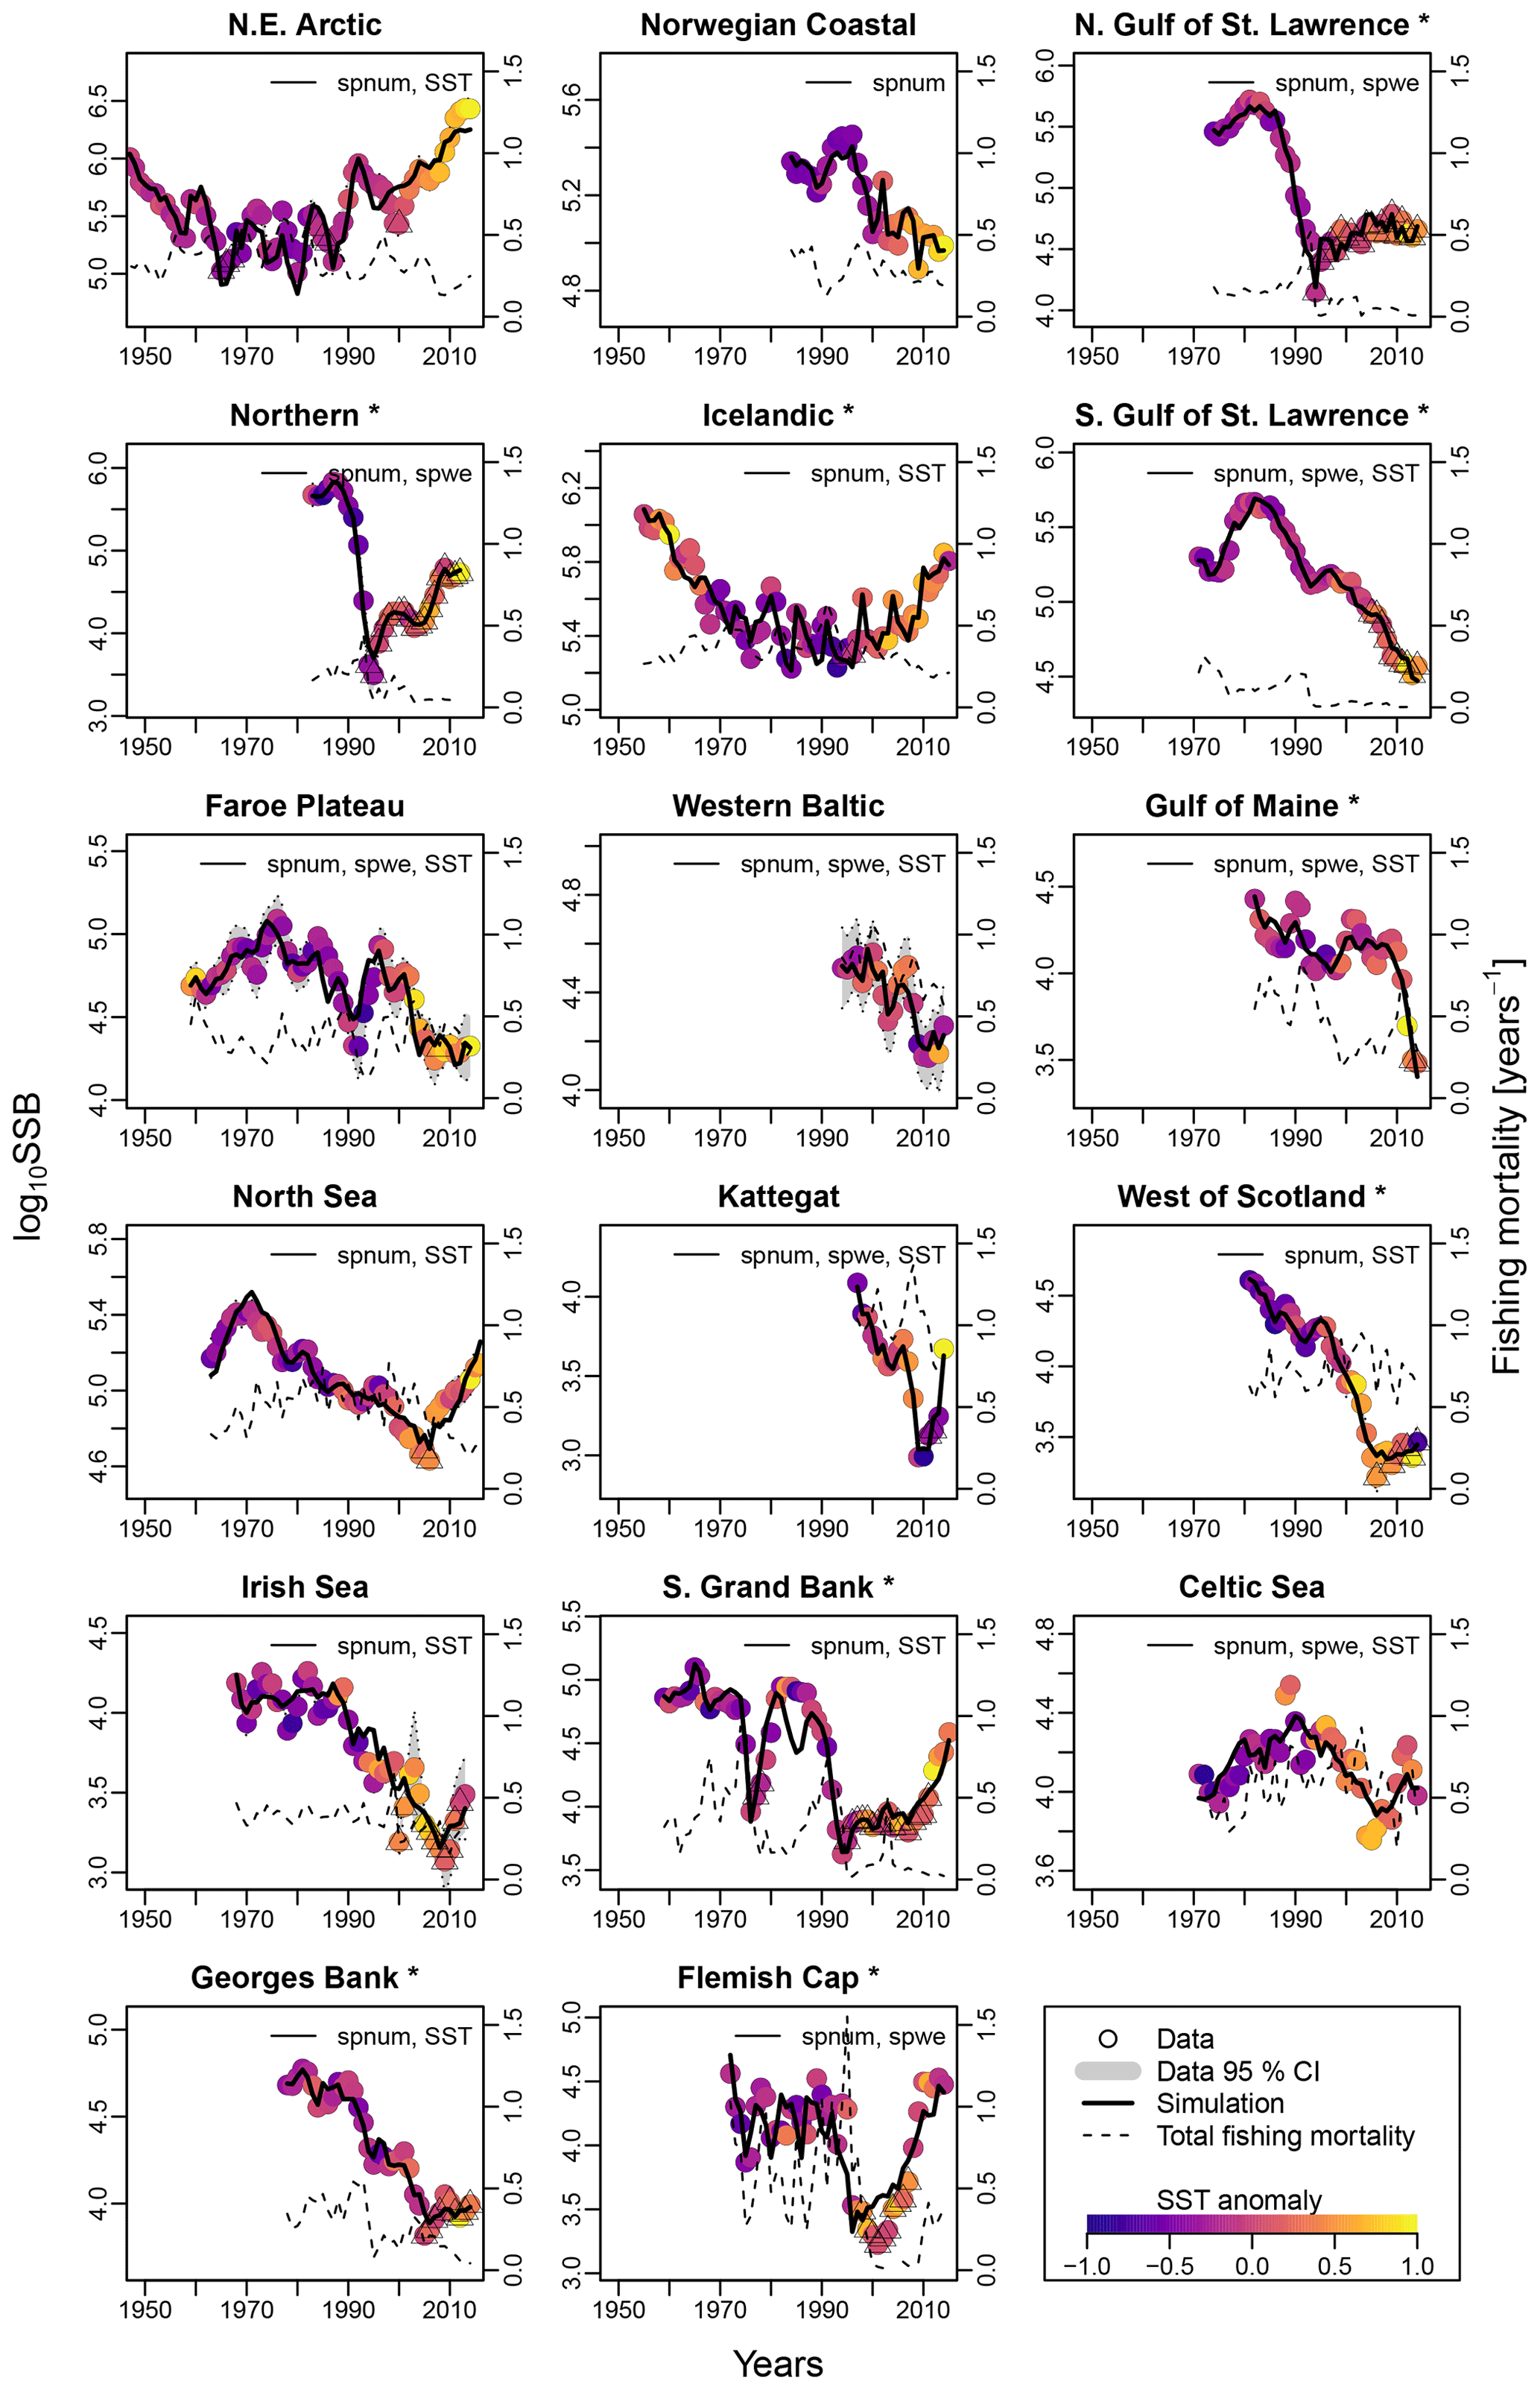
Figure 2Time series of spawning stock biomass (SSB), total fishing pressure and sea surface temperature (SST) anomaly for each stock. Asterisks mark northwest Atlantic cod stocks, while the other cod stocks are found in the northeast Atlantic. Dots show the stock-assessment data for SSB, with dot coloring according to the matching year's average SST. Triangles depict years of collapse (SSB < 20 % of SSBmax and fishing pressure > average fishing pressure). Where available, the 95 % confidence interval of the stock-assessment data is shown in grey. Solid lines indicate estimates based on the respective best model fit to data for the stock-recruitment function. The best model labeling: spnum – best model needs no other effects except spawner number; spwe – best model required spawner weight effect; SST – best model required SST effect in recruitment production function. The dashed line shows the total fishing mortality.
3.1 SSB response to exploitation and SST
For all stocks, SSB simulated with the new stock-recruitment function follows the data trend and remains well within the documented confidence intervals of the data (Fig. 2). We obtained a high goodness of fit for total biomass (TB) and recruitment (R) time series (Appendix D, Figs. D1–D3). All of the stocks experienced strong declines in SSB, with their historical minima observed after 1990, except for the NE Arctic cod stock. Northwest Atlantic stocks (Fig. 2, asterisks) have experienced an overall steeper decline than stocks in the northeast Atlantic. SSB follows the general patterns of fishing pressure with a minor lag (Fig. 2), which is expected given that both time series stem from the same stock-assessment model. Fishing pressure increased more strongly in the northwest Atlantic stocks than in the northeast Atlantic stocks, and there has been a general decreasing trend in fishing pressure in recent years (Appendix B, Fig. B2c and d). Most stocks are now either on an upward or on a rather constant SSB trend following a stock decline, though a few stocks (Norwegian coastal, southern Gulf of St. Lawrence, western Baltic and Gulf of Maine stock) are still declining (Fig. 2).
Average ambient SST ranges between 3 and 15 ∘C (Appendix A, Fig. A2) and shows a significant (p = 0.0001) increasing trend with an average increase of 0.1 ∘C for the last 20 years (1998–2018) (Appendix B, Fig. B1i). On an individual stock level, SST shows less consistent trends, and the relation between SST and SSB is less clear. On a recruitment level (Appendix C, Fig. C3), 13 out of 17 stocks are shown to be affected by the dynamics of SST. Among these, only for the southern Grand Bank and Celtic Sea stock is SST identified as a stringent positive factor, while for six stocks (NE Arctic, Faroe Plateau, Gulf of Maine, North Sea, west of Scotland and Irish Sea stock) the SST increase results in lower recruitment production (Appendix C, Fig. C3), and for another five stocks (Icelandic, southern Gulf of St. Lawrence, western Baltic, Kattegat and Georges Bank stock) the SST impact is ambivalent and dependent on the current temperature (Appendix C, Fig. C3). For these five stocks, the Lorentz function finds a temperature optimum, SST0, within the observed range of data. For stocks where no temperature optimum in the range of observations was found, the whole temperature range in simulations localized on one side of the temperature curve. For the remaining stocks (Norwegian coastal, northern Gulf of St. Lawrence, northern and Flemish Cap stock), the model does not reveal a substantial effect of SST in recruitment production. Appendix C Table C1 summarizes the temperature optima and width parameters of the fitted Lorentz function. The fitted temperature optima for recruitment production are within the documented range for Atlantic cod (Planque and Fredou, 1999; Drinkwater, 2005; Righton et al., 2010; Pörtner et al., 2001), though depending on the physiological and/or ecological mechanism considered. Depending on the current position on the temperature optimum curve (red mark, Appendix C, Fig. C3), changes in future SST have a different impact on future recruitment production.
The SST effect on SSB level is less clear and difficult to disentangle from exploitation effects (Fig. 2). For example, when fishing pressure of the NE Arctic cod started to decline as part of a management plan, the ocean water was also cooler (triangle symbols, Fig. 2), and thus the stock growth temperature component had the highest value (Appendix C, Fig. C2). This could be the reason behind the increase in and recovery of its SSB. Further decline in fishing mortality happened concurrently with ocean warming and likely overweighted the negative response to SST, and the stock continued to grow. Similar patterns are observable for the Icelandic and North Sea stock, which coincides with other studies (Kjesbu et al., 2014; Brander, 2010; Brander, 2018).
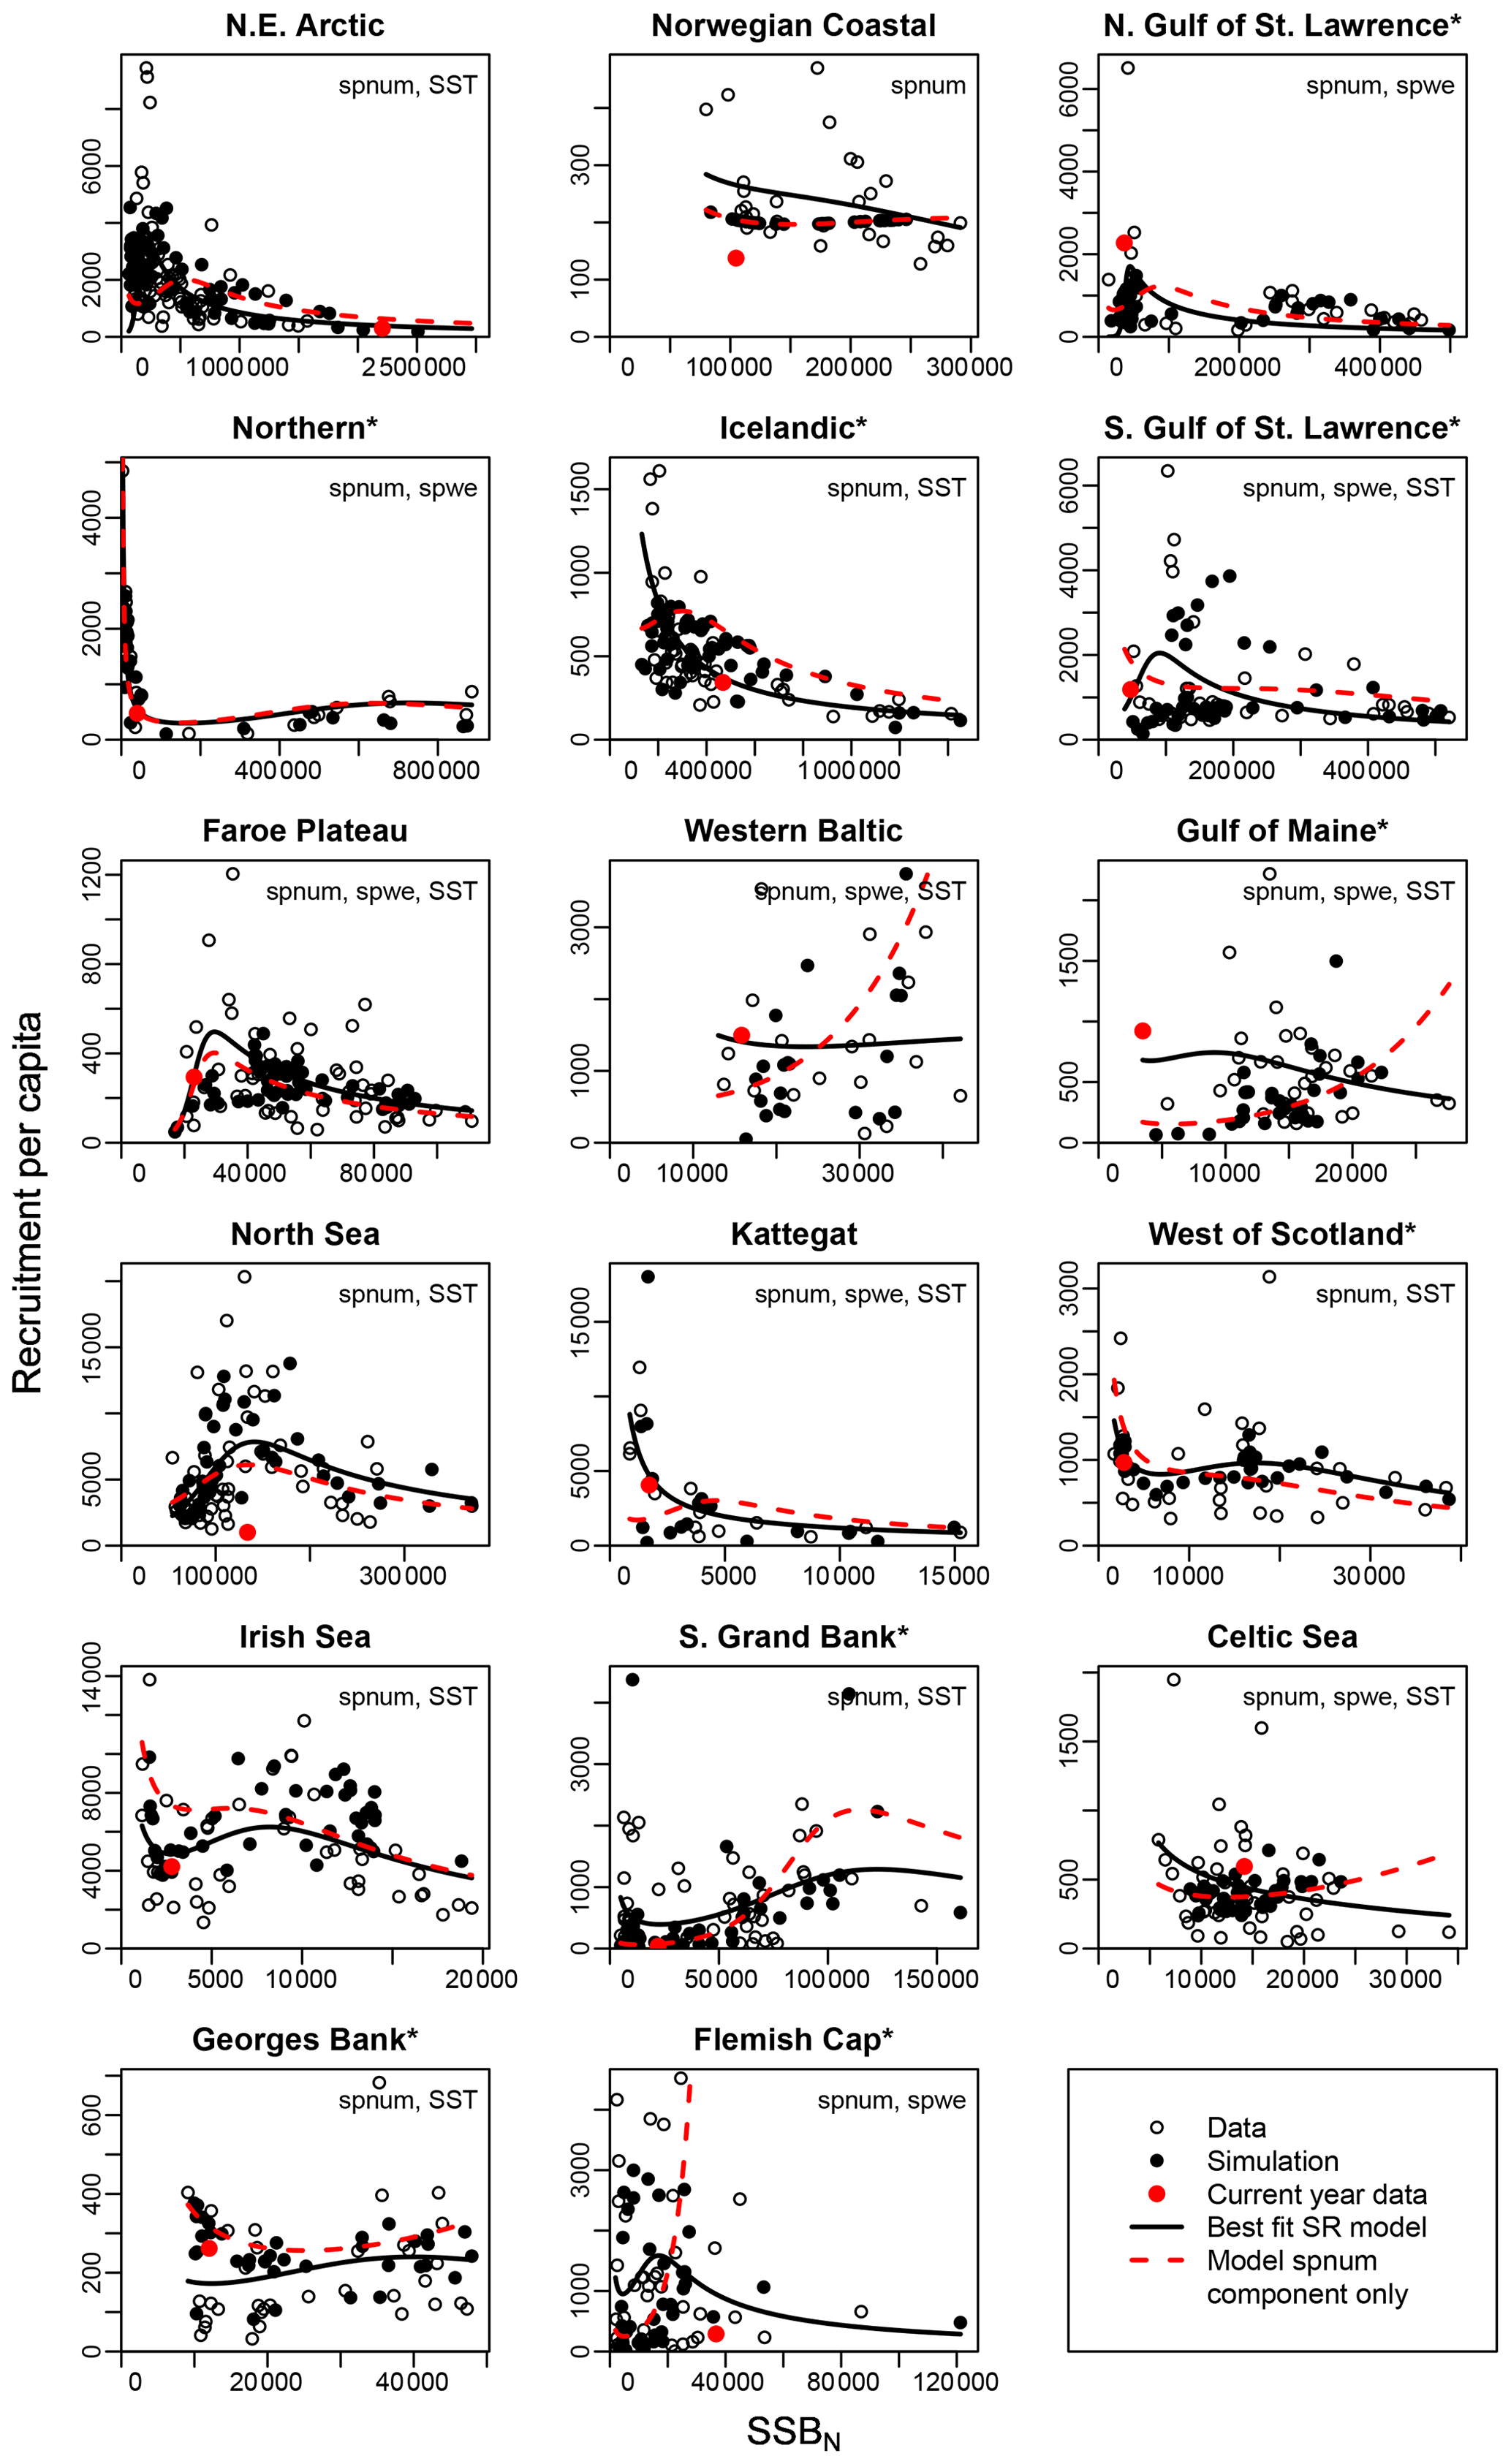
Figure 3Recruitment per capita as a function of SSB at age-specific average spawner weights (SSBN). Asterisks mark northwest Atlantic cod stocks, while the other cod stocks are found in the northeast Atlantic. Circles show the stock-assessment data, black dots show the simulated results of the respective best model (spnum – best model needed no other effects except spawner number; spwe – best model required spawner weight effect; SST – best model required SST effect in recruitment production function). The black line shows the direct fit of the function H(SSBN) to the data. The red dots indicate the most recent stock-assessment data. The dashed red line indicates the relation between recruitment per capita and SSBN neglecting effects of spawner weight (spwe) and sea surface temperature (SST). Thus, deviations between the solid and dashed lines are explained by the impact of spawner weight and/or SST.
3.2 Recruitment production
The introduced new stock-recruitment function considers three factors influencing Atlantic cod recruitment production: (1) abundance of spawners (spnum); (2) deviation from the average spawner weight (spwe); and (3) changes in SST, where spawner weight and SST are considered as environmental factors. We use spnum as the name of the basic model with abundance of spawners as the only significant effect. We tested whether consideration of additional spawner weight (spwe) and/or SST components improves the model fit (i.e., to fit SSB stock-assessment data). We find that in the majority of Atlantic cod stocks (13 stocks), consideration of SST in addition to spnum significantly improves the fit to data (Appendix D, Table D1). For nine stocks, consideration of changes in average spawner weight improves the fit (Appendix D, Table D1). In six stocks, consideration of both spwe and SST is significant (Appendix D, Table D1). In the Norwegian coastal cod stock, spwe and SST do not improve the fit, and (average weighing) SSB is best in describing data (Fig. 3: dashed red line and black dots are the same). Remaining deviations between SSB data and simulated SSB are due to other, here not investigated, factors.
Figure 3 shows the simulated recruitment per capita ratios. In our study we establish that the spnum component of the stock-recruitment function should reflect the inherent density dependence regulation. If recruitment per capita ratios decline at low spawner abundance below a certain threshold, the Allee effect threshold, this can be caused by an abundance-related, inherent Allee effect. For 13 out of 17 stocks, we find an inherent Allee effect, though with highly varying Allee effect strength (As, Table 1) and locations of the Allee effect threshold (SSB0, Table 1). For a few stocks, the model suggests extremely high recruitment per capita ratios and the Allee effect threshold outside the observational range, which stands in contrast to conventional threshold localizations at low abundance (Stephens et al., 1999; Courchamp et al., 1999; Hutchings, 2015). Our Allee effect strength definition (Eq. 9) is further challenged by stocks that show predator-pit-shaped recruitment per capita relations (predator-driven Allee effect), where recruitment per capita drops at low abundance (pit area) but increases again at very low and high abundance (Gascoigne and Lipcius, 2004; Swain and Benoit, 2015). The model confirms the persistent predator-pit-shaped curve for the northern cod stock (Swain and Benoit, 2015; Shelton and Healey, 1999) but also finds a similar but weaker pattern for the west of Scotland, Irish Sea and southern Grand Bank stock.
If recruitment per capita ratios decline at low abundance due to changes in the average spawner weight and/or SST or if changes in the average spawner weight and/or SST enhance the decline of recruitment per capita ratios, i.e., in the best model compared to its spnum component, we consider this an emergent Allee effect. Note that we investigate the significance of SST deviation from the average ambient SST, and, similarly, we investigate the significance of spawner weight deviation from the average-weighing SSB. The majority of stocks show an emergent Allee effect. In six stocks, the inherent Allee effect is strengthened (Table 1). For example, in the northeast Arctic stock, an emergent Allee effect is attributed to SST changes, while in the northern Gulf of St. Lawrence stock changes in spawner weight strengthen an Allee effect (Fig. 3, Table 1). In North Sea cod we find SST to strengthen the inherent Allee effect, which confirms results by Winter et al. (2020). In the southern Gulf of St. Lawrence, west of Scotland and Irish Sea cod environmental factors (spwe and/or SST) induce an Allee effect that was not there before.
The significance of spawner weight changes for Allee effect strength is confirmed by the exponent parameter c (Table 1). In most of these stocks, recruitment production strongly (c > 1, Table 1) increases with increasing spawner weight or, in other words, production declines strongly with decreasing spawner weight. Thus, for stocks with an inherent Allee effect, a decline in spawner weight strengthens the Allee effect. Strengthening of the inherent Allee effect in the Faroe Plateau stock is therefore mainly due to SST changes with a relatively weak spwe effect (c=0.7, Table 1).
For stocks where SST was found to be significant for the Allee effect (e.g., NE Arctic, southern Gulf of St. Lawrence and North Sea cod stock), appearance of the Allee effect is indeed also accompanied by strong changes in SST (cooling for NE Arctic cod and warming for southern Gulf of St. Lawrence and North Sea cod stocks, Fig. 2). The NE Arctic cod stock was in addition much more sensitive to SST changes during the cooling period than at present (Appendix C, Fig. C3). Ocean warming probably helped the stock to recover from low abundance and the Allee effect region when fishing was restricted.
In a few stocks, we find compensatory behavior, the opposite of an Allee effect, to be strengthened when considering changes in spawner weight and/or SST. In five stocks (Icelandic, western Baltic, Gulf of Maine, Kattegat and Celtic Sea stock) this leads to disappearance or masking of the inherent Allee effect, and in two stocks (southern Grand Bank and Flemish Cap stock), the inherent Allee effect is weakened (Fig. 3, Table 1).
3.3 Relation between Allee effect, depletion and recovery
We find that in several Atlantic cod stocks, SSB is below the stock-specific Allee effect threshold (SSB0, Table 1), where a rise in recruitment per capita ratios is constrained by an Allee effect (e.g., northern, southern Gulf of St. Lawrence, Faroe Plateau, North Sea and southern Grand Bank stock) (red dot, Fig. 2). Because for most stocks SST is significant but the future SST impact on recruitment critically depends on the current position on the Lorentz curve (Appendix C, Fig. C3), we estimated a temperature sensitivity, which is the projected recruitment per capita change with 0.5 ∘C (Table 1). With exception of the southern Grand Bank and Celtic Sea stock, the overall future recruitment response to rising SST is projected to be negative, with recruitment of the western Baltic, Kattegat and Georges Bank stocks projected to be reduced up to 50 % (Table 1). Thus, in the southern Gulf of St. Lawrence, Faroe Plateau and North Sea stock, which are currently degraded and in addition show an Allee effect that is strengthened by SST, recovery is likely increasingly hampered by future ocean warming.
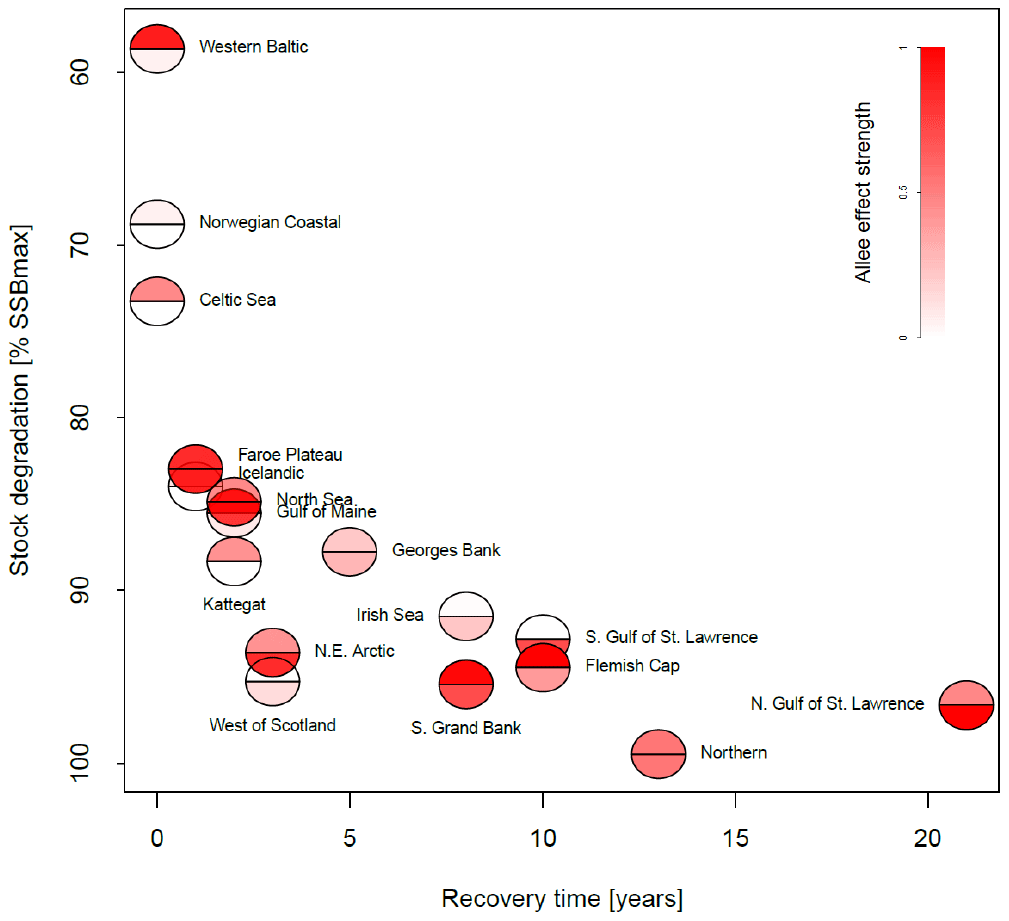
Figure 4Association between the maximum depletion level and recovery time for all stocks. The maximum depletion level is the ratio between the minimum SSB and 20 % of SSBmax, the considered collapse threshold level. The recovery time was estimated as years of SSB < 20 % SSBmax and where fishing pressure remained below average level. The color intensity of the lower semicircle corresponds to the emergent Allee effect strength, and the color intensity of the upper semicircle corresponds to the inherent Allee effect strength.
In Fig. 4, we related depletion level to recovery time and Allee effect strength in order to see whether the Allee effect influences recovery. We estimated stock recovery time as the longest time span of consecutive years where SSB remained below 20 % of its maximum, SSBmax, despite fishing pressure being lower than average. Stock recovery time ranges between 1 year (Faroe Plateau stock; fishing pressure was increased again after a year although SSB remained below 20 % of SSBmax) and 21 years (northern Gulf of St. Lawrence stock). In accordance with other studies (Hilborn et al., 2014; Neubauer et al., 2013; Hutchings, 2015), we find that the stronger the severity of depletion, the longer it takes the stock to recover. We do not find a correlation between Allee effect strength (red color, Fig. 4) and recovery time, though on average stocks with an Allee effect show a longer recovery time. All stocks with an Allee effect did collapse (fell below 20 % SSBmax) and fell below their Allee effect threshold (SSB0, Table 1). An exception is the western Baltic cod, where the model estimated an Allee effect threshold outside the observational range (Fig. 3). Thus, magnitude of degradation and presence of an Allee effect matter, but not Allee effect strength or the location of the Allee effect threshold.
4.1 Presence of Allee effects in Atlantic cod
Slow or negligible recovery in several marine fish stocks and in particular in Atlantic cod stocks remains a challenge. In this study, spawner abundance, changes in spawner weight and temperature were considered as drivers of Atlantic cod recruitment production in order to link these with population trajectories. As a potential impediment to recovery, this study in particular looked at evidence and causes for Allee effects in Atlantic cod. Identification of potential drivers of Allee effects aids in finding (precautionary) fisheries management strategies that can facilitate recovery of depleted stocks.
We find for the majority of Atlantic cod stocks a depression of the per capita growth rate at low to intermediate abundance, which, strictly speaking, could be considered an Allee effect, even if the depression is small. The Allee effect shows a high variety in its form (steep and flat curves, predator-pit shape), location of the Allee effect threshold (8 %–100 % of SSBmax) and Allee effect strength (0–1) (Table 1). Our results confirm the ongoing discussion of potential Allee effects in Atlantic cod, which so far has only focused on single stock studies (Cabral et al., 2013; Kuparinen and Hutchings, 2014; Kuparinen et al., 2014; Perälä et al., 2022) or meta-analysis with aggregated data (Keith and Hutchings, 2012; Myers et al., 1995; Hilborn et al., 2014). To our knowledge, this is the first study showing and investigating the potential of Allee effect dynamics for every individual cod stock.
For several stocks, we find an inherent Allee effect (Fig. 3, Table 1) that is regulated by the abundance of spawners, which has been suggested by others. Some examples include (mechanism in brackets) NE Arctic (northeast Arctic; a sex bias leading to a reduction in egg total, Marshall et al., 2006), Gulf of St. Lawrence (increased predation by seals at low abundance, Neuenhoff et al., 2018), northern cod (increase in spawner mortality (Kuparinen and Hutchings, 2014) and disruption of sub-population structure, Frank and Brickman, 2000), Baltic cod (low food availability after collapse, Van Leeuwen et al., 2008) and Gulf of Maine cod (shrinking sub-population, Dean et al., 2019). For several stocks, the model finds very large recruitment per capita ratios and Allee effect thresholds that are either outside the observational range or at high spawner abundance (e.g., southern Grand Bank cod and emergent Allee effect in northern cod). These cases challenge our definition of an Allee effect, which is usually confined to low abundance (Stephens et al., 1999; Courchamp et al., 1999). We argue here that recruitment dynamics might display a large variety of density dependences, even within the same species, and that recruitment per capita ratios can show a positive density dependence at larger abundances than normally assumed. A possible reason could be that the data used here are only a snapshot of already highly degraded stocks. A prominent example is the northern cod, which seems to have an Allee effect threshold at 75 %–86 % of its maximum observed SSB (Table 1), though we know that the stock has been a multiple of its biomass before its collapse in the 1990s (Department Fisheries and Oceans, 2019). Thus, the time series we have available may not be a good representation of the stock's complete SSB history. Longer time series could aid in better locating Allee effect thresholds, in particular those located at large SSB.
Besides spawner abundance influencing the occurrence of Allee effects, we here identified changes in spawner weight as well as changes in SST as additional environmental factors affecting the presence of Allee effects. The de facto visible Allee effect we call here the emergent Allee effect. SST change strengthens in particular the inherent Allee effect of the NE Arctic, the southern Gulf of St. Lawrence and the North Sea cod; the latter has been recently shown to be impacted by a strong Allee effect strengthened by temperature rise (Winter et al., 2020). Note that the inherent Allee effect of the NE Arctic cod is strengthened during an exceptionally cool period, while the inherent Allee effect in the North Sea cod is strengthened during a warm period (Fig. 2). Conversely, SST changes can also counteract an inherent Allee effect when positively affecting recruitment production. The inherent Allee effect of the western Baltic, Gulf of Maine, Kattegat, southern Grand Bank and Celtic stock was weakened or disappeared due to the change in SST. One suggested explanation is that the stocks were in particular sensitive to below-average sea temperatures (strong, positive temperature dependence of the recruitment production) when they were at low abundance (Fig. 2, Appendix C, Fig. C3). Inherent Allee effects of the western Baltic, Gulf of Maine, Kattegat, Celtic Sea and Flemish Cap stock were reduced due to changes in spawner weight, though only for the Kattegat and Flemish Cap stock do we find clear evidence for an increase in spawner weight in recent years (Appendix E, Fig. E1).
In contrast, changes in spawner weight strengthened the inherent Allee effects in the northern Gulf of St. Lawrence stock (c=3.3, Table 1) and helped cause Allee effect appearance in the southern Gulf of St. Lawrence stock (c=2.2, Table 1), where indeed also a shift towards lighter spawners can be seen (Appendix E, Fig. E1). The stocks also shows a decrease in maturation age and spawner abundance in recent years (Appendix E, Figs. E2 and E3), which has been linked to increased natural mortality and decreased productivity (Swain, 2011).
While we may be able to point out which factor is responsible for influencing the presence of an Allee effect, it remains open which exact mechanism is responsible. As purely abundance (density) related mechanisms, for example, a reduced chance and success of mate finding, egg fertilization, group protection, group learning and less spawning migration at low abundance (Rowe et al., 2004; Rowe and Hutchings, 2003) have been proposed (see stock-specific mechanisms mentioned above). Because of the positive relation between spawner mass, fertility and recruitment success (Marteinsdottir and Steinarsson, 1998; Hixon et al., 2013), changes in spawner weight can facilitate an Allee effect when the spawner population shifts towards lighter, smaller spawners. Such a shift can be induced by a change in body growth (e.g., induced by temperature rise) but is also often induced by heavy fishing targeting the largest and most reproductive individuals, albeit evolutionary shifts towards younger spawners could also imply an increased reproductive output at younger age counteracting an Allee effect. This could explain why we do not find consistent evidence for a decrease in spawner weight. Indeed, life-history traits, such as the probability of maturation at different ages, is for most Atlantic cod stocks highly dynamic (Appendix E, Fig. E3), but we cannot distinguish between phenotypic and evolutionary changes in the (spawner) population.
Changes in SST can strengthen the Allee effect by, for example, decreasing recruitment production; affecting food availability for spawners or recruitment; increasing mortality of spawners or recruitment; and affecting spawner growth. Note that we model the impact of spawner weight and SST independent of spawner abundance and density. Changes in spawner weight and sea temperature mainly strengthen (or weaken) the inherent Allee effect, which is already present (Table 1). The term “emergent” may therefore be better replaced by “apparent”, though we wish to draw with this term attention to the potential of Allee effects to emerge due to changing population or environmental conditions. While density-independent depression of the per capita growth rate strengthens an already existing Allee effect, for an Allee effect to emerge, depression of the recruitment per capita growth rate needs to be density dependent.
It is challenging to differentiate between emergent Allee effect and the coincidental appearance of unfavorable conditions while the stock happened to be at low abundance, if there are no data of unfavorable conditions also at high abundance. While the first is a real Allee effect, becoming effective as soon as the stock's abundance drops below a certain threshold, the second only appears as an Allee effect in conjunction with certain environmental circumstances but is not triggered by or dependent on stock abundance. This is important for predictions under future spawner and environmental changes because the stock may respond differently.
4.2 Linking temperature to biogeochemical processes
For Atlantic cod, variation in recruitment production has been linked to changes in SST throughout the species' geographical range (Drinkwater, 2005; Planque and Fredou, 1999; Brander, 2010). Surface water warming crucially influences the planktonic stage of the Atlantic cod larvae, because of the survival and dependence on plankton prey that occupy surface waters (Sundby, 2000; Beaugrand et al., 2003b; Clark et al., 2003).
In this study, temperature is used as an index for biogeochemical processes that largely determines the variability in Atlantic cod recruitment; however, it does not elaborate on the underlying mechanisms. Physical oceanographic models that link temperature to biogeochemical processes can provide more information on how and when temperature influences recruitment by helping to extract other biogeochemical variables relevant to recruitment, such as oxygen, salinity, nutrients or plankton – the variability of which is often directly temperature dependent.
The negative temperature impact on Baltic cod recruitment (Table 1) could be, for example, due to the temperature-driven decrease in oxygen solubility and rise of oxygen consumption by the increased bacterial decay of surplus primary production (Hinrichsen et al., 2011), creating hypoxia and increased mortality. Low salinity can decrease the buoyancy of cod eggs, which will sink down to oxygen-depleted layers and die, decreasing reproductive success (Nielsen et al., 2013). The inflow of high-salinity waters thus may be an important factor to consider for, e.g., the Baltic cod (Pécuchet et al., 2014) and Flemish Cap stock (Ruiz-Díaz et al., 2022) to explain their response to warming.
Ocean warming also increases the release of nutrients (Rodgers, 2021), creating eutrophication that further contributes to oxygen depletion and can hamper the foraging behavior and food quality of young cod (Isaksson et al., 1994). For example, the North Sea plankton communities have undergone a shift towards smaller, warm-water plankton species, which are of lower food quality for Atlantic cod and impact their survival (Beaugrand et al., 2003a; Beaugrand and Kirby, 2010), and this could be a mechanism behind the negative temperature–recruitment relation in North Sea cod found here.
Besides temperature, various biogeochemical variables have been incorporated into stock-recruitment models of Atlantic cod (e.g., acidification (Stiasny et al., 2016), salinity (Heikinheimo, 2008), plankton (Olsen et al., 2011)), and biogeochemical models have been directly coupled to life stage (Daewel et al., 2011; Hinrichsen et al., 2002) and species distribution models (Gogina et al., 2020). Such spatial explicit models that couple oceanographic features with population density would be of particular interest for the research on Allee effect dynamics, where the density–abundance relation as well as local environmental conditions are important. However, before linking our study to other (biogeochemical) models, we would rather suggest more experimental work to study the effects of environmental variables in relation to population density and abundance. This would fundamentally advance the research on Allee effects, moving from theory to evidence, about the existence of Allee effects and their mechanisms.
In particular, we would suggest more laboratory analysis in closed mesocosms to analyze the biological factors that influence net recruitment (i.e., hatching rate, survival, egg number, feeding rate) in relation to temperature and abundance. These data would allow us to introduce more mechanisms in the model, including those which use the same factors. For example, SST can affect both the probability of eggs hatching in water and abundance of food. Food can serve as a separate mechanism in the recruitment function, in the event of more detailed data on food availability for different age classes (i.e., plankton, sprat and etc.). Weight deviations from the age-specific average would remain a life trait separate from food availability.
To see when and where lab conditions are met in the real world, fish tagging with data loggers could be of importance in addition to existing regular grid monitoring of environmental conditions in the sea. Ideally, obtained fish life-history profiles of environmental variables could then be used to construct rates; specific averages; and other features for correlation analysis with individual fish properties such as weight, fecundity and other. More data on individual fish movements and environmental conditions are required for this approach (ambient water temperature, pressure, etc., for fishes of different age classes either calculated by detailed tracking of fish movement or measured with data loggers attached to fishes of each age class each year). Individual fish behavior during lifetime, e.g., spawning and feeding events can be also obtained with fish track data and correlated with obtained life-history profiles of its ambient environmental factors. The latter would be ideal for analyzing Allee effects in general and being able to distinguish between responses to ambient environment conditions and to population abundance (and ultimately detect emergent Allee effects).
4.3 When can prolonged recovery be linked to an Allee effect?
We identified years until recovery when SSB remained below the collapse threshold (SSB < 20 % SSBmax) even though fishing was reduced below its historic average. For many stocks, we find that in periods of prolonged recovery (triangles, Fig. 2), biomass levels are also below the Allee effect threshold. We also find that in many cases fishing reductions were only in place long after the stock had fallen below its Allee effect threshold (e.g., northern, North Sea, west of Scotland, southern Grand Bank, Georges Bank and Flemish Cup cod) – an observation shared by others (Neubauer et al., 2013). This is surprising, given that the precautionary and biomass limit reference points used in fisheries management are often higher than the Allee effect thresholds discovered here.
We here attempted a gradual quantification of the Allee effect strength, defined by the decline of the recruitment per capita at low abundance (Eq. 9). We do not find a strong relation between inherent or emergent Allee effect strength and length until recovery (Fig. 4). One reason could be that our Allee effect strength definition does not consider the presence of hysteresis, which is caused when per capita growth rate drops to zero at positive abundance (Jiang and Shi, 2010). Decisive for recovery is whether an emergent Allee effect is present and how strongly the stock is degraded (Fig. 4). This implies that for conservation measures, the strength and threshold of the Allee effect should both be considered in order to ensure that stocks with an Allee effect still recover after depletion. The Allee effect threshold could provide guidance for locating precautionary reference levels, and the Allee effect strength could provide guidance for the type of measures implemented below the precautionary level.
4.4 Prediction to future changes
Climate change will continue to cause a considerably warmer Atlantic Ocean (IPCC, 2019), and our results show that increasing SST will have negative repercussions for most of the Atlantic cod stocks that have already passed their thermal optimum. This could push stocks with an emergent SST-related Allee effect further below their Allee effect threshold, squandering any rebuilding efforts so far. While in the past some stocks were positively affected by an SST change and thus could withstand an inherent Allee effect, this positive SST effect can diminish under future conditions. For example, the inherent Allee effect of the Kattegat cod stock was suspended by extraordinary low SST in the past, but future warming is likely to negatively impact recruitment production, which could unmask the inherent Allee effect. Interestingly, we find for many stocks that the location of the Allee effect threshold of the inherent and emergent Allee effect differs (Table 1). Thus, changing environmental conditions could induce an Allee effect at unexpected SSB levels. In some stocks, such as the southern Grand Bank cod, we find increasing SST to be beneficial, which could further enhance SSB increase and push it above the Allee effect threshold. The increasing evidence for (dynamic) Allee effects challenges the default assumption regarding compensatory recruitment dynamic in fisheries stock assessments and calls for precautionary and adaptive management strategies, which involve regular re-assessments. In particular, when environmental factors lead to low or no detectability of an Allee effect, this poses a high management cost.
Migratory behavior and sub-population dynamics influence the presence and detection of an Allee effect (Frank and Brickman, 2000) but could not be considered here because we used stock-assessment data without spatial information. We therefore could also not consider spatial factors that can influence recruitment variability, such as the shift of eggs and larvae from their advantageous habitat due to wind and ocean currents (aberrant drift) or direct spatial constraints on eggs and larvae (vagrancy) (Sinclair and Iles, 1989). In some cases our model predicts depensatory dynamics at high abundance, with a threshold above the historical range. Whether these stocks indeed show an Allee effect is debatable, as the Allee effect is usually considered a low-abundance phenomenon. More data at low abundance, spatial information and stock-assessment independent data would give more indication. Because our study heavily relies on the data from stock-assessment models, our conclusions can only be seen in light of these data and models. Our approach therefore offers an alternative view but is not intended to replace existing stock-assessment practice. It can be used in practice to simulate population dynamics scenarios and analyze projections to give management decision support.
In conclusion, our approach on modeling recruitment production shows some limitations and is not designed to replace common stock-assessment models, but it provides new perspectives on non-linear recruitment dynamics in marine fish. With this study we contribute to the emerging recognition of dynamic Allee effects (Tirronen et al., 2022) that can interact with the environment (Berec, 2019; Vet et al., 2020; Winter et al., 2020). We find that Allee effects are common in Atlantic cod and are highly dynamic under different spawner weight and SST conditions. If present, the Allee effect hinders recovery. Our findings advocate for the application of more precautionary management measures with lower fishing opportunities to counteract the high uncertainties in Atlantic cod recruitment dynamics, which can occur at larger population sizes than previously thought.
The appendix consists of five appendices describing in detail (1) the location of the different Atlantic cod stocks (Appendix A), (2) stock-assessment data and parameters used (Appendix B), (3) the different stock-recruitment function components (Appendix C), (4) the optimization procedure and model validation (Appendix D), and (5) observed changes in population characteristics according to stock-assessment data (Appendix E).
For each Atlantic cod stock, a time series of SST from each stock's geographical location was extracted from NOAA's Physical Sciences Laboratory (NOAA_ERSST_V4 data, Huang et al., 2015). Average annual SST varies between around 3 ∘C in the northern North Atlantic Ocean where NE Arctic and the coastal cod stock are located and around 15 ∘C in the southernmost area of Atlantic cod (Flemish Cap stock). Figure A1 shows the different Atlantic cod stocks located in the North Atlantic Ocean and with their average (from the time series used) ambient SST. The different stocks show four distinct temperature regimes (Fig. A2).
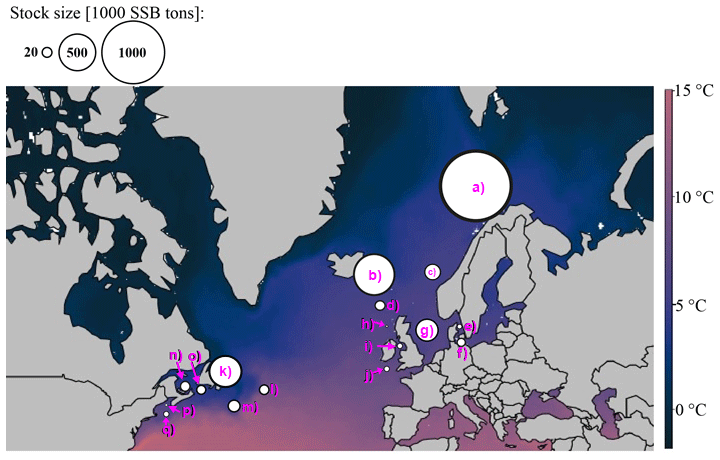
Figure A1Geographic map of average ambient sea surface temperature and stock size and locations according to their stock management area. The coloration of the map is according to ambient sea surface temperatures, which range for Atlantic cod between 3 ∘C in the Barents Sea (a) and 15 ∘C at the Flemish Cap (l). Spawning stock biomass (SSB) is highest from the northeast Arctic (a) and Icelandic stock (b). The stocks investigated are (a) northeast Arctic cod, (b) Icelandic cod, (c) (Norwegian) coastal cod, (d) Faroe Plateau cod, (e) Kattegat cod, (f) western Baltic cod, (g) North Sea cod, (h) west of Scotland cod, (i) Irish Sea cod, (j) Celtic Sea cod, (k) northern cod, (l) Flemish Cap cod, (m) southern Grand Bank cod, (n) southern Gulf of St. Lawrence cod, (o) northern Gulf of St. Lawrence cod, (p) Gulf of Maine cod and (q) Georges Bank cod.
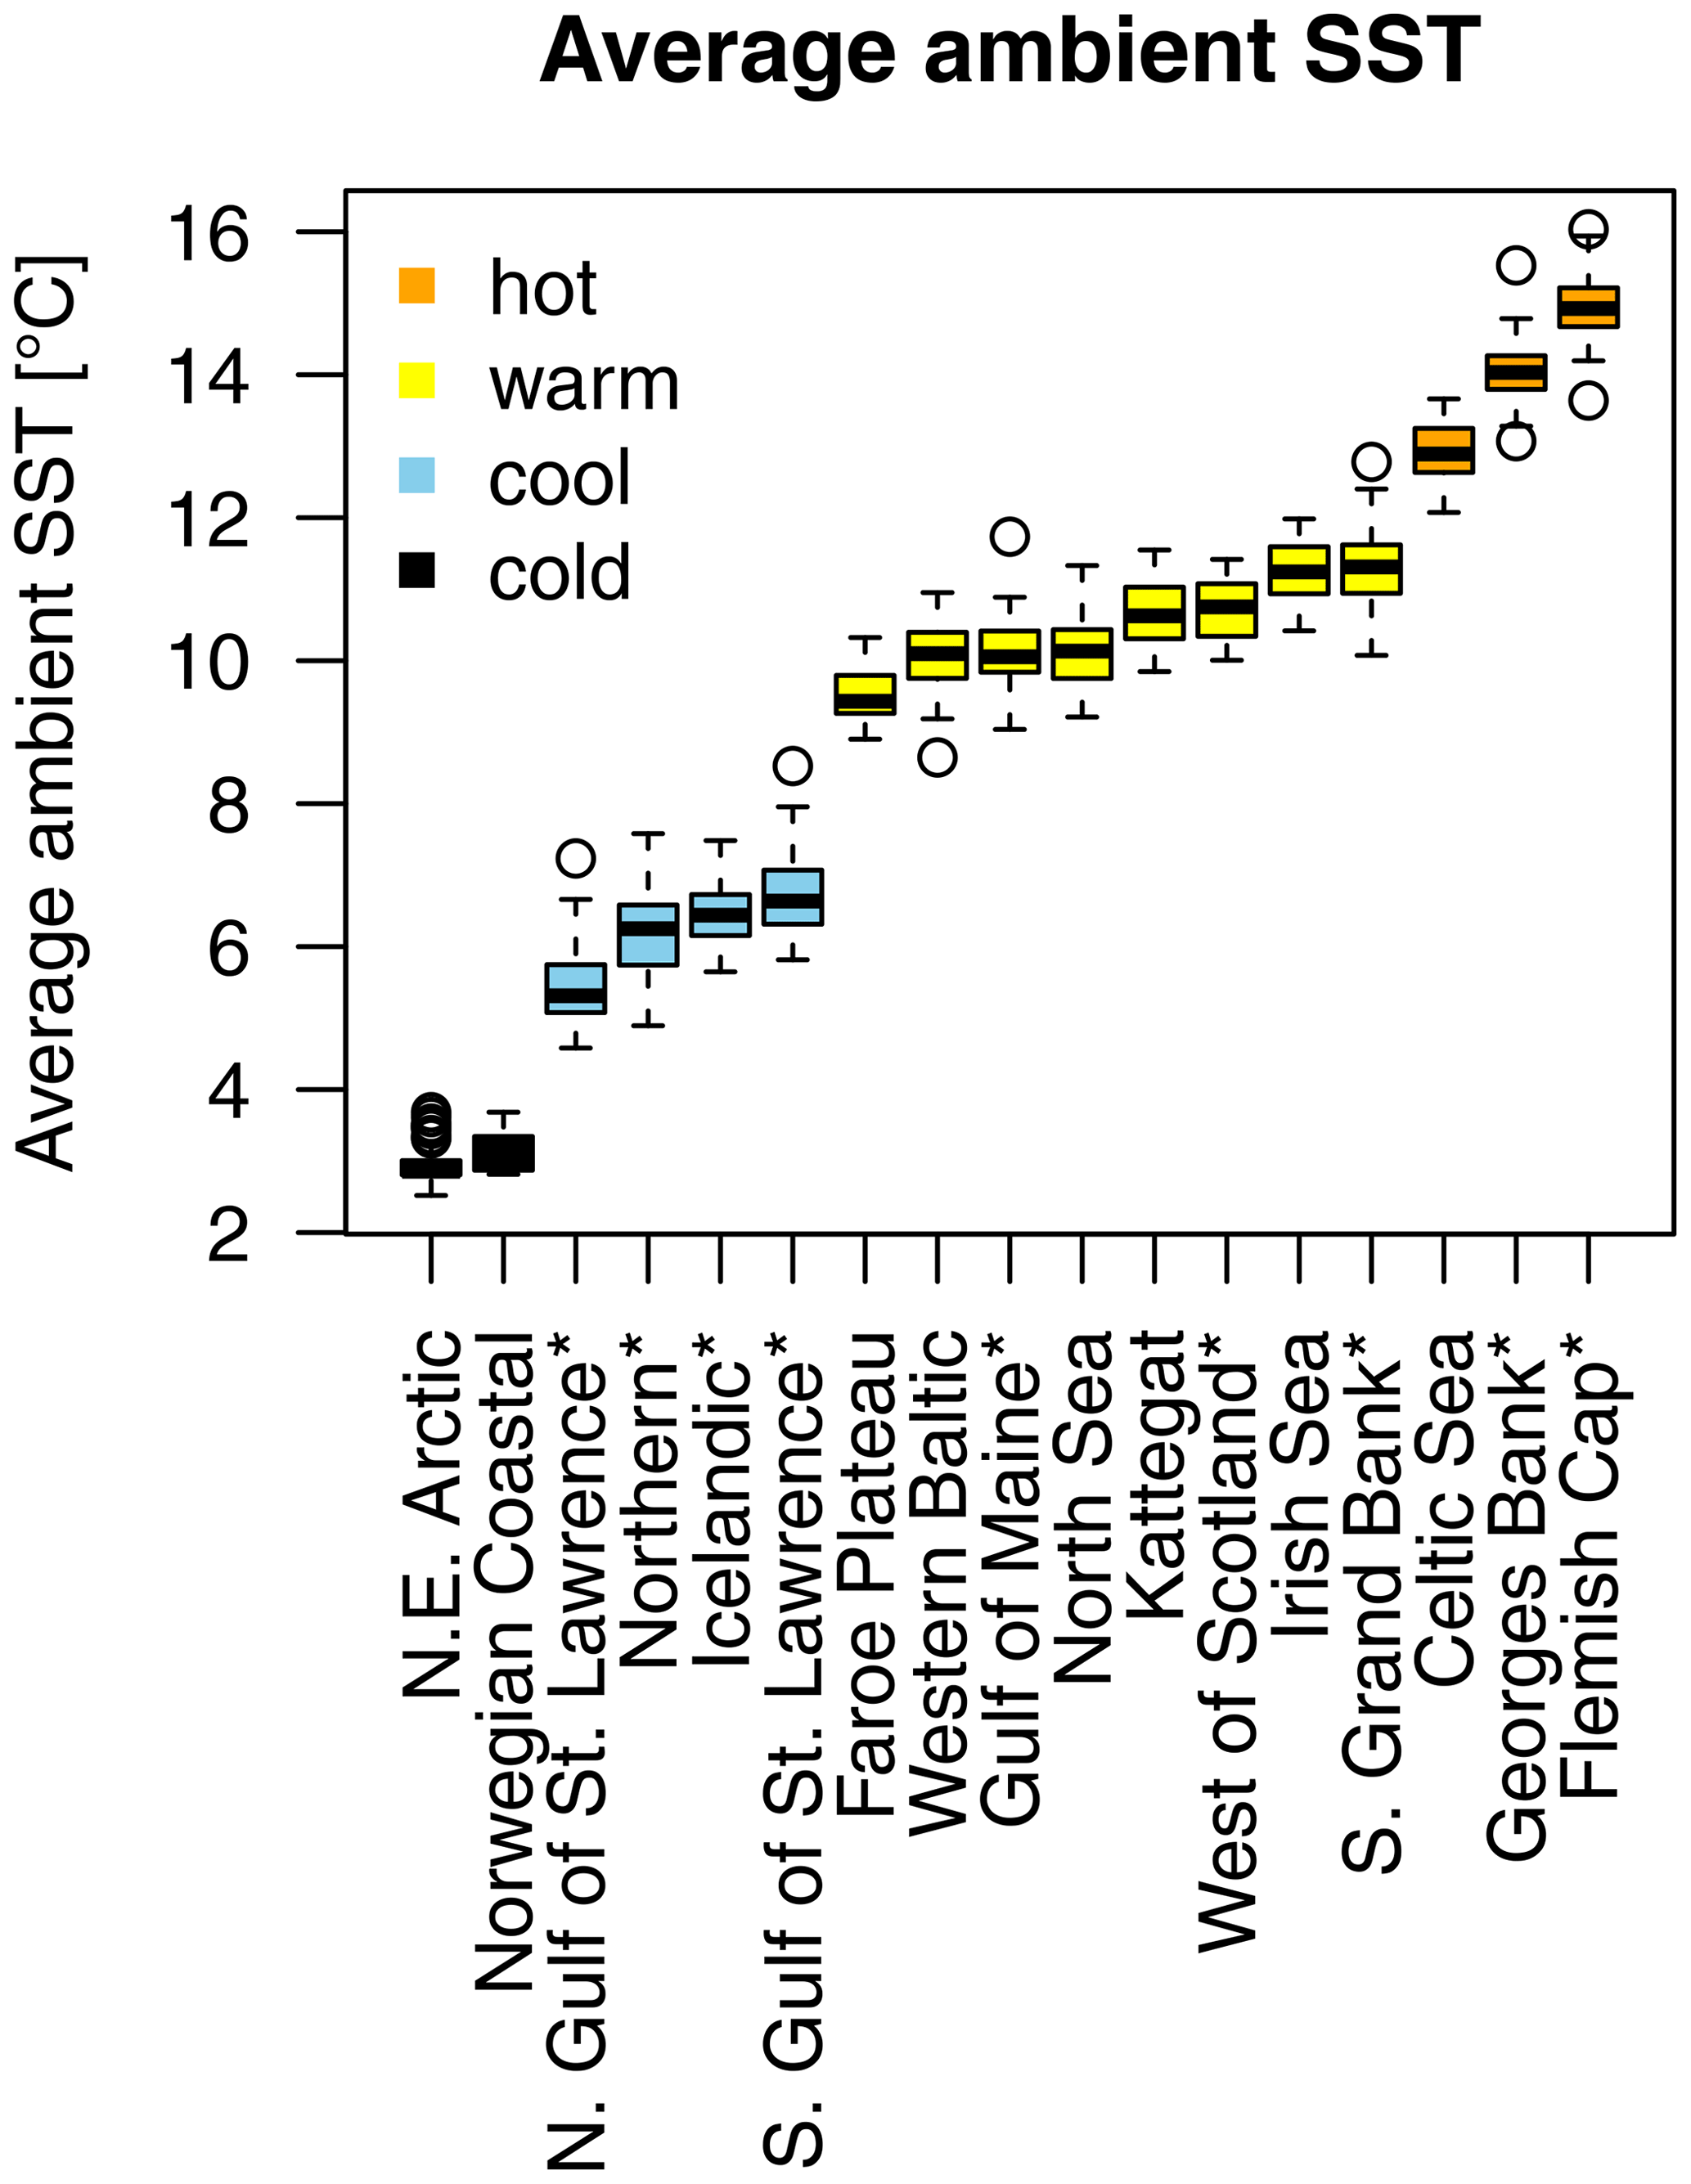
Figure A2Atlantic cod stocks grouping by their average ambient sea surface temperature (SST). Asterisks mark northwest Atlantic cod stocks, while the other cod stocks are found in the northeast Atlantic. Box plots show the temperature span of the time series available.
For the 17 Atlantic cod stocks, we extracted time series on recruitment, SSB, age-specific abundance, fishing mortality and life-history traits (weight, probability of maturation and natural mortality) from publicly available assessment reports issued by the different fisheries institutions responsible (ICES, International Council for the Exploration of the Sea, https://www.ices.dk, last access: 14 August 2023; DFO, Department of Fisheries and Oceans Canada, https://www.dfo-mpo.gc.ca, last access: 14 August 2023; NAFO, Northwest Atlantic Fisheries Organization, https://www.nafo.int, last access: 14 August 2023; and NOAA's Northeast Fisheries Science Center, https://www.nefsc.noaa.gov, last access: 14 August 2023). Stock-specific number of age classes (5–13 classes), recruitment age (age 1–3) and the different length of time series available (17–68 years) was considered in the model (Table B1). Only the subset of data for which values of abundance, life-history traits and SST existed were taken. P, the probability of maturation (Eq. 4), was extended with the value of 1 if there were no data for older age classes available. F, the fishing mortality, was extended with the value for the last fish size class if needed. If the stock-assessment reports did not contain all data needed, the time series of life-history traits were completed by taking the average or using data from different reports (see comments, Table B1). Figure B1 shows the time trend relative to mean value of all data points (from all stocks) of total biomass (TB), spawning stock biomass (SSB), recruitment, recruitment per SSB (recruitment per capita), spawner abundance, mean spawner age (probability of maturation and abundance weighted), mean maturation age (average age at which fish go to spawn for the first time in their life), mean spawner weight (probability of maturation and abundance weighted) and SST. All trends are significant with p < 0.002. All trends are negative, except for SST. Figure B1 shows the time trend in normalized SSB and fishing pressure of all stocks. Total fishing mortality was estimated as
Data were normalized to stock-specific average values.
Table B1Data source, time series length where all parameters were available, number of age classes, age of recruitment aR, average ambient SST and data specifics for each of the 17 Atlantic cod stocks. Asterisks mark the western Atlantic cod stocks.
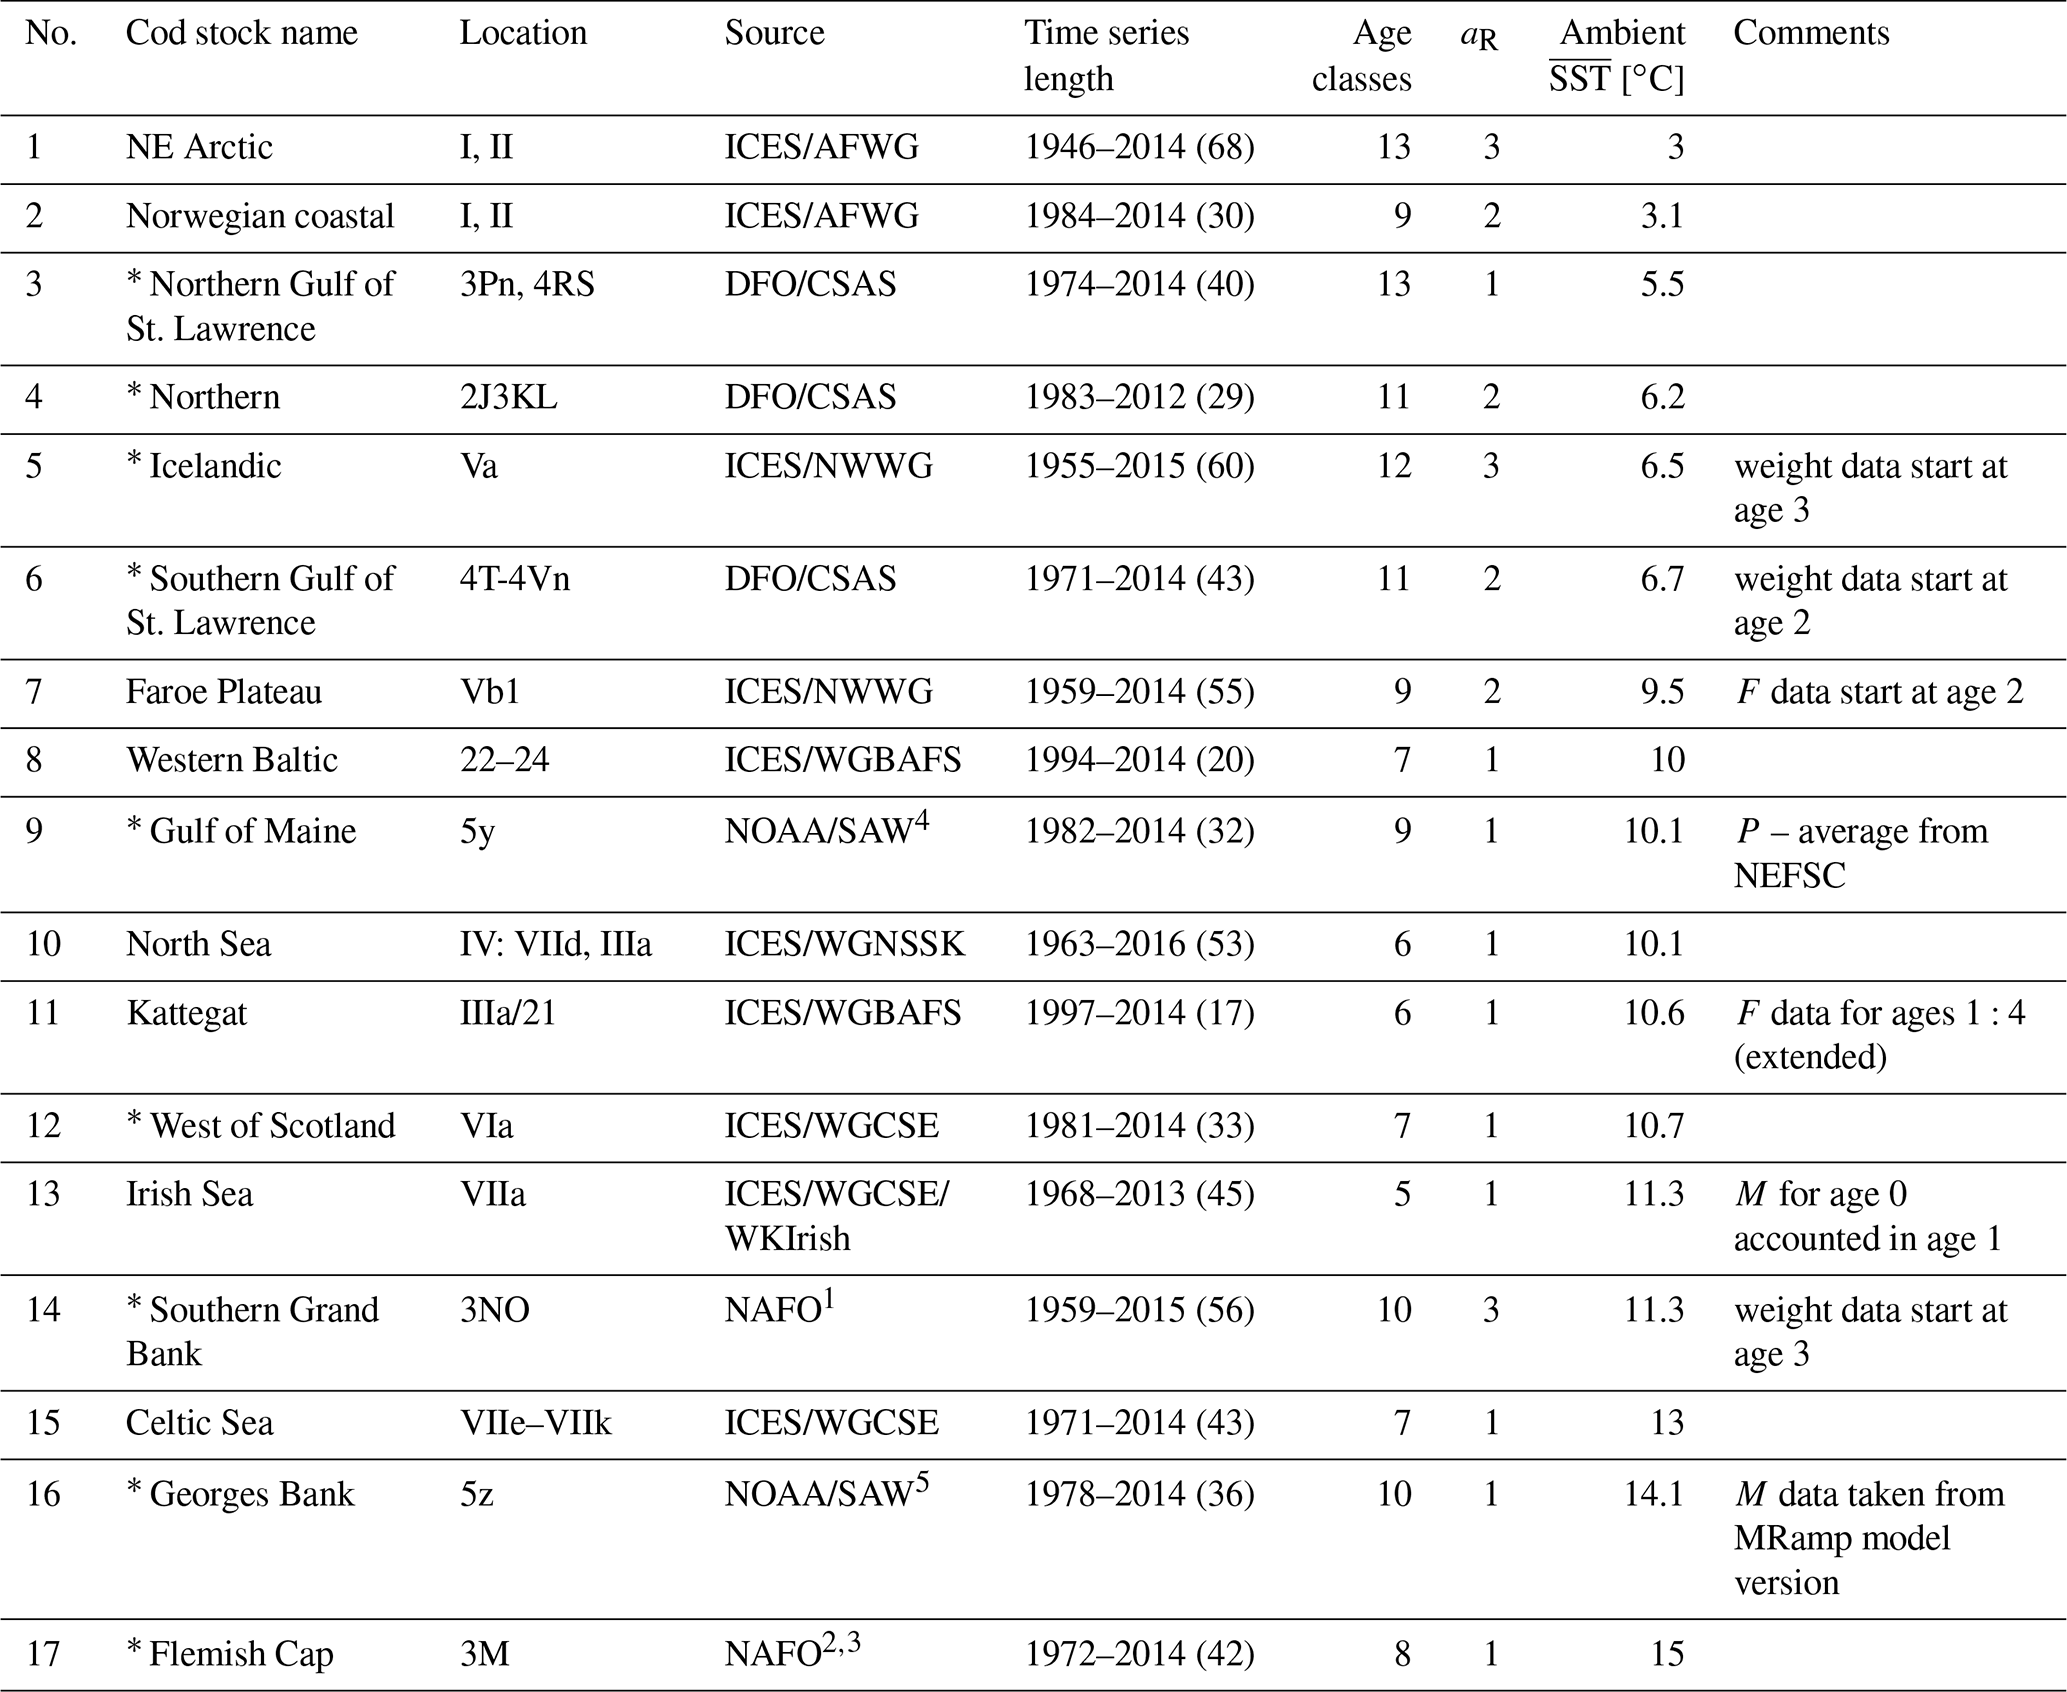
ICES: International Council for the Exploration of the Sea; AFWG: Arctic Fisheries Working Group; DFO: Department of Fisheries and Oceans Canada; CSAS: Canadian Science Advisory Secretariat; NWWG: Northwestern Working Group; WGBFAS: Baltic Fisheries Assessment Working Group; NOAA: National Oceanic and Atmospheric Administration; SAW: Northeast Regional Stock Assessment Workshop; WGNSSK: Working Group on Assessment of Demersal Stocks in the North Sea and Skagerrak; WGCSE: Working Group on Celtic Seas Ecoregion; WKIrish: Benchmark Workshop on the Irish Sea Ecosystem; NEFSC: NOAA's Northeast Fisheries Science Center; NAFO: Northwest Atlantic Fisheries Organization. 1 Rideout et al. (2017). 2 González-Troncoso and Fernando González-Costas (2014). 3 Pérez-Rodríguez et al. (2016). 4 NOAA (2013). 5 NOAA (2012).
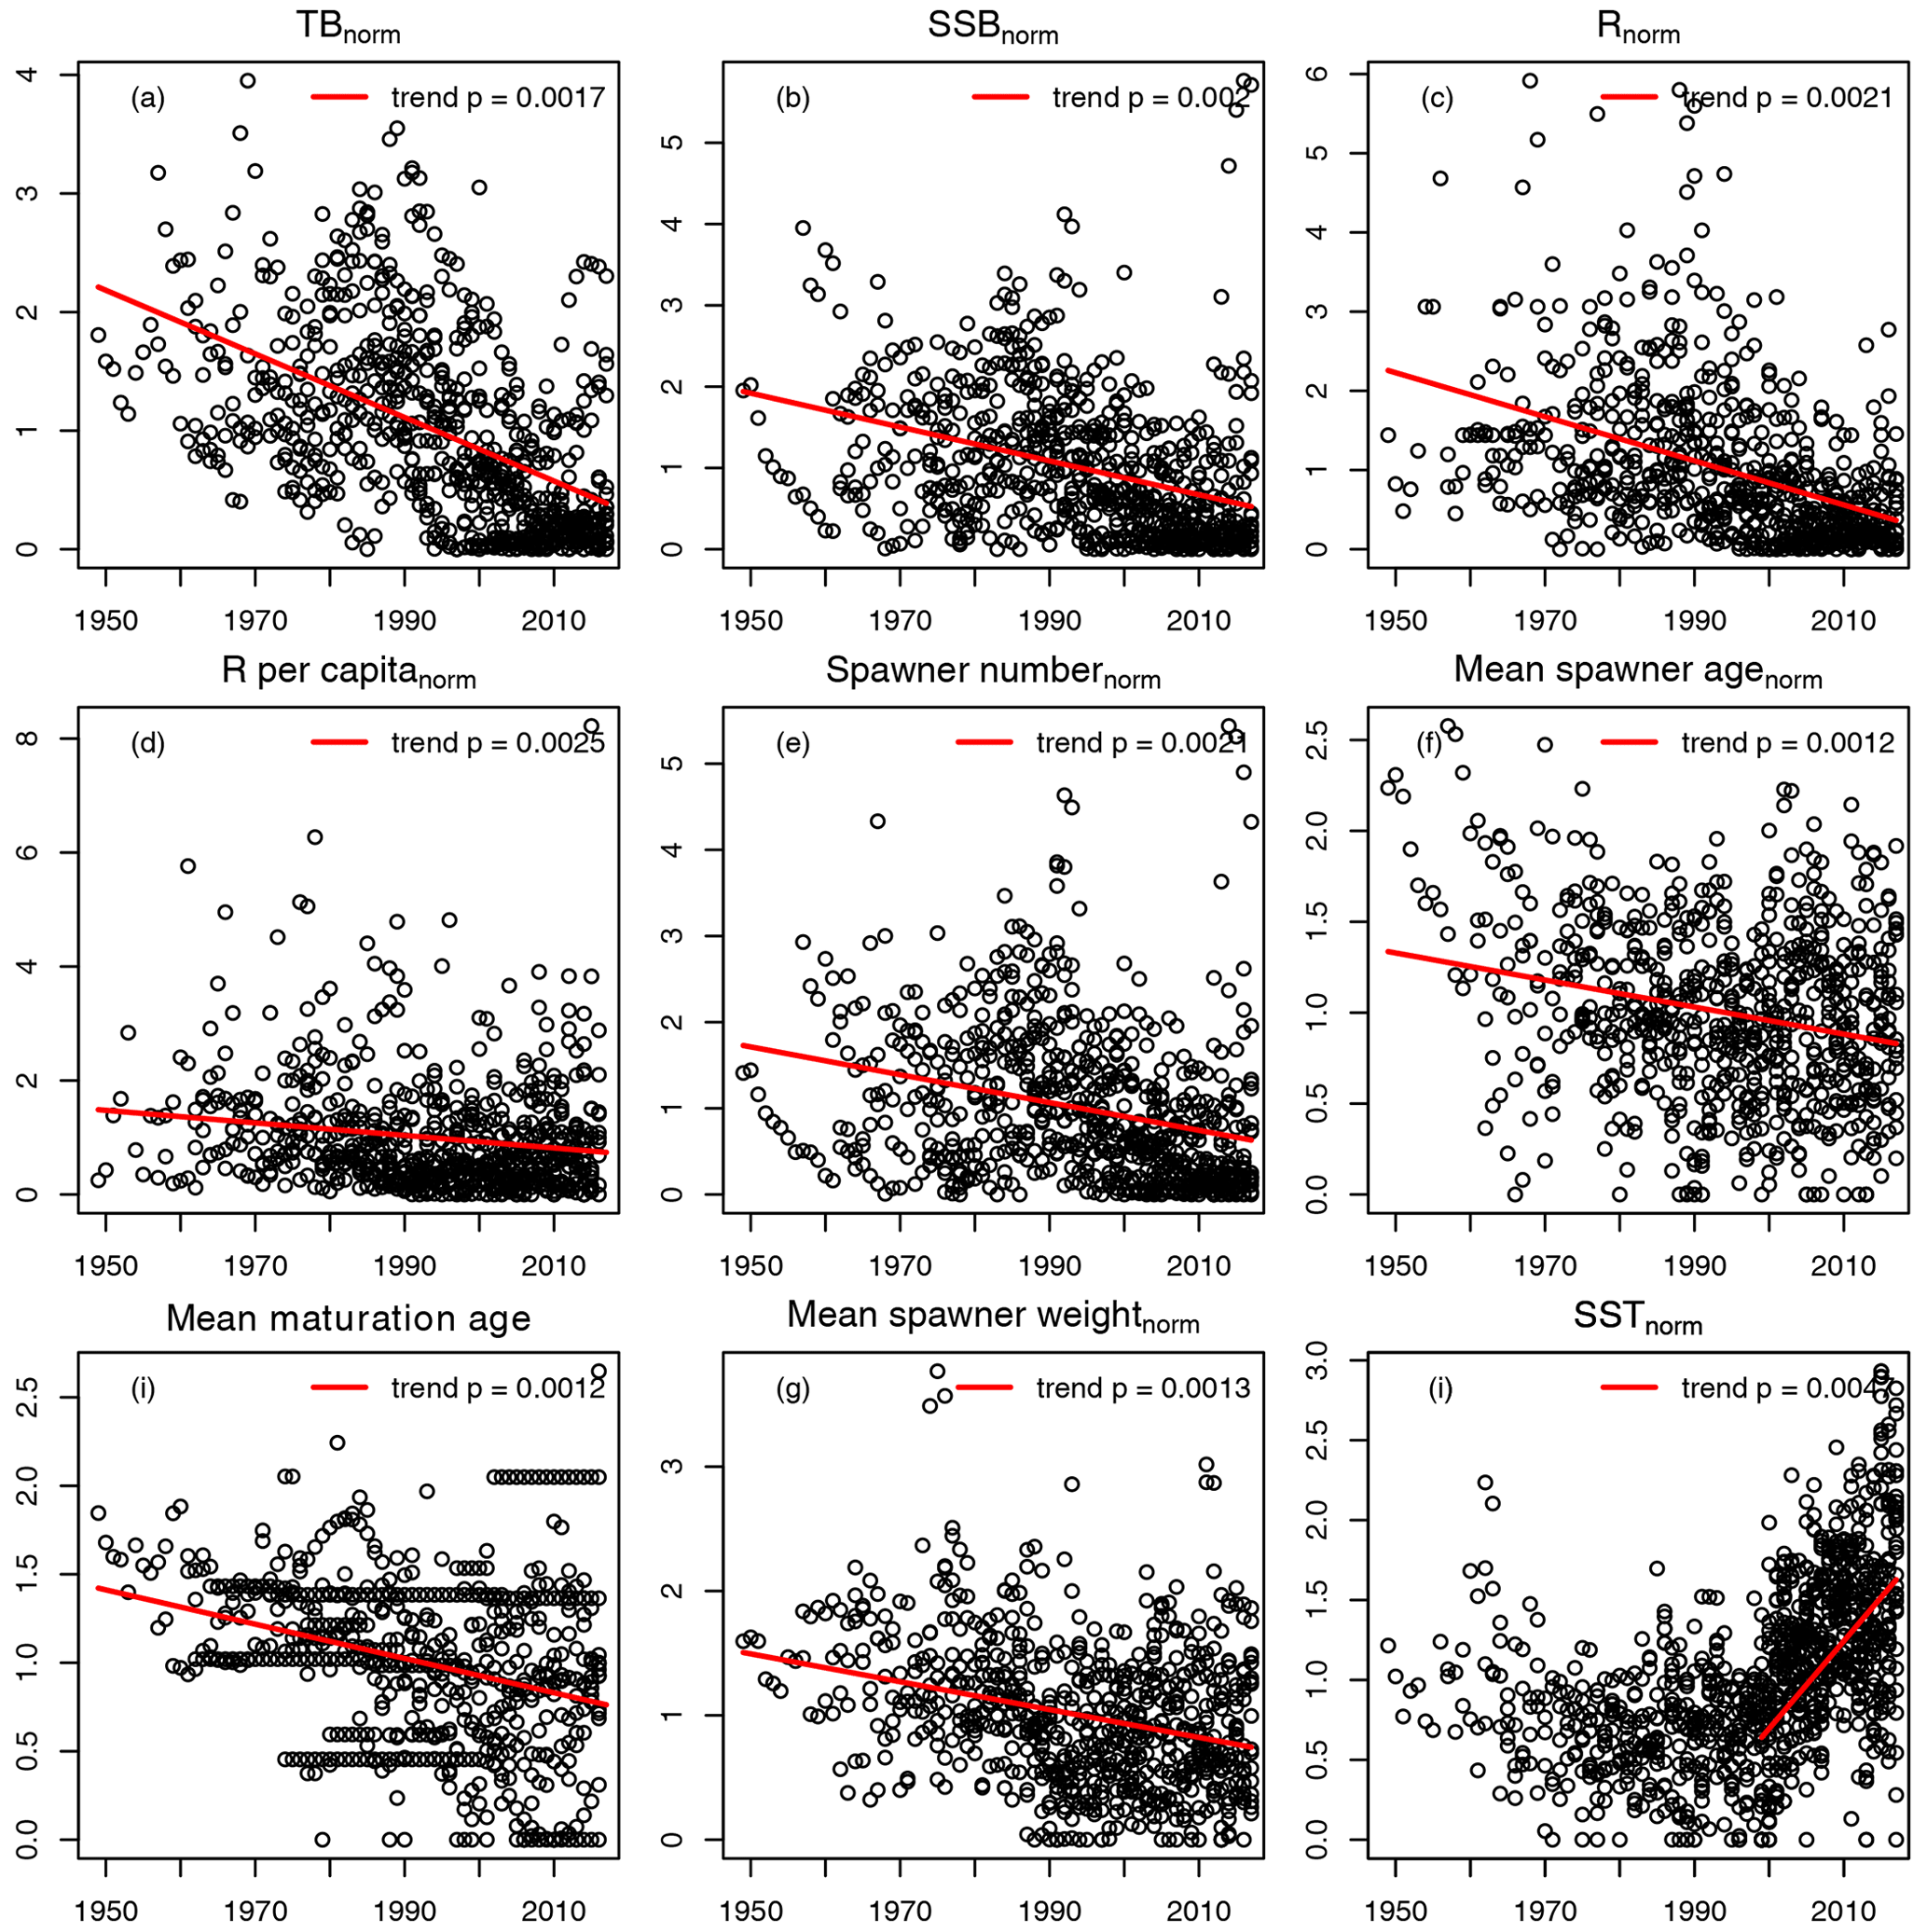
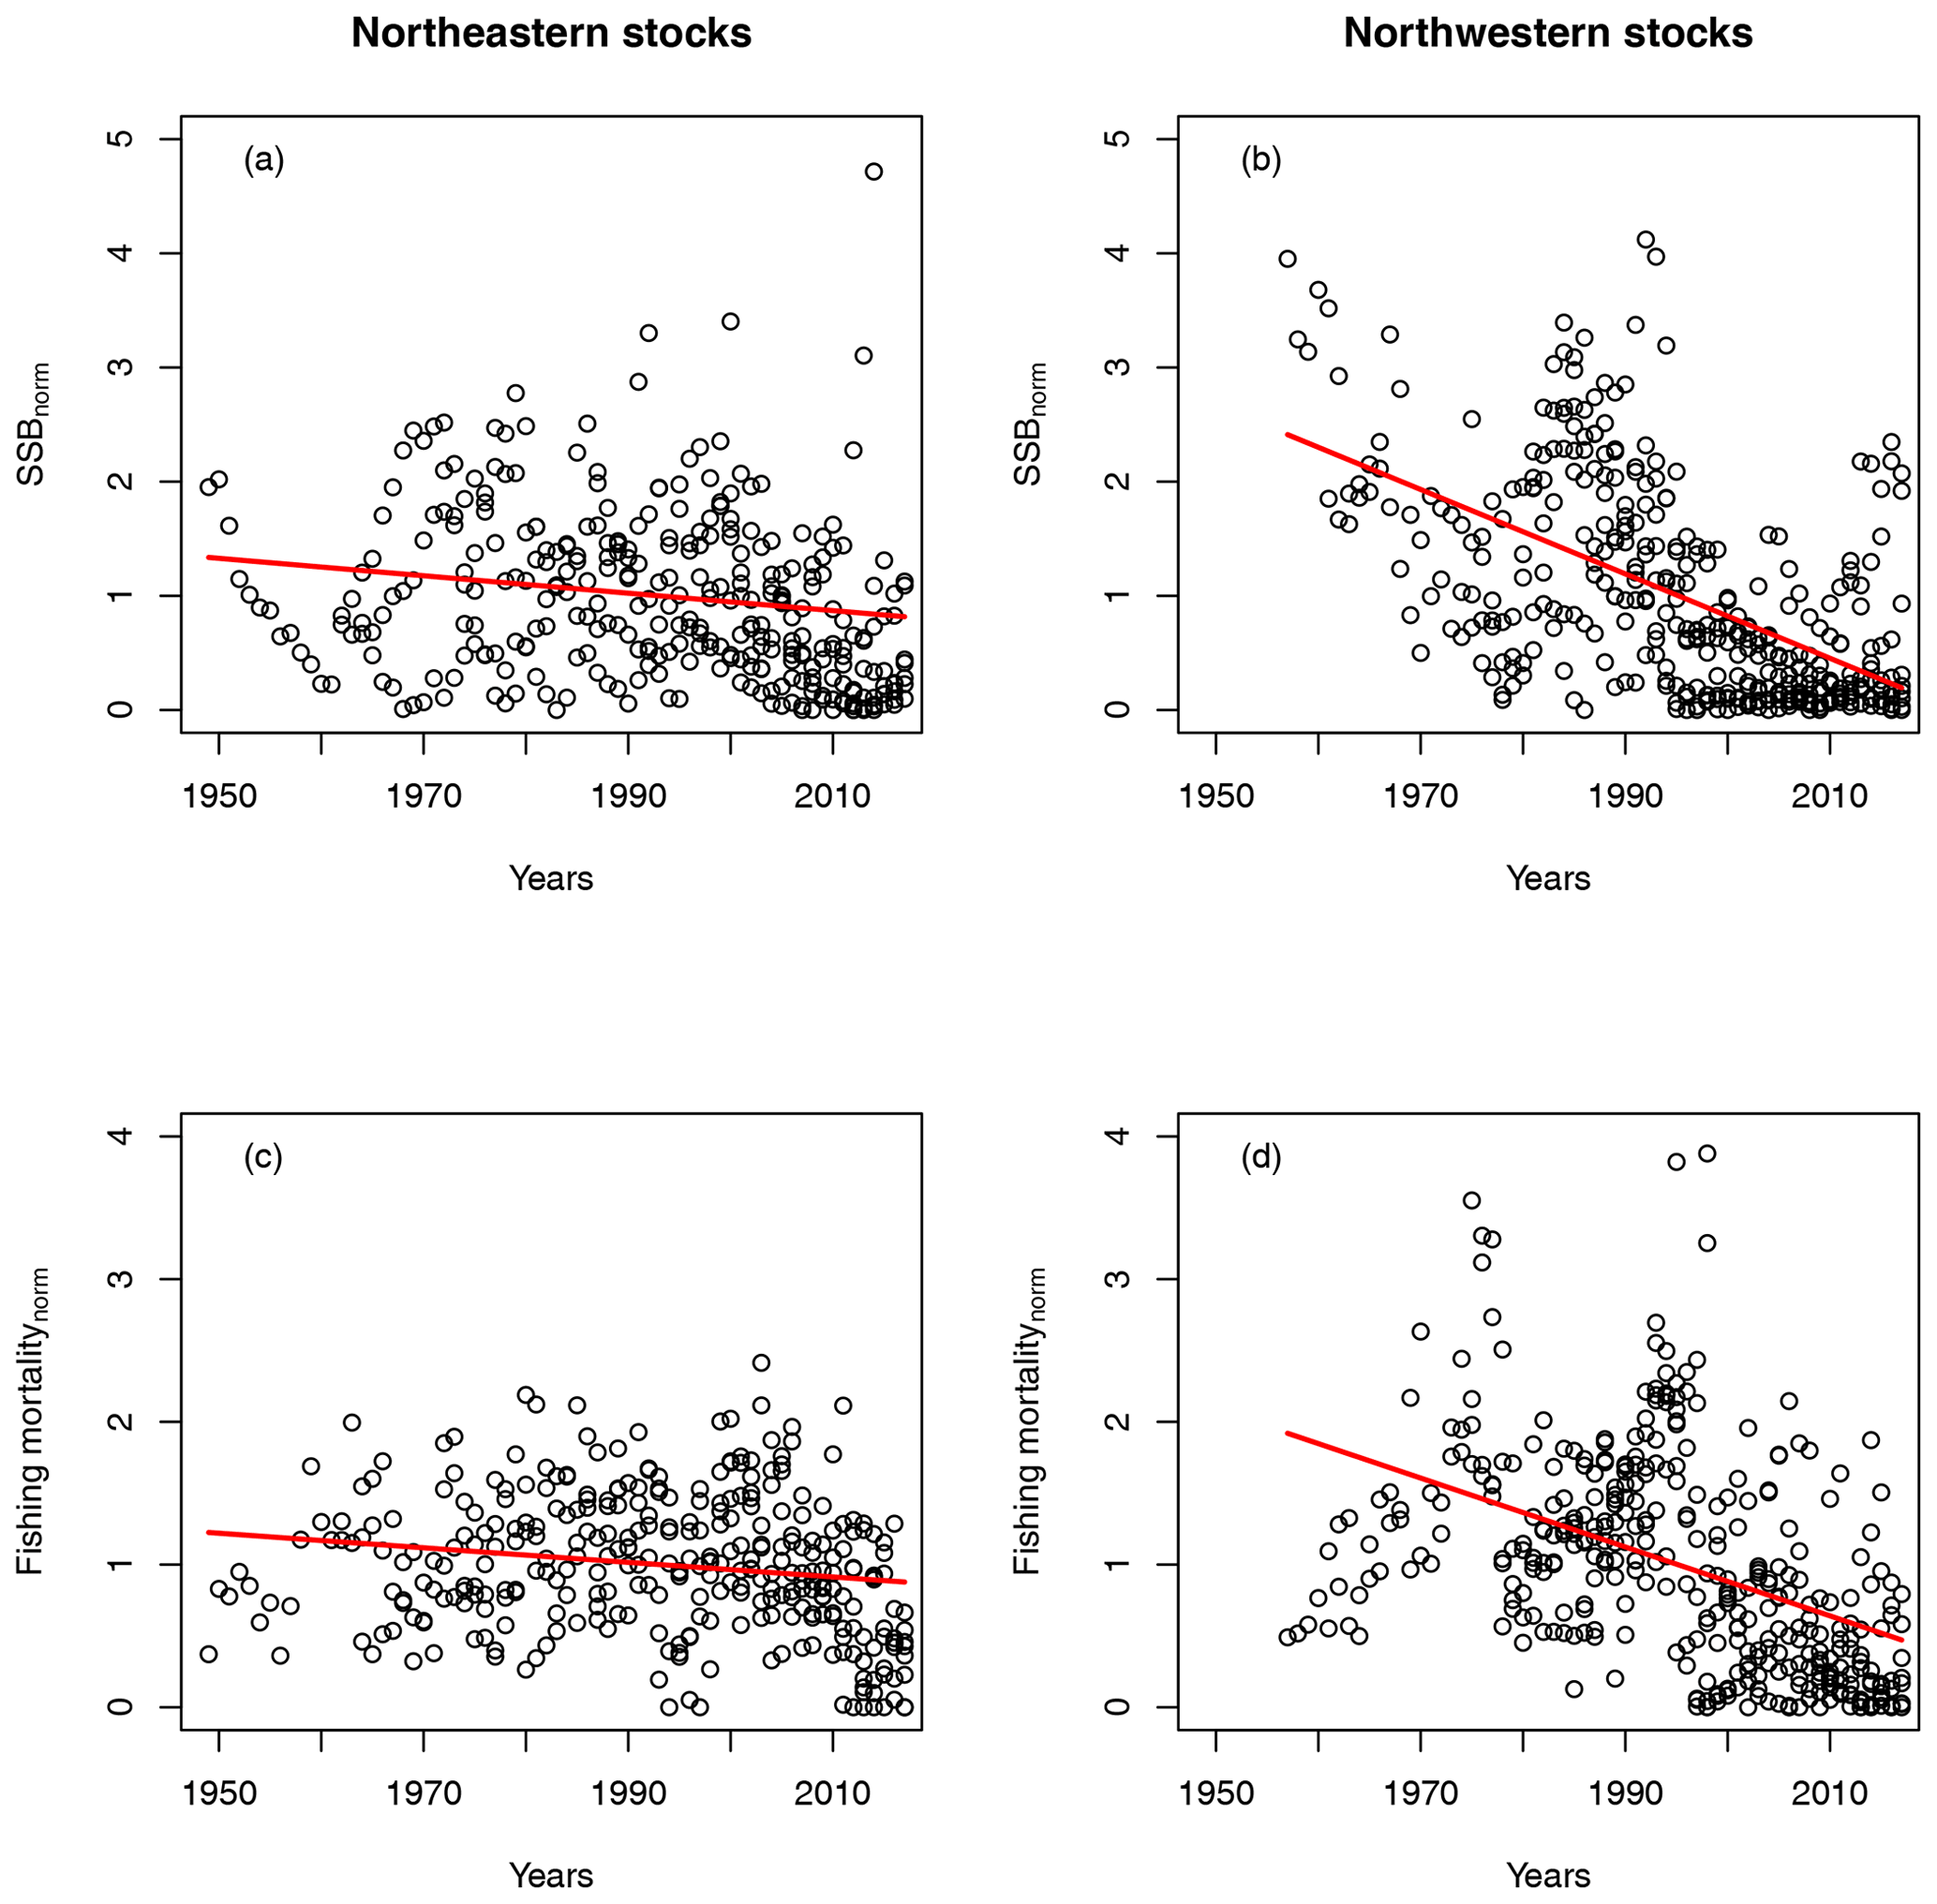
Figure B2Trends in normalized SSB and fishing mortality for northeast Atlantic cod stocks (left plots, a and c) and northwest Atlantic cod stocks (right plots, b and d).
Figure C1 shows the components of the stock-recruitment function with different parameter values.
Figure C3 shows recruitment per capita as a function of average spawning temperature. Circles show the stock-assessment data; black dots indicate the simulated data with the respective best-fit stock-recruitment model. Note that spnum is always considered. For stocks with an additional SST effect, the black line shows the SST component of the stock-recruitment function. The red marks indicate the most recent data.
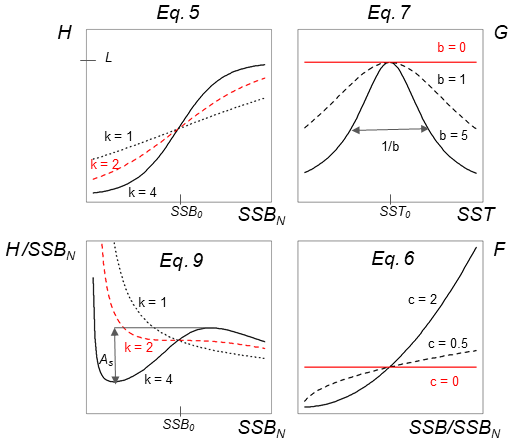
Figure C1Visualization of different equations and their parameters of the stock-recruitment function (Eqs. 5–7) and the Allee effect strength (Eq. 9).
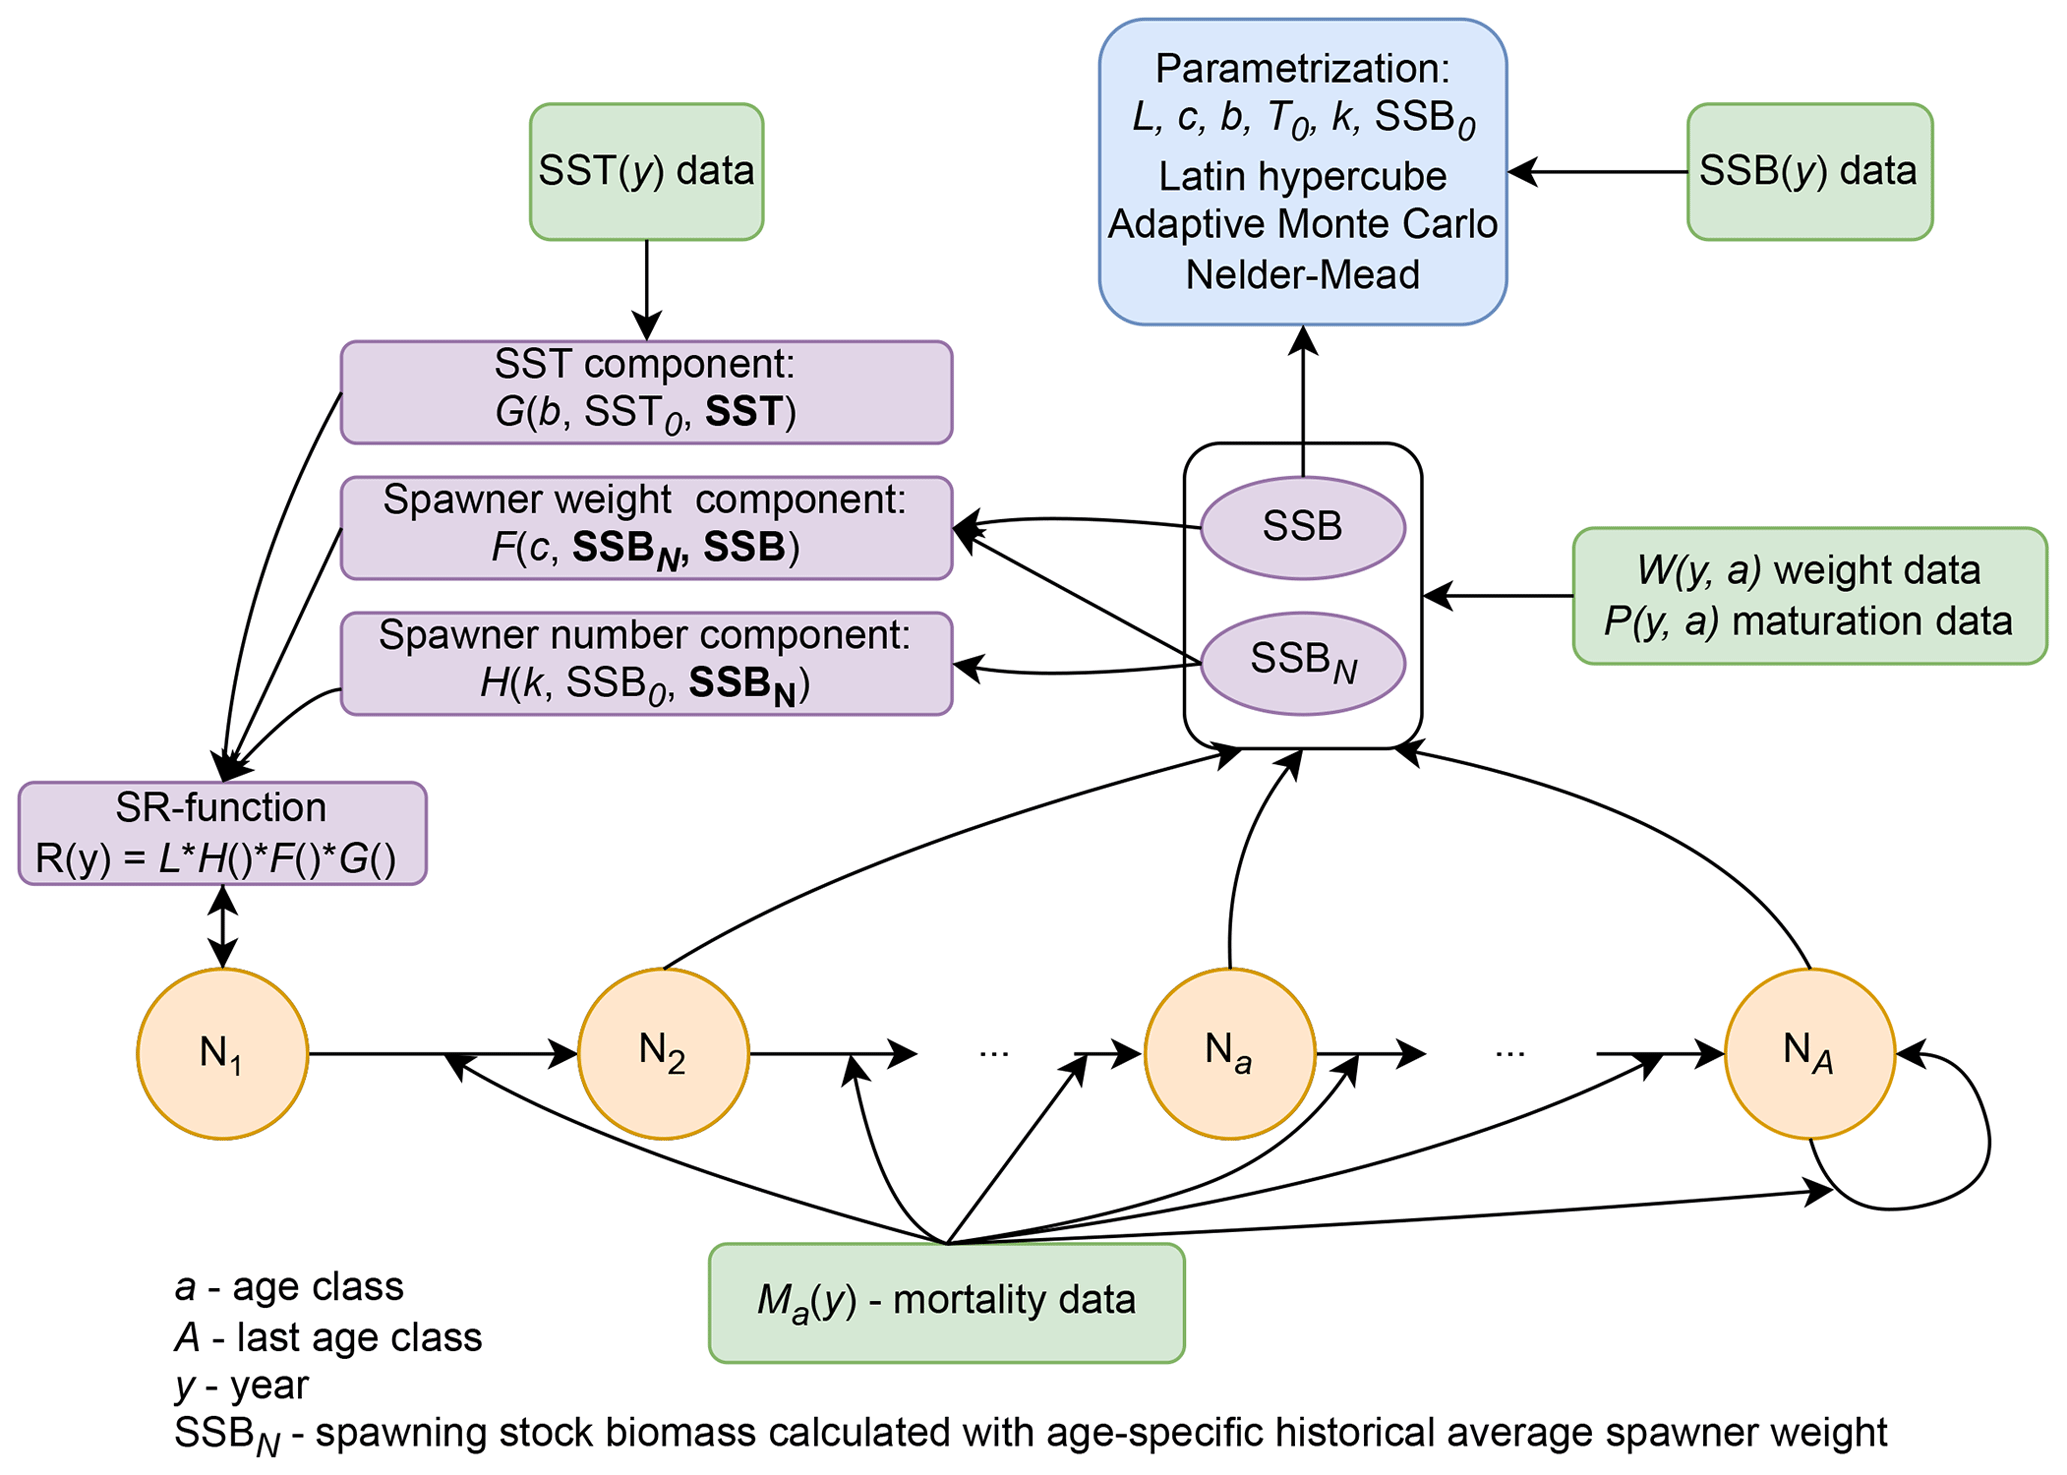
Table C1The stock-specific model coefficients fitted for each Atlantic cod stock. SST0 is the temperature optimum found.
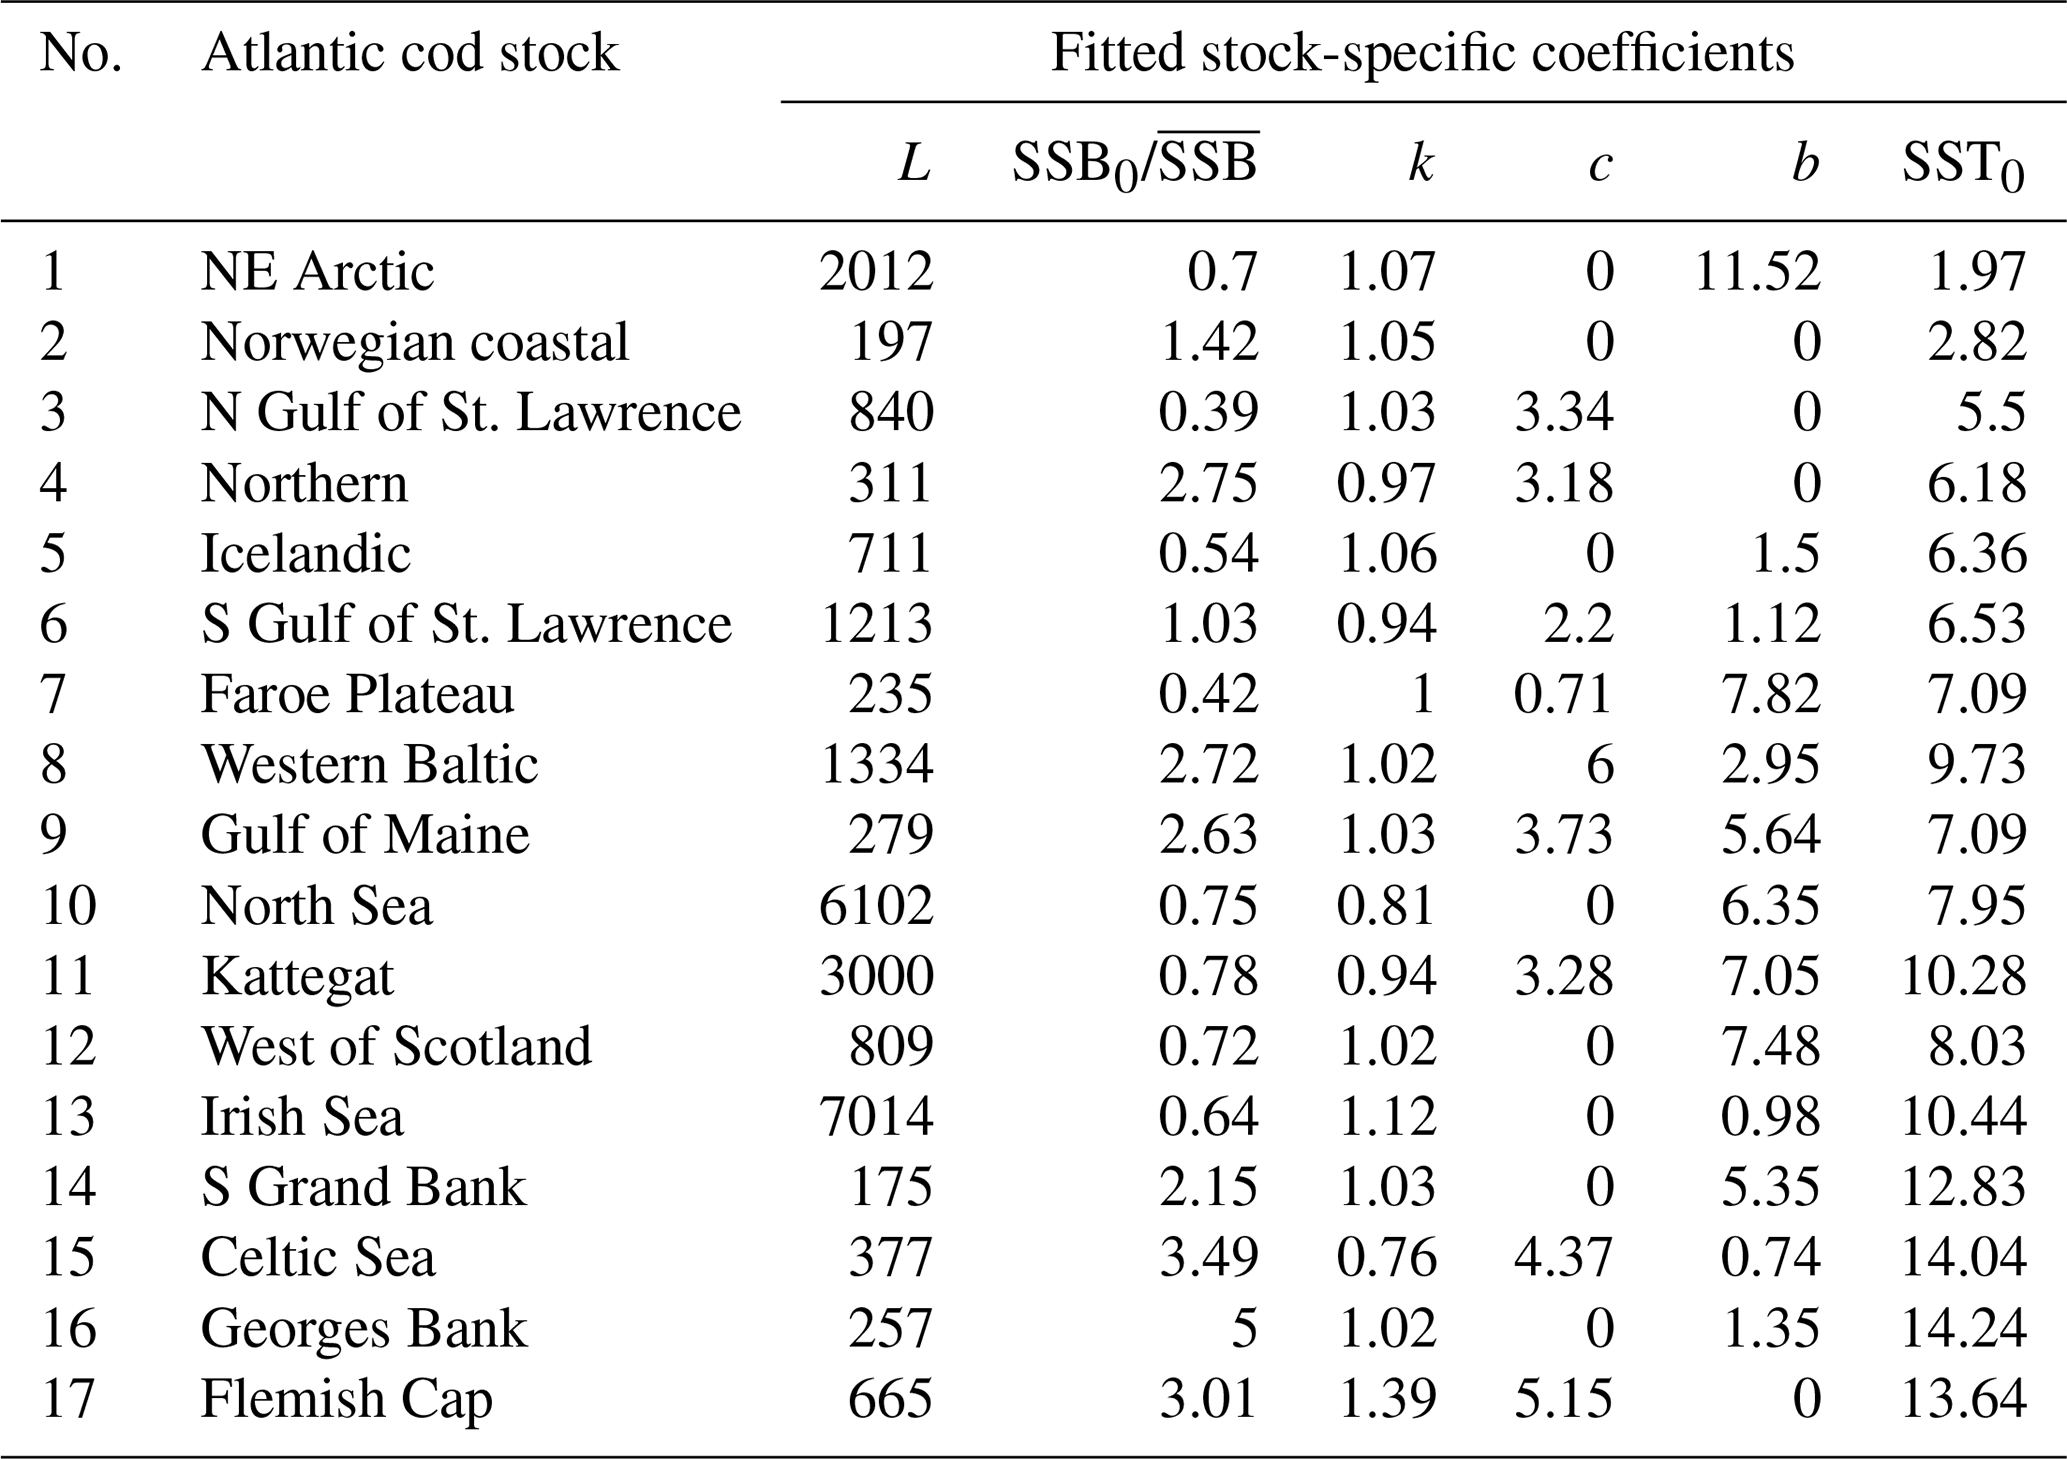
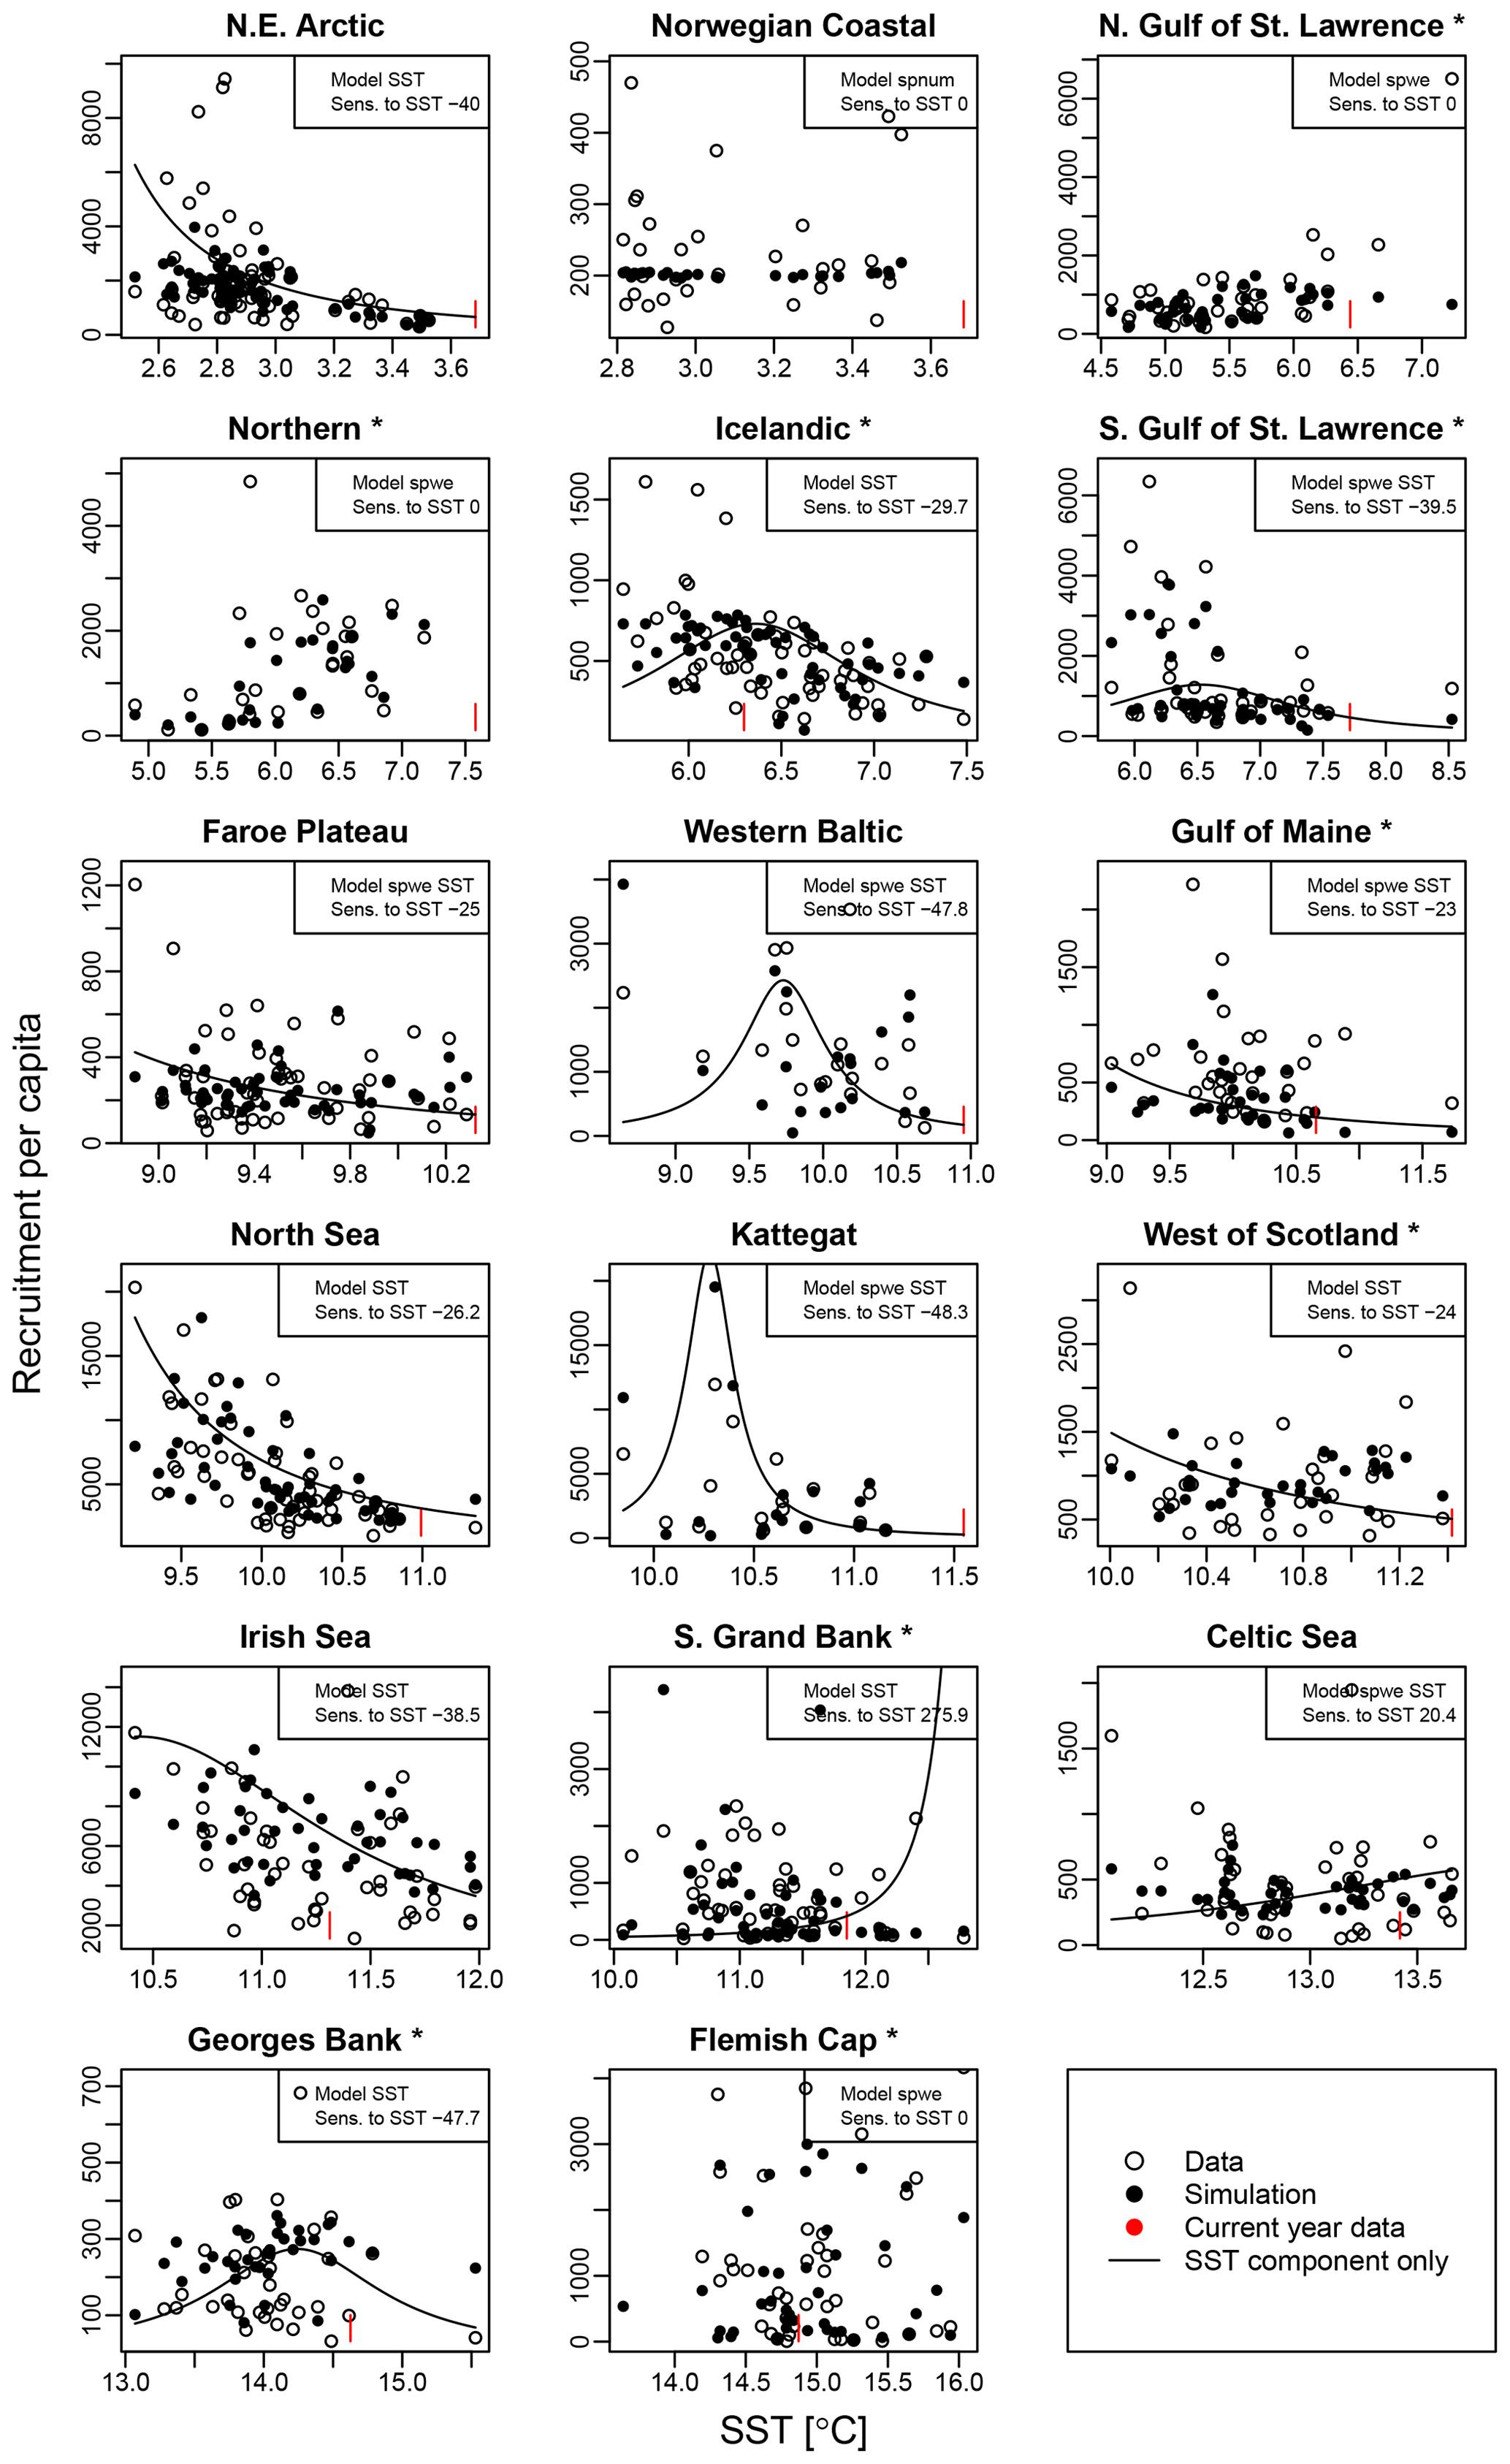
Figure C3Recruitment per capita ratios in relation to ambient SST. Asterisks mark northwest Atlantic cod stocks, while the other cod stocks are found in the northeast Atlantic. Dots show the stock-assessment data; black dots are simulated points with the best-fitted model (spnum – best model needed no other effects except spawner number; spwe – best model required spawner weight effect; SST – best model required SST effect in recruitment production function). The black line indicates the stock-recruitment function with the SST function component only. The red mark indicates the most recent SST data point.
The stock-specific coefficients L, c, b, T0, k, and SSB0 (the Allee effect threshold, Table 1 in main text) were found by an optimization procedure, fitting time series of SSB. The system of equations (Eqs. 1–8) was solved with the goal of obtaining a time series of SSB, here called SSBmodel, which maximizes the match with the SSB time series of stock-assessment data, here called SSBdata. We chose SSBdata for parametrization, because of the smaller 95 % confidential interval of SSBdata (reported as SSBlow and SSBhigh in stock-assessment reports) compared to those reported for recruitment data. The 95 % confidential interval was interpreted as data uncertainty and considered in Eq. (D1) as . For stocks without a reported confidence interval, the average uncertainty value among all stocks and years was used. The log-likelihood function used for optimization is given by
with ymax describing the maximum length of the time series (Appendix B, Table B1). Our goal was to find which combinations of the stock-recruitment components, spnum, spwe and/or SST, minimize the divergence from the stock-assessment SSB time series, while choosing spnum as the basis. Stock-assessment SSB was treated as raw observed data, even though it is a result of a stock-assessment model with its respective model assumptions.
As a first step of the optimization procedure the model was calculated using 5000 Latin hypercube samples. Latin hypercube sampling ranges for the parameters of the proposed stock-recruitment function were chosen wide enough to capture the observed range of stock-specific values (: 0–2; : 0–5; k ⋅ SSB0: 0–10; c: 0–6; b: 0–3 ∘C; T0: 0–15 ∘C), so that maximum likelihood was not near the cube surface. All hypercube samples were used to create initial probability density functions for the Monte Carlo simulations.
The model parameter range was divided into a set of 200 bins, where within each bin a sampling probability ρi was assigned based on maximum log-likelihood q from subset of samples with a given parameter inside the bin: ρi = , where q0 is the normalization parameter equal to the minimum log-likelihood of the currently best 200 samples. Such a dynamical adjustment of sampling probability allowed us to avoid probability functions that were too sharp, while drastically increasing the performance compared to a uniformly sampled Monte Carlo simulation. The sampling probability was updated every 5000 samples. Model parameters were sampled independently according to the probability values for each bin.
The 10 most likely parameter combinations from the Monte Carlo run were used as initial values for the Nelder–Mead algorithm to find a local minimum of the log-likelihood function. In the simulations of the log-likelihood function, Eq. (D1), the initial cod population abundance in each stock was optimized instead of taking it from the first year of data time series, because of the high uncertainty usually associated with the first assessment year. Thus, initial conditions for the simulation were calculated using the age structure from the first assessment year multiplied by the adjustment factor. For each stock, the optimization procedure was carried out in four sets: spawner abundance only – fitting L, k and SSB0; abundance and spawner weight – fitting L, c, k and SSB0; abundance and SST – fitting L, b, T0, k and SSB0; and abundance, spawner weight and SST – fitting L, c, b, T0, k and SSB0. Model performance with the different stock-recruitment effects was compared via model fitting errors (RMSLE) and the Akaike information criterion, , where n is time series length and m is the number of parameters fitted. Dividing AIC by n allows for the comparison of model estimates for different time series lengths, as well as different parameter set sizes in the generic models within a stock. Table D1 shows the best model.
Figures D1–D3 show the comparison between the simulated estimates based on the respective best-fit stock-recruitment function and the stock-assessment data.
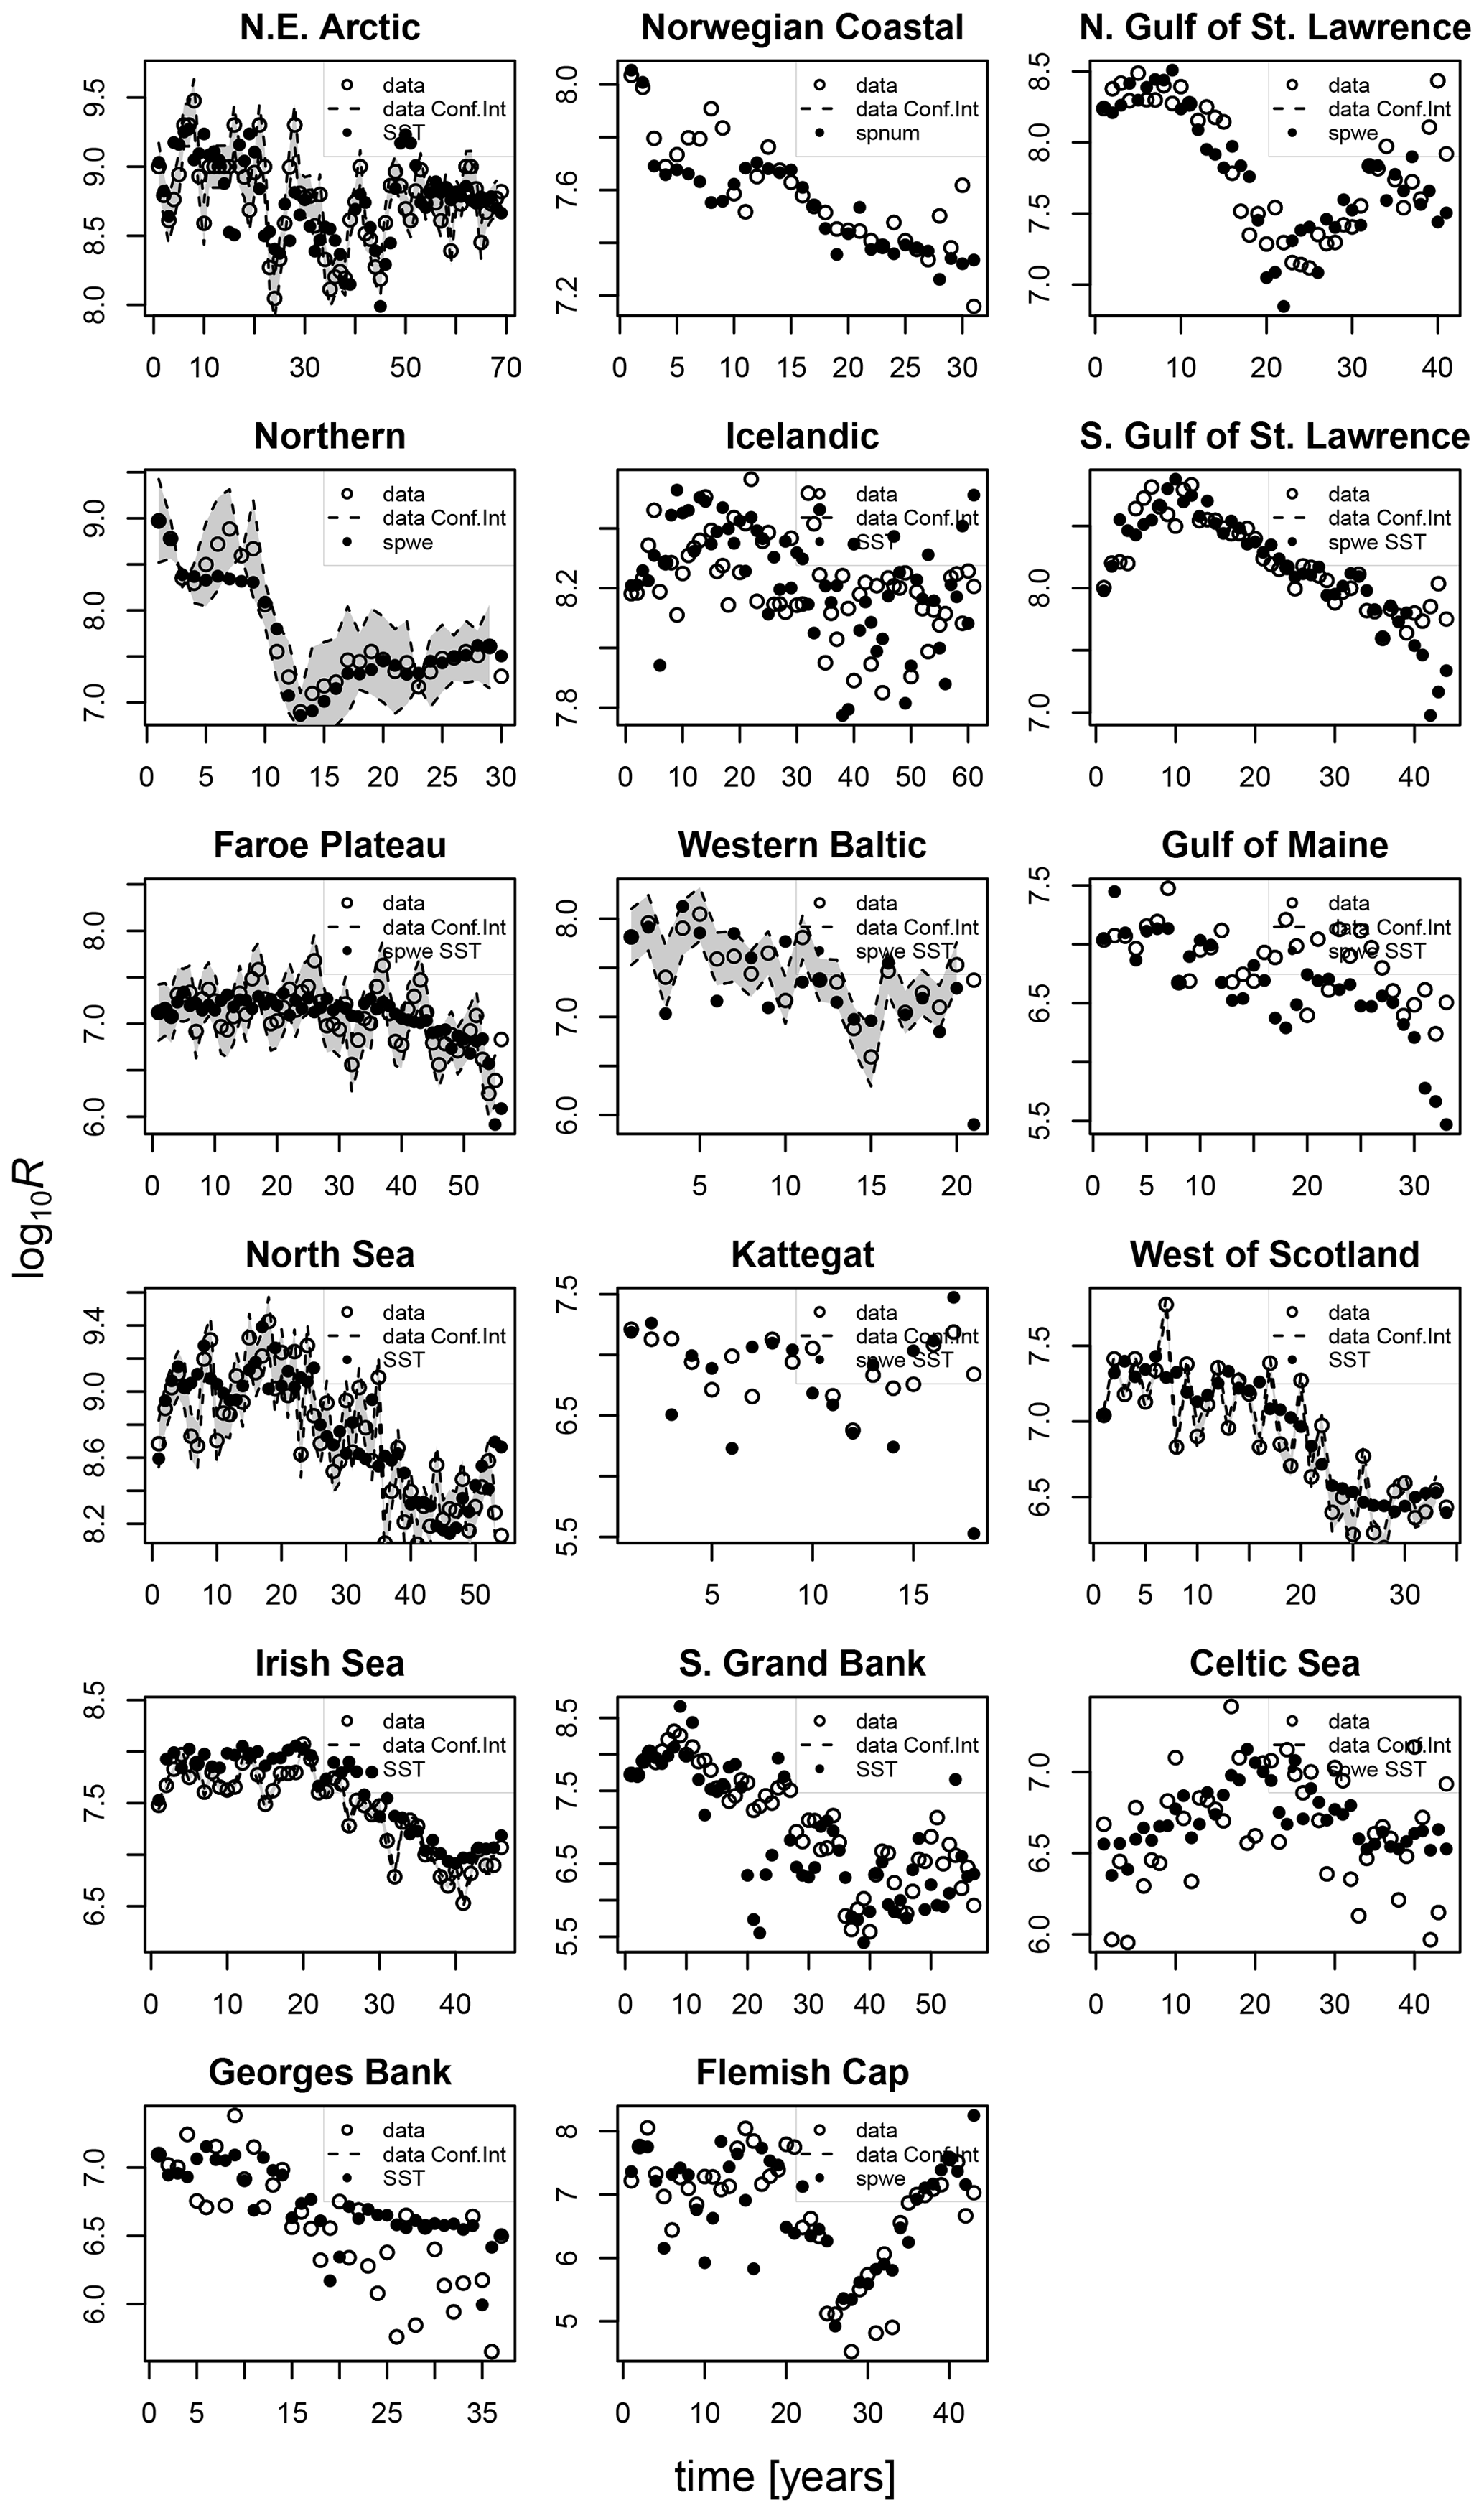
Figure D1Comparison of the simulated recruitment data points (black dots) with the best-fit stock-recruitment model (spnum – best model needed no other effects except spawner number; spwe – best model required spawner weight effect; SST – best model required SST effect in recruitment production function) and the stock-assessment data (circles). Where available, the 95 % confidence interval of the stock-assessment data is shown in grey.
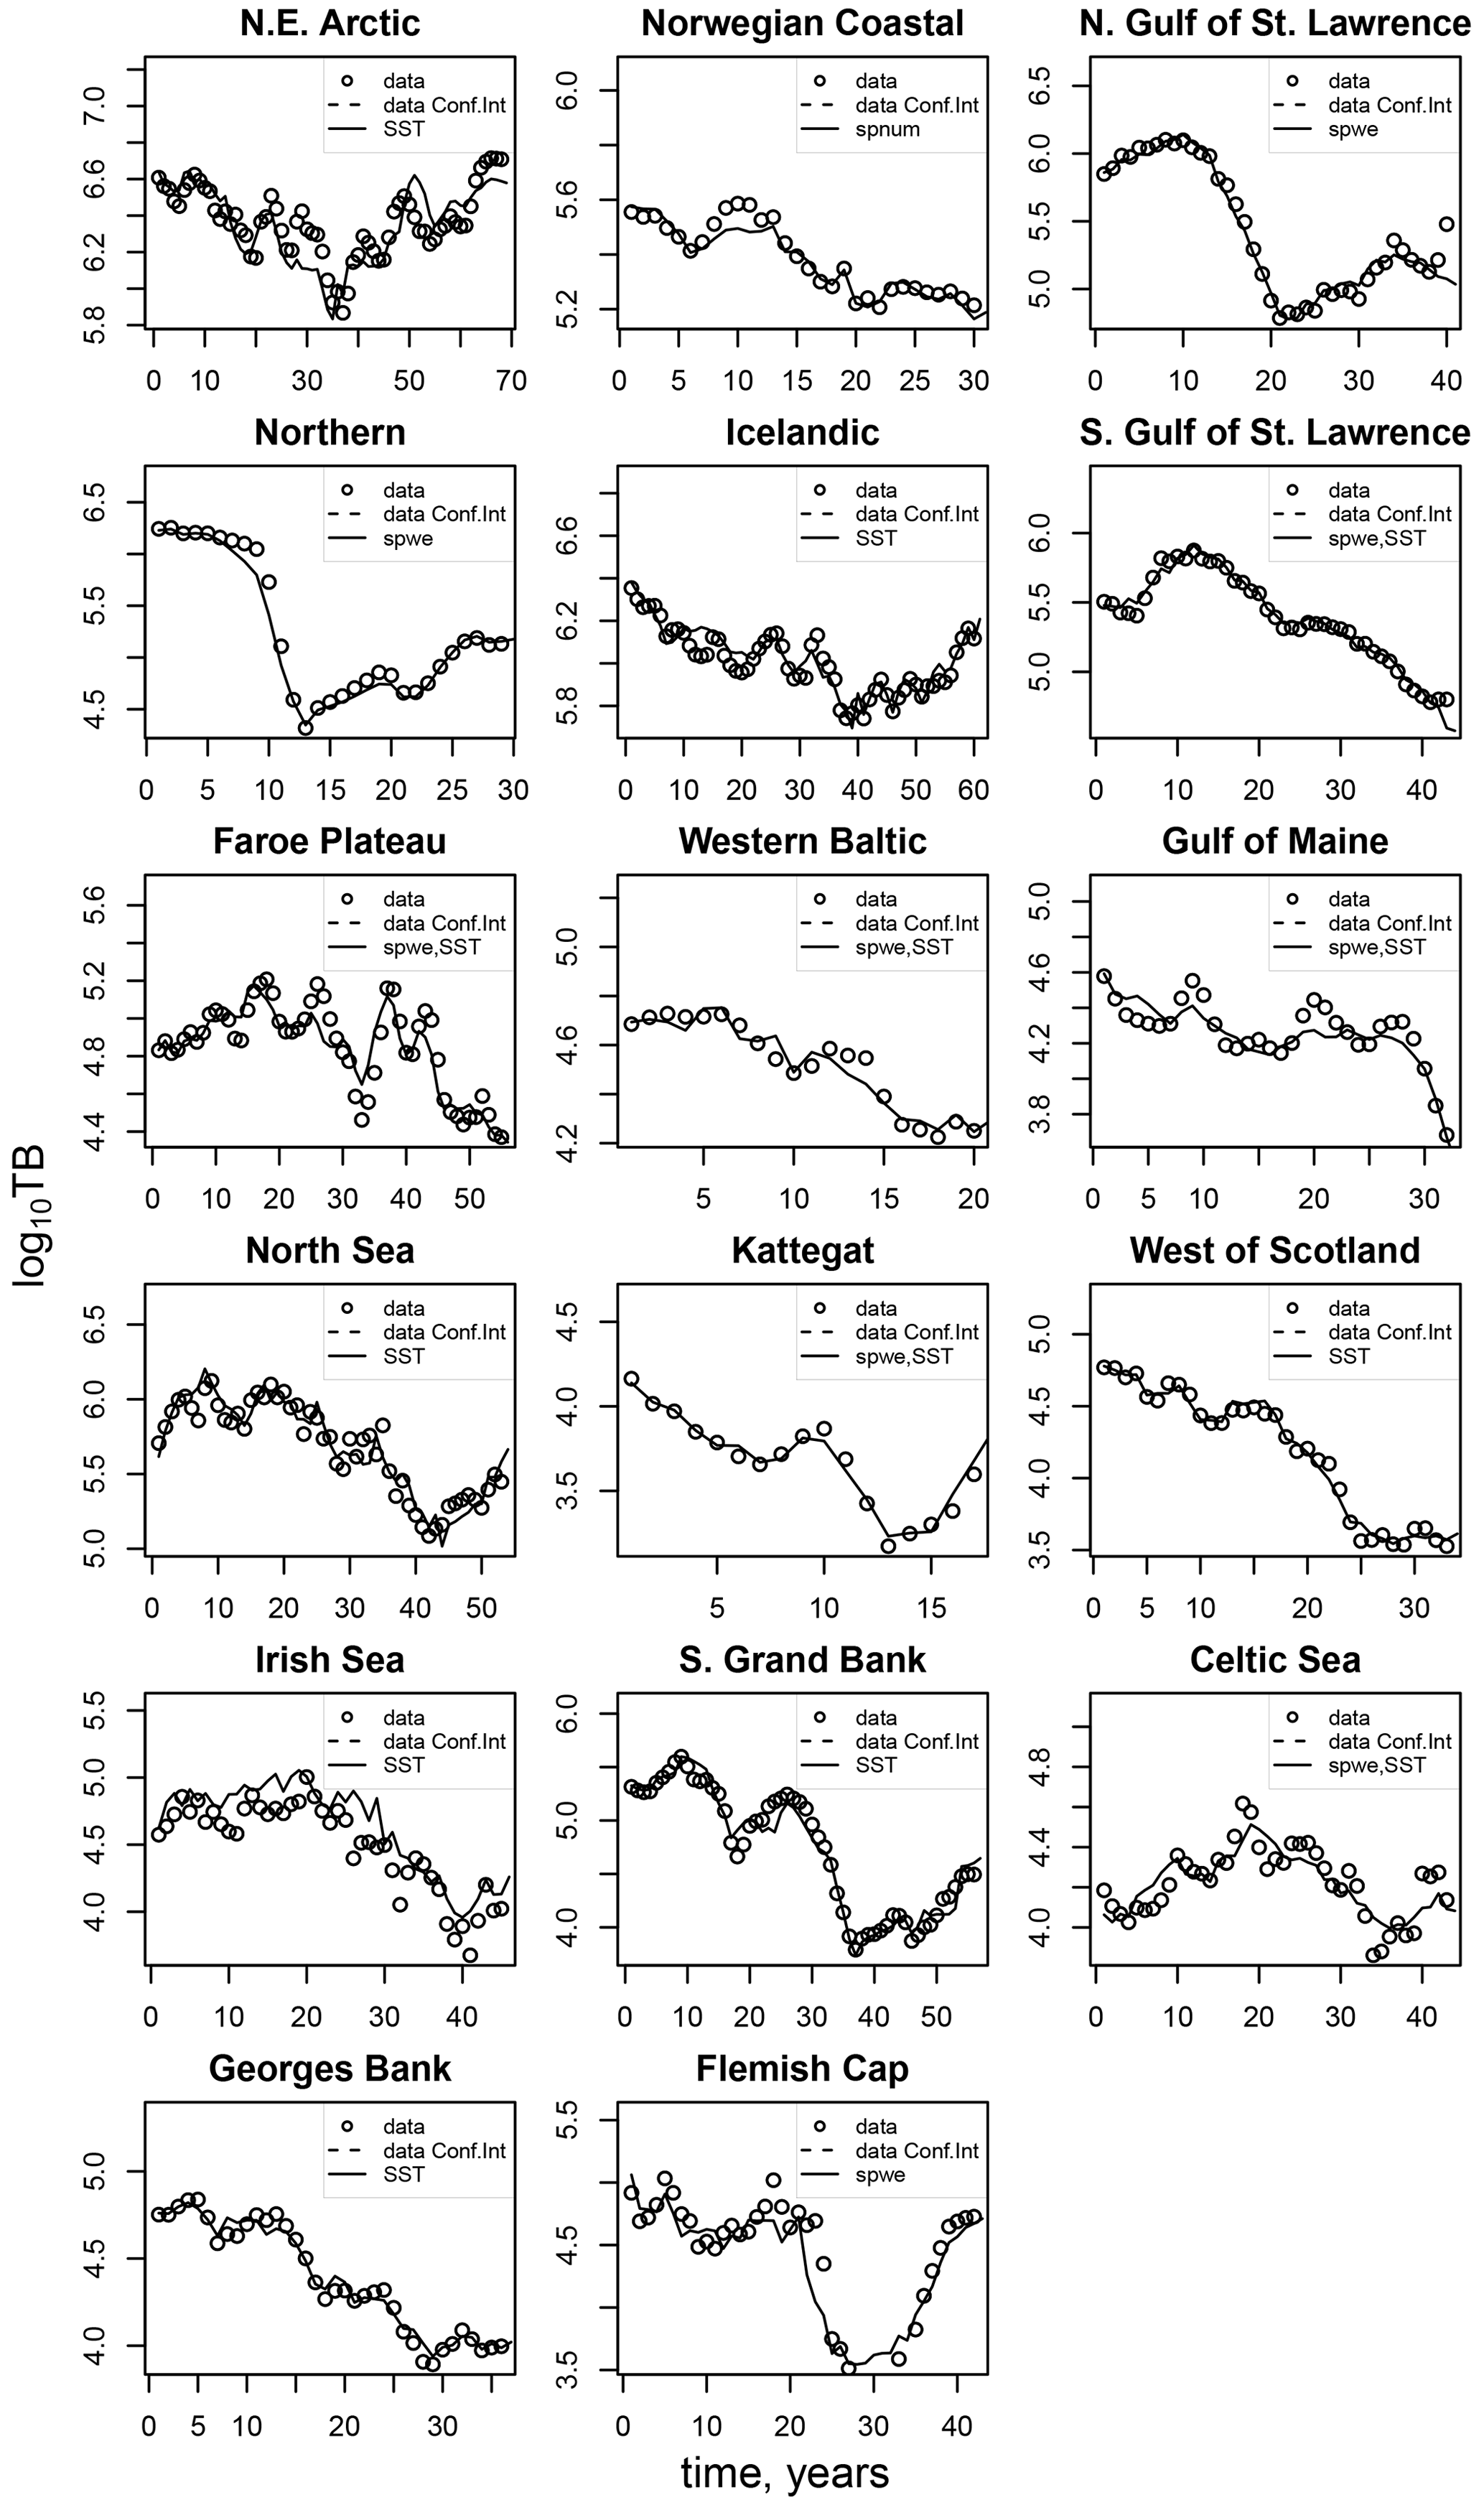
Figure D2Comparison of the simulated total biomass (TB) data points (black dots) with the best-fit stock-recruitment model and the stock-assessment data (circles).
Table D1Comparison of the model fitting errors (RMSLE) and Akaike information criteria (AIC) for the model which includes (1) basic demographic component (spnum) in combination with (2) spawner weight (spwe) and (3) SST component or both. The model component of the best model is shown in the right column.
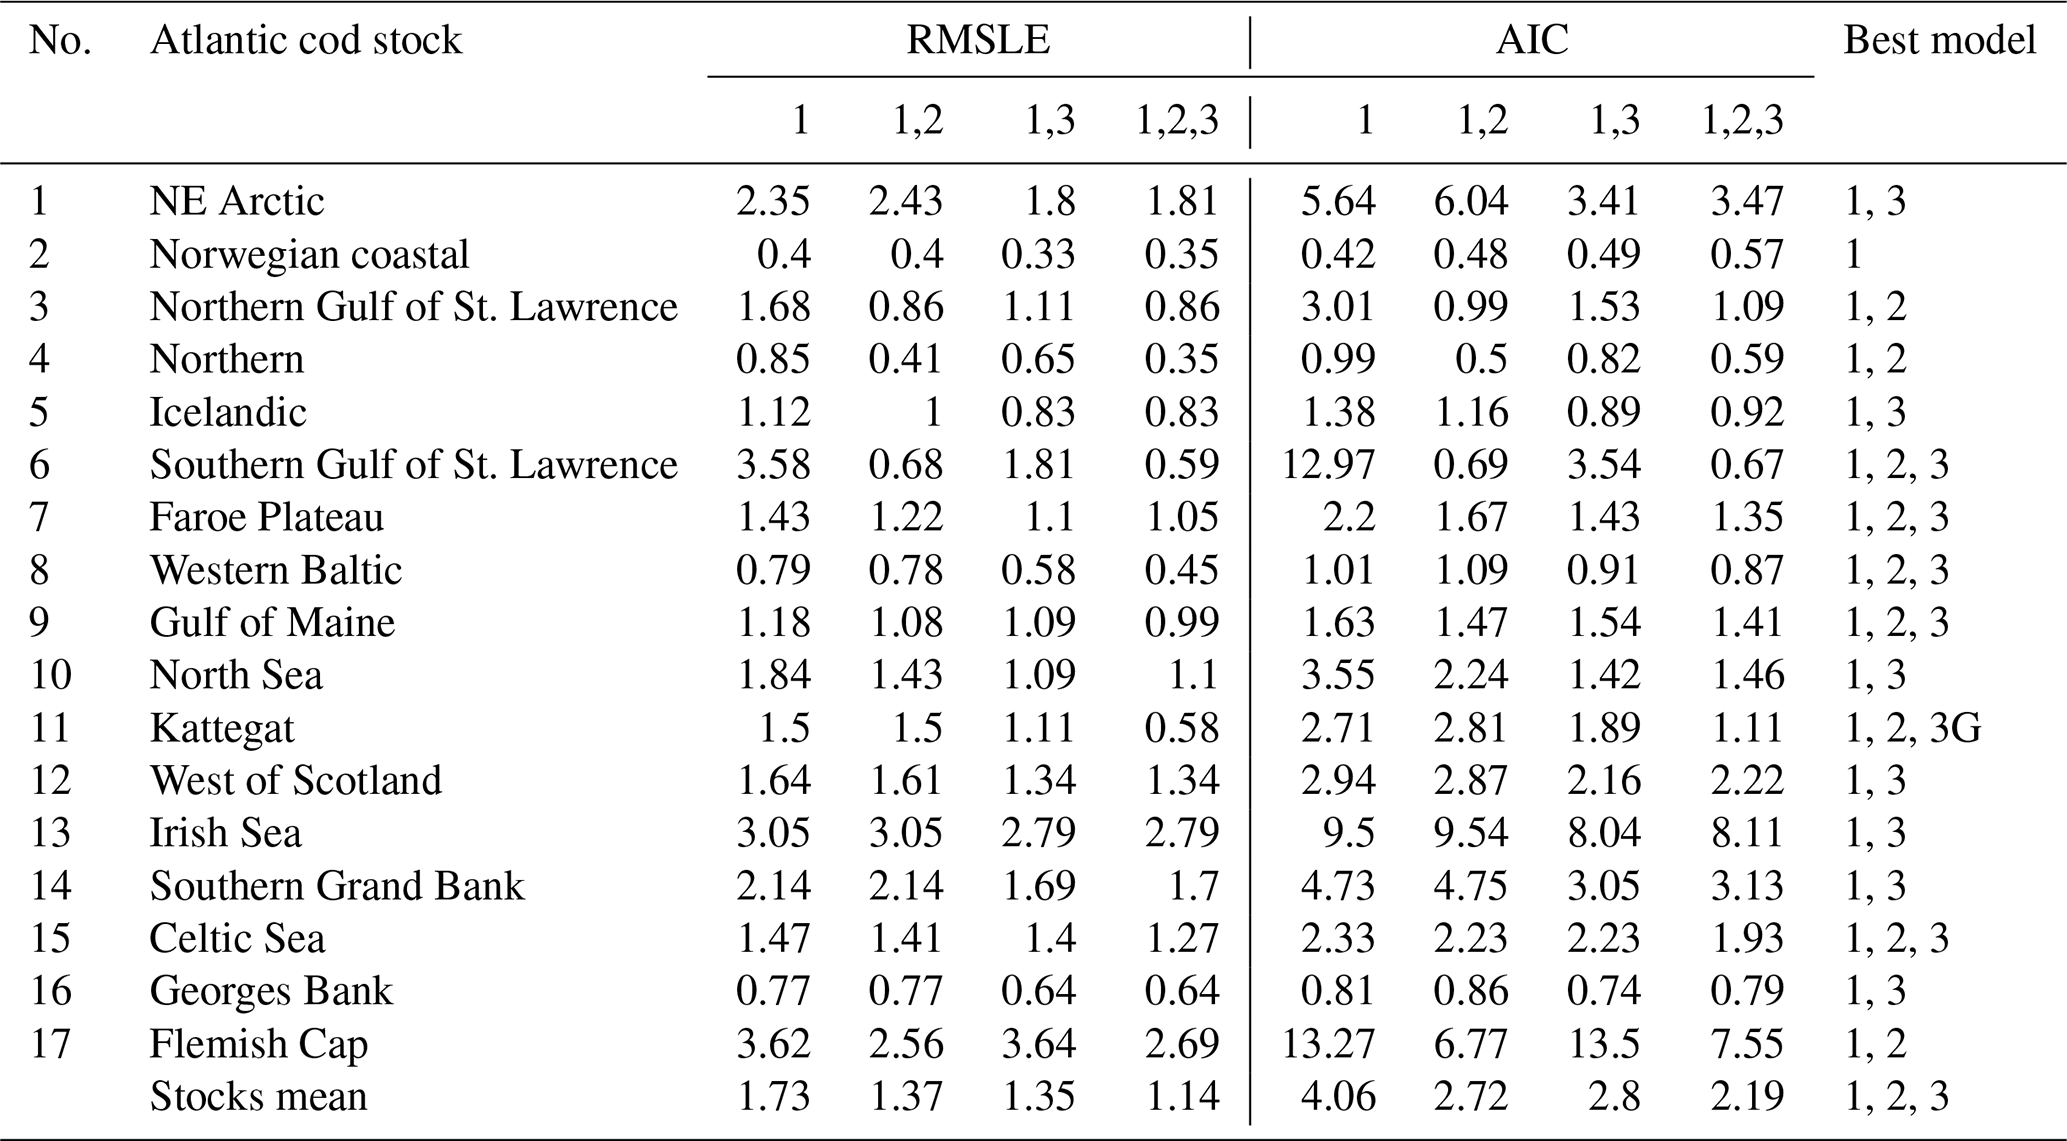
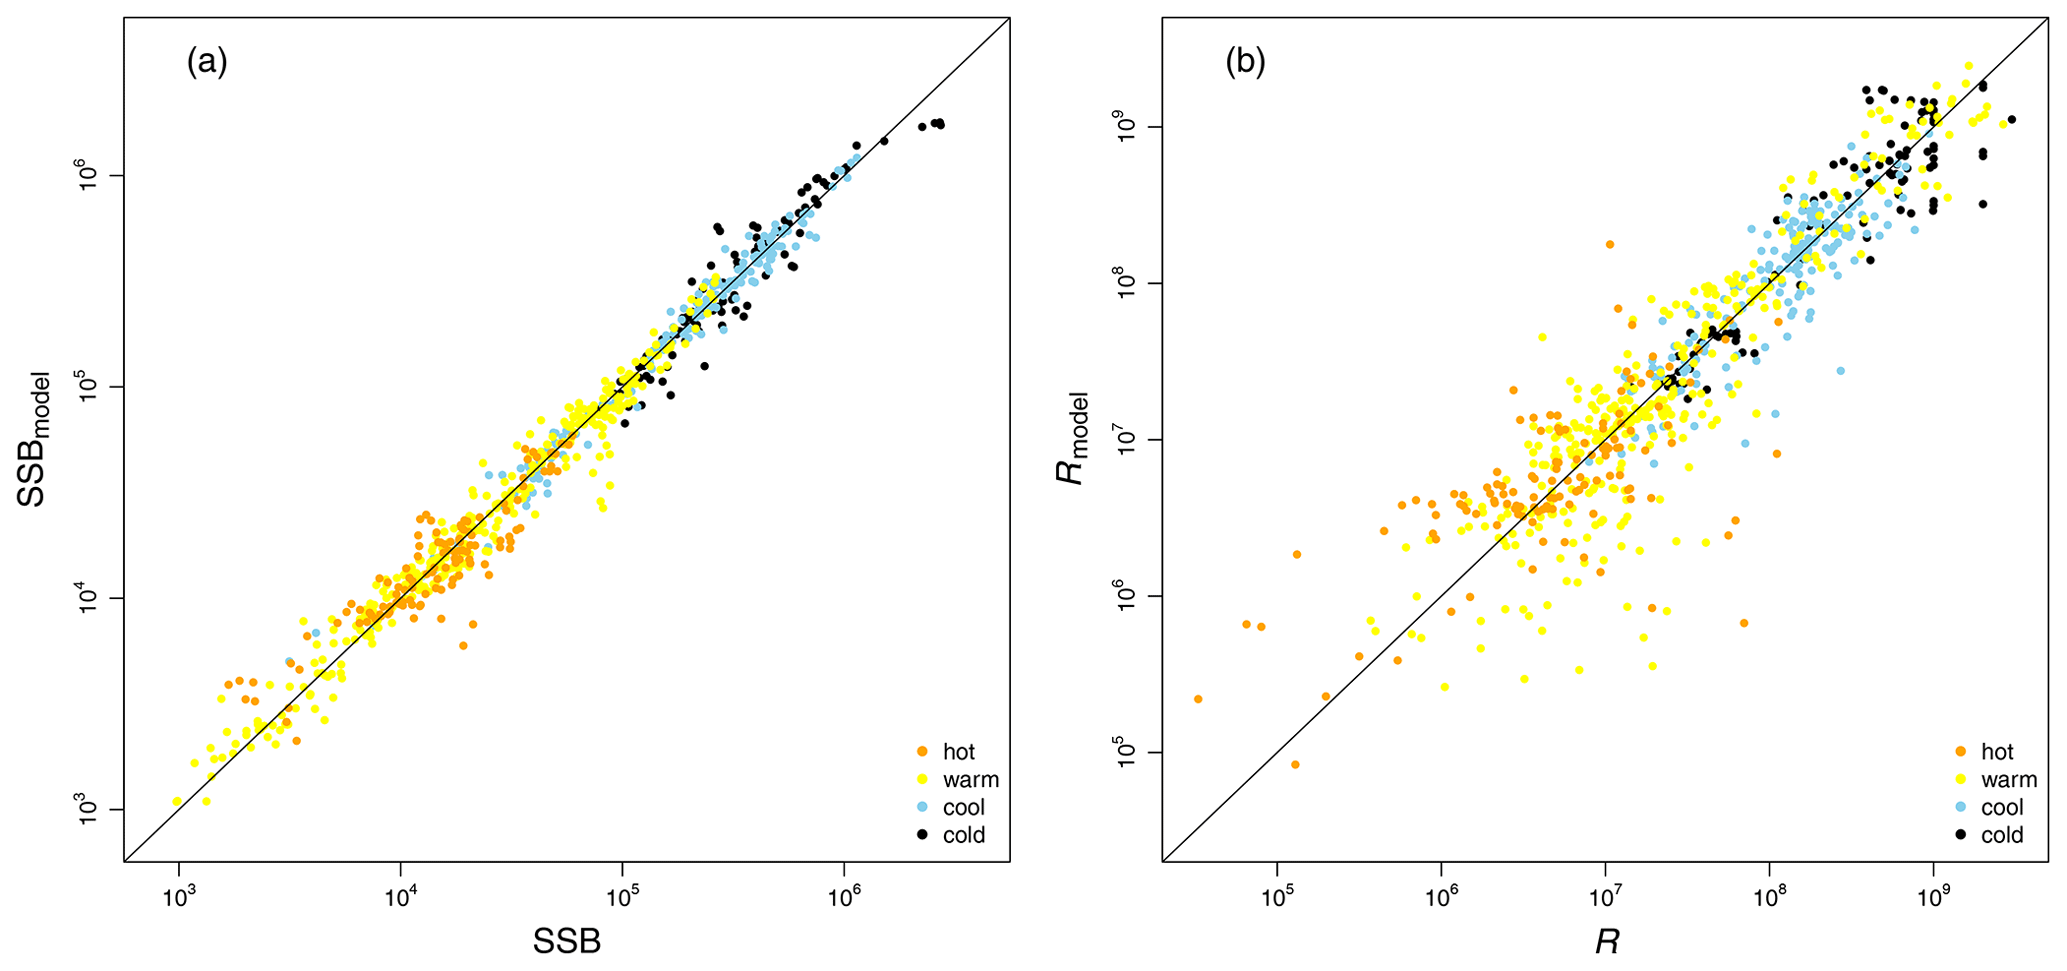
Figure D3Comparison between simulated estimates (y axis) for spawning stock biomass (SSB) (a) and recruitment (R) (b) and the stock-assessment data (x axis). Colors indicate the grouping according to ambient water temperature (Fig. A2).
Appendix E contains different stacked plots from stock-assessment data. Figure E1 shows how body weight deviated from average over time within each Atlantic cod stock and age class.
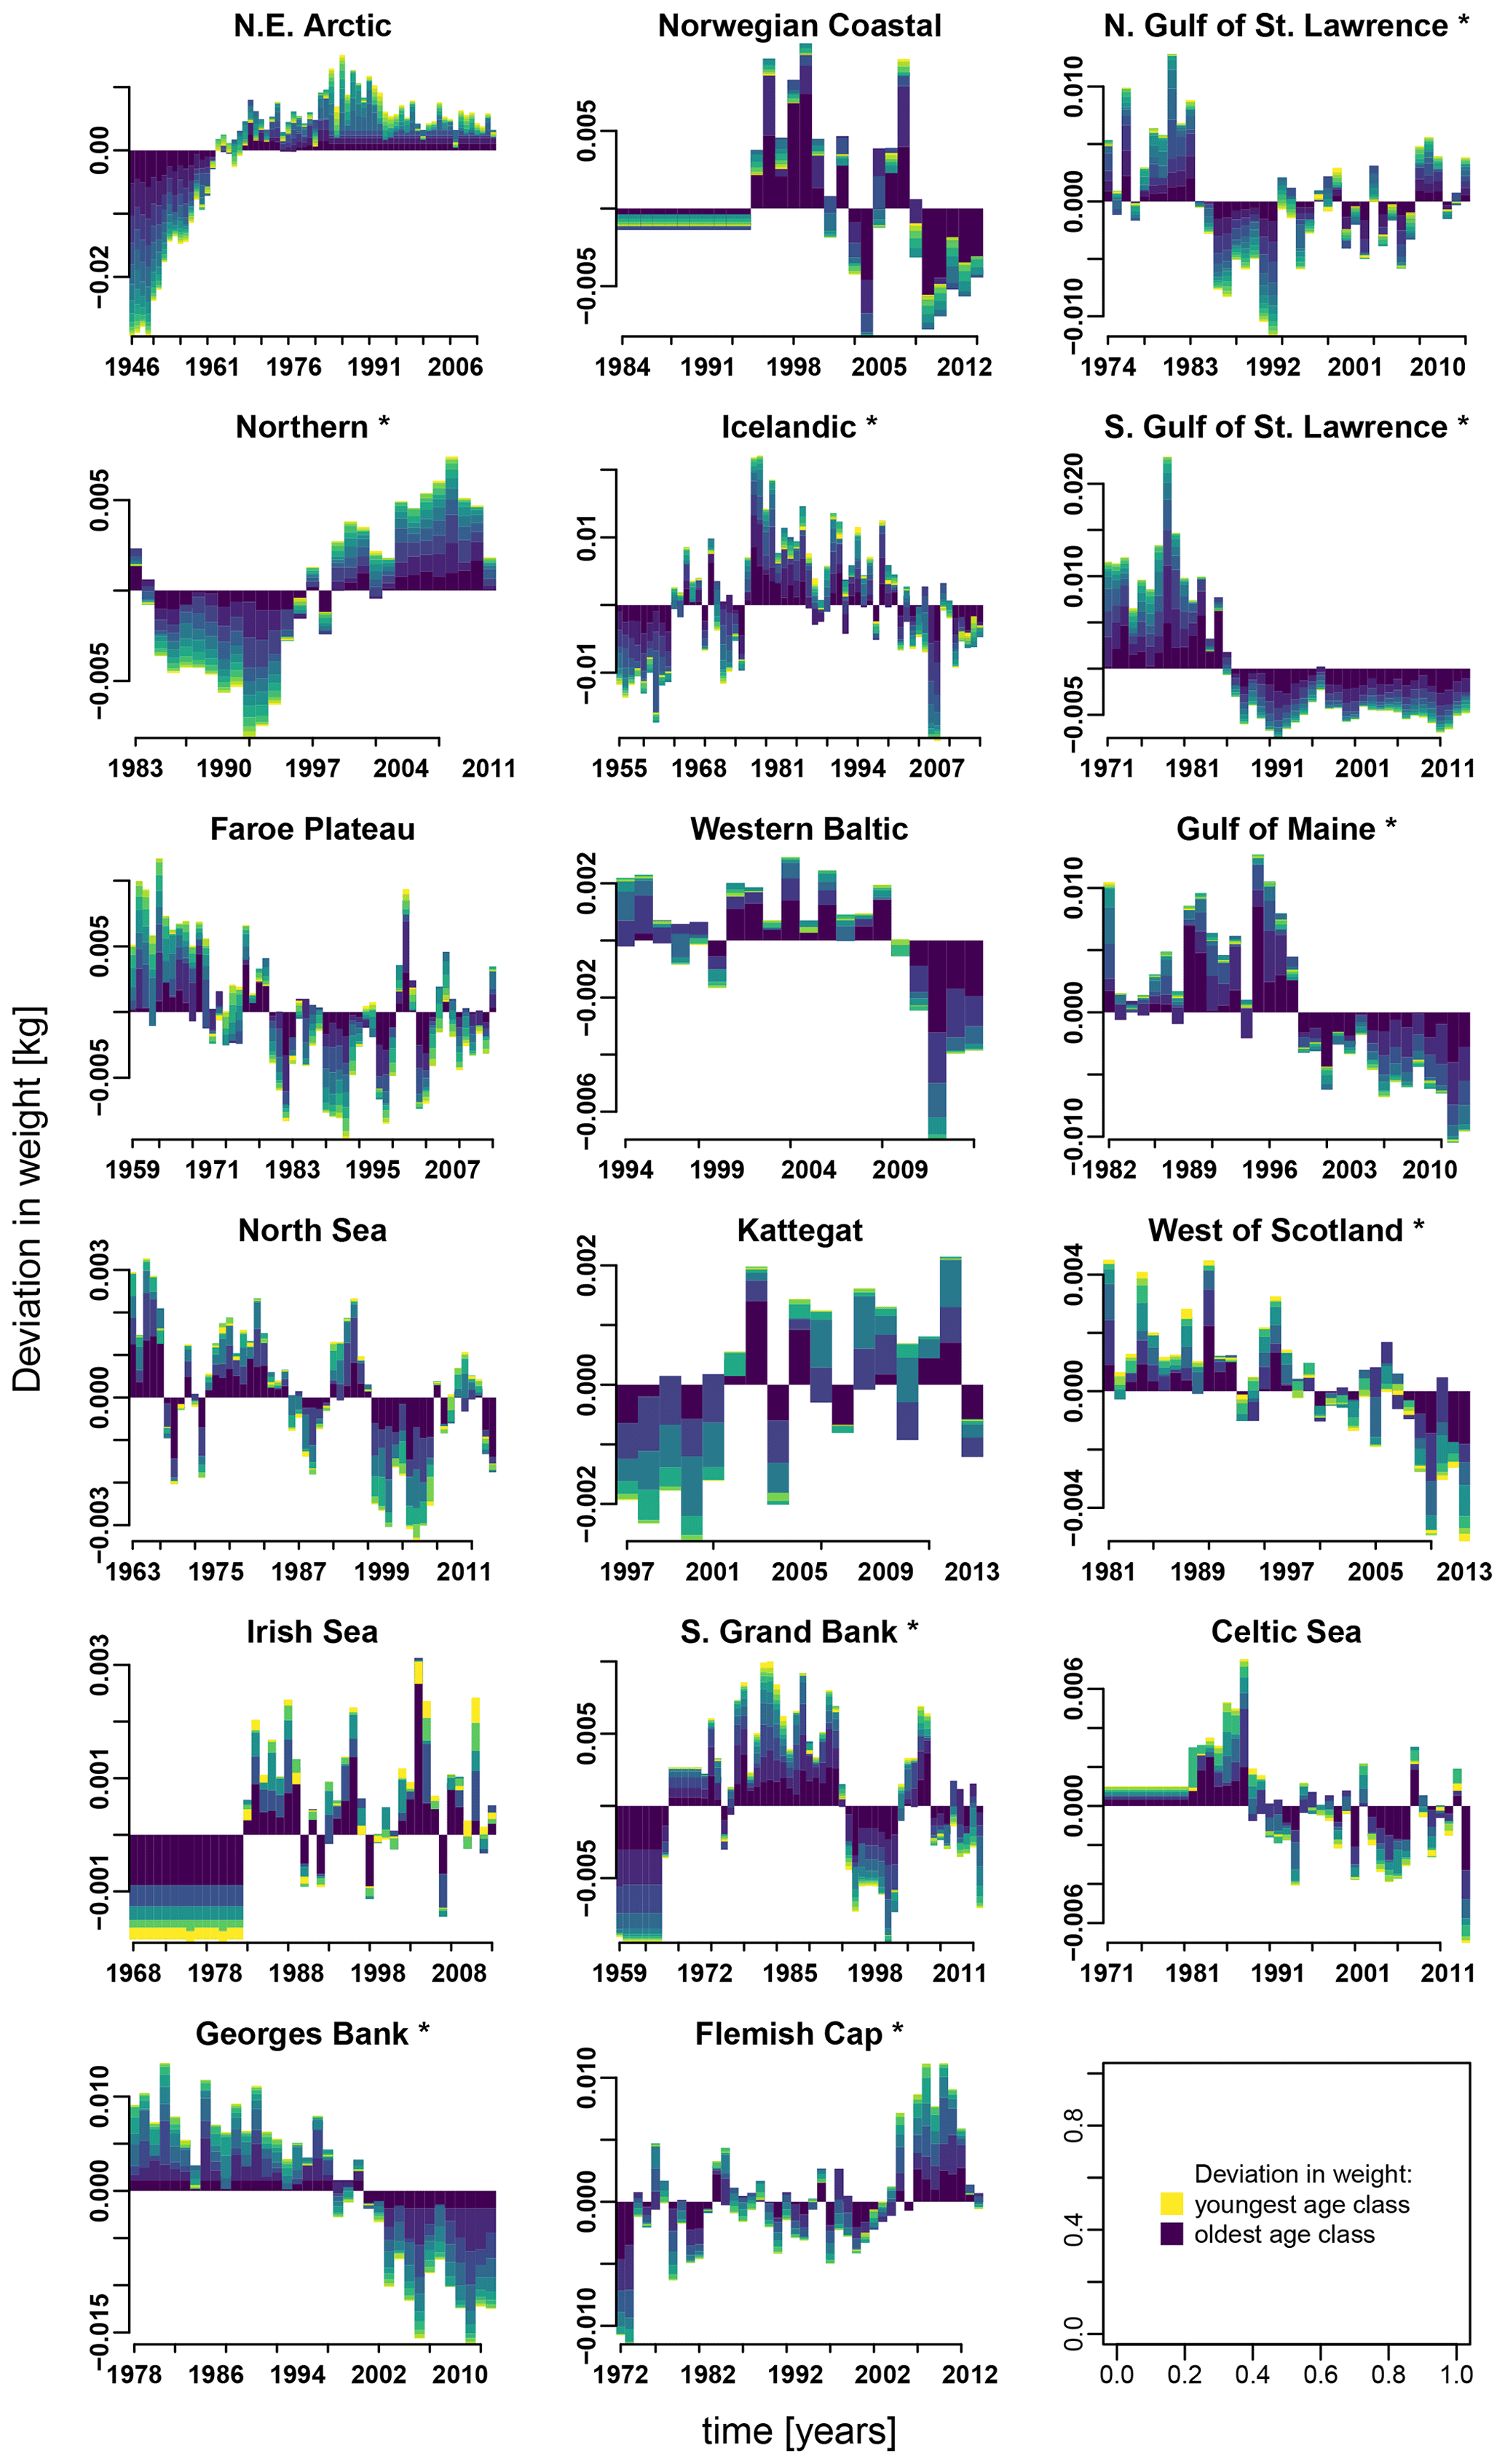
Figure E1Change in body weight relative to mean weight, for each age class according to stock-assessment data. Asterisks mark northwest Atlantic cod stocks, while the other cod stocks are found in the northeast Atlantic. Different colors indicate the different age classes (yellow: youngest age class; dark blue: oldest age class).
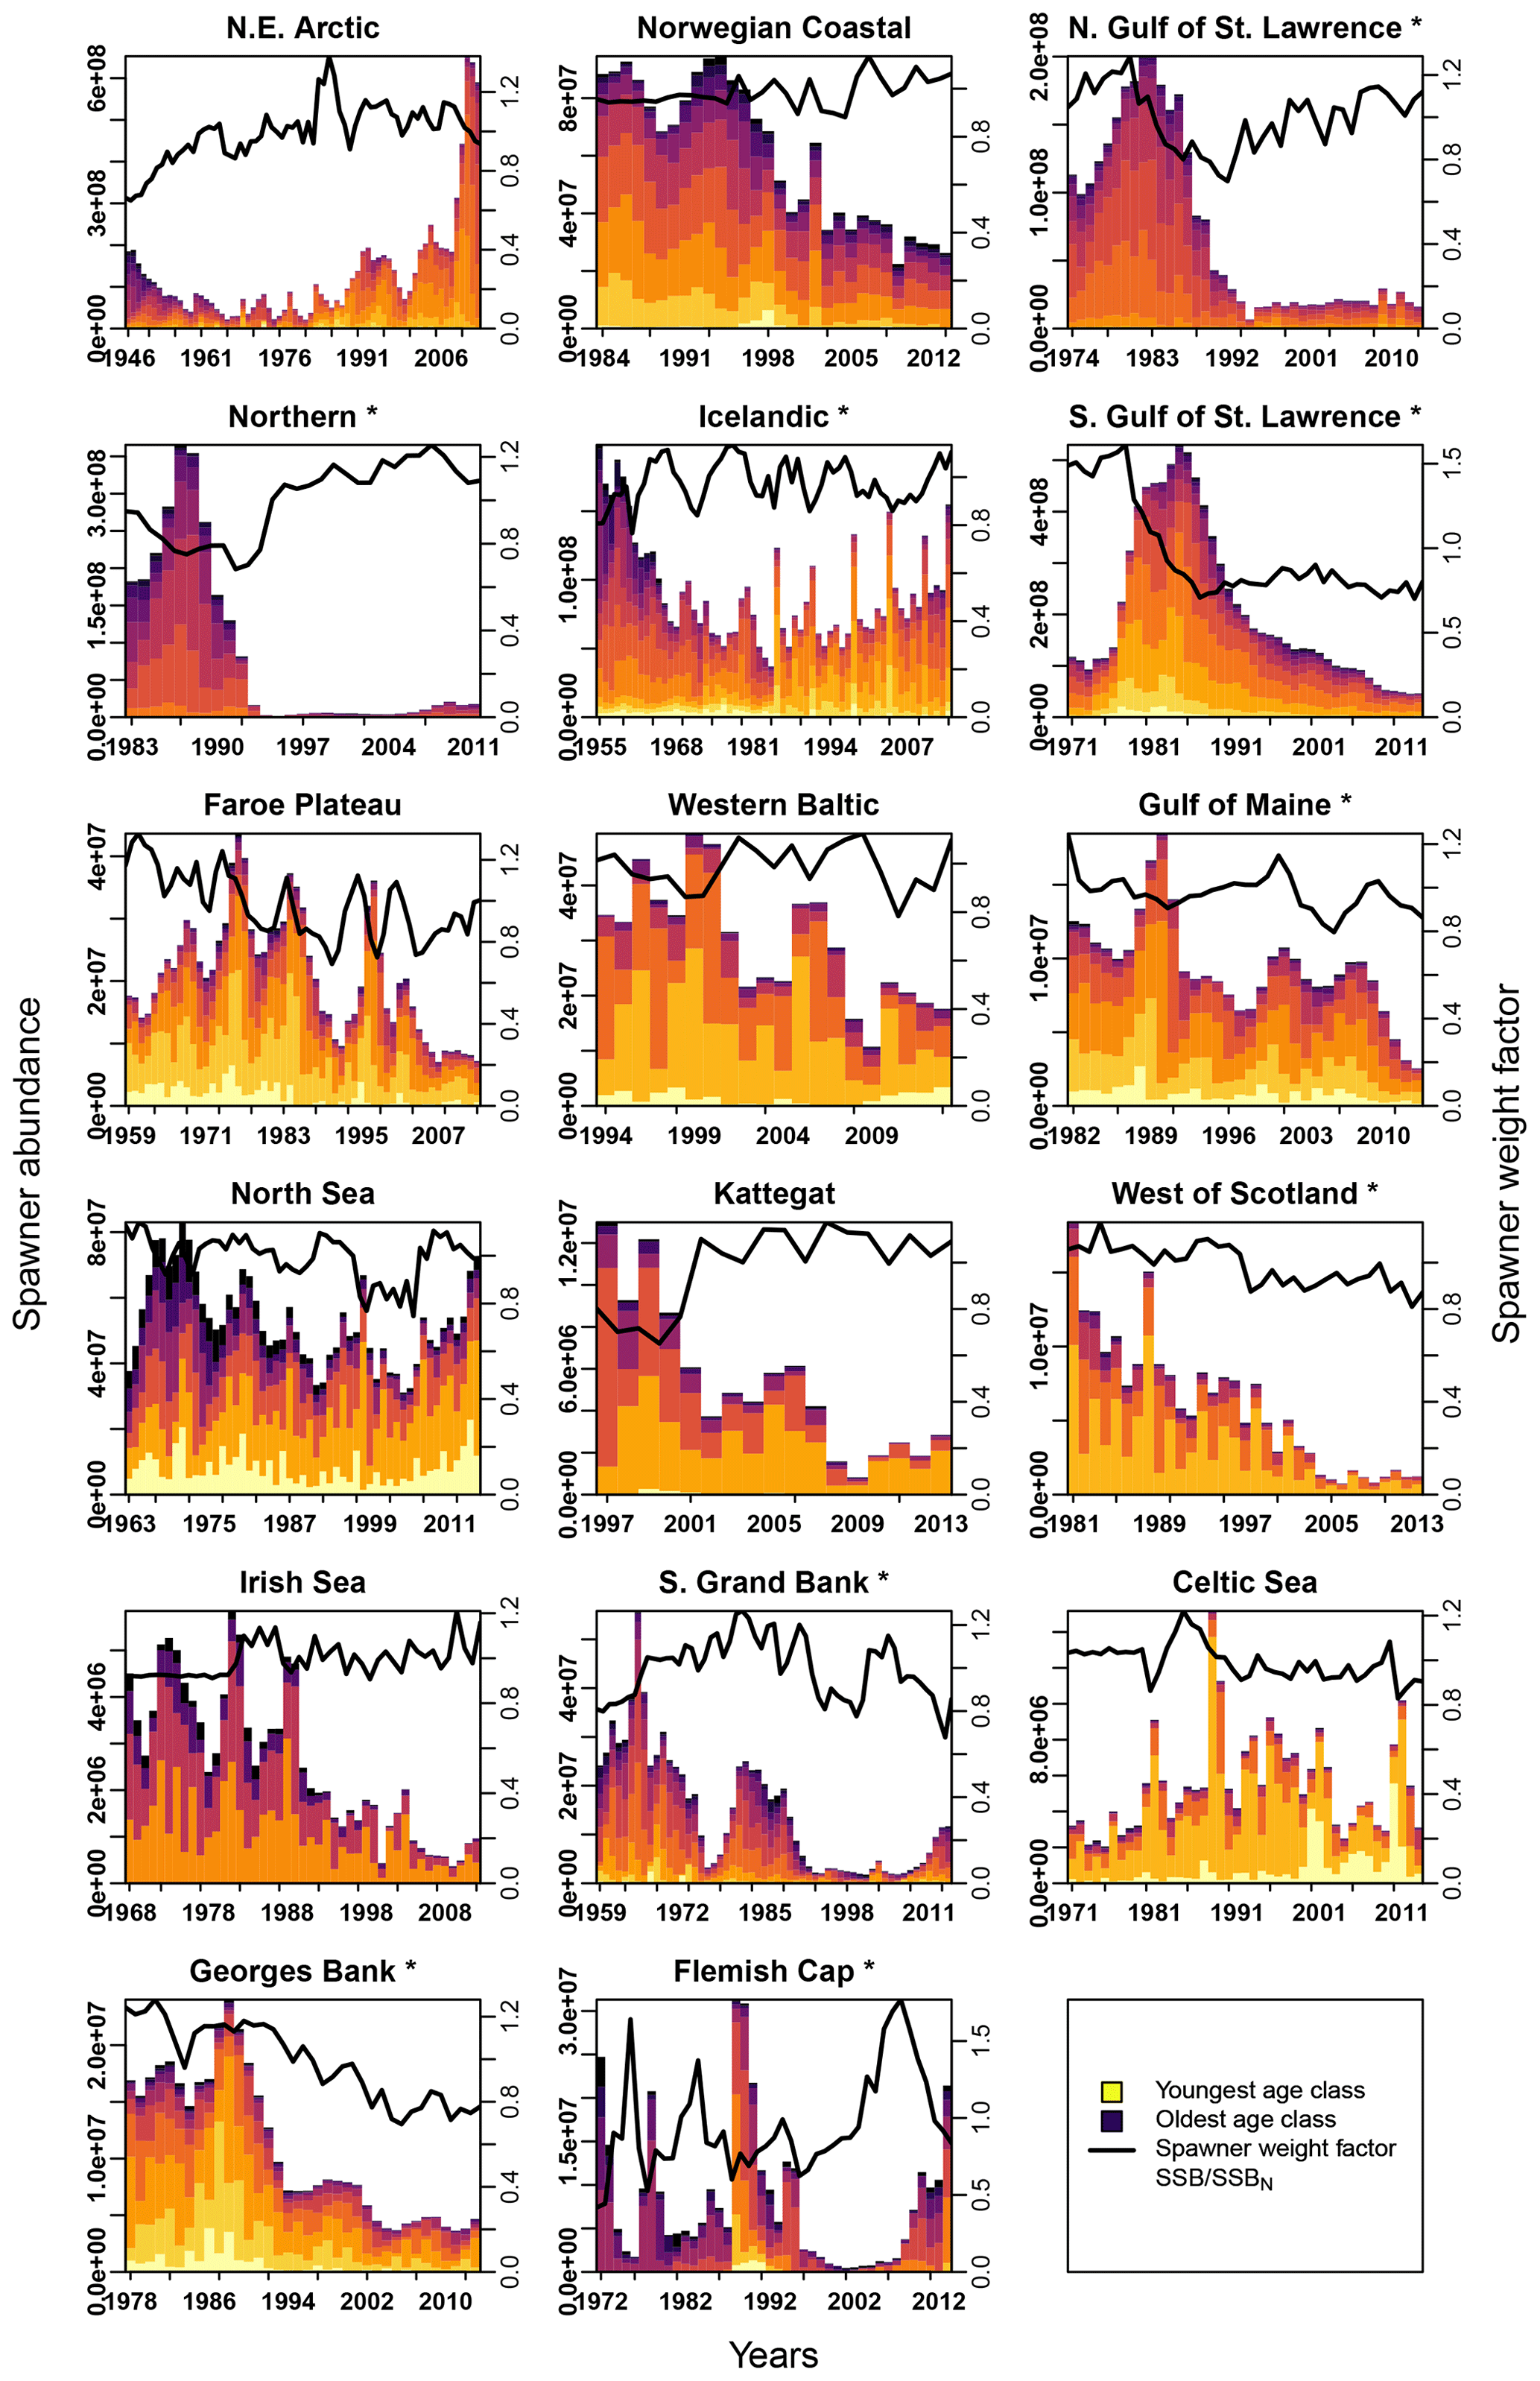
Figure E2Change in spawner abundance (number of mature fishes) for each age class according to stock-assessment data. Asterisks mark northwest Atlantic cod stocks, while the other cod stocks are found in the northeast Atlantic. Different colors indicate the different age classes (yellow: youngest age class; dark blue: oldest age class). The solid line shows the weight of the average spawner, which reflects the weight of the most abundant spawning class in a specific year (right y axis).
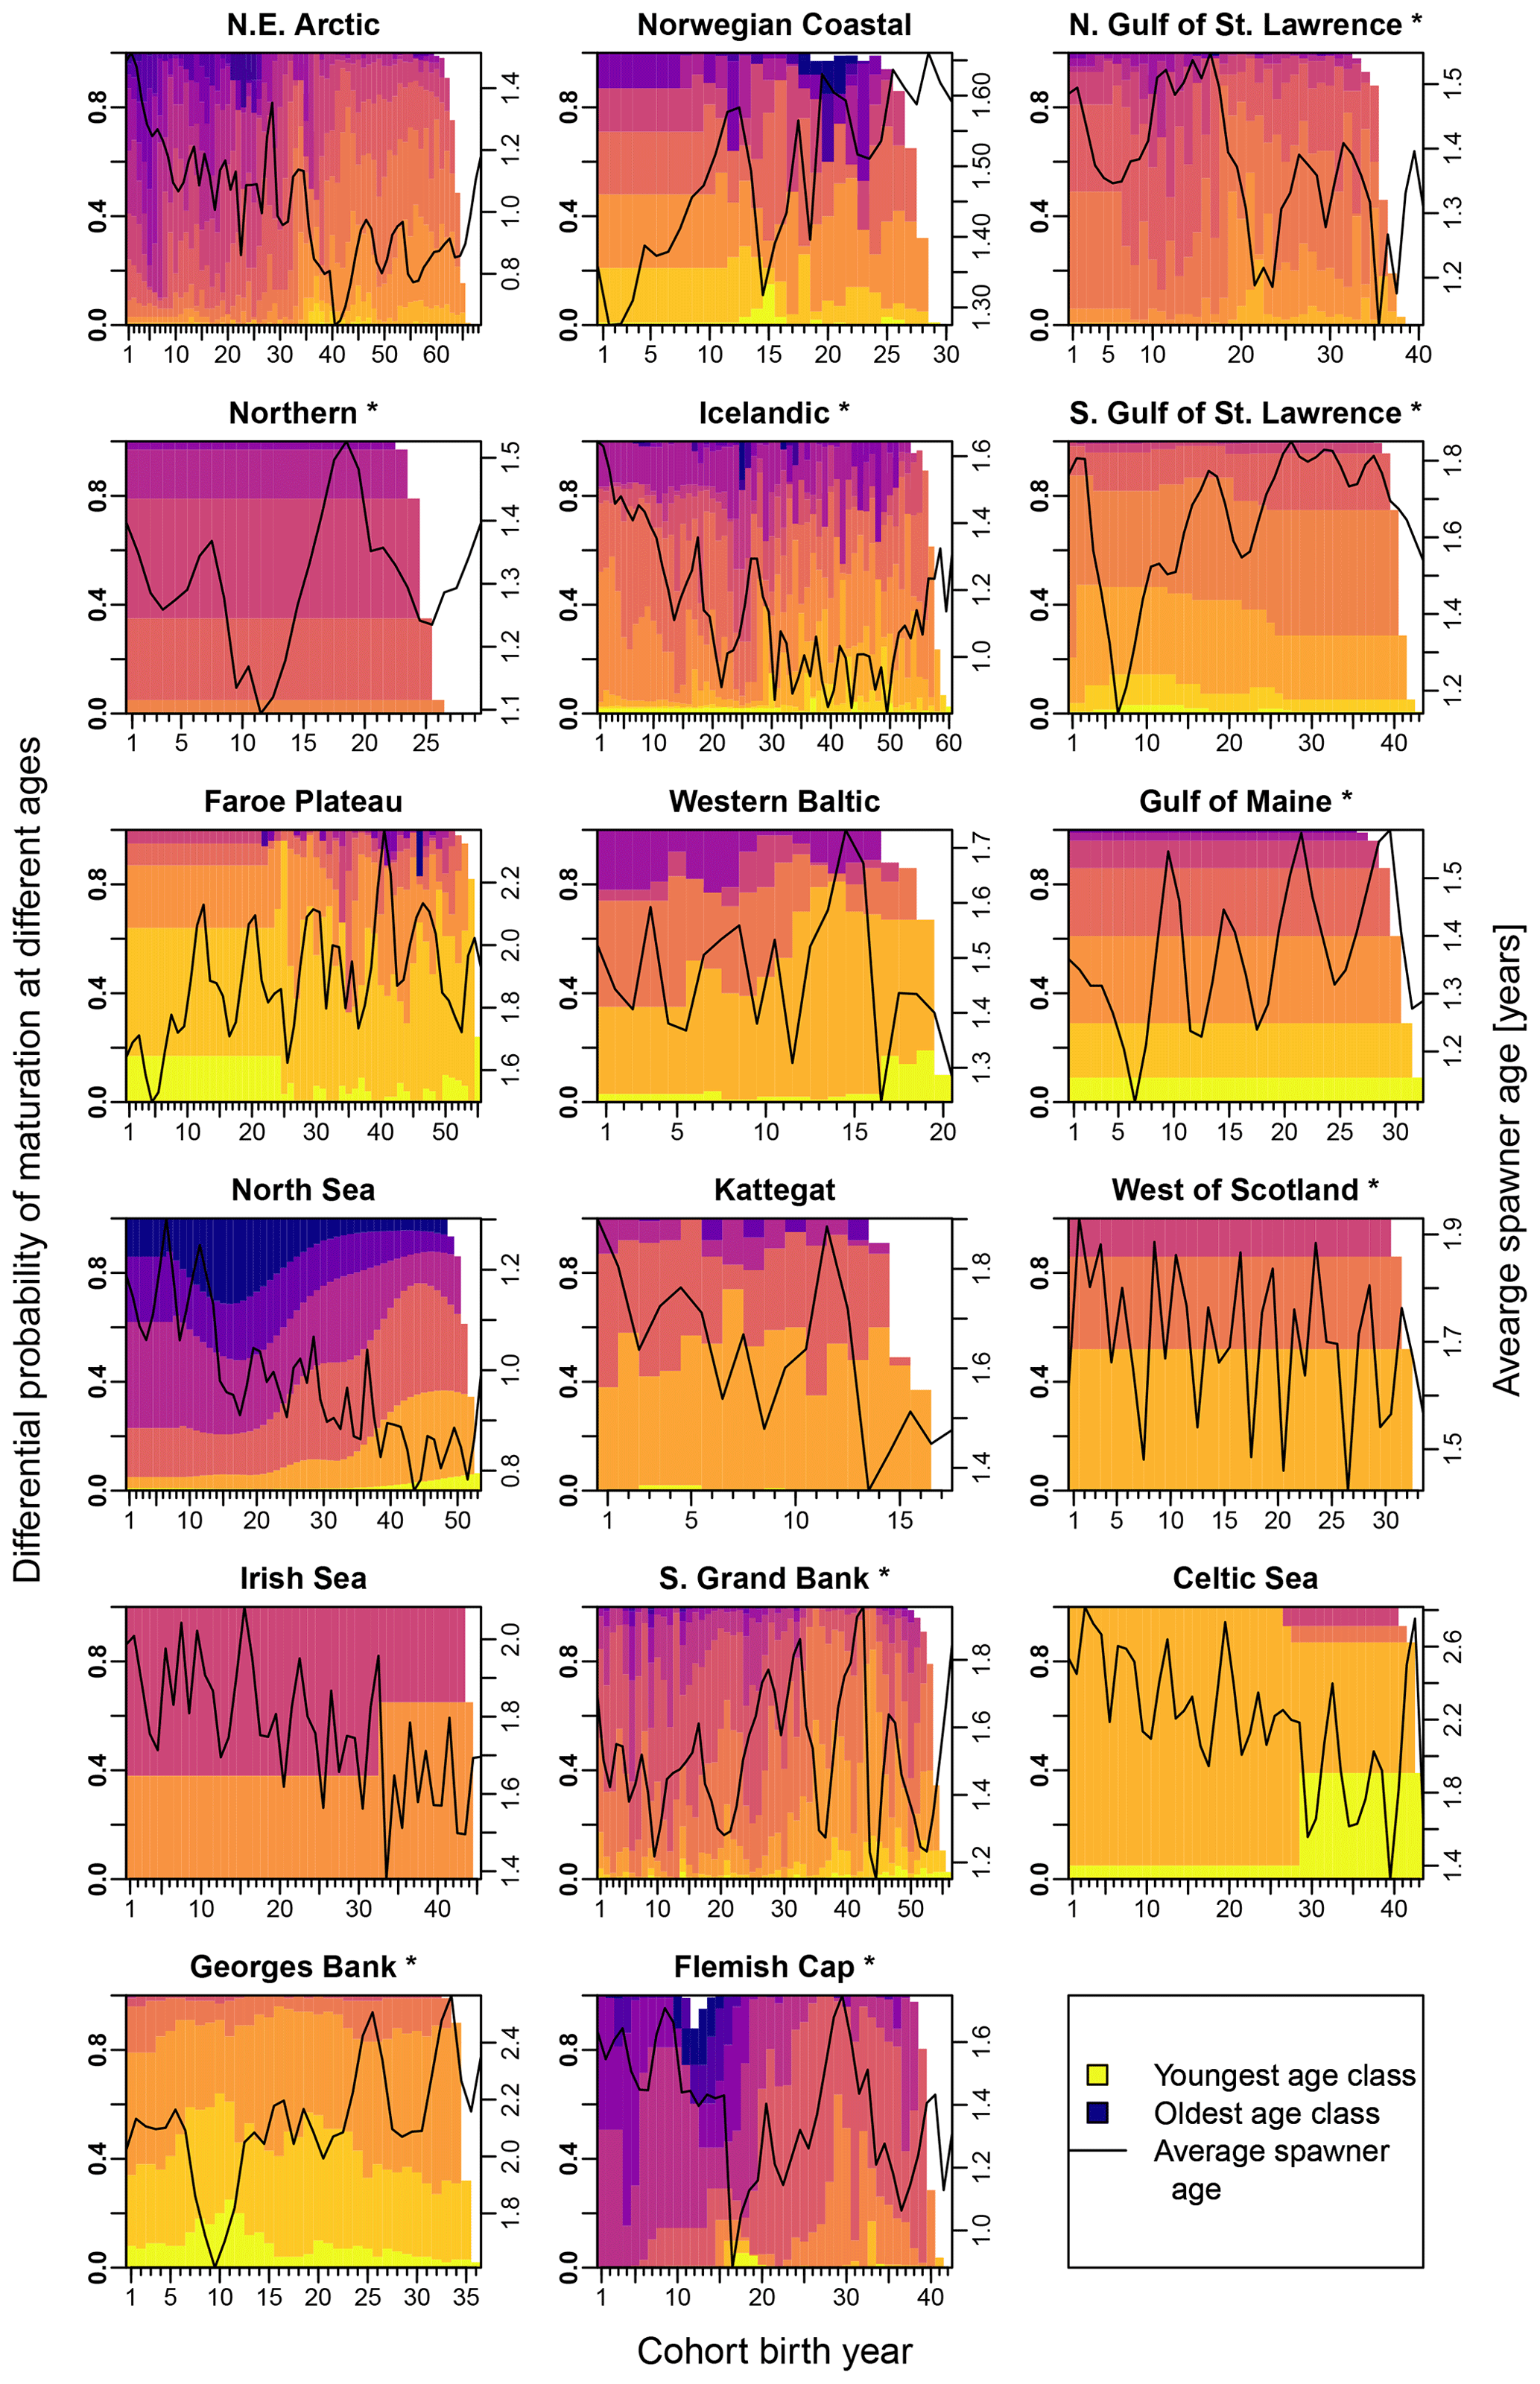
Figure E3Change in the probability of maturation for each age class according to stock-assessment data. Asterisks mark northwest Atlantic cod stocks, while the other cod stocks are found in the northeast Atlantic. Different colors indicate the different age classes (yellow: youngest age class; dark blue: oldest age class). The black line shows the average spawner age (right y axis).
All data used here are publicly available without special permission. No new data were generated. Biological data were retrieved from stock-assessment reports from the different responsible fisheries institutions (for Atlantic cod stocks in waters of the EU: ICES, International Council for the Exploration of the Sea, https://standardgraphs.ices.dk, ICES Stock Assessment Database, 2023; for cod stocks in Canadian waters: DFO, Department of Fisheries and Oceans Canada, https://www.isdm-gdsi.gc.ca/csas-sccs/applications/Publications/index-eng.asp, Science Advisory Reports, 2023; for the two cod stocks in US waters, the Northwest Atlantic Fisheries Organization (NAFO) – Flemish Cap cod: https://www.nafo.int/Portals/0/PDFs/sc/2014/scr14-018.pdf, González-Troncoso and Fernando González-Costas, 2014; http://hdl.handle.net/10261/306031, Pérez-Rodríguez et al., 2016; S Grand Bank cod: https://www.nafo.int/Portals/0/PDFs/sc/2017/scr17-042.pdf?ver=2017-08-29-104839-873, Rideout et al., 2017; for the two stocks from the Northeast Fisheries Science Center (NOAA): Gulf of Maine cod: https://repository.library.noaa.gov/view/noaa/4330, NOAA, 2013; Georges Bank cod: https://repository.library.noaa.gov/view/noaa/4060, NOAA, 2012).
Time series of SST from each stock's geographical location were extracted from NOAA's Physical Sciences Laboratory (NOAA_ERSST_V4 data, https://doi.org/10.7289/V5KD1VVF, Huang et al., 2015), according to each Atlantic cod stock's location. Appendix B gives a full description of the data and sources used.
The programmed R code is provided by the authors.
AMW, NV and AV jointly conceptualized the research and applied for research funding. NV and AV took the lead in developing the methodology, programming and statistical analysis. AMW collected the data, provided the literature and wrote the first draft. AMW, NV and AV jointly created visualizations of the results and finalized the manuscript.
The contact author has declared that none of the authors has any competing interests.
Publisher's note: Copernicus Publications remains neutral with regard to jurisdictional claims in published maps and institutional affiliations.
This research is a result of the Nordic–Russian collaboration project “A multidisciplinary approach to anticipate critical regime shifts in ecosystems: terrestrial and marine systems at risk” (TerMARisk) funded by NordForsk (grant no. 81513). Anna-Marie Winter was further funded by the project OILCOM from the Research Council of Norway (grant no. 255487). The authors wish to thank Taras Vasiliev for providing the computational infrastructure and Jeffrey A. Hutchings, Anne Maria Eikeset, Øystein Langangen and Andries Richter for helpful discussions. This paper is dedicated to the memory of Jeffrey A. Hutchings.
This research has been supported by NordForsk (grant nos. 81513 and 255487).
This paper was edited by Kenneth Rose and reviewed by two anonymous referees.
Armstrong, D. P. and Wittmer, H. U.: Incorporating Allee effects into reintroduction strategies, Ecol. Res., 26, 687–695, https://doi.org/10.1007/s11284-011-0849-9, 2011.
Beamish, R. J., McFarlane, G. A., and Benson, A.: Longevity overfishing, Prog. Oceanogr., 68, 289–302, https://doi.org/10.1016/j.pocean.2006.02.005, 2006.
Beaugrand, G. and Kirby, R. R.: Climate, plankton and cod, Glob. Change Biol., 16, 1268–1280, https://doi.org/10.1111/j.1365-2486.2009.02063.x, 2010.
Beaugrand, G., Brander, K. M., Alistair Lindley, J., Souissi, S., and Reid, P. C.: Plankton effect on cod recruitment in the North Sea, Nature, 426, 661–664, https://doi.org/10.1038/nature02164, 2003.
Berec, L.: Allee effects under climate change, Oikos, 128, 972–983, https://doi.org/10.1111/oik.05941, 2019.
Berec, L., Angulo, E., and Courchamp, F.: Multiple Allee effects and population management, Trends Ecol. Evol., 22, 185–191, https://doi.org/10.1016/j.tree.2006.12.002, 2007.
Beverton, R. J. H. and Holt, S. J. (Eds.): On the dynamics of exploited fish populations, Springer Science+Business Media Dordrecht, London, Great Britain, ISBN 978-94-010-4934-4, 1957.
Birkeland, C. and Dayton, P. K.: The importance in fishery management of leaving the big ones, Trends Ecol. Evol., 20, 356–358, https://doi.org/10.1016/j.tree.2005.03.015, 2005.
Brander, K.: Climate change not to blame for cod population decline, Nat. Sustain., 1, 262–264, https://doi.org/10.1038/s41893-018-0081-5, 2018.
Brander, K. M.: Cod Gadus morhua and climate change: processes, productivity and prediction, J. Fish Biol., 77, 1899–1911, https://doi.org/10.1111/j.1095-8649.2010.02782.x, 2010.
Britten, G. L., Dowd, M., Kanary, L., and Worm, B.: Extended fisheries recovery timelines in a changing environment, Nat. Commun., 8, 15325, https://doi.org/10.1038/ncomms15325, 2017.
Brunel, T.: Age-structure-dependent recruitment: a meta-analysis applied to Northeast Atlantic fish stocks, ICES J. Mar. Sci., 67, 1921–1930, https://doi.org/10.1093/icesjms/fsq032, 2010.
Buren, A. D., Koen-Alonso, M., and Stenson, G. B.: The role of harp seals, fisheries and food availability in driving the dynamics of northern cod, Mar. Ecol.-Prog. Ser., 511, 265–284, https://doi.org/10.3354/meps10897, 2014.
Cabral, R. B., Alino, P. M., and Lim, M. T.: A coupled stock-recruitment-age-structured model of the North Sea cod under the influence of depensation, Ecol. Model., 253, 1–8, https://doi.org/10.1016/j.ecolmodel.2012.12.031, 2013.
Cadigan, N. G.: A state-space stock assessment model for northern cod, including under-reported catches and variable natural mortality rates, Can. J. Fish. Aquat. Sci., 73, 296–308, https://doi.org/10.1139/cjfas-2015-0047, 2015.
Caswell, H.: Matrix Population Models: Construction, Analysis, and Interpretation: Construction, Analysis and Interpretation, 2, Sinauer Associates, Sunderland, Massachusetts, USA, 722 pp., 2001.
Cheung, W. W. L., Sarmiento, J. L., Dunne, J., Frölicher, T. L., Lam, V. W. Y., Deng Palomares, M. L., Watson, R., and Pauly, D.: Shrinking of fishes exacerbates impacts of global ocean changes on marine ecosystems, Nat. Clim. Change, 3, 254–258, https://doi.org/10.1038/nclimate1691, 2013.
Clark, R. A., Fox, C. J., Viner, D., and Livermore, M.: North Sea cod and climate change – modelling the effects of temperature on population dynamics, Glob. Change Biol., 9, 1669–1680, https://doi.org/10.1046/j.1365-2486.2003.00685.x, 2003.
Costello, C., Cao, L., Gelcich, S., Cisneros-Mata, M. Á., Free, C. M., Froehlich, H. E., Golden, C. D., Ishimura, G., Maier, J., Macadam-Somer, I., Mangin, T., Melnychuk, M. C., Miyahara, M., de Moor, C. L., Naylor, R., Nøstbakken, L., Ojea, E., O'Reilly, E., Parma, A. M., Plantinga, A. J., Thilsted, S. H., and Lubchenco, J.: The future of food from the sea, Nature, 588, 95–100, https://doi.org/10.1038/s41586-020-2616-y, 2020.
Courchamp, F., Clutton-Brock, T., and Grenfell, B.: Inverse density dependence and the Allee effect, Trends Ecol. Evol., 14, 405–410, https://doi.org/10.1016/S0169-5347(99)01683-3, 1999.
Courchamp, F., Berec, L., and Gascoigne, J. (Eds.): Allee effects in ecology and conservation, Oxford University Press, New York, U.S., 215 pp., ISBN 9780191717642, 2008.
Daewel, U., Peck, M. A., and Schrum, C.: Life history strategy and impacts of environmental variability on early life stages of two marine fishes in the North Sea: an individual-based modelling approach, Can. J. Fish. Aquat. Sci., 68, 426–443, https://doi.org/10.1139/f10-164, 2011.
Dai, L., Vorselen, D., Korolev, K. S., and Gore, J.: Generic Indicators for Loss of Resilience Before a Tipping Point Leading to Population Collapse, Science, 336, 1175–1177, https://doi.org/10.1126/science.1219805, 2012.
Dakos, V., Carpenter, S. R., Brock, W. A., Ellison, A. M., Guttal, V., Ives, A. R., Kefi, S., Livina, V., Seekell, D. A., van Nes, E. H., and Scheffer, M.: Methods for Detecting Early Warnings of Critical Transitions in Time Series Illustrated Using Simulated Ecological Data, Plos ONE, 7, e41010, https://doi.org/10.1371/journal.pone.0041010, 2012.
Daufresne, M., Lengfellner, K., and Sommer, U.: Global warming benefits the small in aquatic ecosystems, P. Natl. Acad. Sci. USA, 106, 12788–12793, https://doi.org/10.1073/pnas.0902080106, 2009.
Dean, M. J., Elzey, S. P., Hoffman, W. S., Buchan, N. C., and Grabowski, J. H.: The relative importance of sub-populations to the Gulf of Maine stock of Atlantic cod, ICES J. Mar. Sci., 76, 1626–1640, https://doi.org/10.1093/icesjms/fsz083, 2019.
Devine, J. A., Nash, R. D. M., Schaarschmidt, U., and Subbey, S.: Modelling and forecasting stock–recruitment: current and future perspectives, ICES J. Mar. Sci., 71, 2307–2322, https://doi.org/10.1093/icesjms/fsu148, 2014.
Department Fisheries and Oceans, Canada (DFO): Stock Assessment Of Northern Cod (NAFO Divisions 2J3KL) In 2019, Science Advisory Report 2019/050, Canadian Science Advisory Secretariat, Canada, 20 pp., https://www.dfo-mpo.gc.ca/csas-sccs/Publications/SAR-AS/2019/2019_050-eng.html (last access: 23 August 2023), 2019.
Drinkwater, K. F.: The response of Atlantic cod (Gadus morhua) to future climate change, ICES J. Mar. Sci., 62, 1327–1337, https://doi.org/10.1016/j.icesjms.2005.05.015, 2005.
Dulvy, N. K., Ellis, J. R., Goodwin, N. B., Grant, A., Reynolds, J. D., and Jennings, S.: Methods of assessing extinction risk in marine fishes, Fish Fish., 5, 255–276, https://doi.org/10.1111/j.1467-2679.2004.00158.x, 2004.
Dunlop, E. S., Eikeset, A. M., and Stenseth, N. C.: From genes to populations: how fisheries-induced evolution alters stock productivity, Ecol. Appl., 25, 1860–1868, https://doi.org/10.1890/14-1862.1, 2015.
Enberg, K., Jørgensen, C., Dunlop, E. S., Heino, M., and Dieckmann, U.: Implications of fisheries-induced evolution for stock rebuilding and recovery, Evol. Appl., 2, 394–414, https://doi.org/10.1111/j.1752-4571.2009.00077.x, 2009.
Frank, K. T. and Brickman, D.: Allee effects and compensatory population dynamics within a stock complex, Can. J. Fish. Aquat. Sci., 57, 513–517, https://doi.org/10.1139/cjfas-57-3-513, 2000.
Frank, K. T., Petrie, B., Leggett, W. C., and Boyce, D. G.: Large scale, synchronous variability of marine fish populations driven by commercial exploitation, P. Natl. Acad. Sci. USA, 113, 8248–8253, https://doi.org/10.1073/pnas.1602325113, 2016.
Gascoigne, J. and Lipcius, R. N.: Allee effects in marine systems, Mar. Ecol.-Prog. Ser., 269, 49–59, https://doi.org/10.3354/Meps269049, 2004.
Glaser, S. M., Fogarty, M. J., Liu, H., Altman, I., Hsieh, C.-H., Kaufman, L., MacCall, A. D., Rosenberg, A. A., Ye, H., and Sugihara, G.: Complex dynamics may limit prediction in marine fisheries, Fish Fish., 15, 616–633, https://doi.org/10.1111/faf.12037, 2014.
Gogina, M., Zettler, M. L., Wåhlström, I., Andersson, H., Radtke, H., Kuznetsov, I., and MacKenzie, B. R.: A combination of species distribution and ocean-biogeochemical models suggests that climate change overrides eutrophication as the driver of future distributions of a key benthic crustacean in the estuarine ecosystem of the Baltic Sea, ICES J. Mar. Sci., 77, 2089–2105, https://doi.org/10.1093/icesjms/fsaa107, 2020.
González-Troncoso, D. and Fernando González-Costas, F.: 3M cod assessment for different assumptions over M, Scientific Council Research (SCR) Document 14/018, Northwest Atlantic Fisheries Organization (NAFO), https://www.nafo.int/Portals/0/PDFs/sc/2014/scr14-018.pdf (last access: 23 August 2023), 2014.
Gregory, S. D., Bradshaw, C. J. A., Brook, B. W., and Courchamp, F.: Limited evidence for the demographic Allee effect from numerous species across taxa, Ecology, 91, 2151–2161, https://doi.org/10.1890/09-1128.1, 2010.
Gröger, J. P., Kruse, G. H., and Rohlf, N.: Slave to the rhythm: how large-scale climate cycles trigger herring (Clupea harengus) regeneration in the North Sea, ICES J. Mar. Sci., 67, 454–465, https://doi.org/10.1093/icesjms/fsp259, 2009.
Heikinheimo, O.: Average salinity as an index for environmental forcing on cod recruitment in the Baltic Sea, Boreal Environ. Res., 13, 457–464, 2008.
Heino, M., Pauli, B. D., and Dieckmann, U.: Fisheries-Induced Evolution, Annu. Rev. Ecol. Evol. S., 46, 461–480, https://doi.org/10.1146/annurev-ecolsys-112414-054339, 2015.
Hilborn, R. and Walters, C. J. (Eds.): Quantitative Fisheries Stock Assessment: Choice, Dynamics and Uncertainty, Routledge, Chapman & Hall Ltd., London, England, 570 pp., ISBN 1-4020-1845-2, 1992.
Hilborn, R., Hively, D. J., Jensen, O. P., and Branch, T. A.: The dynamics of fish populations at low abundance and prospects for rebuilding and recovery, ICES J. Mar. Sci., 71, 2141–2151, https://doi.org/10.1093/icesjms/fsu035, 2014.
Hinrichsen, H.-H., Möllmann, C., Voss, R., Köster, F. W., and Kornilovs, G.: Biophysical modeling of larval Baltic cod (Gadus morhua) growth and survival, Can. J. Fish. Aquat. Sci., 59, 1858–1873, https://doi.org/10.1139/f02-149, 2002.
Hinrichsen, H.-H., Huwer, B., Makarchouk, A., Petereit, C., Schaber, M., and Voss, R.: Climate-driven long-term trends in Baltic Sea oxygen concentrations and the potential consequences for eastern Baltic cod (Gadus morhua), ICES J. Mar. Sci., 68, 2019–2028, https://doi.org/10.1093/icesjms/fsr145, 2011.
Hixon, M. A., Johnson, D. W., and Sogard, S. M.: BOFFFFs: on the importance of conserving old-growth age structure in fishery populations, ICES J. Mar. Sci., 71, 2171–2185, https://doi.org/10.1093/icesjms/fst200, 2013.
Huang, B., Banzon, V. F., Freeman, E., Lawrimore, J., Liu, W., Peterson, T. C., Smith, T. M., Thorne, P. W., Woodruff, S. D., and Zhang, H.-M.: Extended Reconstructed Sea Surface Temperature (ERSST), Version 4, NOAA National Centers for Environmental Information [data set], https://doi.org/10.7289/V5KD1VVF, 2015.
Hutchings, J. A.: Influence of population decline, fishing, and spawner variability on the recovery of marine fishes, J. Fish Biol., 59, 306–322, https://doi.org/10.1006/jfbi.2001.1756, 2001.
Hutchings, J. A.: Life history consequences of overexploitation to population recovery in Northwest Atlantic cod (Gadus morhua), Can. J. Fish. Aquat. Sci., 62, 824–832, https://doi.org/10.1139/f05-081, 2005.
Hutchings, J. A.: Thresholds for impaired species recovery, P. R. Soc. B, 282, 20150654, https://doi.org/10.1098/rspb.2015.0654, 2015.
Hutchings, J. A. and Rangeley, R. W.: Correlates of recovery for Canadian Atlantic cod (Gadus morhua), Can. J. Zool., 89, 386–400, https://doi.org/10.1139/Z11-022, 2011.
Hutchings, J. A. and Reynolds, J. D.: Marine Fish Population Collapses: Consequences for Recovery and Extinction Risk, BioScience, 54, 297–309, https://doi.org/10.1641/0006-3568(2004)054[0297:MFPCCF]2.0.CO;2, 2004.
ICES Stock Assessment Database: ICES, Copenhagen, Denmark [data set], https://standardgraphs.ices.dk, last access: 23 August 2023.
IPCC: IPCC, edited by: Pörtner, H.-O., Roberts, D. C., Masson-Delmotte, V., Zhai, P., Tignor, M., Poloczanska, E., Mintenbeck, K., Alegría, A., Nicolai, M., Okem, A., Petzold, J., Rama, B., and Weyer, N. M., Cambridge University Press, Cambridge, UK and New York, NY, USA, 755 pp., https://doi.org/10.1017/9781009157964, 2019.
Isaksson, I., Pihl, L., and van Montfrans, J.: Eutrophication-related changes in macrovegetation and foraging of young cod (Gadus morhua L.): a mesocosm experiment, J. Exp. Mar. Biol. Ecol., 177, 203–217, https://doi.org/10.1016/0022-0981(94)90237-2, 1994.
Jiang, J. and Shi, J.: Bistability Dynamics in Structured Ecological Models, in: Spatial Ecology, edited by: Cantrell, S., Cosner, C., and Ruan, S., CRC Press, Taylor & Francis Group, London, ISBN 9780429190025, 2010.
Jones, K. R., Klein, C. J., Halpern, B. S., Venter, O., Grantham, H., Kuempel, C. D., Shumway, N., Friedlander, A. M., Possingham, H. P., and Watson, J. E. M.: The Location and Protection Status of Earth's Diminishing Marine Wilderness, Curr. Biol., 28, 2506–2512.e2503, https://doi.org/10.1016/j.cub.2018.06.010, 2018.
Keith, D. M. and Hutchings, J. A.: Population dynamics of marine fishes at low abundance, Can. J. Fish. Aquat. Sci., 69, 1150–1163, https://doi.org/10.1139/F2012-055, 2012.
Kjesbu, O. S., Bogstad, B., Devine, J. A., Gjøsæter, H., Howell, D., Ingvaldsen, R. B., Nash, R. D. M., and Skjæraasen, J. E.: Synergies between climate and management for Atlantic cod fisheries at high latitudes, P. Natl. Acad. Sci. USA, 111, 3478–3483, https://doi.org/10.1073/pnas.1316342111, 2014.
Kuparinen, A. and Hutchings, J. A.: Increased natural mortality at low abundance can generate an Allee effect in a marine fish, Roy. Soc. Open Sci., 1, 140075, https://doi.org/10.1098/rsos.140075, 2014.
Kuparinen, A., Hardie, D. C., and Hutchings, J. A.: Evolutionary and ecological feedbacks of the survival cost of reproduction, Evol. Appl., 5, 245–255, https://doi.org/10.1111/j.1752-4571.2011.00215.x, 2012.
Kuparinen, A., Keith, D. M., and Hutchings, J. A.: Allee Effect and the Uncertainty of Population Recovery, Conserv. Biol., 28, 790–798, https://doi.org/10.1111/Cobi.12216, 2014.
Lande, R.: Risk of Population Extinction from Fixation of New Deleterious Mutations, Evolution, 48, 1460–1469, https://doi.org/10.1111/j.1558-5646.1994.tb02188.x, 1994.
Laurel, B. J., Copeman, L. A., Spencer, M., and Iseri, P.: Temperature-dependent growth as a function of size and age in juvenile Arctic cod (Boreogadus saida), ICES J. Mar. Sci., 74, 1614–1621, https://doi.org/10.1093/icesjms/fsx028, 2017.
Law, R.: Fishing, selection, and phenotypic evolution, ICES J. Mar. Sci., 57, 659–668, https://doi.org/10.1006/jmsc.2000.0731, 2000.
Liermann, M. and Hilborn, R.: Depensation in fish stocks: a hierarchic Bayesian meta-analysis, Can. J. Fish. Aquat. Sci., 54, 1976–1984, https://doi.org/10.1139/cjfas-54-9-1976, 1997.
Lilly, G. R., Wieland, K., Rothschild, B. J., Sundby, S., Drinkwater, K. F., Brander, K., Ottersen, G., Carscadden, J. E., Stenson, G. B., Chouinard, G. A., Swain, D. P., Daan, N., Enberg, K., Hammill, M. O., Rosing-Asvid, A., Svedäng, H., and Vázquez, A.: Decline and Recovery of Atlantic Cod (Gadus morhua) Stocks throughout the North Atlantic, Low. Wake. Fi., 24, 39–66, https://doi.org/10.4027/rgsfcc.2008.03, 2008.
Mace, G. M., Collar, N. J., Gaston, K. J., Hilton-Taylor, C., Akçakaya, H. R., Leader-Williams, N., Milner-Gulland, E. J., and Stuart, S. N.: Quantification of extinction risk: IUCN's system for classifying threatened species, Conserv. Biol., 22, 1424–1442, https://doi.org/10.1111/j.1523-1739.2008.01044.x, 2008.
Mantzouni, I. and MacKenzie, B. R.: Productivity responses of a widespread marine piscivore, Gadus morhua, to oceanic thermal extremes and trends, P. R. Soc. B, 277, 1867–1874, https://doi.org/10.1098/rspb.2009.1906, 2010.
Marshall, C. T., Needle, C. L., Thorsen, A., Kjesbu, O. S., and Yaragina, N. A.: Systematic bias in estimates of reproductive potential of an Atlantic cod (Gadus morhua) stock: implications for stock-recruit theory and management, Can. J. Fish. Aquat. Sci., 63, 980–994, https://doi.org/10.1139/F05-270, 2006.
Marteinsdottir, G. and Steinarsson, A.: Maternal influence on the size and viability of Iceland cod Gadus morhua eggs and larvae, J. Fish Biol., 52, 1241–1258, https://doi.org/10.1111/j.1095-8649.1998.tb00969.x, 1998.
Marteinsdottir, G. and Thorarinsson, K.: Improving the stock-recruitment relationship in Icelandic cod (Gadus morhua) by including age diversity of spawners, Can. J. Fish. Aquat. Sci., 55, 1372–1377, https://doi.org/10.1139/f98-035, 1998.
Murawski, S. A., Rago, P. J., and Trippel, E. A.: Impacts of demographic variation in spawning characteristics on reference points for fishery management, ICES J. Mar. Sci., 58, 1002–1014, https://doi.org/10.1006/jmsc.2001.1097, 2001.
Myers, R. A., Barrowman, N. J., Hutchings, J. A., and Rosenberg, A. A.: Population-Dynamics of Exploited Fish Stocks at Low Population-Levels, Science, 269, 1106–1108, https://doi.org/10.1126/science.269.5227.1106, 1995.
Neubauer, P., Jensen, O. P., Hutchings, J. A., and Baum, J. K.: Resilience and Recovery of Overexploited Marine Populations, Science, 340, 347–349, https://doi.org/10.1126/science.1230441, 2013.
Neuenhoff, R. D., Swain, D. P., Cox, S. P., McAllister, M. K., Trites, A. W., Walters, C. J., and Hammill, M. O.: Continued decline of a collapsed population of Atlantic cod (Gadus morhua) due to predation-driven Allee effects, Can. J. Fish. Aquat. Sci., 76, 168–184, https://doi.org/10.1139/cjfas-2017-0190, 2018.
Nielsen, A. and Berg, C. W.: Estimation of time-varying selectivity in stock assessments using state-space models, Fish. Res., 158, 96–101, https://doi.org/10.1016/j.fishres.2014.01.014, 2014.
Nielsen, J. R., Lundgren, B., Kristensen, K., and Bastardie, F.: Localisation of Nursery Areas Based on Comparative Analyses of the Horizontal and Vertical Distribution Patterns of Juvenile Baltic Cod (Gadus morhua), PLOS ONE, 8, e70668, https://doi.org/10.1371/journal.pone.0070668, 2013.
NOAA: Assessment or Data Updates of 13 Northeast Groundfish Stocks through 2010, Northeast Fisheries Science Center Reference Document 12-06, NOAA's National Marine Fisheries Serv., Massachusetts, U.S., https://repository.library.noaa.gov/view/noaa/4060 (last access: 23 August 2023), 2012.
NOAA: 55th Northeast Regional Stock Assessment Workshop (55th SAW) Assessment Summary Report, Northeast Fisheries Science Center Reference Document 13-01, NOAA's National Marine Fisheries Serv., Massachusetts, U.S., https://repository.library.noaa.gov/view/noaa/4330 (last access: 23 August 2023), 2013.
Nussle, S., Hendry, A. P., and Carlson, S. M.: When Should Harvest Evolution Matter to Population Dynamics?, Trends Ecol. Evol., 31, 500–502, https://doi.org/10.1016/j.tree.2016.04.001, 2016.
Olsen, E. M., Ottersen, G., Llope, M., Chan, K.-S., Beaugrand, G., and Stenseth, N. C.: Spawning stock and recruitment in North Sea cod shaped by food and climate, P. R. Soc. B, 278, 504–510, https://doi.org/10.1098/rspb.2010.1465, 2011.
Ottersen, G.: Pronounced long-term juvenation in the spawning stock of Arcto-Norwegian cod (Gadus morhua) and possible consequences for recruitment, Can. J. Fish. Aquat. Sci., 65, 523–534, https://doi.org/10.1139/f07-185, 2008.
Ottersen, G., Bogstad, B., Yaragina, N. A., Stige, L. C., Vikebø, F. B., and Dalpadado, P.: A review of early life history dynamics of Barents Sea cod (Gadus morhua), ICES J. Mar. Sci., 71, 2064–2087, https://doi.org/10.1093/icesjms/fsu037, 2014.
Ottersen, G., Stige, L. C., Durant, J. M., Chan, K. S., Rouyer, T. A., Drinkwater, K. F., and Stenseth, N. C.: Temporal shifts in recruitment dynamics of North Atlantic fish stocks: effects of spawning stock and temperature, Mar. Ecol.-Prog. Ser., 480, 205–225, https://doi.org/10.3354/Meps10249, 2013.
Pécuchet, L., Nielsen, J. R., and Christensen, A.: Impacts of the local environment on recruitment: a comparative study of North Sea and Baltic Sea fish stocks, ICES J. Mar. Sci., 72, 1323–1335, https://doi.org/10.1093/icesjms/fsu220, 2014.
Pepin, P.: Reconsidering the impossible – linking environmental drivers to growth, mortality, and recruitment of fish, Can. J. Fish. Aquat. Sci., 73, 205–215, https://doi.org/10.1139/cjfas-2015-0091, 2016.
Perälä, T. and Kuparinen, A.: Detection of Allee effects in marine fishes: analytical biases generated by data availability and model selection, P. Roy. Soc. B-Biol. Sci., 284, 20171284, https://doi.org/10.1098/rspb.2017.1284, 2017.
Perälä, T., Hutchings, J. A., and Kuparinen, A.: Allee effects and the Allee-effect zone in northwest Atlantic cod, Biol. Letters, 18, 20210439, https://doi.org/10.1098/rsbl.2021.0439, 2022.
Pérez-Rodríguez, A., Howell, D., Casas, M., Saborido-Rey, F., Ávila-de Melo, A., González-Costas, F., and González-Troncoso, D.: GadCap: A GADGET multispecies model for the Flemish Cap cod, redfish and shrimp, Scientific Council Research (SCR) Document 16/35, Northwest Atlantic Fisheries Organization (NAFO), http://hdl.handle.net/10261/306031 (last access: 23 August 2023), 2016.
Planque, B. and Fredou, T.: Temperature and the recruitment of Atlantic cod (Gadus morhua), Can. J. Fish. Aquat. Sci., 56, 2069–2077, https://doi.org/10.1139/cjfas-56-11-2069, 1999.
Planque, B., Fox, C. J., Saunders, M. A., and Rockett, P.: On the prediction of short term changes in the recruitment of North Sea cod (Gadus morhua) using statistical temperature forecasts, Sci. Mar., 67, 211–218, 2003.
Pörtner, H. O., Berdal, B., Blust, R., Brix, O., Colosimo, A., De Wachter, B., Giuliani, A., Johansen, T., Fischer, T., Knust, R., Lannig, G., Naevdal, G., Nedenes, A., Nyhammer, G., Sartoris, F. J., Serendero, I., Sirabella, P., Thorkildsen, S., and Zakhartsev, M.: Climate induced temperature effects on growth performance, fecundity and recruitment in marine fish: developing a hypothesis for cause and effect relationships in Atlantic cod (Gadus morhua) and common eelpout (Zoarces viviparus), Cont. Shelf Res., 21, 1975–1997, https://doi.org/10.1016/S0278-4343(01)00038-3, 2001.
R Core Team: R: A Language and Environment for Statistical Computing, R Foundation for Statistical Computing [code], Vienna, Austria, https://www.R-project.org/ (last access: 23 August 2023), 2017.
Ricard, D., Minto, C., Jensen, O. P., and Baum, J. K.: Examining the knowledge base and status of commercially exploited marine species with the RAM Legacy Stock Assessment Database, Fish Fish., 13, 380–398, https://doi.org/10.1111/j.1467-2979.2011.00435.x, 2012.
Ricker, W. E.: Stock and Recruitment, J. Fish. Res. Board Can., 11, 559–623, https://doi.org/10.1139/f54-039, 1954.
Rideout, R. M., Ings, D. W., and Brattey, J.: An Assessment of the Cod Stock in NAFO Divisions 3NO, NAFO, Scientific Council Research (SCR) Document 17/042, Northwest Atlantic Fisheries Organization (NAFO), https://www.nafo.int/Portals/0/PDFs/sc/2017/scr17-042.pdf?ver=2017-08-29-104839-873 (last access: 6 September 2023), 2017.
Righton, D. A., Andersen, K. H., Neat, F., Thorsteinsson, V., Steingrund, P., Svedang, H., Michalsen, K., Hinrichsen, H. H., Bendall, V., Neuenfeldt, S., Wright, P., Jonsson, P., Huse, G., van der Kooij, J., Mosegaard, H., Hussy, K., and Metcalfe, J.: Thermal niche of Atlantic cod Gadus morhua: limits, tolerance and optima, Mar. Ecol. Prog. Ser., 420, 1-U344, https://doi.org/10.3354/meps08889, 2010.
Rodgers, E. M.: Adding climate change to the mix: responses of aquatic ectotherms to the combined effects of eutrophication and warming, Biol. Letters, 17, 20210442, https://doi.org/10.1098/rsbl.2021.0442, 2021.
Rose, G. A.: Reconciling overfishing and climate change with stock dynamics of Atlantic cod (Gadus morhua) over 500 years, Can. J. Fish. Aquat. Sci., 61, 1553–1557, https://doi.org/10.1139/F04-173, 2004.
Rowe, S. and Hutchings, J. A.: Mating systems and the conservation of commercially exploited marine fish, Trends Ecol. Evol., 18, 567–572, https://doi.org/10.1016/j.tree.2003.09.004, 2003.
Rowe, S., Hutchings, J. A., Bekkevold, D., and Rakitin, A.: Depensation, probability of fertilization, and the mating system of Atlantic cod (Gadus morhua L.), ICES J. Mar. Sci., 61, 1144–1150, https://doi.org/10.1016/j.icesjms.2004.07.007, 2004.
Ruiz-Díaz, R., Dominguez-Petit, R., and Saborido-Rey, F.: Atlantic Cod Growth History in Flemish Cap Between 1981 and 2016: The Impact of Fishing and Climate on Growth Performance, Frontiers in Marine Science, 9, 876488, https://doi.org/10.3389/fmars.2022.876488, 2022.
Science Advisory Reports (SAR): Publications, SAR, https://www.isdm-gdsi.gc.ca/csas-sccs/applications/Publications/index-eng.asp, last access: 23 August 2023.
Sharpe, D. M. T. and Hendry, A. P.: Life history change in commercially exploited fish stocks: an analysis of trends across studies, Evol. Appl., 2, 260–275, https://doi.org/10.1111/j.1752-4571.2009.00080.x, 2009.
Shelton, A. O., Hutchings, J. A., Waples, R. S., Keith, D. M., Akçakaya, H. R., and Dulvy, N. K.: Maternal age effects on Atlantic cod recruitment and implications for future population trajectories, ICES J. Mar. Sci., 72, 1769–1778, https://doi.org/10.1093/icesjms/fsv058, 2015.
Shelton, P. A. and Healey, B. P.: Should depensation be dismissed as a possible explanation for the lack of recovery of the northern cod (Gadus morhua) stock?, Can. J. Fish. Aquat. Sci., 56, 1521–1524, https://doi.org/10.1139/cjfas-56-9-1521, 1999.
Sibly, R. M., Barker, D., Denham, M. C., Hone, J., and Pagel, M.: On the Regulation of Populations of Mammals, Birds, Fish, and Insects, Science, 309, 607–610, https://doi.org/10.1126/science.1110760, 2005.
Sinclair, M. and Iles, T. D.: Population regulation and speciation in the oceans, ICES J. Mar. Sci., 45, 165–175, https://doi.org/10.1093/icesjms/45.2.165, 1989.
Stephens, P. A., Sutherland, W. J., and Freckleton, R. P.: What Is the Allee Effect?, Oikos, 87, 185–190, https://doi.org/10.2307/3547011, 1999.
Stiasny, M. H., Mittermayer, F. H., Sswat, M., Voss, R., Jutfelt, F., Chierici, M., Puvanendran, V., Mortensen, A., Reusch, T. B. H., and Clemmesen, C.: Ocean Acidification Effects on Atlantic Cod Larval Survival and Recruitment to the Fished Population, PLOS ONE, 11, e0155448, https://doi.org/10.1371/journal.pone.0155448, 2016.
Stige, L. C., Hunsicker, M. E., Bailey, K. M., Yaragina, N. A., and Hunt, G. L.: Predicting fish recruitment from juvenile abundance and environmental indices, Mar. Ecol.-Prog. Ser., 480, 245–261, https://doi.org/10.3354/meps10246, 2013.
Sundby, S.: Recruitment of Atlantic cod stocks in relation to temperature and advectlon of copepod populations, Sarsia, 85, 277–298, https://doi.org/10.1080/00364827.2000.10414580, 2000.
Svedäng, H. and Hornborg, S.: Historic changes in length distributions of three Baltic cod (Gadus morhua) stocks: Evidence of growth retardation, Ecol. Evol., 7, 6089–6102, https://doi.org/10.1002/ece3.3173, 2017.
Swain, D. P.: Life-history evolution and elevated natural mortality in a population of Atlantic cod (Gadus morhua), Evol. Appl., 4, 18–29, https://doi.org/10.1111/j.1752-4571.2010.00128.x, 2011.
Swain, D. P. and Benoit, H. P.: Extreme increases in natural mortality prevent recovery of collapsed fish populations in a Northwest Atlantic ecosystem, Mar. Ecol.-Prog. Ser., 519, 165–182, https://doi.org/10.3354/meps11012, 2015.
Szuwalski, C. S., Vert-Pre, K. A., Punt, A. E., Branch, T. A., and Hilborn, R.: Examining common assumptions about recruitment: a meta-analysis of recruitment dynamics for worldwide marine fisheries, Fish Fish., 16, 633–648, https://doi.org/10.1111/faf.12083, 2015.
Tirronen, M., Perälä, T., and Kuparinen, A.: Temporary Allee effects among non-stationary recruitment dynamics in depleted gadid and flatfish populations, Fish Fish., 23, 392–406, https://doi.org/10.1111/faf.12623, 2022.
Trippel, E. A.: Age at Maturity as a Stress Indicator in Fisheries, Bioscience, 45, 759–771, https://doi.org/10.2307/1312628, 1995.
Tu, C.-Y., Chen, K.-T., and Hsieh, C.-H.: Fishing and temperature effects on the size structure of exploited fish stocks, Sci. Rep.-UK, 8, 7132, https://doi.org/10.1038/s41598-018-25403-x, 2018.
Van Leeuwen, A., De Roos, A. M., and Persson, L.: How cod shapes its world, J. Sea Res., 60, 89–104, https://doi.org/10.1016/j.seares.2008.02.008, 2008.
Vert-pre, K. A., Amoroso, R. O., Jensen, O. P., and Hilborn, R.: Frequency and intensity of productivity regime shifts in marine fish stocks, P. Natl. Acad. Sci. USA, 110, 1779–1784, https://doi.org/10.1073/pnas.1214879110, 2013.
Vet, S., Gelens, L., and Gonze, D.: Mutualistic cross-feeding in microbial systems generates bistability via an Allee effect, Sci. Rep.-UK, 10, 7763, https://doi.org/10.1038/s41598-020-63772-4, 2020.
Vortkamp, I., Barraquand, F., and Hilker, F. M.: Ecological Allee effects modulate optimal strategies for conservation in agricultural landscapes, Ecol. Model., 435, 109208, https://doi.org/10.1016/j.ecolmodel.2020.109208, 2020.
Winter, A.-M., Richter, A., and Eikeset, A. M.: Implications of Allee effects for fisheries management in a changing climate: evidence from Atlantic cod, Ecol. Appl., 30, e01994, https://doi.org/10.1002/eap.1994, 2020.
- Abstract
- Introduction
- Material and methods
- Results
- Discussion
- Conclusions
- Appendix A: Location of different Atlantic cod stocks
- Appendix B: Stock-assessment data and parameters
- Appendix C: The different stock-recruitment function components
- Appendix D: Optimization procedure and model validation
- Appendix E: Changes in population characteristics
- Code and data availability
- Author contributions
- Competing interests
- Disclaimer
- Acknowledgements
- Financial support
- Review statement
- References