the Creative Commons Attribution 4.0 License.
the Creative Commons Attribution 4.0 License.
 | 27 Nov 2023
Single-species dinoflagellate cyst carbon isotope fractionation in core-top sediments: environmental controls, CO2 dependency and proxy potential
Joost Frieling
Linda van Roij
Iris Kleij
Gert-Jan Reichart
Appy Sluijs
Sedimentary bulk organic matter and various molecular organic components exhibit strong CO2-dependent carbon isotope fractionation relative to dissolved inorganic carbon sources. This fractionation (εp) has been employed as a proxy for paleo-pCO2. Yet, culture experiments indicate that CO2-dependent εp is highly specific at genus and even species level, potentially hampering the use of bulk organic matter and non-species-specific organic compounds. In recent years, significant progress has been made towards a CO2 proxy using controlled growth experiments with dinoflagellate species, also showing highly species-specific εp values. These values were, however, based on motile specimens, and it remains unknown whether these relations also hold for the organic-walled resting cysts (dinocysts) produced by these dinoflagellate species in their natural environment. We here analyze dinocysts isolated from core tops from the Atlantic Ocean and Mediterranean Sea, representing several species (Spiniferites elongatus, S. (cf.) ramosus, S. mirabilis, Operculodinium centrocarpum sensu Wall and Dale (1966) (hereafter referred to as O. centrocarpum) and Impagidinium aculeatum) using laser ablation–nano-combustion–gas-chromatography–isotope ratio mass spectrometry (LA/nC/GC-IRMS). We find that the dinocysts produced in the natural environment are all appreciably more 13C-depleted compared to the cultured motile dinoflagellate cells, implying higher overall εp values, and, moreover, exhibit large isotope variability. Where several species could be analyzed from a single location, we often record significant differences in isotopic variance and offsets in mean δ13C values between species, highlighting the importance of single-species carbon isotope analyses. The most geographically expanded dataset, based on O. centrocarpum, shows that εp correlates significantly with various environmental parameters. Importantly, O. centrocarpum shows a CO2-dependent εp above ∼ 240 µatm pCO2. Similar to other marine autotrophs, relative insensitivity at low pCO2 is in line with active carbon-concentrating mechanisms at low pCO2, although we here cannot fully exclude that we partly underestimated εp sensitivity at low pCO2 values due to the relatively sparse sampling in that range. Finally, we use the relation between εp and pCO2 in O. centrocarpum to propose a first pCO2 proxy based on a single dinocyst species.
- Article
(3636 KB) - Full-text XML
-
Supplement
(426 KB) - BibTeX
- EndNote


Stable carbon isotope fractionation in marine autotrophs is governed for a large part by the carbon-fixing enzyme RuBisCO (e.g., Farquhar et al., 1989; Roeske and O'Leary, 1984), which implies most marine organic matter and therefore sedimentary marine organic matter is strongly 13C-depleted with respect to the dissolved inorganic carbon (DIC) source (CO2 (aq), HCO or CO), with the stable carbon isotope composition (δ13C) of organic matter ranging from −10 ‰ to −30 ‰ (Freeman and Hayes, 1992). While many groups of marine autotrophs show clear CO2-dependent carbon isotope fractionation (εp), the exact relation strongly varies between marine phytoplankton groups, genera and cell morphologies (Popp et al., 1998; Boller et al., 2011, 2015; Brandenburg et al., 2022). Still, because of the assumed CO2 dependency of RuBisCO fractionation, bulk marine organic matter and more specific organic compounds of marine autotrophs (e.g., lipids biomarkers) have been proposed and applied as pCO2 proxies over the past decades (Freeman and Hayes, 1992; Naafs et al., 2016). The application of these pCO2 proxies (e.g., Bijl et al., 2010; Pagani et al., 2011; Schoon et al., 2011; Witkowski et al., 2018) has provided constraints on past atmospheric pCO2 and earth system sensitivity beyond the ice core record (e.g., Pagani et al., 2010; PALAEOSENS, 2012).
However, many of the organic compounds used for CO2 reconstructions such as alkenones (e.g., Pagani, 2013), phytane (e.g., Witkowski et al., 2018), porphyrins (e.g., Freeman and Hayes, 1992) or bulk organic matter (e.g., Hayes et al., 1999) are not unique to a single species, genus and sometimes not even a group of organisms. This implies that reconstructions based on these compounds integrate interspecific differences in CO2 dependency, which complicates the interpretation of such proxy records. Secondly, even if specific compounds derive from a single species or genus, they intrinsically derive from a multitude of individual organisms, differing in shape and size, affecting isotopic fractionation and hence limiting the accuracy of such CO2 reconstructions.
Part of the uncertainties and biases in carbon isotope fractionation can be circumvented if the carbon isotopic fractionation of individual fossils can be analyzed. In recent years, significant progress has been made towards a CO2 proxy based on the stable carbon isotope fractionation in organic walled dinoflagellate cysts (Burkhardt et al., 1999; Hoins et al., 2015, 2016a, b; Wilkes et al., 2017). A fraction (∼ 15 %) of modern dinoflagellates produces an organic resting cyst or dinocyst as an obligatory part of their lifecycle (Evitt, 1985). The organic resting cysts from autotrophic species have excellent preservation potential and are often highly oxidation-resistant (Zonneveld et al., 1997, 2019; Kodrans-Nsiah et al., 2008), and several ubiquitous extant genera and species, such as Spiniferites spp. and Operculodinium centrocarpum, have extremely long geological records (Fensome et al., 1996; Williams et al., 2004). The ecology and morphology of these long-ranging species seemingly remained unchanged for millions of years (Frieling and Sluijs, 2018). Most importantly, recent advances in methodology allow for analyses of species-specific single-cyst δ13C (van Roij et al., 2017; Sluijs et al., 2018). This presents the opportunity to quantify environmental controls on εp of individual dinoflagellate cysts and hence species to assess the potential to obtain more accurate paleo-pCO2 estimates from sedimentary records.
Controlled growth experiments across a range of CO2 levels representative of the last glacial (e.g., Barnola et al., 1987) and modern and future carbon emission scenarios (Eberlein et al., 2016; Hoins et al., 2016a, b, 2015; IPCC, 2014; Rost et al., 2006; Van de Waal et al., 2013; Wilkes et al., 2017) showed species-specific CO2-dependent εp for multiple dinoflagellate species. From these, the species Protoceratium reticulatum and Gonyaulax spinifera (Hoins et al., 2015, 2016a, 2016b) are of particular interest as these produce the organic cyst species Operculodinium centrocarpum sensu Wall and Dale (1966), hereafter referred to as O. centrocarpum, and Spiniferites (cf.) ramosus, hereafter referred to as S. ramosus, respectively (Head, 1996; Zonneveld et al., 2013). These cyst species have their first occurrences in the geological records around ∼ 60 and 130 Ma (million years ago), for O. centrocarpum and S. ramosus, respectively (Williams et al., 2004), thus providing the potential for deep-time pCO2 reconstructions.
Before εp values based on dinocysts can be used for reconstructing pCO2, several fundamental questions need to be addressed. Although δ13CDIC exerts a major control on dinocyst δ13C (Sluijs et al., 2018), it remains uncertain whether the CO2 control on εp of motile cells from controlled growth experiments can be translated to their cysts formed in the natural environment. In addition, potential offsets in εp values between the motile cells and the cysts need to be established. This is especially important as the cell–cyst relations in carbon isotope ratios are not necessarily straightforward because bulk biomass such as cysts potentially deviates in δ13C values from the various cell components and potentially not by a constant offset (e.g., Freeman, 2001; Hayes, 2001; Pancost and Pagani, 2006; Schouten et al., 1998; Van de Waal et al., 2013; Wilkes et al., 2018).
We here present the first core-top data for single-species dinocysts to constrain the environmental controls on εp. We focus on the species O. centrocarpum and compare this data, when possible, to several species of Spiniferites (S. ramosus, S. mirabilis, S. elongatus) and Impagidinium aculeatum. The established environmental relations are subsequently evaluated using simple models converting carbon isotope fractionation in dinocysts into pCO2 values for the surface waters.
2.1 Materials
The primary dataset is based on 34 core-top samples (Table 1, Fig. 1), collected from the North Atlantic Ocean and Mediterranean Sea, with a secondary dataset based on pre-industrial sample material spanning ∼ 0–1500 common era (CE) from ENAM9606 for the North Atlantic (Richter et al., 2009). The core-top samples encompass a substantial natural pCO2 (aq) gradient because the rate of cooling of the North Atlantic Current exceeds that of CO2 uptake, whereas pCO2 in the Mediterranean is close to or slightly above equilibrium with the atmosphere. Sample selection is further based on the dinocyst occurrence maps of Zonneveld et al. (2013), including only samples with an expected relative abundance of at least 10 %–20 % of the target species. Similarly, the coverage of environmental parameters such as sea surface temperature (SST), pCO2 and difference in environmental settings was maximized during sample selection. Existing ocean databases are used for obtaining the relevant environmental parameters (Table 1).
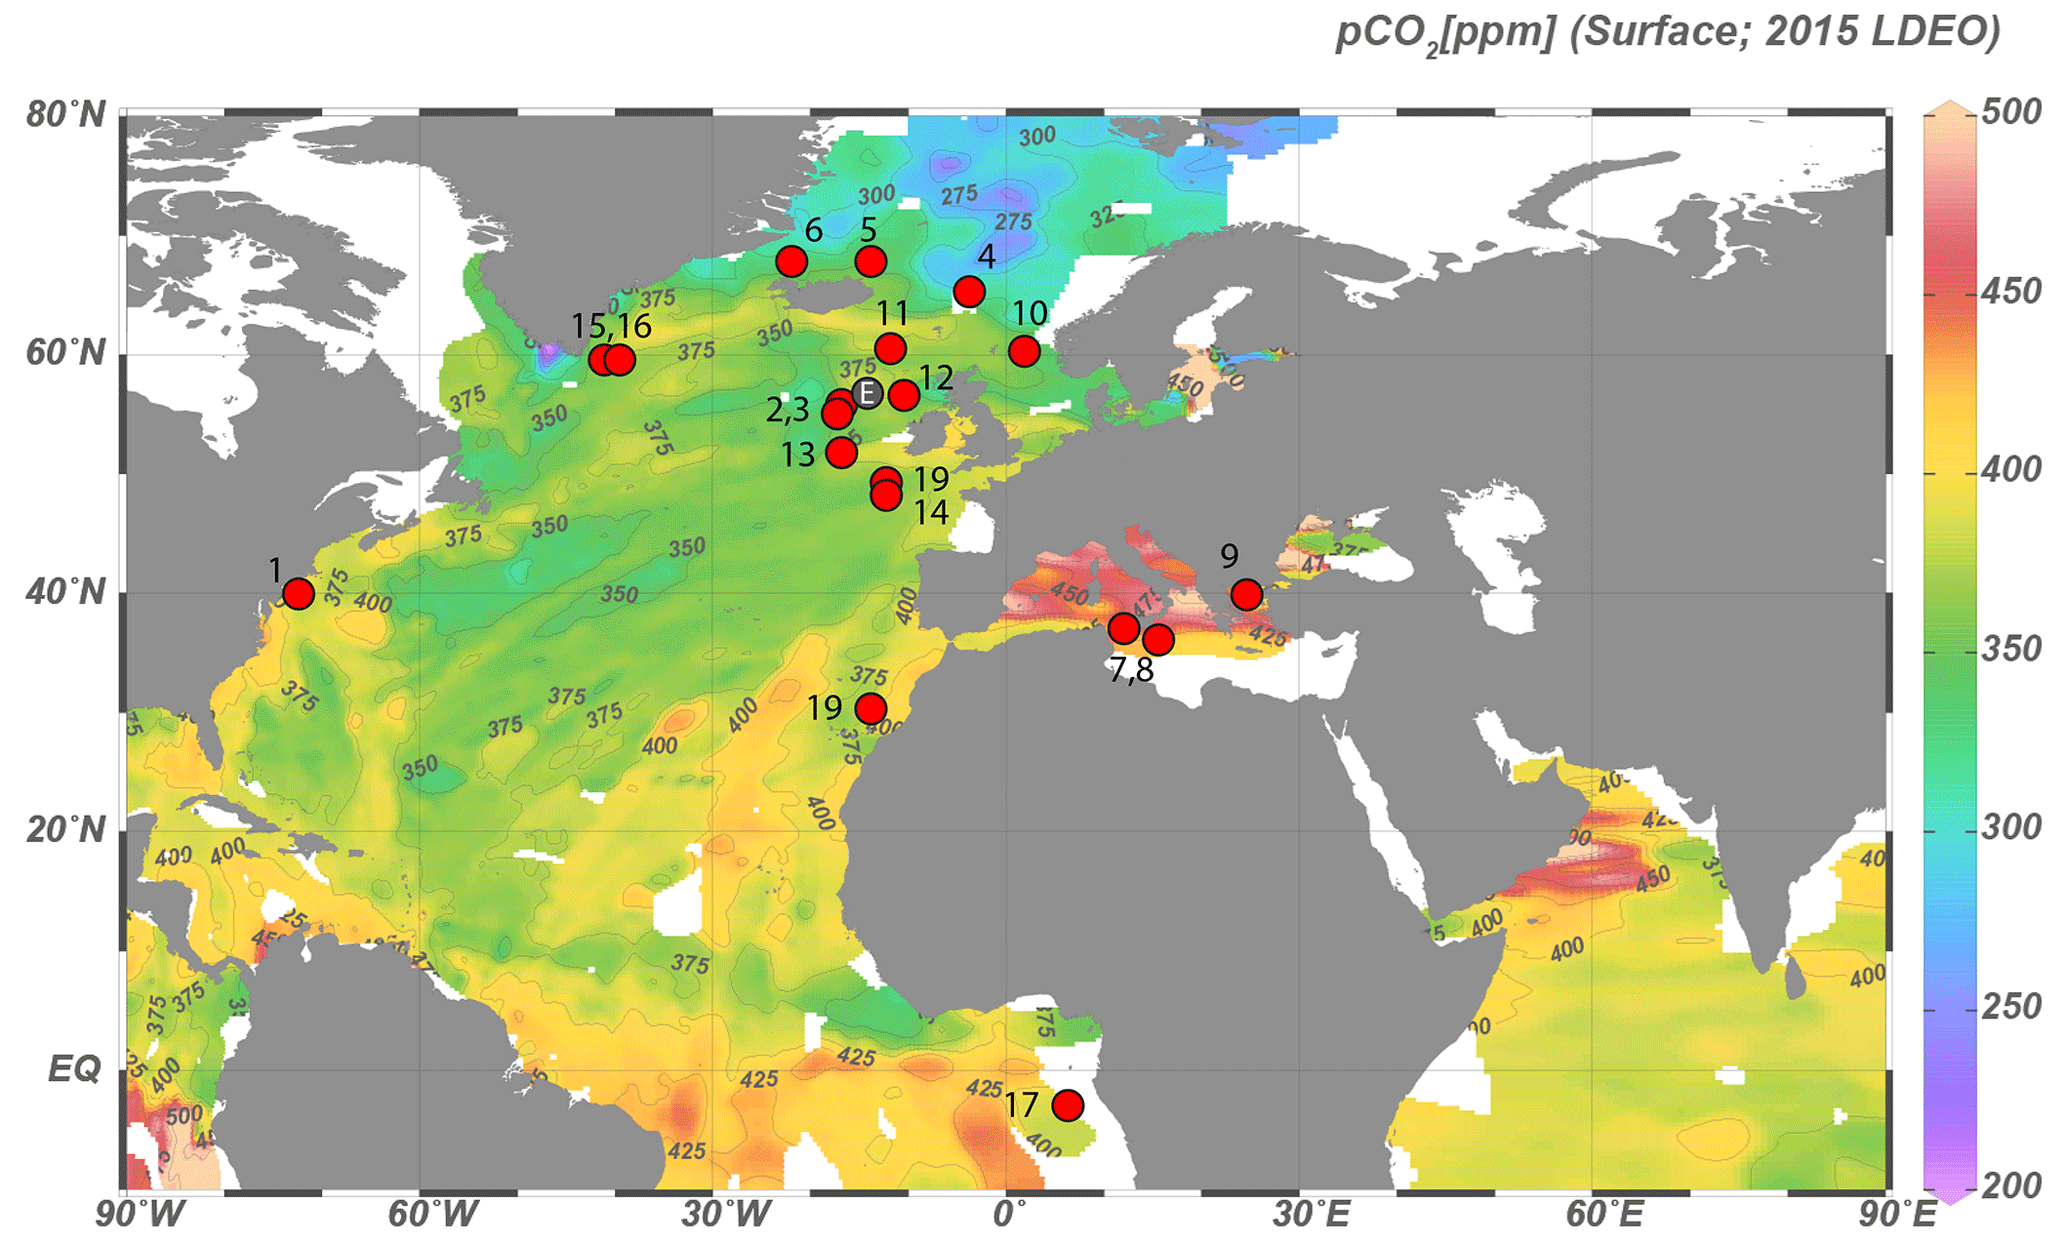
Figure 1Locations of samples with sufficient Operculodinium centrocarpum and/or Spiniferites spp for dinoflagellate cyst δ13C analyses. Numbers correspond to localities listed in Table 1. Down-core data location (ENAM9606; 55.650∘ N, 13.985∘ W) is marked by a gray dot (“E”) between core top nos. 2, 3 and 12.
2.2 Methods
Using standard palynological techniques (see, e.g., Brinkhuis et al., 2003), ca. 5–10 g freeze-dried sediment of the upper 1–2 cm of core material was processed for each sample. This involved dissolving carbonates and silicate components using strong acids (HCl 30 % and HF 38 %–40 %). After acid steps, residues were pH-neutralized and sieved using an ultrasonic bath and 250 and 10 µm nylon mesh sieves to remove large and small particles, respectively. Subsequently, samples were transferred to glass test tubes with demineralized water and centrifuged at 3200 rpm for 10 min to obtain an optimum concentrate of the sample material. Prior to dinocyst selection, samples were stored in 4 mL glass vials in demineralized water.
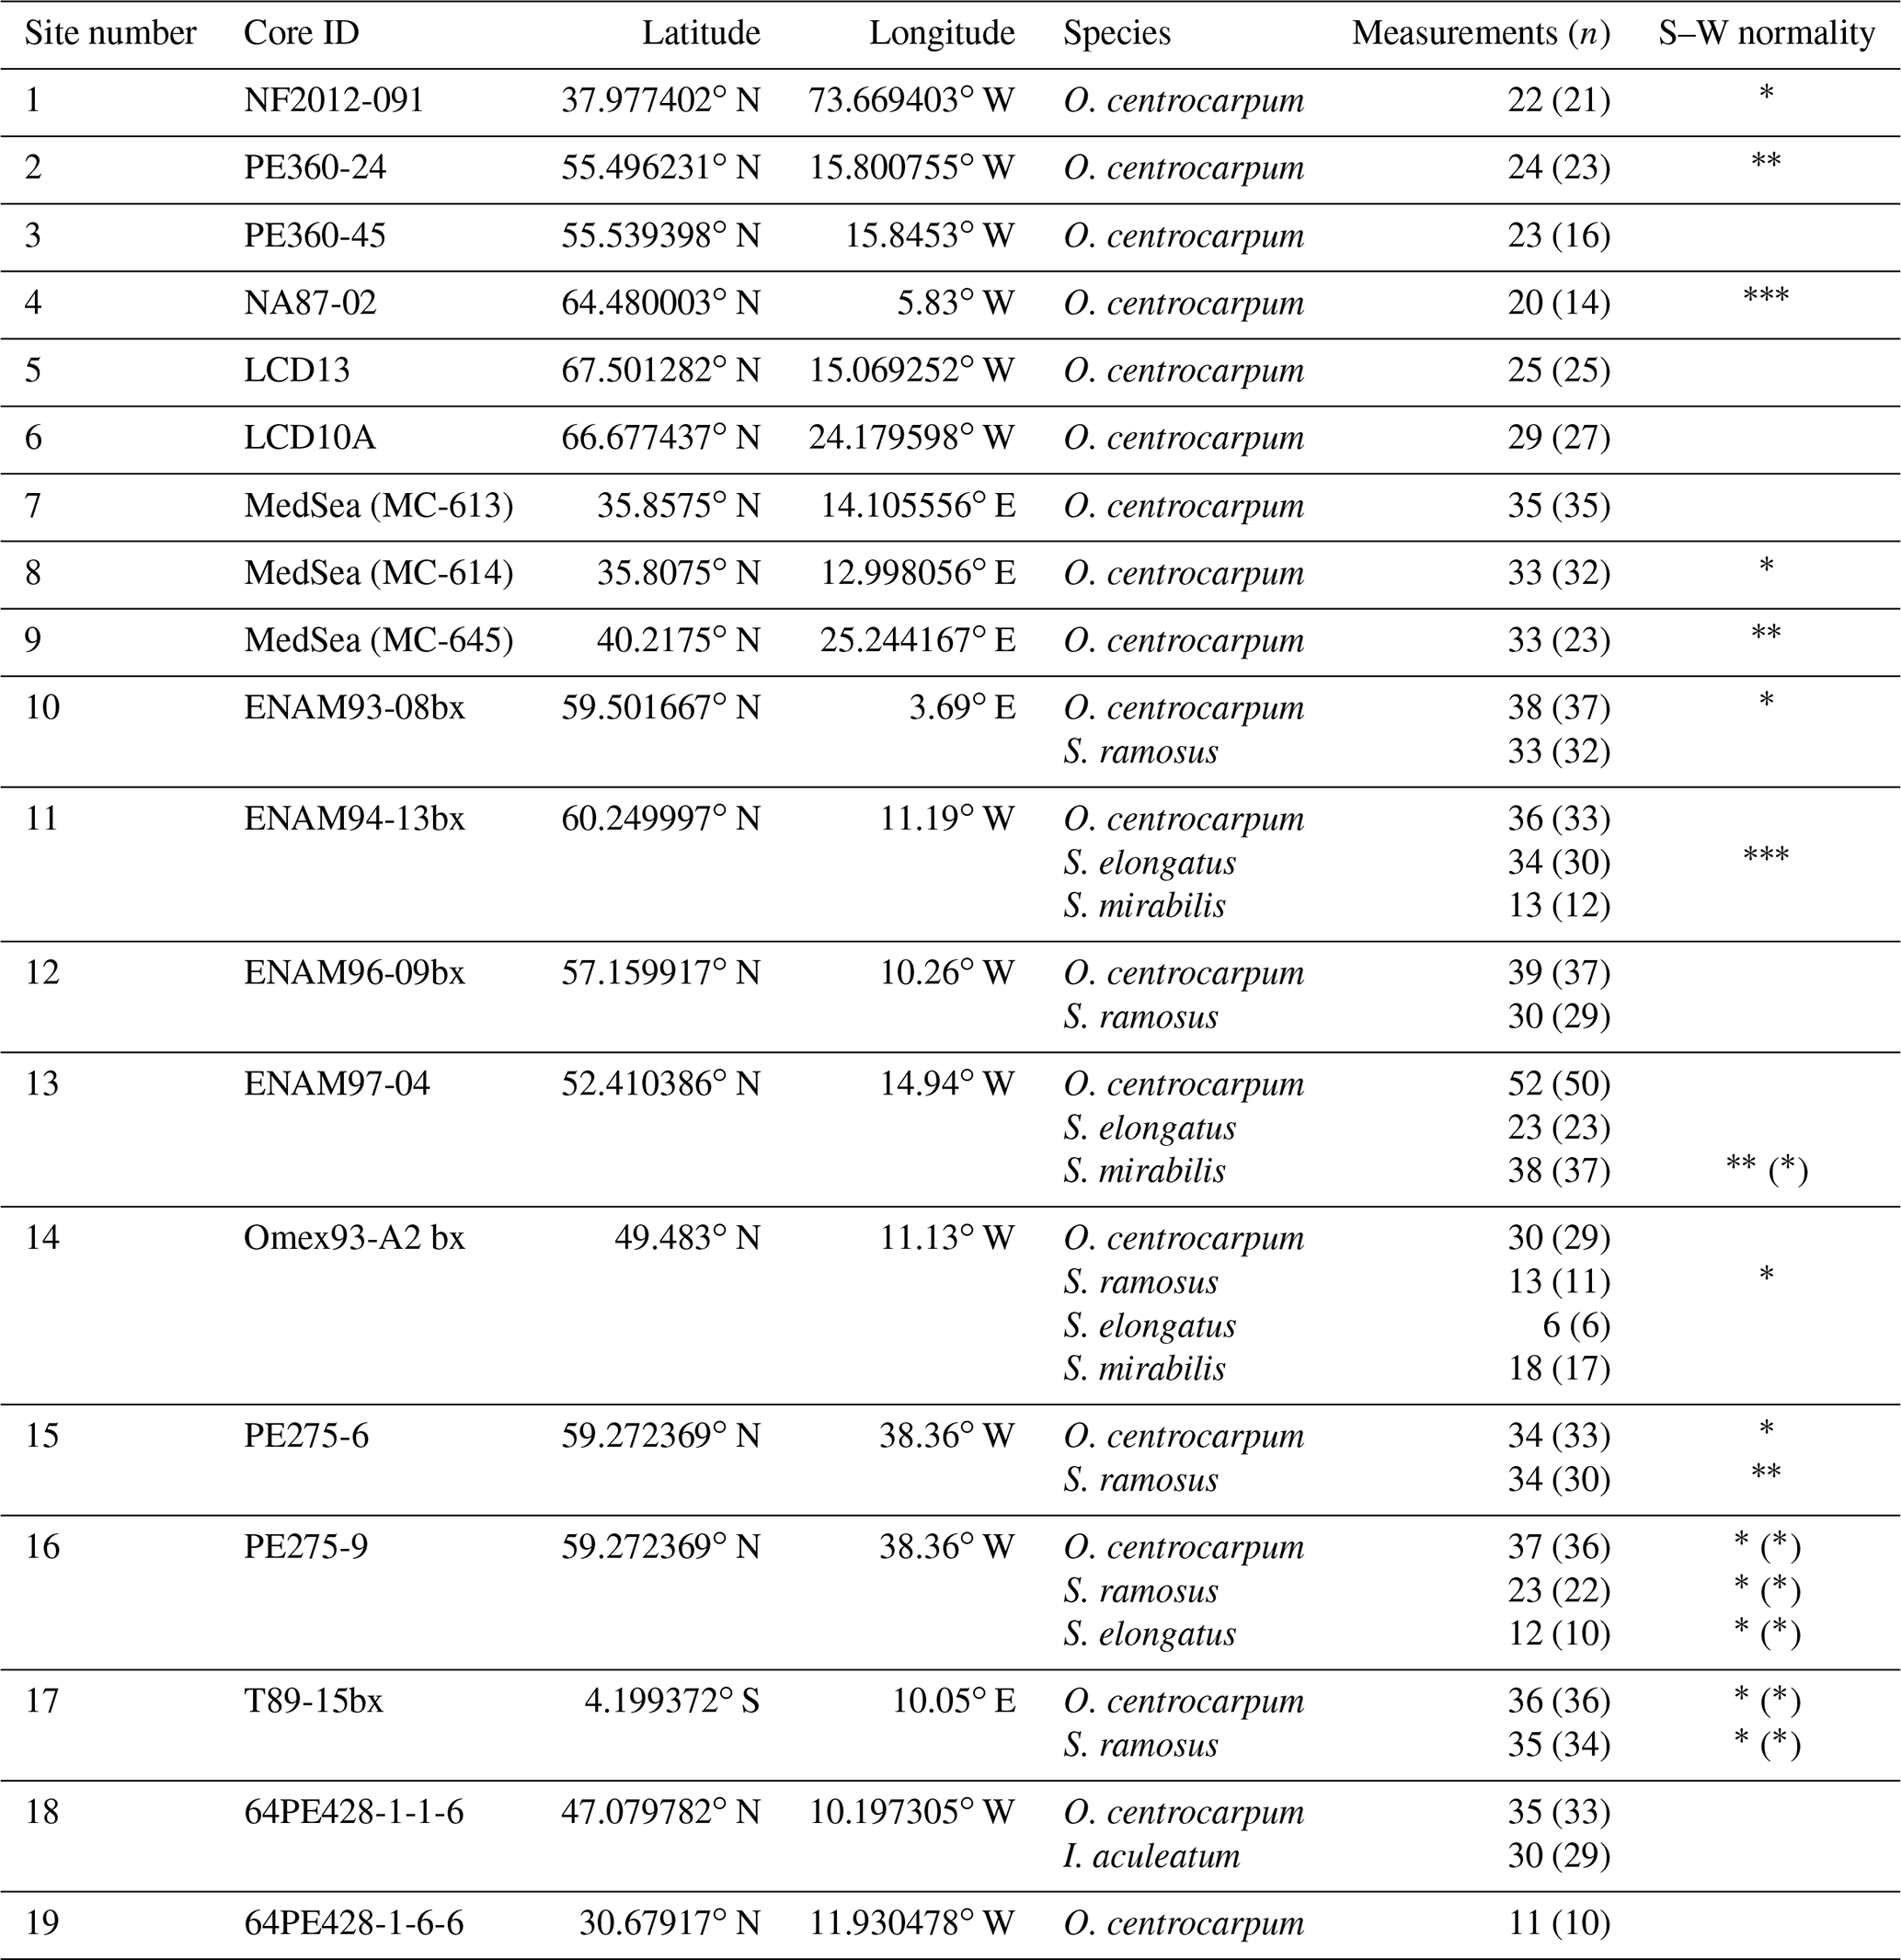
Table 1Core localities, analyzed species, number of measurements and normality of the carbon isotope data. Number of measurements is given as the total number and, in parentheses, the number of measurements used for environmental comparisons (see also results Sect. 3.4). Shapiro–Wilk (S–W) normality test on data: non-normal data distributions are indicated where p values are * < 0.1, < 0.01 and < 0.001; parentheses indicate the same for the data used for environmental comparisons. Site numbers correspond to those in Figs. 1 and 6a.
A micro-manipulator consisting of a Leica inverted microscope and a Narishige IM-9B micro-injector connected to a strung-out pipette was used to manually select individual dinocysts from a water droplet on a glass petri dish. Dinocyst selection followed a strict protocol, in which cyst morphology (primarily cyst shape and process length) was kept constant and the contribution of other organic particles was minimized. Specimens with darker coloration or amorphous organic matter adhering to the cyst or processes were avoided. In the case of O. centrocarpum, the morphological selection primarily involved selecting specimens of equal size and process length to avoid cysts that may be derived from different environments (e.g., Mertens et al., 2009). For Spiniferites, we were able to distinguish and separate three distinct morphological species in sufficient numbers: S. ramosus, S. elongatus and S. mirabilis. For all dinocyst species, the selected diameter excluding processes was in the order of ∼ 30–40 µm, except for S. mirabilis (∼ 60 µm), although constraining the exact size of each individual specimen was not feasible within the current analytical procedures. Stable carbon isotope analyses for individual samples are based on replicating the analyses of single of dinocysts, with ∼ 30 individual measurements being conducted to obtain a reasonably precise (∼ 0.3 ‰–0.4 ‰) sample average (van Roij et al., 2017). Given the size of the dinocysts used here (∼ 30–40 µm cyst diameter), three to seven specimens were required for each measurement, and hence ∼ 150 cysts were required to obtain sample averages (Table 1).
Dinocysts were placed on a 6 mm ∅ nickel sample tray, after which an identical second tray is added on top and compressed to fixate the dinocysts. Before placement in the ablation chamber, approximately ∼ 1 mm2 of International Atomic Energy Agency CH-7 (IAEA-CH7) polyethylene standard (PE; certified δ13C value −32.15 ‰ ± 0.05 ‰; 1σ) was added to the sample tray. Stable carbon isotope analyses of the dinocysts followed the procedures described in previous work (van Roij et al., 2017; Sluijs et al., 2018), utilizing the recently developed ablation–nano-combustion–gas-chromatography–isotope ratio mass spectrometry (LA/nC/GC-IRMS) method. Fragments resulting from deep-ultraviolet LA were carried using a continuous helium flow in 0.32 mm capillaries and oxidized in a combustion oven at 940 ∘C. The resultant CO2 was transported to a GC combustion interface, dried in a Nafion tube using a He counterflow and subsequently into a Thermo Fisher DeltaV Advantage IRMS for isotope analysis. Each analytical run included five standards with signal intensity above 4 Vs (ca. 40 ng C; δ13C precision better than 0.5 ‰) to allow calibrating to the Vienna Peedee Belemnite (VPDB) scale. Direct visual monitoring of the ablation process was used as initial quality assessment of each individual measurement.
To calculate the fractionation factor εp of the dinocysts relative to dissolved inorganic carbon (DIC) from which the dinocyst was produced, we take the δ13CDIC from the modeled grid of Tagliabue and Bopp (2008). As many dinoflagellate species, including those that produce O. centrocarpum and S. ramosus cysts, are able to utilize both HCO, which makes up the majority of DIC, and CO2 for carbon fixation (Hoins et al., 2016a), we also compare the δ13CDINO data to δ13C and to overall seawater carbon partitioning.
εp-DIC is calculated as δ13CDIC–δ13CDINO, and is calculated as δ13C–δ13CDINO. For the latter the δ13C of dissolved CO2 is calculated from δ13CDIC using the temperature-dependent fractionation between DIC and CO2 (aq) (Mook et al., 1974). To evaluate the dominant contributions to 13C fractionation in dinocysts, we compare the εp-DIC and values to measured and interpolated physicochemical parameters. We test a suite of parameters, [NO], [PO], [Si], alkalinity, pCO2, SST and sea surface salinity (SSS), which are extracted using Ocean Data View (https://odv.awi.de/, last access: 20 July 2020) from existing (gridded) datasets (Gouretski and Koltermann, 2004; Takahashi et al., 2014, 2016) (Supplement). Where possible, data are averaged over a grid of 4∘ longitude and latitude around the sample position. This is both to reduce errors introduced by data scarcity and to account for potential lateral transport of dinocysts during sinking (Nooteboom et al., 2019). Carbonate chemistry is calculated using the R package seacarb (Gattuso et al., 2021), with alkalinity and pCO2 as input variables to calculate the other relevant parameters of the carbonate system: the relative contributions of CO2 (aq), HCO and CO, i.e., carbon speciation.
Ideally, all environmental parameters would be known for the different locations as would the time the dinoflagellates lived and encysted. This is, however, unfeasible because the dinocysts assemblage in core-top sediments (typically the upper 2 cm of sediment) integrates conditions over several centuries, assuming moderate to low average sediment accumulation rates (< 10 cm kyr−1) that generally characterize open-ocean settings such as examined here. We therefore apply a rough correction for pCO2, based on the assumption that local air–sea gas exchange has remained similar, that equals the atmospheric pCO2 rise between the sampling date and 1850 CE. The correction from actual measurements to “pre-industrial” conditions for pCO2 yields a substantial offset due to the ∼ 90 ppmv atmospheric pCO2 rise from 1850 CE to the average sampling date (ca. 2000 CE). As this correction is broadly similar for all sample localities, it has only a small impact on the overall pattern in the CO2 data (Fig. 3). We employed a Monte Carlo simulation to assess the potential impact of the pCO2 correction by propagating (1) the 5 % analytical error in pCO2 values and adding 45 ± 15 ppm to reflect a normally distributed mixture of modern and pre-industrial conditions and (2) a resampled uncertainty derived from the pCO2 rise since pre-industrial times (1800–2000 CE). Both scenarios are set up to represent worst-case scenarios; a single error drawn from the error distribution is imposed on a sample basis and not a resampled average of the number of δ13CDINO measurements within a sample, as that would reduce the error through averaging.
Changes in SST, SSS and nutrient concentrations are also expected, partly also by anthropogenic activity, but offsets in these parameters are generally subtle and more local compared to the changes in pCO2 and hence would require site-specific reconstructions. Still, recent widespread eutrophication and enhanced productivity may impact the carbon isotope results through increased DIC uptake in algal blooms (i.e., counteracting the impact of enhanced pCO2). However, as eutrophication has mainly affected coastal areas (Hallegraeff, 1993; Anderson et al., 2002), this is expected to play a minor factor at our, mostly open marine, sample localities (Fig. 1). Lastly, long-term natural changes in nutrients, SSS and SST also occur, and it is currently not possible to fully filter out the various anthropogenic offsets. With the exception of pCO2, we hence assume all parameters (SST, SSS, nutrients) to have remained constant over the period the core-top samples represent.
3.1 Carbon yields from dinocyst analyses
Despite our pre-screening to include only samples with high relative abundances of the target species, some of the selected samples contained too few dinocysts or at too low an abundance relative to other organic particles (amorphous organic matter, plant debris, pollen, non-dinocyst marine palynomorphs etc.) to be used in our study. Ultimately, out of the initial core-top sample set of 34 samples, 19 were found suitable for species-specific dinocyst stable carbon isotope analyses (Table 1).
Typically, ∼ 150 individual cysts were picked and analyzed for a total of 20–50 measurements, amounting to three to seven cysts per carbon isotope measurement. We calculate an average signal size of 0.2 Vs for a single cyst, which amounts to a carbon yield of ∼ 6–7 ng C per cyst (van Roij et al., 2017). Although the variability in signal intensity from individual measurements suggests there is substantial intra-sample (cyst–cyst) variability, no significant offsets in average carbon content per cyst were observed between samples, suggesting the average carbon content of the cysts within each of the analyzed populations is similar. Spiniferites mirabilis is the notable exception to this rule, as far fewer specimens of this species are needed for a single δ13Ccyst measurement. Based on the signal intensity per specimen, we estimate that this larger cyst species contains twice the amount of C compared to S. ramosus, S. elongatus and O. centrocarpum.
3.2 Carbon isotope data
3.2.1 Signal intensity
The 949 individual core-top analyses range in δ13C from ∼ −18.5 ‰ to −35.5 ‰ (all δ13C are relative to Vienna Peedee Belemnite (VPDB)), and the 137 down-core analyses range from ∼ −19.4 ‰ to −28.1 ‰. No relation was observed between δ13C and signal size (Vs), except at the very low end (≤ 0.2 Vs) (Fig. 2), in line with earlier analyses (van Roij et al., 2017). In this low range, the median of the δ13C values rises from −28 ‰ below 0.1 Vs to values between −22 ‰ and −25 ‰ above 0.2 Vs. In the ≤ 0.2 Vs range the δ13C averages of both the cysts and PE converge between −25 ‰ and −30 ‰, with substantial scatter. Poorer performance at such low C masses and signal intensities is expected, as these extremely small signal sizes and poor signal-to-noise ratio (below ∼ 3:1) approach the limit of our method. Consequently, even a very minor contamination source would bias values and result in larger scatter, as is also apparent in the PE standard at a similar signal intensity (van Roij et al., 2017; Fig. 2). Due to a worsening signal-to-noise ratio, we find that a noticeable degree of δ13C biasing from a background C source within the system is likely to occur at signal intensities ≤ 0.5 Vs and is particularly pronounced ≤ 0.2 Vs, and values for the standard and dinocysts converge around −27 ‰ in this range (Fig. 2a). A similar background δ13C value was also obtained after liquid nitrogen trapping (van Roij et al., 2017). The source of this C remains elusive. It is unlikely to be related to the ablation (etching) of the nickel plate or associated with the water used to pick samples from, as measured blanks for those result in much lower signal intensities and neither source would affect the measurements of the PE standard. Lastly, a significant contribution of atmospheric CO2 (δ13C around −8 ‰) appears unlikely due to the δ13C signature of the background signal (−27 ‰). Though the origin of the background C remains unknown, we can use the trapping experiment to estimate the relevant background contribution (van Roij et al., 2017). We calculate the typical contribution is likely between 0.024 and 0.08 Vs, given a background C flux of 0.0008 Vs per second (van Roij et al., 2017) and a typical duration of measurements (30–50 s for δ13CDINO and up to ∼ 100 s for PE standard).
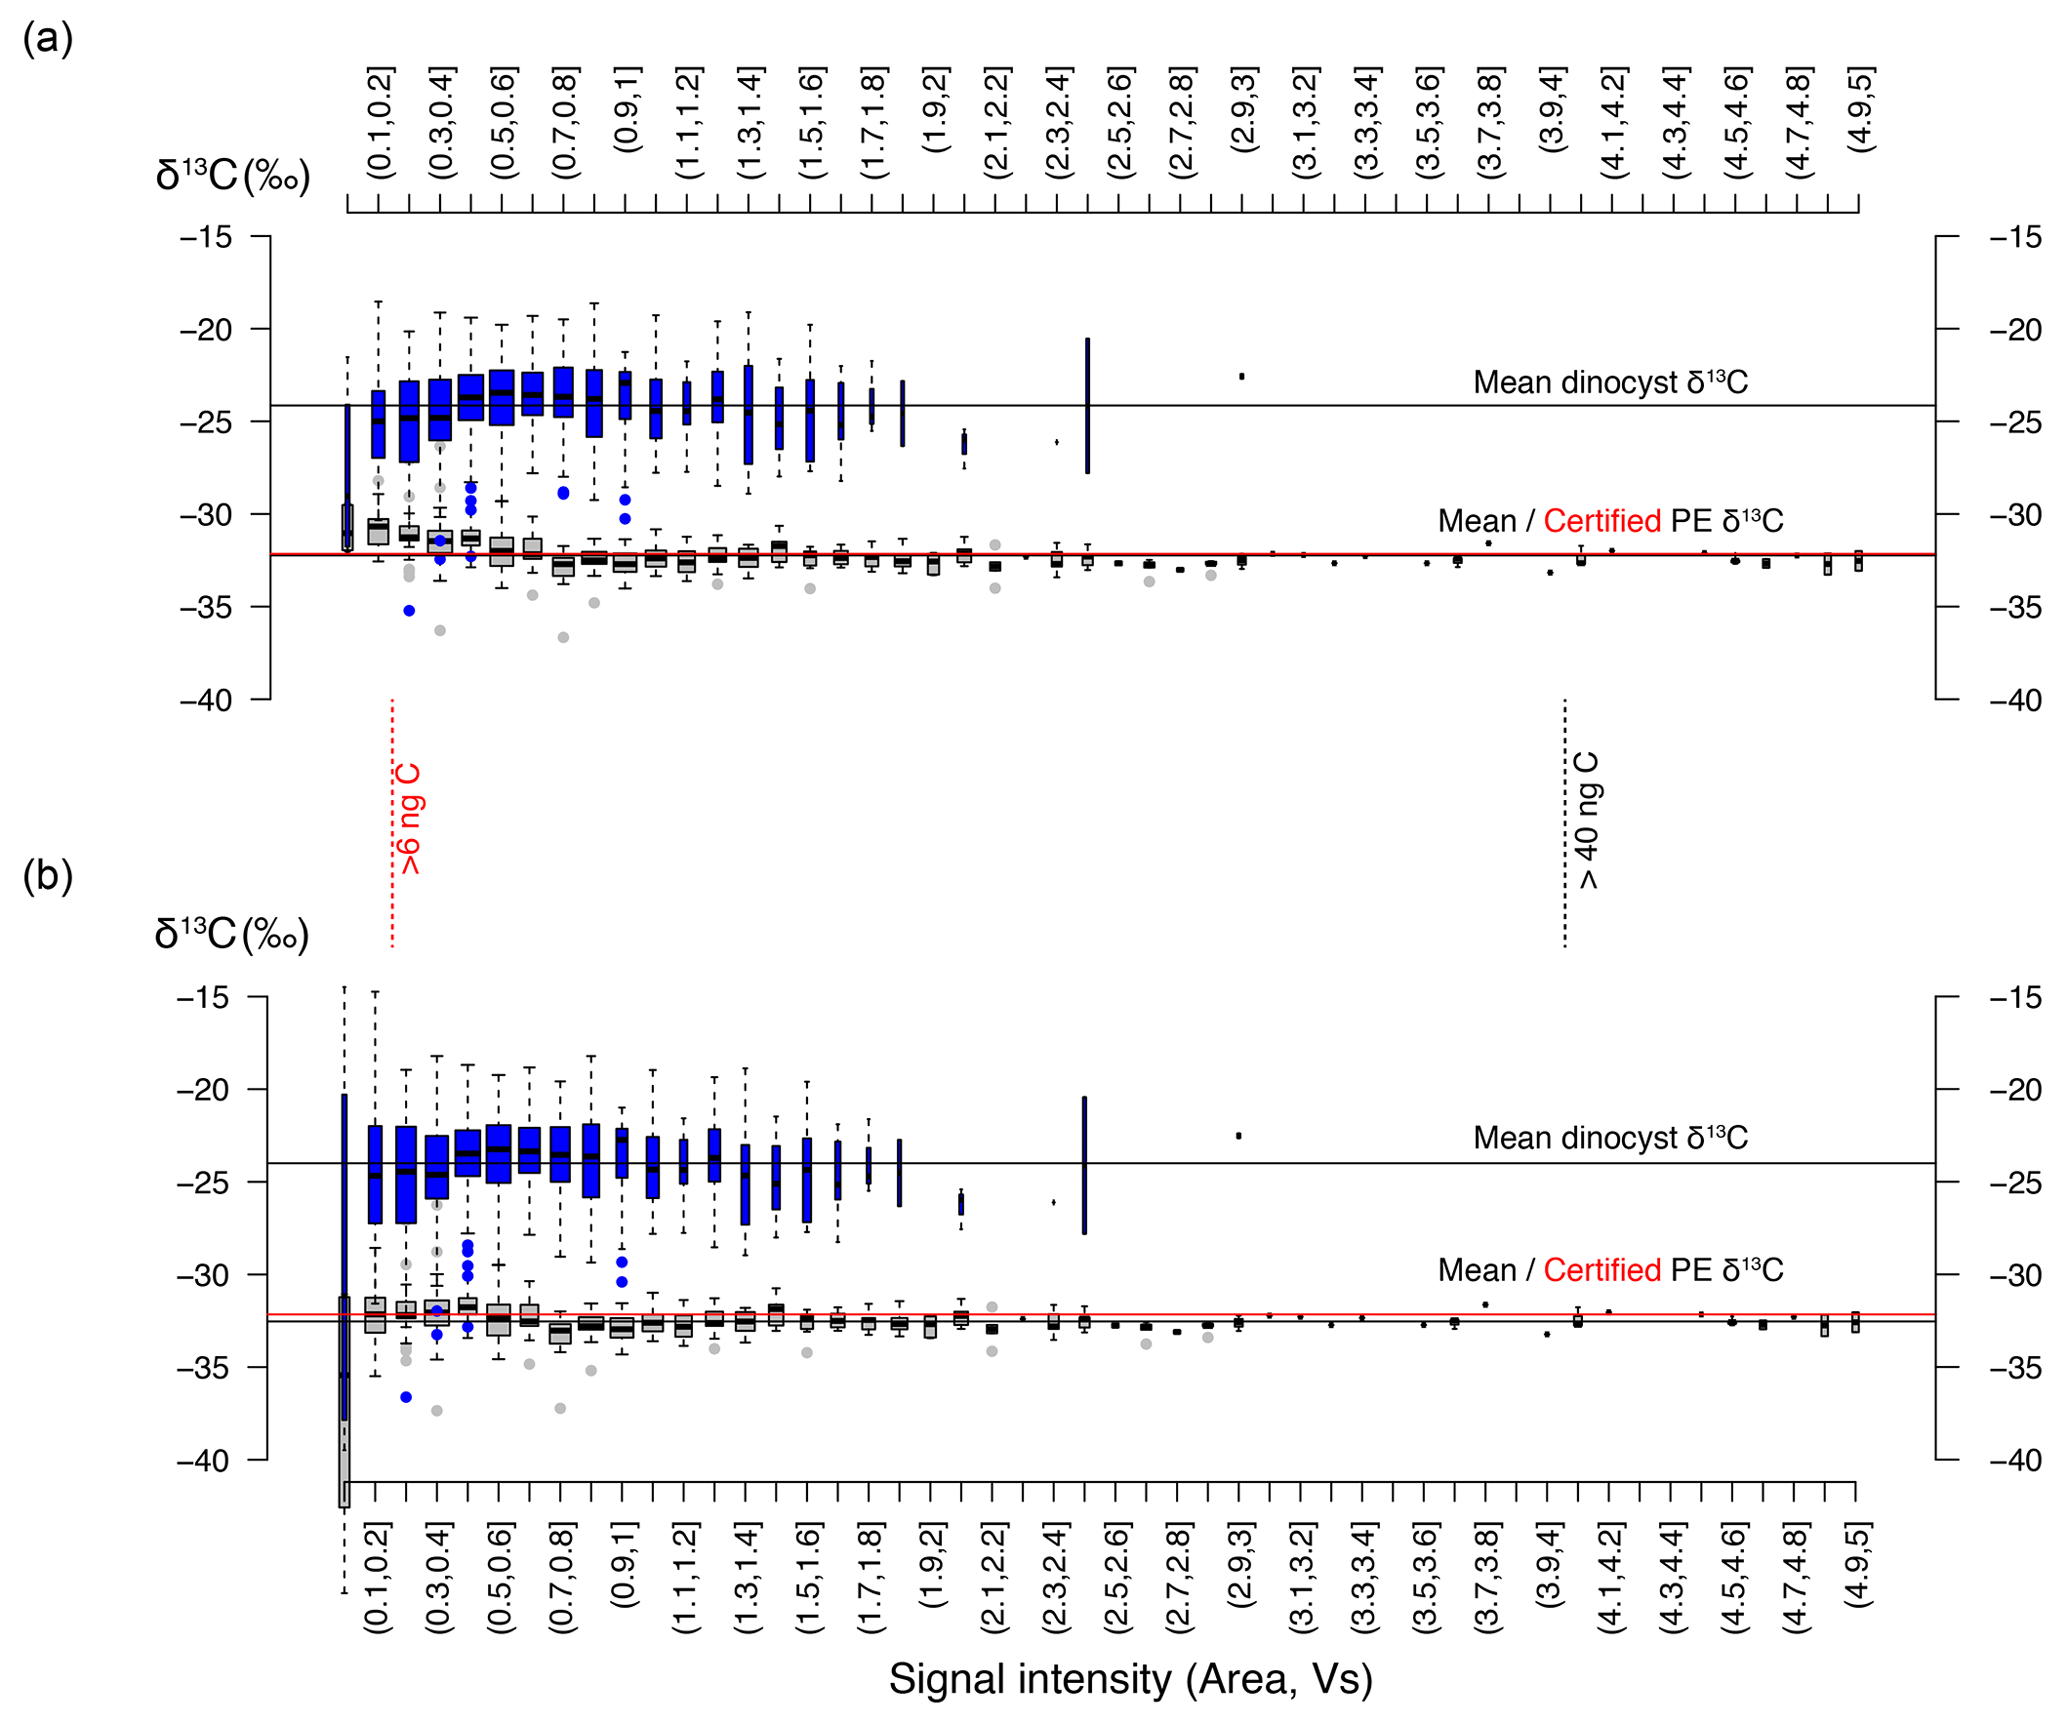
Figure 2Signal intensity in volt seconds (Vs) versus carbon isotope value distribution within bins of 0.1 Vs. (a) The blue boxplots represent our new dinocyst δ13C, and the gray boxplots represent the previously published data for the PE standard (δ13C value −32.15 ‰ ± 0.05 ‰; 1σ). (b) Same as (a). but for background-corrected values (see Sect. 3.2). The vertical black and red lines represent cut-off values for individual PE standard measurements (>4 Vs; ∼ 42 ng C; 0.5 ‰ precision) and individual cyst measurements (>0.2 Vs; ∼ 6 ng C), respectively. The width of each boxplot is square-root-scaled with the number of measurements in the respective bins. Note that several bins at the high end do not contain any data.
Before comparing our data with environmental variables, we therefore assess the impact of a very minor, but consistent, background contamination on the carbon isotope signal at low signal intensities (e.g., Fig. 2a). We find that a constant addition of ca. 0.04 Vs (≤ 1 ng C) of a background C source with a δ13C of −27 ‰ can explain the positive skewing in the standard PE δ13C. Using a simple isotope endmember and mass balance mixing model to correct for skewing (Fig. 2b), we calculated an average deviation from the measured PE and dinocyst values for intensities below 0.2 Vs in the order of and , respectively. The standard deviation of the data increases approximately 3-fold (Fig. 2b) compared to the raw measurement data below 0.2 Vs but remains virtually unchanged above 0.2 Vs, and the calculated deviation from the measured value is also much reduced above 0.2 Vs ().
The data correction using our simple mixing model eliminates the skew towards −27 ‰ at low signal intensities and removes signal size δ13C dependency below 0.2 Vs for both the isotopically homogeneous PE and the heterogeneous dinocyst data (Fig. 2a, b). This suggests that our method of bias correction is warranted, but the increased variability at very low intensities and lack of independent control on the exact size and δ13C of the background contamination imply that the data associated with the lowest signal intensities remain significantly less reliable. We therefore apply a conservative cut-off and use only corrected data with a signal size above 0.2 Vs.
3.2.2 Skewed distributions and outlier omission
The drift-corrected δ13CDINO is non-normally distributed in many core-top samples and also in different species (Table 1, Fig. 4). Distributions tend to be tailed towards lower values, exaggerated by the presence of a small number of outlier values. This is not due to analytical error or otherwise directly related to low signal intensity as we used a 0.2 Vs cut-off to eliminate samples with potentially unreliable signal-to-noise ratios (see above), and a minor correction for background C addition was sufficient to eliminate skewing at low signal intensities. The absence of such signals in the down-core samples (Supplement Fig. S1) suggests that the outliers and skewing in the sampled core-top populations could represent a real signal.
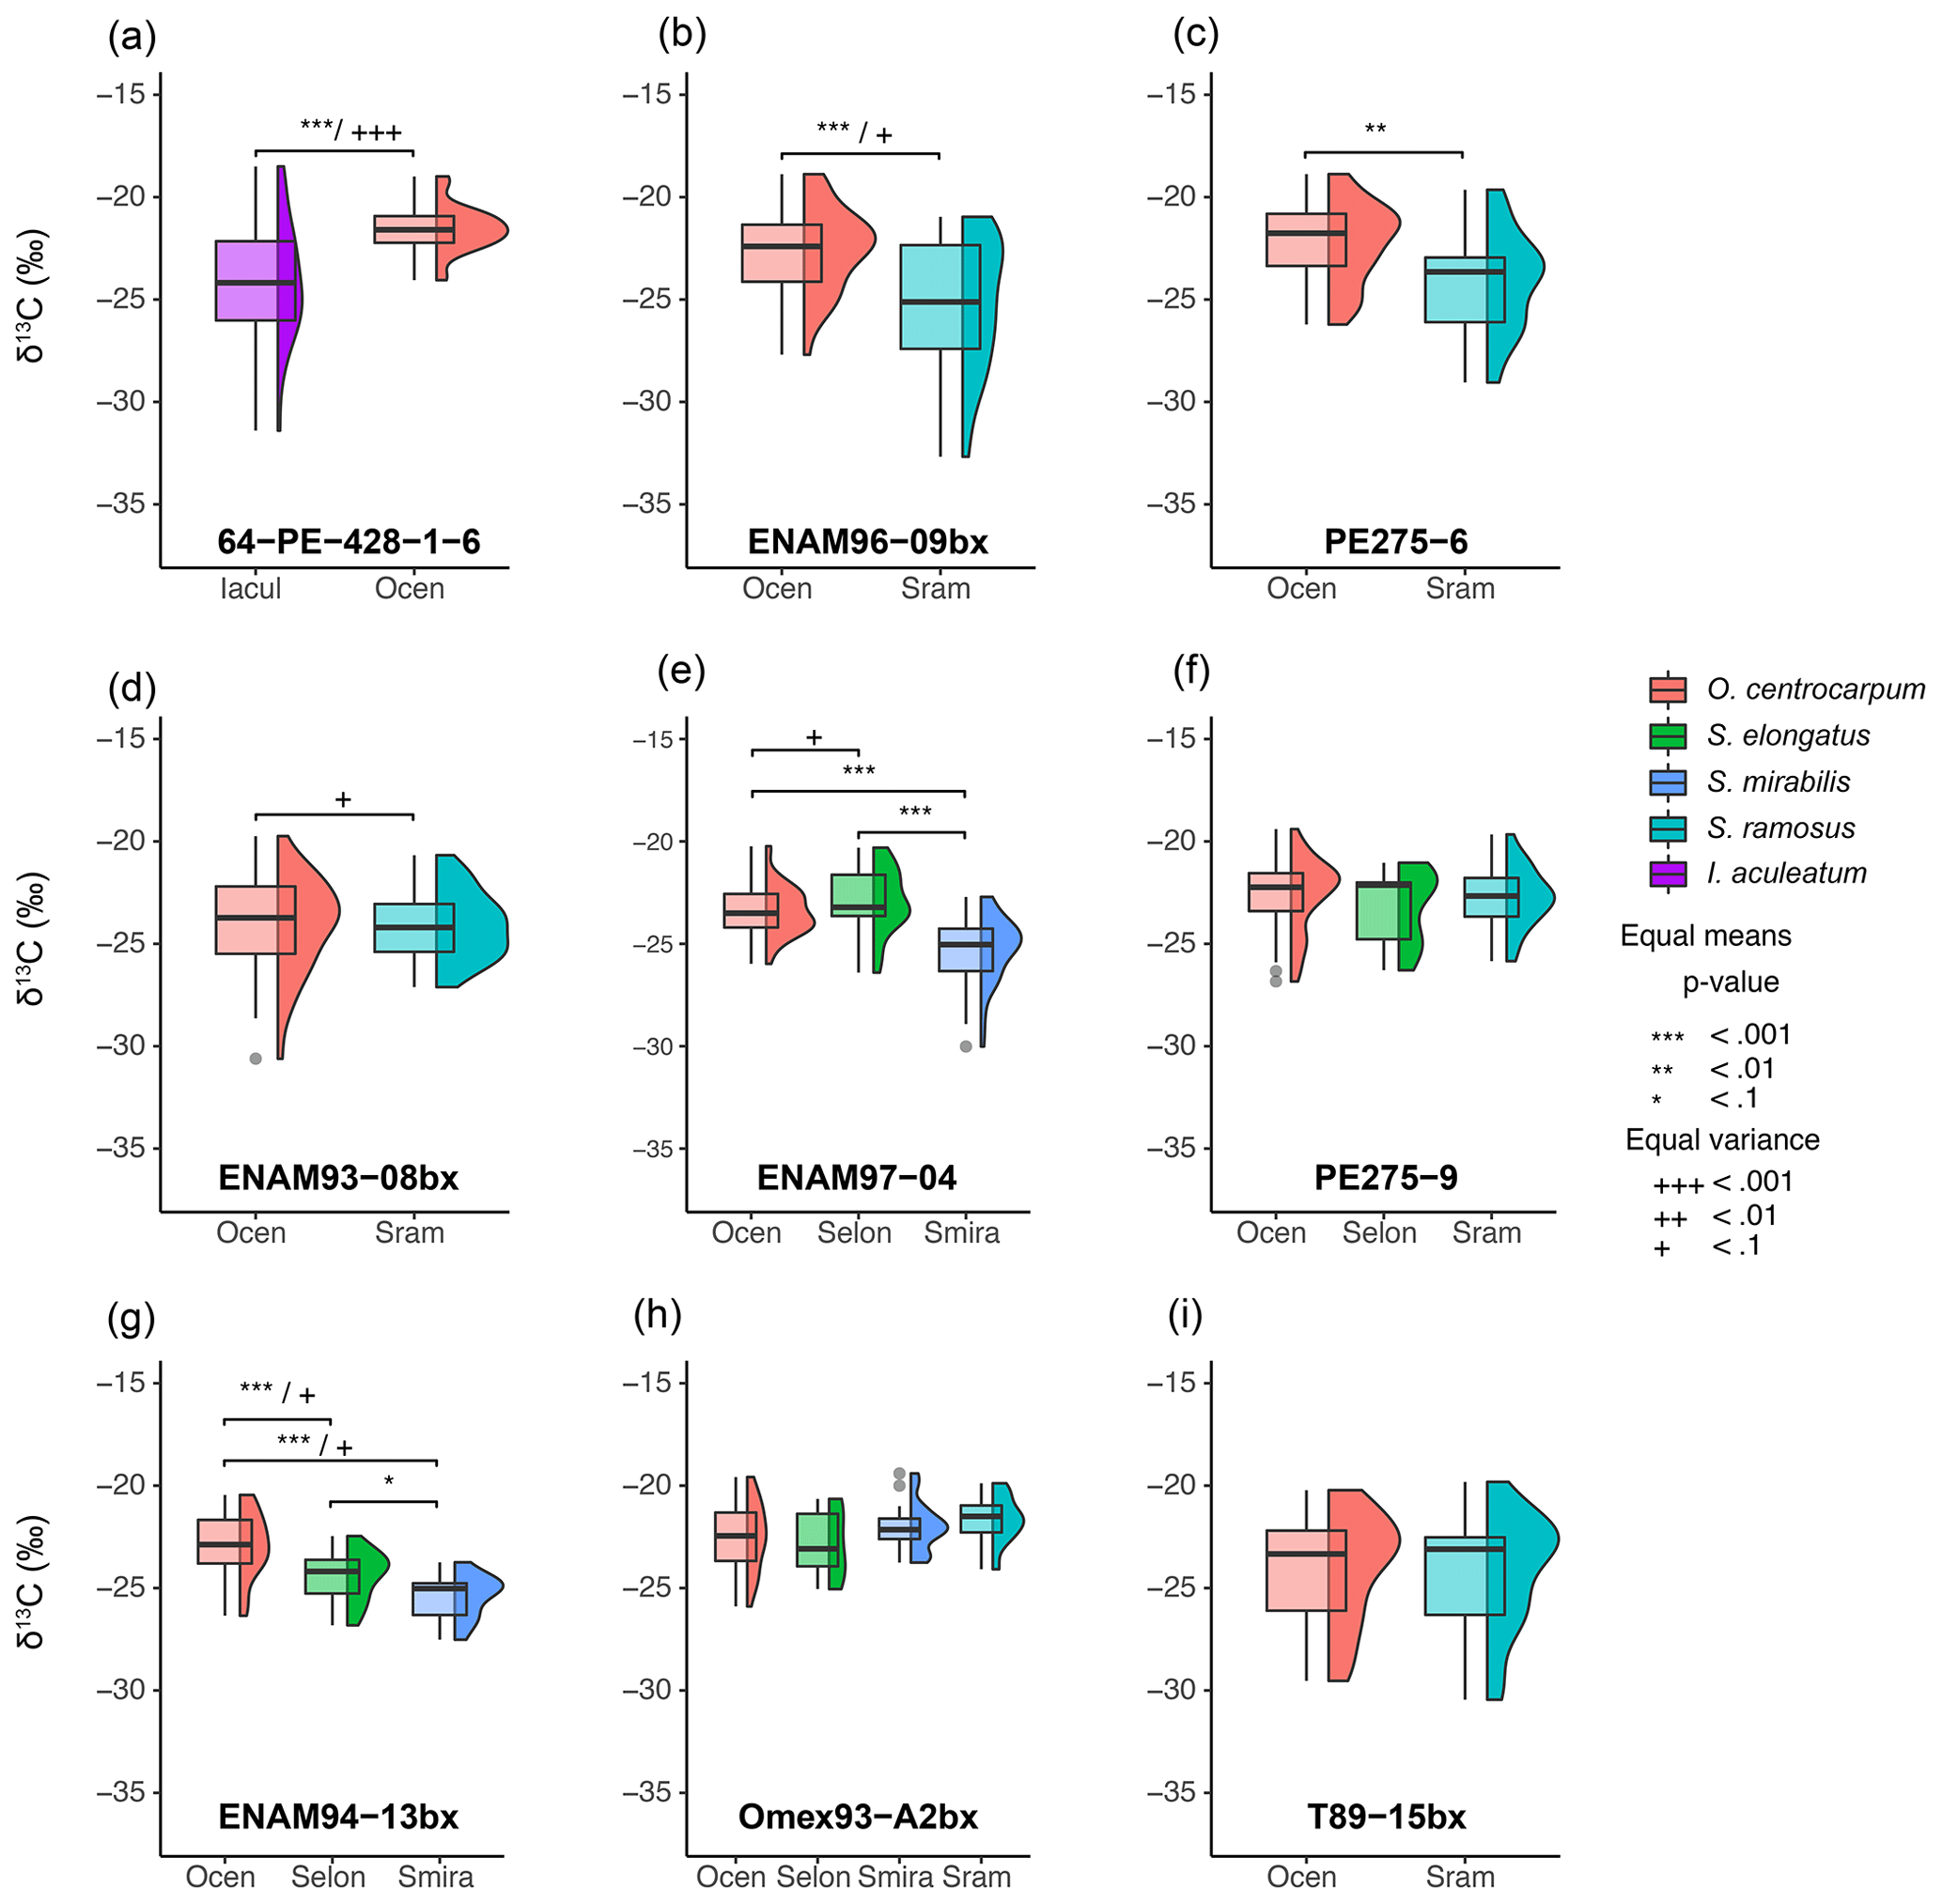
Figure 4Carbon isotope measurements for multiple species; each panel represents a single sample after eliminating extremely small measurements sizes (< 0.2 Vs), carrying out background correction and removing outliers (± 2.5 interquartile range) (Sect. 3.2). Each box–whisker and δ13C distribution plot represents a set of measurements for a single species at their respective locality; note that tailing towards negative δ13C is common. Brackets above species δ13C populations indicate significant differences in means and variance for different species within a single sample.
Based on typical deep-ocean sedimentation rates in the range of centimeters per kiloyear, the core-top samples are expected to contain a mixed assemblage of dinocysts produced mostly within the last centuries to millennia but could also include cysts produced during the last few decades that are likely affected by anthropogenic influences. It is particularly relevant to consider because a steep δ13C decrease (∼ 2 ‰ since 1850 CE, of which > 1.5 ‰ occurs after 1950 CE) (Francey et al., 1999; Keeling et al., 2017) accompanies the pCO2 rise (> 130 ppmv since 1850 CE, of which > 100 ppmv after 1950 CE). So even if enhanced carbon isotope fractionation at higher pCO2 (Freeman and Hayes, 1992; Hoins et al., 2015; Brandenburg et al., 2022) did not play a role, the most recent specimens are likely to be impacted by decreasing δ13CDIC.
As age integration in the modern era may result in a mixture of cysts representing a range of environmental conditions, especially with respect to CO2 concentrations and δ13CDIC, it is important to consider the potential age distribution of dinocysts before comparing δ13CDINO and εp to environmental variables. In an ideal scenario, cysts produced after 1850 CE should be avoided in proxy-calibration efforts to eliminate a systematic bias towards the most recent times when atmospheric CO2 was already elevated above pre-industrial Holocene background (∼ 280 ppmv). Because an accurate age correction for the Suess effect is technically unfeasible because the age distribution of δ13CDINO measurements cannot be constrained, we illustrate the influence of δ13CDINO data treatment (Fig. 3) and use Monte Carlo simulations of different error distributions to test the potential impact of the pCO2 correction. We also compared both measured pCO2 and pCO2 around 1850 CE (see Sect. 2.2) to εp calculated using both our raw δ13CDINO data and the δ13CDINO data after drift correction and removal of statistical outliers identified within the sample-specific single-species populations. This final step of data treatment removed positive and negative measurement outliers from the sample- and species-specific δ13C population (outside ± 2.5 IQR), after eliminating the extremely low-signal intensities (< 0.2 Vs) and correcting for the drift induced by background C in the system.
Altogether, out of a 949 core-top measurements, we omit 43 measurements with signals < 0.2 Vs and 24 statistical outliers, which leaves 882 individual δ13CDINO measurements: 560 for O. centrocarpum, 293 for Spiniferites (158 S. ramosus, 69 S. elongatus and 66 S. mirabilis) and 29 for I. aculeatum (Table 1). Most of the 67 omitted measurements have comparatively low δ13C, and the resulting δ13C of the populations is close to statistically indistinguishable from a normal distribution (Shapiro–Wilk p=0.05–0.1) or representative of a normal distribution (Table 1). Although the data treatment partly removed the negative skew on the δ13CDINO distribution (Table 1), the combined effects of drift correction and outlier removal on sample and species-mean δ13CDINO are generally small (Fig. 3). This is expected as drift correction averages only ∼ 0.25 ‰, and the negative and positive outliers represent only a small percentage of the total measurements (Table 1).
Distinctly non-normally distributed δ13C values were not previously observed in recent pollen and ancient dinocyst species analyzed with the same method (van Roij et al., 2016; Sluijs et al., 2018). The here presented down-core pre-industrial δ13CDINO shows a similar mean, variance and data distribution to the nearby core-top samples (Supplement Fig. S1), suggesting that, at least for these nearby localities, the analyzed core-top specimens represent pre-industrial conditions. We find that an influence of the Suess effect and increased pCO2 impacts on the δ13CDINO data is the most likely factor to explain the appearance of a small number of predominantly 13C-depleted outliers and resulting (subtle) negative skewing of the δ13C distributions (Fig. 4).
We use the background and outlier-corrected δ13CDINO data and compare these data with CO2 conditions prevalent around 1850 CE (Fig. 6) and explore the effects of age integration by propagating different error distributions representative of the pCO2 change since 1850 CE (Fig. 7b–d). For practical purposes, we assume all δ13CDINO populations to be normally distributed for further statistical analyses. We then use the mean carbon isotope value (δ13CDINO) and signal intensity in volt seconds (Vs) of each sample. The standard error of the mean ranges from ∼ 0.2 ‰ to 0.7 ‰ and depends primarily on the number of measurements in cases where n < 30, in line with expected values based on replicate measurements of the PE standard (van Roij et al., 2017) (Fig. 5).
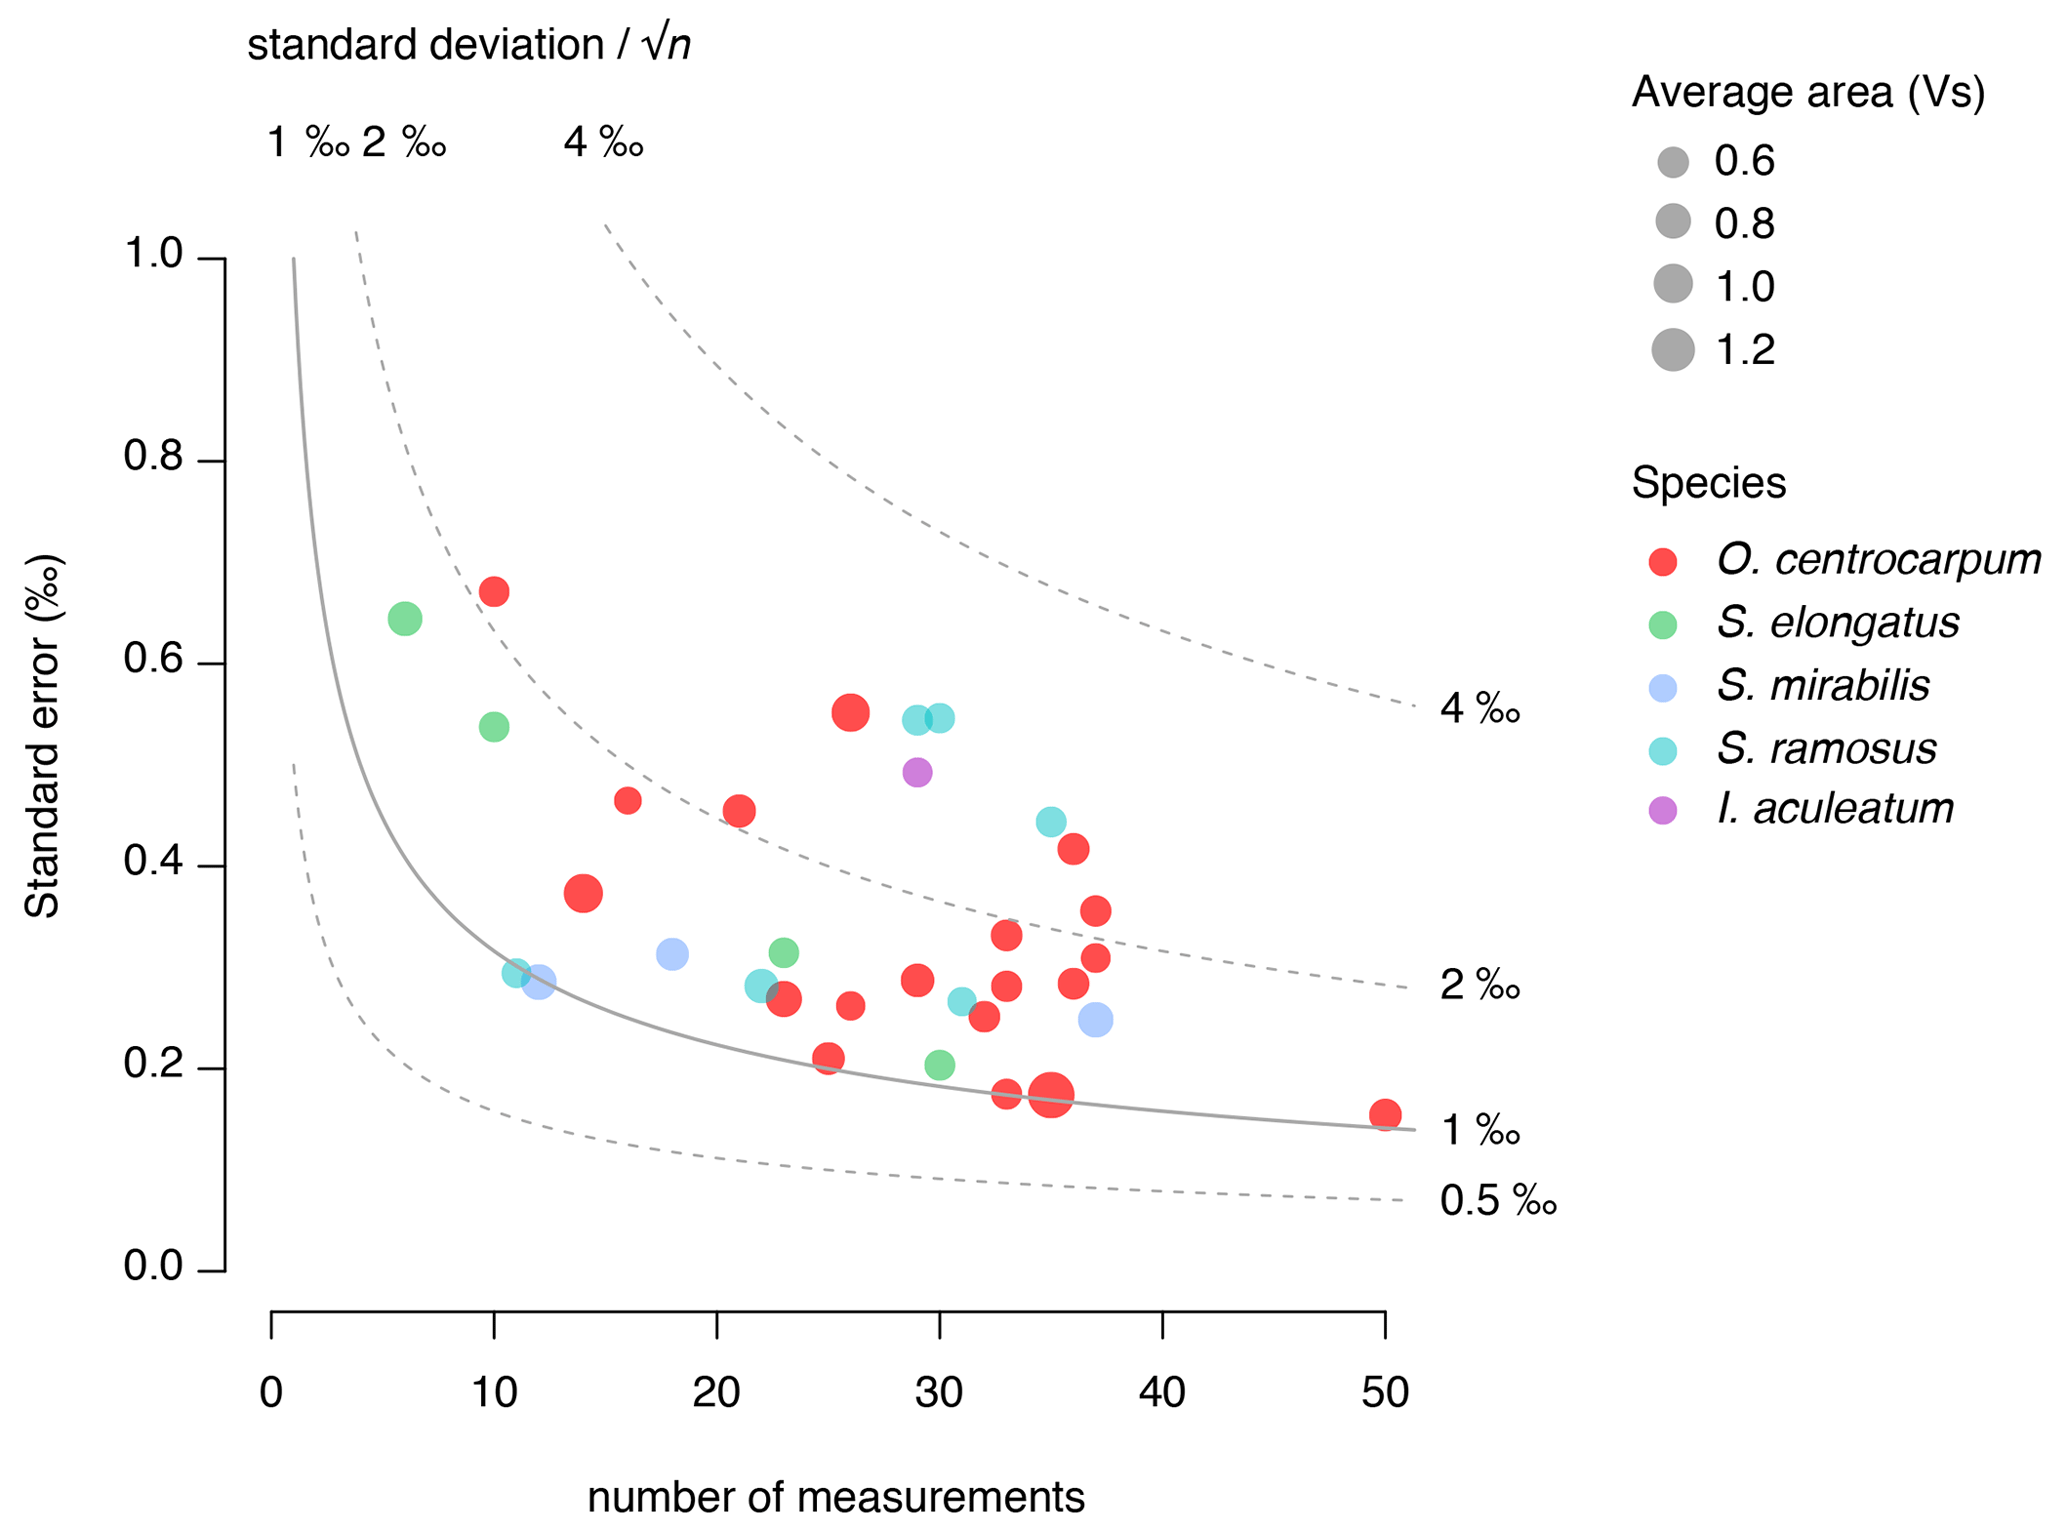
Figure 5Relation of standard error of δ13CDINO (‰) with the number of measurements and signal intensity (area in volt seconds (Vs)). Colors correspond to the various analyzed species.
3.3 Environmental parameters and correlation
The range of measured δ13CDINO values (∼ 5 ‰) far exceeds the variability in surface ocean δ13CDIC (∼ 1 ‰) and δ13C (∼ 2.5 ‰), implying the observed range likely reflects differences in fractionation related to changing uptake or leakage of different inorganic carbon phases (CO2 and HCO; Sharkey and Berry, 1985; Hoins et al., 2016a), and this hence determines most of the variability in the δ13CDINO data. Here, we quantitatively assess fractionation as a function of several environmental parameters.
Table 2Linear regression coefficients and significance for all samples where O. centrocarpum was analyzed (n=19), with as dependent variable.
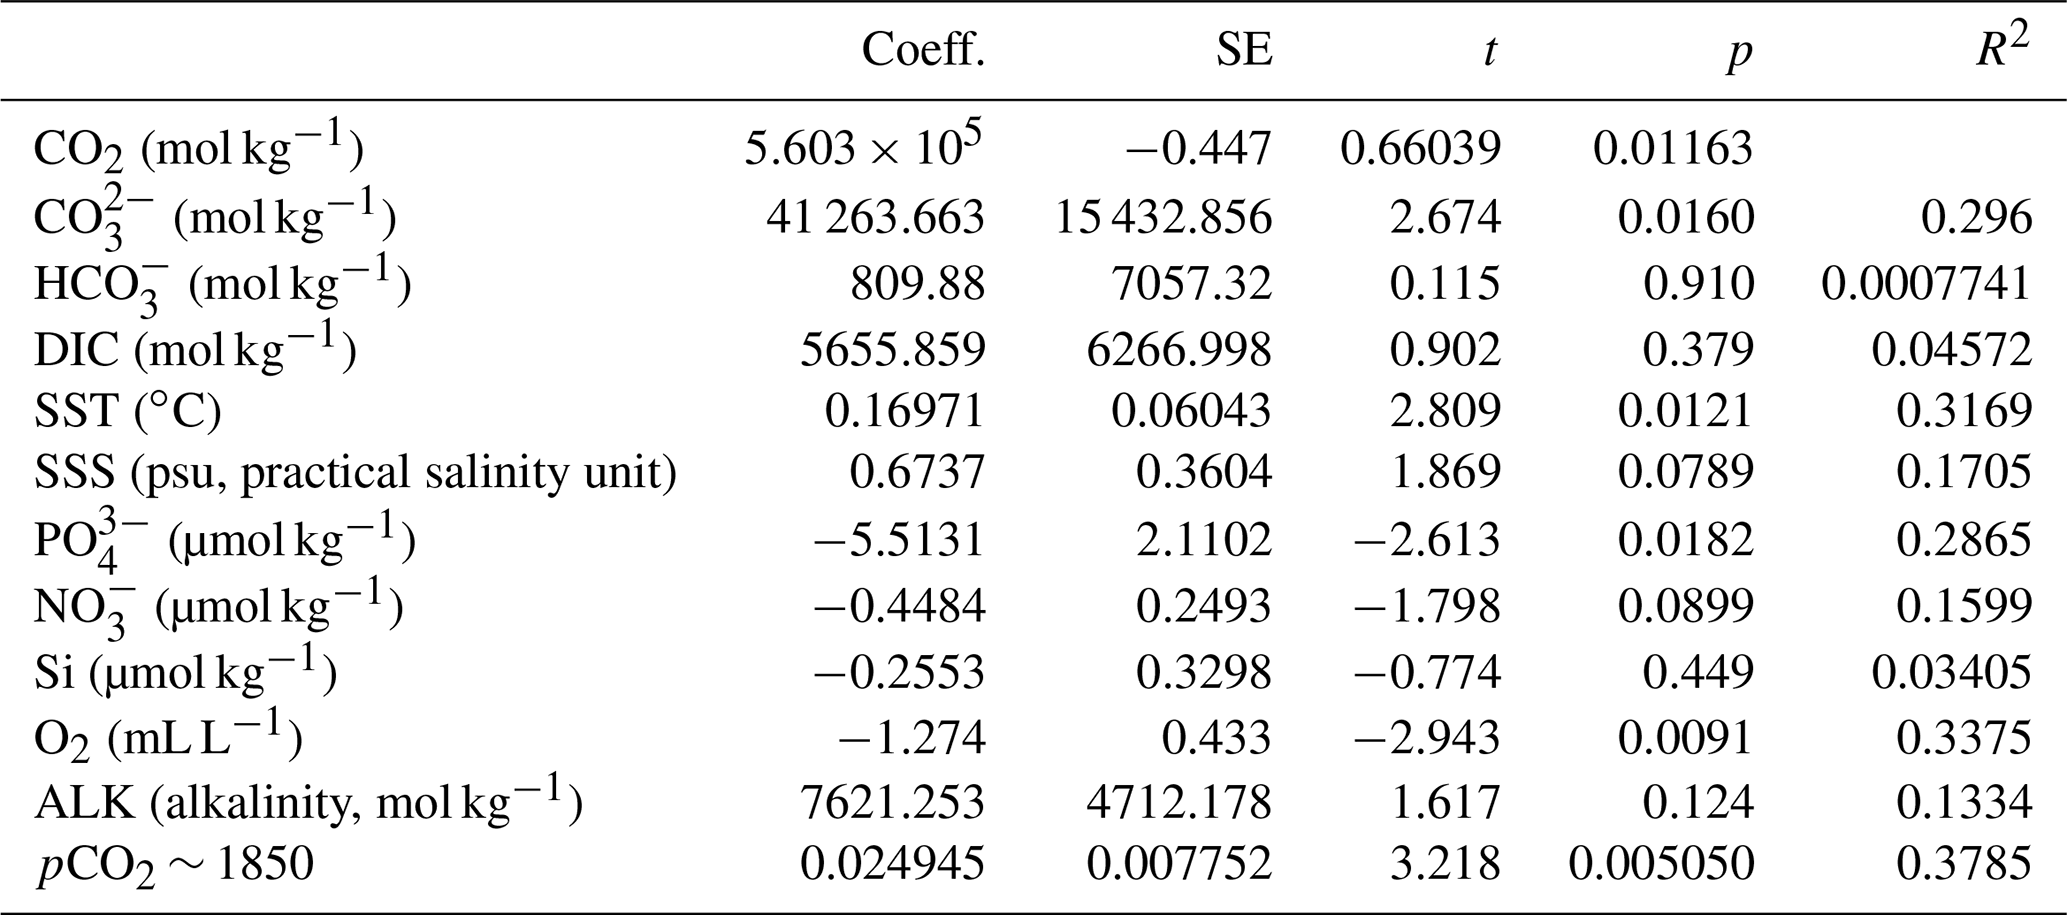
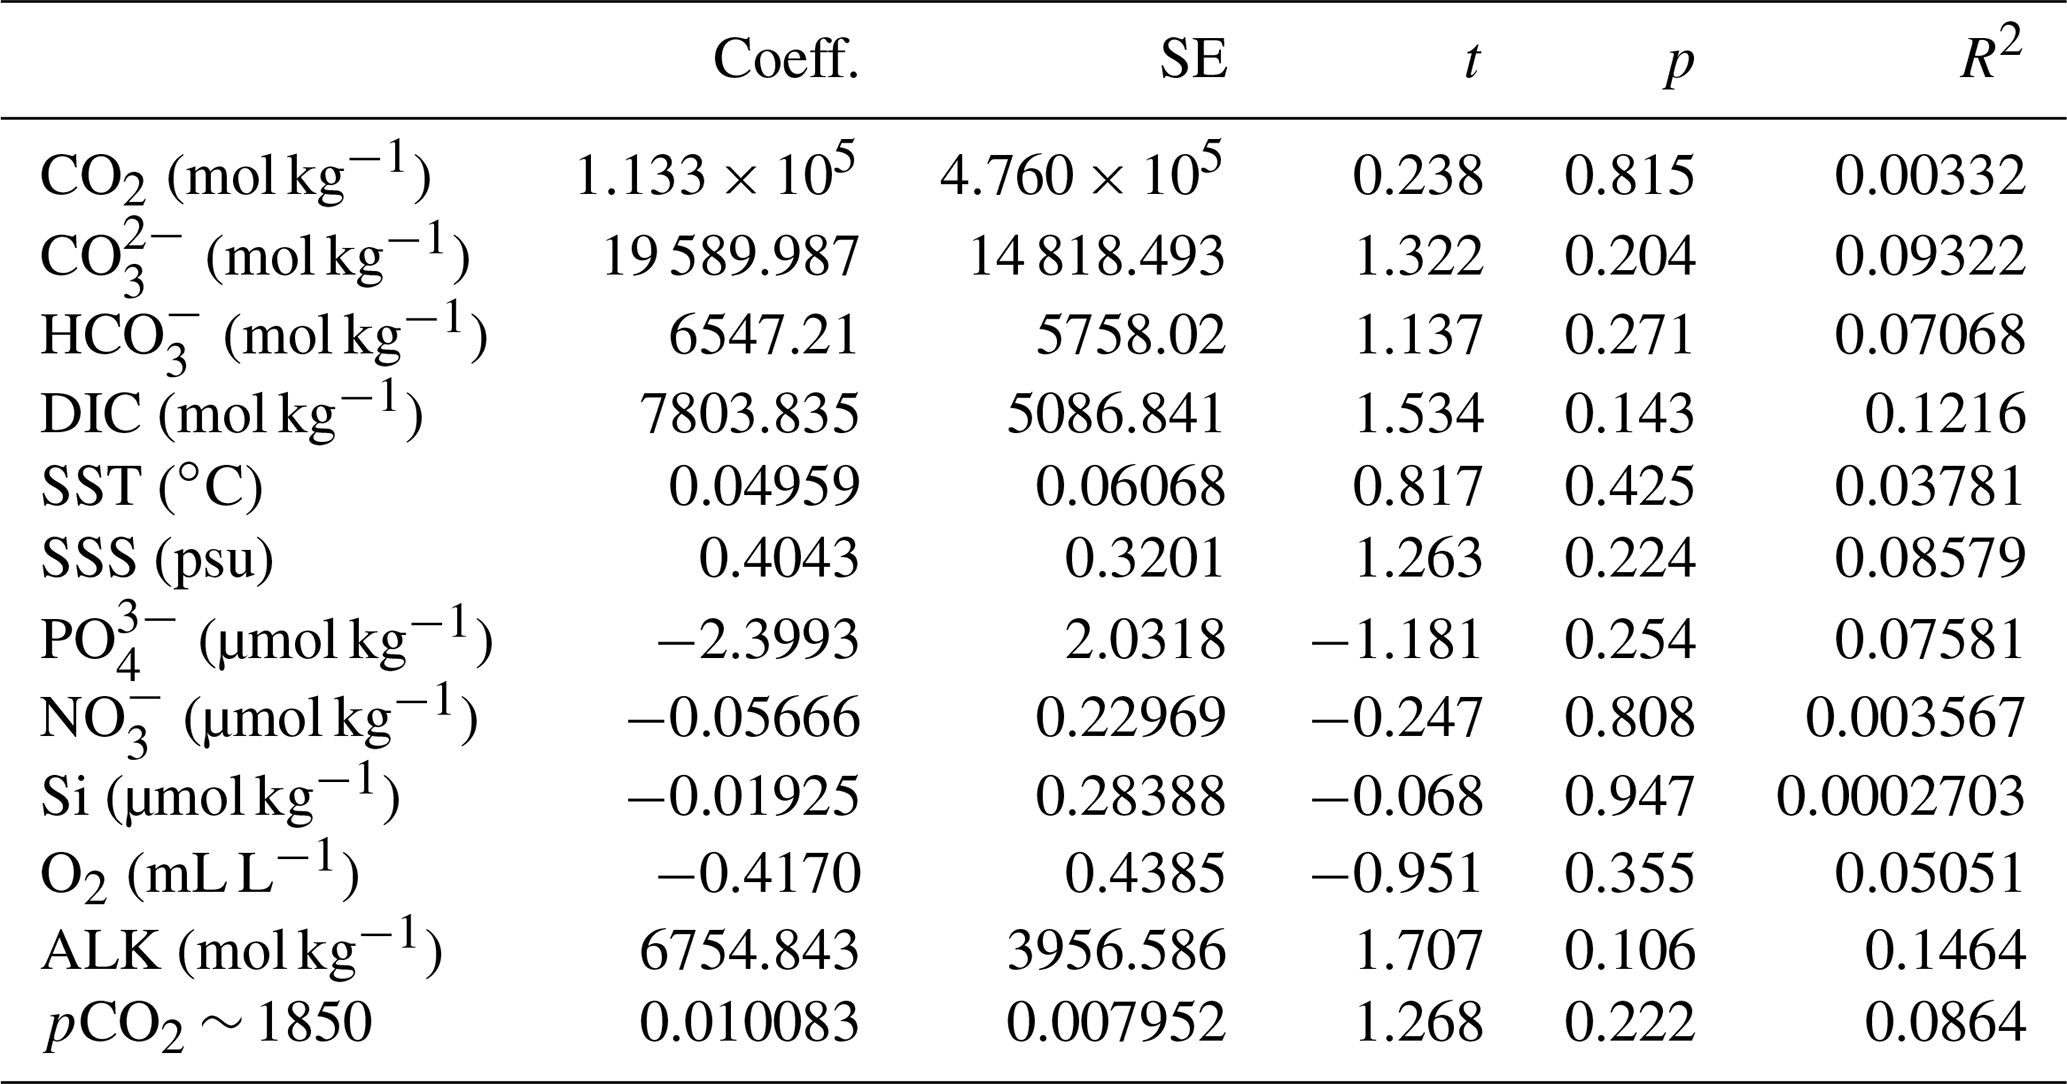
The simple (non-weighted) linear regressions show poor correlations between εp-DIC and δ13CDIC for all environmental parameters, and the correlations slightly improve when compared to (Tables 2, 3). However, none of the tested parameters individually explain the majority of the observed variance in εp-DIC (maximum R2; ∼ 0.1) or (maximum R2 with pCO2; ∼ 0.38), despite high significance (low p values) of the regressions. The explained variance increases when polynomial regressions are applied. Several controlled growth experiments indeed show a non-linear response of εp as a function of pCO2 of the growth medium (Hoins et al., 2015), although the number of data points in such experiments limits full mathematical descriptions of the trends within the pCO2 range of this field study. Here, a second-order polynomial (quadratic) regression achieves an R2 of ∼ 0.74 and ∼ 0.79 for the non-weighted and weighted versions, respectively.
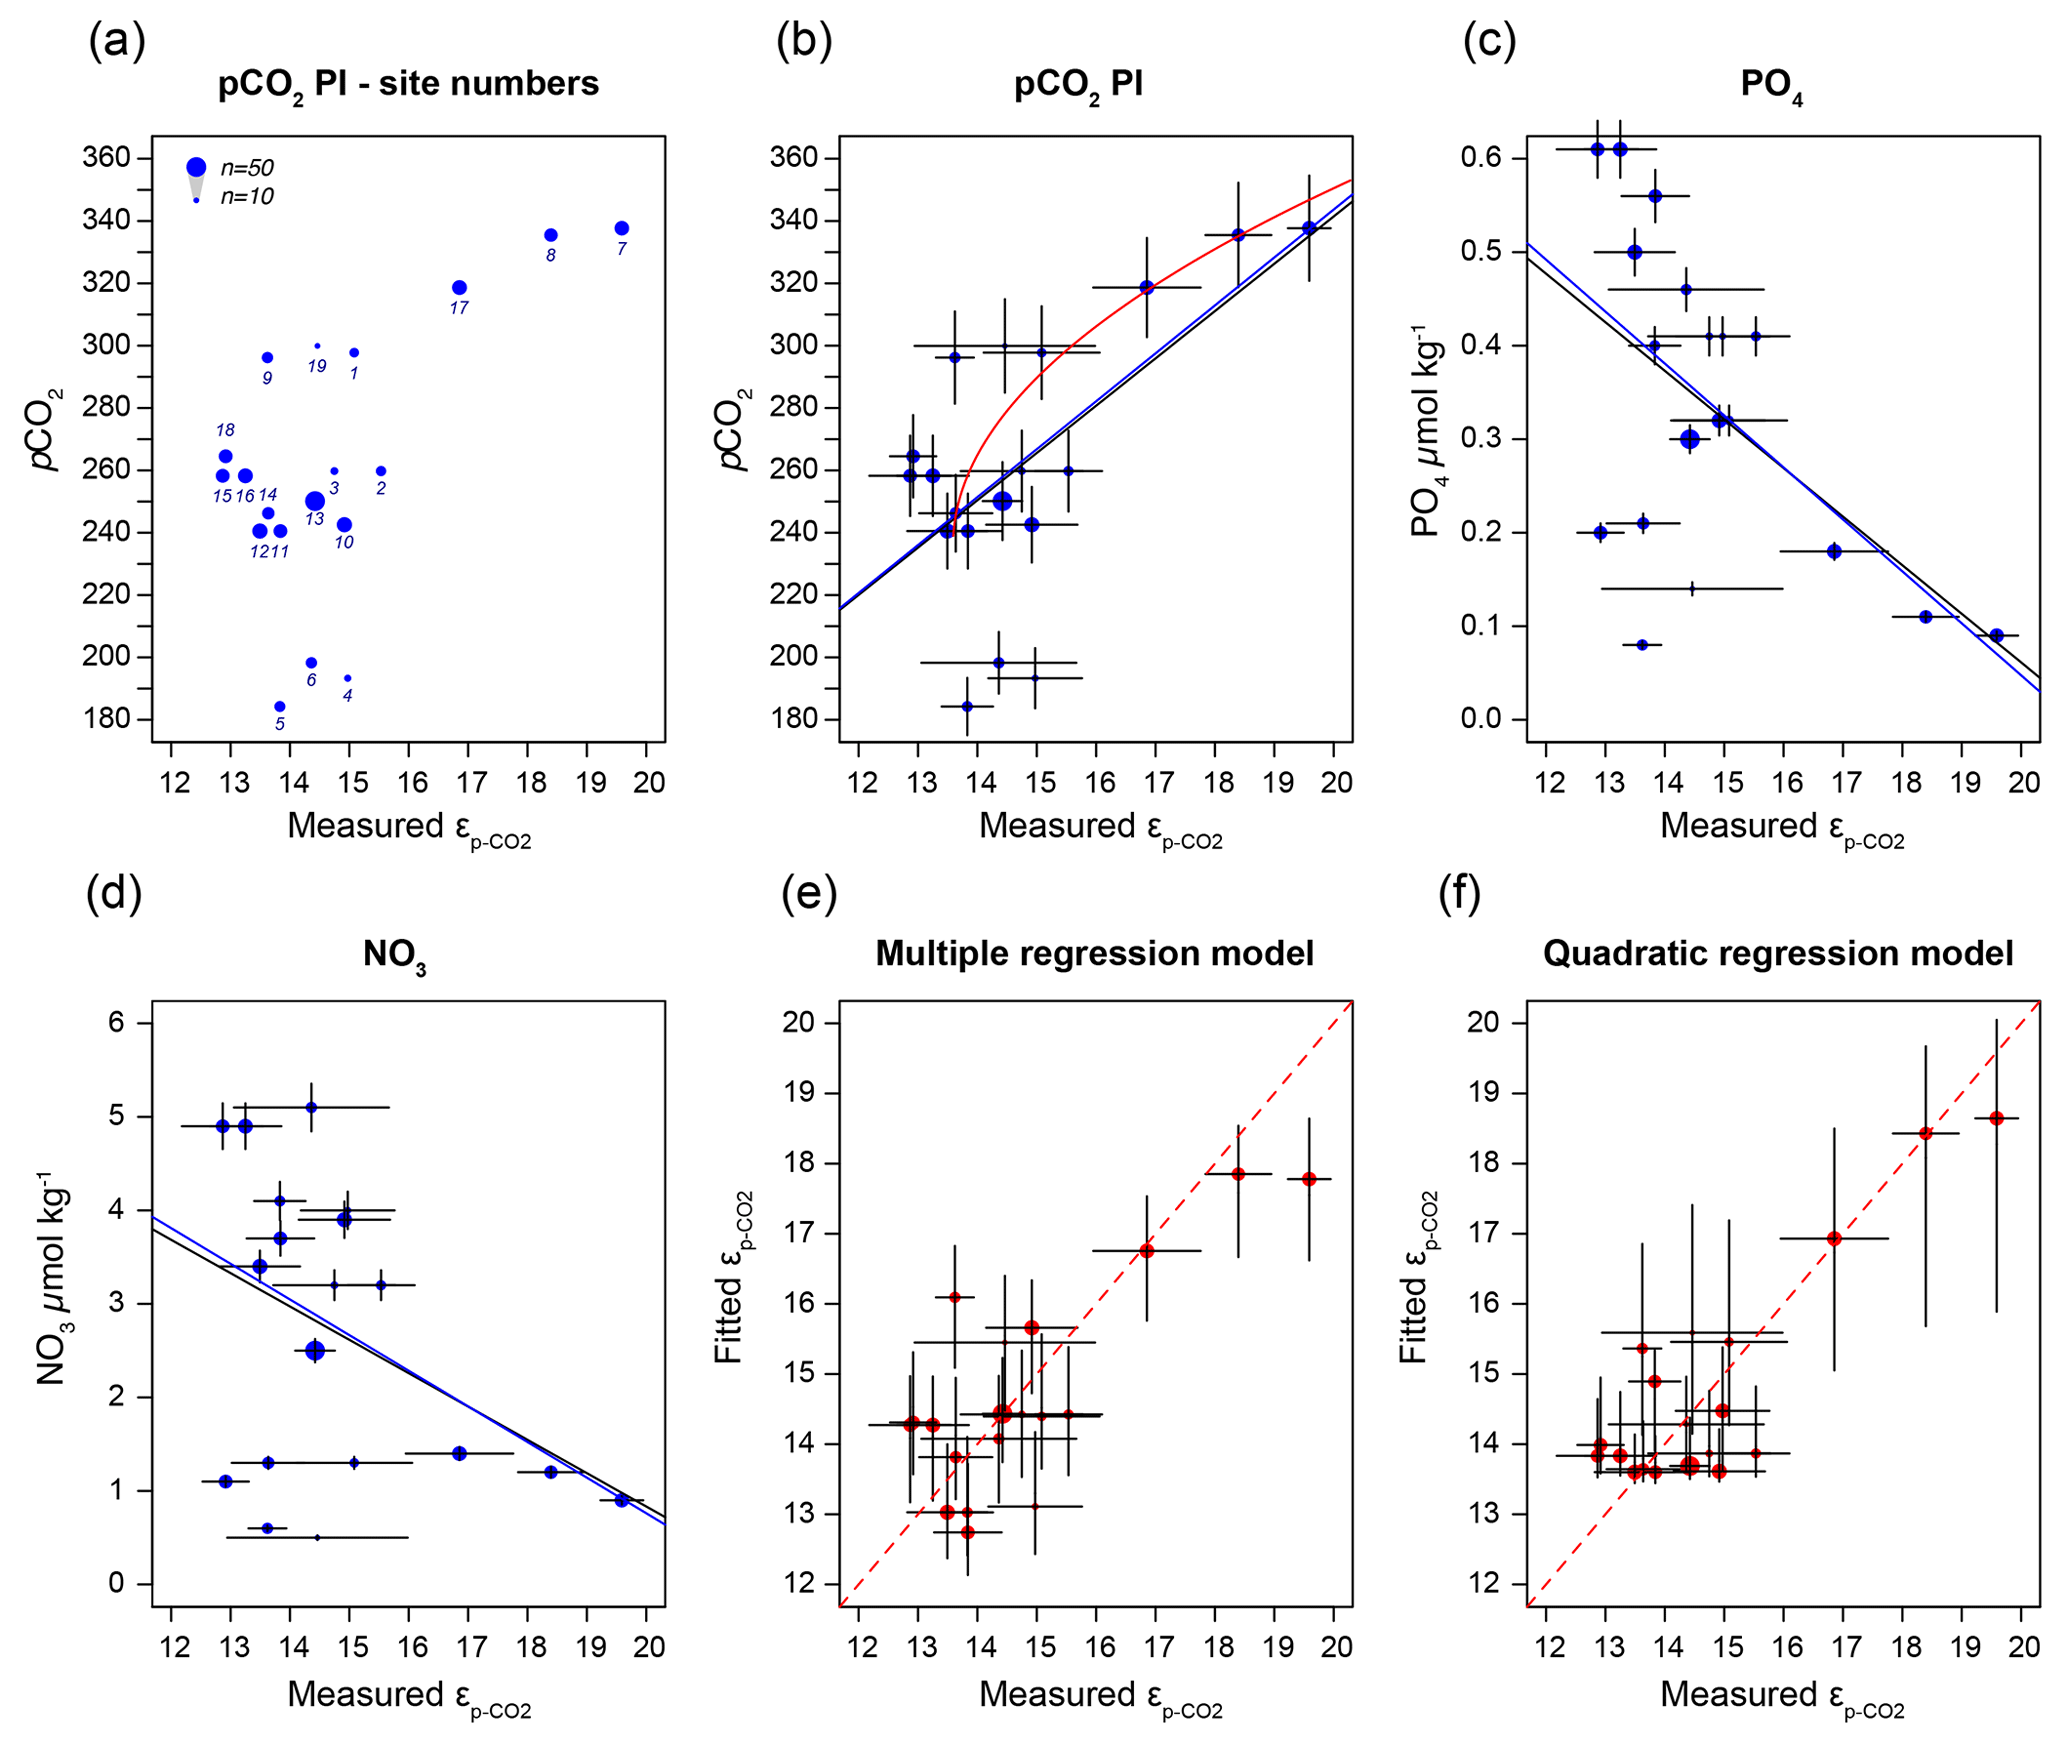
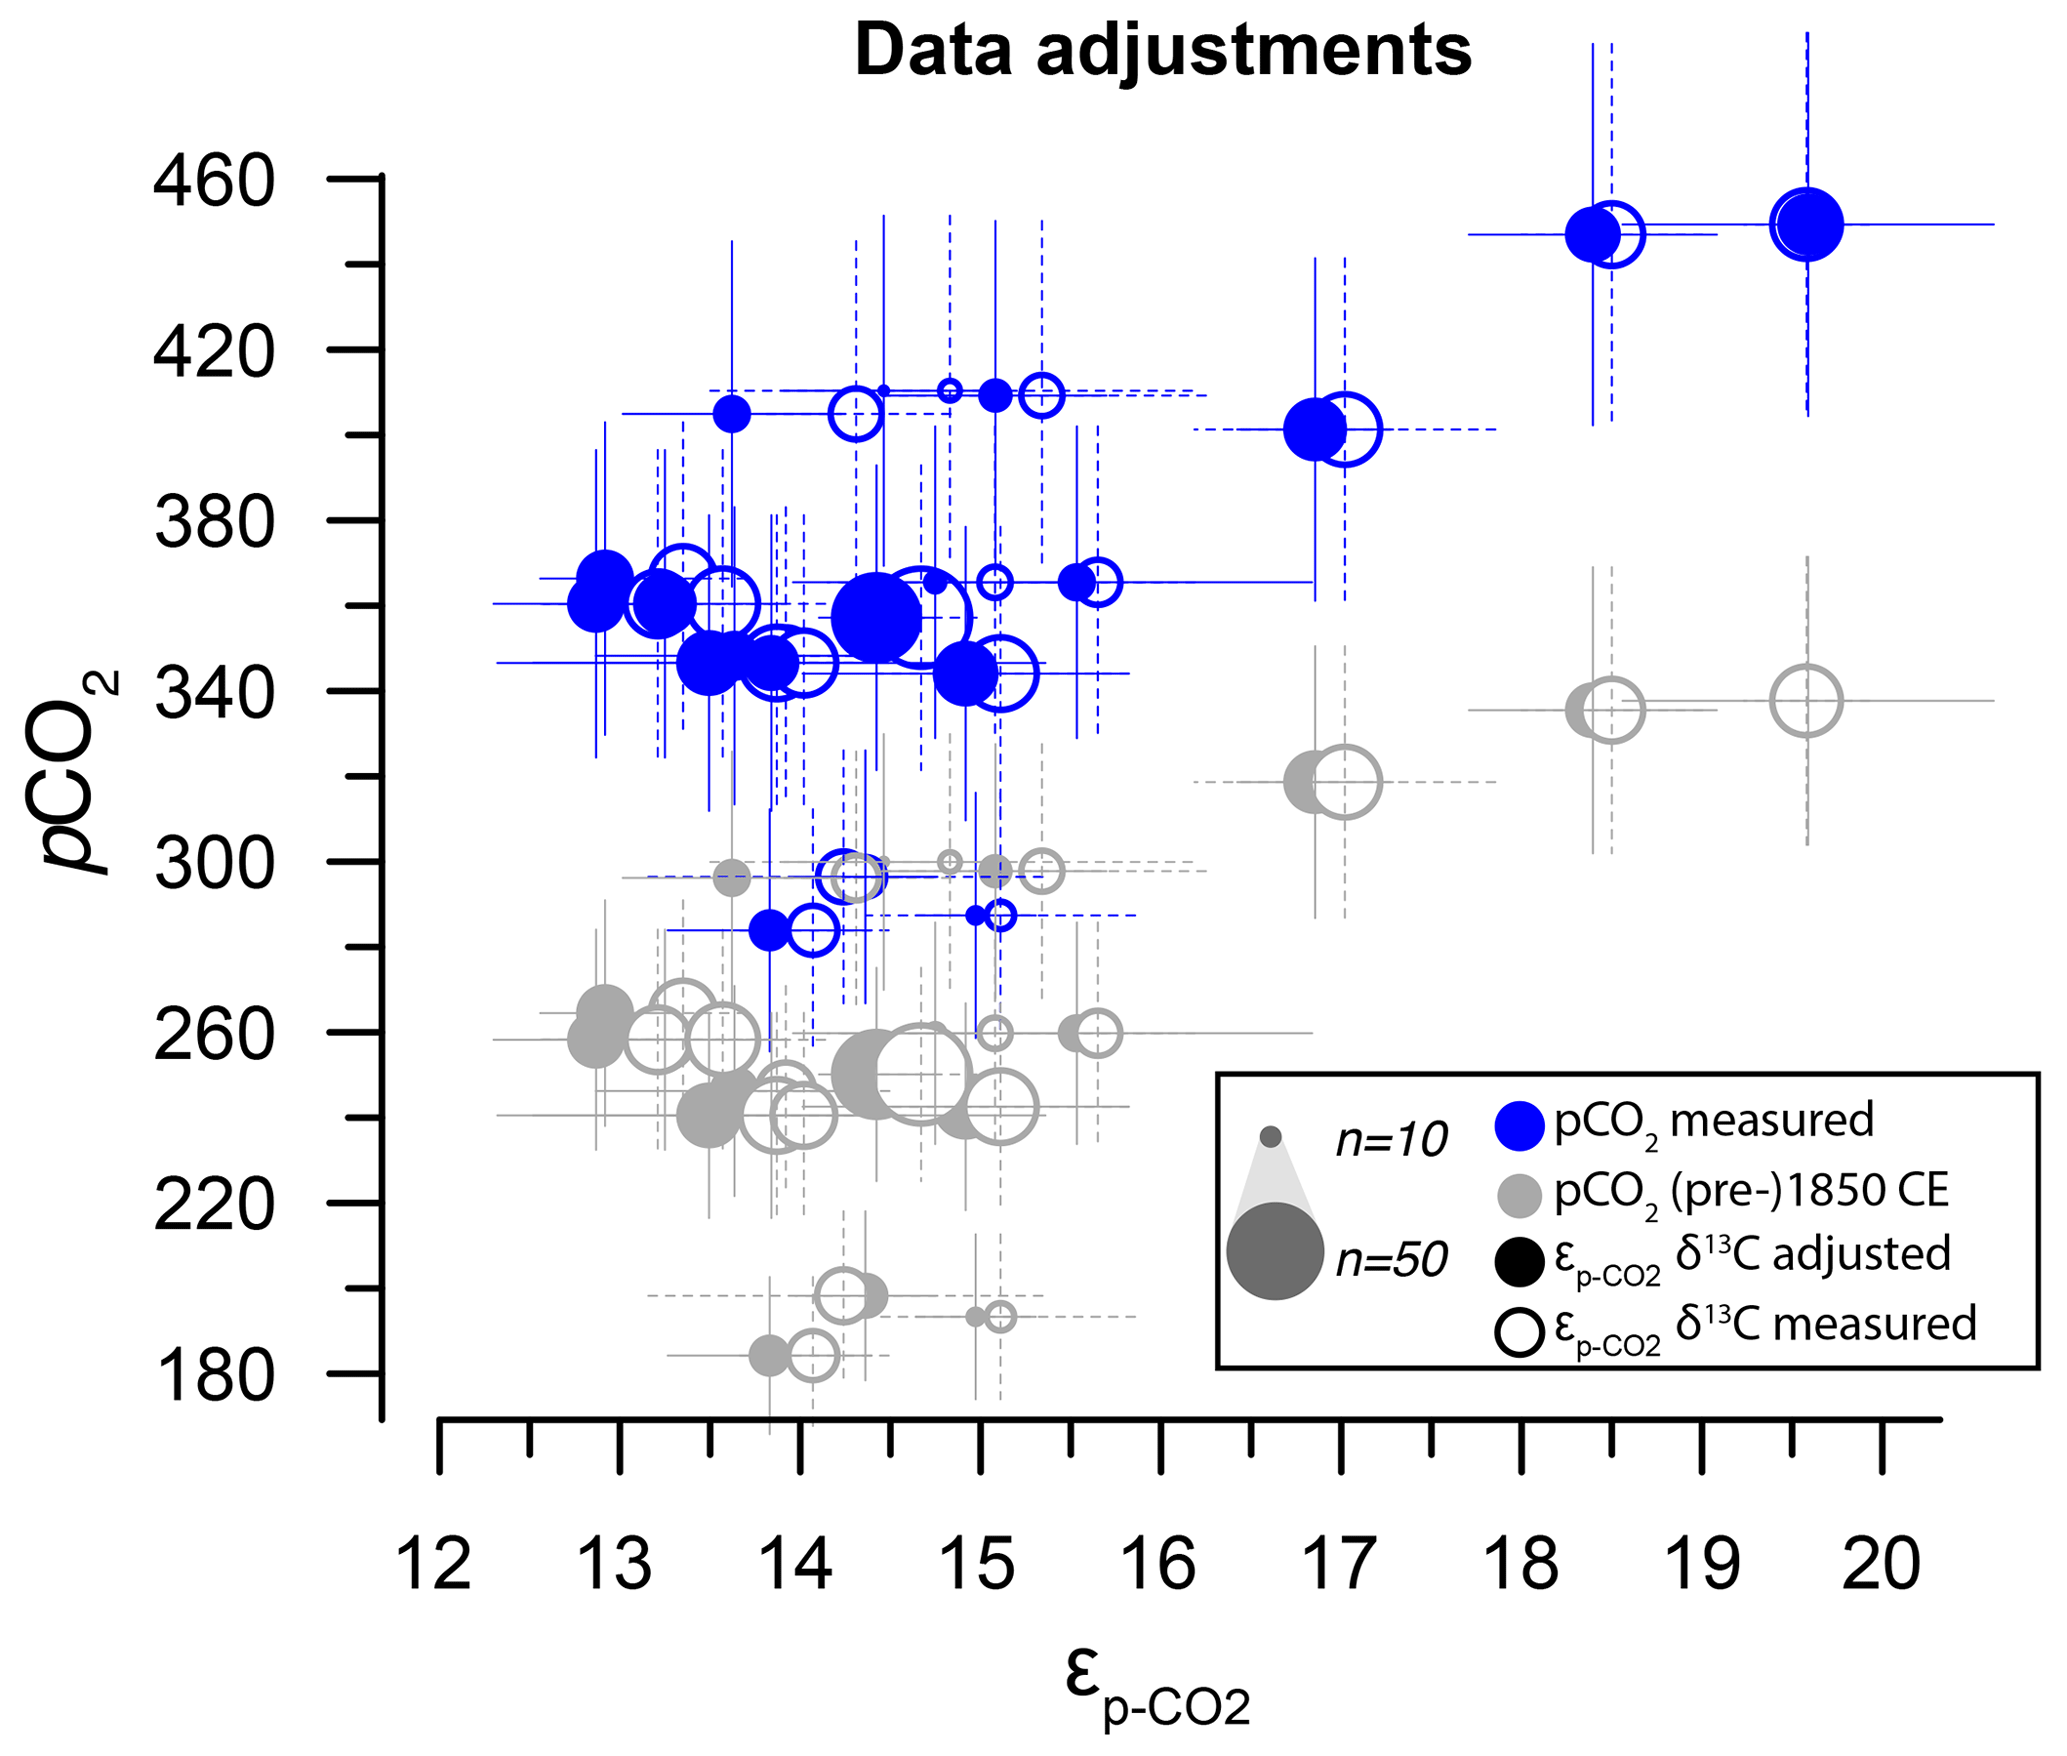
Figure 6(a) Sample-specific of O. centrocarpum relative to pre-industrial pCO2; numbers correspond to localities listed in Table 1. (b) Regression analyses for of O. centrocarpum relative to pCO2 (measured and corrected to pre-industrial values); the black line represents simple linear regression, the blue line represents weighted linear regressions and the red line represents weighted quadratic regression. (c) Phosphate concentrations (PO). (d) Nitrate concentrations (NO). (e) Fitted values illustrating the multiple-regression model performance using parameters (a)–(c) relative to measured . (f) Fitted values using only pre-industrial pCO2 but applying a quadratic regression (red curve in panel b). Errors in panels (b)–(d) represent 5 % of the measured value and errors on the fitted values in panels (d) and (e) represent propagated errors in both measurements and environmental variables (as shown in panel b–d) using Monte Carlo simulations (n=1000) for regression models. Symbol size (top left corner of panel a) represents the number of measurements within each sample.
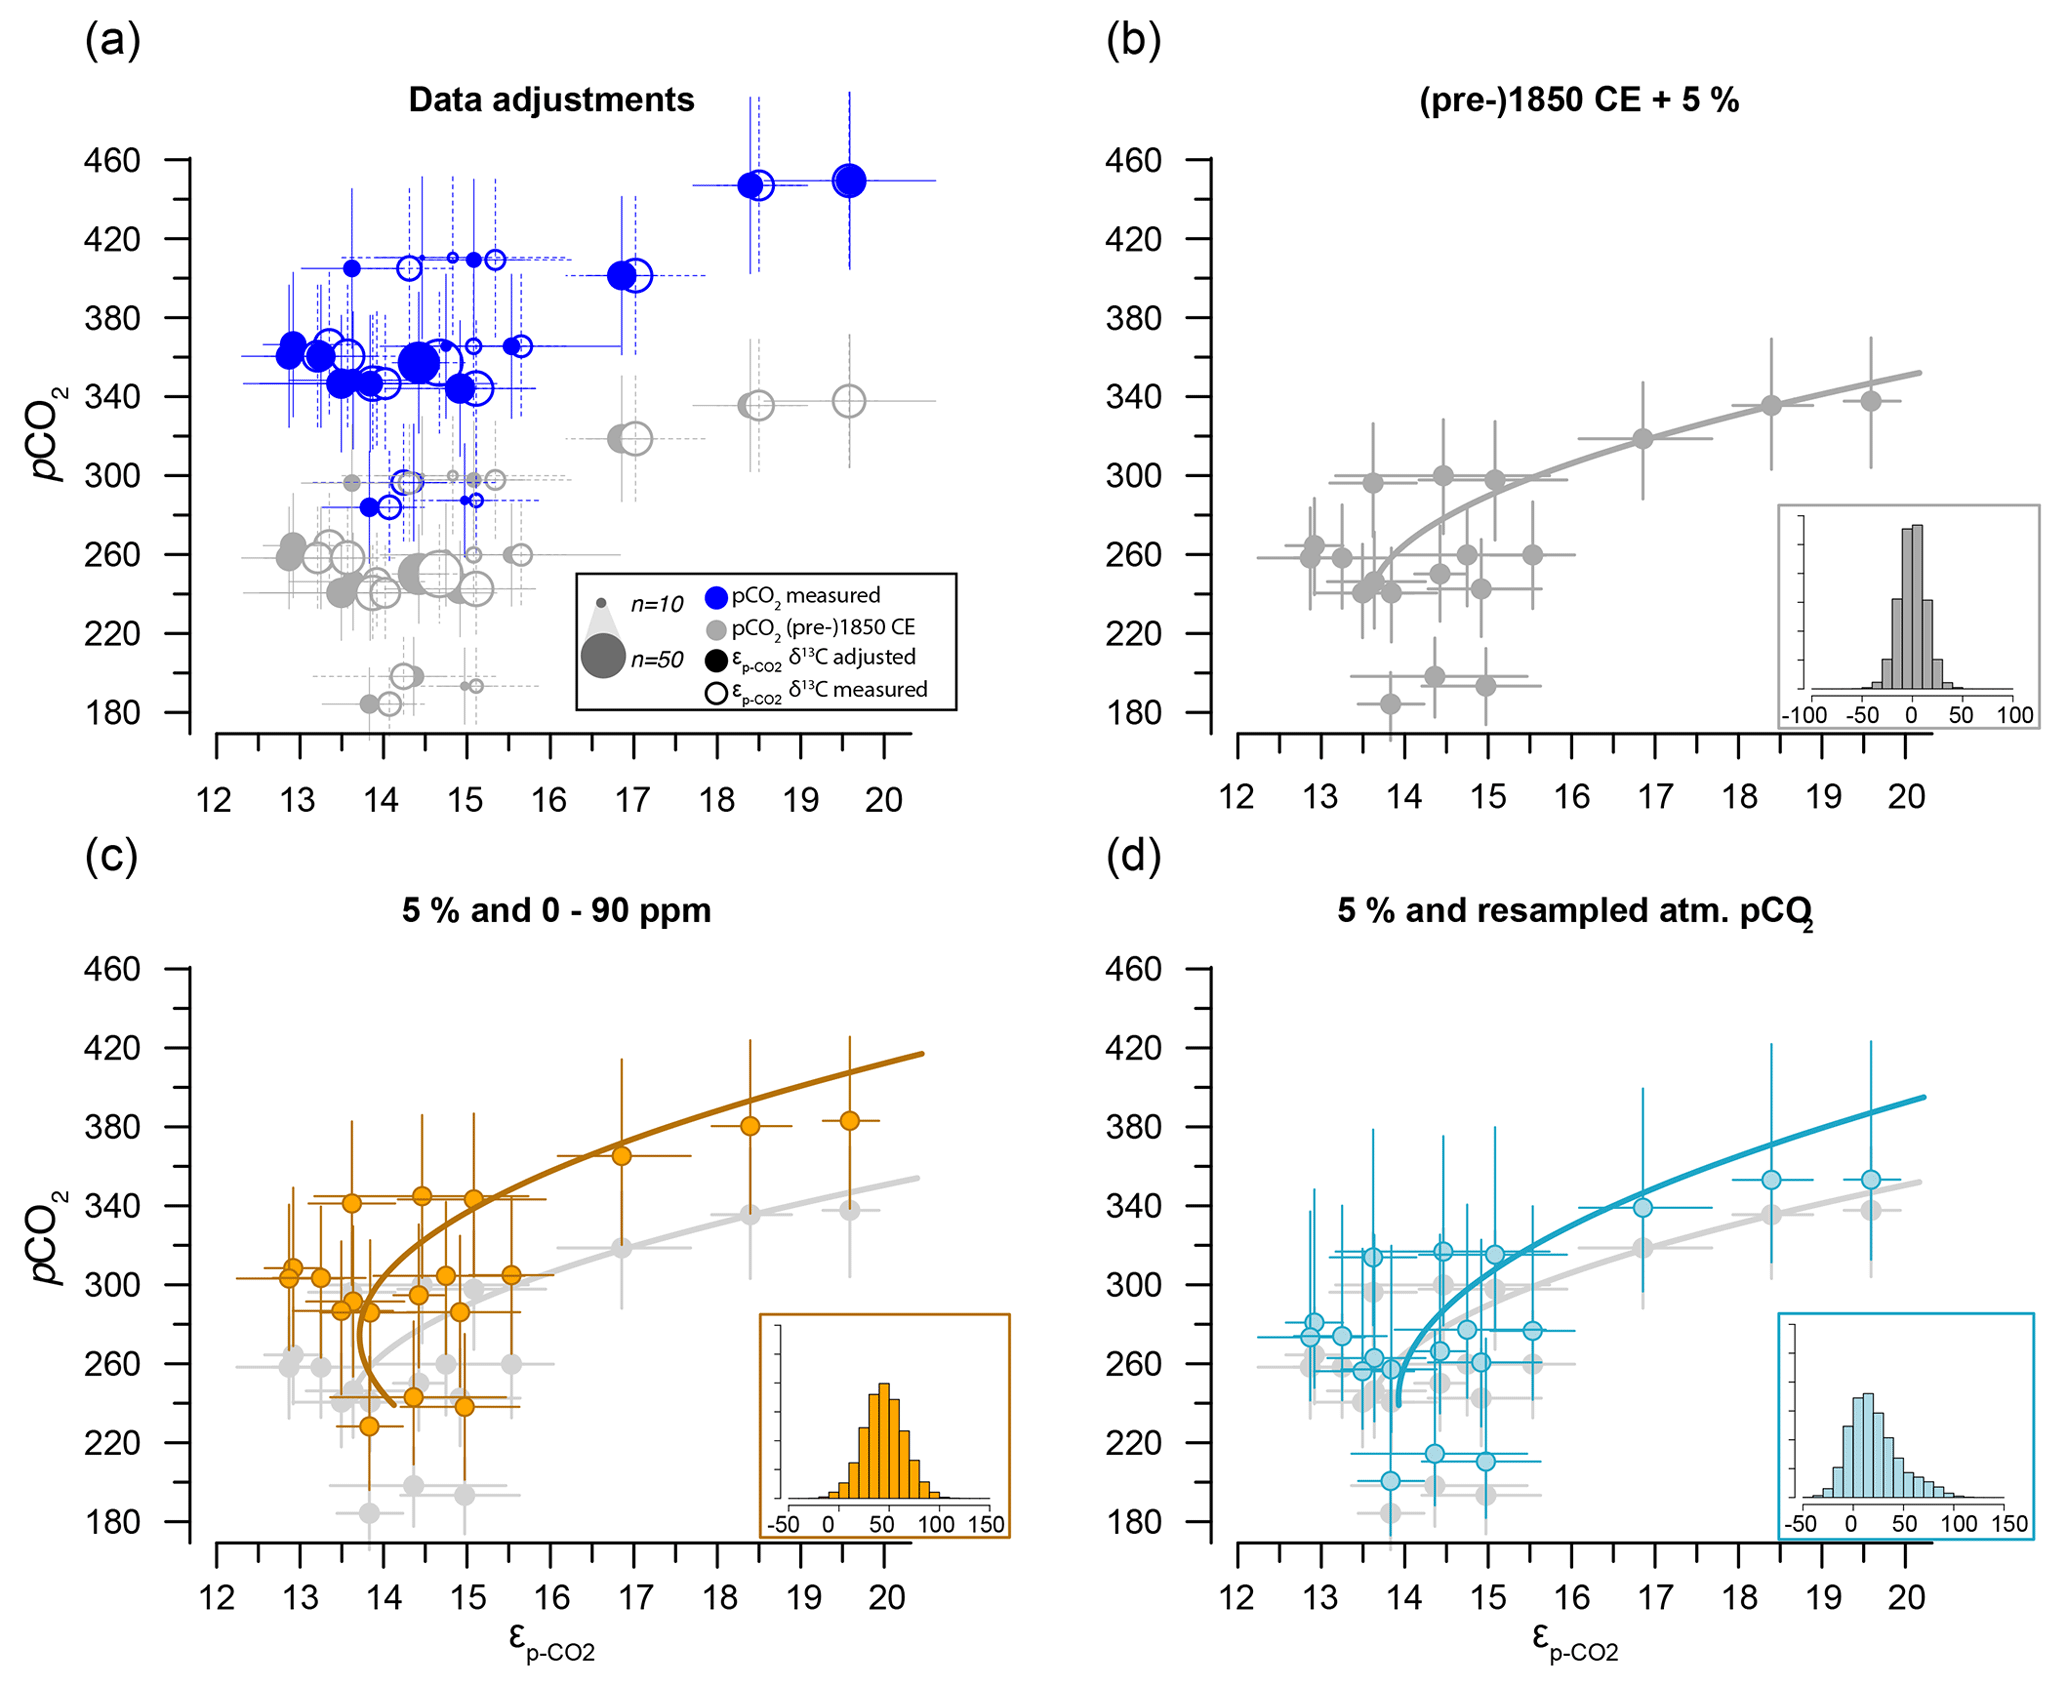
Figure 7Sensitivity tests on the potential effect of anthropogenic carbon emissions. (a) Effects of data treatment on the difference between measured and adjusted pCO2 and (same as Fig. 3). Open symbols indicate measured δ13C; closed symbols represent data after eliminating small signals (< 0.2 Vs) and outliers. Blue dots represent measured CO2 values and gray dots indicate the CO2 around 1850 CE. (b) Quadratic regression (red line in Fig. 6b) with propagated analytical error in pCO2 and δ13C only, using CO2 values around 1850 CE (gray filled symbols in panel a). (c) As in (b) but with the addition of a +45 ± 15 ppm error to reflect potential impact of anthropogenic CO2 in orange. Gray dots and curve of panel (b) are added as a comparison. (d) As in (b) but with the addition of a CO2 increase relative to pre-industrial values, sampled for the period 1800–2000 CE. Insets on the bottom right in panels (b), (c) and (d) show the combined error distributions imposed on pCO2. All error bars in panels (b)–(d) on pCO2 and are 2.5 %–97.5 % percentile ranges from Monte Carlo simulations (n=1000).
It is conceivable that other environmental parameters also significantly contribute to εp variability (Fig. 6). For example, [PO], [NO3] and pCO2 contribute significantly to a (linear) multiple-regression model, which takes the form of CO2+yPO4+zNO3, where c, x, y and z are numerical constants. The multiple-regression model using these three parameters covers ∼ 58 % of the variance in O. centrocarpum (not weighted) and 67 % when weighted to number of measurements per sample. Including more parameters, such as SST, oxygen concentrations or other carbonate system parameters, explains slightly more of the observed variance but does not significantly improve the model. The residual mean standard error (RSME) of the carbon–nitrogen–phosphorus (CNP)-εp multiple-regression model is ∼ 1.45 ‰ while a linear regression with only pCO2 yields 1.7 ‰. Only weighted regressions are given here and reported ranges of the constants represent 1 standard error or equivalent percentiles in the case of Monte Carlo-simulated errors. These models have the following optimal formats:
-
Equation (1), linear.
(adjusted R2=0.48, p=0.001, RSME = 1.7 ‰) (Fig. 6b).
-
Equation (2a), quadratic (data without error propagation and only suitable for use >240 μatm).
(adjusted R2=0.79, p < 0.001, RSME = 1.13 ‰) (Fig. 6b).
-
Equation (2b), quadratic (Monte Carlo-constrained errors – analytical for pCO2 and ) (Fig. 7b).
-
Equation (2c), quadratic (as Eq. 2b with additional 45 ± 15 ppm pCO2 error) (Fig. 7c).
-
Equation (2d), quadratic (as 2b with resampled pCO2 rise 1800–2000 CE) (Fig. 7d).
-
Equation (3a), multiple-regression linear (Fig. 6e).
(adjusted R2=0.67, p < 0.001, RSME = 1.45 ‰).
-
Equation (3b) adjusted for application in the paleo-domain.
-
Equation (4), multiple-regression linear.
(adjusted R2=0.52, p=0.01, RSME = 1.44 ‰).
The two linear multiple-regression models are offset (Eqs. 3a and 4), primarily because of the carbon isotope fractionation between HCO and CO2. The slope with respect to pCO2 also varies slightly between the models for εp-DIC and due to the temperature-dependent fractionation between HCO and CO2, but the slopes with NO and PO are indistinguishable. The quadratic regression seemingly better fits the variability observed in compared to other (multiple) linear regressions and removes any structure in the residuals, potentially signaling a non-linear response in to pCO2. The quadratic regression also indicates insensitivity to pCO2≤240 µatm and should not be used below this value (Fig. 6b). The Monte Carlo simulations of scenarios where an additional pCO2 uncertainty is imposed as a normally distributed mixture of pre-industrial and modern values, offsetting pCO2 by +45 ± 15 ppm (Fig. 7c, Eq. 2c), and a resampled uncertainty derived from the pCO2 rise since pre-industrial times (Fig. 7d, Eq. 2d) shows that the parameters of the quadratic regression are fairly robust to these uncertainties (i.e., none of the parameters become insignificant at p>0.05), although the absolute pCO2 values and errors increase.
4.1 Absolute values, comparison to marine organic matter
The recorded δ13CDINO range and absolute values (∼ −18 ‰ to −35 ‰) correspond well with global δ13C values previously reported for marine particulate organic matter (δ13CPOC) (e.g., Freeman and Hayes, 1992; Goericke and Fry, 1994) and modeled phytoplankton biomass (e.g., Magozzi et al., 2017; Tagliabue and Bopp, 2008). Consequently, εp-DIC and are also within the expected range for general marine particulate organic matter. However, the intra-sample variance of δ13CDINO appears to be substantial, often spanning most of the full range (∼ 10 ‰) observed for δ13CPOC. Some of the observed variability might be related to the limited analytical precision during measurements of the extremely small numbers of carbon of individual dinocysts. Fully constraining the contribution of this analytical uncertainty to the observed variance is, however, not possible because of unresolvable micrometer-scale heterogeneity in the PE standard (van Roij et al., 2017; Sluijs et al., 2018). In most cases, the variance in δ13CDINO is similar to that of the standard. Still, it is likely that some of the seasonal δ13CDIC differences are also recorded in the δ13CDINO and that some additional inter-specimen δ13C variance is present. This is to be expected since the δ13C populations from our integrated core-top samples span seasons and decades and thus also considerable variability in seawater properties and population change. In addition, growth-induced randomness and changes in δ13C and DIC in the cell's microenvironment likely contributed to inter-specimen variability. Note that in our data inter-specimen variability is still underestimated because we analyzed three to seven specimens per ablation event, as single-cyst carbon yield (∼ 7 ng C) from these cyst-sizes approached the limit for reliable measurements (van Roij et al., 2016). We minimized potential influence of differences in cell size or shape through manual selection. We thus analyzed a population where the pre-selection of similar-sized cysts restricts the variance in cell surface area and volume, unlike biomarker-based proxies for which the cell size has to be reconstructed independently (Henderiks and Pagani, 2007; Stoll et al., 2019). This approach could reduce scatter in the relation of εp to environmental variables (Popp et al., 1998).
4.2 Cell–cyst offset
One of the striking differences between the here generated data and the existing culture experiments is that carbon isotope fractionation of dinocysts in the natural environment appears to be much larger than that of motile cells from controlled growth (dilute batch) experiments (Hoins et al., 2015, 2016b). We find average εp values ranging between 13 ‰–20 ‰ and 23 ‰–29 ‰ with respect to CO2 and DIC. Cultured cells of O. centrocarpum yielded not only a smaller overall εp but also a smaller range (∼ 8 ‰–12 ‰ and 18.5 ‰–20 ‰) across a larger CO2 gradient, implying the cysts have a much steeper fractionation slope with CO2 compared to the motile cells. Despite these differences, the average εp for Spiniferites species (S. ramosus, elongatus and mirabilis) is often somewhat larger than for O. centrocarpum (Fig. 4). This is consistent with culture experiments that showed larger CO2 dependency and overall slightly larger εp in the motile species G. spinifera compared to P. reticulatum (Hoins et al., 2015).
While the cultured single strains and dinoflagellate populations in nature may behave somewhat differently, we do not expect that this alone underlies such a marked offset between the motile cultured cells and natural cysts. Natural cysts and cultured cells seem consistently offset in δ13C, although at present the exact amplitude of this offset cannot be determined. However, such an offset is in line with certain compounds in dinoflagellate cells being depleted in 13C relative to the bulk biomass (Schouten et al., 1998; Wilkes et al., 2017). The organic-walled dinocysts consist of mostly aliphatic and aromatic compounds, forming a complex biopolymer referred to as dinosporin (de Leeuw et al., 2006; Versteegh et al., 2007, 2012). Depending on the biosynthetic pathway of the cyst material and the derivation or degradation of the original compounds, this may result in offsets in δ13C values between cysts and the motile cells. A potential additional fractionation might be introduced during taphonomy and also later by the processing of sediments to concentrate the dinocysts from sediment samples. The sediment processing involves hydrochloric and hydrofluoric acids, which affects the more labile organic compounds. Last, it is conceivable that fractionation in the dilute batch experiments may be reduced by, e.g., higher-than-natural growth rates. This may be supported by chemostat culture experiments on Alexandrium tamarense (Wilkes et al., 2017), which show a (much) greater fractionation compared to the dilute batch experiments (Hoins et al., 2015). However, the enhanced fractionation recorded in chemostat experiments is likely an artifact of isotope equilibration times exceeding CO2 uptake rates (Brandenburg et al., 2022; Zhang et al., 2022). The range of options cannot be narrowed down until cultured cysts are compared to their motile cells harvested from the same culture and treated with similar techniques as used for the sediments. Until these data become available, inferences on the origin and amplitude of the offsets between the cells and cysts of O. centrocarpum and Spiniferites remain speculative.
4.3 Environmental controls on carbon isotope fractionation
Carbon isotope fractionation is determined by RuBisCO and several environmental parameters, dominantly pCO2 but also cell size and shape, growth rates, and nutrient or light regimes (e.g., Freeman and Hayes, 1992; Pagani, 2013; Popp et al., 1998; Stoll et al., 2019, and many others). In most cases, fractionation is pCO2-dependent, and consequently εp in various groups and genera has been used as a paleo-pCO2 proxy (e.g., Freeman and Hayes, 1992; Pagani, 2013; Rae et al., 2021). We performed a broad-spectrum multiple-regression analysis to identify environmental factors that contribute significantly to dinocyst εp. The most important parameter is pCO2, in line with previous studies (Freeman and Hayes, 1992). A large part of the remaining variability can be attributed to growth rate and ultimately nutrient content, specifically nitrate and phosphate of the surface waters, in line with previous studies on phytoplankton and dinoflagellate carbon isotope fractionation (Popp et al., 1998; Hoins et al., 2016b; Wilkes et al., 2017; Wilkes and Pearson, 2019). We find that pCO2 and εp are positively correlated, while NO and PO are negatively correlated with εp (Fig. 6c, d).
The inclusion of nutrient levels as environmental factors in the carbon isotope fractionation reduces the error in the fit between the measured and modeled fractionation. In the rare cases where paleo-nutrient concentrations are estimated, reconstructions usually cover only [PO], implying the [NO] in Eqs. (3a) and (4) has to be approximated from [PO]. As [PO] and [NO3] are generally well-correlated (typically ∼ 1:10 [PO] : [NO3]; here ∼ 1:8) in ocean waters, this is relatively straightforward. For application in the paleo-domain, however, nutrient ([PO]) reconstructions may not be available or may be considered too unreliable to provide meaningful constraints. In specific cases where accurate paleo-[PO4] estimates or large changes are reconstructed, Eq. (3b) may be applied, in which [NO3] is substituted for [PO] at a 1:8 ratio. However, unless there are clear changes in the nutrient regime or sufficient proxy constraints on the nutrient concentrations, we prefer a calibration based exclusively on carbon isotope fractionation and carbonate system parameters, including sea surface temperature to calculate δ13C from δ13CDIC to reconstruct pCO2.
4.4 Influence of carbon-concentrating mechanisms: CO2 insensitivity
As many phototrophs, including dinoflagellates, have mechanisms for concentrating CO2 near the cell membrane, the sensitivity of carbon isotope fractionation to ambient CO2 is expected to diminish below a certain concentration (M. R. Badger, 2003; M. P. S. Badger, 2021; Stoll et al., 2019). This is particularly the case as dinoflagellates utilize type II RuBisCO, which has generally poorer performance compared to type I RuBisCO at low CO2 concentrations (Giordano et al., 2005). Indeed, substantial activity of the carboxyl anhydrase (CA) enzyme, which facilitates the conversion of HCO to CO2 inside the cell or near the membrane, was observed in numerous dinoflagellate species, including Lingulodinium (Lapointe et al., 2008), Symbiodinium (Leggat et al., 1999) and the here analyzed Operculodinium (Ratti et al., 2007). Also, here we find a relatively low sensitivity at the lower end of the CO2 scale. The lower CO2 values correspond to the northern-most locations, with trends below 240 µatm becoming somewhat obscured, at a minimum εp-CO2 around 13 ‰ (Fig. 6b). However, part of this leveling of the proxy relationship may reflect the locally higher nutrient concentrations offsetting the higher CO2. Though growth rates have a clear influence on εp in algal groups (Burkhardt et al., 1999), including dinoflagellates (Wilkes et al., 2017), the dilute batch culturing experiments conducted with P. reticulatum showed no clear influence of growth rates on εp (see also Sect. 4.2). It is also conceivable that higher growth rates influence εp indirectly through, for example, seasonally enhanced CO2 drawdown, resulting in higher δ13C values in the remaining DIC. This effect may be enhanced by the relatively short growing season at the high latitudes. However, in culture experiments at low CO2 concentrations with other dinoflagellate species, 13C fractionation was higher under nutrient-limiting conditions than under replete conditions (Hoins et al., 2016b). Because of these confounding factors, the influence of carbon-concentrating mechanisms on εp in O. centrocarpum is difficult to gauge with the presently available data and would ideally be tested using high nutrient or very low CO2 concentrations.
Still, also in the relatively limited range the current ocean offers for testing pCO2 proxies we have established a robust, albeit not overly sensitive, relation between pCO2 and dinocyst δ13C. Our cyst-based calibration yields more conservative and arguably more realistic absolute CO2 estimates and variability compared to available culture-based calibrations as it is based on the same compounds as will be analyzed in the paleo-domain. However, the low sensitivity at low CO2 implies that, until better constraints become available, the proposed calibration is potentially less suitable for application across, for example, the Pleistocene glacial periods. Further, it is important to realize that the value of 240 µatm is based on the assumption that the εp-CO2–pCO2 relation originated from cysts that have not been affected by the Suess effect and thus represent a lower limit for CO2 (in)sensitivity. While our data do not preclude fractionation smaller than the here observed minimum (∼ 13 ‰) during low-pCO2 periods, increased sensitivity at higher CO2 suggests that CO2 above (minimum) 240 µatm and CO2 variability can be reconstructed with reasonable precision.
4.5 Challenges of age control and potential caveats associated with anthropogenic carbon
A topic that warrants specific attention is the potential impact of anthropogenic carbon emissions on shaping the relation between δ13CDINO and εp. Here, we assume that our outlier analyses preferentially excluded samples that were significantly affected by anthropogenic CO2 and that, on average, the remainder of our core-top δ13CDINO was not appreciably affected by either decreasing δ13CDIC or elevated pCO2. The similarity in pre-industrial down-core δ13CDINO and that of three core-top localities in the North Atlantic corroborate the validity of this assumption locally, but these observations cannot be extrapolated to other regions. Unfortunately, sedimentation rates or other constraints for cyst production datums are not available. Further, if sedimentation rates were available for core-top localities, that would constitute an imperfect solution as it cannot provide the required dinocyst-specific age distribution needed to obtain an appropriate local pCO2 correction to the datum of cyst production. This challenge may be unique to data such as those presented here, as studies on other substrates with pCO2-proxy potential either could not generate data for individual single-celled organisms or have avoided the issue through other means, such as culture experiments (e.g., Pagani et al., 2002; Henehan et al., 2013), approaches that have other drawbacks.
Although we have no constraints on the ages of the cysts analyzed here, we can provide a meaningful test of the potential uncertainty added by our assumption that cysts are representative of pre-industrial conditions (Eq. 2a, b). The two scenarios that we have explored through Monte Carlo simulations show that, depending on the error distribution imposed on the assumed pCO2 used in the quadratic regressions (Eq. 2a, b), the fitted regression shifts towards higher values (Fig. 7c) and may be steeper (Fig. 7d). These error-propagation case studies illustrate that our proposed pre-industrial transfer function (Eq. 2a, b), if it does indeed contain a substantial proportion of very recent dinocysts, is likely to lead to underestimated pCO2 and perhaps pCO2 variability when applied in the paleo-domain. Consequently, we recommend future studies target, for example, sediment trap collections and culture-derived dinocysts to validate the results obtained here.
Our new modern ocean single-species carbon isotope fractionation dataset shows promising trends with environmental variables, pCO2 and nutrients. The selection of individual cysts allows control of cell size and species, which reduces uncertainty in proxy calibration and application compared to approaches based on organic substrates, which inevitably integrate entire communities. Although this approach has clear benefits, it also poses a unique challenge as the impact of anthropogenic carbon emissions on individual single-celled organisms must be considered. Based on our analyses, we expect this to be a relatively minor factor. In a worst-case scenario, however, we find that, although a helpful simplification, the assumption that all dinocysts from the core-top samples represent pre-industrial conditions may lead to an underestimate of pCO2 and perhaps also pCO2 variability when applied as a proxy in the paleo-domain.
In addition, many of the challenges associated with other proxies based on organic substrates are encountered here as well. For example, like in cultures (Hoins et al., 2016b), we observed an impact of nutrients on carbon isotope fractionation, possibly related to differences in growth rates. Similarly, at low pCO2 values sensitivity is reduced, possibly because of carbon-concentrating mechanisms involved in dinoflagellate C uptake, as observed in culturing experiments (e.g., Hoins et al., 2016a). Another remaining challenge is the observed difference between the cultured populations and cysts from the core-top sediments. This is a pronounced difference, not only in the absolute isotope fractionation values but also in the slope of the CO2 sensitivity, which appears to be much larger for the cysts and requires attention in future culture studies.
The offset in δ13C, combined with uncertainties in fractionation between the motile cells and dinocysts, implies that CO2 reconstructions using culture-based calibrations are more likely to overestimate past pCO2. Furthermore, the large spread in our data (∼ 5 ‰ between high and low CO2) suggests that, due to this high sensitivity in the cysts, the method is also suited to study population dynamics.
All newly generated data will be available via a permanent online repository (Mendeley data https://doi.org/10.17632/z6285myxkm.2, Frieling, 2023) upon publication.
The supplement related to this article is available online at: https://doi.org/10.5194/bg-20-4651-2023-supplement.
AS and GJR designed the study. LvR, IK and JF processed samples, generated and analyzed data. JF wrote the original draft. AS and GJR reviewed and edited the paper. AS acquired funding for this study.
The contact author has declared that none of the authors has any competing interests.
Publisher’s note: Copernicus Publications remains neutral with regard to jurisdictional claims made in the text, published maps, institutional affiliations, or any other geographical representation in this paper. While Copernicus Publications makes every effort to include appropriate place names, the final responsibility lies with the authors.
We thank Arnold van Dijk, Michiel Kienhuis and Helen de Waard (Utrecht University) for technical and analytical assistance. Appy Sluijs acknowledges funding from Netherlands Organisation for Scientific Research (NWO) no. ALWOP.223 and a European Research Council (ERC) Consolidator grant 771497 (SPANC). This work was carried out under the program of the Netherlands Earth System Science Centre (NESSC), financially supported by the Dutch Ministry of Education, Culture and Science. We thank three anonymous reviewers for their insightful and highly constructive comments and Steven Bouillon for editorial handling.
This research has been supported by the European Research Council, FP7 Ideas: European Research Council (SPANC (grant no. 771497)), and the Aard- en Levenswetenschappen, Nederlandse Organisatie voor Wetenschappelijk Onderzoek (grant no. ALWOP.223).
This paper was edited by Steven Bouillon and reviewed by three anonymous referees.
Anderson, D. M., Glibert, P. M., and Burkholder, J. M.: Harmful algal blooms and eutrophication: Nutrient sources, composition, and consequences, Estuaries, 25, 704–726, https://doi.org/10.1007/BF02804901, 2002.
Badger, M.: The roles of carbonic anhydrases in photosynthetic CO2 concentrating mechanisms, Photosynth. Res., 77, 83–94, https://doi.org/10.1023/A:1025821717773, 2003.
Badger, M. P. S.: Alkenone isotopes show evidence of active carbon concentrating mechanisms in coccolithophores as aqueous carbon dioxide concentrations fall below 7 µmol L−1, Biogeosciences, 18, 1149–1160, https://doi.org/10.5194/bg-18-1149-2021, 2021.
Barnola, J. M., Raynaud, D., Korotkevich, Y. S., and Lorius, C.: Vostok ice core provides 160,000-year record of atmospheric CO2, Nature, 329, 408–414, https://doi.org/10.1038/329408a0, 1987.
Bijl, P. K., Houben, A. J. P., Schouten, S., Bohaty, S. M., Sluijs, A., Reichart, G.-J., Damsté, J. S. S., and Brinkhuis, H.: Transient Middle Eocene Atmospheric CO2 and Temperature Variations, Science, 330, 819–821, https://doi.org/10.1126/science.1193654, 2010.
Boller, A. J., Thomas, P. J., Cavanaugh, C. M., and Scott, K. M.: Low stable carbon isotope fractionation by coccolithophore RubisCO, Geochim. Cosmochim. Ac., 75, 7200–7207, https://doi.org/10.1016/j.gca.2011.08.031, 2011.
Boller, A. J., Thomas, P. J., Cavanaugh, C. M., and Scott, K. M.: Isotopic discrimination and kinetic parameters of RubisCO from the marine bloom-forming diatom, Skeletonema costatum, Geobiology, 13, 33–43, https://doi.org/10.1111/gbi.12112, 2015.
Brandenburg, K. M., Rost, B., Van De Waal, D. B., Hoins, M., and Sluijs, A.: Physiological control on carbon isotope fractionation in marine phytoplankton, Biogeosciences, 19, 3305–3315, https://doi.org/10.5194/bg-19-3305-2022, 2022.
Brinkhuis, H., Sengers, S., Sluijs, A., Warnaar, J., Williams, G. L., and Exon, N. F.: Latest Cretaceous to earliest Oligocene, and Quaternary dinoflagellates from ODP site 1172, East Tasman Plateau, in: Proceedings of the Ocean Drilling Program, scientific results, edited by: Exon, N. and Kennett, J. P., US Government Printing Office, College Station, Texas, USA, https://doi.org/10.2973/odp.proc.sr.189.106.2003, 2003.
Burkhardt, S., Riesebell, U., and Zondervan, I.: Effects of growth rate, CO2 concentration, and cell size on the stable carbon isotope fractionation in marine phytoplankton, Geochim. Cosmochim. Ac., 63, 3729–3741, 1999.
de Leeuw, J. W., Versteegh, G. J. M., and van Bergen, P. F.: Biomacromolecules of Algae and Plants and their Fossil Analogues, Plant Ecol., 182, 209–233, https://doi.org/10.1007/s11258-005-9027-x, 2006.
Eberlein, T., Van de Waal, D., Brandenburg, K., John, U., Voss, M., Achterberg, E., and Rost, B.: Interactive effects of ocean acidification and nitrogen limitation on two bloom-forming dinoflagellate species, Mar. Ecol. Prog. Ser., 543, 127–140, https://doi.org/10.3354/meps11568, 2016.
Evitt, W. R.: Sporopollenin dinoflagellate cysts: their morphology and interpretation. Dallas, Texas: American Association of Stratigraphic Palynologists Foundation, 1–333, 1985.
Farquhar, G. D., Ehleringer, J. R., and Hubick, K. T.: Carbon Isotope Discrimination and Photosynthesis, Annu. Rev. Plant Physiol. Plant Mol. Biol., 40, 503–537, https://doi.org/10.1146/annurev.pp.40.060189.002443, 1989.
Fensome, R. A., MacRae, R. A., Moldowan, J. M., Taylor, F. J. R., and Williams, G. L.: The early Mesozoic radiation of dinoflagellates, Paleobiology, 22, 329–338, 1996.
Francey, R. J., Allison, C. E., Etheridge, D. M., Trudinger, C. M., Enting, I. G., Leuenberger, M., Langenfelds, R. L., Michel, E., and Steele, L. P.: A 1000-year high precision record of δ13C in atmospheric CO2, Tellus B, 51, 170–193, https://doi.org/10.1034/j.1600-0889.1999.t01-1-00005.x, 1999.
Freeman, K. H.: Isotopic biogeochemistry of marine organic carbon, Rev. Mineral. Geochem., 43, 579–605, https://doi.org/10.2138/gsrmg.43.1.579, 2001.
Freeman, K. H. and Hayes, J. M.: Fractionation of carbon isotopes by phytoplankton and estimates of ancient CO2 levels, Global Biogeochem. Cy., 6, 185–198, 1992.
Frieling, J.: Core-top carbon isotope measurements of dinoflagellate cysts, Mendeley Data [data set], https://doi.org/10.17632/z6285myxkm.2, 2023.
Frieling, J. and Sluijs, A.: Towards quantitative environmental reconstructions from ancient non-analogue microfossil assemblages: Ecological preferences of Paleocene – Eocene dinoflagellates, Earth-Sci. Rev., 185, 956–973, https://doi.org/10.1016/j.earscirev.2018.08.014, 2018.
Gattuso, J. P., Epitalon, J. M., Lavigne, H., and Orr, J.: seacarb: seawater carbonate chemistry, R package version 3.3.0, https://doi.org/10.5281/zenodo.4600014, 2021.
Giordano, M., Beardall, J., and Raven, J. A.: CO2 Concentrating Mechanisms in Algae: Mechanisms, Environmental Modulation, and Evolution, Annu. Rev. Plant Biol., 56, 99–131, https://doi.org/10.1146/annurev.arplant.56.032604.144052, 2005.
Goericke, R. and Fry, B.: Variations of marine plankton δ13C with latitude, temperature, and dissolved CO2 in the world ocean, Global Biogeochem. Cy., 8, 85–90, https://doi.org/10.1029/93GB03272, 1994.
Gouretski, V. V. and Koltermann, K. P.: WOCE Global Hydrographic Climatology, Berichte des Bundesamtes fur Seeschifffahrt und Hydrogr., 35, 52 pp., https://doi.org/10.5065/GS51-V170, 2004.
Hallegraeff, G. M.: A review of harmful algal blooms and their apparent global increase, Phycologia, 32, 79–99, https://doi.org/10.2216/i0031-8884-32-2-79.1, 1993.
Hayes, J. M.: Fractionation of Carbon and Hydrogen Isotopes in Biosynthetic Processes, Rev. Mineral. Geochem., 43, 225–277, https://doi.org/10.2138/gsrmg.43.1.225, 2001.
Hayes, J. M., Strauss, H., and Kaufman, A. J.: The abundance of 13C in marine organic matter and isotopic fractionation in the global biogeochemical cycle of carbon during the past 800 Ma, Chem. Geol., 161, 103–125, 1999.
Head, M. J.: Modern dinoflagellate cysts and their biological affinities, Palynol. Princ. Appl., 3, 1197–1248, 1996.
Henderiks, J. and Pagani, M.: Refining ancient carbon dioxide estimates: Significance of coccolithophore cell size for alkenone-based pCO2 records, Paleoceanography, 22, PA3202, https://doi.org/10.1029/2006PA001399, 2007.
Henehan, M. J., Rae, J. W. B., Foster, G. L., Erez, J., Prentice, K. C., Kucera, M., Bostock, H. C., Martínez-Botí, M. A., Milton, J. A., Wilson, P. A., Marshall, B. J., and Elliott, T.: Calibration of the boron isotope proxy in the planktonic foraminifera Globigerinoides ruber for use in palaeo-CO2 reconstruction, Earth Planet. Sc. Lett., 364, 111–122, https://doi.org/10.1016/j.epsl.2012.12.029, 2013.
Hoins, M., Van de Waal, D. B., Eberlein, T., Reichart, G.-J., Rost, B., and Sluijs, A.: Stable carbon isotope fractionation of organic cyst-forming dinoflagellates: Evaluating the potential for a CO2 proxy, Geochim. Cosmochim. Ac., 160, 267–276, https://doi.org/10.1016/j.gca.2015.04.001, 2015.
Hoins, M., Eberlein, T., Van de Waal, D. B., Sluijs, A., Reichart, G.-J., and Rost, B.: CO2-dependent carbon isotope fractionation in dinoflagellates relates to their inorganic carbon fluxes, J. Exp. Mar. Bio. Ecol., 481, 9–14, https://doi.org/10.1016/j.jembe.2016.04.001, 2016a.
Hoins, M., Eberlein, T., Großmann, C. H., Brandenburg, K., Reichart, G.-J., Rost, B., Sluijs, A., and Van de Waal, D. B.: Combined Effects of Ocean Acidification and Light or Nitrogen Availabilities on 13C Fractionation in Marine Dinoflagellates, PLoS One, 11, e0154370, https://doi.org/10.1371/journal.pone.0154370, 2016b.
IPCC: Climate Change 2014: Synthesis Report. Contribution of Working Groups I, II and III to the Fifth Assessment Report of the Intergovernmental Panel on Climate Change, Core Writing Team, edited by: Pachauri, R. K. and Meyer, L. A., IPCC, Geneva, Switzerland, 151 pp., ISBN 978-92-9169-143-2, 2014.
Keeling, R. F., Graven, H. D., Welp, L. R., Resplandy, L., Bi, J., Piper, S. C., Sun, Y., Bollenbacher, A. and Meijer, H. A. J.: Atmospheric evidence for a global secular increase in carbon isotopic discrimination of land photosynthesis, P. Natl. Acad. Sci. USA, 114, 10361–10366, https://doi.org/10.1073/pnas.1619240114, 2017.
Kodrans-Nsiah, M., De Lange, G. J., and Zonneveld, K. A. F.: A natural exposure experiment on short-term species-selective aerobic degradation of dinoflagellate cysts, Rev. Palaeobot. Palynol., 152, 32–39, 2008.
Lapointe, M., MacKenzie, T. D. B., and Morse, D.: An external δ-carbonic anhydrase in a free-living marine dinoflagellate may circumvent diffusion-limited carbon acquisition, Plant Physiol., 147, 1427–1436, https://doi.org/10.1104/pp.108.117077, 2008.
Leggat, W., Badger, M. R., and Yellowlees, D.: Evidence for an inorganic carbon-concentrating mechanism in the symbiotic dinoflagellate Symbiodinium sp., Plant Physiol., 121, 1247–1255, https://doi.org/10.1104/pp.121.4.1247, 1999.
Magozzi, S., Yool, A., Vander Zanden, H. B., Wunder, M. B., and Trueman, C. N.: Using ocean models to predict spatial and temporal variation in marine carbon isotopes, Ecosphere, 8, e01763, https://doi.org/10.1002/ecs2.1763, 2017.
Mertens, K. N., Ribeiro, S., Bouimetarhan, I., Caner, H., Combourieu Nebout, N., Dale, B., De Vernal, A., Ellegaard, M., Filipova, M., Godhe, A., Goubert, E., Grøsfjeld, K., Holzwarth, U., Kotthoff, U., Leroy, S. A. G., Londeix, L., Marret, F., Matsuoka, K., Mudie, P. J., Naudts, L., Peña-Manjarrez, J. L., Persson, A., Popescu, S. M., Pospelova, V., Sangiorgi, F., van der Meer, M. T. J., Vink, A., Zonneveld, K. A. F., Vercauteren, D., Vlassenbroeck, J., Louwye, S., Nebout, N. C., Dale, B., De Vernal, A., Ellegaard, M., Filipova, M., and Godhe, A.: Process length variation in cysts of a dinoflagellate, Lingulodinium machaerophorum, in surface sediments: investigating its potential as salinity proxy, Mar. Micropaleontol., 70, 54–69, https://doi.org/10.1016/j.marmicro.2008.10.004, 2009.
Mook, W. G., Bommerson, J. C., and Staverman, W. H.: Carbon isotope fractionation between dissolved bicarbonate and gaseous carbon dioxide, Earth Planet. Sc. Lett., 22, 169–176, https://doi.org/10.1016/0012-821X(74)90078-8, 1974.
Naafs, B. D. A., Castro, J. M., De Gea, G. A., Quijano, M. L., Schmidt, D. N., and Pancost, R. D.: Gradual and sustained carbon dioxide release during Aptian Oceanic Anoxic Event 1a, Nat. Geosci., 9, 135–139, https://doi.org/10.1038/ngeo2627, 2016.
Nooteboom, P. D., Bijl, P. K., van Sebille, E., von der Heydt, A. S., and Dijkstra, H. A.: Transport bias by ocean currents in sedimentary microplankton assemblages: Implications for paleoceanographic reconstructions, Paleoceanogr. Paleocl., 34, 1178–1194, https://doi.org/10.1029/2019PA003606, 2019.
Pagani, M.: Biomarker-Based Inferences of Past Climate: The Alkenone pCO2 Proxy, 2nd Edm., Elsevier Ltd., ISBN: 978-0-08-098300-4, 2013.
Pagani, M., Freeman, K. H., Ohkouchi, N., and Caldeira, K.: Comparison of water column [CO2 aq] with sedimentary alkenone-based estimates: A test of the alkenone-CO2 proxy, Paleoceanography, 17, 1069, https://doi.org/10.1029/2002PA000756, 2002.
Pagani, M., Liu, Z., LaRiviere, J., and Ravelo, A. C.: High Earth-system climate sensitivity determined from Pliocene carbon dioxide concentrations, Nat. Geosci., 3, 27–30, https://doi.org/10.1038/ngeo724, 2010.
Pagani, M., Huber, M., Liu, Z., Bohaty, S. M., Henderiks, J., Sijp, W. P., Krishnan, S., and DeConto, R. M.: The Role of Carbon Dioxide During the Onset of Antarctic Glaciation, Science, 334, 1261–1265, https://doi.org/10.1126/science.1203909, 2011.
PALAEOSENS: Making sense of palaeoclimate sensitivity, Nature, 491, 683–691, https://doi.org/10.1038/nature11574, 2012.
Pancost, R. D. and Pagani, M.: Controls on the carbon isotopic compositions of lipids in marine environments, Handb. Environ. Chem., 2, 209–249, https://doi.org/10.1007/698_2_007, 2006.
Popp, B. N., Laws, E. A., Bidigare, R. R., Dore, J. E., Hanson, K. L., and Wakeham, S. G.: Effect of Phytoplankton Cell Geometry on Carbon Isotopic Fractionation, Geochim. Cosmochim. Ac., 62, 69–77, https://doi.org/10.1016/S0016-7037(97)00333-5, 1998.
Rae, J. W. B., Zhang, Y. G., Liu, X., Foster, G. L., Stoll, H. M., and Whiteford, R. D. M.: Atmospheric CO2 over the Past 66 Million Years from Marine Archives, Annu. Rev. Earth Pl. Sc., 49, 599–631, https://doi.org/10.1146/annurev-earth-082420-063026, 2021.
Ratti, S., Giordano, M., and Morse, D.: CO2-concentrating mechanisms of the potentially toxic dinoflagellate Protoceratium reticulatum (Dinophyceae, Gonyaulacales), J. Phycol., 43, 693–701, https://doi.org/10.1111/j.1529-8817.2007.00368.x, 2007.
Richter, T. O., Peeters, F. J. C., and van Weering, T. C. E.: Late Holocene (0–2.4 ka BP) surface water temperature and salinity variability, Feni Drift, NE Atlantic Ocean, Quaternary Sci. Rev., 28, 1941–1955, https://doi.org/10.1016/j.quascirev.2009.04.008, 2009.
Roeske, C. A. and O'Leary, M. H.: Carbon isotope effects on enzyme-catalyzed carboxylation of ribulose bisphosphate, Biochemistry, 23, 6275–6284, https://doi.org/10.1021/bi00320a058, 1984.
Rost, B., Richter, K.-U., Riesebell, U., and Hansen, P. J.: Inorganic carbon acquisition in red tide dinoflagellates, Plant, Cell Environ., 29, 810–822, https://doi.org/10.1111/j.1365-3040.2005.01450.x, 2006.
Schoon, P. L., Sluijs, A., Sinninghe Damsté, J. S., and Schouten, S.: Stable carbon isotope patterns of marine biomarker lipids in the Arctic Ocean during Eocene Thermal Maximum 2, Paleoceanography, 26, PA3215, https://doi.org/10.1029/2010PA002028, 2011.
Schouten, S., Klein Breteler, W. C., Blokker, P., Schogt, N., Rijpstra, W. I. C., Grice, K., Baas, M., and Sinninghe Damsté, J. S.: Biosynthetic effects on the stable carbon isotopic compositions of algal lipids: implications for deciphering the carbon isotopic biomarker record, Geochim. Cosmochim. Ac., 62, 1397–1406, https://doi.org/10.1016/S0016-7037(98)00076-3, 1998.
Sharkey, T. D. and Berry, J. A.: Carbon isotope fractionation of algae as influenced by an inducible CO2 concentrating mechanism, in: Inorganic carbon uptake by Aquatic Photosynthetic organisms, edited by: Lucas, W. J. and Berry, J. A., 389–401, American Society of Plant Physiologists, ISBN: 0 943088 05 4, 1985.
Sluijs, A., van Roij, L., Frieling, J., Laks, J., and Reichart, G.-J.: Single-species dinoflagellate cyst carbon isotope ecology across the Paleocene-Eocene Thermal Maximum, Geology, 46, 79–82, https://doi.org/10.1130/G39598.1, 2018.
Stoll, H. M., Guitian, J., Hernandez-Almeida, I., Mejia, L. M., Phelps, S., Polissar, P., Rosenthal, Y., Zhang, H., and Ziveri, P.: Upregulation of phytoplankton carbon concentrating mechanisms during low CO2 glacial periods and implications for the phytoplankton pCO2 proxy, Quaternary Sci. Rev., 208, 1–20, https://doi.org/10.1016/j.quascirev.2019.01.012, 2019.
Tagliabue, A. and Bopp, L.: Towards understanding global variability in ocean carbon-13, Global Biogeochem. Cy., 22, 1–13, https://doi.org/10.1029/2007GB003037, 2008.
Takahashi, T., Sutherland, S. C., Chipman, D. W., Goddard, J. G., Ho, C., Newberger, T., Sweeney, C., and Munro, D. R.: Climatological distributions of pH, pCO2, total CO2, alkalinity, and CaCO3 saturation in the global surface ocean, and temporal changes at selected locations, Mar. Chem., 164, 95–125, https://doi.org/10.1016/j.marchem.2014.06.004, 2014.
Takahashi, T., Sutherland, S. C., and Kozyr, A.: Global Ocean Surface Water Partial Pressure of CO2 Database: Measurements Performed During 1957–2015 (Version 2015), Carbon Dioxide Information Analysis Center, Oak Ridge National Laboratory, U.S. Department of Energy, Oak Ridge, Tennessee, NOAA National Centers for Environmental Information, https://doi.org/10.3334/CDIAC/OTG.NDP088(V2015), 2015.
Van de Waal, D. B., John, U., Ziveri, P., Reichart, G.-J., Hoins, M., Sluijs, A., and Rost, B.: Ocean Acidification Reduces Growth and Calcification in a Marine Dinoflagellate, PLoS One, 8, e65987, https://doi.org/10.1371/journal.pone.0065987, 2013.
van Roij, L., Sluijs, A., Laks, J. J., and Reichart, G.-J.: Stable carbon isotope analyses of ng quantities of particulate organic carbon (pollen) with laser ablation nano combustion gas chromatography isotope ratio mass spectrometry, Rapid Commun. Mass Sp., 31, 47–58, https://doi.org/10.1002/rcm.7769, 2016.
Versteegh, G. J. M., Blokker, P., Marshall, C., and Pross, J.: Macromolecular composition of the dinoflagellate cyst Thalassiphora pelagica (Oligocene, SW Germany), Org. Geochem., 38, 1643–1656, https://doi.org/10.1016/j.orggeochem.2007.06.007, 2007.
Versteegh, G. J. M., Blokker, P., Bogus, K., Harding, I. C., Lewis, J., Oltmanns, S., Rochon, A., and Zonneveld, K. A. F.: Infra red spectroscopy, flash pyrolysis, thermally assisted hydrolysis and methylation (THM) in the presence of tetramethylammonium hydroxide (TMAH) of cultured and sediment-derived Lingulodinium polyedrum (Dinoflagellata) cyst walls, Org. Geochem., 43, 92–102, https://doi.org/10.1016/j.orggeochem.2011.10.007, 2012.
Wall, D. and Dale, B.: “Living fossils” in Western Atlantic plankton, Nature, 211, 1025–1026, https://doi.org/10.1038/2111025a0, 1966.
Wilkes, E. B. and Pearson, A.: A general model for carbon isotopes in red-lineage phytoplankton: Interplay between unidirectional processes and fractionation by RubisCO, Geochim. Cosmochim. Ac., 265, 163–181, https://doi.org/10.1016/j.gca.2019.08.043, 2019.
Wilkes, E. B., Carter, S. J., and Pearson, A.: CO2 -dependent carbon isotope fractionation in the dinoflagellate Alexandrium tamarense, Geochim. Cosmochim. Ac., 212, 48–61, https://doi.org/10.1016/j.gca.2017.05.037, 2017.
Wilkes, E. B., Lee, R. B. Y., McClelland, H. L. O., Rickaby, R. E. M., and Pearson, A.: Carbon isotope ratios of coccolith–associated polysaccharides of Emiliania huxleyi as a function of growth rate and CO2 concentration, Org. Geochem., 119, 1–10, https://doi.org/10.1016/j.orggeochem.2018.02.006, 2018.
Williams, G. L., Brinkhuis, H., Pearce, M. A., Fensome, R. A., and Weegink, J. W.: Southern Ocean and global dinoflagellate cyst events compared: index events for the Late Cretaceous–Neogene, in Proceedings of the Ocean Drilling Program, Sci. Res., 189, 1–98., 2004.
Witkowski, C. R., Weijers, J. W. H., Blais, B., Schouten, S., and Sinninghe Damsté, J. S.: Molecular fossils from phytoplankton reveal secular PCO2 trend over the Phanerozoic, Sci. Adv., 4, eaat4556, https://doi.org/10.1126/sciadv.aat4556, 2018.
Zhang, H., Torres-Romero, I., and Stoll, H. M.: Re-examining extreme carbon isotope fractionation in the coccolithophore Ochrosphaera neapolitana, Nat. Commun., 13, 7606, https://doi.org/10.1038/s41467-022-35109-4, 2022.
Zonneveld, K. A. F., Versteegh, G. J. M., and De Lange, G. J.: Preservation of organic-walled dinoflagellate cysts in different oxygen regimes: a 10,000 year natural experiment, Mar. Micropaleontol., 29, 393–405, 1997.
Zonneveld, K. A. F., Marret, F., Versteegh, G. J. M., Bogus, K., Bonnet, S., Bouimetarhan, I., Crouch, E., de Vernal, A., Elshanawany, R., Edwards, L., Esper, O., Forke, S., Grøsfjeld, K., Henry, M., Holzwarth, U., Kielt, J.-F., Kim, S.-Y., Ladouceur, S., Ledu, D., Chen, L., Limoges, A., Londeix, L., Lu, S.-H., Mahmoud, M. S., Marino, G., Matsouka, K., Matthiessen, J., Mildenhal, D. C., Mudie, P., Neil, H. L., Pospelova, V., Qi, Y., Radi, T., Richerol, T., Rochon, A., Sangiorgi, F., Solignac, S., Turon, J.-L., Verleye, T., Wang, Y., Wang, Z., and Young, M.: Atlas of modern dinoflagellate cyst distribution based on 2405 data points, Rev. Palaeobot. Palynol., 191, 1–197, https://doi.org/10.1016/j.revpalbo.2012.08.003, 2013.
Zonneveld, K. A. F., Gray, D. D., Kuhn, G., and Versteegh, G. J. M.: Postdepositional aerobic and anaerobic particulate organic matter degradation succession reflected by dinoflagellate cysts: The Madeira Abyssal Plain revisited, Mar. Geol., 408, 87–109, https://doi.org/10.1016/j.margeo.2018.11.010, 2019.