the Creative Commons Attribution 4.0 License.
the Creative Commons Attribution 4.0 License.
 | 22 Dec 2023
Adjustments to the Rock-Eval® thermal analysis for soil organic and inorganic carbon quantification
Joséphine Hazera
David Sebag
Isabelle Kowalewski
Eric Verrecchia
Herman Ravelojaona
Tiphaine Chevallier
Quantifying both soil organic carbon (SOC) and soil inorganic carbon (SIC) is essential to understand carbon (C) dynamics and to assess the atmospheric C sequestration potential in calcareous soils. The procedures usually used to quantify SOC and SIC involve pretreatments (decarbonation, carbonate removal) and calculations of the difference between C contents estimated by elemental analysis on raw and pretreated aliquots. These procedures lead to analytical bias associated with pretreatments, measurement deviations associated with sample heterogeneity, and cumulative errors associated with calculations. The Rock-Eval® analysis is a ramped thermal analysis that has been used in soil sciences since the 2000s, consisting of pyrolysis of the sample followed by oxidation of the residue. A single Rock-Eval® analysis on non-pretreated aliquots provides two parameters estimating the organic (TOC) and inorganic (MinC) C contents of the samples. Nevertheless, the Rock-Eval® protocol was standardised in the 1970s by IFP Energies Nouvelles for studying oil-bearing rocks and is thus not perfectly suited for soil study. Previous studies have suggested statistical corrections of the standard parameters to improve their estimations of C contents assessed by elemental analysis, but only a few of them have focused on the estimation of inorganic C content using the MinC parameter. Moreover, none of them have suggested adjustments to the standard Rock-Eval® protocol. This study proposes to adapt this protocol to optimise SOC and SIC quantifications in soil samples. Comparisons between SOC and SIC quantifications by elemental analysis and by Rock-Eval®, with and without statistical corrections of the standard TOC and MinC parameters, were carried out on 30 agricultural topsoils with a wide range of SOC and SIC contents. The results show that the standard Rock-Eval® protocol can properly estimate SOC contents once the TOC parameter is corrected. However, it cannot achieve a complete thermal breakdown of SIC amounts > 4 mg, leading to an underestimation of high SIC contents by the MinC parameter, even after correcting for this. Thus, the final oxidation isotherm is extended to 7 min to complete the thermal breakdown of SIC before the end of the analysis. This work is a methodological step to measure SOC and SIC contents in a single analytical run on a non-pretreated aliquot. More work is needed (i) on a wider range of soil samples with differing land use and other forms of carbonate mineral and sampling depths and (ii) to avoid the use of statistical corrections of the TOC and MinC parameters.
- Article
(2694 KB) - Full-text XML
-
Supplement
(612 KB) - BibTeX
- EndNote


The carbon (C) cycle is particularly active in the pedosphere, which is at the interface between life and mineral matter. Indeed, the world's top metre of soil contains 2000 to 2200 PgC on average, with 70 % being soil organic carbon (SOC) and 30 % being soil inorganic carbon (SIC; Batjes, 1996; Plaza et al., 2018). Stocks and dynamics of SOC and SIC strongly affect soil functions and atmospheric C sequestration (Virto et al., 2022; Zamanian and Kuzyakov, 2022; Sharififar et al., 2023). Furthermore, quantifying the changes in SIC following the weathering processes of parent materials in critical-zone studies is also a challenge (Martin et al., 2021). Thus, the study of soil C is essential to address scientific, societal, and economic issues related to food security, climate change, and to a larger extent C fluxes in Earth's critical zone.
Although most of the studies focus on SOC, SIC plays a fundamental role in calcareous soils, representing 30 % to 50 % of the world's soils (Chen and Barak, 1982; Zamanian et al., 2018). SIC can act as a sink of atmospheric C (Bughio et al., 2016; Cailleau et al., 2011; Gao et al., 2017; Vicca et al., 2022), and, thanks to the calcium ions associated with carbonate, SIC improves SOC stability by stabilising soil aggregates and by forming complexes with organic matter (Rowley et al., 2018; Shabtai et al., 2023). Nevertheless, SIC can also act as a source of atmospheric C (Chevallier et al., 2016; Cardinael et al., 2019; Zamanian et al., 2021). Subsequently, it is essential to clearly identify and quantify soil C forms, in terms of SOC and SIC, to understand the different processes of C dynamics and to assess the atmospheric C sequestration potential in calcareous soils.
Elemental analysis (EA) is often considered the reference test for soil C quantification (ISO, 1995b; Bispo et al., 2017; Chatterjee et al., 2009). However, EA requires the flash combustion of samples, and thus, it cannot separately quantify SOC and SIC when applied to a calcareous soil sample. Therefore, the total C (TC) must be first quantified by EA on one aliquot and the SOC (or the SIC) on a second aliquot. The SIC (or the SOC) content not measured by EA is then calculated using the difference: SIC = TC − SOC (or SOC = TC − SIC). SOC quantification can be performed by EA on an aliquot previously fumigated with acid (Harris et al., 2001) or by the wet-oxidation method (ISO, 1998; Bispo et al., 2017). SIC quantification can be performed by EA on an aliquot previously heated at 550 ∘C to remove the SOC (Bertrand et al., 2007) or by the Scheibler or calcimetry method (ISO, 1995a; Bispo et al., 2017).
Unfortunately, removing SIC or SOC without any modification of the other C form remains a methodological issue. Some studies reported a possible measurement bias due to incomplete carbonate removal and/or organic matter alteration after acid fumigation (Schlacher and Connolly, 2014; Apesteguia et al., 2018). A consensus has not been found on the ignition temperature or the exposure time to complete organic matter combustion without carbonate alteration after soil heating to approximately 550 ∘C (Nayak et al., 2019; Chatterjee et al., 2009). Alternatively, the wet-oxidation method quantifies SOC without pretreatments thanks to organic matter digestion. However, the recovery percentage of this digestion depends on soil type, depth, and mineralogy. Consequently, correction factors are needed to estimate the SOC content but can lead to over- or underestimation (Nayak et al., 2019; Chatterjee et al., 2009). In addition to uncertainties related to the pretreatments or measurements, quantifying SOC and SIC on two aliquots can also generate analytical deviations associated with the heterogeneity of the sample. Moreover, these pretreatments and specific methods for SOC and SIC quantifications are time-consuming, require handling chemicals (acid fumigation, wet combustion, calcimetry), and produce chemical wastes (wet combustion).
Thermal analysis monitors the physicochemical properties of a sample while it is progressively heated in a reductive (pyrolysis) or oxidative (oxidation) atmosphere (Plante et al., 2009; Lever et al., 2014). Thermograms plot a property against time and temperature and provide a rapid characterisation of C associations in the sample based on a single aliquot. However, most of the thermal methods used in soil science, such as thermogravimetry, differential thermal analysis, or differential scanning calorimetry, focus on organic compounds (Plante et al., 2009). Ramped combustion is a promising method to measure SOC and SIC in a single aliquot (Bisutti et al., 2007; Vuong et al., 2016; Apesteguia et al., 2018) but remains poorly tested. To our knowledge, none of the thermal methods are standardised to quantify SOC and SIC, unlike the Rock-Eval® (RE) thermal analysis, which provides two standardised parameters estimating the organic and inorganic C contents of a sample (TOC and MinC, respectively). The RE analysis consists of pyrolysis of the sample followed by oxidation of the residue. Temperature boundaries are used to distinguish the signals released by the pyrolytic cracking and oxidative combustion of organic C from the signals released by the inorganic C thermal breakdown. The TOC and MinC parameters are then calculated by integrating these signals between the temperature boundaries. These temperature boundaries were initially set for the study of oil-bearing rocks (Behar et al., 2001).
The RE thermal analysis has been progressively developed and used in soil science mostly to quantify SOC with the TOC parameter (Disnar et al., 2003; Saenger et al., 2013) and to characterise SOC stability through several indices directly calculated from the signals (Sebag et al., 2016; Soucémarianadin et al., 2018; Malou et al., 2020) or statistically predicted with a machine-learning model (Cécillon et al., 2021). To quantify SOC, Disnar et al. (2003) corrected the underestimation of the SOC content by the TOC parameter compared to EA carried out on noncalcareous soils. No application has been dedicated to SIC quantification, and only some studies have focused on inorganic C quantification in sediments (Pillot et al., 2014; Baudin et al., 2015; Wattripont et al., 2019). Recently, Sebag et al. (2022a, b) used relations between the TOC and MinC parameters assessed in calcareous and noncalcareous soils to correct their estimations of the SOC and SIC contents, respectively (SOTHIS – soil characterisation by thermal analysis – correction). All these approaches rely on post hoc statistical corrections of the standardised TOC and MinC parameters to quantify SOC and SIC without changing the standard analysis protocol of the RE method.
This study proposes to adapt the RE thermal analysis protocol to optimise the quantification of SOC and SIC in soil samples. Comparisons between SOC and SIC quantifications by EA (after carbonate removal, noted EAHCl, and after decarbonation, noted EA, respectively) and by RE (with and without statistical corrections of the standard TOC and MinC parameters) were carried out on 30 different agricultural topsoils with a wide range of SOC and SIC contents and on three geostandard materials and a calcite sample. We hypothesised that (i) statistical corrections on TOC and MinC parameters improve the estimation of SOC and low SIC contents, respectively, and (ii) the standard cycle analysis needs to be adjusted to improve the estimation of high SIC contents by the corrected MinC parameters.
2.1 Material
Thirty different agricultural topsoils were selected from the soil library of the Eco&Sols lab in Montpellier. These 30 soils were selected to have a wide range of SOC and SIC contents and soil types (Table 1). These 30 soils were collected at a depth of 0–10 or 0–15 cm in Mediterranean agricultural settings of southern France and northern Tunisia (Table 1). Among these 30 soils, four were considered noncalcareous because they had no or very low Rock-Eval® (RE) signals specific to SIC (Table 1). These four noncalcareous soils were analysed by EA and RE (Fig. S1 in the Supplement), similar to the other soils. All soil samples were dried at 40 ∘C, sieved at 2 mm, and milled with 200 µm mesh before analysis. No correction for the residual moisture at 105 ∘C was performed for either the RE or EA analysis.
Table 1Description of the 30 agricultural topsoils. The WRB qualifiers were added to the reference soil group when available (IUSS Working group WRB, 2015). The depth is in centimetres. The TC (gC kg−1 soil) contents were assessed by EA, and the SOC (g SOC kg−1) and SIC contents (g SIC kg−1) were assessed by EA after decarbonation (EAHCl) and carbonate removal (EA), respectively.
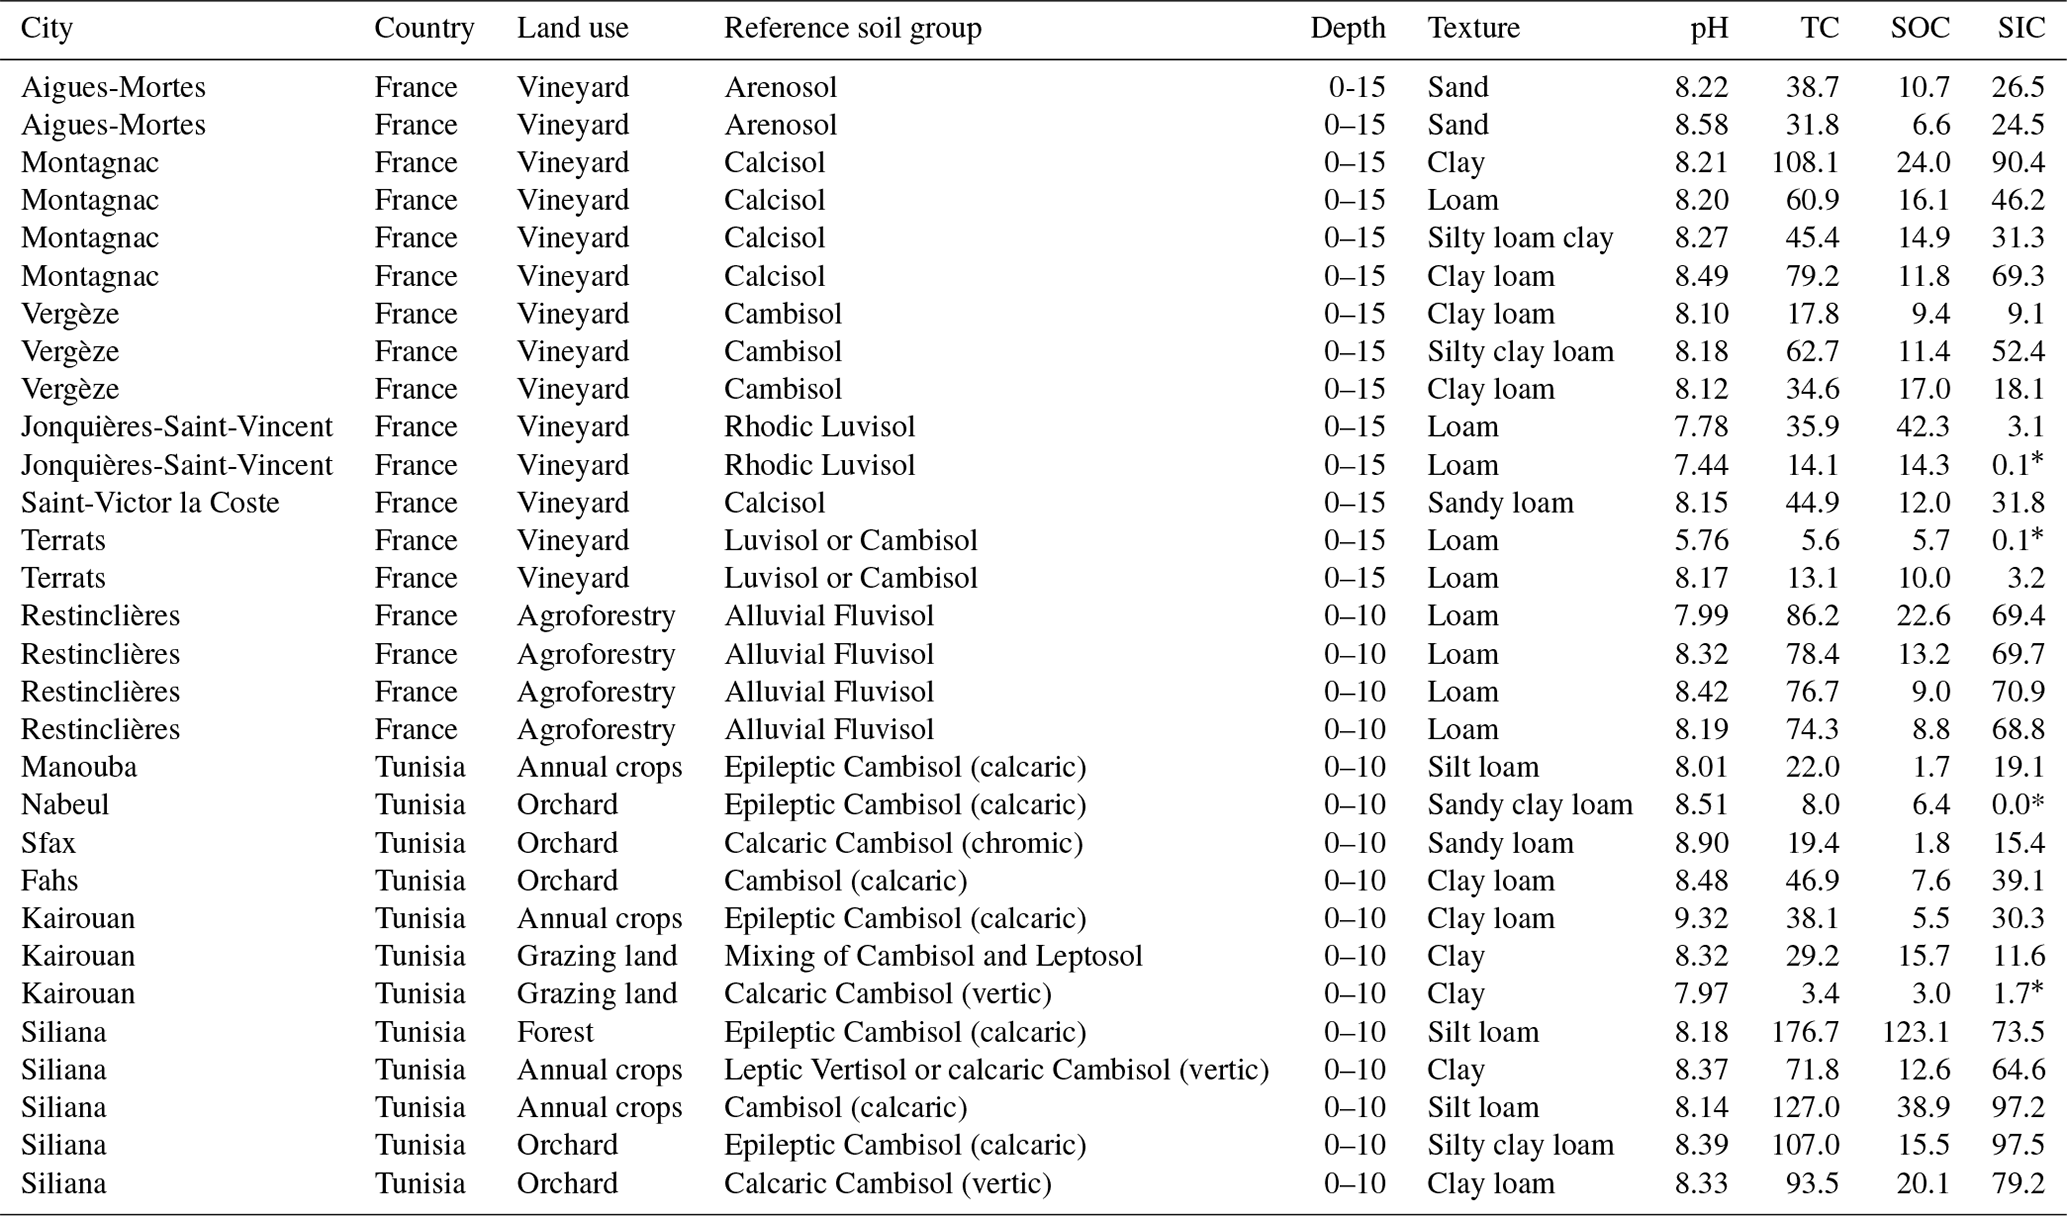
* Soil samples considered noncalcareous because they had no or very low RE signals specific to SIC.
As the most common carbonate mineral in soils is calcite, a sample of calcite was analysed by X-ray diffraction (XRD; Fig. S2), EA (Table S1), and RE (Fig. S3) to check its purity. The positions of the X-ray diffraction maximum (Fig. S2) corresponded to those of the reference sample PDF 04-008-0788 of the International Centre for Diffraction Data. Thus, the calcite sample used in this study was composed of only one crystallised solid and corresponds to calcite. The estimations of the TC content of this sample were very close to theoretical stoichiometric TC content of pure calcite (120 g TC kg−1, ); Table S1). Moreover, the RE thermograms (Fig. S3) corresponded to those obtained for pure calcite (Lafargue et al., 1998; Pillot et al., 2014).
To check the accuracy of our results, three natural geostandard materials were selected based on the availability of their TC content assessment: two soil standards (ERMCC690 from the European Commission – Joint Research Centre and ISE850 from the WEPAL International Soil-analytical Exchange Programme) and one Norwegian Geochemical Standard of rock (SR1).
2.2 Measurements
2.2.1 Elemental analysis
C contents were estimated for the 30 agricultural topsoils, the three geostandard materials, and the calcite sample with an elemental analyser (Carlo Erba NA 2000) without any pretreatment for TC (noted EA) after carbonate removal with HCl to remove SIC from the samples for the SOC measurement (noted EAHCl) and after a 550 ∘C heating pretreatment to remove SOC from the samples for the SIC measurement (noted EA). The carbonate removal was performed by acid fumigation on the aliquots dedicated to the SOC content estimation. The Ag foil capsules were filled with 30 ± 5 mg of soil and 50 µL of demineralised water and placed in a vacuum desiccator with a 100 mL beaker of concentrated HCl (37 %) for 8 h. The capsules were then dried at 60 ∘C for 48 h before being closed and analysed with an elemental analyser (Harris et al., 2001; Cardinael et al., 2015). The decarbonation pretreatment was performed by heating the aliquots dedicated to SIC content estimation. The capsules were filled with 30 ± 5 mg of soil and placed in a muffle furnace at 550 ∘C for 6 h (Bertrand et al., 2007). The capsules were then closed and analysed with an elemental analyser.
2.2.2 Rock-Eval® thermal analysis
The standard cycle of Rock-Eval® analysis
The Rock-Eval® (RE) method is a ramped thermal analysis performed by an RE-6 device consisting of a pyrolysis furnace and an oxidation furnace. The analyses were carried out on the standard RE-6 device (Vinci Technologies, France) of the IFP Energies Nouvelles (IFPEN) laboratory using the “basic” method (Behar et al., 2001; Baudin et al., 2022). The steel crucibles were filled with different sample amounts depending on the sample (see Sect. 2.3) and analysed with the standard cycle consisting of two phases: pyrolysis of the sample under an inert dinitrogen atmosphere (N2, purity = 99.999 %) and oxidation of the residue under synthetic air (80 % N2 and 20 % O2, purity = 99.999 %). The pyrolysis starts with an isotherm of 3 min at 200 ∘C and continues with a temperature ramp of 25 ∘C min−1 up to an isotherm of 3 min at 650 ∘C. The oxidation starts with an isotherm of 3 min at 200 ∘C and continues with a temperature ramp of 25 ∘C min−1 up to an isotherm of 3 min at 850 ∘C. The analysis took approximately 1 h per sample.
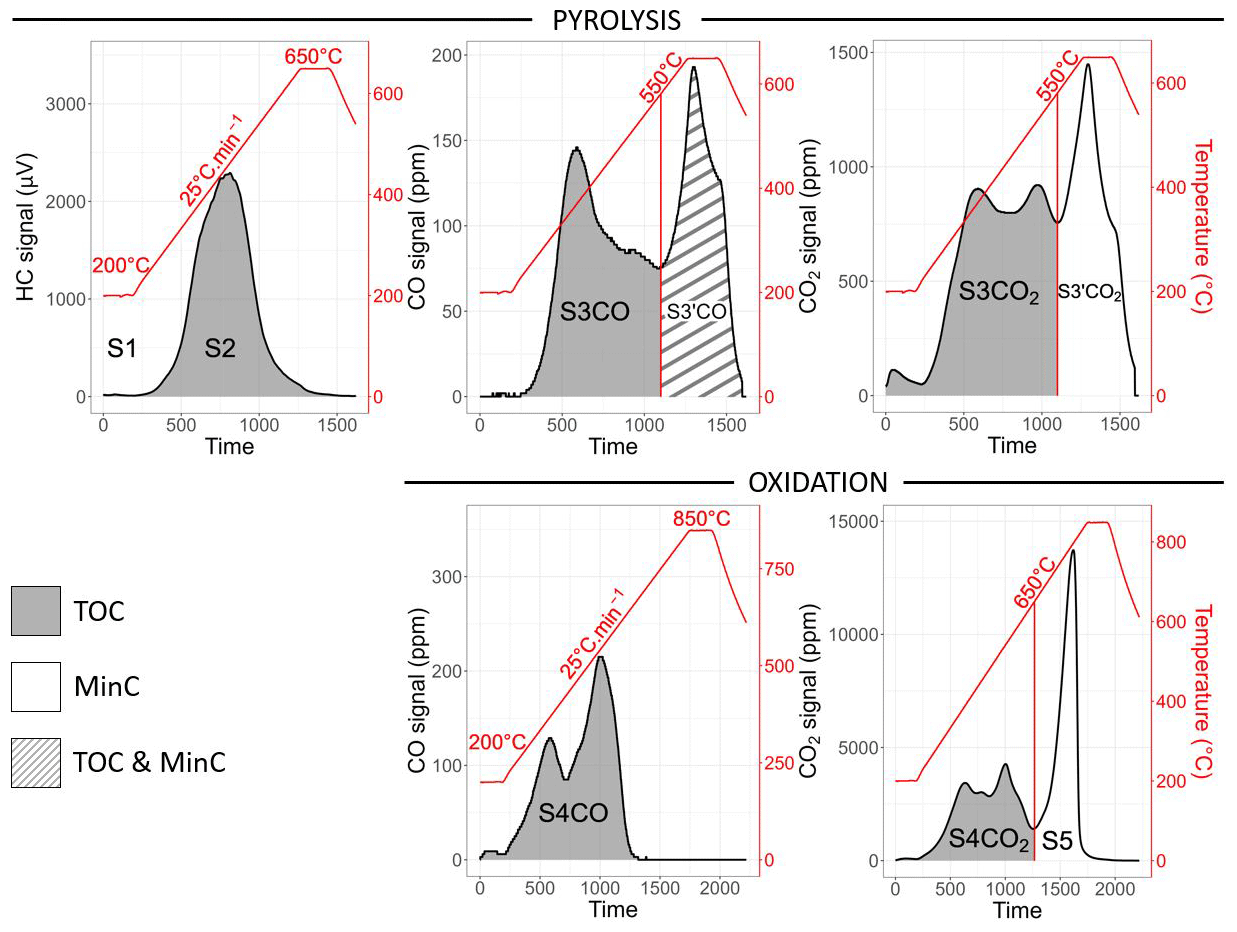
Figure 1Examples of the five thermograms and nine curves (S1, S2, S3CO, S3′CO, S3CO2, S3′CO2, S4CO, S4CO2, and S5) obtained during the Rock-Eval® analysis of a calcareous agricultural topsoil with an SOC content of 15.68 g SOC kg−1 and an SIC content of 11.61 g SIC kg−1. The grey areas correspond to the curves formed by the pyrolytic cracking and the oxidative combustion of SOC and are integrated in the TOC parameter calculation. The white areas correspond to the curves formed by the SIC thermal breakdown and are integrated in the MinC parameter calculation. The white area with grey stripes corresponds to the curve formed by the SOC pyrolytic cracking and SIC thermal breakdown and is integrated in both the TOC and MinC parameter calculations.
Table 2Temperature span for curve integration and associated conversion factor for TOC and MinC calculations.
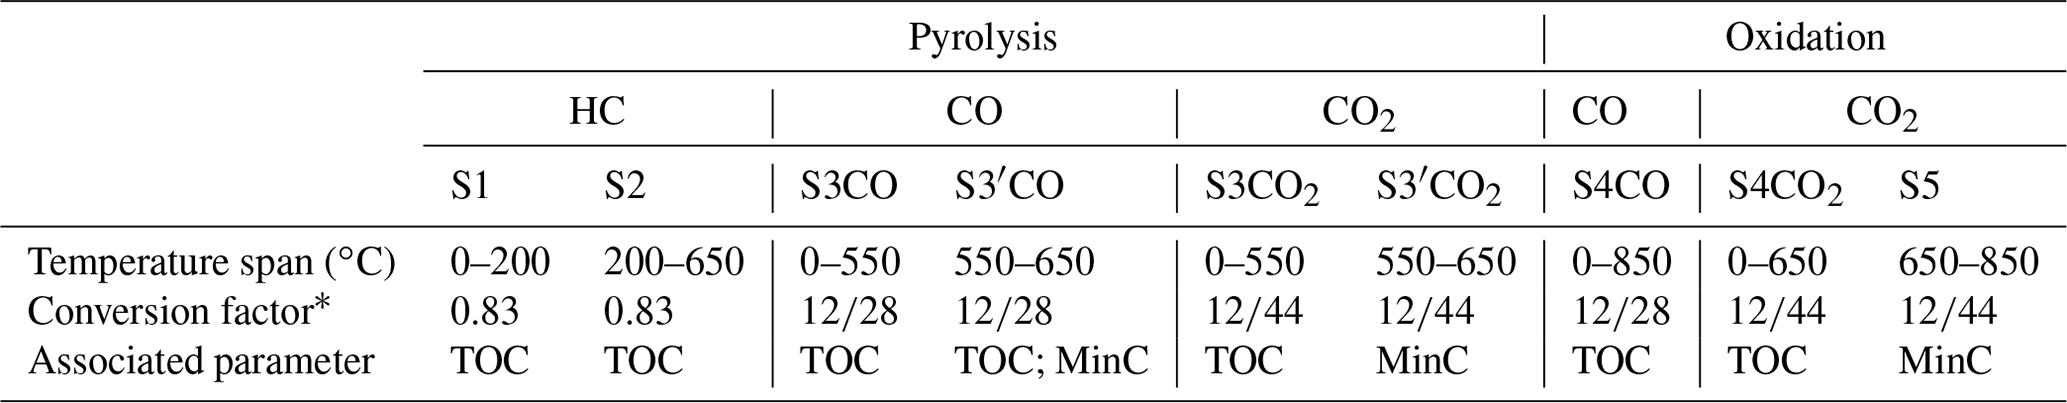
* From milligrams of HC, CO, or CO2 to milligrams of C.
The amounts of hydrocarbon compounds (HC), carbon monoxide (CO), and carbon dioxide (CO2) emitted by the sample during the heating are continuously monitored by two detectors: the flame ionisation detector (FID) measures the HC released during the pyrolysis; the infrared (IR) detector measures four signals: the CO and the CO2 released during the pyrolysis and the oxidation phases. Therefore, the RE analysis results in five thermograms plotting the effluent amount emitted by the sample as a function of time and temperature.
Calculation of the standard parameters
The five resulting thermograms are divided into nine curves, usually called “peaks”, according to temperature boundaries: S1 and S2 curves refer to the HC effluents released during pyrolysis; S3CO, S3′CO, S3CO2 (also called S3; Baudin et al., 2022), and S3′CO2 (also called S3′; Baudin et al., 2022) curves refer to the CO and CO2 released during pyrolysis; and S4CO, S4CO2, and S5 curves refer to the CO and CO2 released during oxidation (Fig. 1, Table 2). SOC pyrolytic cracking and oxidative combustion occur at lower temperatures than SIC pyrolytic and oxidative thermal breakdown. Thus, the S1, S2, S3CO, half of the S3′CO, S3CO2, S4CO, and S4CO2 curves correspond to SOC cracking and combustion, whereas the other half of the S3′CO, S3′CO2, and S5 curves correspond to SIC thermal breakdown (Fig. 1, Table 2). SIC thermal breakdown releases only CO2 (). However, half of the S3′CO curve is attributed to SIC thermal breakdown because the CO2 released by SIC thermal breakdown reacts with residual organic C to produce two molecules of CO (Boudouard's reaction: CO 2CO; Lafargue et al., 1998). These curves are integrated between their temperature boundaries to estimate the amounts of HC, CO, or CO2 released by SOC cracking and combustion and SIC thermal breakdown (Fig. 1, Table 2). Therefore, the choice of these temperature boundaries is critical to correctly quantify SOC and SIC. Behar et al. (2001) set the temperature boundaries between the S3CO and S3′CO curves and S4CO2 and S5 curves to the local minimum of the CO pyrolysis and the CO2 oxidation thermograms, respectively, sample by sample for rock studies. During soil analyses, these local minima usually occur at 550 and 650 ∘C (Figs. 1, S1, and S3). Thus, in this study, the boundaries between the S3CO and S3′CO curves and the S4CO2 and S5 curves were fixed for all the samples at 550 and 650 ∘C, respectively (Fig. 1, Table 2). Regarding the boundary between the S3CO2 and S3′CO2 curves, Lafargue et al. (1998) set the temperature at 400 ∘C for rock studies because the siderite and magnesite thermal breakdown starts at 400 ∘C. When the most common carbonate mineral is calcite, operators usually shift this boundary to the local minimum of the CO2 pyrolysis thermogram sample by sample. In this study, the thermograms did not show any of the specific curves of siderite, magnesite, or dolomite. Moreover, the thermograms obtained with the calcite sample showed that the calcite pyrolytic thermal breakdown started at 550 ∘C (Fig. S3). Thus, in this study, the boundary between the S3CO2 and S3′CO2 curves was shifted to 550 ∘C for all the samples (Fig. 1, Table 2).
The integrations of the curves are expressed in milligrams of HC, CO, or CO2 depending on the thermogram. These integrations are multiplied by the ratio of the C molar mass (12) to the CO or CO2 molar mass (28 or 44, respectively; Table 2) to convert CO and CO2 amounts in milligrams of C. HC refers to molecules made of C and hydrogen atoms exclusively (e.g. CnH2n + 2 for alkane derivatives). The HC released during RE pyrolysis contains approximately 83 % of organic C on average (Espitalié et al., 1985). Thus, the HC amount is multiplied by 0.83 to be converted to milligrams of C. Once converted, the curve integrations corresponding to SOC cracking and combustion and SIC thermal breakdown are summed to calculate the standard TOC and MinC parameters, respectively, as described in Eqs. (1) and (2) (Disnar et al., 2003).
The calibration of all the RE devices and the quality of the RE analyses are routinely checked by the operator with the so-called 160 000 standard. The 160 000 standard is a clayey rock with an organic C content of 32.8 g OC kg−1 and an inorganic C content of 32.6 g IC kg−1. Two 160 000 standards are analysed at the beginning and the end of each sample set, as well as every 10 samples. The values obtained for each curve, the TOC and MinC parameters, and a few other indicators are compared with the reference values of the 160 000 standard.
Corrections of the standard parameters
To date, Disnar et al. (2003) were the first to propose corrections for better SOC quantification in soil samples. On a wide panel of noncalcareous soils, Disnar et al. (2003) estimated that the TOC parameter underestimates the SOC content appraised by EA by 9.2 %. Moreover, for soils with organic matter enriched in poorly degraded organic compounds and litter debris, they suggested adding a supplementary correction of 6.8 % to the previously corrected TOC parameter.
Sebag et al. (2022a, b) demonstrated that in calcareous and noncalcareous soils, a part of the MinC parameter corresponds to thermoresistant organic matter (Fig. S1) and thus must be subtracted from the MinC parameter and added to the TOC parameter for calcareous soils. This correction, named SOTHIS for soil characterisation by thermal analysis, has been statistically evaluated between 4 % and 12 % of the TOC parameter and depends on the content of thermoresistant organic matter in the soil samples (Sebag et al., 2022a, b). For noncalcareous soils, the signals associated with the MinC parameter (Fig. S1) are then integrated into the correction of the TOC parameter, and the corrected MinC parameter is set to 0.
In this study, it is assumed that the first correction proposed by Disnar et al. (2003), i.e. the missing 9.2 % of the TOC parameter, corresponds to thermoresistant organic matter included in the MinC parameter as proposed by the SOTHIS correction. Consequently, for the calcareous soils of this study, 9.2 % of the TOC parameter was systematically added to the TOC and subtracted from the MinC (Fig. 2), as noted by the SOTHIS correction. For noncalcareous soils, the MinC was added to the TOC parameter and set to 0. As the studied soils were collected in agricultural topsoils (soil depth < 15 cm), they also contain fresh organic matter. Thus, in this study, the TOC parameter corrected using SOTHIS was also corrected with the second correction of Disnar et al. (2003), i.e. by adding 6.8 % of the corrected TOC (Fig. 2). The corrected TOC and corrected MinC parameters were finally calculated as described by Eqs. (3) and (4) for the calcareous soils.
For the noncalcareous soils, the corrected TOC and MinC parameters were calculated as described by Eqs. (5) and (6).
The results of the corrected parameters were systematically compared with the uncorrected standard parameters. Corrections were applied to the results obtained from the soil samples. Because the geostandard SR1 and the calcite samples were rock and mineral samples, respectively, the parameters obtained with these samples were not corrected.
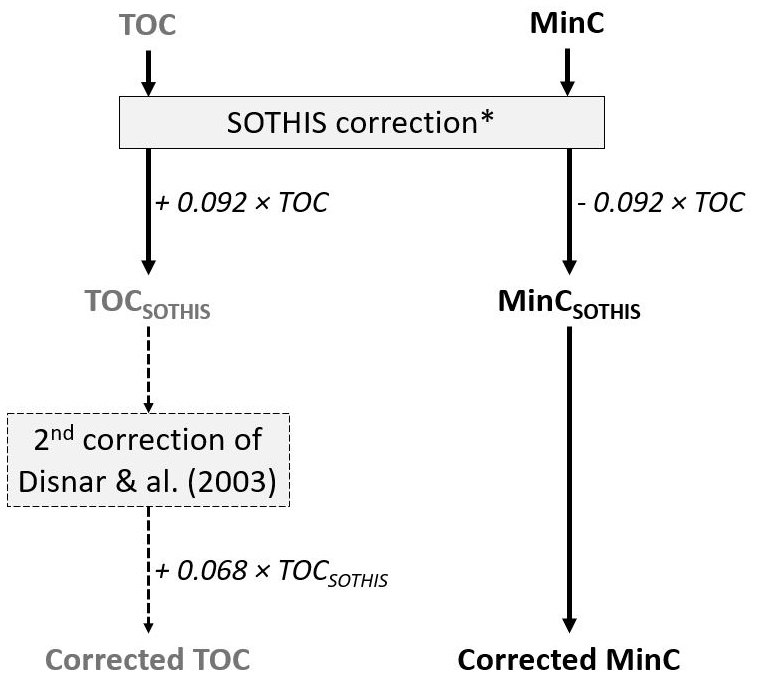
Figure 2Corrections of the TOC and MinC parameters for calcareous soils. * The first correction proposed by Disnar et al. (2003) is assumed to correspond to the SOTHIS correction with a 9.2 % coefficient.
2.3 Experimental design
Two soil panels designed from the 30 soils and the calcite sample were studied with different RE experimental conditions (Fig. 3).
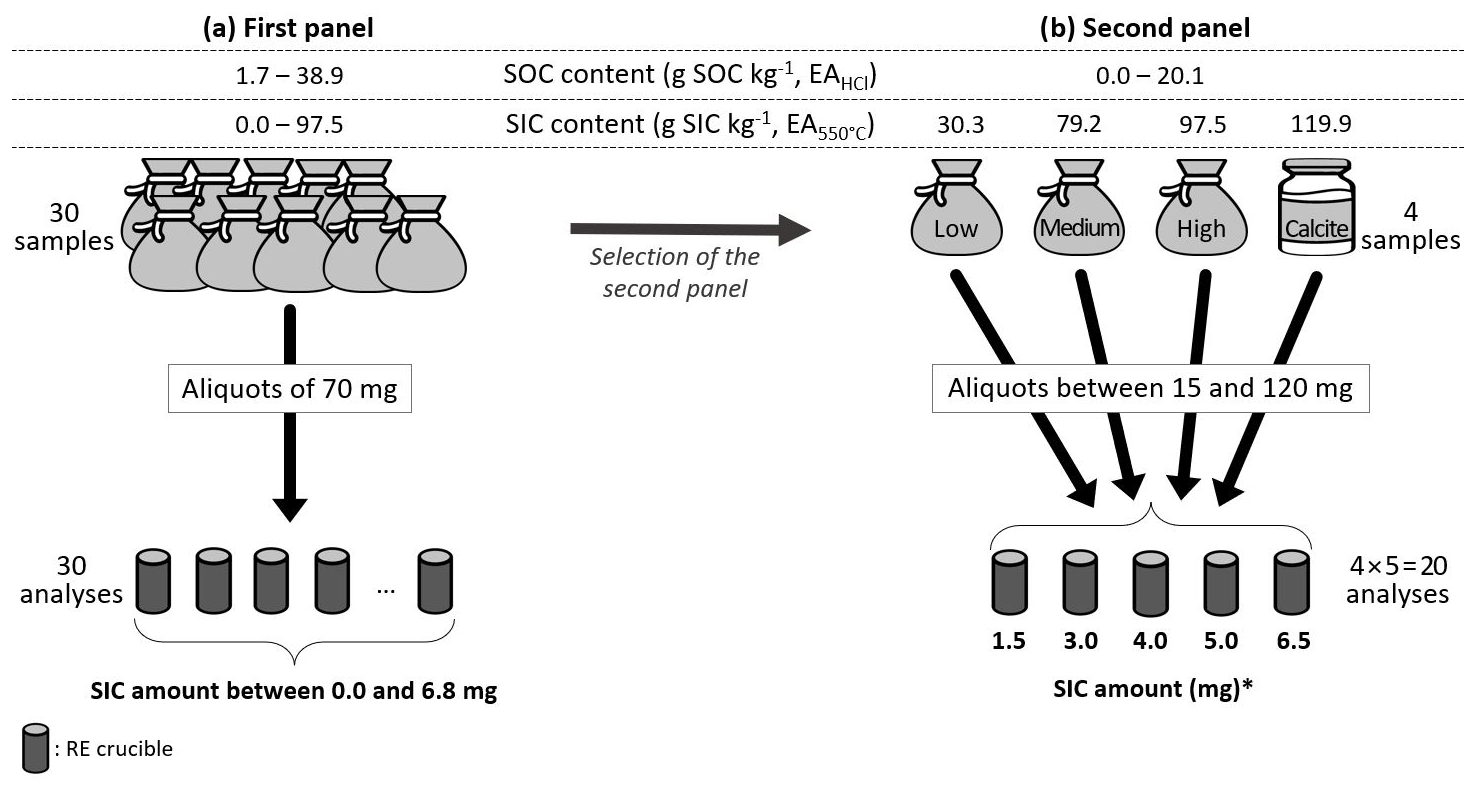
Figure 3Settings of the two soil panels and their associated RE analyses. (a) The first soil panel was composed of 30 soils. For each soil, an RE analysis was carried out on one aliquot of 70 mg. (b) The second soil panel was composed of four samples: three soils chosen among the 30 soils with low, medium, and high SIC contents and the calcite sample. For each sample, five RE analyses were carried out on five aliquots between 15 and 120 mg, i.e. on five chosen SIC amounts in the five RE crucibles (from 1.5 to 6.5 mg of SIC). * For the sample with the lower SIC content, the five chosen SIC amounts were 1.5, 2.5, 3.0, 3.5, and 4.0 mg of SIC.
In the first soil panel, which included the 30 soils, the SOC content ranged from 1.7 to 38.9 g SOC kg−1 (EAHCl), and the SIC content ranged from 0.0 to 97.5 g SIC kg−1 (EA; Fig. 3, Table 1). The RE analyses were carried out on one aliquot of 70 ± 1 mg for each sample. Thus, the SIC amounts in each RE crucible were between 0.0 and 6.8 mg of SIC (Fig. 3). For each sample of the first panel, the SOC and SIC contents were measured one time by EAHCl and EA, respectively, and one time by RE.
Regarding the second panel, three soil samples were selected from the 30 soils based on their SIC content. The calcite sample was also added to this second panel. The SOC content of the three soil samples ranged from 0.0 to 20.1 g SOC kg−1 (EAHCl), and their SIC content ranged from low (30.3 g SIC kg−1, EA) to high (97.5 g SIC kg−1, EA). The TC content of the calcite sample, assumed to be only SIC, was 120.87 ± 0.29 g TC kg−1 (EA; Fig. 3). The RE analyses were carried out on five aliquots between 15 and 120 mg for each sample to analyse five chosen SIC amounts. These five SIC amounts corresponded to different sample charges in the RE crucibles and were 1.5, 3.0, 4.0, 5.0, and 6.5 mg of SIC for the medium- (79.2 g SIC kg−1) and high-SIC-content soils (97.5 g SIC kg−1) and the calcite sample (Fig. 3). The five RE crucibles of the medium-SIC-content soil and the calcite sample were replicated three times. For the low-SIC-content soil (30.3 g SIC kg−1), the five SIC amounts in the RE crucibles were 1.5, 2.5, 3.0, 3.5, and 4.0 mg of SIC because the maximal amount of matter in the RE crucibles is 120 mg. To compare the RE results, sand was added and mixed with the samples to complete the initial loading in each RE crucible to 120 mg. The calcite sample and the medium-SIC-content soil (79.2 g SIC kg−1) were also analysed with standard cycles of analysis with an extended final oxidation isotherm from 3 to 5 or 7 min. For each sample of the second panel, the SOC and SIC contents were measured one time by EAHCl and EA, respectively, and five times by RE but on different sample amounts in the RE crucible each time.
To evaluate the precision and accuracy of the RE method, the TC, SOC, and SIC contents of the three geostandard materials and the calcite sample were measured by EA and RE on four aliquots (Table S1). These samples were analysed with an RE analysis cycle with an extended final oxidation isotherm of 7 min.
2.4 Data analysis
The uncorrected and corrected TOC parameters were compared to the EAHCl values. The uncorrected and corrected MinC parameters were compared to the EA values. The corrected MinC parameter was also compared to the SIC content estimated as the difference between the TC and the SOC contents estimated by EA (noted EATC − SOC).
For the first panel, the normality of the distribution of the parameters (uncorrected and corrected TOC and MinC, EAHCl and EA) was tested with the Shapiro–Wilk test (H0: the distribution is normal, shapiro.test function of the statistical R software, R Core Team, 2023) with a confidence interval of 95 %. Then, the significance of the differences between the RE parameter and the EA value (paired variables) was tested with the Student test (H0: μRE = μEA, t-test function of the statistical R software, R Core Team, 2023) for the parametric variables or the Wilcoxon test (H0: μRE = μEA, wilcox.test function of the statistical R software, R Core Team, 2023) for the nonparametric variables with a confidence interval of 95 %.
Least squares regressions between the SOC content estimations by EAHCl vs. uncorrected TOC or corrected TOC and between SIC content estimations by EA or EATC − SOC vs. uncorrected MinC or corrected MinC were tested with the lm function (fitting linear models) of the statistical R software (R Core Team, 2023) on nonreplicated values. This function tests the overall significance of the regression with the Fisher test (H0: the regression slope and the intercept are not significantly different from zero, and the relationship between the two variables is not significant): if the p value (P) is < 0.01 or < 0.05, the regression is significant with a confidence interval of 99 % or 95 %, respectively. If the intercept was not significantly different from 0 with a confidence interval of 99 %, the regressions were performed without intercepts. The goodness of fit of the regression is assessed by the coefficient of determination R2 given by the lm function: the closer R2 is to 1, the higher the proportion of variance explained by the regression. The significance of the difference in the regression slope from 1 was tested with the Student test (H0: μSLOPE = 1) with a confidence interval of 95 %.
The grey area in the graphs corresponds to the analytical error in the two methods (EA and RE). To build this area, a relative error of 5 % was applied to the x axis (EA) according to the norm ISO (1995b). For the TOC and MinC parameters, relative errors of 2 % and 1.7 %, respectively, were applied to the y axis (RE). These relative error values come from an IFPEN study of internal repeatability conducted on five replicates of five soils (data not shown). These relative errors are consistent with Behar et al. (2001) measurements of rock and kerogen samples.
3.1 Comparison between the estimations of the SOC and SIC contents of the 30 soils (first panel) measured by RE and EA
The estimations of the SOC contents by RE and EAHCl in the first panel are related (R2 = 0.996, P<0.001; Fig. 4). The SOC contents estimated by the uncorrected TOC parameter significantly differ from those estimated by EAHCl (Wilcoxon test: P <0.05), while the SOC contents estimated by the corrected TOC parameter do not significantly differ from those estimated by EAHCl (Wilcoxon test: P=0.18). Moreover, the slope of the regression line between the SOC contents estimated by EAHCl and by the uncorrected TOC parameter is significantly different from 1 (0.84 ± 0.01; Fig. 4; Student test: P<0.05), while the slope of the corrected TOC vs. EAHCl regression line does not significantly differ from 1 (0.98 ± 0.01; Fig. 4; Student test: P=0.17). Thus, for these 30 agricultural topsoils, the RE estimations of the SOC content by the corrected TOC parameter, either with Eq. (3) for the calcareous soil samples or with Eq. (5) for the noncalcareous soils, are similar to the SOC content estimations by EAHCl.
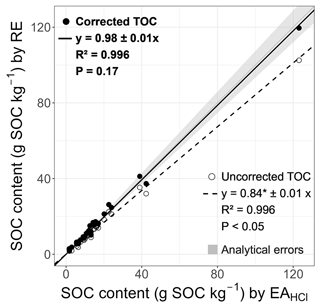
Figure 4Plot of the SOC content estimated by the uncorrected and corrected TOC parameters of the RE analysis on one aliquot vs. the SOC content estimated by EAHCl on one aliquot for the 30 soils of the first panel. The corrected TOC vs. EAHCl (bold line) and uncorrected TOC vs. EAHCl (dashed line) linear regressions are provided with their coefficient of determination (R2). For both regressions, the slopes were significantly different from 0 (p value (P) < 0.001) but not the intercepts (P>0.01). The p values presented on the graph indicate the significance of the difference between the slope and 1. * The slope of the regression was significantly different from 1 (P<0.05). The grey area, centred around the grey line y=x, represents the analytical error in the two methods.
For the four soil samples considered to be noncalcareous soils, the SIC contents assessed by EA averaged 0.5 ± 0.8 g SIC kg−1, and the SIC contents assessed by the uncorrected MinC parameter averaged 1.07 ± 0.26 g SIC kg−1, which is consistent with very low RE signals specific to SIC observed in these samples. Thus, we consider a soil sample to be noncalcareous when the measured SIC content is lower than 2.0 g SIC kg−1.
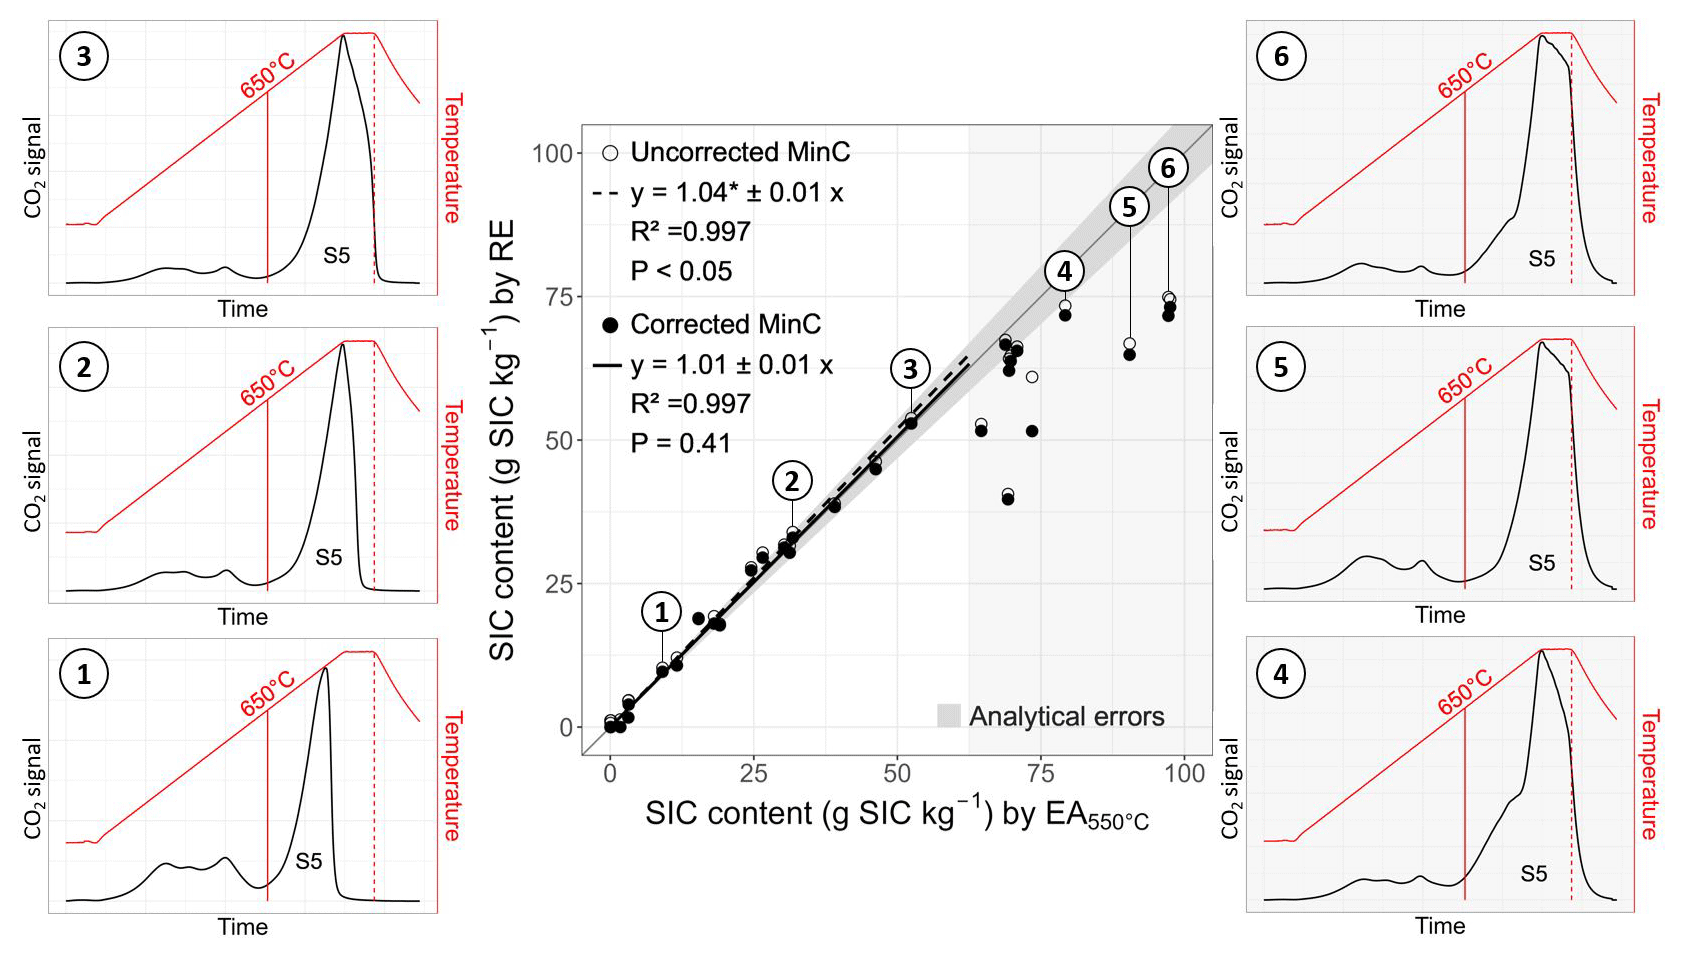
Figure 5Plot of the SIC content estimated by the uncorrected and corrected MinC parameters on one aliquot vs. the SIC content estimated by EA on one aliquot for the 30 soils of the first panel. The grey area refers to the SIC contents estimated by EA to be higher than 62.50 g SIC kg−1 (n=11). The corrected MinC vs. EA (bold line) and MinC vs. EA (bold dashed line) linear regressions correspond only to the SIC contents < 62.50 g SIC kg−1. For both regressions, the slopes were significantly different from 0 (P<0.001) but not the intercepts (P>0.01). The p values presented on the graph indicate the significance of the difference between the slope and 1. * The slope of the regression was significantly different from 1 (P<0.05). The oxidation thermograms presented on both sides of the plot are examples of the S4CO2 and S5 curves obtained for six soils of the first panel: three with SIC contents < 62.50 g SIC kg−1 (no. 1–3) and three with SIC contents > 62.50 g SIC kg−1 (no. 4–6). The grey area, centred around the grey line y=x, represents the analytical error in the two methods.
Surprisingly, for the whole first panel, the SIC contents estimated by the uncorrected MinC parameter were not significantly different from those estimated by EA (Wilcoxon test: n=30, P=0.32), while the SIC contents estimated by the corrected MinC parameter significantly differed from those estimated by EA (Wilcoxon test: n=30, P<0.05).
However, the distribution of the points around the y=x line differs according to the SIC content. For SIC contents lower than a value of approximately 62.50 g SIC kg−1, the data plot mostly above the line y=x with a sparse dispersion. For SIC contents higher than a value of approximately 62.50 g SIC kg−1, the data plot mostly below the line y=x with a higher dispersion (Fig. 5). For SIC contents < 62.50 g SIC kg−1, the estimations by the corrected MinC parameter do not significantly differ from those by EA (Student test: n=19, P=0.51), while the SIC contents estimated by the uncorrected MinC parameter significantly differ from those by EA (Student test: n=19, P<0.05). Moreover, for SIC contents < 62.50 g SIC kg−1, the slope of the corrected MinC vs. EA regression line is not significantly different from 1 (1.01 ± 0.01; Fig. 5; Student test: P=0.41), while the slope of the uncorrected MinC vs. EA regression line is significantly different from 1 (1.04 ± 0.01; Fig. 5; Student test: P<0.05). Since the correction decreases the value of the MinC parameter (Fig. 2), correcting the MinC parameter reduces its overestimation when SIC contents < 62.50 g SIC kg−1 but increases its underestimation when SIC contents > 62.50 g SIC kg−1. Thus, for these 30 agricultural topsoils, the correction applied to the MinC parameter (Eq. 4 for the calcareous soils and Eq. 6 for noncalcareous soils) improved its estimation only when the SIC contents were lower than a value of approximately 62.50 g SIC kg−1.
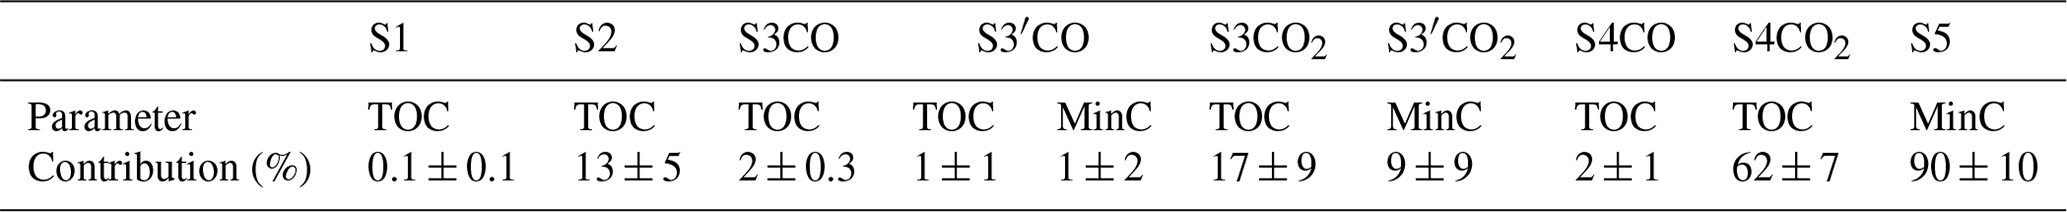
The oxidative thermal breakdown of SIC occurs at temperatures > 650 ∘C and forms the S5 curve (Fig. 5), whose integration represents the main contributor to the MinC parameter (approximately 90 %; Table 3). The S5 curves of the samples with SIC contents > 62.50 g SIC kg−1 drop sharply at the end of the final oxidation isotherm, unlike the S5 curves of the samples with SIC contents < 62.50 g SIC kg−1 (Fig. 5). This sharp drop is likely related to a stop in the thermal breakdown of SIC due to the temperature decrease at the end of the final oxidation isotherm. Thus, the underestimation of SIC contents > 62.50 g SIC kg−1 by the MinC parameter is probably caused by an incomplete thermal breakdown of a large amount of SIC in the RE crucibles, estimated above 4.4 mg of SIC for 70 ± 1 mg of sample in the RE crucible.
Table 3Average contribution (%, mean ± standard deviation) of each curve integration to the TOC and MinC parameters for the 26 calcareous soils of the first panel.
3.2 Effect of the SIC amount in the RE crucible on the SIC content estimated by RE on the four samples of the second panel
Analysis of the second panel with increasing SIC amounts in the RE crucibles showed that the MinC and the corrected MinC parameters properly estimated SIC amounts < 4 mg (Fig. 6). For SIC amounts in the RE crucible > 4 mg, the higher the SIC amount was, the more the MinC parameter underestimated it (Fig. 6). These results are consistent with the assumption that the underestimation of high SIC contents by the MinC parameter is due to an incomplete thermal breakdown of the SIC amount in the RE crucible.
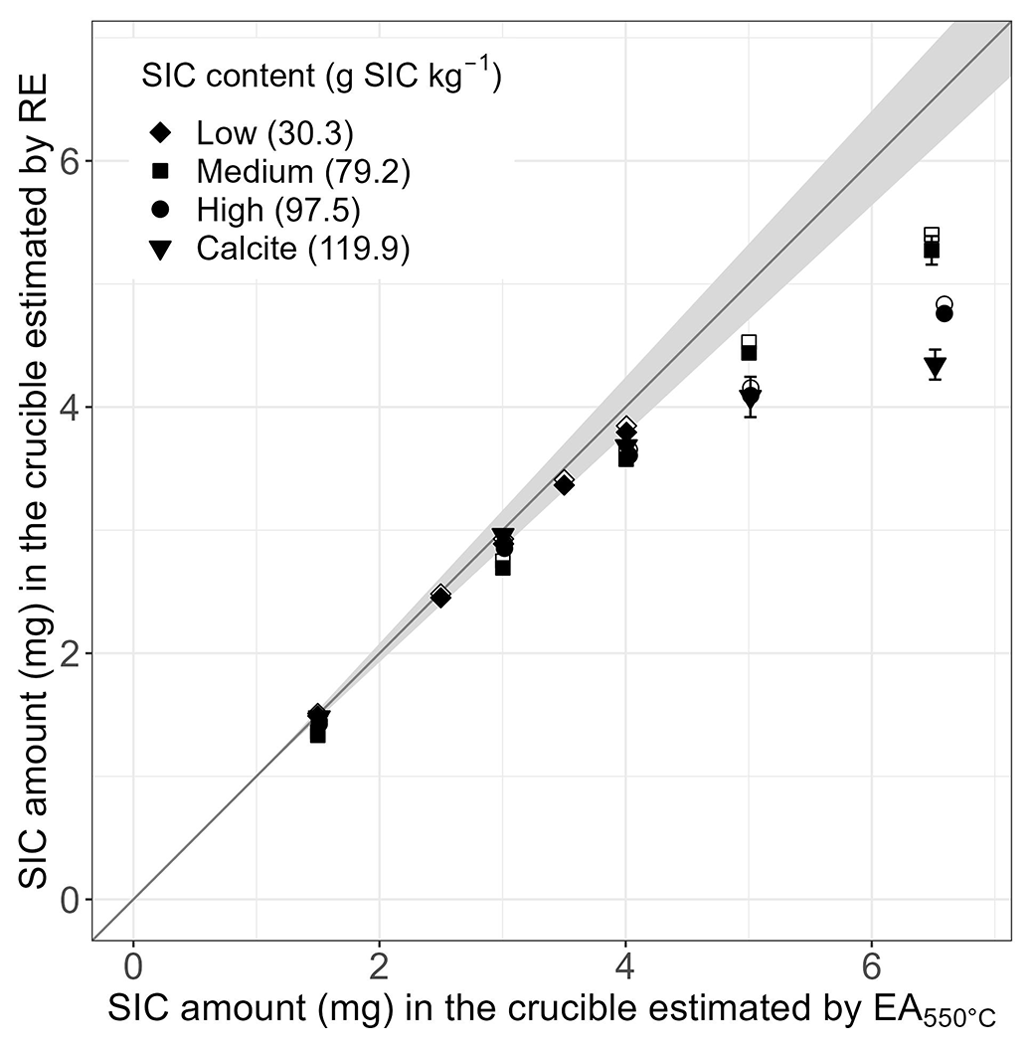
Figure 6Plot of the SIC amount in the crucible estimated by the uncorrected (hollow point) and the corrected (full point) MinC parameter on one aliquot for the low- and high-SIC-content soils and on the five aliquots for the medium SIC content and the calcite samples vs. the SIC amount in the crucible estimated by EA on one aliquot for the four samples of the second panel. The grey area, centred around the grey line y=x, represents the analytical error in the two methods.
In addition to the SIC amount (mg) in the crucible, the SIC content (g SIC kg−1) of the sample also seems to affect the SIC thermal breakdown during the RE analysis. The higher the SIC content (g SIC kg−1) in the sample, the more the MinC parameter underestimates the SIC amount (mg) in the RE crucible (Fig. 6). This result can be explained by the SIC content and/or by different SIC forms within the samples. Pillot et al. (2014) assumed that the mineral size has an effect on its thermal destabilisation, especially for calcite: the smaller the calcite mineral is, the easier it is to destabilise it, explaining the faster breakdown of chalk compared to marble. Thus, the quality of SIC seems to affect its thermal breakdown. The higher probability of containing larger SIC crystals that are hard to decompose in soil with a high SIC content or in the calcite sample than in soil with a medium SIC content likely explains the observed results.
The RE standard cycle analysis cannot accurately estimate the SIC content when the SIC amount in the crucible is higher than 4 mg. This is especially valuable for soils with a high SIC content. To solve this problem, two solutions are proposed: (i) when the SIC content is known, the standard cycle of analysis can be used by limiting the SIC amount in the crucible to 4 mg; (ii) when the SIC content is unknown, the RE standard cycle of analysis can be customised by extending the final oxidation isotherm.
3.3 Adaptation of the RE standard cycle of analysis
To provide enough time for SIC thermal breakdown during the oxidation phase, two options are possible: extending the time or raising the maximal temperature during the oxidation phase. Because raising the maximal temperature of oxidation to 850 ∘C requires an RE7 device, and most laboratories still use RE6 devices, we preferred to test the extension of the oxidation time to 7 min.
The SIC amounts in the crucibles with calcite were properly estimated by the MinC parameter with a final oxidation isotherm of 7 min (Fig. 7). Unlike the results with calcite, a systematic error was observed for the estimation of the SIC amount of the soil with a medium SIC content, even with a final oxidation isotherm of 7 min (Fig. 7). This error seems to be proportional to the quantity of the sample in the crucible, as it increases with the SIC amount in the crucible (Fig. 7). Thus, it is suggested that this error can propagate to the five SIC amounts calculated from the single EA measurement of the soil with a medium SIC content. Heating the soil sample at 550 ∘C may have resulted in an incomplete combustion of thermoresistant organic matter, leading to an overestimation of its SIC content by EA (Nayak et al., 2019; Chatterjee et al., 2009). Thus, this error can be related to the pretreatment performed on the soil before the SIC content estimation by EA rather than from the RE analyses. Indeed, the SIC amount estimated by EA as the difference between the TC amount and the SOC amount after carbonate removal (EATC − SOC; Fig. 8) should be less overestimated than the SIC amount estimated by EA after heating at 550 ∘C (EA; Fig. 8).
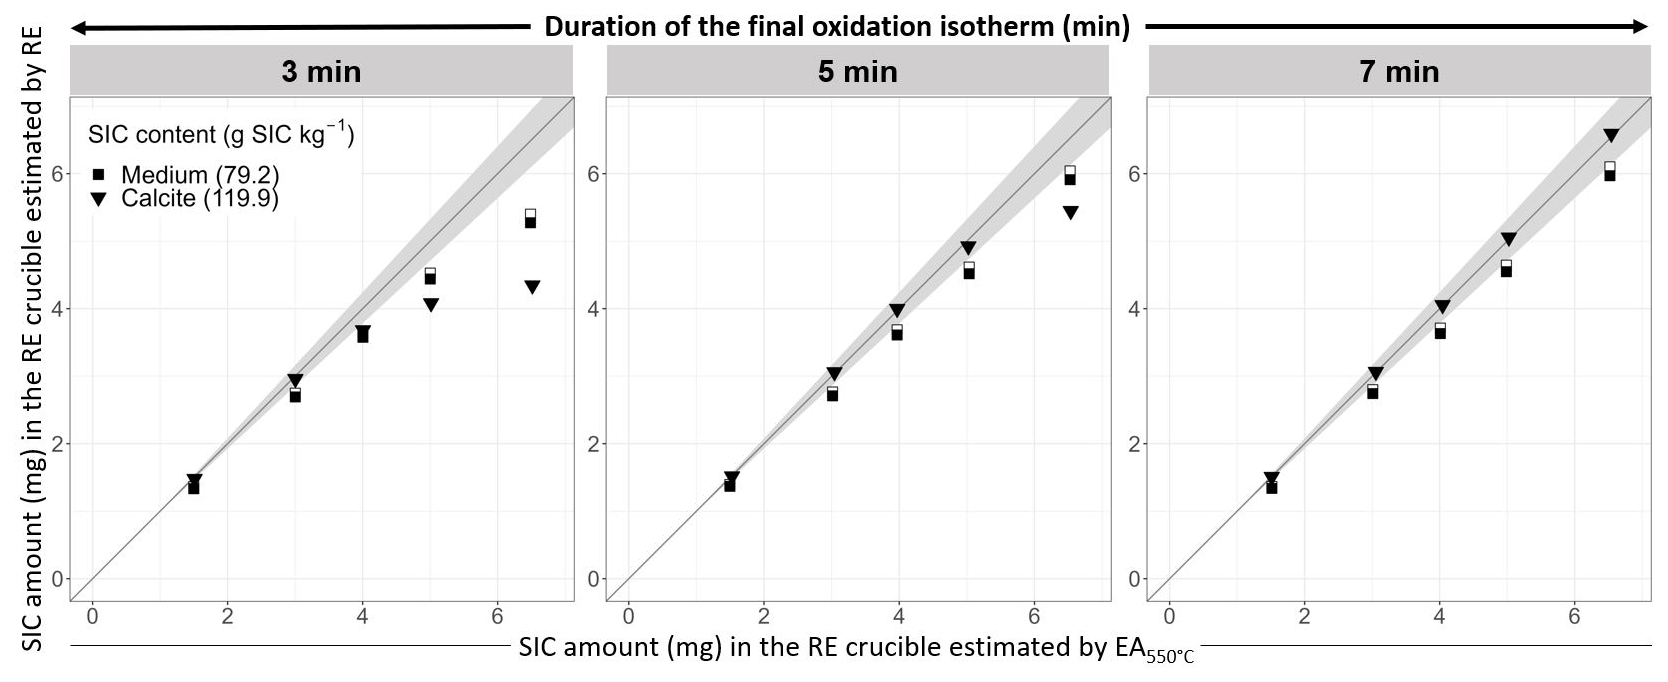
Figure 7Plots of the SIC amount in the crucible estimated by the uncorrected (hollow point) and the corrected (full point) MinC parameter vs. the SIC amount in the crucible estimated by EA on one aliquot for the soil with a medium SIC content and the calcite sample. Three cycles with different durations of the final oxidation isotherm (3, 5, and 7 min) were applied. The grey area, centred around the grey line y=x, represents the analytical error in the two methods.
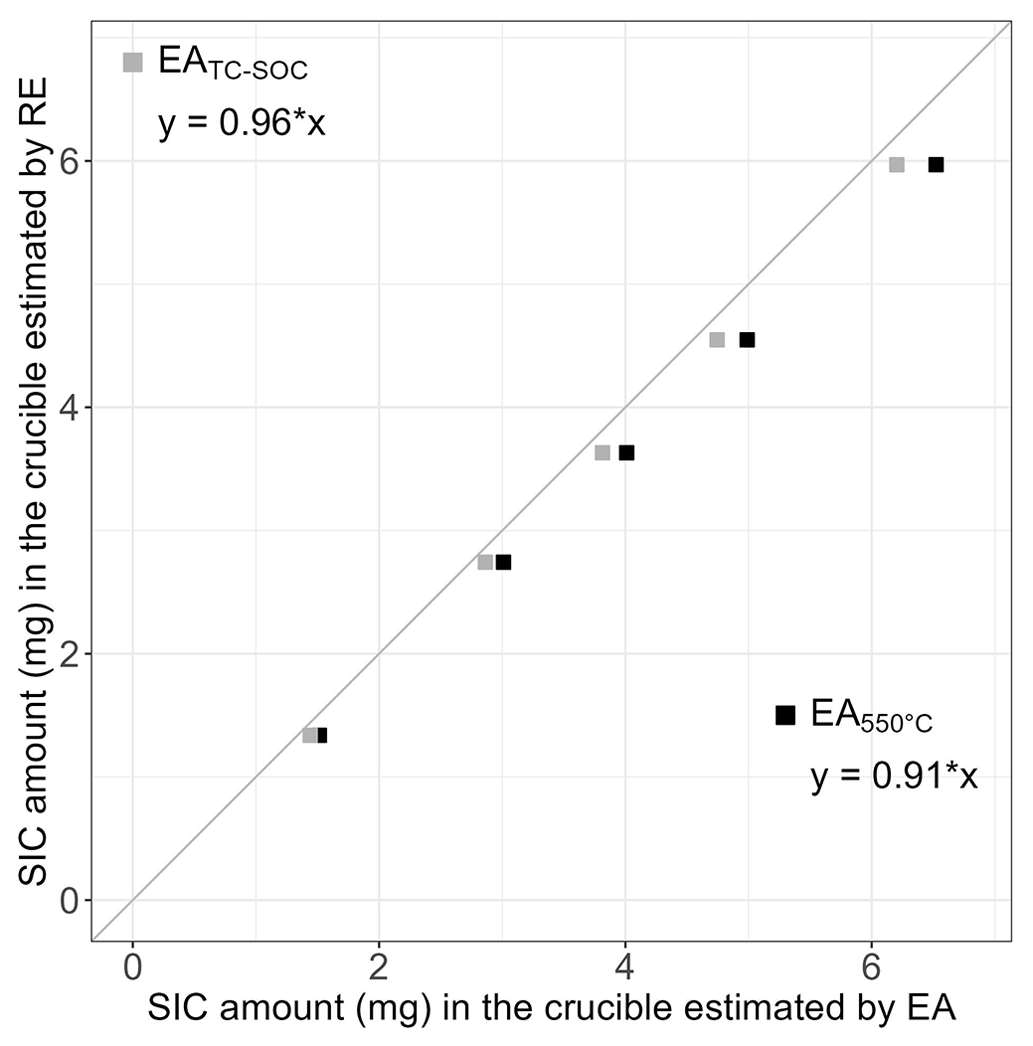
Figure 8Plot of the SIC amount in the crucible estimated by the corrected MinC parameter vs. the SIC amount in the crucible estimated by EA (black square) and by EATC − SOC, i.e. the difference between the TC and the SOC (grey square) on one aliquot for the soil with a medium SIC content.
The slope of the regression line between the SIC amount in the crucible estimated by RE and by EA is closer to 1 with the EATC − SOC (0.96) value than with the EA value (0.91; Fig. 8). This result confirms that the systematic error observed in Fig. 7 for the soil with a medium SIC content is probably due to incomplete combustion of the organic matter during the heating pretreatment before the SIC content estimation by EA. These results have been observed for only one calcareous soil and, thus, cannot be generalised for all calcareous soils.
The results obtained for the four EA and RE (with a 7 min final oxidation isotherm) analyses on the three geostandard materials and the calcite samples are presented in Table S1. For the three geostandard materials, the relative errors for the TOC, MinC, and TOC + MinC parameters were between 0.13 % and 5.88 %, 0.83 % and 2.44 %, and 0.35 % and 1.92 %, respectively. These relative errors are equivalent to those of EA: between 0.22 % and 5.02 % for the organic C content, between 1.57 % and 23.80 % for the inorganic C content, and between 1.12 % and 2.44 % for the total C content. These relative errors in EA are close to the 5 % given by the norm (ISO, 1995b) for TC. On these samples, the precision of the RE method is comparable or better for inorganic content than the precision of the EA method. The estimations of the total C content by EA and RE were close to the informative values given for the three geostandard materials and the theoretical stoichiometric value of the calcite sample. Thus, the RE method gives an accurate estimation of total C content and similar values and precision for SOC and SIC contents to EAHCl and EA, respectively, without any soil sample pretreatment.
The RE thermal analysis is a promising tool to precisely and accurately measure both SOC and SIC contents with a single analysis on a single calcareous soil aliquot. To accurately estimate the SOC and SIC contents with the RE, the standard TOC and MinC parameters must be statistically corrected, and the RE standard cycle needs to be adjusted. The RE standard cycle of analysis properly estimates SOC contents in calcareous and noncalcareous soils once the TOC parameter is corrected. However, the standard cycle of analysis cannot achieve a complete thermal breakdown of SIC amounts in the RE crucible > 4 mg. This boundary leads to an underestimation of high SIC contents by the MinC parameter even after correcting it. The final oxidation isotherm must be extended to at least 7 min to complete the thermal breakdown of SIC before the end of the analysis.
These results were obtained for 26 calcareous and 4 noncalcareous agricultural topsoils. The 26 calcareous agricultural topsoils contained calcite as the main carbonate mineral. Thus, these results need to be repeated with other calcareous soils and for other carbonate mineral types with different thermal breakdown behaviours, such as siderite, magnesite, and dolomite. In this study, the RE method was compared with the pretreated EA values to compare two methods based on the measure of the gases emitted by sample oxidation (EA) or sample pyrolysis and oxidation (RE). Comparison with other C quantification methods could be interesting to perform, such as MinC parameter vs. calcimetry or TOC parameter vs. loss-on-ignition method. The TOC and MinC parameters still need to be statistically corrected (Disnar et al., 2003, and SOTHIS corrections; Fig. 2) even with the adaptation of the oxidation phase. To be independent of statistical corrections, which could depend on the SOC and SIC forms in the soil sample, further studies on a large panel of soils should focus on the distinction between the signals from the pyrolytic cracking and oxidative combustion of SOC and the signals from the SIC pyrolytic and oxidative thermal breakdown. These methodological adjustments would improve organic and inorganic C quantification in soils and surficial deposits and contribute to a better understanding of C content changes in the Earth's critical zone.
The dataset and the R script used for this article can be accessed upon request to Joséphine Hazera.
The supplement related to this article is available online at: https://doi.org/10.5194/bg-20-5229-2023-supplement.
JH, DS, TC, and IK designed the experiment. JH and HR performed the measurements. JH, DS, IK, EV, and HR analysed the data. JH wrote the manuscript. DS, IK, TC, and EV reviewed and edited the manuscript.
The contact author has declared that none of the authors has any competing interests.
Publisher’s note: Copernicus Publications remains neutral with regard to jurisdictional claims made in the text, published maps, institutional affiliations, or any other geographical representation in this paper. While Copernicus Publications makes every effort to include appropriate place names, the final responsibility lies with the authors.
The authors thank Louis Rouyer, who suggested comparing the SIC and the SICTC − SOC values to assess the preheating effect during a discussion at the Congress FROG V (Rennes, France, 2022). The authors thank Eric Kohler and Nawal Dkhissi for performing the XRD analysis of the calcite sample used in this study. The authors thank Nadhem Brahim, Patrice Coll, Edith LeCadre, Michel Brossard, and Lydie Lardy for soil collection and soil classification in Tunisia and France. The authors thank the two anonymous reviewers and Yakov Kuzyakov for their constructive comments for the improvement of this paper.
Rock-Eval® is a trademark registered by IFP Energies Nouvelles.
This research has been supported by the SIC-SOC-DYN “Organic and inorganic carbon dynamic in calcareous soils” project of the first external call “Towards Healthy, Resilient and Sustainable Agricultural Soils” within the EJP SOIL programme (2022–2025), Horizon 2020 (grant no. 862695).
This paper was edited by Sara Vicca and reviewed by two anonymous referees.
Apesteguia, M., Plante, A. F., and Virto, I.: Methods assessment for organic and inorganic carbon quantification in calcareous soils of the Mediterranean region, Geoderma Regional, 12, 39–48, https://doi.org/10.1016/j.geodrs.2017.12.001, 2018.
Batjes, N. H.: Total carbon and nitrogen in the soils of the world, Eur. J. Soil Sci., 47, 151–163, https://doi.org/10.1111/j.1365-2389.1996.tb01386.x, 1996.
Baudin, F., Ammouial, J., Barré, P., Behar, F., Benoit, Y., Bouton, N., Cécillon, L., Copard, Y., Espitalié, J., Kanari, E., Lamoureux-Var, V., Romero-Sarmiento, M.-F., and Wattripont, A.: La méthode Rock-Eval principes et applications, IFPEN, Rueil-Malmaison, 315 pp., ISBN 978-1-394-25622-8, 2022.
Baudin, F., Disnar, J.-R., Aboussou, A., and Savignac, F.: Guidelines for Rock–Eval analysis of recent marine sediments, Org. Geochem., 86, 71–80, https://doi.org/10.1016/j.orggeochem.2015.06.009, 2015.
Behar, F., Beaumont, V., and B. Penteado, H. L. de: Rock-Eval 6 Technology: Performances and Developments, Oil Gas Sci. Technol., 56, 111–134, https://doi.org/10.2516/ogst:2001013, 2001.
Bertrand, I., Delfosse, O., and Mary, B.: Carbon and nitrogen mineralization in acidic, limed and calcareous agricultural soils: Apparent and actual effects, Soil Biol. Biochem., 39, 276–288, https://doi.org/10.1016/j.soilbio.2006.07.016, 2007.
Bispo, A., Andersen, L., Angers, D. A., Bernoux, M., Brossard, M., Cécillon, L., Comans, R. N. J., Harmsen, J., Jonassen, K., Lamé, F., Lhuillery, C., Maly, S., Martin, E., Mcelnea, A. E., Sakai, H., Watabe, Y., and Eglin, T. K.: Accounting for Carbon Stocks in Soils and Measuring GHGs Emission Fluxes from Soils: Do We Have the Necessary Standards?, Front. Environ. Sci., 5, 41, https://doi.org/10.3389/fenvs.2017.00041, 2017.
Bisutti, I., Hilke, I., Schumacher, J., and Raessler, M.: A novel single-run dual temperature combustion (SRDTC) method for the determination of organic, in-organic and total carbon in soil samples, Talanta, 71, 521–528, https://doi.org/10.1016/j.talanta.2006.04.022, 2007.
Bughio, M. A., Wang, P., Meng, F., Qing, C., Kuzyakov, Y., Wang, X., and Junejo, S. A.: Neoformation of pedogenic carbonates by irrigation and fertilization and their contribution to carbon sequestration in soil, Geoderma, 262, 12–19, https://doi.org/10.1016/j.geoderma.2015.08.003, 2016.
Cailleau, G., Braissant, O., and Verrecchia, E. P.: Turning sunlight into stone: the oxalate-carbonate pathway in a tropical tree ecosystem, Biogeosciences, 8, 1755–1767, https://doi.org/10.5194/bg-8-1755-2011, 2011.
Cardinael, R., Chevallier, T., Barthès, B. G., Saby, N. P., Parent, T., Dupraz, C., Bernoux, M., and Chenu, C.: Impact of alley cropping agroforestry on stocks, forms and spatial distribution of soil organic carbon – A case study in a Mediterranean context, Geoderma, 259–260, 288–299, https://doi.org/10.1016/j.geoderma.2015.06.015, 2015.
Cardinael, R., Chevallier, T., Guenet, B., Girardin, C., Cozzi, T., Pouteau, V., and Chenu, C.: Organic carbon decomposition rates with depth and contribution of inorganic carbon to CO2 emissions under a Mediterranean agroforestry system, Eur. J. Soil Sci., 71, 909–923, https://doi.org/10.1111/ejss.12908, 2019.
Cécillon, L., Baudin, F., Chenu, C., Christensen, B. T., Franko, U., Houot, S., Kanari, E., Kätterer, T., Merbach, I., van Oort, F., Poeplau, C., Quezada, J. C., Savignac, F., Soucémarianadin, L. N., and Barré, P.: Partitioning soil organic carbon into its centennially stable and active fractions with machine-learning models based on Rock-Eval® thermal analysis (PARTYSOCv2.0 and PARTYSOCv2.0EU), Geosci. Model Dev., 14, 3879–3898, https://doi.org/10.5194/gmd-14-3879-2021, 2021.
Chatterjee, A., Lal, R., Wielopolski, L., Martin, M. Z., and Ebinger, M. H.: Evaluation of Different Soil Carbon Determination Methods, CRC Cr. Rev. Plant Sci., 28, 164–178, https://doi.org/10.1080/07352680902776556, 2009.
Chen, Y. and Barak, P.: Iron Nutrition of Plants in Calcareous Soils, Adv. Agr., 35, 217–240, https://doi.org/10.1016/S0065-2113(08)60326-0, 1982.
Chevallier, T., Cournac, L., Hamdi, S., Gallali, T., and Bernoux, M.: Temperature dependence of CO2 emissions rates and isotopic signature from a calcareous soil, J. Arid Environ., 135, 132–139, https://doi.org/10.1016/j.jaridenv.2016.08.002, 2016.
Disnar, J. R., Guillet, B., Keravis, D., Di-Giovanni, C., and Sebag, D.: Soil organic matter (SOM) characterization by Rock-Eval pyrolysis: scope and limitations, Org. Geochem., 34, 327–343, https://doi.org/10.1016/S0146-6380(02)00239-5, 2003.
Espitalié, J., Deroo, G., and Marquis, F.: La pyrolyse rock-Eval et ses applications, Oil Gas Sci. Technol., 40, 563–579, 1985.
Gao, Y., Tian, J., Pang, Y., and Liu, J.: Soil Inorganic Carbon Sequestration Following Afforestation Is Probably Induced by Pedogenic Carbonate Formation in Northwest China, Front. Plant Sci., 8, 1282, https://doi.org/10.3389/fpls.2017.01282, 2017.
Harris, D., Horwath, W. R., and van Kessel, C.: Acid fumigation of soils to remove carbonates prior to total organic carbon or CARBON-13 isotopic analysis, Soil Soc. Am. J., 65, 1853–1856, https://doi.org/10.2136/sssaj2001.1853, 2001.
ISO: Détermination de la teneur en carbonate – Méthode volumétrique, https://www.iso.org/fr/standard/18781.html (last access: 27 October 2022), 1995a.
ISO: Dosage du carbone organique et du carbone total après combustion sèche (analyse élémentaire), https://www.iso.org/obp/ui/#iso:std:iso:10694:ed-1:v1:fr (last access: 11 June 2022), 1995b.
ISO: Dosage du carbone organique par oxydation sulfochromique, https://www.iso.org/fr/standard/23140.html (last access: 27 October 2022), 1998.
IUSS Working group WRB: World Reference Base for Soil Resources 2014, update 2015: International soil classification system for naming soils and creating legends for soil maps, World Soil Resources Reports, FAO, No. 106, ISBN 978-92-5-130380-1, 2015.
Lafargue, E., Marquis, F., and Pillot, D.: Rock-Eval 6 applications in hydrocarbon exploration, production, and soil contamination studies, Oil Gas Sci. Technol., 53, 421–437, https://doi.org/10.2516/ogst:1998036, 1998.
Lever, T., Haines, P., Rouquerol, J., Charsley, E. L., van Eckeren, P., and Burlett, D. J.: ICTAC nomenclature of thermal analysis (IUPAC Recommendations 2014), Pure Appl. Chem., 86, 545–553, https://doi.org/10.1515/pac-2012-0609, 2014.
Malou, O. P., Sebag, D., Moulin, P., Chevallier, T., Badiane-Ndour, N. Y., Thiam, A., and Chapuis-Lardy, L.: The Rock-Eval® signature of soil organic carbon in arenosols of the Senegalese groundnut basin. How do agricultural practices matter?, Agr. Ecosyst. Environ., 301, 107030, https://doi.org/10.1016/j.agee.2020.107030, 2020.
Martin, J., de Grammont, P., Covington, M., and Toran, L.: A New Focus on the Neglected Carbonate Critical Zone, EOS, 102, https://doi.org/10.1029/2021EO163388, 2021.
Nayak, A. K., Rahman, M. M., Naidu, R., Dhal, B., Swain, C. K., Nayak, A. D., Tripathi, R., Shahid, M., Islam, M. R., and Pathak, H.: Current and emerging methodologies for estimating carbon sequestration in agricultural soils: A review, Sci. Total Environ., 665, 890–912, https://doi.org/10.1016/j.scitotenv.2019.02.125, 2019.
Pillot, D., Deville, E., and Prinzhofer, A.: Identification and Quantification of Carbonate Species Using Rock-Eval Pyrolysis, Oil Gas Sci. Technol., 69, 341–349, https://doi.org/10.2516/ogst/2012036, 2014.
Plante, A. F., Fernández, J. M., and Leifeld, J.: Application of thermal analysis techniques in soil science, Geoderma, 153, 1–10, https://doi.org/10.1016/j.geoderma.2009.08.016, 2009.
Plaza, C., Zaccone, C., Sawicka, K., Méndez, A. M., Tarquis, A., Gascó, G., Heuvelink, G. B. M., Schuur, E. A. G., and Maestre, F. T.: Soil resources and element stocks in drylands to face global issues, Sci. Rep., 8, 13788, https://doi.org/10.1038/s41598-018-32229-0, 2018.
R Core Team: A Language and Environment for Statistical Computing, R Foundation for Statistical Computing, R-project.org [code], https://www.R-project.org/, 2023.
Rowley, M., Grand, S., and Verrecchia, É.: Calcium-mediated stabilisation of soil organic carbon, Biogeochemistry, 137, 27–49, https://doi.org/10.1007/s10533-017-0410-1, 2018.
Saenger, A., Cécillon, L., Sebag, D., and Brun, J.-J.: Soil organic carbon quantity, chemistry and thermal stability in a mountainous landscape: A Rock–Eval pyrolysis survey, Org. Geochem., 54, 101–114, https://doi.org/10.1016/j.orggeochem.2012.10.008, 2013.
Schlacher, T. A. and Connolly, R. M.: Effects of acid treatment on carbon and nitrogen stable isotope ratios in ecological samples: a review and synthesis, Methods Ecol. Evol., 5, 541–550, https://doi.org/10.1111/2041-210X.12183, 2014.
Sebag, D., Verrecchia, E. P., Cécillon, L., Adatte, T., Albrecht, R., Aubert, M., Bureau, F., Cailleau, G., Copard, Y., Decaens, T., Disnar, J.-R., Hetényi, M., Nyilas, T., and Trombino, L.: Dynamics of soil organic matter based on new Rock-Eval indices, Geoderma, 284, 185–203, https://doi.org/10.1016/j.geoderma.2016.08.025, 2016.
Sebag, D., Lamoureux-Var, V., Kowalewski, I., Pillot, D., and Ravelojoana, H.: Procédé pour la quantification et la caractérisation du carbone dans les sols, IFP Energies Nouvelles, Patent no. FR3121224B1, 2022a.
Sebag, D., Lamoureux-Var, V., Kowalewski, I., Ravelojoana, H., and Lefrançois, N. (Eds.): Improved quantification of SOC and SIC in Rock-Eval® thermal analysis, https://doi.org/10.13140/RG.2.2.27606.52800, 2022b.
Shabtai, I., Wilhelm, R., Schweizer, S., Hoeschen, C., Buckley, D., and Lehmann, J.: Calcium promotes persistent soil organic matter by altering microbial transformation of plant litter, Nat. Commun., 14, 6609, https://doi.org/10.1038/s41467-023-42291-6, 2023.
Sharififar, A., Minasny, B., Arrouays, D., Boulonne, L., Chevallier, T., van Deventer, P., Field, D. J., Gomez, C., Jang, H.-J., Jeon, S.-H., Koch, J., McBratney, A. B., Malone, B. P., Marchant, B. P., Martin, M. P., Monger, C., Munera-Echeverri, J.-L., Padarian, J., Pfeiffer, M., Richer-de-Forges, A. C., Saby, N. P., Singh, K., Song, X.-D., Zamanian, K., Zhang, G.-L., and van Zijl, G.: Soil inorganic carbon, the other and equally important soil carbon pool: Distribution, controlling factors, and the impact of climate change, Adv. Agron., 178, 165–231, https://doi.org/10.1016/bs.agron.2022.11.005, 2023.
Soucémarianadin, L., Cécillon, L., Chenu, C., Baudin, F., Nicolas, M., Girardin, C., and Barré, P.: Is Rock-Eval 6 thermal analysis a good indicator of soil organic carbon lability? – A method-comparison study in forest soils, Soil Biol. Biochem. 117, 108–116, https://doi.org/10.1016/j.soilbio.2017.10.025, 2018.
Vicca, S., Goll, D. S., Hagens, M., Hartmann, J., Janssens, I. A., Neubeck, A., Peñuelas, J., Poblador, S., Rijnders, J., Sardans, J., Struyf, E., Swoboda, P., van Groenigen, J. W., Vienne, A., and Verbruggen, E.: Is the climate change mitigation effect of enhanced silicate weathering governed by biological processes?, Glob. Change Biol., 28, 711–726, https://doi.org/10.1111/gcb.15993, 2022.
Virto, I., de Soto, I., Antón, R., and Poch, R. M.: Management of carbonate-rich soils and trade-offs with soil inorganic carbon cycling, in: Understanding and fostering soil carbon sequestration, edited by: Rumpel, C., Burleigh Dodds Series in Agricultural Science, Burleigh Dodds Science Publishing, 707–736, https://doi.org/10.19103/AS.2022.0106.22, 2022.
Vuong, X. T., Prietzel, J., and Heitkamp, F.: Measurement of organic and inorganic carbon in dolomite-containing samples, Soil Use Manage., 32, 53–59, https://doi.org/10.1111/sum.12233, 2016.
Wattripont, A., Baudin, F., de Rafelis, M., and Deconinck, J.-F.: Specifications for carbonate content quantification in recent marine sediments using Rock-Eval pyrolysis, J. Anal. Appl. Pyrol., 140, 393–403, https://doi.org/10.1016/j.jaap.2019.04.019, 2019.
Zamanian, K. and Kuzyakov, Y.: Soil inorganic carbon: stocks, functions, losses and their consequences, in: Understanding and fostering soil carbon sequestration, edited by: Rumpel, C., Burleigh Dodds Series in Agricultural Science, Burleigh Dodds Science Publishing, 209–236, https://doi.org/10.19103/AS.2022.0106.07, 2022.
Zamanian, K., Zarebanadkouki, M., and Kuzyakov, Y.: Nitrogen fertilization raises CO2 efflux from inorganic carbon: A global assessment, Glob. Change Biol., 24, 2810–2817, https://doi.org/10.1111/gcb.14148, 2018.
Zamanian, K., Zhou, J., and Kuzyakov, Y.: Soil carbonates: The unaccounted, irrecoverable carbon source, Geoderma, 384, 114817, https://doi.org/10.1016/j.geoderma.2020.114817, 2021.