the Creative Commons Attribution 4.0 License.
the Creative Commons Attribution 4.0 License.
 | 06 Jan 2023
Improved representation of phosphorus exchange on soil mineral surfaces reduces estimates of phosphorus limitation in temperate forest ecosystems
Silvia Caldararu
Bernhard Ahrens
Thomas Wutzler
Marion Schrumpf
Julian Helfenstein
Chiara Pistocchi
Sönke Zaehle
Phosphorus (P) availability affects the response of terrestrial ecosystems to environmental and climate change (e.g., elevated CO2), yet the magnitude of this effect remains uncertain. This uncertainty arises mainly from a lack of quantitative understanding of the soil biological and geochemical P cycling processes, particularly the P exchange with soil mineral surfaces, which is often described by a Langmuir sorption isotherm.
We first conducted a literature review on P sorption experiments and terrestrial biosphere models (TBMs) using a Langmuir isotherm. We then developed a new algorithm to describe the inorganic P exchange between soil solution and soil matrix based on the double-surface Langmuir isotherm and extracted empirical equations to calculate the sorption capacity and Langmuir coefficient. We finally tested the conventional and new models of P sorption at five beech forest sites in Germany along a soil P stock gradient using the QUINCY (QUantifying Interactions between terrestrial Nutrient CYcles and the climate system) TBM.
We found that the conventional (single-surface) Langmuir isotherm approach in most TBMs largely differed from P sorption experiments regarding the sorption capacities and Langmuir coefficients, and it simulated an overly low soil P-buffering capacity. Conversely, the double-surface Langmuir isotherm approach adequately reproduced the observed patterns of soil inorganic P pools. The better representation of inorganic P cycling using the double-surface Langmuir approach also improved simulated foliar N and P concentrations as well as the patterns of gross primary production and vegetation carbon across the soil P gradient. The novel model generally reduces the estimates of P limitation compared with the conventional model, particularly at the low-P site, as the model constraint of slow inorganic P exchange on plant productivity is reduced.
- Article
(2445 KB) - Full-text XML
-
Supplement
(2216 KB) - BibTeX
- EndNote


Nutrient availability is one of the key factors affecting the productivity of terrestrial ecosystems and their future carbon (C) balance (Fernández-Martínez et al., 2014; Wieder et al., 2015). Although nitrogen (N) is the main constraint of plant biomass responses to an elevated CO2 (eCO2) concentration in many terrestrial ecosystems, phosphorus (P) availability likely constrains the biomass responses to eCO2 in major global biomes (Du et al., 2020; Elser et al., 2007; Lebauer and Treseder, 2008; Terrer et al., 2019). For instance, the tropical forests and forests grown on old soils are known to be strongly limited by P availability, and they might not be able to sequester additional C in the future as the CO2 concentration continues to increase (Hubau et al., 2020; Jiang et al., 2020). While temperate and boreal forests are generally considered to be N limited (Lebauer and Treseder, 2008), recent studies have shown that a decreasing P nutritional status is concomitant with increasing atmospheric CO2 (Penuelas et al., 2020; Jonard et al., 2015). These findings highlight the importance of representing C–P interactions in terrestrial biosphere models (TBMs) and including P cycle processes in the future global C balance predictions.
There has been a continuous effort to include P cycling processes into TBMs in the past decade (Goll et al., 2012, 2017; Sun et al., 2021; Thum et al., 2019; Yang et al., 2014; Zhu et al., 2019; Wang et al., 2010; Yu et al., 2018). Many current TBMs employ the scheme (Fig. 1a) developed by Wang et al. (2007) to describe soil geochemical processes. This model considers the soil inorganic P (Pi) as soluble Pi (Psol), labile Pi (Plab), sorbed Pi (Psorb), occluded Pi (Pocl), and primary Pi (Pprimary), with few exceptions where labile and sorbed Pi pool are grouped into one pool (Zhu et al., 2016, 2019). The exchange between soil solution and soil matrix is described with a Langmuir adsorption isotherm assuming that Psol quickly exchanges with Plab on the mineral surface. The Plab pool also slowly exchanges with Psorb at a linear rate regardless of Psol concentrations, but this relationship is parameterized very differently across TBMs (Helfenstein et al., 2020).
Many modeling studies have emphasized the significance of biological P processes (Fleischer et al., 2019; Jonard et al., 2010; Yu et al., 2018; Wang et al., 2010) and underestimated the role of geochemical P processes. In these models, organic P recycling processes are the major fluxes, whereas the geochemical P fluxes are small (Sun et al., 2021). Particularly, the effect of (ad)sorption kinetics has seldom been discussed in previous modeling studies (Fleischer et al., 2019; Yang et al., 2014), although they are known to directly and strongly regulate Psol and Plab, thereby affecting P bioavailability (Frossard et al., 2000; Shen et al., 2011).
In this paper, we first conducted an extensive literature review of important soil characteristics affecting soil phosphorus sorption kinetics and then developed a model concept to reconcile measured P stocks with model simulations. In this new model, we applied the “two-surface” modification (Holford and Mattingly, 1976; McGechan and Lewis, 2002) to the conventional single-surface Langmuir isotherm to formulate a novel algorithm for Pi exchange with mineral surfaces, namely a double-surface Langmuir isotherm. We hypothesized that both Plab and Psorb exchange with Psol in the new model (Fig. 1b), following evidence from isotopic studies (Helfenstein et al., 2020; Frossard et al., 2011). We then compared and evaluated the performance of the novel and conventional models with measured soil Pi pools as well as foliar N and P concentrations for a gradient of soil P stocks (164–904 g P m−2) and availability in a similar climate (mean annual temperature, MAT, 4.5–8 ∘C) and under similar vegetation conditions (mature German beech forests, 120–140 years). Lastly, we tested the sensitivity of the alternative Pi exchange schemes on ecosystem P and C cycling to changes in P cycling parameters, and we also tested their responses to changes in P availability (P fertilization), C availability (CO2 fertilization), and changes in both P and C availability.
2.1 Literature review on the Langmuir isotherm
The two parameters in the Langmuir isotherm, the maximum sorption capacity (Smax) and the Langmuir coefficient (Km), are statistically fitted from measured adsorption curves of batch sorption experiments (Barrow, 1978). Following the scheme of Lloyd et al. (2001), most TBMs adapted the constant-equilibrium assumption to calculate a partition coefficient, kp (Eq. 2), which is the ratio of change in the Psol concentration to the change in available P (Psol and Plab). The partition coefficient affects the rate of Psol released from the Plab pool as Psol is consumed and, thus, eventually affects the soil P supply to plants and microbes.
To better understand the characteristics of phosphate exchange between solution and the soil mineral surface, we conducted a literature review of batch phosphate sorption experiments that describe the P sorption curves using a Langmuir isotherm, and we converted the lab-fitted Langmuir parameters (Qmax, mg P per kg soil, and KL, L per mg P; see Sect. S2 in the Supplement) to the parameters used in TBMs, sorption capacity and the Langmuir coefficient (Smax and Km, g P m−2; Eq. 1). From the batch phosphate sorption experiments found in the literature, we calculated the partition coefficient (kp) following Eq. (2). Similarly, we reviewed the values of Smax and Km in modeling studies and calculated kp accordingly.
To showcase the difference in the Langmuir isotherm parameter values in TBMs and experiments as well as the differences between single- and double-surface Langmuir isotherms, we compared the exchangeable soil Pi curves of different TBMs' and batch experiments' data to the double-surface Langmuir isotherm. We also simulated desorption experiments with the single- and double-surface Langmuir isotherms to demonstrate their different responses to P removal.
2.2 The QUINCY model
QUINCY (QUantifying Interactions between terrestrial Nutrient CYcles and the climate system) is a terrestrial biosphere model of coupled C, N, and P cycles as well as energy and water processes (Thum et al., 2019). The model represents the growth of vegetation and the turnover of litter and soil organic matter at 30 min timescales, coupled with the calculation of the terrestrial energy and water budgets. Vegetation is represented by average individuals of plant functional types (here, a temperate broadleaved tree; see Sect. 2.3). Gross carbon uptake as well as leaf area and vegetation biomass and structure are directly influenced by nutrient availability through their effect on photosynthesis, tissue growth, allocation, and mortality. The model explicitly considers depth profiles (discretized into 15 layers with a default total soil column depth of 9.5 m) of soil temperature, moisture, and biogeochemical pools, representing litter and soil organic matter compartments, as well as inorganic forms of N and P. Vertical transport processes include diffusion and bioturbation. The phosphate exchange between soil solution and soil matrix is described using a conventional single-surface Langmuir isotherm, which is implemented the same way as in other TBMs. Different from other TBMs, QUINCY estimates Smax and Km using soil texture and organic matter content (Thum et al., 2019).
To test our hypothesis that both Plab and Psorb exchange with Psol, we modified the QUINCY Pi pool structure to describe the Pi exchange between solution and the soil matrix (Fig. 1b), using a double-surface Langmuir isotherm (Eq. 3) (Holford and Mattingly, 1976; McGechan and Lewis, 2002).
where
The first sorption sites are responsible for the fast exchange (Eq. 3a) between Psol and Plab and have much lower bonding strength than the second sorption sites that are responsible for the slower exchange (Eq. 3b) between Psol and Psorb. We estimated two soil sorption maxima (Smax,1 and Smax,2; Eq. 3c) and calculated two Langmuir coefficients (Km,1 and Km,2; Eqs. 3d and 3e) based on batch experiment data from the literature review, assuming both single- and double-surface isotherms can be fitted with batch experiment data. The detailed derivation is described in the Supplement (Sect. S3).
2.3 Sites and data
We performed analysis at five mature beech forest stands in Germany: Bad Brückenau (BBR), Mitterfels (MTF), Vessertal (VES), Conventwald (COM), and Lüß (LUE) (Table 1, based on Table 1 from Lang et al., 2017). Total soil P stocks (g P m−2, up to 1 m depth) decrease strongly along the following gradient: BBR (904) > MTF (678) > VES (464) > COM (231) > LUE (164).
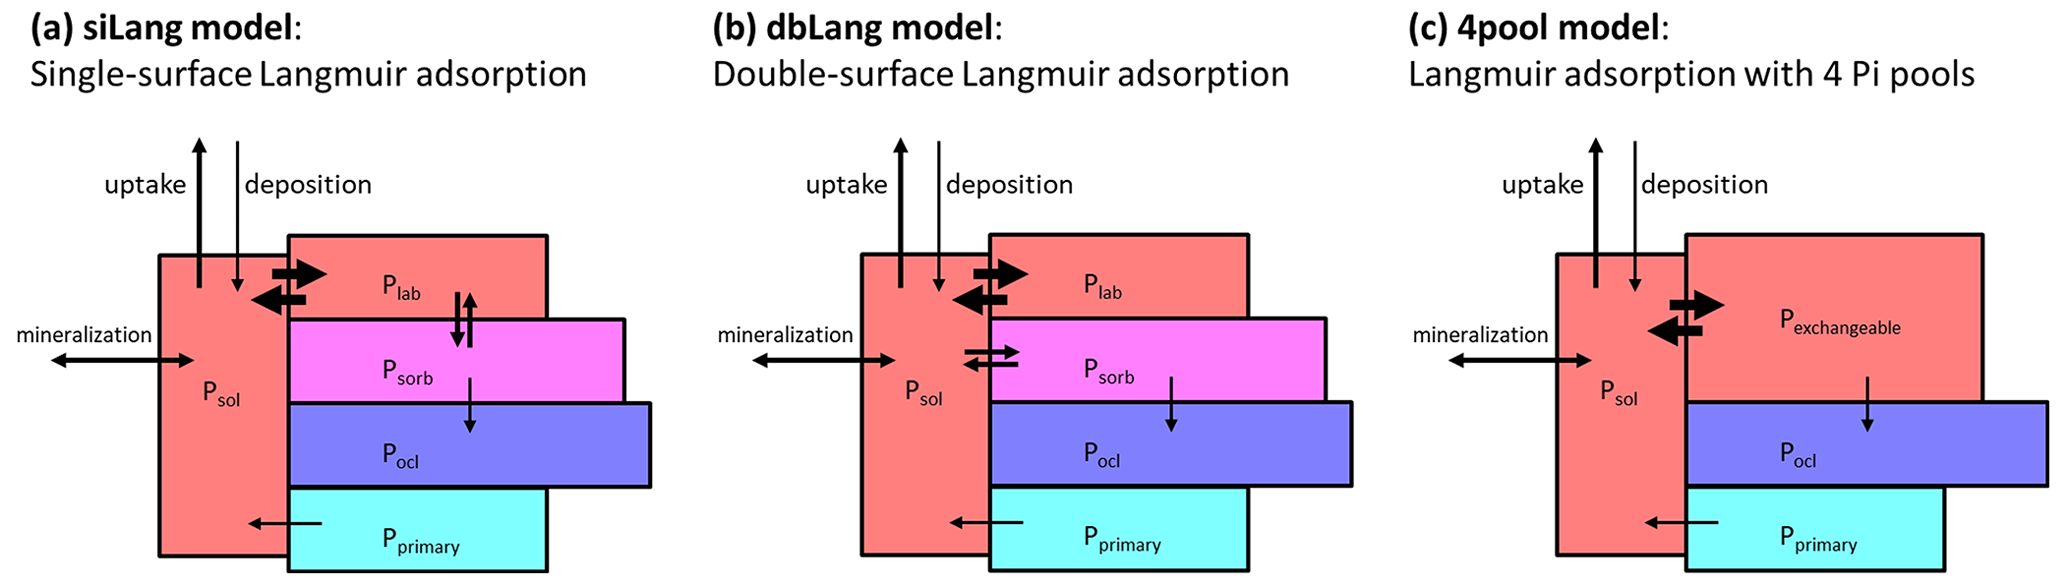
Figure 1Model concept of (a) a conventional Langmuir model (siLang), where only the labile P pool (Plab) is exchanging P with the soil solution (Psol); (b) a double-surface Langmuir model (dbLang), where both Plab and Psorb are exchanging P with the soil solution but with different Langmuir parameters; and (c) a Langmuir model with only four inorganic P pools (4pool), where Plab and Psorb are combined to one pool (Pexchangeable) to which Psol can get adsorbed via Langmuir sorption.
Soil was sampled up to 1 m depth at each site, with layer depths of 5–10 cm, for the measurement of total C, N, organic and inorganic P, and other physiochemical properties, such as soil texture, pH, and oxalate-extractable Fe and Al. Modified Hedley fractionations (Tiessen and Moir, 2008) were conducted on soils from all depths for the measurements of labile Pi (P extractable with anionic resin and Pi extractable with 0.5 M NaHCO3), sorbed Pi (0.1 M NaOH extractable Pi), occluded Pi (P residual, acid digestion), and primary P (1 M HCl extractable P). Beech leaves were sampled in July and August from five trees for the measurement of leaf N and P concentrations.
Table 1Site characteristics of the Bad Brückenau (BBR), Mitterfels (MTF), Vessertal (VES), Conventwald (COM), and Lüß (LUE) study sites, based on Table 1 from Lang et al. (2017). In the soil measurement section of the table, values before the slash refer to the topsoil, and values after the slash refer to the subsoil.

2.4 Model setup, experiments, and evaluation
2.4.1 Model setup
To compare the performance of different phosphate exchange schemes, we applied the conventional single-surface Langmuir isotherm here (siLang; Fig. 1a) as well as the novel double-surface Langmuir isotherm (dbLang; Fig. 1b) as model variants. To further test the causes of differences between these model variants, we introduced a Control simulation, which serves as a reference run without P limitation, and a four-pool simulation (4pool; Fig. 1c), which serves as a special case of siLang that does not include slow Pi exchange. All four models employed Eq. (3) to calculate the Smax and Km in the Langmuir isotherms. In siLang and 4pool, total sorption capacity (Smax; Eq. 3c) only refers to Plab (or Pexchangeable), whereas the two sorption maxima (Smax,1 and Smax,2) refer to Plab and Psorb, respectively, in dbLang. In the Control model, Psol was kept at concentrations not limiting plant uptake or soil organic matter (SOM) decomposition. All models were initialized with a 15-layer soil column of 9.5 m which has a decreasing SOM content as soil depth increases (Thum et al., 2019). As for the inorganic P pools, the initial values of the top 1 m of soil were prescribed from the Hedley fractionation measurements and extrapolated to the deeper soil assuming an increased fraction of primary P and a decreasing fraction of exchangeable soil Pi pools (Plab and Psorb). The initialization of soil inorganic P pools deeper than 1 m is described in the Supplement (Sect. S4).
2.4.2 Model experiment protocol
The models were spun up for 500 years with meteorology and other atmospheric forcing (atmospheric CO2 as well as N and P deposition), which were randomly drawn from the years from 1901 to 1930. During the model spin-up, the P cycle was simulated dynamically, but the more stable Pi pools, i.e., Pocl, and Pprimary, were kept constant to ensure that all of the models initialized at the same field P status. After spin-up, all models were run from 1901 to 2015 using the annual values for atmospheric CO2, N (Lamarque et al., 2010, 2011) and P (Brahney et al., 2015; Chien et al., 2016) deposition, and the meteorology (Viovy, 2018) of the respective year. The C : N and C : P ratios of the slow SOM pool were calibrated per site per soil depth to match the measured soil C : N and C : P ratios so that the simulated SOM cycling adequately represented the measured site condition. All of the other parameter values were either taken from Thum et al. (2019) or modified based on the development in this study, except for the maximum biological N fixation rate, which is set to be 2.5 kg N ha−1 yr−1 for all of the study sites.
2.4.3 Model evaluation
Trend analyses were carried out with the Mann–Kendall test (M–K test) of the Kendall R package (McLeod, 2011). In the Mann–Kendall test, the tau (τ) value varies between −1 and 1, where −1 represents a decreasing trend and 1 represents an increasing trend. The modeled soil profile against the measured soil profile was evaluated with a normalized root-mean-square ratio term, Knrmsr, which is modified to represent the average proportions between modeled and measured values (Yu et al., 2020b).
Ki is the variable representing the ratio between simulated and measured values (in volumetric units) at the measured ith layer. A paired t test was conducted on the Knrmsr of all study sites between siLang and dbLang to verify if one model was statistically better than the other.
2.5 Sensitivity analysis
To evaluate the response of alternative Langmuir isotherms to changes in P cycling processes, we further tested the sensitivity of the siLang and dbLang models to the P cycling parameterization at one low-P site, Conventwald (COM), and one high-P site, Mitterfels (MTF), using a standard Latin hypercube design (LHS; Saltelli et al., 2004). We selected 16 parameters that directly control flux rates of inorganic or organic P cycling processes and varied each parameter by ± 20 % of its default value (Table S2) using LHS sampling of a uniform distribution in order to form a set of 1000 LHS samples. The model outputs were evaluated in terms of gross primary productivity (GPP), foliar N and P content, vegetation C stock, soil organic carbon (SOC) content, total soil organic P (Po) and inorganic P, and the ratio between Plab and exchangeable Pi. We measured parameter importance as the rank-transformed partial correlation coefficients (RPCCs) to account for potential nonlinearities in the association between model parameters and output (Zaehle et al., 2005; Saltelli et al., 2004).
2.6 Simulated CO2 and P fertilization experiments
To test the effects of phosphate exchange schemes on environmental changes, we conducted a CO2 fertilization model experiment, a P fertilization model experiment, and a CO2–P (CP) fertilization model experiment using the siLang, dbLang, and 4pool models at each study site. In the CO2 fertilization experiment, the atmospheric CO2 concentration was increased by 200 ppm from 2006 to 2015. In the P fertilization experiment, 50 kg ha−1 KH2PO4, i.e., 1139.7 mg P m−2, was added once to the soil as soluble phosphate on 16 September 2006.
3.1 Langmuir isotherm parameters in batch sorption experiments and TBMs
In batch sorption experiments, the maximum soil P sorption capacity Smax ranges from 187 to 829 g P m−2 (25th quantile and 75th quantile values, median 390 g P m−2) and the Langmuir coefficient Km ranges from 0.21 to 4.5 g P m−2 (median 0.93 g P m−2); therefore, the calculated partition coefficient kp varies between 0.005 and 0.022 (median 0.01; Table 2, Fig. S1). Regarding the parameterization of Smax and Km in TBMs, a few studies have directly retrieved values from sorption experiments (Wang et al., 2007; Yang et al., 2014), although most modeling studies estimate Smax and Km based on soil types (Wang et al., 2010; Goll et al., 2012; Zhu et al., 2019) or soil texture (Thum et al., 2019).
The two studies using lab-derived Langmuir parameters fitted well in the range of experimental values; however, for those modeling studies that estimate Langmuir parameters, only the QUINCY model (Thum et al., 2019) produced reasonable Langmuir parameters and kp values, while most other TBMs greatly overestimated Km, thereby generating much higher kp values than batch experiments (Table 2).
Table 2The maximum sorption capacity (Smax), the Langmuir coefficient (Km), and the calculated partition coefficient (kp) of the phosphorus Langmuir (ad)sorption isotherm in TBMs and batch sorption experiment data (BED).

n/a: not applicable.
In Fig. 2a, it is also shown that most TBMs are at or below the lower range of curves from batch sorption experiment data (BED) except the two isotherms from QUINCY that are close to the BED-median curve. All of the other TBMs either have very low Smax or overly high Km, which can both lead to flattened soil Pi curves, indicating that very low amounts of P are stored as exchangeable Pi in the soil, even at high Psol concentrations.
However, the responses to P removal are noticeably different between the single- and double-surface Langmuir models (siLang and dbLang) given the similar soil Pi curves (Fig. 2b). The Psol in siLang almost reached zero after a 30 d desorption experiment, whereas dbLang still maintained a Psol level of 0.2 g m−2, suggesting a much stronger buffering capacity in dbLang compared with siLang. This is mainly because the replenishment of Psol in siLang is strongly limited by the rate of desorption from Psorb to Plab, but Psol directly exchanges with Psorb when the P is removed in dbLang.
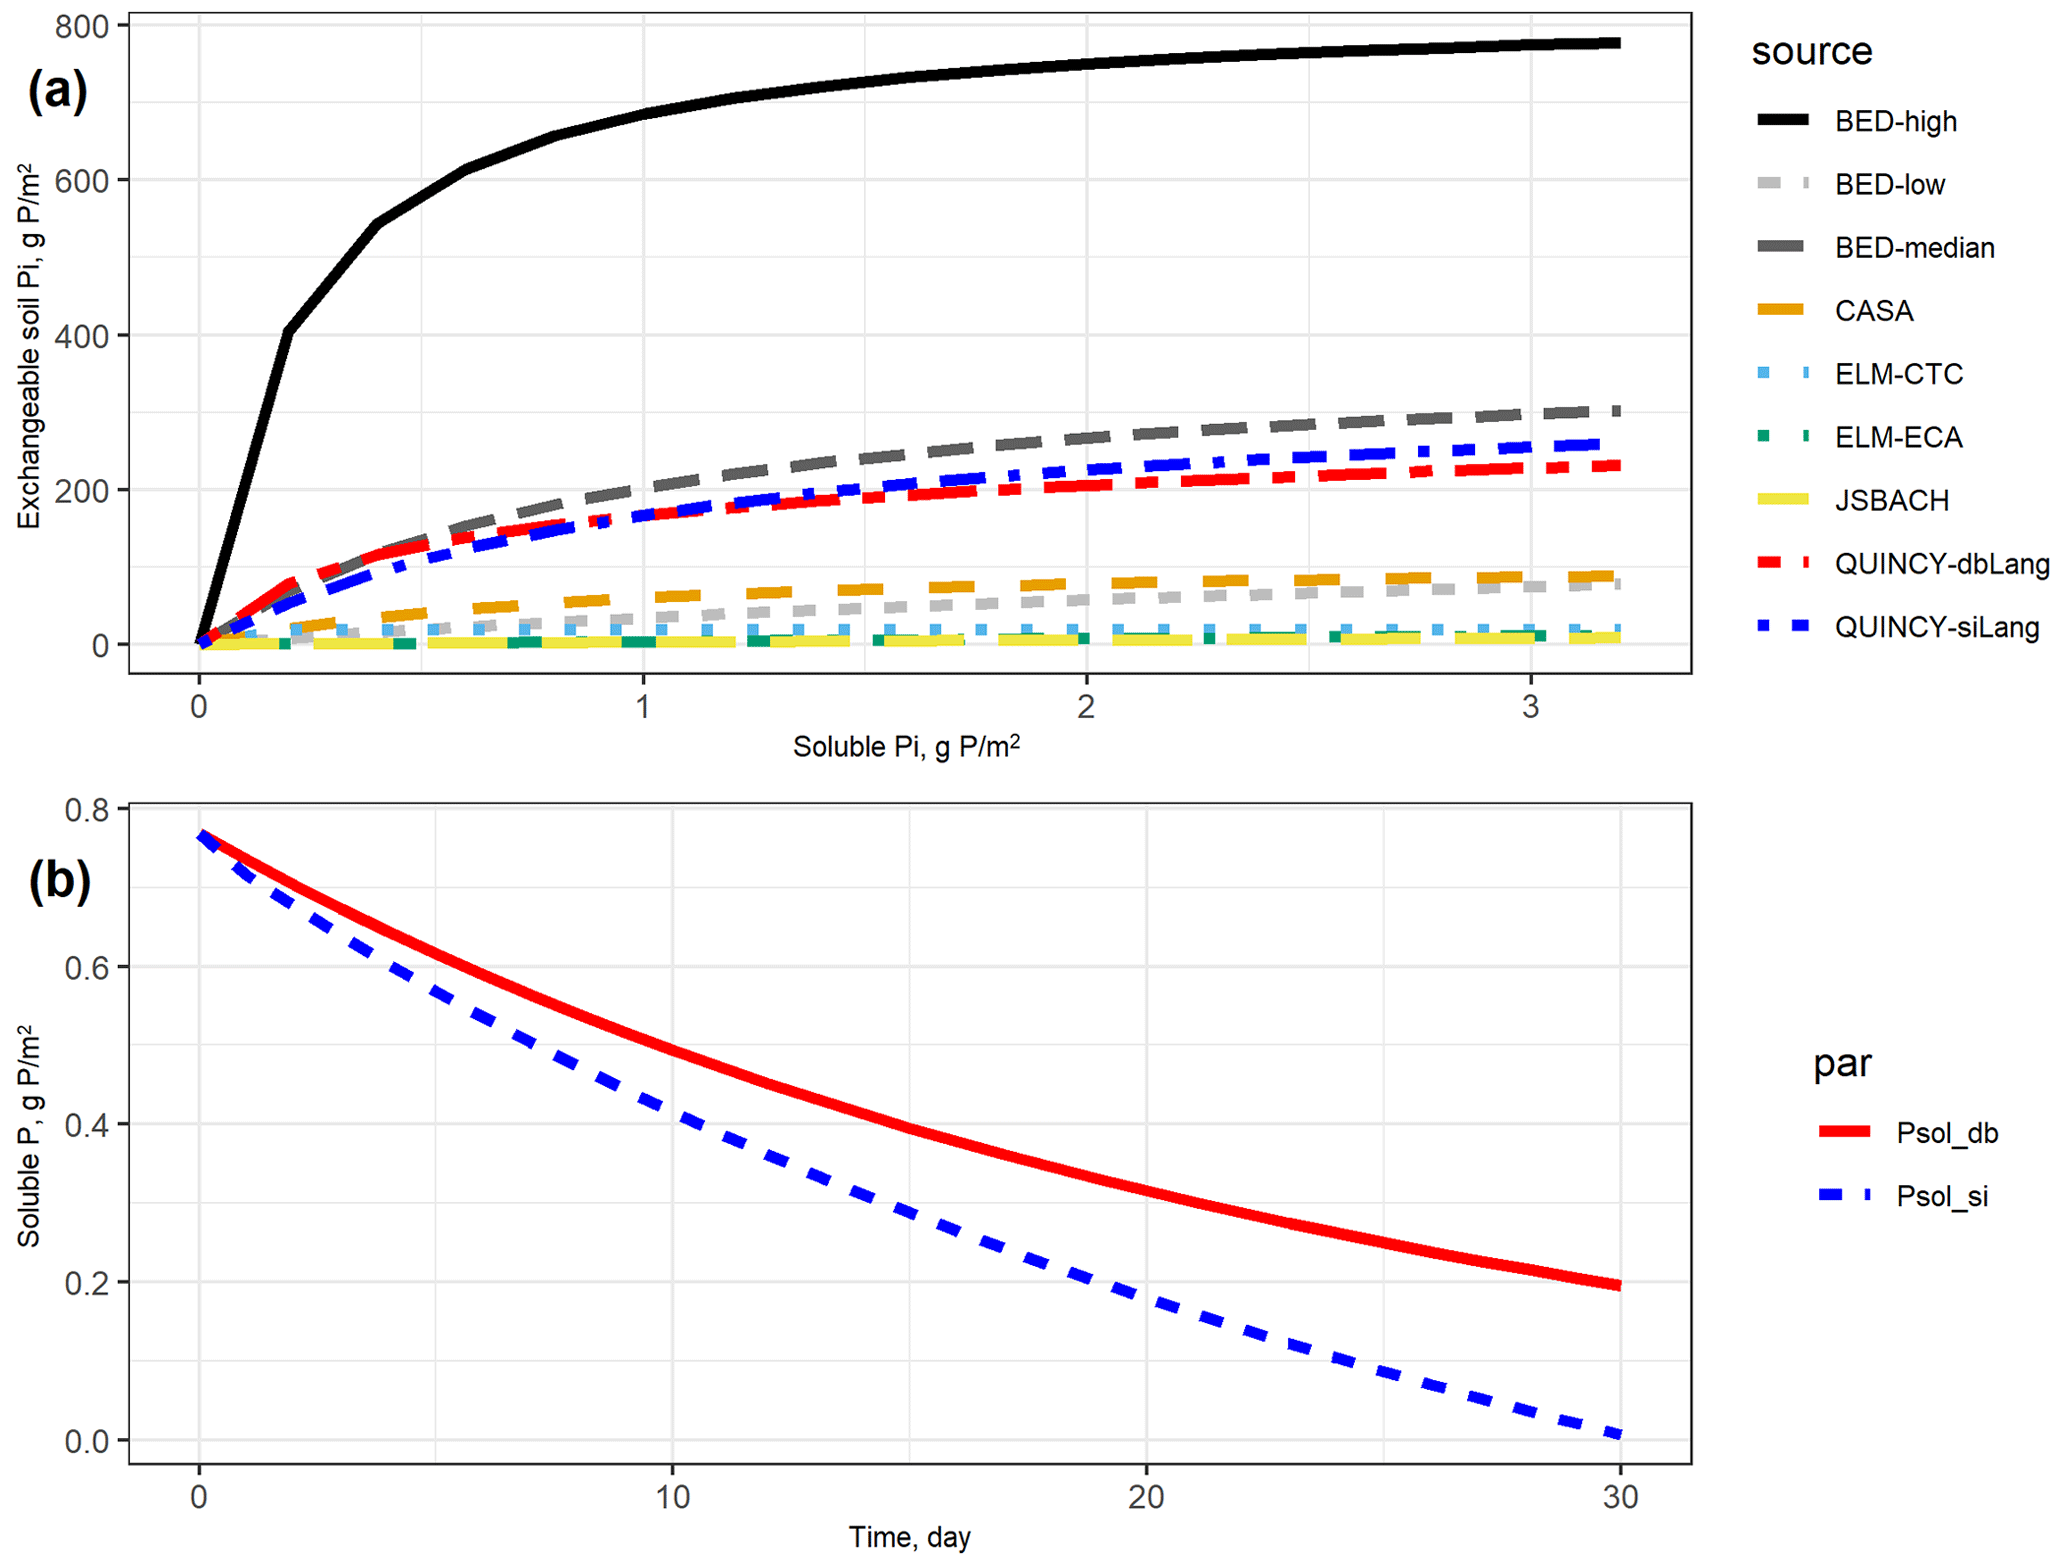
Figure 2(a) Exchangeable soil inorganic P (Plab and Psorb) curves based on different terrestrial biosphere model (TBM) parameters and batch experiment data (BED). In TBMs, exchangeable soil Pi is defined as the sum of Plab and Psorb. In BED, soil exchangeable Pi only refers to Plab in Eq. (1) due to a destructive experimental procedure that mobilizes the soil Pi well (Barrow and Shaw, 1979). For the conventional Langmuir model (siLang), Psorb is calculated as 9 : 8 (global average ratio between Psorb and Plab, reported in Yang et al., 2013) of Plab at all soluble P concentrations; for the double-surface Langmuir model (dbLang), Psorb is calculated following Eq. (3b). (b) Simulated desorption curves for single- and double-surface Langmuir isotherms. The two desorption curves start with the same exchangeable soil Pi (152.2 g P m−2, Plab+ Psorb) and soluble Pi (0.769 g P m−2, Psol) content, and the same amount of P (2.5 g P m−2) is removed from soil solution every day. Both Langmuir isotherms are assumed to be in equilibrium at a daily time step.
3.2 Simulated and measured ecosystem properties
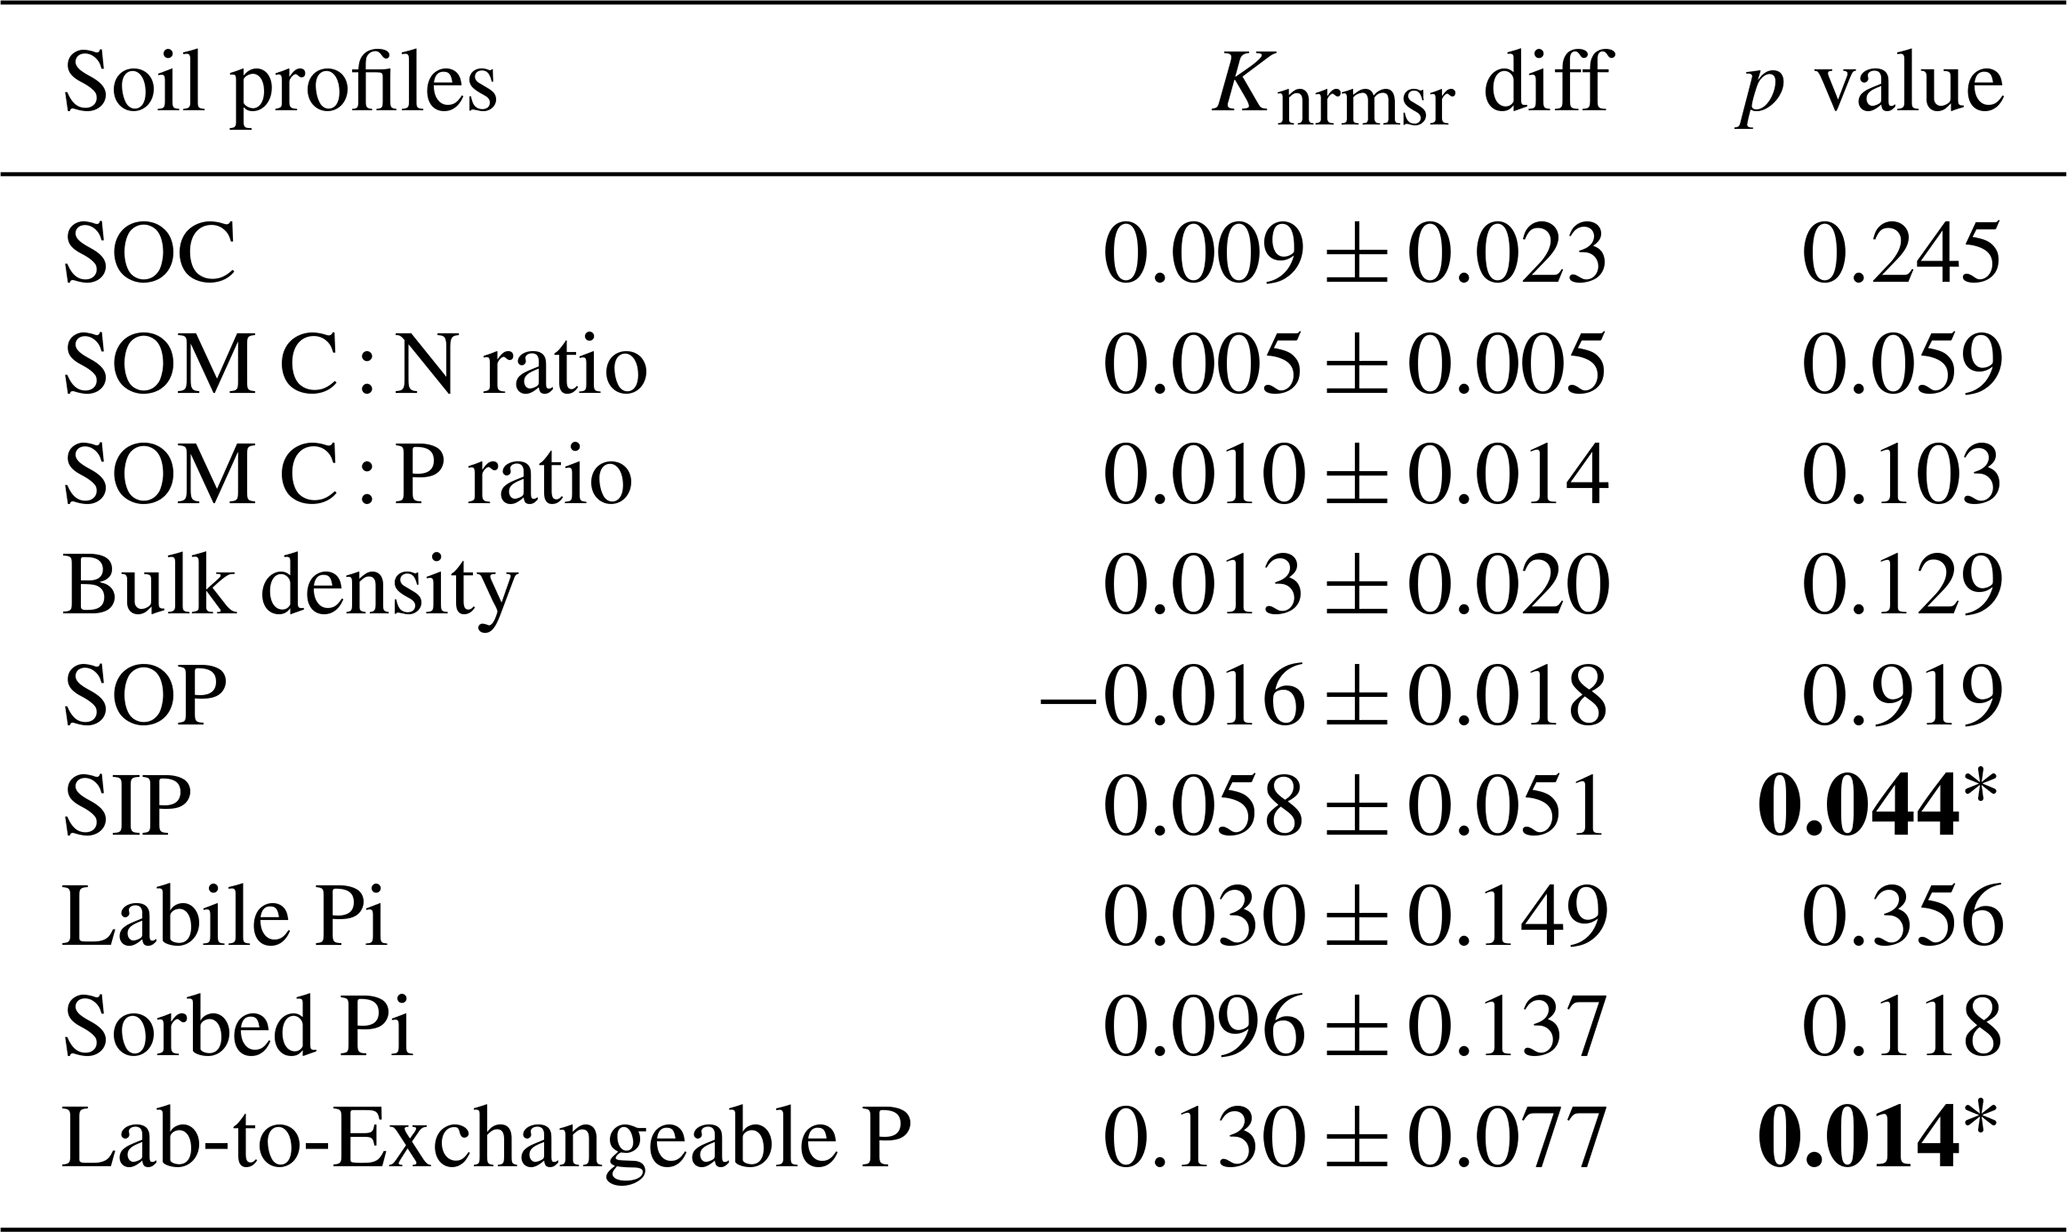
The siLang, dbLang, and 4pool models can adequately reproduce the measured SOC content as well as the SOM C : N and C : P ratios along soil profiles at all of the study sites after site- and depth-specific calibration (Fig. 3a, b, c; Table S1). The performance of the three models did not differ much regarding the simulation of SOM profiles due to our calibration strategy (Tables 2, S1). However, the novel dbLang model better reproduced the ratio between Plab and exchangeable Pi (Lab-to-Exchangeable P) than siLang (Knrmsr improvement of 0.130 ± 0.077, p<0.05) (Table 3). The improvements of dbLang in modeling the labile (Knrmsr improvement of 0.030 ± 0.147, p>0.05) and sorbed Pi (Knrmsr improvement of 0.096 ± 0.137, p>0.05) pools were not as significant as that in modeling the Lab-to-Exchangeable P ratio (Fig. 3d, e, f; Table 3).
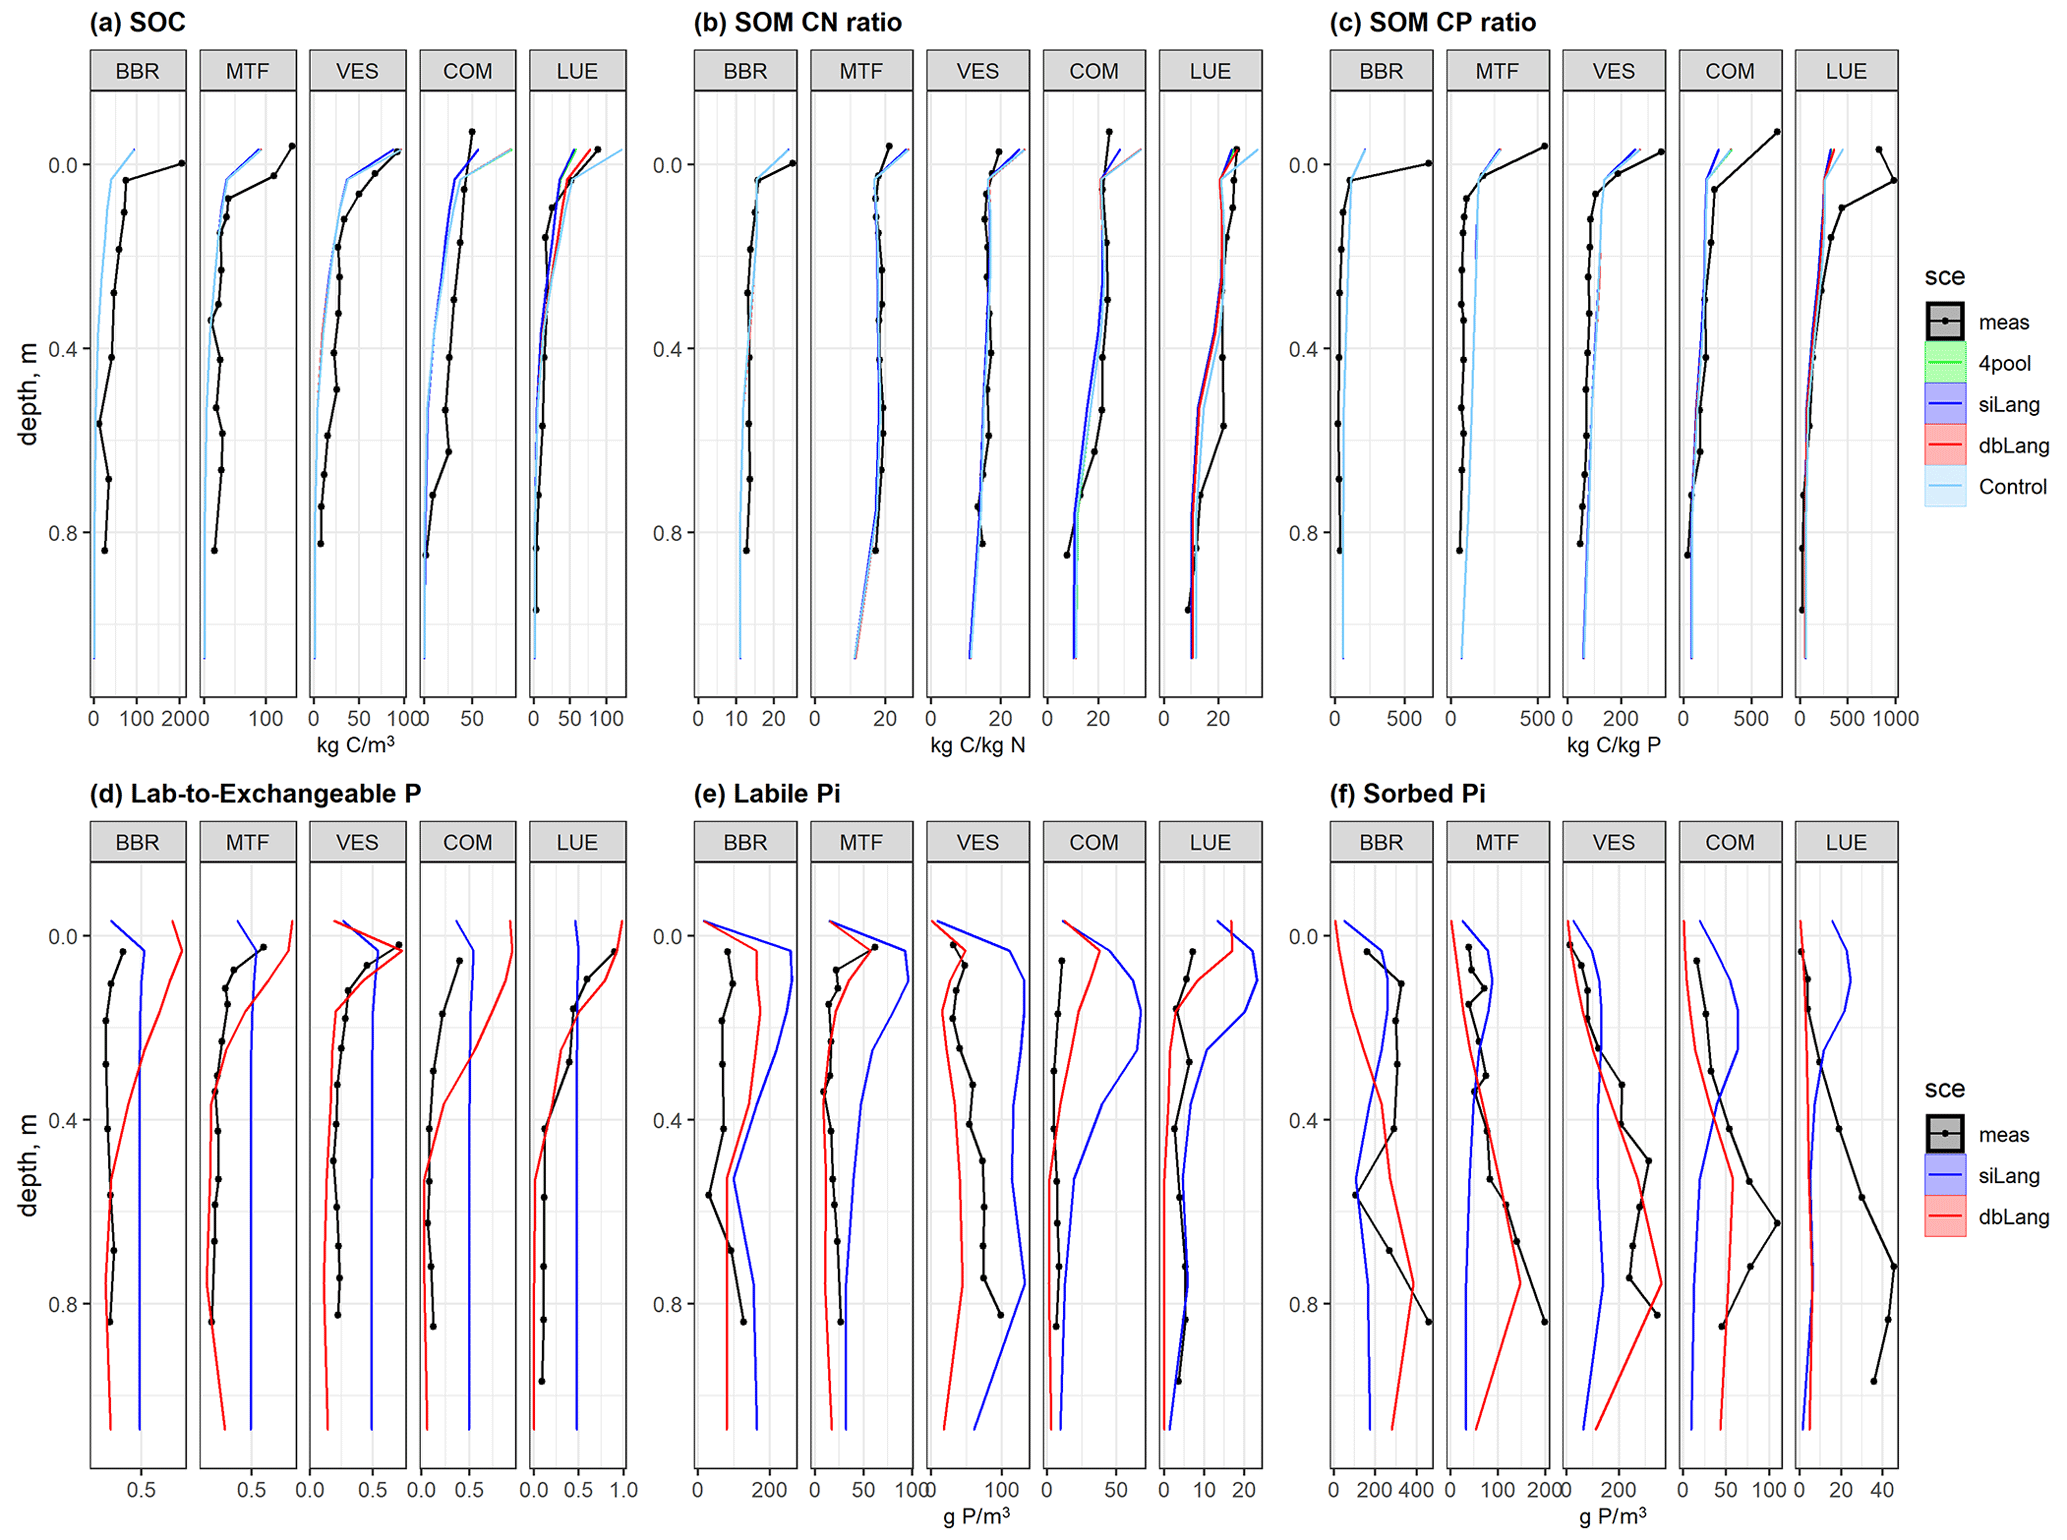
Figure 3Simulated and measured (a) soil organic carbon (SOC), soil organic matter (SOM) (b) C : N and (c) C : P ratios, (d) ratio of labile to exchangeable Pi, (e) labile Pi, and (f) sorbed Pi of the study sites along the following soil P availability gradient: BBR > MTF > VES > COM > LUE. The black dotted line is the field measurements, the lime line represents the Langmuir model with only four inorganic P pools (4pool), the blue line represents the single-surface Langmuir model (siLang), the red line represents the double-surface Langmuir model (dbLang), and the light sky-blue line represents the Control model. The 4pool and Control simulations are not applicable in panels (d), (e), and (f).
Table 3Results for the paired t test between the normalized root-mean-square ratios (Knrmsr; Table S1) of the siLang and dbLang models of measured soil profile properties at all study sites. The null hypothesis is that dbLang performs no differently than siLang (i.e., dbLang has the same Knrmsr values as siLang), and the hypothesis is rejected when the p value is smaller than 0.05 (values in bold with an asterisk).
The simulated average foliar N content values of the four models (23.35 ± 1.59, 23.05 ± 1.84, 22.45 ± 2.35, 22.74 ± 2.27 mg N g−1 DW (where DW denotes dry weight) for Control, dbLang, siLang, and 4pool, respectively) were within the average range of measured values (24.32± 1.43 mg N g−1 DW). However, the simulated decreasing trend in the foliar N content (M–K test, , −0.8, −1, −0.8 for Control, dbLang, siLang, and 4pool, respectively) along the soil P gradient was not found in the measured data (M–K test, τ = −0.2) (Fig. 4a). Decreasing trends in simulated foliar P content in all models (M–K test, , −0.95, −1, −1 for Control, dbLang, siLang, and 4pool, respectively) were instead also seen in measurements, but the decreasing trend was much weaker (M–K test, ) (Fig. 4b). The simulated foliar P content was highest in the Control model (1.40 ± 0.09 mg P g−1 DW) and lowest in siLang (0.95 ± 0.21 mg P g−1 DW) at each study site, as Control is not P limited and the strongest P limitation occurs in siLang. The simulated difference in foliar P content across models reflects both plant P uptake and productivity (Figs. 4, S2–5). For example, at the P-rich BBR site, although the simulated GPP, leaf area index (LAI), aboveground C, and fine-root C for the four models were almost identical (Fig. S2), the foliar P content values of four models were different due to differing plant P uptake (0.99, 0.95, 0.89, 0.95 g P m−2 yr−1 for Control, dbLang, siLang, and 4pool, respectively; Fig. S2). In contrast, at the P-poor LUE site, the differences among siLang, dbLang and 4pool for GPP, LAI, and plant C were more pronounced than that for foliar P content, as the limited P uptake (0.67, 0.53, 0.55 g P m−2 yr−1 for Control, dbLang, and siLang, respectively; Fig. S2) drastically changed the plant C allocation (e.g., leaf-to-root ratio) and led to subsequent changes in plant properties (Figs. 4, S2).
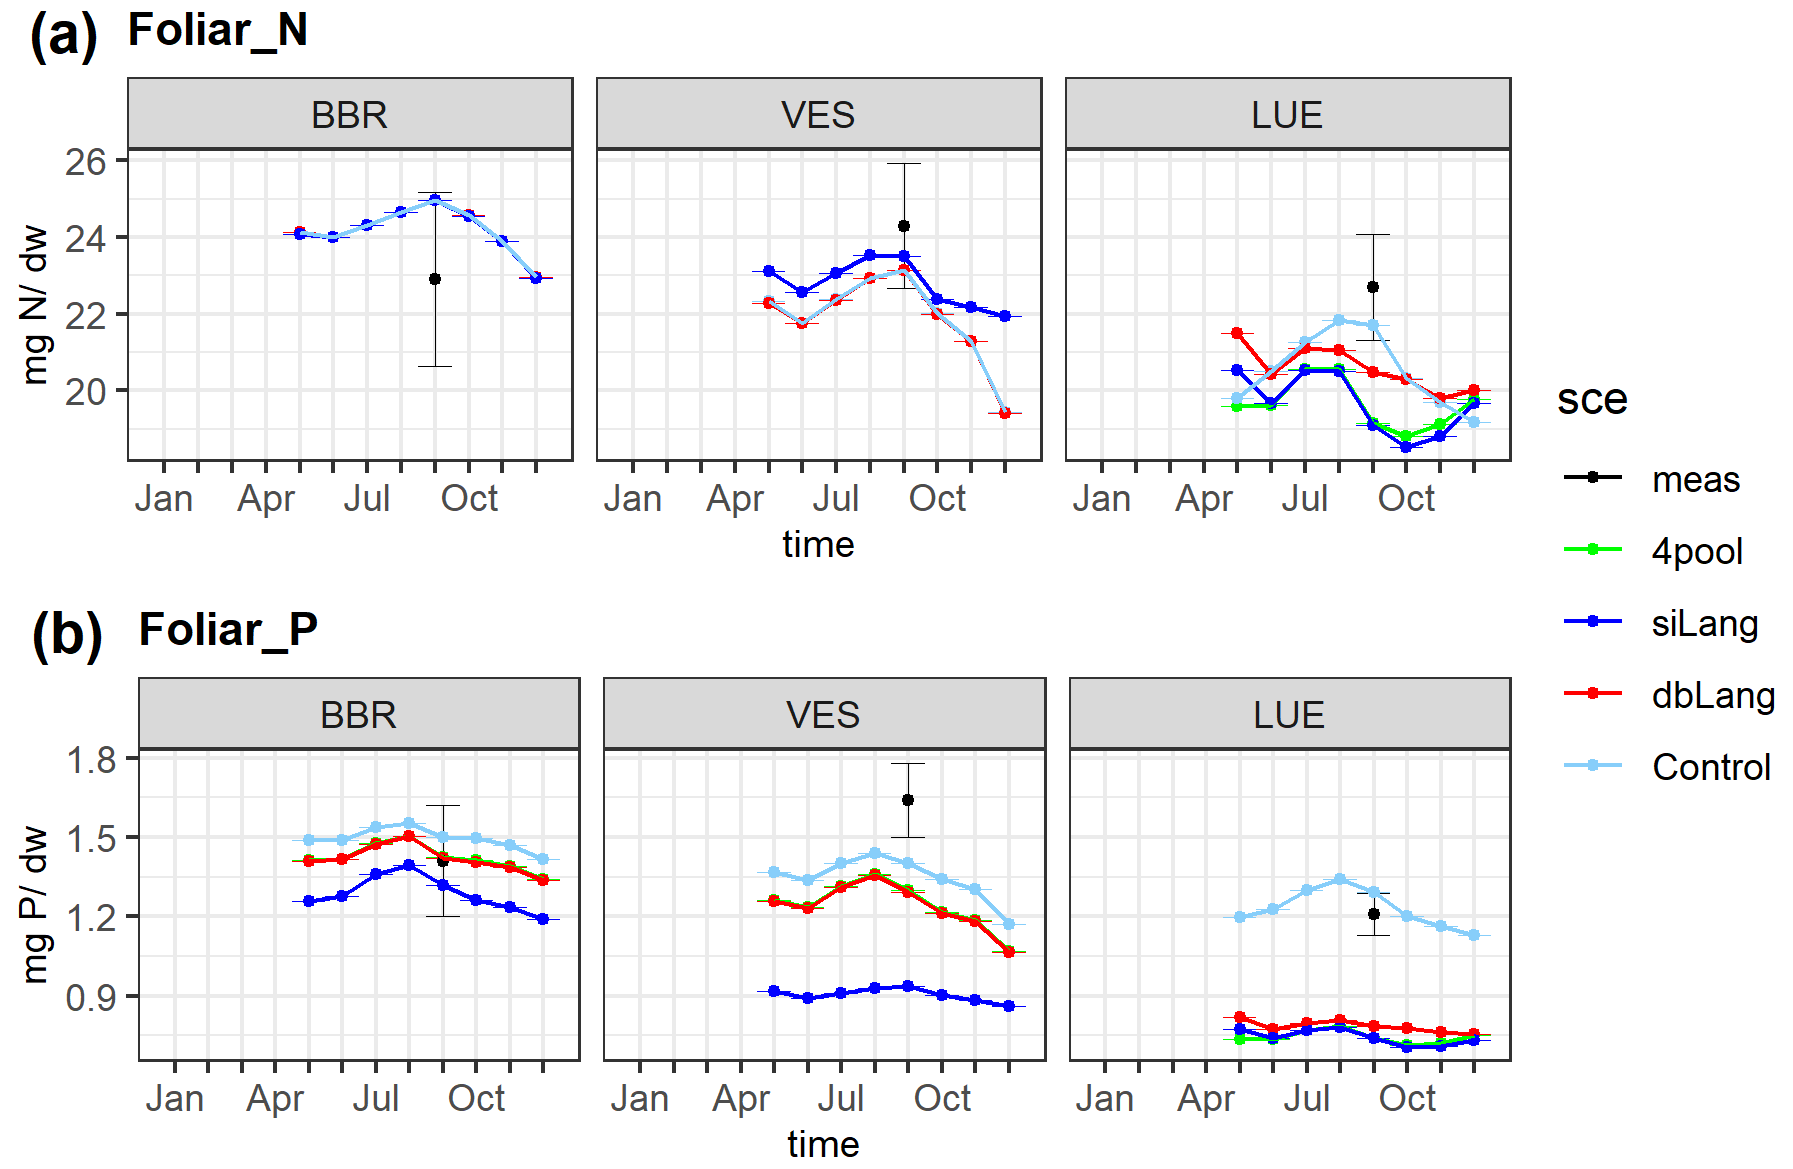
Figure 4Simulated and measured foliar N (a) and P (b) content along the soil P availability gradient. The simulated values are the yearly average of the 2006–2015 period, and the measured values were sampled in 2014. The black dots are the field measurements, the lime line represents the Langmuir model with only four inorganic P pools (4pool), the blue line represents the single-surface Langmuir model (siLang), the red line represents the double-surface Langmuir model (dbLang), and the light sky-blue line represents the Control model.
3.3 Sensitivity analysis
Our sensitivity tests at the low-P COM site (231 g P m−2) and the high-P MTF site (678 g P m−2) showed a diverging effect of model choice and parameterization on selected ecosystem properties, such as GPP, plant C, and foliar P content (Figs. 5, S6). Both models were very consistent in maintaining the vertical pattern of the simulated ratio between labile and exchangeable Pi (Lab-to-Exchangeable P) across different parameterizations (Fig. S7). In other words, the better fit of dbLang in capturing the measured decreasing trend in Lab-to-Exchangeable P was robust against model parameters choice (Figs. S6, S7).
The P cycling parameters with the strongest effect on the selected ecosystem properties were very different between the two models and moderately different between the two sites (Fig. 5, Table S3). In siLang, the parameters with the highest impact for most selected outputs (e.g., foliar P, GPP, and plant C, as in Fig. 5) were the absorption and desorption rates between Plab and Psorb (kabs and kdes), i.e., the slow exchange process, whereas they were the turnover rates and N : P ratios of slow and fast SOM pools (τslow, τfast, SOM_np, and microbial_np) in dbLang. One common feature of both models is that the low-P site (COM) was more affected by SOM_np, the maximum weathering rate (k_weath_mineral) and the maximum plant P uptake rate (vmax_uptake_p_p4) than the high-P site (MTF), inferring a tighter P cycle in a low-P ecosystem than in a high-P ecosystem.
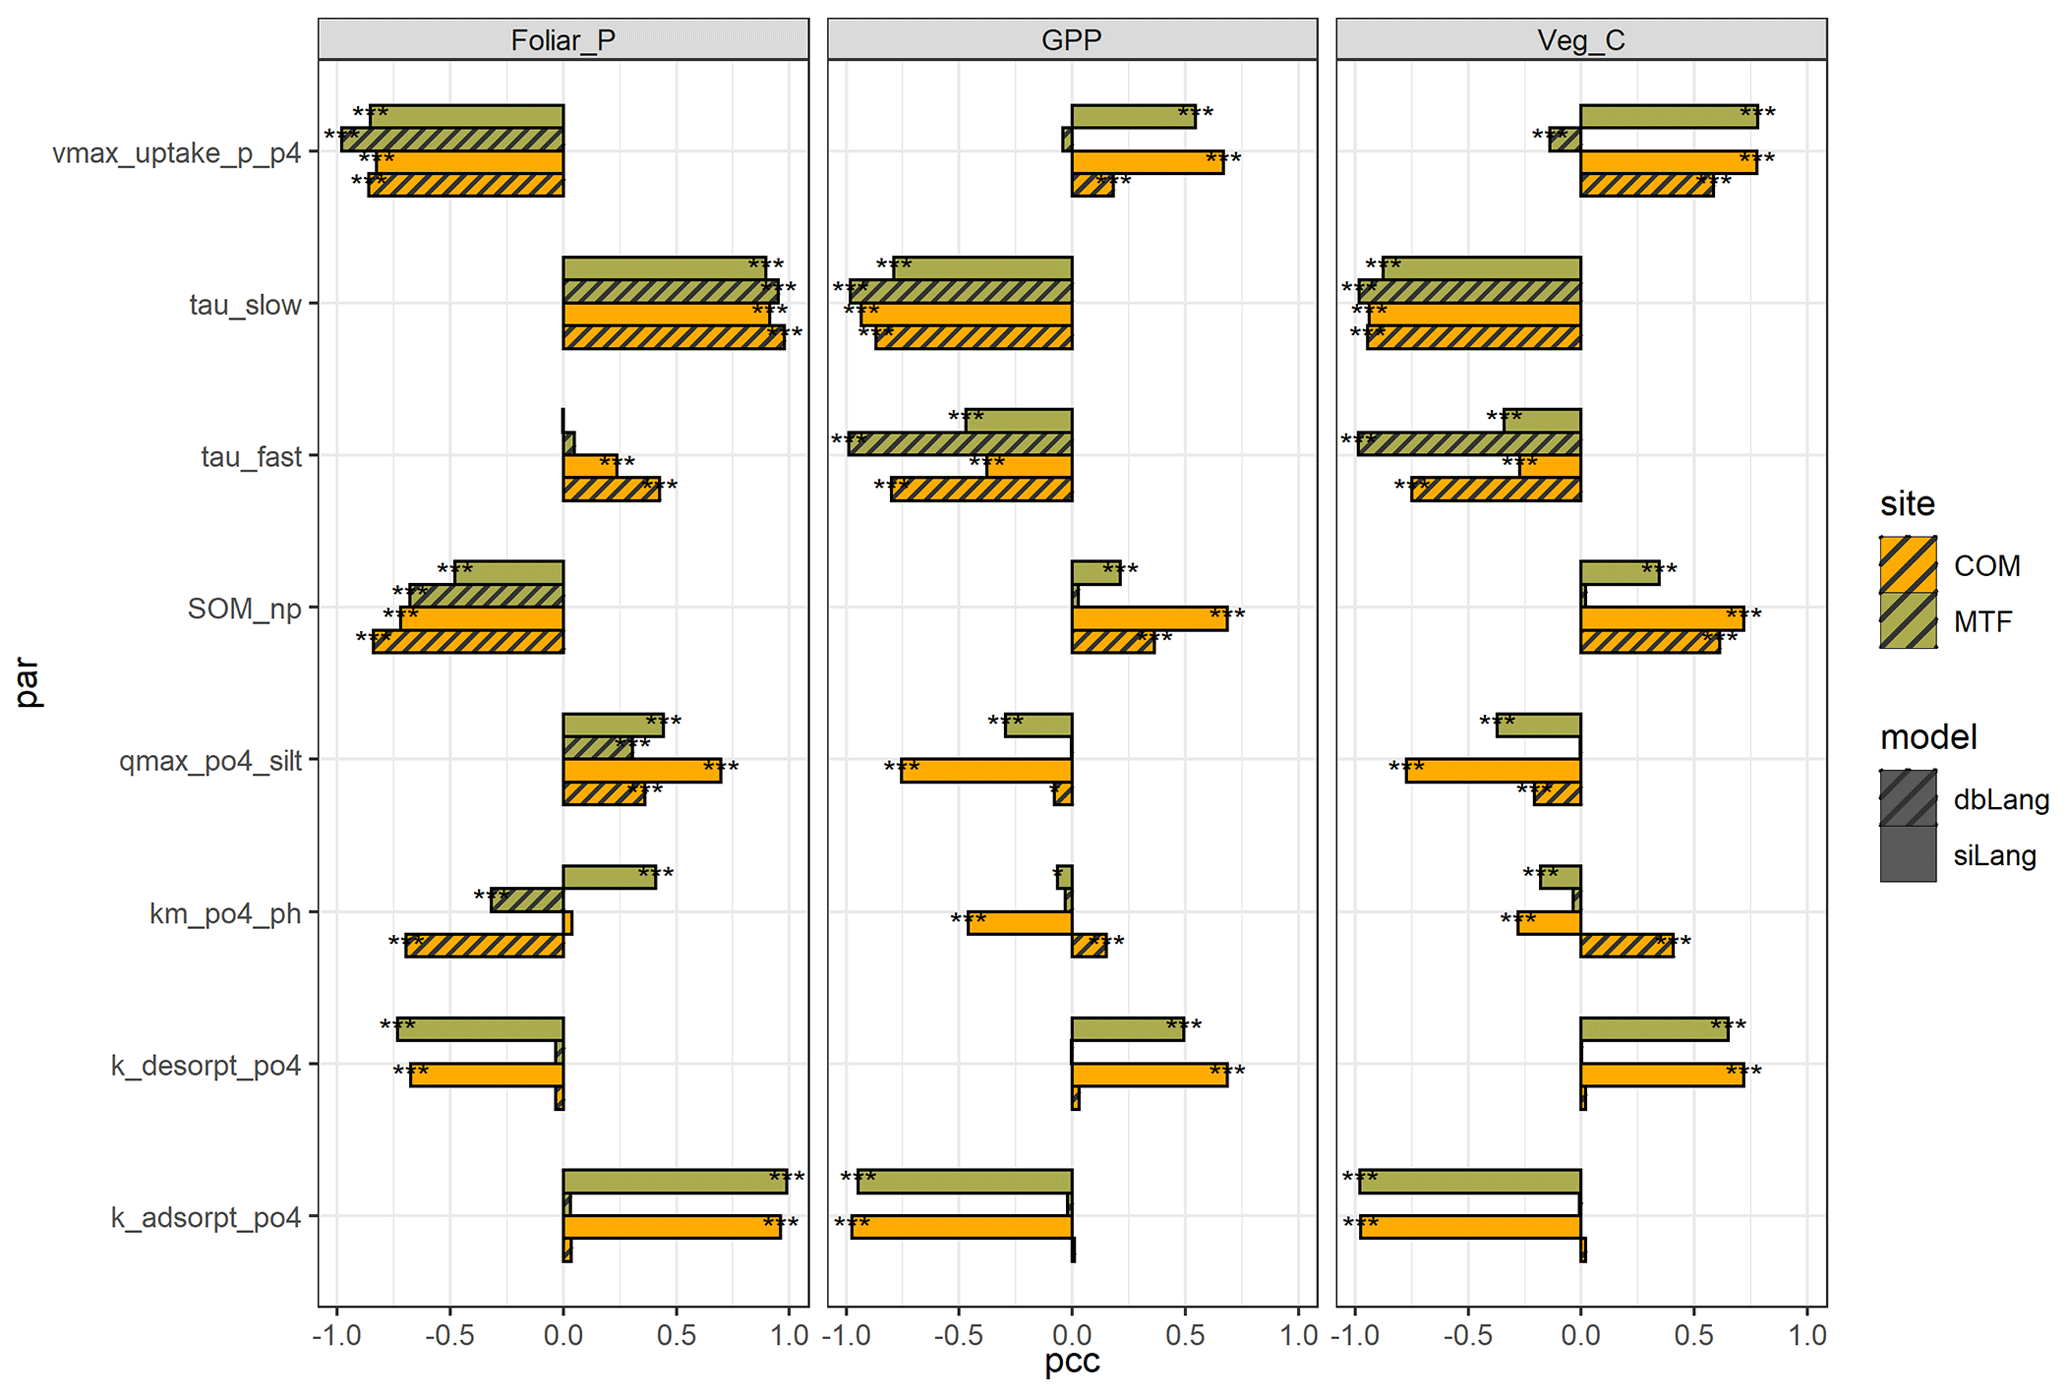
Figure 5Partial correlation coefficient (pcc) values of eight main parameters of foliar P content, gross primary production (GPP), and vegetation C stock at the COM and MTF sites of the single-surface Langmuir model (siLang) and the double-surface Langmuir model (dbLang) in the Latin hypercube design (LHS) sensitivity runs. The eight parameters are as follows: the maximum plant P uptake rate (vmax_uptake_p_p4), the turnover rates of slow and fast soil organic matter (SOM) pools (tau_slow and tau_fast, respectively), the N : P ratio of the slow SOM pool (SOM_NP), the phosphate sorption capacity of fine soil (qmax_po4_silt), the correction coefficient of pH on Langmuir Km (km_po4_ph), and the absorption and desorption rate between Plab and Psorb (k_ adsorpt_po4 and k_desorpt_po4, respectively). The significance levels shown in figure (using asterisks) are as follows: p<0.001 (), p<0.01 (), and p<0.05 (*).
3.4 Modeled ecosystem responses to C, P, and CP fertilizations
The simulated ecosystem responses to CO2 fertilization, P fertilization, and CP fertilization differed greatly among study sites, models, and fertilization types due to the differences in soil P availability and model schemes of Pi exchange (Figs. 6, 7, S3–S5). At the P-rich BBR site, the simulated GPP, LAI, aboveground and fine-root C, and plant uptake of N and phosphate increased after CO2 and CP fertilizations but did not change after P fertilization in all three models (siLang, dbLang, and 4pool; Fig. 6a). This indicates that the simulations at BBR were not limited by P, which is also supported by the small difference in the responses between the CO2 and CP fertilization experiments. In contrast, at the P-poor LUE site, the simulated responses to P and CP fertilization were much stronger than those after CO2 fertilization in all three models (Fig. 6c), indicating a strong P limitation at LUE.
This simulated P stress among models can be quantified when compared to the Control model (Fig. 6d). The siLang model simulated the lowest plant P uptake at all three sites with high, moderate and low P concentrations in soil. This difference in plant P uptake was not only reflected in the foliar P concentration at the high-P site but also in other vegetation properties at moderate- to low-P sites. The 4pool model, which is a special case of the single-surface Langmuir isotherm, simulated similar P stress to dbLang at high- and moderate-P sites, whereas it behaved similarly to siLang at the low-P site and simulated a high P stress (Fig. 6d).
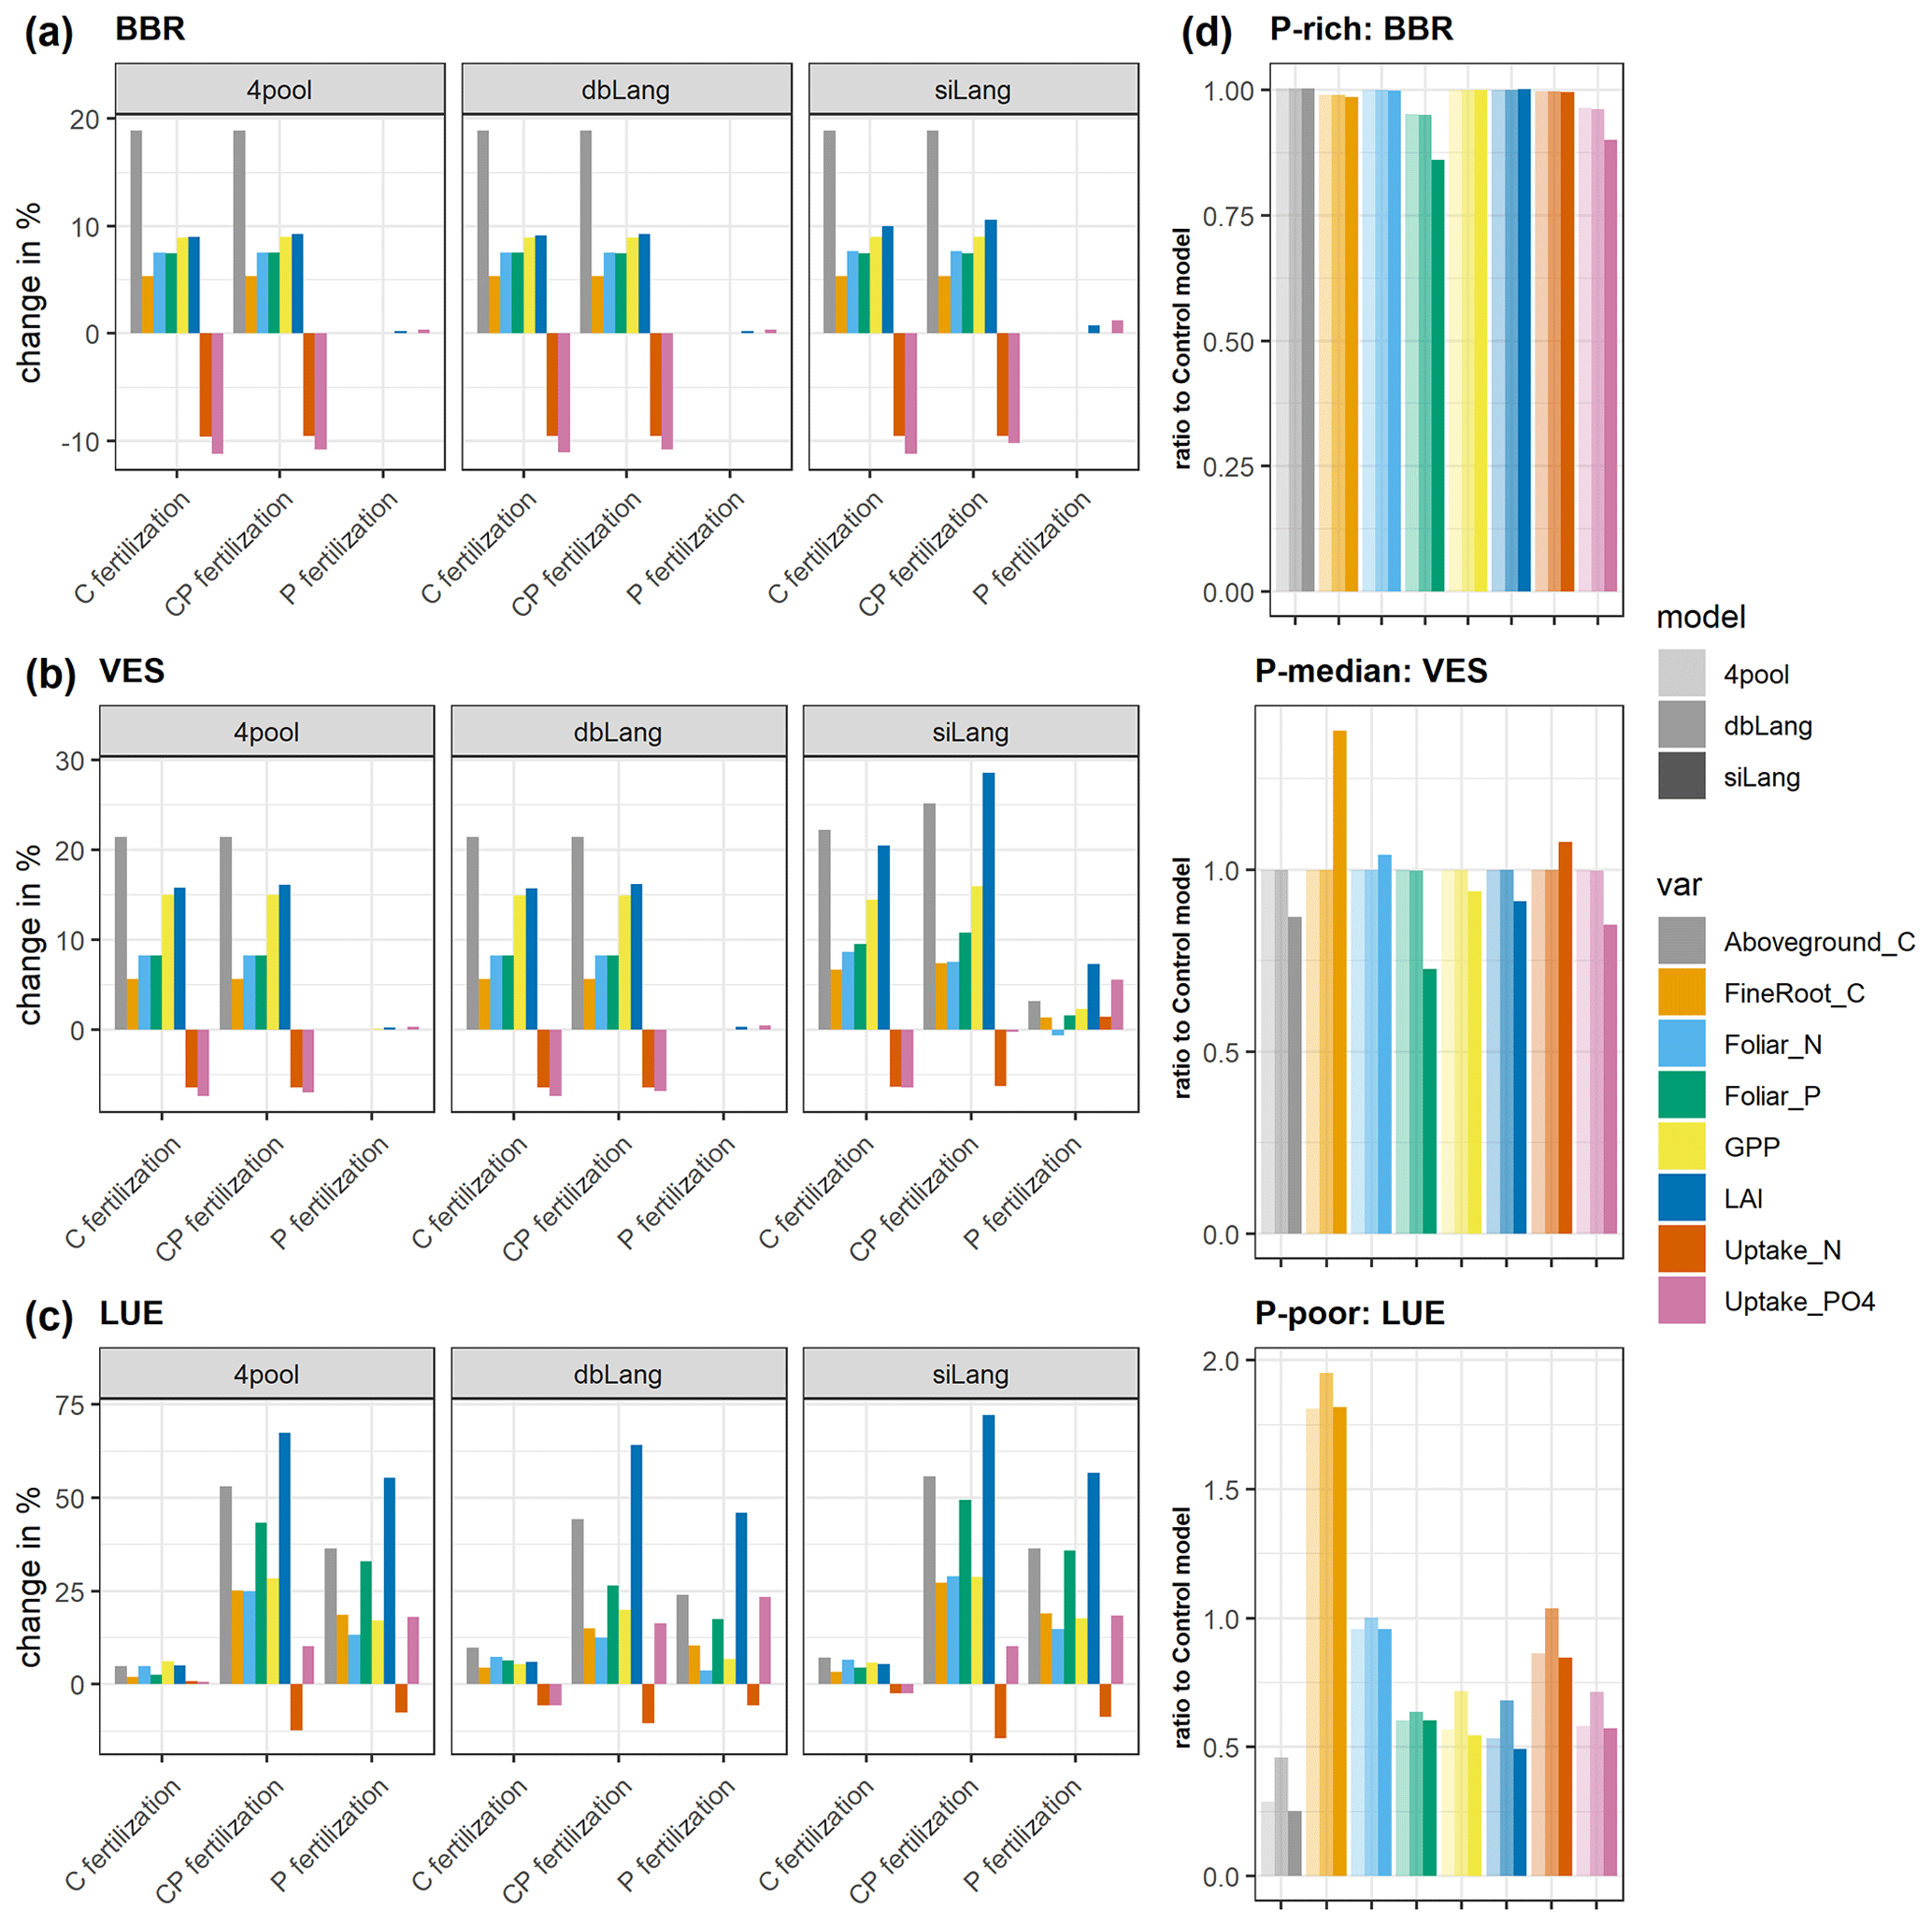
Figure 6Simulated changes in gross primary production (GPP), aboveground C, fine-root C, leaf area index (LAI), uptake of N and P, and foliar N and P content due to CO2, P, and CP fertilizations at the (a) BBR, (b) VES, and (c) LUE sites, and (d) the ratio of unfertilized scenarios of each model to the Control model. Bars are calculated as the percentage change in subplots (a) to (c), and the bars in subplot (d) are fractions representing how much the models deviate from a non-P-limited condition.
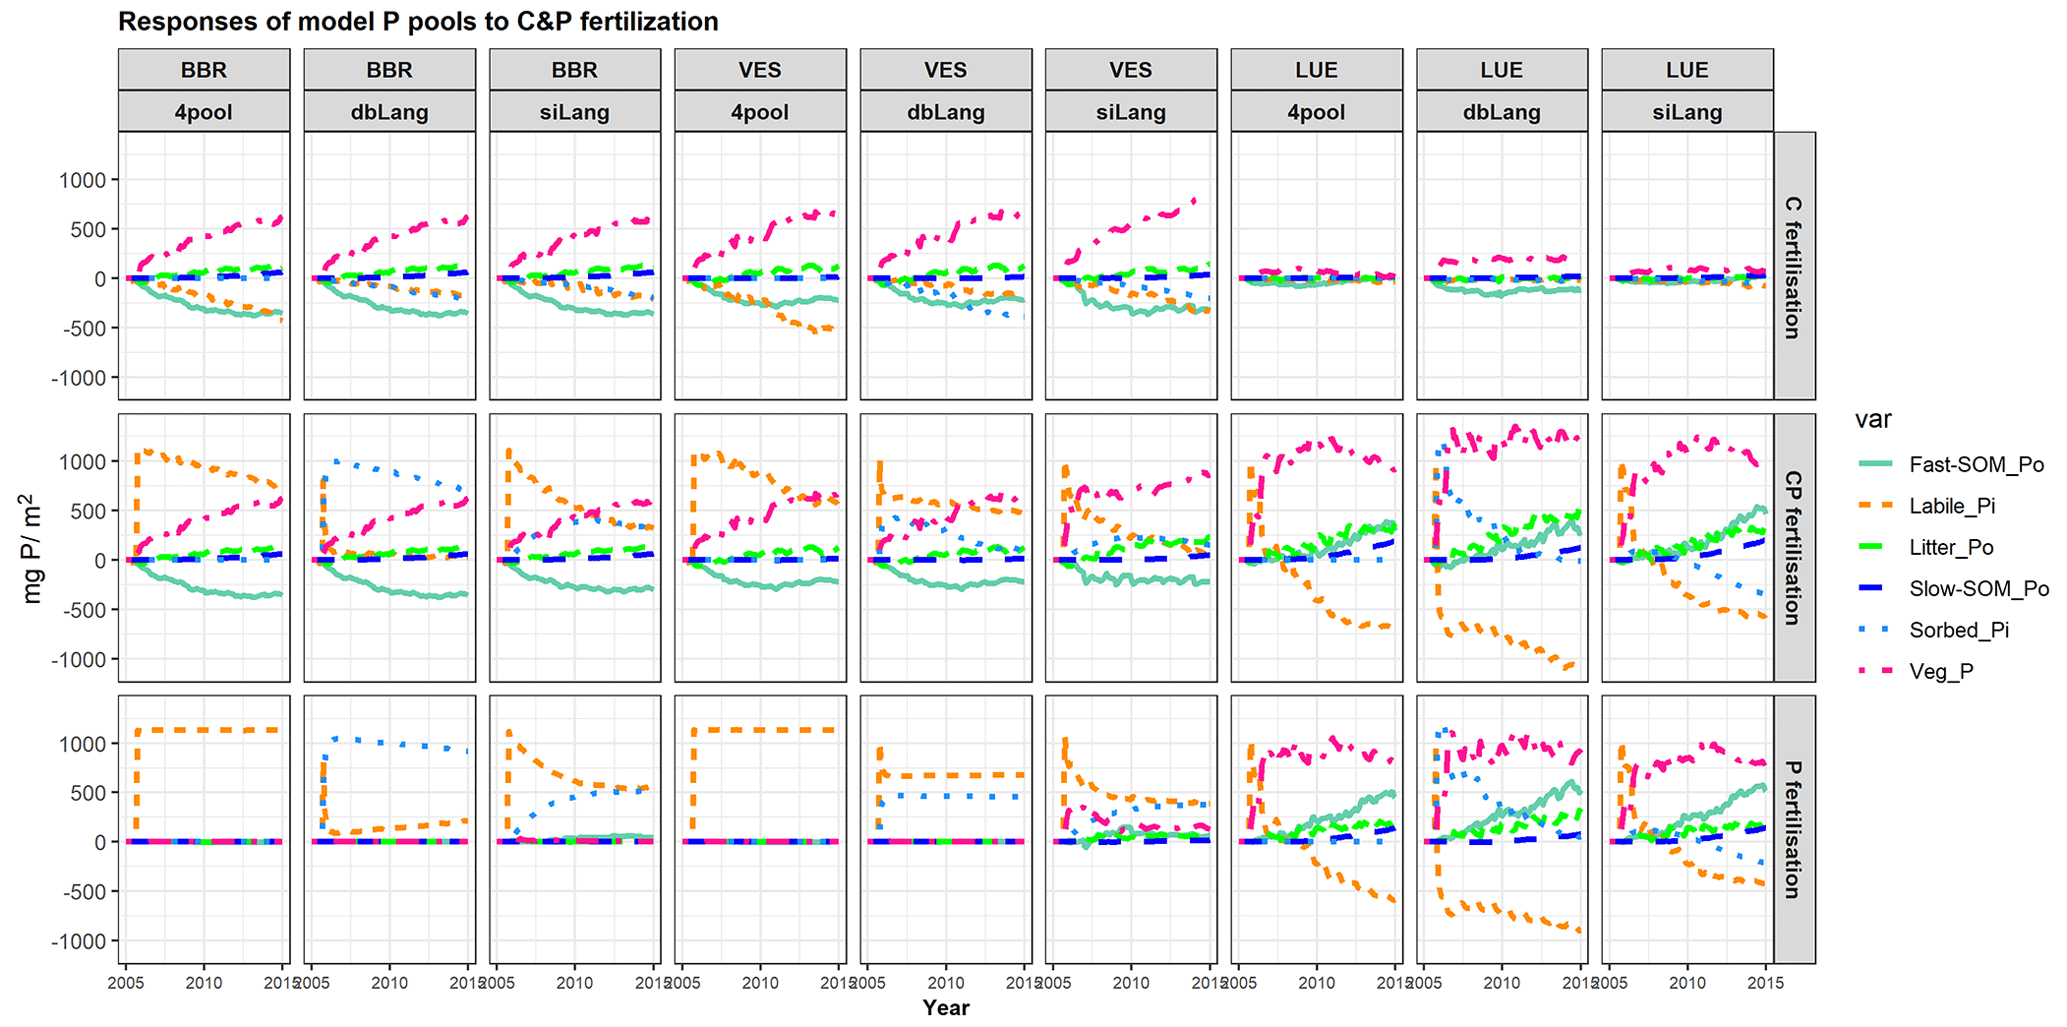
Figure 7Simulated temporal responses of model P pools (labile Pi; sorbed Pi; litter Po; Po in fast and slow soil organic matter (SOM) pools – fast-SOM_Po and slow-SOM_Po, respectively; and P in the plant – Veg_P) to CO2, P, and CP fertilizations at the BBR, VES, and LUE sites. In the C fertilization experiment, the atmospheric CO2 concentration was increased by 200 ppm from 2006 to 2015. In the P fertilization experiment, 1139.7 mg P m−2 was added once to the soil as soluble phosphate on 16 September 2006. The CP fertilization is the combination of C and P fertilizations. Each point in the x axis represents a P budget change at the specific time, with the size change in all P pools equal to zero (C fertilization) or the added P (1139.7 mg P m−2, P and CP fertilization). The change in a specific P pool at any given time is equal to the total change in related P fluxes since the fertilization (e.g., the plant P pool change relates to plant P uptake and P litterfall, the labile Pi pool change relates to P adsorption (and P absorption) (Fig. 1), the Po in the fast SOM pool change relates to litter and fast SOM decomposition, and so on).
The changes in the model P pools after CO2, P, or CP fertilizations further illustrated the effects of Pi exchange schemes on ecosystem responses under varying soil P availability (Fig. 7). In the CO2 fertilization experiment, the chronic increase of CO2 led to increases in plant biomass P at all study sites in all three models (Fig. 7, top row). The concurrent increases in plant P pools were compensated for by decreases in labile and sorbed Pi as well as Po in the microbial pool (fast SOM). At the high-P BBR site, the increases in plant P (631.4 ± 1.4 mg P m−2), litter P (107.8 ± 0.8 mg P m−2), and slow Po in SOM (62.8 ± 0.3 mg P m−2) were similar in all models, and the mobilization from soil exchangeable Pi (−417.4 ± 16.1 mg P m−2) and fast Po SOM (−354.2 ± 2.5 mg P m−2) contributed similarly to P sources. Conversely, at the P-poor LUE site, dbLang simulated a significantly higher plant P increase (188.3 mg P m−2) than siLang (69.5 mg P m−2) and 4pool (18.5 mg P m−2), due to its stronger capacity to mineralize P from the microbial P pool. dbLang can maintain a much higher SOM pool in topsoil (Fig. 3a), as Psol is better buffered under low soil Pi (Fig. 2b) compared with siLang; thus, more P can be mineralized under eCO2.
In the P fertilization experiments, the fate of added P largely differed between siLang and dbLang, as the added P was preferably and quickly transferred to Psorb in dbLang compared with siLang (Fig. 7, bottom row).
In the CP fertilization experiments (Fig. 7, middle row), plant P did not gain more P at high- and moderate-P sites (BBR and VES) compared to the C fertilization, indicating both sites might not be P limited under eCO2. Surprisingly, microbes (fast SOM) also did not benefit from P addition on top of eCO2 at BBR and VES, as most added P was transferred to the soil Pi pools. However, at the low-P LUE site (Fig. 7, last three columns), the combination of C and P fertilization produced higher plant P increases (928.5, 1202.3, and 971.1 mg P m−2 for 4pool, dbLang and siLang, respectively) than P fertilization alone in all three models, inferring a very strong P limitation on C sequestration at the low-P LUE site.
4.1 Model representation of soil Pi cycling and Langmuir sorption
The majority of terrestrial biosphere models (TBMs) describe the soil inorganic P (Pi) cycling processes with a similar structure of pools and fluxes (Fig. 1a or c), and they mostly describe the key soil Pi exchange process, i.e., the (ad)sorption and desorption between soil solution and matrix, using the Langmuir isotherm. In this study, we have shown that the values of Langmuir parameters in most TBMs, namely maximum P sorption capacity (Smax; Eq. 1) and the half-saturation Langmuir coefficient (Km; Eq. 1), largely differ from those reported in the P sorption batch experiments (Table 2). This disagreement between TBMs and experiments leads to much lower exchangeable soil Pi (Plab and Psorb) content in TBMs than experiments under the same soluble Pi (Psol) conditions (Fig. 2a). This is in line with the much higher partition coefficient (kp; Eq. 2) values in most TBMs compared with experiments (Table 2). Additionally, the reported Smax values have a comparable size to the total soil Pi in experiments (Fig. S1), indicating that most of the soil-associated Pi could be exchanged with the soil solution at a certain point. This implies that the Langmuir isotherm can describe not only the fast exchange between Psol and Plab but also the slower exchange with Psorb. This hypothesis is supported by the classic sorption model of Barrow (Barrow, 1978, 1983) and the isotopic exchange kinetics conceptual model (Fardeau, 1995; Frossard and Sinaj, 1997; Morel et al., 2000) that Pi ions located in the soil matrix are distributed along a continuum of solubility, with some being in rapid equilibrium with Pi ions in soil solution and some being in slow equilibrium.
Following the concept of the soil P solubility continuum, we have developed the double-surface Langmuir isotherm (dbLang; Fig. 1b, Eq. 3) in the QUINCY TBM and parameterized it with batch sorption experiment data. The double-surface Langmuir isotherm simulated a higher P-buffering capacity than the single-surface Langmuir isotherm (siLang) when P is removed from the soil (Fig. 2b), which is in agreement with the experimental results of Roberts and Johnston (2015). By comparing dbLang with the conventional siLang model and a special four-Pi-pool structure of siLang (4pool model, used in Zhu et al., 2016, 2019), we further investigated the effects of different sorption–desorption schemes on soil P under the QUINCY TBM framework (Fig. 3). The model performance in simulating the relationship between soil labile and sorbed Pi pools (Lab-to-Exchangeable P) has been improved by dbLang at our study sites of varying soil P stocks, soil texture, and stoichiometry (Lang et al., 2017; Yu et al., 2020b). Such an improvement of dbLang with respect to reproducing the Lab-to-Exchangeable P ratio much better captures the vertical patterns of soil inorganic pools (Figs. 3d, e, f), which is also supported by statistical analysis that the measured soil P profiles were slightly better reproduced (Tables 3, S1). This was not simply caused by improvements in modeling the individual labile or sorbed Pi pool but rather by a better representation of the Pi exchange among Psol, Plab, and Psorb, as such an improvement is independent of site conditions and model parameterization (Figs. 3, S7). Additionally, the siLang and dbLang models in this study shared the same set of QUINCY parameters; therefore, they had the same model complexity but differed in model performance. However, the new scheme did require more input than other TBMs (listed in Table 2), as the new parameterizations were dependent on soil texture, pH, and extractable Al or Fe, whereas most other TBMs use prescribed values.
In this study, we have included the Hedley soil P data as part of the model validation, which, to our knowledge, has seldom been done before, although the Hedley soil P data (Yang and Post, 2011; Yang et al., 2013) have been widely used as initialization data for TBMs. The depth-explicit and quantitative evaluation of model Pi pools with field measurements provides us a unique tool to diagnose different sorption–desorption schemes, and it warrants future applications in model–data comparison or model intercomparison studies.
4.2 Model performance and confidence
We have shown that dbLang performed better than siLang (and 4pool) in reproducing the measured soil Pi pools and foliar P content (Figs. 3, 4; Table 3). Several observations suggest that the novel dbLang model produced more realistic GPP and vegetation C patterns, although there is no direct evidence. First of all, Lang et al. (2017) found that there are no trends in the measured tree heights nor stand biomass along our soil P gradient (Table 1). As all sites are unmanaged beech stands with a similar age structure, we can assume that GPP and vegetation C should also be similar between the sites in the absence of nutrient limitation. This was better reproduced using dbLang than siLang, as less P limitation is simulated using dbLang. Secondly, studies have shown that biological processes dominate the C–P interactions in P-poor beech forests (Bünemann et al., 2016; Pistocchi et al., 2018); this was supported by the sensitivity results of only dbLang (Fig. 5, Table S3), whereas slow sorption/desorption process dominated GPP and vegetation C regardless of P availability in siLang. Most importantly, siLang overestimated Plab and Psorb in topsoil but still greatly underestimated the plant productivity and biomass at low-P sites (COM and LUE). Collectively, these findings suggest that a double-surface Langmuir model of Pi sorption–desorption better described forest C and nutrient dynamics at these sites than the conventional single-surface Langmuir model.
Yang et al. (2014) used the siLang scheme to study P cycling in P-limited tropical forests. They showed that a doubled rate of P transfer from Psorb to Plab leads to similar increases in plant productivity and biomass as a doubled P mineralization rate. This is in line with our sensitivity analysis of siLang, showing that slow sorption/desorption of P has similar impacts to SOM turnover on GPP and plant biomass (Fig. 5, Table S3). However, this seems unlikely in tropical forest sites depleted of soil Pi, and we argue that a dbLang model could also better capture such processes in tropical forest ecosystems.
From the perspective of Pi cycling, the parameterization of linear P exchange between Plab and Psorb in siLang lacked clear foundations and experimental evidence; hence, it largely differed among TBMs (Helfenstein et al., 2020). Similarly, we have shown that the exchange between Psol and Plab in most TBMs also largely varies and deviates from the reported ranges of experiments (Table 2). Most importantly, the assumption that Psol only exchanges with Plab has been heavily questioned by experimentalists (Helfenstein et al., 2020; Morel et al., 2000), and it also differs from earlier models (Barrow, 1983; Devau et al., 2009; van der Zee and Gjaltema, 1992). The double-surface Langmuir isotherm much better represents the conceptual sorption–desorption scheme that is supported by experimental data (Frossard et al., 2000; Frossard and Sinaj, 1997; Fardeau, 1995), and it also implicitly considers some slower Pi exchange processes that are currently ignored in TBMs, such as chelation and dissolution/precipitation.
4.3 Ecosystem responses to perturbations
The different Pi sorption–desorption schemes have not only led to different simulated Pi pool sizes but have also caused varying ecosystem responses to elevated CO2 and P addition (Figs. 6, 7). The main difference between siLang and dbLang was the speed and extent of exchange between the soluble/labile and sorbed Pi pools. The added P was quickly transferred to the Plab in both models, but the speed of Pi transfer to Psorb was much faster in dbLang. This was because Pi directly transferred from Psol to Psorb in dbLang, whereas the transfer to Psorb only occurred from Plab and at a much slower rate in siLang. As a consequence, Psorb in dbLang stored more P after P addition, and it also released more P under higher CO2 concentrations and elevated plant P demand. The fast transfer of P from Psol to Plab in both models is supported by evidence from 33P tracer studies showing that the radioactivity of Psol and Plab converged quickly (<3 months) after 33P tracer addition (Pistocchi et al., 2018). However, the speed and extent of transfer to Psorb cannot be easily confirmed with isotope signals because both 33P and 32P have short half-lives, but it is estimated to vary from days to weeks (Buehler et al., 2002; Helfenstein et al., 2021). Nevertheless, the mathematical and conceptual descriptions of isotopic exchange kinetics tend to support the dbLang model in that the P transfer to Psorb took place at a timescale of months rather than years in acidic soils (Bünemann et al., 2016; Frossard and Sinaj 1997; Helfenstein et al., 2020). Hou et al. (2019), using a data assimilation approach, also concluded that P transfer to Psorb might happen at a much faster rate than the conventional TBM parameter values suggest.
Our advance in capturing soil Pi exchange has altered the responses of QUINCY to changing P availability, particularly at low-P sites. The main difference in the soil Pi responses to P additions between siLang (also 4pool) and dbLang is that the novel dbLang model can store or release more P from the sorbed Pi pool at a faster rate than siLang. Particularly, at sites with high P stress (e.g., LUE), a further increase in P stress (e.g., CO2 fertilization) led to an increased P mineralization in dbLang rather than increased P desorption in siLang (Fig. 7), as dbLang can establish a much larger (implicit) microbial pool (fast SOM) in the topsoil to mineralize P (Fig. 3a). It was confirmed in the EucFACE (Eucalyptus Free Air CO2 Enrichment) experiment that both N and P mineralization increased by as much as 200 % under eCO2 (Hasegawa et al., 2016). Additionally, evidence from isotopic studies has shown that biological processes, rather than geochemical processes, are dominant in both topsoil and subsoil of the P-poor LUE site (Pistocchi et al., 2018; Bünemann et al., 2016).
4.4 Limitations and future directions
The novel dbLang model much better represented soil Pi exchange and, thus, improved the C–P interactions in QUINCY, but there was a caveat when the P stress was high. At the P-poor site (LUE), the GPP and vegetation C in dbLang were almost twice as high as those in siLang (Fig. S2a, c). However, such a huge release of P stress by dbLang was still not enough for LUE to reach similar plant productivity and biomass values to BBR or VES, as indicated by field evidence (Lang et al., 2017). In ecosystems with low soil P or high P stress, CO2 fertilization enhances the organic P cycling processes, such as root exudation, phosphatase production, and microbial P mining (Ellsworth et al., 2017; Jiang et al., 2020; Lang et al., 2017; Pistocchi et al., 2020). Such responses in SOM cycling have not yet been implemented in QUINCY, leading to much lower GPP and plant biomass values at the low-P site than at other sites. These mechanisms have also not been described in other TBMs, leading to poor model performance in low-P ecosystems, e.g., Amazon forests (Fleischer et al., 2019) and Eucalyptus forests (Medlyn et al., 2016). Recent developments in soil models/modules have endeavored to improve the model description of SOM cycling by including parameters such as organomineral association process, explicit microbial dynamics, enzyme dynamics or allocation, and mycorrhizal association (Huang et al., 2021; Yu et al., 2020a; Ahrens et al., 2020; Wutzler et al., 2017; Tang and Riley, 2014; Sulman et al., 2014; Wang et al., 2013). We believe that coupling the novel dbLang scheme with a more mechanistic representation of SOM cycling will open the door to model the different forest ecosystem P cycling strategies (Lang et al., 2017) as well as to simulate the responses of low-P ecosystems to elevated CO2 (Jiang et al., 2020).
In this study, we first reviewed the implementation of the soil Pi exchange process in terrestrial biosphere models and compared the model implementations of P sorption with batch sorption experiment data. We found that the parameterizations used by most TBMs strongly underestimate the soil's P sorption capacity and overestimate the half-saturation Langmuir coefficient compared with the experimental data. In the QUINCY model, such a formulation leads to a much lower soil P binding capacity in TBMs than in reality, causing the unrealistically large constraint of a slow Pi exchange process on GPP and plant biomass, regardless of the actual soil P availability. We presented a novel model scheme, based on a double-surface Langmuir isotherm, to describe the soil Pi exchange in better accordance with data from sorption experiments. This model parameterization better simulated the measured soil Pi pools and the GPP and plant C patterns of our study sites. It also better reproduced the topsoil SOM pools at the low-P site, thereby better simulating the responses of P pools/fluxes to elevated CO2 than conventional TBMs. Thus, the novel double-surface Langmuir approach can serve as a better modeling tool to understand the ecosystem response to global change.
The scientific part of the code is available under the GPL v3 license. The scientific code of QUINCY relies on software infrastructure from the MPI-ESM environment, which is subject to the MPI-M Software License Agreement in its most recent form. The source code is available online (QUINCY model, https://doi.org/10.17871/quincy-model-2019, Zaehle et al., 2019), but its access is restricted to registered users. Readers interested in running the model should request a username and password from the corresponding authors or via the Git repository.
The data in the literature review are available upon request from the corresponding author.
The supplement related to this article is available online at: https://doi.org/10.5194/bg-20-57-2023-supplement.
LY designed the study. LY and SZ formulated the paper outline. LY performed the literature review, model development, and analyses. SC, LY, and SZ developed the QUINCY model that forms the basis of the analysis in this paper. All authors contributed to writing the paper.
At least one of the (co-)authors is a member of the editorial board of Biogeosciences. The peer-review process was guided by an independent editor, and the authors also have no other competing interests to declare.
Publisher’s note: Copernicus Publications remains neutral with regard to jurisdictional claims in published maps and institutional affiliations.
Lin Yu was supported by the Swedish government-funded “Strategic Research Area Biodiversity and Ecosystems in a Changing Climate” (BECC) program. Silvia Caldararu was supported by the European Research Council (ERC) under the European Union's Horizon 2020 “Research and Innovation” program (QUINCY; grant no. 647204). The authors are grateful to Friederike Lang, Jaane Krüger, and other co-workers from the German Research Foundation (DFG) priority research program “Ecosystem Nutrition” (SPP1685), for measuring and sharing the data, and to Jan Engel, for technical assistance with developing the code.
The article processing charges for this open-access publication were covered by the Max Planck Society.
This paper was edited by Aninda Mazumdar and reviewed by two anonymous referees.
Ahrens, B., Guggenberger, G., Rethemeyer, J., John, S., Marschner, B., Heinze, S., Angst, G., Mueller, C. W., Kögel-Knabner, I., Leuschner, C., Hertel, D., Bachmann, J., Reichstein, M., and Schrumpf, M.: Combination of energy limitation and sorption capacity explains 14C depth gradients, Soil Biol. Biochem., 148, 107912, https://doi.org/10.1016/j.soilbio.2020.107912, 2020.
Barrow, N. J.: The description of phosphate adsortion curves, J. Soil Sci., 29, 447–462, 1978.
Barrow, N. J.: A mechanistic model for describing the sorption and desorption of phosphate by soil, J. Soil Sci., 34, 733–750, 1983.
Brahney, J., Mahowald, N., Ward, D. S., Ballantyne, A. P., and Neff, J. C.: Is atmospheric phosphorus pollution altering global alpine Lake stoichiometry?, Global Biogeochem. Cy., 29, 1369–1383, https://doi.org/10.1002/2015gb005137, 2015.
Buehler, S., Oberson, A., Rao, I. M., Friesen, D. K., and Frossard, E.: Sequential phosphorus extraction of a 33P-labeled oxisol under contrasting agricultural systems, Soil Sci. Soc. Am. J., 66, 868–877, 2002.
Bünemann, E. K., Augstburger, S., and Frossard, E.: Dominance of either physicochemical or biological phosphorus cycling processes in temperate forest soils of contrasting phosphate availability, Soil Biol. Biochem., 101, 85–95, https://doi.org/10.1016/j.soilbio.2016.07.005, 2016.
Chien, C.-T., Mackey, K. R. M., Dutkiewicz, S., Mahowald, N. M., Prospero, J. M., and Paytan, A.: Effects of African dust deposition on phytoplankton in the western tropical Atlantic Ocean off Barbados, Global Biogeochem. Cy., 30, 716–734, https://doi.org/10.1002/2015gb005334, 2016.
Devau, N., Cadre, E. L., Hinsinger, P., Jaillard, B., and Gérard, F.: Soil pH controls the environmental availability of phosphorus: Experimental and mechanistic modelling approaches, Appl. Geochem., 24, 2163–2174, https://doi.org/10.1016/j.apgeochem.2009.09.020, 2009.
Du, E., Terrer, C., Pellegrini, A. F. A., Ahlström, A., van Lissa, C. J., Zhao, X., Xia, N., Wu, X., and Jackson, R. B.: Global patterns of terrestrial nitrogen and phosphorus limitation, Nat. Geosci., 13, 221–226, https://doi.org/10.1038/s41561-019-0530-4, 2020.
Ellsworth, D. S., Anderson, I. C., Crous, K. Y., Cooke, J., Drake, J. E., Gherlenda, A. N., Gimeno, T. E., Macdonald, C. A., Medlyn, B. E., Powell, J. R., Tjoelker, M. G., and Reich, P. B.: Elevated CO2 does not increase eucalypt forest productivity on a low-phosphorus soil, Nat. Clim. Change, 7, 279–282, https://doi.org/10.1038/nclimate3235, 2017.
Elser, J. J., Bracken, M. E. S., Cleland, E. E., Gruner, D. S., Harpole, W. S., Hillebrand, H., Ngai, J. T., Seabloom, E. W., Shurin, J. B., and Smith, J. E.: Global analysis of nitrogen and phosphorus limitation of primary producers in freshwater, marine and terrestrial ecosystems, Ecol. Lett., 10, 1135–1142, https://doi.org/10.1111/j.1461-0248.2007.01113.x, 2007.
Fardeau, J. C.: Dynamics of phosphate in soils. An isotopic outlook, Fert. Res., 45, 91–100, https://doi.org/10.1007/BF00790658, 1995.
Fernández-Martínez, M., Vicca, S., Janssens, I. A., Sardans, J., Luyssaert, S., Campioli, M., Chapin Iii, F. S., Ciais, P., Malhi, Y., Obersteiner, M., Papale, D., Piao, S. L., Reichstein, M., Rodà, F., and Peñuelas, J.: Nutrient availability as the key regulator of global forest carbon balance, Nat. Clim. Change, 4, 471–476, https://doi.org/10.1038/nclimate2177, 2014.
Fleischer, K., Rammig, A., De Kauwe, M. G., Walker, A. P., Domingues, T. F., Fuchslueger, L., Garcia, S., Goll, D. S., Grandis, A., Jiang, M., Haverd, V., Hofhansl, F., Holm, J. A., Kruijt, B., Leung, F., Medlyn, B. E., Mercado, L. M., Norby, R. J., Pak, B., von Randow, C., Quesada, C. A., Schaap, K. J., Valverde-Barrantes, O. J., Wang, Y.-P., Yang, X., Zaehle, S., Zhu, Q., and Lapola, D. M.: Amazon forest response to CO2 fertilization dependent on plant phosphorus acquisition, Nat. Geosci., 12, 736–741, https://doi.org/10.1038/s41561-019-0404-9, 2019.
Frossard, E. and Sinaj, S.: The Isotope Exchange Kinetic Technique: A Method to Describe the Availability of Inorganic Nutrients, Applications to K, P, S and Zn, Isot. Environ. Health S., 34, 61–77, https://doi.org/10.1080/10256019808036360, 1997.
Frossard, E., Condron, L. M., Oberson, A., Sinaj, S., and Fardeau, J. C.: Processes governing phosphorus availability in temperate soils, J. Environ. Qual., 29, 15–23, https://doi.org/10.2134/jeq2000.00472425002900010003x, 2000.
Frossard, E., Achat, D. L., Bernasconi, S. M., Fardeau, J.-c., Jansa, J., Morel, C., Randriamanantsoa, L., Sinaj, S., and Oberson, A.: The Use of Tracers to Investigate Phosphate Cycling in Soil – Plant Systems, in: Phosphorus in Action Biological Processes in Soil Phosphorus Cycling, edited by: Bünemann, E., Oberson, A., and Frossard, E., Soil Biology, Springer Berlin Heidelberg, Berlin, Heidelberg, 59–91, https://doi.org/10.1007/978-3-642-15271-9, 2011.
Goll, D. S., Brovkin, V., Parida, B. R., Reick, C. H., Kattge, J., Reich, P. B., Van Bodegom, P. M., and Niinemets, Ü.: Nutrient limitation reduces land carbon uptake in simulations with a model of combined carbon, nitrogen and phosphorus cycling, Biogeosciences, 9, 3547–3569, https://doi.org/10.5194/bg-9-3547-2012, 2012.
Goll, D. S., Vuichard, N., Maignan, F., Jornet-Puig, A., Sardans, J., Violette, A., Peng, S., Sun, Y., Kvakic, M., Guimberteau, M., Guenet, B., Zaehle, S., Penuelas, J., Janssens, I., and Ciais, P.: A representation of the phosphorus cycle for ORCHIDEE (revision 4520), Geosci. Model Dev., 10, 3745–3770, https://doi.org/10.5194/gmd-10-3745-2017, 2017.
Hasegawa, S., Macdonald, C. A., and Power, S. A.: Elevated carbon dioxide increases soil nitrogen and phosphorus availability in a phosphorus-limited Eucalyptus woodland, Glob. Change Biol., 22, 1628–1643, https://doi.org/10.1111/gcb.13147, 2016.
Helfenstein, J., Pistocchi, C., Oberson, A., Tamburini, F., Goll, D. S., and Frossard, E.: Estimates of mean residence times of phosphorus in commonly considered inorganic soil phosphorus pools, Biogeosciences, 17, 441–454, https://doi.org/10.5194/bg-17-441-2020, 2020.
Helfenstein, J., Frossard, E., Pistocchi, C., Chadwick, O., Vitousek, P., and Tamburini, F.: Soil Phosphorus Exchange as Affected by Drying-Rewetting of Three Soils From a Hawaiian Climatic Gradient, Front. Soil Sci., 1, 738464, https://doi.org/10.3389/fsoil.2021.738464, 2021.
Holford, I. C. R. and Mattingly, G. E. G.: A model for the behaviour of labile phosphate in soil, Plant Soil, 44, 219–229, https://doi.org/10.1007/BF00016969, 1976.
Hou, E., Lu, X., Jiang, L., Wen, D., and Luo, Y.: Quantifying Soil Phosphorus Dynamics: A Data Assimilation Approach, J. Geophys. Res.-Biogeo., 124, 2159–2173, https://doi.org/10.1029/2018JG004903, 2019.
Huang, Y., Guenet, B., Wang, Y. L., and Ciais, P.: Global Simulation and Evaluation of Soil Organic Matter and Microbial Carbon and Nitrogen Stocks Using the Microbial Decomposition Model ORCHIMIC v2.0, Global Biogeochem. Cy., 35, e2020GB006836, https://doi.org/10.1029/2020GB006836, 2021.
Hubau, W., Lewis, S. L., Phillips, O. L., Affum-Baffoe, K., Beeckman, H., Cuní-Sanchez, A., Daniels, A. K., Ewango, C. E. N., Fauset, S., Mukinzi, J. M., Sheil, D., Sonké, B., Sullivan, M. J. P., Sunderland, T. C. H., Taedoumg, H., Thomas, S. C., White, L. J. T., Abernethy, K. A., Adu-Bredu, S., Amani, C. A., Baker, T. R., Banin, L. F., Baya, F., Begne, S. K., Bennett, A. C., Benedet, F., Bitariho, R., Bocko, Y. E., Boeckx, P., Boundja, P., Brienen, R. J. W., Brncic, T., Chezeaux, E., Chuyong, G. B., Clark, C. J., Collins, M., Comiskey, J. A., Coomes, D. A., Dargie, G. C., de Haulleville, T., Kamdem, M. N. D., Doucet, J.-L., Esquivel-Muelbert, A., Feldpausch, T. R., Fofanah, A., Foli, E. G., Gilpin, M., Gloor, E., Gonmadje, C., Gourlet-Fleury, S., Hall, J. S., Hamilton, A. C., Harris, D. J., Hart, T. B., Hockemba, M. B. N., Hladik, A., Ifo, S. A., Jeffery, K. J., Jucker, T., Yakusu, E. K., Kearsley, E., Kenfack, D., Koch, A., Leal, M. E., Levesley, A., Lindsell, J. A., Lisingo, J., Lopez-Gonzalez, G., Lovett, J. C., Makana, J.-R., Malhi, Y., Marshall, A. R., Martin, J., Martin, E. H., Mbayu, F. M., Medjibe, V. P., Mihindou, V., Mitchard, E. T. A., Moore, S., Munishi, P. K. T., Bengone, N. N., Ojo, L., Ondo, F. E., Peh, K. S. H., Pickavance, G. C., Poulsen, A. D., Poulsen, J. R., Qie, L., Reitsma, J., Rovero, F., Swaine, M. D., Talbot, J., Taplin, J., Taylor, D. M., Thomas, D. W., Toirambe, B., Mukendi, J. T., Tuagben, D., Umunay, P. M., van der Heijden, G. M. F., Verbeeck, H., Vleminckx, J., Willcock, S., Wöll, H., Woods, J. T., and Zemagho, L.: Asynchronous carbon sink saturation in African and Amazonian tropical forests, Nature, 579, 80–87, https://doi.org/10.1038/s41586-020-2035-0, 2020.
Jiang, M., Medlyn, B. E., Drake, J. E., Duursma, R. A., Anderson, I. C., Barton, C. V. M., Boer, M. M., Carrillo, Y., Castañeda-Gómez, L., Collins, L., Crous, K. Y., De Kauwe, M. G., dos Santos, B. M., Emmerson, K. M., Facey, S. L., Gherlenda, A. N., Gimeno, T. E., Hasegawa, S., Johnson, S. N., Kännaste, A., Macdonald, C. A., Mahmud, K., Moore, B. D., Nazaries, L., Neilson, E. H. J., Nielsen, U. N., Niinemets, Ü., Noh, N. J., Ochoa-Hueso, R., Pathare, V. S., Pendall, E., Pihlblad, J., Piñeiro, J., Powell, J. R., Power, S. A., Reich, P. B., Renchon, A. A., Riegler, M., Rinnan, R., Rymer, P. D., Salomón, R. L., Singh, B. K., Smith, B., Tjoelker, M. G., Walker, J. K. M., Wujeska-Klause, A., Yang, J., Zaehle, S., and Ellsworth, D. S.: The fate of carbon in a mature forest under carbon dioxide enrichment, Nature, 580, 227–231, https://doi.org/10.1038/s41586-020-2128-9, 2020.
Jonard, M., Augusto, L., Hanert, E., Achat, D. L., Bakker, M. R., Morel, C., Mollier, A., and Pellerin, S.: Modeling forest floor contribution to phosphorus supply to maritime pine seedlings in two-layered forest soils, Ecol. Model., 221, 927–935, https://doi.org/10.1016/j.ecolmodel.2009.12.017, 2010.
Jonard, M., Fürst, A., Verstraeten, A., Thimonier, A., Timmermann, V., Potočić, N., Waldner, P., Benham, S., Hansen, K., Merilä, P., Ponette, Q., de la Cruz, A. C., Roskams, P., Nicolas, M., Croisé, L., Ingerslev, M., Matteucci, G., Decinti, B., Bascietto, M., and Rautio, P.: Tree mineral nutrition is deteriorating in Europe, Glob. Change Biol., 21, 418–430, https://doi.org/10.1111/gcb.12657, 2015.
Lamarque, J.-F., Bond, T. C., Eyring, V., Granier, C., Heil, A., Klimont, Z., Lee, D., Liousse, C., Mieville, A., Owen, B., Schultz, M. G., Shindell, D., Smith, S. J., Stehfest, E., Van Aardenne, J., Cooper, O. R., Kainuma, M., Mahowald, N., McConnell, J. R., Naik, V., Riahi, K., and van Vuuren, D. P.: Historical (1850–2000) gridded anthropogenic and biomass burning emissions of reactive gases and aerosols: methodology and application, Atmos. Chem. Phys., 10, 7017–7039, https://doi.org/10.5194/acp-10-7017-2010, 2010.
Lamarque, J.-F., Kyle, G. P., Meinshausen, M., Riahi, K., Smith, S. J., van Vuuren, D. P., Conley, A. J., and Vitt, F.: Global and regional evolution of short-lived radiatively-active gases and aerosols in the Representative Concentration Pathways, Climatic Change, 109, 191, https://doi.org/10.1007/s10584-011-0155-0, 2011.
Lang, F., Krüger, J., Amelung, W., Willbold, S., Frossard, E., Bünemann, E. K., Bauhus, J., Nitschke, R., Kandeler, E., Marhan, S., Schulz, S., Bergkemper, F., Schloter, M., Luster, J., Guggisberg, F., Kaiser, K., Mikutta, R., Guggenberger, G., Polle, A., Pena, R., Prietzel, J., Rodionov, A., Talkner, U., Meesenburg, H., von Wilpert, K., Hölscher, A., Dietrich, H. P., and Chmara, I.: Soil phosphorus supply controls P nutrition strategies of beech forest ecosystems in Central Europe, Biogeochemistry, 136, 5–29, https://doi.org/10.1007/s10533-017-0375-0, 2017.
LeBauer, D. S. and Treseder, K. K.: Nitrogen Limitation Of Net Primary Productivity In Terrestrial Ecosystems Is Globally Distributed, Ecology, 89, 371–379, https://doi.org/10.1890/06-2057.1, 2008.
Lloyd, J., Bird, M. I., Veenendaal, E. M., and Kruijt, B.: Should Phosphorus Availability Be Constraining Moist Tropical Forest Responses to Increasing CO2 Concentrations?, in: Global Biogeochemical Cycles in the Climate Systems, edited by: Schulze, E.-D., Heimann, M., Harrison, S., Holland, E., Lloyd, J., Prentice, I. C., and Schimel, D., Elsevier, New York, 95–114, https://doi.org/10.1016/b978-012631260-7/50010-8, 2001.
McGechan, M. B. and Lewis, D. R.: Sorption of Phosphorus by Soil, Part 1: Principles, Equations and Models, Biosyst. Eng., 82, 1–24, https://doi.org/10.1006/bioe.2002.0054, 2002.
McLeod, A. I.: Kendall Rank Correlation and Mann–Kendall Trend Test, R Package Version 2.2, CRAN [code], http://www.stats.uwo.ca/faculty/aim, 2011.
Medlyn, B. E., De Kauwe, M. G., Zaehle, S., Walker, A. P., Duursma, R. A., Luus, K., Mishurov, M., Pak, B., Smith, B., Wang, Y.-P., Yang, X., Crous, K. Y., Drake, J. E., Gimeno, T. E., Macdonald, C. A., Norby, R. J., Power, S. A., Tjoelker, M. G., and Ellsworth, D. S.: Using models to guide field experiments: a priori predictions for the CO2 response of a nutrient- and water-limited native Eucalypt woodland, Glob. Change Biol., 22, 2834–2851, https://doi.org/10.1111/gcb.13268, 2016.
Morel, C., Tunney, H., Plénet, D., and Pellerin, S.: Transfer of Phosphate Ions between Soil and Solution: Perspectives in Soil Testing, J. Environ. Qual., 29, 50–50, https://doi.org/10.2134/jeq2000.00472425002900010007x, 2000.
Penuelas, J., Fernández-Martínez, M., Vallicrosa, H., Maspons, J., Zuccarini, P., Carnicer, J., Sanders, T. G. M., Krüger, I., Obersteiner, M., Janssens, I. A., Ciais, P., and Sardans, J.: Increasing atmospheric CO2 concentrations correlate with declining nutritional status of European forests, Commun. Biol., 3, 125, https://doi.org/10.1038/s42003-020-0839-y, 2020.
Pistocchi, C., Mészáros, É., Tamburini, F., Frossard, E., and Bünemann, E. K.: Biological processes dominate phosphorus dynamics under low phosphorus availability in organic horizons of temperate forest soils, Soil Biol. Biochem., 126, 64–75, https://doi.org/10.1016/j.soilbio.2018.08.013, 2018.
Pistocchi, C., Mészáros, É., Frossard, E., Bünemann, E. K., and Tamburini, F.: In or Out of Equilibrium? How Microbial Activity Controls the Oxygen Isotopic Composition of Phosphate in Forest Organic Horizons With Low and High Phosphorus Availability, Front. Environ. Sci., 8, 564778, https://doi.org/10.3389/fenvs.2020.564778, 2020.
Roberts, T. L. and Johnston, A. E.: Phosphorus use efficiency and management in agriculture, Resour. Conserv. Recycl., 105, 275–281, https://doi.org/10.1016/j.resconrec.2015.09.013, 2015.
Saltelli, A., Tarantola, S., Campolongo, F., and Ratto, M.: Sensitivity analysis in practice: a guide to assessing scientific models, Wiley Online Library, ISBN 0-470-87093-1, 2004.
Shen, J., Lixing, Y., Junling, Z. H. L., Zhaohai, B., Xinping, C. W. Z., and Fusuo, Z.: Phosphorus Dynamics: From Soil to Plant, Plant Physiol., 156, 997–1005, https://doi.org/10.1104/pp.111.175232, 2011.
Sulman, B. N., Phillips, R. P., Oishi, A. C., Shevliakova, E., and Pacala, S. W.: Microbe-driven turnover offsets mineral-mediated storage of soil carbon under elevated CO2, Nat. Clim. Change, 4, 1099, https://doi.org/10.1038/nclimate2436, 2014.
Sun, Y., Goll, D. S., Chang, J., Ciais, P., Guenet, B., Helfenstein, J., Huang, Y., Lauerwald, R., Maignan, F., Naipal, V., Wang, Y., Yang, H., and Zhang, H.: Global evaluation of the nutrient-enabled version of the land surface model ORCHIDEE-CNP v1.2 (r5986), Geosci. Model Dev., 14, 1987–2010, https://doi.org/10.5194/gmd-14-1987-2021, 2021.
Tang, J. and Riley, W. J.: Weaker soil carbon–climate feedbacks resulting from microbial and abiotic interactions, Nat. Clim. Change, 5, 56–60, https://doi.org/10.1038/nclimate2438, 2014.
Terrer, C., Jackson, R. B., Prentice, I. C., Keenan, T. F., Kaiser, C., Vicca, S., Fisher, J. B., Reich, P. B., Stocker, B. D., Hungate, B. A., Peñuelas, J., McCallum, I., Soudzilovskaia, N. A., Cernusak, L. A., Talhelm, A. F., Van Sundert, K., Piao, S., Newton, P. C. D., Hovenden, M. J., Blumenthal, D. M., Liu, Y. Y., Müller, C., Winter, K., Field, C. B., Viechtbauer, W., Van Lissa, C. J., Hoosbeek, M. R., Watanabe, M., Koike, T., Leshyk, V. O., Polley, H. W., and Franklin, O.: Nitrogen and phosphorus constrain the CO2 fertilization of global plant biomass, Nat. Clim. Change, 9, 684–689, https://doi.org/10.1038/s41558-019-0545-2, 2019.
Thum, T., Caldararu, S., Engel, J., Kern, M., Pallandt, M., Schnur, R., Yu, L., and Zaehle, S.: A new model of the coupled carbon, nitrogen, and phosphorus cycles in the terrestrial biosphere (QUINCY v1.0; revision 1996), Geosci. Model Dev., 12, 4781–4802, https://doi.org/10.5194/gmd-12-4781-2019, 2019.
Tiessen, H. and Moir, J. O.: Characterization of available P by sequential extraction, in: Carter MR, Gregorich EG (eds) Soil sampling and methods of analysis, CRC Press, Boca Raton, 293–306, 2008.
van der Zee, S. E. A. T. M. and Gjaltema, A.: Simulation of phosphate transport in soil columns, I. model development, Geoderma, 52, 87–109, https://doi.org/10.1016/0016-7061(92)90077-K, 1992.
Viovy, N.: CRUNCEP Version 7 – Atmospheric Forcing Data for the Community Land Model, Research Data Archive at the National Center for Atmospheric Research, Computational and Information Systems Laboratory [dataset], https://doi.org/10.5065/PZ8F-F017, 2018.
Wang, G., Post, W. M., and Mayes, M. A.: Development of microbial-enzyme-mediated decomposition model parameters through steady-state and dynamic analyses, Ecol. Appl., 23, 255–272, https://doi.org/10.1890/12-0681.1, 2013.
Wang, Y. P., Houlton, B. Z., and Field, C. B.: A model of biogeochemical cycles of carbon, nitrogen, and phosphorus including symbiotic nitrogen fixation and phosphatase production, Global Biogeochem. Cy., 21, 1–15, https://doi.org/10.1029/2006GB002797, 2007.
Wang, Y. P., Law, R. M., and Pak, B.: A global model of carbon, nitrogen and phosphorus cycles for the terrestrial biosphere, Biogeosciences, 7, 2261–2282, https://doi.org/10.5194/bg-7-2261-2010, 2010.
Wieder, W. R., Cleveland, C. C., Smith, W. K., and Todd-Brown, K.: Future productivity and carbon storage limited by terrestrial nutrient availability, Nat. Geosci., 8, 441–444, https://doi.org/10.1038/ngeo2413, 2015.
Wutzler, T., Zaehle, S., Schrumpf, M., Ahrens, B., and Reichstein, M.: Adaptation of microbial resource allocation affects modelled long term soil organic matter and nutrient cycling, Soil Biol. Biochem., 115, 322–336, https://doi.org/10.1016/j.soilbio.2017.08.031, 2017.
Yang, X. and Post, W. M.: Phosphorus transformations as a function of pedogenesis: A synthesis of soil phosphorus data using Hedley fractionation method, Biogeosciences, 8, 2907–2916, https://doi.org/10.5194/bg-8-2907-2011, 2011.
Yang, X., Post, W. M., Thornton, P. E., and Jain, A.: The distribution of soil phosphorus for global biogeochemical modeling, Biogeosciences, 10, 2525–2537, https://doi.org/10.5194/bg-10-2525-2013, 2013.
Yang, X., Thornton, P. E., Ricciuto, D. M., and Post, W. M.: The role of phosphorus dynamics in tropical forests – A modeling study using CLM-CNP, Biogeosciences, 11, 1667–1681, https://doi.org/10.5194/bg-11-1667-2014, 2014.
Yu, L., Zanchi, G., Akselsson, C., Wallander, H., and Belyazid, S.: Modeling the forest phosphorus nutrition in a southwestern Swedish forest site, Ecol. Model., 369, 88–100, https://doi.org/10.1016/j.ecolmodel.2017.12.018, 2018.
Yu, L., Ahrens, B., Wutzler, T., Schrumpf, M., and Zaehle, S.: Jena Soil Model (JSM v1.0; revision 1934): a microbial soil organic carbon model integrated with nitrogen and phosphorus processes, Geosci. Model Dev., 13, 783–803, https://doi.org/10.5194/gmd-13-783-2020, 2020a.
Yu, L., Ahrens, B., Wutzler, T., Zaehle, S., and Schrumpf, M.: Modeling Soil Responses to Nitrogen and Phosphorus Fertilization Along a Soil Phosphorus Stock Gradient, Front. Forest Glob. Change, 3, 543112, https://doi.org/10.3389/ffgc.2020.543112, 2020b.
Zaehle, S., Sitch, S., Smith, B., and Hatterman, F.: Effects of parameter uncertainties on the modeling of terrestrial biosphere dynamics, Global Biogeochem. Cy., 19, GB3020, https://doi.org/10.1029/2004GB002395, 2005.
Zaehle, S., Caldararu, S., Engel, J., Kern, M., Schnur, R., Thum, T., and Yu L.: QUINCY model, Max Planck Institute for Biogeochemistry [code], https://doi.org/10.17871/quincy-model-2019, 2019.
Zhu, Q., Riley, W. J., Tang, J., and Koven, C. D.: Multiple soil nutrient competition between plants, microbes, and mineral surfaces: model development, parameterization, and example applications in several tropical forests, Biogeosciences, 13, 341–363, https://doi.org/10.5194/bg-13-341-2016, 2016.
Zhu, Q., Riley, W. J., Tang, J., Collier, N., Hoffman, F. M., Yang, X., and Bisht, G.: Representing Nitrogen, Phosphorus, and Carbon Interactions in the E3SM Land Model: Development and Global Benchmarking, J. Adv. Model. Earth Syst., 11, 2238–2258, https://doi.org/10.1029/2018MS001571, 2019.