the Creative Commons Attribution 4.0 License.
the Creative Commons Attribution 4.0 License.
 | 06 Feb 2023
Nature and origin of variations in pelagic carbonate production in the tropical ocean since the mid-Miocene (ODP Site 927)
Thomas Westerhold
Heiko Pälike
Torsten Bickert
Karl-Heinz Baumann
Michal Kucera
Marine plankton is an important component of the global carbon cycle. Whereas the production and seafloor export of organic carbon produced by the plankton, the biological pump, has received much attention, the long-term variability in plankton calcification, controlling the carbonate counter pump, remains less well understood. However, it has been shown that changes in pelagic calcification (biological compensation) could affect the ocean's buffering capacity and thus regulate global carbon budget on geological timescales. Here we use Neogene pelagic sediments deposited on the Ceara Rise in the tropical Atlantic to characterize the variability in pelagic carbonate production with a focus on warm climates. A re-evaluation of published records of carbonate accumulation at the Ceara Rise reveals a systematic increase in sedimentation rates since the late Miocene, but the carbonate accumulation rate does not show a clear trend. Instead, we observe substantial orbital timescale variability in carbonate accumulation, combined with a trend towards less carbonate on average at sites located below 4 km, likely due to the effect of carbonate dissolution. To evaluate long-term changes against possible orbital-scale variability, we generated new high-resolution records of carbonate accumulation rate at Ocean Drilling Program (ODP) Site 927 across two Quaternary interglacials (MIS 5 and MIS 9), the Pliocene warm period (MIS KM5) and the Miocene Climatic Optimum (MCO). We observe that the highest carbonate accumulation rates occurred during the Pliocene but that each of the studied intervals was characterized by large-magnitude orbital variability. Prominent variations in carbonate accumulation prior to the Quaternary preservation cycles appear to follow Earth obliquity and eccentricity. These results imply that pelagic carbonate accumulation in the tropical ocean, buffered from large temperature changes, varied on orbital timescales. The magnitude of the orbital-scale variability was similar or even higher than the long-term mean differences among the studied intervals. Since preservation can be excluded as a driver of these changes prior to the Quaternary, the observed variations must reflect changes in the export flux of pelagic biogenic carbonate. We conclude that the overall carbonate production by pelagic calcifiers responded to local changes in light, temperature, and nutrients delivered by upwelling, which followed long orbital cycles, as well as to long-term shifts in climate and/or ocean chemistry. The inferred changes on both timescales were sufficiently large such that when extrapolated on a global scale, they could have played a role in the regulation of the carbon cycle and global climate evolution during the transition from the Miocene warm climates into the Quaternary icehouse.
- Article
(2393 KB) - Full-text XML
-
Supplement
(1590 KB) - BibTeX
- EndNote


The ocean plays a key role in the climate system as one of the major sinks for anthropogenic atmospheric CO2 (Landschützer et al., 2014). Most of the excess atmospheric carbon (CO2) is absorbed by the ocean as dissolved CO2, which becomes part of the seawater carbonate system and can be sequestered by the metabolic activity of marine organisms. A large part of the carbon sequestration is due to carbon fixation into organic matter by photosynthesis (Henson et al., 2012; Passow and Carlson, 2012; Sarmiento et al., 2004). However, next to the sequestration of CO2 by photosynthesis and export via the biological pump, marine organisms also participate in the global carbon cycle by carbonate biomineralization. Milliman (1993) estimated that today's marine carbonate production by organisms amounts to 5.3 GT yr−1, of which about a half is accounted for by pelagic calcifiers (2.4 GT yr−1). Since aragonite and high-Mg calcite are unstable and largely dissolve before deposition, the geologically relevant aspect of the pelagic biogenic carbonate production is mediated mainly by low-Mg calcite that may be variable but is mostly dominated by both planktic foraminifera and coccolithophores (Boudreau et al., 2018). The carbonate biomineralization, also termed the carbonate counter pump, leads in the short term (kyr) to the release of CO2 from seawater because it consumes alkalinity, but on long, geological timescales (Myr) it sequesters carbon from the dissolved volatile ocean–atmosphere reservoir into the more inert sedimentary reservoir. Manipulative experiments, ocean chemistry profiles, and numerical models all indicate that pelagic carbonate production is affected by a range of environmental parameters, such as temperature, nutrient availability or pCO2 (Feely, 2004; Gehlen et al., 2007). Therefore, a change in any of these parameters could impact the pelagic carbonate production, resulting in a process that Boudreau et al. (2018) termed biological compensation. In contrast to chemical compensation, where changes in ocean carbonate chemistry are compensated by dissolution of seafloor carbonate deposits, biological compensation refers to changes in ocean carbonate chemistry due to globally relevant shifts in carbonate biomineralization. For example, a decrease in global oceanic biomineralization would lead to an increase of alkalinity, which would cause an increase CO2 solubility and therefore lead to an increased capacity of the ocean to take up CO2 (Boudreau et al., 2018; Sarmiento and Gruber, 2006). Using a modelling approach, Boudreau et al. (2018) showed that a global carbonate productivity change by only 10 % would be sufficient for the process of biological compensation to affect the marine carbon cycle on timescales from years to millions of years.
For the process of biological compensation to play an important role in the global carbon cycle, it must be demonstrated that sufficiently large changes in global carbonate biomineralization occurred in the geological past. However, measuring changes in global biogenic carbonate production is difficult because productivity and biomineralization vary in space, and changes observed in individual records could be compensated by complementary shifts elsewhere in the ocean (Drury et al., 2021). In most parts of the ocean, climate change causes plankton assemblages to migrate, with biogeographic provinces expanding and contracting in pace with orbital cycles (Yasuhara et al., 2020). These processes should result mainly in the spatial reorganization of pelagic carbonate production, and as long as the forcing is cyclic, the effects should cancel out over time.
Beyond orbital timescales, understanding of changes in carbonate production are complicated by the confounding effects of biological and chemical compensation on carbonate content of deep-sea sediments (Boudreau et al., 2018). Nevertheless, the few existing continuous records indicate the presence of long-term shifts in carbonate production by a factor of 2 or more manifested, for example, as the late Miocene carbonate maximum (Lyle et al., 2019; Drury et al., 2021; Liebrand et al., 2016). Although there is abundant evidence for local changes in pelagic calcification and carbonate production, their spatial extent remains unknown, making it difficult to judge whether the local shifts may have resulted in globally significant biogeochemical response (Lyle et al., 2019; Drury et al., 2021).
Here we have investigated pelagic carbonate accumulation, as a proxy for production, in an equatorial location, where the plankton could not respond to the climate cycles by migration and where long-term changes in temperature, a key parameter likely affecting biomineralization, were buffered compared to higher latitudes. Low-magnitude tropical sea surface temperature (SST) variability in the Atlantic in the Pliocene and in the Miocene was reported by Herbert et al. (2016) and Curry et al. (1995). Since orbitally driven environmental change still affected the tropics, the Cenozoic tropical plankton represents a natural experiment where the tropical calcifying community responded to a number of orbital cycles and long-term changes in ocean chemistry, reflecting changing atmospheric CO2. Whilst these records cannot provide a direct answer to how much pelagic carbonate production changed globally, they can provide a first-order constraint on the amount of change in pelagic calcification that could occur due to changes in the constitution and/or abundance of the calcifiers on different timescales. We specifically decided to target intervals with warmer global climate states, providing potential analogues to gauge the amount of change in tropical pelagic carbonate production under a global warming scenario (Fig. 2), and the tropical Atlantic location allows us to complement records from the Pacific and South Atlantic (Lyle et al., 2019; Drury et al., 2021; Pälike et al., 2006a) to assess the spatial coherence of long term trends and the amount and nature of short-term variability.
Next to analysing long-term changes in carbonate accumulation, the existence of persistent orbital variability implies that new data will be required, characterizing the short-term response of the tropical pelagic carbonate production system. To this end, in the present study the changes in carbonate production through time have been studied in four intervals, occurring during four warm periods of the late Cenozoic: the marine isotopic stage (MIS) 5 (87.5 to 150.2 ka), the MIS 9 (276.4 to 370.3 ka), the MIS KM5 (3095.5 to 3307 ka) and the Miocene Climatic Optimum (MCO) (15 589.3 to 15 964.3 ka).
This approach allows us to evaluate long-term changes in pelagic carbonate production since the Mid-Miocene and at the same time to characterize the orbital-scale variability and determine if the orbital periodicity forcing carbonate production changed from the Miocene to present.
Time intervals
The MIS 5, as the last warmest and longest interglacial of the past 500 ka (Howard, 1997), with an abrupt glacial–interglacial transition (Howard, 1997; Müller and Kukla, 2004; Sirocko et al., 2005) is considered to be a good analogue for the actual warm Holocene (Howard, 1997; Kukla, 1997) and even a partial analogue for +1–2 ∘C scenarios because of polar temperatures 3 to 5 ∘C warmer than today and a sea level about 6.6 m higher than today (Clark and Huybers, 2009; Kopp et al., 2009). During this interglacial, Chalk et al. (2019) observed a change in the current circulation in the Atlantic Ocean, with an enhanced Antarctic Bottom Water (AABW) below 3400 m b.s.l. and well-ventilated, high-pH, and high [CO] water mass around 2200 m b.s.l. They also highlighted a correlation between the [CO] and the pCO2 in the West Atlantic during cold intervals, with an increase of the volume of the high dissolved inorganic carbon (DIC), low [CO] deep-water masses in the North Atlantic.
The MIS 9 in the equatorial Atlantic presents well-preserved sediment at a period known to be under high obliquity with a unique insolation signal. Stable oxygen isotope values are low during this period (low ice volume). It is one of the interglacials showing the highest pCO2 (around 300 ppm) and pCH4 (around 25 ppb) conditions in the late Pleistocene. This period is also one of the warmest, stablest and shortest interglacials, with a weak surface water ventilation (Past Interglacials Working Group of PAGES, 2016; Marino et al., 2014; Voelker et al., 2010).
The Pliocene warm period (PWP) MIS KM5 corresponds to a period with a similar orbital forcing to present day and an insolation distribution close to the modern one (Haywood et al., 2013). This interval (3.264–3.025 ka) is also described as a negative oxygen isotope slope and a sea level 21–23 m above the present-day one (Lunt et al., 2008, 2010; Naish et al., 2009; Pollard and DeConto, 2009) with a well-ventilated deep Atlantic Ocean (Bell et al., 2015). The temperature is 3 ∘C higher than pre-industrial values (Haywood et al., 2000; Lunt et al., 2010) and the CO2 concentration is close to the present value, i.e. 330–425 ppmv during the warm interglacials (Pagani et al., 2010; Seki et al., 2010), making it a good analogue for future climate (Ravelo and Wara, 2004) and an important period to understand the climate system (Lunt et al., 2010). Furthermore, this period is also described as being wetter than today (Leroy and Dupont, 1994; Dodson and Macphail, 2004), but the latitudinal distribution of the rainforest was close to the present day distribution (Salzmann et al., 2011).
The MCO corresponds to a period with an eccentricity-modulated precession δ18O signal and low global ice volume, featuring a Northern Hemisphere that is free of continental ice sheets, important 100 and 400 kyr orbital variability, and an Antarctic ice sheet that is smaller but more dynamic than today (De Vleeschouwer et al., 2017; Holbourn et al., 2007). Haq et al. (1987) highlighted the large sea level amplitude from 16 to 14 Ma, and the annual global temperature was 3 to 8 ∘C higher than today (Pound et al., 2012; You et al., 2009). The climate during the MCO is known to be correlated with atmospheric CO2 concentration changes (Foster et al., 2012), with CO2 concentration being generally lower than at present (Foster et al., 2012; Ruddiman, 2010; Zachos et al., 2008; Zachos, 2001a, b) but peaking at 16 Ma between 460 and 564 ppmv (Kürschner et al., 2008). Even if a decline in δ18O and δ13C at 16.9 Ma was suspected to be linked to increase of carbonate dissolution, a sign of strong changes in the carbon cycle (Holbourn et al., 2015), carbonate production appears to have been the main control of the CaCO3 record (Liebrand et al., 2016).
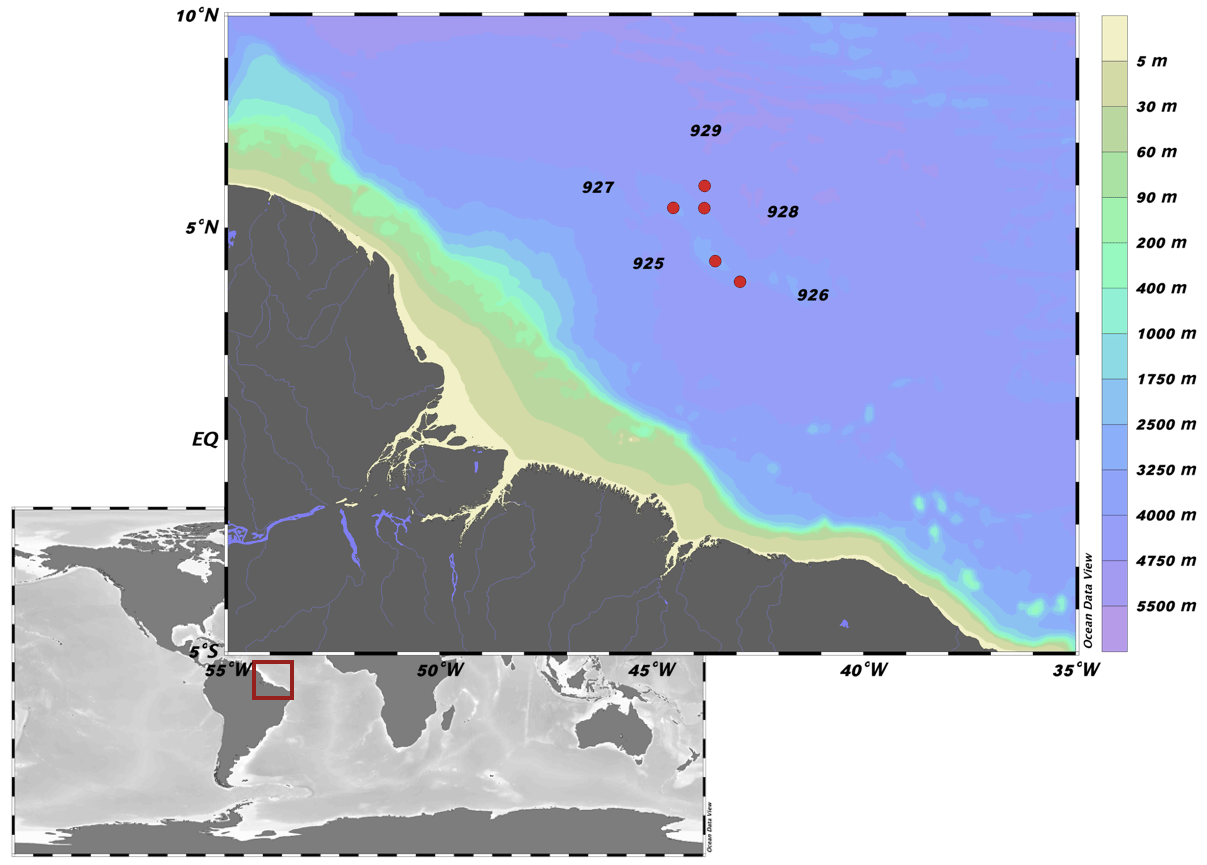
Figure 1Location of the material of this study at the Ceara Rise, ODP Leg 154 (Ocean Data View, Schlitzer, 2018).
2.1 Site location
Ceara Rise, located in the equatorial Atlantic Ocean, represents an ideal location to quantify the variability in tropical Atlantic pelagic carbonate production since the Miocene. This aseismic ridge rises several kilometres above the surrounding abyssal plain, well above the modern regional lysocline, located between 4100 and 4200 m b.s.l. (Frenz et al., 2006; Gröger et al., 2003a, b; Curry et al., 1995; Cullen and Curry, 1997; Bickert et al., 1997). The ridge is bathed by the shallower North Atlantic deep water (NADW) and the deeper Antarctic bottom water (AABW) (Rühlemann et al., 2001; Gröger et al., 2003b; Herrford et al., 2017), and the interface of the two water masses corresponds to the regional lysocline depth. Around the ridge, the average depth of the seafloor is at 4500 m b.s.l., but the Ceara Rise ridge rises by as much as 1900 m above the surrounding abyssal plain, with its top reaching the depth of 2600 m b.s.l. (Curry et al., 1995). This provides an opportunity to sample pelagic sediments that are largely unaffected by dissolution, and their accumulation therefore mainly reflects changes in pelagic carbonate production as suggested by Brummer and van Eijden (1992). The Ceara Rise (Fig. 1) has been visited by Ocean Drilling Program (ODP) Leg 154 (Curry et al., 1995), recovering a transect of sediment sequences ranging into the Eocene that are rich in carbonate and show prominent cycles due to variable input of clastic material from the Amazon fan (Shackleton et al., 1999; Bickert et al., 1997; Shackleton and Crowhurst, 1997). The cycles are reflected in sediment physical properties, such as colour or magnetic susceptibility, and because of the very good recovery and repeated coring at the same sites, continuous spliced records could be produced that facilitated the development of orbitally tuned age models (Shackleton et al., 1999; Zeeden et al., 2013; Wilkens et al., 2017; Shackleton and Crowhurst, 1997), a prerequisite for the quantification of carbonate accumulation. Since all high-resolution Neogene records of carbonate accumulation (Drury et al., 2021; Lyle et al., 2019), including those from the Ceara Rise (Curry et al., 1995; King et al., 1997) show a large orbital-scale variability, hinting at prominent orbital-scale variability in pelagic carbonate production, next to a compilation and re-evaluation of existing carbonate records, the selected time slices had to be newly sampled and analysed at higher resolution.
2.2 Compilation of existing carbonate data from ODP Leg 154
The combination of the availability of high-resolution age models and good carbonate preservation make the Ceara Rise a model region to study pelagic carbonate production and preservation. We compiled existing data on carbonate content (CaCO3 %) at all the Leg 154 sites since the Miocene (Curry et al., 1995; Frenz et al., 2006; King et al., 1997) and used those to calculate carbonate accumulation rates (CaCO3 AR). The few other existing datasets on carbonate content from the Ceara Rise sites (e.g. Tiedemann and Franz, 1997) could not be used because some of the information needed to calculate accumulation rates or the original samples ID and depths was not available.
The carbonate content data were combined with dry bulk density (DBD) and sedimentation rate (SR) to calculate the CaCO3 AR as follows.
Following the approach by Lyle (2003), we first derived for each site a calibration between the gamma ray attenuation (GRA) bulk density and DBD using data from Curry et al. (1995). The resulting site-specific calibrations (Fig. S1) were then applied on GRA bulk density values, which were extracted from Curry et al. (1995), and interpolated to the position of the analysed samples using linear interpolation. This yielded DBD values between 0.40 and 1.64 g cm−3. For two samples, the calibration returned negative DBD (at 129.62 and 135.47 mcd) due to two anomalous GRA values below 1. In these cases, we used the DBD of the nearest point instead.
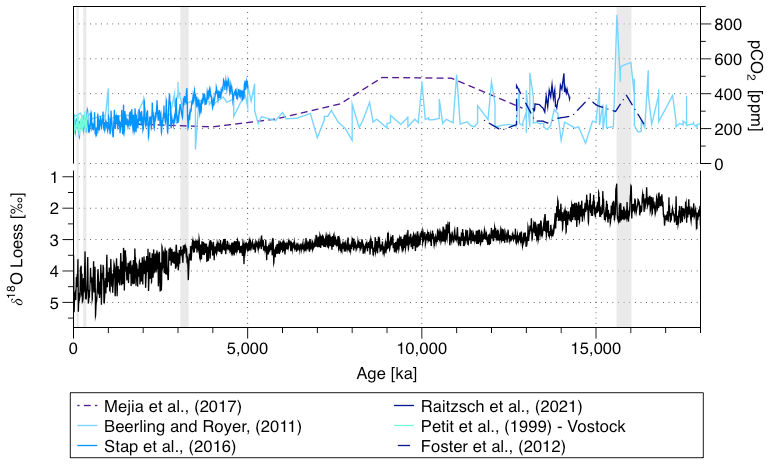
Figure 2Oxygen stable isotopes (δ18O) shown as a smoothed record (Loess) (Westerhold et al., 2020) and pCO2 (Mejía et al., 2017; Beerling and Royer, 2011; Stap et al., 2016; Raitzsch et al., 2021; Foster et al., 2012; Petit et al., 1999) over the last 18 000 kyr and sampled intervals (shadows).
2.3 Context and sampling plan
We sampled the record at Site 927 at high resolution for the four periods of interest (Fig. 2), making sure that for each interval both the interglacial and the flanking glacial in the Quaternary and at least two full eccentricity cycles during the Pliocene and Miocene have been covered. These four intervals cover a large range of global temperature and CO2 values (Fig. 2). We selected Site 927 because it is one of the two shallow sites of Leg 154, located well above the lysocline at present (Frenz et al., 2005; Curry et al., 1995; Bickert et al., 1997), and because numerous palaeoceanographic datasets and carbonate measurements exist for this site (e.g. Pälike et al., 2006a; Bickert et al., 1997; Frenz et al., 2006; Gröger et al., 2003b; King et al., 1997; Curry and Cullen, 1997). The site appears generally less affected by slumps or turbidites than the four others, which were not observed in the four studied intervals (sampled out of the slumps and turbidites reported lithostratigraphic units) (Curry et al., 1995). The sampling was guided by the Wilkens et al. (2017) age model for the samples from 0 to 14 Ma and by the Shackleton et al. (1999) age model for the samples from 14 to 16.5 Ma. Considering the typical mixing depth of −10 cm in deep-sea sediments, we sampled at 5 cm in the Quaternary and 10 cm in the Neogene, which in both cases provides sub-orbital resolution. The resolution was higher in the Quaternary because the peak interglacial warmth periods are short (<10 kyr for MIS 5e; Stolz and Baumann, 2010; Müller and Kukla, 2004; Sirocko et al., 2005), and we wanted to cover these using multiple samples. In total, we collected and analysed 139 samples for the two Quaternary intervals, 72 samples for the Pliocene and 50 samples for the Miocene.
2.4 Stable isotopes analyses
We performed stable isotopes analyses (δ18O and δ13C) at Bremen University, using a Thermo Fisher Scientific MAT 253plus gas isotope ratio mass spectrometer with Kiel IV automated carbonate preparation device. This gives δ18O values with a standard deviation of house standard (Solnhofen limestone) over a measurement period of 0.07 ‰ and δ13C values with standard deviation of house standard (Solnhofen limestone) over measurement period of 0.03 ‰. The sediment samples were washed and sieved at 63 µm using tap water and dried overnight in the oven at 50 ∘C. Then, they have been dry-sieved at 150 µm for benthic foraminifera picking. All the Miocene samples have been picked, and only three samples did not have enough material to run the stable isotopes analyses. For some of the samples we had enough material to analyse two or three replicates using different species known to be relevant markers for δ18O seawater: Cibicidoides mundulus, Cibicidoides wuellerstorfi and Oridorsalis umbonatus (Katz et al., 2003; Rathmann and Kuhnert, 2008). We did not mix the species in one single measurement. For the species-specific δ18O and δ13C values correction, we used the calibration given in the Supplement Table S3 from Westerhold et al. (2020).
2.5 Age model
2.5.1 For the existing data compilation
Because the orbitally tuned age models as well as the splices for the individual sites have been recently revised (Wilkens et al., 2017), we re-evaluated the composite depth of all samples and assigned new ages to them based on Wilkens et al. (2017) and used the new ages to derive sedimentation rates (SR).
2.5.2 For the four high-resolution intervals of core 927
The existing most recent age model for Site 927 is based on a directly tuned age model from Site 926 that has been point-to-point correlated with the composite record from Site 927 using core images, magnetic susceptibility, greyscale values and stable isotopes (Wilkens et al., 2017; Zeeden et al., 2013). For the determination of CaCO3 AR during the four target intervals, this age model requires adjustments because it provides too low resolution and is not tuned below core 927A-30H, section 6, 70 cm (303.60 rmcd), corresponding to 926A-28H, section 3, 18 cm (277.82 rmcd). Thus, to estimate CaCO3 AR for the three studied intervals, we developed modified age models, where SRs have been constrained directly by astronomical tuning of sediment properties in the studied cores.
2.6 Carbonate analyses
To determine the CaCO3 AR for the newly sampled intervals, we performed carbonate content analyses on the bulk sediment using a LECO CS744 elemental analyser at Bremen University. The analysis was performed by heating 0.1 g of homogenized material in a ceramic dish and measuring the resulting CO2 in IR cells. The carbonate content has been calculated as the difference between the total carbon content and the organic carbon content, measured in a second sample that was pre-treated with hydrochloric acid to remove carbonates. Both measurements have an accuracy of 0.001 mg (1 ppm) or 0.5 % relative standard deviation (RSD). The inorganic carbon was then converted to carbonate content using the molecular mass of calcium carbonate. Dry bulk density for all the newly analysed samples at Site 927 was determined from GRA bulk density as described above (Sect. 2.2.) and combined with the carbonate content and SR from the modified age models to calculate the CaCO3 AR.
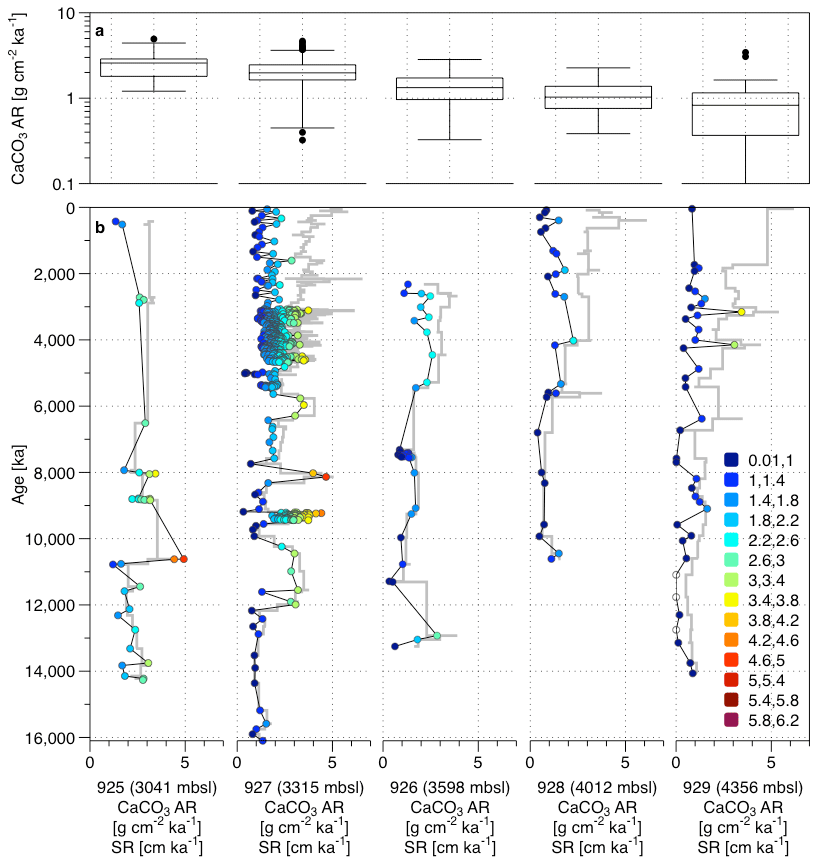
Figure 3(a) Box plots of the CaCO3 AR for the five cores and (b) CaCO3 AR and SR (grey line) through the time for the Sites 925, 926, 927, 928, and 929 (black line and dots) for the five cores of the Leg 154. The CaCO3 AR are calculated from existing carbonate content data for all Leg 154 sites (Curry et al., 1995; Frenz et al., 2006; King et al., 1997). The colour shade corresponds to the values of CaCO3 AR.
3.1 Long-term trends in carbonate accumulation rates
Using existing carbonate content data for all Leg 154 sites (Curry et al., 1995; Frenz et al., 2006; King et al., 1997), combined with new age models (Wilkens et al., 2017), for each site, records of CaCO3 AR since the mid-Miocene were calculated (Fig. 3). Curry et al. (1995) noted the occasional presence of slumps or hiatuses in the sediment sequences, especially at Site 928 and Site 929. Here we used the age models for the entire sediment package, ignoring the presence of these events. This is because the slumps only represent a small fraction of the sediment sequence and therefore are unlikely to affect the overall trends.
The mean CaCO3 AR varies considerably among the sites, reflecting their depth and therefore likely the amount of dissolution. ODP Sites 925 and 927 (present depth 3041 and 3315 m b.s.l.) show consistently higher CaCO3 AR (between 1.5 and 3 g cm−2 ka−1) than the three remaining sites, located below 3400 m b.s.l. (around 1 g cm−2 kyr−1). Curry and Cullen (1997) show an effect of distance from the Amazon Fan on sediment composition on Ceara Rise for the late Quaternary, but this change is only manifested as differences in the AR of terrigenous (non-carbonate) sediments. This is seen in patterns of carbonate content of the sediment (their Fig. 2) but not in changes in carbonate accumulation. Also, there is little evidence that the Amazon discharge plume reaches far enough offshore to induce changes in productivity over the plateau. At present, the discharge is strongly deflected northwards and stimulates productivity mainly along a narrow coastal strip (Gouveia et al., 2019). The same authors note that some of the Amazon discharge may be deflected into the North Brazil Current, but this affects productivity only little and mainly north off the Ceara Rise. To visualize long-term trends, we subtracted at each site the mean values of CaCO3 AR and SR (Fig. 4). All sites show a prominent trend of increasing SR, beginning in the late Miocene (8 Ma ago) (Fig. 4), which is known to reflect increasing amount of clastic material transported from the Amazon Fan (Curry et al., 1995; Pälike et al., 2006b; Bickert et al., 1997; Harris et al., 1997; Shackleton and Crowhurst, 1997). The CaCO3 AR, on the contrary, shows a less obvious temporal trend on a long timescale (Fig. 4), indicating that the increase in SR is compensated by decreased carbonate content in the sediment. Instead, the CaCO3 AR record at all Ceara Rise sites show a pervasive short-term (likely orbital) variability, with substantial magnitude (Curry et al., 1995).
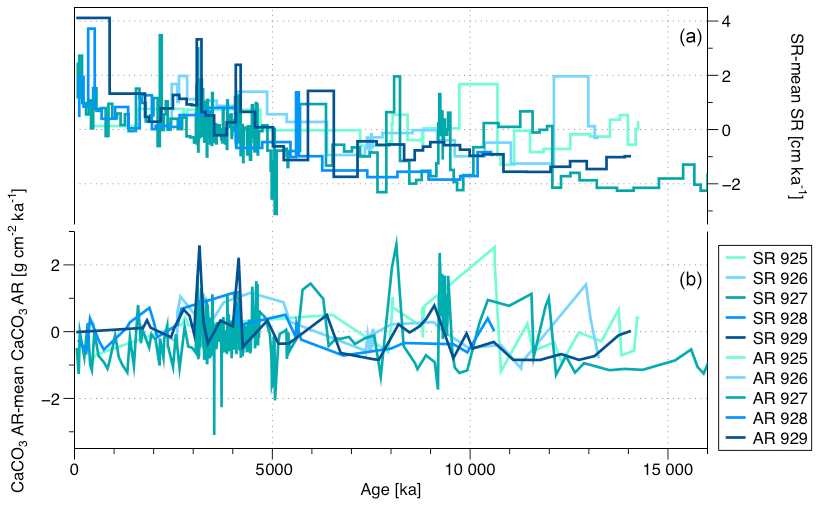
Figure 4(a) SR from which the average SR has been subtracted and (b) CaCO3 AR from which the average CaCO3 AR has been subtracted, both for the five sites of Leg 154 over the last 16 Ma.
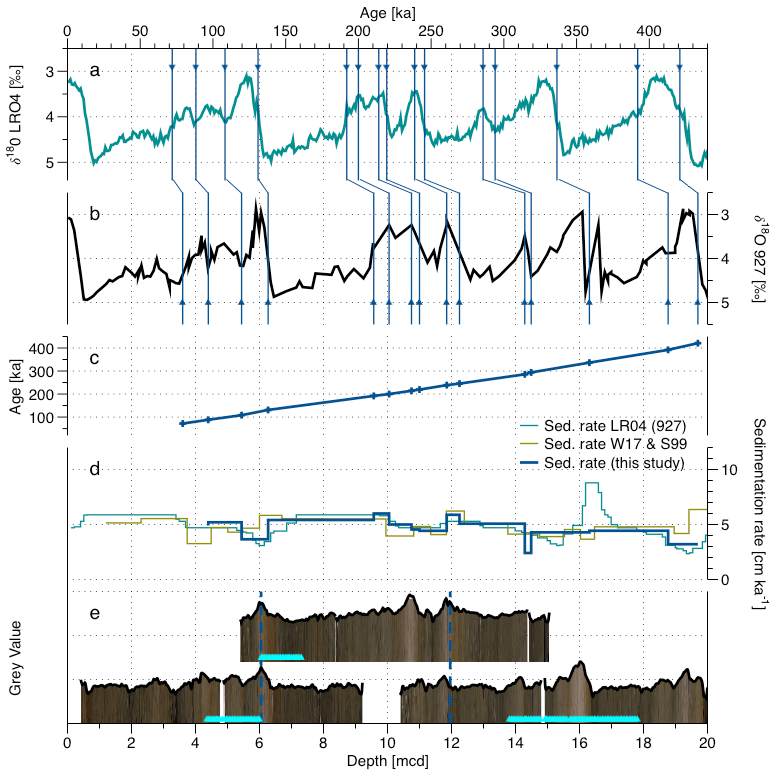
Figure 5Depth–age correlation for the late Pleistocene, cores 927A 1H, 927B 2H and 927A 2H (following the splice) with (a) the Lisiecki and Raymo (2005) δ18O stack; (b) the local δ18O record (Wilkens et al., 2017, modified from Bickert et al., 2004); (c) the age–depth record with control points; (d) the SR from Wilkens et al. (2017) (green), the SR using the LRO4 depths and ages for site 927 (blue-green), and the SR defined in this study (blue); and (e) the core images (Wilkens et al., 2017) and grey value record for the three cores of the splice used, the position of the switch from one core to the other in the splice (dashed lines), and the position of the samples used in the present study in the cores (light blue triangles).
3.2 Age models for target intervals at ODP Site 927
3.2.1 Pleistocene
The Pleistocene interval in the studied core has a high-resolution age model based on benthic oxygen isotope data (Bickert et al., 2004) that were incorporated in the benthic stack of Lisiecki and Raymo (2005), who had added a constant 4–5 kyr lag to take into account the delay in the δ18O data (ice volume inertia) with respect to the insolation forcing (Lisiecki and Raymo, 2005). However, Wilkens et al. (2017) revised the splice for this site (the way individual core segments are aligned), which means the age model in Lisiecki and Raymo (2005) has to be validated. To this end, we first checked the new alignment of the individual cores by generating high-resolution sediment colour (grey value) curves from the core images presented by Wilkens et al. (2017) (Fig. 5e). The grey value curve was extracted using the ImageJ software and calculated from RGB images using the NTSC formula (Rasband, 1997) with values averaged across the entire core width perpendicular to the core axis and the resulting noisy curve was smoothed as first component of the singular spectrum analysis (SSA) obtained with Analyseries software (Paillard et al., 1996). This curve was used to compare the overlapping parts of the cores spanning the last 400 ka, validating the alignment by Wilkens et al. (2017), which we thus adopt without modification. For the age model, we carried out a manual tuning of the 927 δ18O data (Bickert et al., 2004) using the new composite depth by Wilkens et al. (2017) to the LR04 stack (Lisiecki and Raymo, 2005). Because the benthic stable oxygen record reflects mainly global sea level change (Bickert et al., 2004), the tuning was based on the identification of all unambiguously recognizable δ18O maxima and times of fastest sea level change (Fig. 5a). By the fastest sea level change (coinciding with the fastest ice volume change), we mean the inflection points of the δ18O curve (327.55 mcd to 15 605 ka and 331.5 mcd to 15 930 ka). The resulting SRs are indeed more similar to those inferred from the age model by Wilkens et al. (2017) than those implied by the age model for the site as implemented in the LR04 stack (Lisiecki and Raymo, 2005).
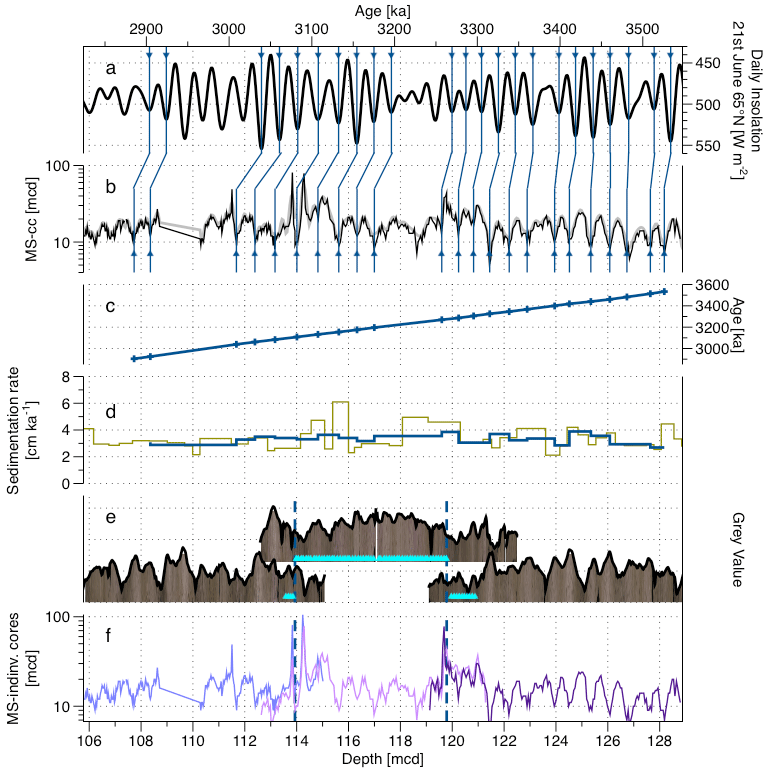
Figure 6Depth–age correlation for the Pliocene interval across cores 154 927C 11H, 154 927A 12H and 154 927B 13H. (a) The daily insolation for 21 June at 65∘ N record (Laskar et al., 2004). (b) The MS record (black) and MS smoothed record (grey) according to the splice presented in this study. (c) The age–depth record with control points. (d) The SR from the Wilkens et al. (2017) age model (green) and from this study (blue). (e) The core images for the cores of the splice are from Wilkens et al. (2017) (pictures), also shown are the grey value record extracted from it (black lines), a step from one core to the other in the splice (dashed lines), and the position of the samples used in this study in the cores (light blue triangles). (f) MS record for the individual cores (Curry et al., 1995; Wilkens et al., 2017) and steps from one core to the other in the splice (dashed lines).
3.2.2 Pliocene
For the Pliocene interval, the first step has been to validate the core alignment. First, we generated a grey value curve (Sect. 3.2.1) but noted that this signal is weaker and shows many idiosyncratic features among the overlapping parts of the cores from the individual holes. Therefore, we decided to carry out the tuning on the magnetic susceptibility (MS) signal as done by Shackleton et al. (1999), which was also measured in all cores (Curry et al., 1995). MS shows a distinct signal in this part of the sediment sequence, which can be used for tuning (like it has been used at Site 926), but for this it must be in alignment across the individual core segments. The alignment revealed that the existing splice by Wilkens et al. (2017) has to be adjusted for the purpose of tuning in this interval (Fig. S2) by a shift of the core 927C 11H by 2 cm shallower, a shift of the core A 12H by 15 cm deeper and a shift of the core B 13H 9 cm deeper in the splice compared to the spliced MS record of Wilkens et al. (2017). Otherwise, the construction of the spliced record remained the same, retaining the same depths where the signal from one core switches to a signal from the adjacent core. These depths are indicated by dashed lines across the overlapping sections of the cores (Fig. 6d). The spliced MS signal (Fig. 6b) has then been tuned to the daily insolation on 21 June at 65∘ N. This is because this representation of orbital forcing of global climate shows the best pattern of influence from both obliquity and precession (Laskar et al., 2004) (Fig. 6a) and has been used for tuning at the studied location in previous studies (e.g. Zeeden et al., 2013), who also provide arguments for why the MS and insolation are co-varying without lag. The tuning of the MS signal to an orbital target is possible because the existing age model of Wilkens et al. (2017) is sufficiently precise to provide a specific tuning target age interval, as confirmed by similar modulation of the insolation target and of the spliced MS record. The tuning has been done by correlating recognizable 23 MS minima to insolation maxima for this interval, using the Analyseries software (Paillard et al., 1996), assuming the signals are in antiphase without lag (Wilkens et al., 2017; Zeeden et al., 2013, 2015). As MS minima are easier to identify than the MS maxima, we prefer here to work with MS minima and insolation maxima instead of MS maxima and insolation minima as in Zeeden et al. (2013).
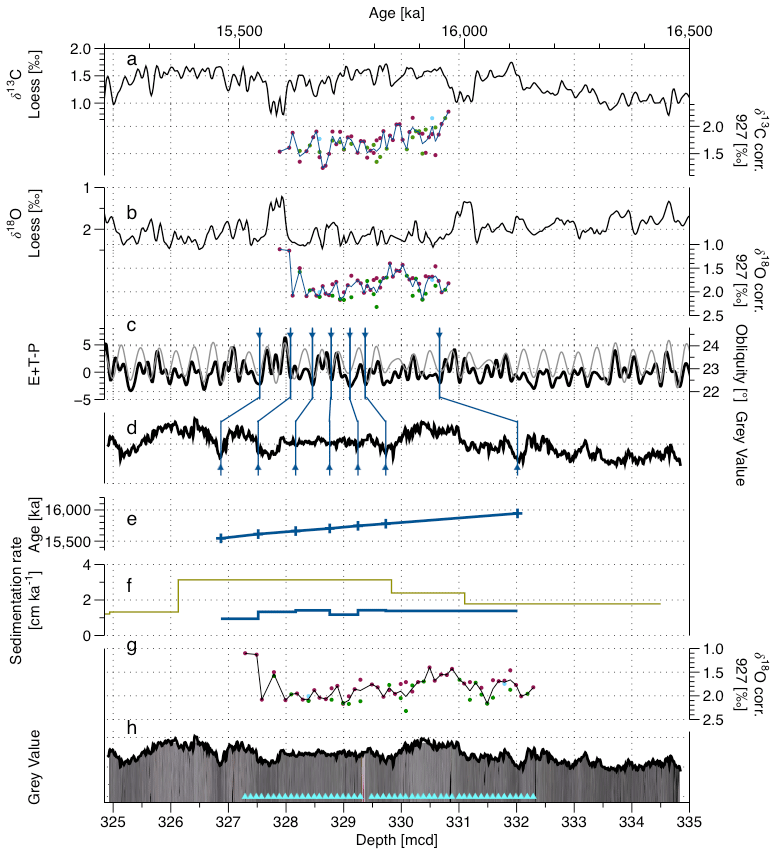
Figure 7Depth–age correlation for the Mid-Miocene, core 154 927 A33H. (a) The δ13C loess smooth composite record (from sites U1337 and U1338, Westerhold et al., 2020) and corrected δ13C measured in Miocene samples from this study (O.umbonatus in pink, C. mundulus in green, and C. wuellerstorfi in blue; the line corresponds to the average value). (b) The δ18O loess smoothed composite record (from sites U1337 and U1338, Westerhold et al., 2020) and corrected δ18O measured in Miocene samples from this study (O.umbonatus in pink, C. mundulus in green, and C. wuellerstorfi in blue; the line corresponds to the average value). (c) The obliquity (grey) and (black) records (Laskar et al., 2004). (d) The SSA of the grey value record extracted from the core image and corrected from the light bias. (e) The age–depth relationship and control points. (f) SR from the Shackleton et al. (1999) age model (green), from nannofossil events (Curry et al., 1995; Pälike et al., 2010; Wilkens et al., 2017) (dark blue) and from this study (blue). (g) The corrected δ18O measured on Miocene samples from this study against depth (O.umbonatus in pink, C. mundulus in green and C. wuellerstorfi in blue; the line corresponds to the average value). (h) The core image (Wilkens et al., 2017), smoothed grey value record and position of the samples for this study in the core (light blue triangles).
3.2.3 Miocene
The existing age model for the Miocene interval by Shackleton et al. (1999) is based on a combination of orbital tuning and biostratigraphy. It presents a distinct shift in the SR around 330 mcd (Fig. 7c), dominating the CaCO3 AR record for the studied period. There does not seem to be any distinct shift in the physical properties at that depth (Curry et al., 1995), and we therefore felt compelled to test the possibility that the singular change in SR does not correctly represent the changes in the sedimentation at this site. Since the studied interval is within one core segment, we tested whether a “nested” tuned age model can be developed, allowing a more precise estimation of the variability in the SR. As in this part of the sediment sequence the MS was not the dominant signal, we have made the choice to work with both the sediment colour and the stable isotopes to have two independent markers for this age model (analyses run for the purpose of this study; see Sects. 3.2.1. and 2.4.).
To have an independent estimation of the SR, we also evaluated the biostratigraphy from the shipboard data (Curry et al., 1995) with revised metre composite depth (Wilkens et al., 2017) and revised biomarker ages GTS 2020 (Raffi et al., 2020). Three biostratigraphic markers have been evaluated: last appearance datum (LAD) of Sphenolithus heteromorphus, LAD Helicosphaera ampliaperta and LAD abundant Discoaster deflandrei. The combination of these markers gives us two SR options. Using LAD H. ampliaperta (the less reliable marker according to Raffi et al., 2020), in combination with LAD D. deflandrei, gives an SR of 1.65 cm kyr−1. Alternatively, considering LAD S. heteromorphus, which is recorded in the core further from the studied interval but is considered more reliable according to Raffi et al. (2020), in combination with LAD D. deflandrei, gives an SR of 1.11 cm kyr−1.
A sediment colour proxy was generated for the studied core (Sect. 3.2.1) (Fig. 7d). Due to the light appearance of the sediment composing this core and the way the pictures have been taken onboard (1.5 m sections with a centred camera and centred white source of light), there is a strong 1.5 m induced light cyclicity in the original light images (Curry et al., 1995; Wilkens et al., 2017). To reduce this bias, the core images were adjusted for the edge effect using the lighting correction function inside the Code for Ocean Drilling Data (CODD, Wilkens et al., 2017) (Fig. 7d). For the identification of the cyclicity in the core, we carried out spectral analyses on the corrected grey value curve using the multitaper method (MTM) (carried out using astrochron package on R, Meyers, 2014; R 4.1.2., R Core Team, 2021) (Fig. S6). This revealed three broad but distinct peaks for the frequencies 0.48 (period: 2.08 m), 0.7 (period: 1.43 m) and 1.4 (period: 0.71 m). Applying the two alternatives, biostratigraphy-derived SR reveals that the most distinct 71 cm cycles could represent obliquity when the SR of 1.65 cm kyr−1 is applied. Finally, we used the δ18O record to define the exact temporal window of the sampled interval and confirm the assumed cyclicity by matching the isotopic signal to the Westerhold et al. (2020) stable isotope loess smoothed record δ18O curve as a target. The new isotopic curve reveals a prominent minimum, which corresponds to the 15.6 Ma event, but the older 16.0 Ma isotopic minimum (also seen in carbon isotopic record of the target) is not recorded, indicating that the sampled interval spans less than 400 kyr and confirming that the average SR must be >1.2 cm kyr−1. Overall, the new oxygen and carbon stable isotope signals show similar trends and absolute values as the global stack and representative individual records (Fig. S3), but the resolution of the new record is slightly lower. It does seem to record stable oxygen isotopic maxima at 15 720 and 15 900 ka that are also seen in the other records, but the absolute values appear lighter by about 0.5 ‰, and the shape of the corrected average record between these maxima appears to display a stronger eccentricity component. The new stable carbon isotope record also shows similar absolute values and an overall decreasing trend as seen in the global stack (Fig. S3), but our corrected average signal is hard to compare to the stack in detail, and the representative records both show substantial divergence at orbital timescales. The new record does not show the stable carbon isotopic minimum at 15 980 ka nor the increasing trend afterwards, indicating that it must have started later. The divergence at the beginning of our record by almost 1 ‰ from the stack has to be seen in the context of a similar departure seen in the record from Site U1338. Because the new isotopic curve does not allow sufficiently robust tuning within the target interval, after the alignment with the younger isotopic maximum we used the signal as a target curve (taking in account the eccentricity, the obliquity and the precession) (Fig. 7a) (Laskar et al., 2004) to tune prominent light minima with minima (and obliquity minima) (Shackleton et al., 1999; Zeeden et al., 2013) (Fig. 7a and b). This tuning has then been verified by plotting the stable isotope (both δ18O and δ13C) record using the new given ages and comparing it to the existing stable isotopes loess smooth records from Westerhold et al. (2020) (Fig. S3.).

Figure 8(a) Quaternary and Pliocene benthic stable oxygen records from Site 927 and a global stack for the Miocene (Bickert et al., 2004; Westerhold et al., 2020). (b) Orbital parameters: eccentricity and daily summer insolation for 21 June at 65∘ N (Laskar et al., 2004). (c) CaCO3 AR and boxplot for each interval. (d) SR and (e) CaCO3 % in the dried bulk sediment and a boxplot for each interval.
3.2.4 High-resolution records of carbonate content and carbonate accumulation rates at ODP Site 927
The new carbonate content analyses are based on 261 measurements, yielding values comparable to existing low-resolution measurements, confirming decreasing carbonate content throughout the Neogene due to dilution by clastic sediments from Amazon fan (Curry et al., 1995; Bickert et al., 1997; Harris et al., 1997) and indicating particularly strong variations in the Quaternary (Fig. 8). In combination with the new high-resolution SR data (Fig. 8), these measurements provide records of sub-orbital variability in CaCO3 AR across the four intervals, showing orbital-scale variability exceeding the differences in mean CaCO3 AR among the intervals (Fig. 8).
The comparison between the highly resolved record for the four intervals of interest (Fig. 8c, d, and e) and the environmental parameters (Fig. 8a and b) highlights the good correlation – in terms of phase and amplitude – between the CaCO3 AR (reflecting the pelagic carbonate production) and the insolation at 65∘ N signal for the two warm interglacials observed. For the MIS 5 and the MIS 9 warm interglacials, there is a strong correlation between the CaCO3 % and CaCO3 AR (r2 of 0.86 and 0.93) (Figs. 8 and 9). At the same time, the SR is reaching high values (3 to 5 cm kyr−1), independently of CaCO3 AR changes, indicating the role of another component than the pelagic carbonate production influencing the SR. In contrast, during the MIS KM5, the CaCO3 AR is driven by both the carbonate content and the SR, and in the Miocene, the CaCO3 AR appears to be dominantly driven by SR only (Fig. 9). Furthermore, the slope of the relationship between carbonate content and CaCO3 AR appears to decrease with increasing age, indicating that the earlier in the record, the less the carbonate content is influencing the CaCO3 AR.
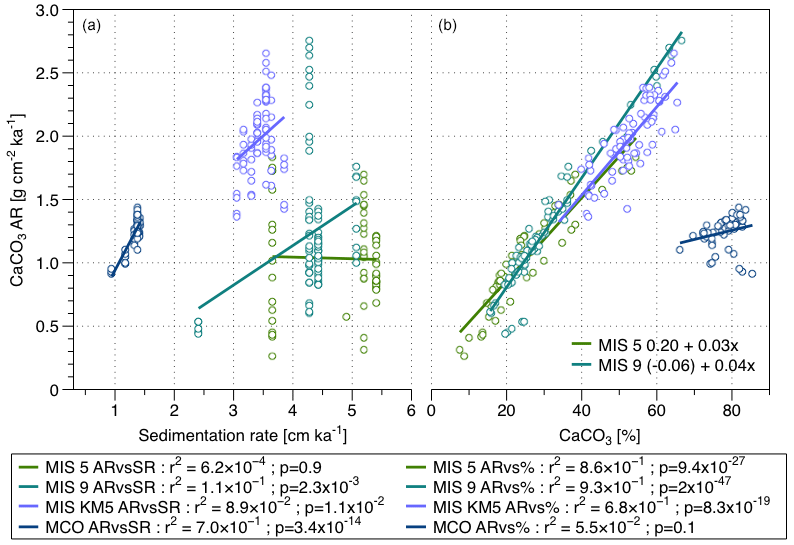
Figure 9(a) Relationship between the CaCO3 AR and the SR and (b) relationship between the CaCO3 AR and the CaCO3 % for the four periods of interest.
The presence of multiple CaCO3 AR values for the same SR values, especially for the Quaternary intervals, is due to the few available values of SR, because the studied intervals are short and the tuning cannot be carried out on much higher resolution than orbital. This pattern likely affects the correlation analysis and in such a situation, it would have been appropriate to treat the CaCO3 AR data as groups of observations, each representing a different mean SR, and test for differences using ANOVA. However, the number of observations for some of the intervals is too low, to run the test effectively. However, this limitation may have caused the apparently significant relationship between CaCO3 AR and SR for MIS9, which we indeed consider likely to be an artefact.

Figure 10CaCO3 AR for each period of interest, average value between two maxima per period (for Quaternary and Pliocene), average value taking into account maxima and minima for the Pliocene and the Miocene, and quantification of change within (amplitude) or between each of the periods of interest. The shaded areas are underlying the maxima values of CaCO3 AR used for the quantification of change between the time intervals calculation.
When we look at the trend of the highest values reached on long geological timescale from the mid-Miocene to MIS 5 (Fig. 10), we observe a 31 % decrease in CaCO3 AR from the Pliocene (highest value) to the Pleistocene MIS 5 (lowest value), excluding dissolution intervals in the Pleistocene. Taking into account the average value of the MCO and MIS KM5, we found an increase in the pelagic carbonate production of 59 % from Miocene to Pliocene MIS KM5. If we now take into account the maxima values for the Quaternary and Pliocene MIS KM5, we observe a decrease of 12 % from the Pliocene MIS KM5 to Pleistocene and a decrease of 22 % from Pleistocene MIS 9 to Pleistocene MIS 5.
Looking at the amplitude of the variability within the Pliocene and Miocene interval, we found higher values in the Pliocene (65 %) compared to the average of the period (1.98 g cm−2 kyr−1) than in the Miocene (42 %) compared to the average (1.24 g cm−2 kyr−1).
4.1 Carbonate preservation during the Quaternary
During the Pleistocene, the CaCO3 AR at Site 927 was driven only by the carbonate content, indicating that the signal is affected by dissolution. This is confirmed by the presence of very low values of carbonate content and CaCO3 AR during the cold intervals in the Pleistocene, in phase with the δ18O and insolation signal, indicating a relationship to changes in deep-water circulation, confirming the conclusions by Bickert et al. (1997). As expected from the overall stratigraphy and palaeoceanography of the Ceara Rise sites (Curry et al., 1995; Frenz et al., 2006; King et al., 1997), the new carbonate content (Fig. 8e) and CaCO3 AR (Fig. 8c) records from Site 927 show strong minima during cold intervals of the Quaternary (indicated by δ18O record), which is consistent with the shoaling of the corrosive AABW (Miller et al., 2012; Harris et al., 1997), causing dissolution at shallower depth (Gröger et al., 2003a, b). In contrast, the maxima in CaCO3 AR and carbonate content in the sediment during the Quaternary do not appear to be affected by dissolution. Therefore, whilst we cannot use the Quaternary variability in the CaCO3 AR to estimate the orbital-scale variability in pelagic carbonate production, we can use the interglacial maxima (Fig. 10) to estimate pelagic carbonate production during the Quaternary, assuming that during the studied Pleistocene interglacials Site 927 was positioned above the lysocline, as is the case during the Holocene.
4.2 Carbonate preservation during the Pliocene and Miocene
Because the Ceara Rise sites became periodically affected by the more corrosive Antarctic bottom water only after the initiation of the North Hemisphere glaciation (Liebrand et al., 2016; Harris et al., 1997; Pälike et al., 2006a), the studied Pliocene and Miocene intervals should not be affected by dissolution. Paul et al. (2000) note that the exact subsidence history of the Ceara Rise is unknown but assume minimal subsidence since the early Miocene. Similarly, sea level differences among Quaternary interglacials and the Pliocene and Miocene were likely on the order of tens of metres. Therefore, the largest changes in palaeodepth would have been due to sediment cover, which would make the studied mid-Miocene interval about 300 m deeper compared to the present one (this depth is still above the present day lysocline depth of 4200 m b.s.l.). Throughout the entire studied interval since the Miocene (Fig. 3), the shallowest cores (925 and 927) record higher CaCO3 AR values than the deeper ones. This also indicates that these sites likely remained above the lysocline (Curry et al., 1995; Bickert et al., 1997; Frenz et al., 2006; Gröger et al., 2003a, b) and that the CaCO3 AR signals recorded at these sites primarily record changes in pelagic carbonate production. To provide further support for the lack of dissolution control on the pre-Quaternary variation in CaCO3 AR, for the Pliocene and Miocene interval we generated new data on the degree of fragmentation of planktonic foraminifera shells, a commonly accepted proxy for the extent of carbonate dissolution (Berger et al., 1982; Preiss-Daimler et al., 2013). The fragmentation data (Fig. S4) reveal good preservation (see also Fig. S7) of foraminiferal shells throughout the Pliocene and Miocene intervals, showing no correlation with CaCO3 AR (Fig. S5), confirming that the CaCO3 AR was not driven by dissolution at that time and therefore must reflect pelagic carbonate production changes.
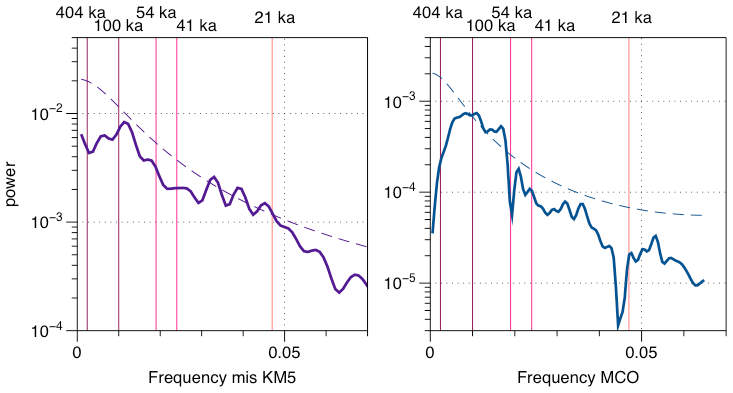
Figure 11MTM spectral analysis of the CaCO3 AR record through time (Meyers, 2014; R Core Team, 2021). The dashed lines represent the 95 % significance level. The pink shadows correspond to the orbital periodicities (eccentricity at 404 and 100 ka, obliquity at 54 and 41 ka, and precession at 21 ka).
4.3 Orbital variability in the Pliocene and Miocene
Assuming dissolution did not play a significant role in the observed variations in CaCO3 AR in Pleistocene interglacials and prior to the Quaternary and that pelagic carbonate is the main component of the carbonate fraction of the sediment (Curry et al., 1995), we here observe the changes in the export flux of pelagic biogenic carbonate. Under the same assumption, the new record from Site 927 reveals that pelagic carbonate production (assessed by the pelagic CaCO3 AR) in the equatorial ocean (avoiding large-amplitude temperature changes) has changed on a geological timescale by a factor of 2 and on orbital timescales by up to 50 %. The presence of orbital-scale variability in pelagic carbonate production is an interesting phenomenon that requires further analysis. First, we tested whether or not this variability is periodic, i.e. whether the underlying changes in pelagic carbonate production responded to orbital forcing. Such analysis is possible because the studied intervals have been tuned to the orbital target using parameters other than carbonate content (Figs. 6 and 7). Multitaper method (MTM) spectra derived with the astrochron package in R (Meyers, 2014, using R 4.1.2., R Core Team, 2021) (Fig. 11) highlight significant periodicity close to the precession band for the MIS KM5 and periodicities in the obliquity and 100 ka eccentricity bands for the MCO. This implies that during both intervals, the pelagic production likely varied in response to orbitally driven environmental factors, such as insolation (light intensity for phytoplankton, Cavaleiro et al., 2018) or nutrient availability due to changes in upwelling (Cavaleiro et al., 2020). Interestingly, the dominant periodicities appear different between the Pliocene and Miocene. Next, we asked whether or not the observed periodicities in CaCO3 AR are coherent with the actual insolation, obliquity and eccentricity signals. This is possible because the underlying age models have been tuned such that they should preserve the correct phase relationship with the orbital forcing (Figs. 6 and 7). To this end, we carried out cross Blackman–Tukey (BT) analyses using the Analyseries software 2.0 (Paillard et al., 1996). The results (Fig. 12) indicate a coherence with insolation in the precession band and with the 41 ka obliquity for the MIS KM5. In both cases, the coherence occurs in phase. In contrast, for the MCO we observe a coherence at 41 ka with the obliquity periodicity and at 100 ka with eccentricity, but in both cases the coherence is anti-phased. That the pelagic carbonate production is responding to an eccentricity-paced periodicity (Figs. 11 and 12) is interesting, as eccentricity was not the main driver of the Earth climate signal (Westerhold et al., 2020; De Vleeschouwer et al., 2020). The carbon cycle in the Miocene appears to show eccentricity pacing (Holbourn et al., 2007, 2018; De Vleeschouwer et al., 2020; Raitzsch et al., 2021), and our results indicate that pelagic carbonate productivity may play a role in modulation of this cyclicity. We also note that the discovery of eccentricity forcing pelagic carbonate production in the Miocene and a shift towards obliquity and precession forcing in the Pliocene is consistent with the observations from mid-latitudes by Drury et al. (2021), and the modelling study by Vervoort et al. (2021) provides potential mechanisms on how the eccentricity and obliquity frequencies in carbonate production may arise despite the dominance of the precession frequencies in the forcing.
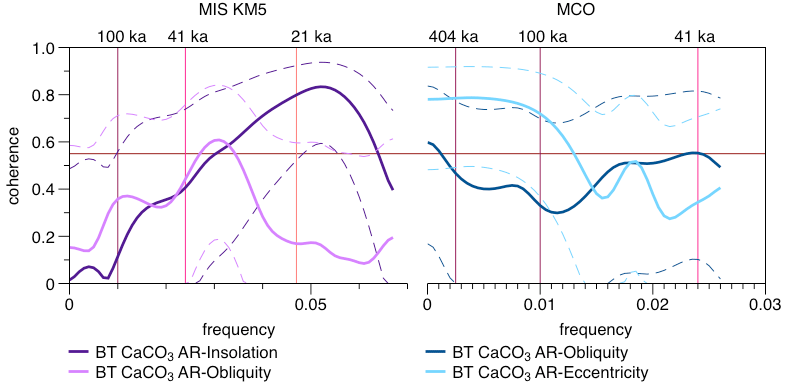
Figure 12Coherence diagram BT cross correlation (Paillard et al., 1996) between the CaCO3 AR and the orbital parameters (Laskar et al., 2004). The dashed curves show the 90 % confidence intervals. The horizontal red line corresponds to the non-zero coherence at a significance level of 90 %. The vertical pink lines correspond to the orbital periodicities (eccentricity at 404 and 100 ka, obliquity at 54 and 41 ka, and precession at 21 ka).
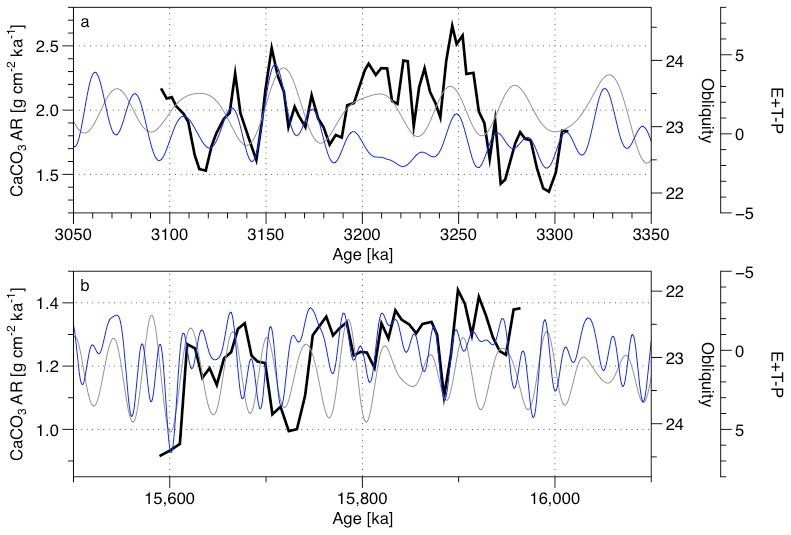
Figure 13Comparison of the CaCO3 AR (black) with both the obliquity (grey) and the orbital records (blue) (Laskar et al., 2004) for (a) MIS KM5 and (b) the MCO.
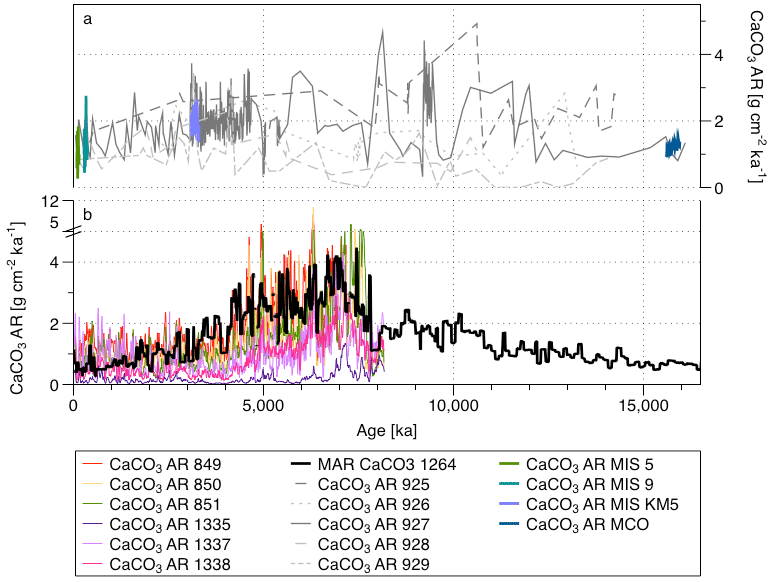
Figure 14Comparison of the CaCO3 AR at (a) the five Ceara Rise sites (Sect. 3.1., in grey) and CaCO3 AR at high resolution (this study; in colours) and (b) the CaCO3 AR record in the equatorial Pacific (colours) (Lyle et al., 2019) and South Atlantic Ocean (black) (Site 1264, Drury et al., 2021).
Finally, we consider the apparent shift in the phase in the relationship between orbital forcing and the CaCO3 AR record between the Pliocene and Miocene. This relationship implied by the cross-spectral analysis is clearly visible in the raw data (Fig. 13), and we consider it unlikely that it is due to tuning artefacts. We note that the Miocene record ends with a strong and distinct minimum in the oxygen isotope record, which provides a strong constraint on the phase relationship between the youngest CaCO3 AR and obliquity cycle. These show an opposite phase relationship to that observed during the Pliocene. This could be explained by a change in the carbonate production response to the insolation changes between the Pliocene and the Miocene. Indeed, the production of different pelagic calcifiers could be promoted by a decreased mean annual insolation at equatorial latitude (with high and high obliquity) during the Pliocene compared to the Miocene, when the pelagic carbonate calcifiers appears to be promoted by a higher mean annual insolation at equatorial latitude (with low and low obliquity). We can then expect a higher weight of the foraminifera (non-photosynthetic) in the carbonate production balance during the Pliocene and a higher weight of the coccolithophores (doing photosynthesis) in the carbonate production balance during the Miocene. This is coherent with the climate–carbon cycle changes occurring between the Miocene and the Pliocene, highlighted by De Vleeschouwer et al. (2020), who found changes in the phase relationship of δ18O and δ13C before and after 6 Ma.
4.4 Long-term trend (differences between periods)
Because of the observed changes in what appears to be carbonate production among the studied intervals and especially within the studied intervals, we conclude that tropical pelagic calcifiers responded to environmental or biotic forcing on orbital cycles, as well as to long-term shifts in climate and/or ocean chemistry. In other words, either the production, the community composition or the biomineralization of the tropical pelagic calcifiers may respond to local changes in light, temperature and nutrients delivered by upwelling, which followed orbital cycles, as well as to long-term shifts in climate and/or ocean chemistry. The inferred changes in pelagic carbonate production on both timescales are sufficiently large that when extrapolated on a global scale, they could have played a role in the regulation of the carbon cycle. For example, Boudreau et al. (2018) estimated that changes in global pelagic carbonate production on the order of 10 % would be sufficient to affect the marine carbon cycle on timescales from years to millions of years. Whereas the drivers of the orbital-scale variability could be plausibly attributed to changes in local oceanic parameters affecting primary production, the causes of the long-term shifts require another explanation.
There are two studies presenting long continuous CaCO3 AR records from the Miocene to the present (Fig. 14). Both records show an increasing CaCO3 AR from the early Miocene to Pliocene and a decreasing CaCO3 AR from the Pliocene to Quaternary and both records indicate the presence of high-amplitude variability on orbital scales throughout the last 16 Myr (Drury et al., 2021; Lyle et al., 2019). The observed CaCO3 AR at the Ceara Rise appears coherent with both records (Fig. 14), as well as with the recent results by Sutherland et al. (2022) from the South Pacific. Our record shows similar absolute values to Lyle et al. (2019) and Drury et al. (2021) (a CaCO3 AR between 0 and 5 g cm−2 ka−1) and a similar overall trend, with its highest values being in the late Miocene–early Pliocene. Clearly, the overall trend of CaCO3 AR at the Ceara Rise supports the existence of a late Miocene carbonate maximum also under tropical conditions. Interestingly, our observations from the Ceara Rise also support the conclusion from Sutherland et al. (2022) that there does not appear to be any strong relationship between pelagic carbonate production and global CO2, other than the fact that the lowest CaCO3 AR in both their and our records are observed during the MCO with presumably highest CO2.
A compilation of CaCO3 AR for the five sites of Leg 154 in the western equatorial Atlantic Ocean documents a distinct increase in SR from Miocene to Quaternary, but the CaCO3 AR remained relatively stable. The two shallowest sites at the Ceara Rise (925 and 927) consistently record higher CaCO3 AR, confirming observations of good carbonate preservation during Quaternary interglacials and throughout the Pliocene and Miocene. This means that the observed changes in CaCO3 AR at these sites should reflect changes in pelagic carbonate production.
To analyse long-term and orbital-scale patterns of pelagic carbonate production variability, we generated new data for four periods at Site 927.
We found that CaCO3 AR, as a proxy for pelagic carbonate production in the tropical Atlantic, exhibited both long-term changes and a pervasive orbital-scale variability. We observe a 31 % decrease in CaCO3 AR from the Pliocene MIS KM5 to the Pleistocene interglacial MIS 5, but 59 % higher values for the Pliocene warm period than for the Miocene climatic optimum. On the orbital timescale, the Quaternary signals are overprinted by precession and insolation forcing on deep-water circulation, causing dissolution. However, concerning the Pliocene Warm Period and the Miocene Climatic Optimum, we observe a persistent variability in CaCO3 AR with an amplitude exceeding that of the long-term mean shifts. We show that the CaCO3 AR at low latitude varied in phase with insolation (precession) cycles during the Pliocene, whereas the Miocene signal is dominated by 100 kyr eccentricity cycles, which are exactly anti-phased with the carbonate signal.
We conclude that the low-latitude pelagic carbonate production responded strongly to orbital-driven local tropical processes, rather than to secular changes in the global climate or ocean chemistry (like global CO2). The Ceara Rise records are consistent with the existence of a late Miocene to Pliocene global carbonate production optimum, but the magnitude of the long-term change appears smaller than outside the tropics. Instead, orbital-scale variability dominates the record and the inferred magnitude of production changes are potentially sufficient to affect the global carbon cycle through the process of biological compensation (Boudreau et al., 2018).
Our results imply that in the context of the ongoing and projected global change, pelagic carbonate production may be an important variable in the parameterization of the global marine carbon cycle, especially with regard to the long-term (millennial-scale) fate of anthropogenic carbon injection. To parameterize the pelagic carbonate production, it remains to be shown whether it changes due to changes in production (population sizes), biomineralization (amount of carbonate produced per individual) or community composition (shift to more or less calcified taxa).
All data sets are available on Pangaea (https://doi.org/10.1594/PANGAEA.945848, Cornuault et al., 2022a, https://doi.org/10.1594/PANGAEA.945773, Cornuault et al., 2022b, https://doi.org/10.1594/PANGAEA.945812, Cornuault et al., 2022c, https://doi.org/10.1594/PANGAEA.945789, Cornuault et al., 2022d, https://doi.org/10.1594/PANGAEA.945707, Cornuault et al., 2022e).
The supplement related to this article is available online at: https://doi.org/10.5194/bg-20-597-2023-supplement.
The conceptualisation, as well as samples selection, was carried out by all the co-authors. PC compiled all the existing carbonate data for he five sites of Leg 154 and calculated carbonate accumulation rates from it. PC analysed all of the newly generated carbon content from the samples of this study, calculated the carbonate content and accumulation rates from it, and revised the tuned age models for the three periods of interest in this study (with the help of TW and MK). PC ran the spectral analysis and prepared all the figures presented in this paper. PC wrote the manuscript, and all co-authors contributed to the manuscript.
The contact author has declared that none of the authors has any competing interests.
Publisher's note: Copernicus Publications remains neutral with regard to jurisdictional claims in published maps and institutional affiliations.
We thank Brit Kockisch for assistance with carbonate content analyses and Anna-Joy Drury for providing South Atlantic carbonate data and discussing the results.
This research used samples and data provided by the Ocean Drilling Program
(ODP), which is sponsored by the US National Science 15 Foundation (NSF) and
participating countries. This research was supported by the DFG through
Germany's Excellence Strategy, Cluster of Excellence “The Ocean
Floor – Earth's Uncharted Interface” (EXC-2077, Project 390741603).
The article processing charges for this open-access publication were covered by the University of Bremen.
This paper was edited by Caroline P. Slomp and reviewed by two anonymous referees.
Beerling, D. J. and Royer, D. L.: Reconstructions of atmospheric carbon dioxide concentrations over the past 65 million years are heading towards consensus. It is time for systematic testing of the proxies, against measurements and against each other, Nat. Geosci., 4, 418–420, https://doi.org/10.1038/ngeo1186, 2011.
Bell, D. B., Jung, S. J. A., and Kroon, D.: The Plio-Pleistocene development of Atlantic deep-water circulation and its influence on climate trends, Quaternary Sci. Rev., 123, 265–282, https://doi.org/10.1016/j.quascirev.2015.06.026, 2015.
Berger, W. H., Bonneau, M. C., and Parker, F. L.: Foraminifera on the deep-sea floor – lysocline and dissolution rate, Oceanol. Ac., 5, 249–258, 1982.
Bickert, T., Cordes, R., and Wefer, G.: Late Pliocene to mid-Pleistocene (2.6–1.0 My) carbonate dissolution in the western equatorial Atlantic: results of leg 154, Ceara Rise, in: Proceedings of the Ocean Drilling Program, Sci. Res., 154, 229–237, 1997.
Bickert, T., Haug, G. H., and Tiedemann, R.: Late Neogene benthic stable isotope record of Ocean Drilling Program Site 999: Implications for Caribbean paleoceanography, organic carbon burial, and the Messinian Salinity Crisis, Paleoceanography, 19, PA1023, https://doi.org/10.1029/2002PA000799, 2004.
Boudreau, B. P., Middelburg, J. J., and Luo, Y.: The role of calcification in carbonate compensation, Nat. Geosci., 11, 894–900, https://doi.org/10.1038/s41561-018-0259-5, 2018.
Brummer, G. J. A. and van Eijden, A. J. M.: “Blue-ocean” paleoproductivity estimates from pelagic carbonate mass accumulation rates, Mar. Micropaleontol., 19, 99–117, https://doi.org/10.1016/0377-8398(92)90023-D, 1992.
Cavaleiro, C., Voelker, A. H. L., Stoll, H., Baumann, K.-H., Kulhanek, D. K., Naafs, B. D. A., Stein, R., Grützner, J., Ventura, C., and Kucera, M.: Insolation forcing of coccolithophore productivity in the North Atlantic during the Middle Pleistocene, Quaternary Sci. Rev., 191, 318–336, https://doi.org/10.1016/j.quascirev.2018.05.027, 2018.
Cavaleiro, C., Voelker, A. H. L., Stoll, H., Baumann, K.-H., and Kucera, M.: Coccolithophore productivity at the western Iberian Margin during the Middle Pleistocene (310–455 ka) – evidence from coccolith Sr Ca data, Clim. Past, 16, 2017–2037, https://doi.org/10.5194/cp-16-2017-2020, 2020.
Chalk, T. B., Foster, G. L., and Wilson, P. A.: Dynamic storage of glacial CO2 in the Atlantic Ocean revealed by boron [CO] and pH records, Earth Pl. Sc. Lett., 510, 1–11, https://doi.org/10.1016/j.epsl.2018.12.022, 2019.
Clark, P. U. and Huybers, P.: Interglacial and future sea level: Global change, Nature, 462, 856–857, https://doi.org/10.1038/462856a, 2009.
Cornuault, P., Westerhold, T., Pälike, H., Bickert, T., Baumann, K.-H., and Kucera, M.: Carbonate accumulation rate calculation derived from previously published carbonate content data, for the five sites of the Leg 154, Ceara Rise, tropical Atlantic from 0 to 16 Ma, PANGAEA [data set], https://doi.org/10.1594/PANGAEA.945848, 2022a.
Cornuault, P., Westerhold, T., Pälike, H., Bickert, T., Baumann, K. H., and Kucera, M.: Magnetic susceptibility of ODP Site 154-927, Pliocene Warm Period (3095 to 3307 ka) interval, PANGAEA [data set], https://doi.org/10.1594/PANGAEA.945773, 2022b
Cornuault, P., Westerhold, T., Pälike, H., Bickert, T., Baumann, K.-H., and Kucera, M.: Oxygen and carbon stable isotopes ratios from benthic foraminifera from Miocene Climatic Optimum (MCO) (15589 to 15964 ka) time interval, ODP Hole 154-927A, Ceara Rise, tropical Atlantic Ocean, PANGAEA [data set], https://doi.org/10.1594/PANGAEA.945812, 2022c.
Cornuault, P., Westerhold, T., Pälike, H., Bickert, T., Baumann, K.-H., and Kucera, M.: Carbonate content analyses and accumulation rate data for the marine isotopic stage (MIS) 5, MIS 9, MIS KM5 and MCO, ODP Site 154-927, Ceara Rise, tropical Atlantic Ocean, PANGAEA [data set], https://doi.org/10.1594/PANGAEA.945789, 2022d.
Cornuault, P., Westerhold, T., Pälike, H., Bickert, T., Baumann, K.-H., and Kucera, M.: Splice composition of ODP Site 154-927, 110.43 mcd to 119.79 mcd interval, Ceara Rise, tropical Atlantic, PANGAEA [data set], https://doi.org/10.1594/PANGAEA.945707, 2022e.
Cullen, J. L. and Curry, W. B.: Variations in planktonic foraminifer faunas and carbonate preservation at site 927: Evidence for changing surface water conditions in the western tropical Atlantic ocean during the middle Pleistocene, in: Proceedings of the Ocean Drilling Program, edited by: Shackleton, N. J., Curry, W. B., Richter, C., and Bralower, T. J., Sci. Results, Vol. 154, College Station, TX, Ocean Drilling Program, 207–228, https://doi.org/10.2973/odp.proc.sr.154.111.1997, 1997.
Curry, W. B. and Cullen, J. L.: Carbonate production and dissolution in the western equatorial Atlantic during the last 1 My, in: Proceedings of the Ocean Drilling Program, edited by: Shackleton, N. J., Curry, W. B., Richter, C., and Bralower, T. J., Scientific Results, Vol. 154, College Station, TX, Ocean Drilling Program, 189–199, https://doi.org/10.2973/odp.proc.sr.154.112.1997, 1997.
Curry, W. B., Shackleton, N. J., Richter, C., and et al. (Eds.): Proceedings of the Ocean Drilling Program, 154 Initial Reports, Ocean Drilling Program, https://doi.org/10.2973/odp.proc.ir.154.1995, 1995.
De Vleeschouwer, D., Vahlenkamp, M., Crucifix, M., and Pälike, H.: Alternating Southern and Northern Hemisphere climate response to astronomical forcing during the past 35 My, Geology, 45, 375–378, https://doi.org/10.1130/G38663.1, 2017.
De Vleeschouwer, D., Drury, A. J., Vahlenkamp, M., Rochholz, F., Liebrand, D., and Pälike, H.: High-latitude biomes and rock weathering mediate climate–carbon cycle feedbacks on eccentricity timescales, Nat. Commun., 11, 5013, https://doi.org/10.1038/s41467-020-18733-w, 2020.
Dodson, J. and Macphail, M. K.: Palynological evidence for aridity events and vegetation change during the Middle Pliocene, a warm period in Southwestern Australia, Glob. Planet. Change, 41, 285–307, https://doi.org/10.1016/j.gloplacha.2004.01.013, 2004.
Drury, A. J., Liebrand, D., Westerhold, T., Beddow, H. M., Hodell, D. A., Rohlfs, N., Wilkens, R. H., Lyle, M., Bell, D. B., Kroon, D., Pälike, H., and Lourens, L. J.: Climate, cryosphere and carbon cycle controls on Southeast Atlantic orbital-scale carbonate deposition since the Oligocene (30–0 Ma), Clim. Past, 17, 2091–2117, https://doi.org/10.5194/cp-17-2091-2021, 2021.
Feely, R. A.: Impact of Anthropogenic CO2 on the CaCO3 System in the Oceans, Science, 305, 362–366, https://doi.org/10.1126/science.1097329, 2004.
Foster, G. L., Lear, C. H., and Rae, J. W. B.: The evolution of pCO2, ice volume and climate during the middle Miocene, Earth Pl. Sc. Lett., 341, 243–254, https://doi.org/10.1016/j.epsl.2012.06.007, 2012.
Frenz, M., Baumann, K.-H., Boeckel, B., Hoppner, R., and Henrich, R.: Quantification of Foraminifer and Coccolith Carbonate in South Atlantic Surface Sediments by Means of Carbonate Grain-Size Distributions, J. Sediment. Res., 75, 464–475, https://doi.org/10.2110/jsr.2005.036, 2005.
Frenz, M., Henrich, R., and Zychla, B.: Carbonate preservation patterns at the Ceará Rise – Evidence for the Pliocene super conveyor, Mar. Geol., 232, 173–180, https://doi.org/10.1016/j.margeo.2006.07.006, 2006.
Gehlen, M., Gangstø, R., Schneider, B., Bopp, L., Aumont, O., and Ethe, C.: The fate of pelagic CaCO3 production in a high CO2 ocean: a model study, Biogeosciences, 4, 505–519, https://doi.org/10.5194/bg-4-505-2007, 2007.
Gouveia, N. A., Gherardi, D. F. M., and Aragão, L. E. O. C.: The Role of the Amazon River Plume on the Intensification of the Hydrological Cycle, Geophys. Res. Lett., 9, 12221–12229, https://doi.org/10.1029/2019GL084302, 2019.
Gröger, M., Henrich, R., and Bickert, T.: Glacial–interglacial variability in lower North Atlantic deep water: inference from silt grain-size analysis and carbonate preservation in the western equatorial Atlantic, Mar. Geol., 201, 321–332, https://doi.org/10.1016/S0025-3227(03)00263-9, 2003a.
Gröger, M., Henrich, R., and Bickert, T.: Variability of silt grain size and planktonic foraminiferal preservation in Plio/Pleistocene sediments from the western equatorial Atlantic and Caribbean, Mar. Geol., 201, 307–320, https://doi.org/10.1016/S0025-3227(03)00264-0, 2003b.
Haq, B. U., Hardenbol, J., and Vail, P. R.: Chronology of Fluctuating Sea Levels Since the Triassic, Science, 235, 1156–1167, https://doi.org/10.1126/science.235.4793.1156, 1987.
Harris, S. E., Mix, A. C., and King, T.: Biogenic and terrigenous sedimentation at Ceara Rise, western tropical Atlantic, supports Pliocene–Pleistocene deep-water linkage between hemispheres, in: Proceedings of the Ocean Drilling Program, edited by: Shackleton, N. J., Curry, W. B., Richter, C., and Bralower, T. J., Proc. ODP, Sci. Results, Vol. 154, College Station, TX, Ocean Drilling Program, 331–345, https://doi.org/10.2973/odp.proc.sr.154.114.1997, 1997.
Haywood, A. M., Valdes, P. J., and Sellwood, B. W.: Global scale palaeoclimate reconstruction of the middle Pliocene climate using the UKMO GCM: initial results, Glob. Planet. Change, 25, 239–256, https://doi.org/10.1016/S0921-8181(00)00028-X, 2000.
Haywood, A. M., Dolan, A. M., Pickering, S. J., Dowsett, H. J., McClymont, E. L., Prescott, C. L., Salzmann, U., Hill, D. J., Hunter, S. J., Lunt, D. J., Pope, J. O., and Valdes, P. J.: On the identification of a Pliocene time slice for data-model comparison, Philos. T. R. Soc. A, 371, 20120515, https://doi.org/10.1098/rsta.2012.0515, 2013.
Henson, S. A., Sanders, R., and Madsen, E.: Global patterns in efficiency of particulate organic carbon export and transfer to the deep ocean, Global Biogeochem. Cy., 26, GB1028, https://doi.org/10.1029/2011GB004099, 2012.
Herbert, T. D., Lawrence, K. T., Tzanova, A., Peterson, L. C., Caballero-Gill, R., and Kelly, C. S.: Late Miocene global cooling and the rise of modern ecosystems, Nat. Geosci., 9, 843–847, https://doi.org/10.1038/ngeo2813, 2016.
Herrford, J., Brandt, P., and Zenk, W.: Property changes of deep and bottom waters in the Western Tropical Atlantic, Deep-Sea Res. Pt. I, 124, 103–125, https://doi.org/10.1016/j.dsr.2017.04.007, 2017.
Holbourn, A., Kuhnt, W., Schulz, M., Flores, J.-A., and Andersen, N.: Orbitally-paced climate evolution during the middle Miocene “Monterey” carbon-isotope excursion, Earth Pl. Sc. Lett., 261, 534–550, https://doi.org/10.1016/j.epsl.2007.07.026, 2007.
Holbourn, A., Kuhnt, W., Kochhann, K. G. D., Andersen, N., and Sebastian Meier, K. J.: Global perturbation of the carbon cycle at the onset of the Miocene Climatic Optimum, Geology, 43, 123–126, https://doi.org/10.1130/G36317.1, 2015.
Holbourn, A. E., Kuhnt, W., Clemens, S. C., Kochhann, K. G. D., Jöhnck, J., Lübbers, J., and Andersen, N.: Late Miocene climate cooling and intensification of southeast Asian winter monsoon, Nat. Commun., 9, 1584, https://doi.org/10.1038/s41467-018-03950-1, 2018.
Howard, W. R.: A warm future in the past, Nature, 388, 418–419, https://doi.org/10.1038/41201, 1997.
Katz, M. E., Katz, D. R., Wright, J. D., Miller, K. G., Pak, D. K., Shackleton, N. J., and Thomas, E.: Early Cenozoic benthic foraminiferal isotopes: Species reliability and interspecies correction factors, Paleoceanography, 18, 1024, https://doi.org/10.1029/2002PA000798, 2003.
King, T. A., Ellis, W. G., Murray, D. W., Shackleton, N. J., and Harris, S.: 23. Miocene evolution of carbonate sedimentation at the Ceara Rise: A multivariate data/proxy approach, edited by: Shackleton, N. J., Curry, W. B., Richter, C., and Bralower, T. J., Proc. ODP, Sci. Results, Vol. 154, College Station, TX, Ocean Drilling Program, 349–365, https://doi.org/10.2973/odp.proc.sr.154.116.1997, 1997.
Kopp, R. E., Simons, F. J., Mitrovica, J. X., Maloof, A. C., and Oppenheimer, M.: Probabilistic assessment of sea level during the last interglacial stage, Nature, 462, 863–868, https://doi.org/10.1038/nature08686, 2009.
Kukla, G.: How long and how stable was the last interglacial?, Quaternary Sci. Rev., 16, 605–612, https://doi.org/10.1016/S0277-3791(96)00114-X, 1997.
Kurschner, W. M., Kvacek, Z., and Dilcher, D. L.: The impact of Miocene atmospheric carbon dioxide fluctuations on climate and the evolution of terrestrial ecosystems, P. Natl. Acad. Sci. USA, 105, 449–453, https://doi.org/10.1073/pnas.0708588105, 2008.
Landschützer, P., Gruber, N., Bakker, D. C. E., and Schuster, U.: Recent variability of the global ocean carbon sink, Global Biogeochem. Cy., 28, 927–949, https://doi.org/10.1002/2014GB004853, 2014.
Laskar, J., Robutel, P., Joutel, F., Gastineau, M., Correia, A. C. M., and Levrard, B.: A long-term numerical solution for the insolation quantities of the Earth, Astron. Astrophys., 428, 261–285, https://doi.org/10.1051/0004-6361:20041335, 2004.
Leroy, S. and Dupont, L.: Development of vegetation and continental aridity in northwestern Africa during the Late Pliocene: the pollen record of ODP site 658, Palaeogeogr. Palaeocl., 109, 295–316, https://doi.org/10.1016/0031-0182(94)90181-3, 1994.
Liebrand, D., Beddow, H. M., Lourens, L. J., Pälike, H., Raffi, I., Bohaty, S. M., Hilgen, F. J., Saes, M. J. M., Wilson, P. A., van Dijk, A. E., Hodell, D. A., Kroon, D., Huck, C. E., and Batenburg, S. J.: Cyclostratigraphy and eccentricity tuning of the early Oligocene through early Miocene (30.1–17.1 Ma): Cibicides mundulus stable oxygen and carbon isotope records from Walvis Ridge Site 1264, Earth Pl. Sc. Lett., 450, 392–405, https://doi.org/10.1016/j.epsl.2016.06.007, 2016.
Lisiecki, L. E. and Raymo, M. E.: A Pliocene-Pleistocene stack of 57 globally distributed benthic δ18O records, Paleoceanography, 20, PA1003, https://doi.org/10.1029/2004PA001071, 2005.
Lunt, D. J., Foster, G. L., Haywood, A. M., and Stone, E. J.: Late Pliocene Greenland glaciation controlled by a decline in atmospheric CO2 levels, Nature, 454, 1102–1105, https://doi.org/10.1038/nature07223, 2008.
Lunt, D. J., Haywood, A. M., Schmidt, G. A., Salzmann, U., Valdes, P. J., and Dowsett, H. J.: Earth system sensitivity inferred from Pliocene modelling and data, Nat. Geosci., 3, 60–64, https://doi.org/10.1038/ngeo706, 2010.
Lyle, M.: Neogene carbonate burial in the Pacific Ocean, Paleoceanography, 18, 1059, https://doi.org/10.1029/2002PA000777, 2003.
Lyle, M., Drury, A. J., Tian, J., Wilkens, R., and Westerhold, T.: Late Miocene to Holocene high-resolution eastern equatorial Pacific carbonate records: stratigraphy linked by dissolution and paleoproductivity, Clim. Past, 15, 1715–1739, https://doi.org/10.5194/cp-15-1715-2019, 2019.
Marino, M., Maiorano, P., Tarantino, F., Voelker, A., Capotondi, L., Girone, A., Lirer, F., Flores, J.-A., and Naafs, B. D. A.: Coccolithophores as proxy of seawater changes at orbital-to-millennial scale during middle Pleistocene Marine Isotope Stages 14-9 in North Atlantic core MD01-2446, Paleoceanography, 29, 518–532, https://doi.org/10.1002/2013PA002574, 2014.
Mejía, L. M., Méndez-Vicente, A., Abrevaya, L., Lawrence, K. T., Ladlow, C., Bolton, C., Cacho, I., and Stoll, H.: A diatom record of CO2 decline since the late Miocene, Earth Pl. Sc. Lett., 479, 18–33, https://doi.org/10.1016/j.epsl.2017.08.034, 2017.
Meyers, S. R.: Astrochron: An R package for astrochronology, https://cran.r-project.org/package=astrochron (last access: 18 January 2023). 2014.
Miller, K. G., Wright, J. D., Browning, J. V., Kulpecz, A., Kominz, M., Naish, T. R., Cramer, B. S., Rosenthal, Y., Peltier, W. R., and Sosdian, S.: High tide of the warm Pliocene: Implications of global sea level for Antarctic deglaciation, Geology, 40, 407–410, https://doi.org/10.1130/G32869.1, 2012.
Milliman, J. D.: Production and accumulation of calcium carbonate in the ocean: budget of a nonsteady state, Global Biogeochem. Cy., 7, 927–957, 1993.
Müller, U. C. and Kukla, G. J.: North Atlantic Current and European environments during the declining stage of the last interglacial, Geology, 32, 1009, https://doi.org/10.1130/G20901.1, 2004.
Naish, T., Powell, R., Levy, R., Wilson, G., Scherer, R., Talarico, F., Krissek, L., Niessen, F., Pompilio, M., Wilson, T., Carter, L., DeConto, R., Huybers, P., McKay, R., Pollard, D., Ross, J., Winter, D., Barrett, P., Browne, G., Cody, R., Cowan, E., Crampton, J., Dunbar, G., Dunbar, N., Florindo, F., Gebhardt, C., Graham, I., Hannah, M., Hansaraj, D., Harwood, D., Helling, D., Henrys, S., Hinnov, L., Kuhn, G., Kyle, P., Läufer, A., Maffioli, P., Magens, D., Mandernack, K., McIntosh, W., Millan, C., Morin, R., Ohneiser, C., Paulsen, T., Persico, D., Raine, I., Reed, J., Riesselman, C., Sagnotti, L., Schmitt, D., Sjunneskog, C., Strong, P., Taviani, M., Vogel, S., Wilch, T., and Williams, T.: Obliquity-paced Pliocene West Antarctic ice sheet oscillations, Nature, 458, 322–328, https://doi.org/10.1038/nature07867, 2009.
Pagani, M., Liu, Z., LaRiviere, J., and Ravelo, A. C.: High Earth-system climate sensitivity determined from Pliocene carbon dioxide concentrations, Nat. Geosci., 3, 27–30, https://doi.org/10.1038/ngeo724, 2010.
Paillard, D., Labeyrie, L., and Yiou, P.: Macintosh Program performs time-series analysis, Eos Trans. AGU, 77, 379–379, https://doi.org/10.1029/96EO00259, 1996.
Pälike, H., Frazier, J., and Zachos, J. C.: Extended orbitally forced palaeoclimatic records from the equatorial Atlantic Ceara Rise, Quaternary Sci. Rev., 25, 3138–3149, https://doi.org/10.1016/j.quascirev.2006.02.011, 2006a.
Pälike, H., Norris, R. D., Herrle, J. O., Wilson, P. A., Coxall, H. K., Lear, C. H., Shackleton, N. J., Tripati, A. K., and Wade, B. S.: The Heartbeat of the Oligocene Climate System, Science, 314, 1894–1898, https://doi.org/10.1126/science.1133822, 2006b.
Pälike, H., Lyle, M., Nishi, H., Raffi, I., Gamage, K., Klaus, A., and Expedition 320/321 Scientists (Eds.): Proceedings of the Integrated Ocean Drilling Program, 320/321, International Ocean Discovery Program, https://doi.org/10.2204/iodp.proc.320321.2010, 2010.
Passow, U. and Carlson, C.: The biological pump in a high CO2 world, Mar. Ecol. Prog. Ser., 470, 249–271, https://doi.org/10.3354/meps09985, 2012.
Past Interglacials Working Group of PAGES: Interglacials of the last 800,000 years, Rev. Geophys., 54, 162–219, https://doi.org/10.1002/2015RG000482, 2016.
Paul, H. A., Zachos, J. C., Flower, B. P., and Tripati, A.: Orbitally induced climate and geochemical variability across the Oligocene/Miocene boundary, Paleoceanography, 15, 471–485, https://doi.org/10.1029/1999PA000443, 2000.
Petit, J. R., Jouzel, J., Raynaud, D., Barkov, N. I., Barnola, J.-M., Basile, I., Bender, M., Chappellaz, J., Davis, M., Delaygue, G., Delmotte, M., Kotlyakov, V. M., Legrand, M., Lipenkov, V. Y., Lorius, C., PÉpin, L., Ritz, C., Saltzman, E., and Stievenard, M.: Climate and atmospheric history of the past 420,000 years from the Vostok ice core, Antarctica, Nature, 399, 429–436, https://doi.org/10.1038/20859, 1999.
Pollard, D. and DeConto, R. M.: Modelling West Antarctic ice sheet growth and collapse through the past five million years, Nature, 458, 329–332, https://doi.org/10.1038/nature07809, 2009.
Pound, M. J., Haywood, A. M., Salzmann, U., and Riding, J. B.: Global vegetation dynamics and latitudinal temperature gradients during the Mid to Late Miocene (15.97–5.33 Ma), Earth-Sci. Rev., 112, 1–22, https://doi.org/10.1016/j.earscirev.2012.02.005, 2012.
Preiss-Daimler, I. V., Henrich, R., and Bickert, T.: The final Miocene carbonate crash in the Atlantic: Assessing carbonate accumulation, preservation and production, Mar. Geol., 343, 39–46, https://doi.org/10.1016/j.margeo.2013.06.010, 2013.
R Core Team: R: A language and environment for statistical computing. R Foundation for Statistical Computing, Vienna, Austria, 2021.
Raffi, I., Wade, B. S., Pälike, H., Beu, A. G., Cooper, R., Crundwell, M. P., Krijgsman, W., Moore, T., Raine, I., Sardella, R., and Vernyhorova, Y. V.: The Neogene Period, in: Geologic Time Scale 2020, Elsevier, 1141–1215, https://doi.org/10.1016/B978-0-12-824360-2.00029-2, 2020.
Raitzsch, M., Bijma, J., Bickert, T., Schulz, M., Holbourn, A., and Kučera, M.: Atmospheric carbon dioxide variations across the middle Miocene climate transition, Clim. Past, 17, 703–719, https://doi.org/10.5194/cp-17-703-2021, 2021.
Rasband, W. S.: ImageJ, https://imagej.net/ij/index.html (last access: 18 January 2023), 1997.
Rathmann, S. and Kuhnert, H.: Carbonate ion effect on Mg/Ca, Sr/Ca and stable isotopes on the benthic foraminifera Oridorsalis umbonatus off Namibia, Mar. Micropaleontol., 66, 120–133, https://doi.org/10.1016/j.marmicro.2007.08.001, 2008.
Ravelo, A. C. and Wara, M. W.: The Role of the Tropical Oceans on Global Climate During a Warm Period and a Major Climate Transition, Oceanography, 17, 32–41, https://doi.org/10.5670/oceanog.2004.28, 2004.
Ruddiman, W. F.: A Paleoclimatic Enigma?, Science, 328, 838–839, https://doi.org/10.1126/science.1188292, 2010.
Rühlemann, C., Diekmann, B., Mulitza, S., and Frank, M.: Late Quaternary changes of western equatorial Atlantic surface circulation and Amazon lowland climate recorded in Ceará Rise deep-sea sediments, Paleoceanography, 16, 293–305, https://doi.org/10.1029/1999PA000474, 2001.
Salzmann, U., Williams, M., Haywood, A. M., Johnson, A. L. A., Kender, S., and Zalasiewicz, J.: Climate and environment of a Pliocene warm world, Palaeogeogr. Palaeocl., 309, 1–8, https://doi.org/10.1016/j.palaeo.2011.05.044, 2011.
Sarmiento, J. L. and Gruber, N.: Ocean biogeochemical dynamics, Princeton University Press, Princeton, 503 pp., ISBN: 978-0-691-01707-5, 2006.
Sarmiento, J. L., Gruber, N., Brzezinski, M. A., and Dunne, J. P.: High-latitude controls of thermocline nutrients and low latitude biological productivity, Nature, 427, 56–60, https://doi.org/10.1038/nature02127, 2004.
Schlitzer, R.: Ocean Data View, version 5.1.7, https://odv.awi.de (last access: 18 January 2023), 2018.
Seki, O., Foster, G. L., Schmidt, D. N., Mackensen, A., Kawamura, K., and Pancost, R. D.: Alkenone and boron-based Pliocene pCO2 records, Earth Pl. Sc. Lett., 292, 201–211, https://doi.org/10.1016/j.epsl.2010.01.037, 2010.
Shackleton, N. J. and Crowhurst, S.: Sediment fluxes based on an orbitally tuned time scale 5 Ma to 14 Ma, Site 926, in: Proceedings of the Ocean Drilling Program, edited by: Shackleton, N. J., Curry, W. B., Richter, C., and Bralower, T. J., Proc. ODP, Sci. Results, Vol. 154, College Station, TX, Ocean Drilling Program, 69–82, https://doi.org/10.2973/odp.proc.sr.154.102.1997, 1997.
Shackleton, N. J., Crowhurst, S. J., Weedon, G. P., and Laskar, J.: Astronomical calibration of Oligocene–Miocene time, Philos. T. R. Soc. Lond. Ser. A, 357, 1907–1929, https://doi.org/10.1098/rsta.1999.0407, 1999.
Sirocko, F., Seelos, K., Schaber, K., Rein, B., Dreher, F., Diehl, M., Lehne, R., Jäger, K., Krbetschek, M., and Degering, D.: A late Eemian aridity pulse in central Europe during the last glacial inception, Nature, 436, 833–836, https://doi.org/10.1038/nature03905, 2005.
Stap, L. B., de Boer, B., Ziegler, M., Bintanja, R., Lourens, L. J., and van de Wal, R. S. W.: CO2 over the past 5 million years: Continuous simulation and new δ11B-based proxy data, Earth Pl. Sci. Lett., 439, 1–10, https://doi.org/10.1016/j.epsl.2016.01.022, 2016.
Stolz, K. and Baumann, K.-H.: Changes in palaeoceanography and palaeoecology during Marine Isotope Stage (MIS) 5 in the eastern North Atlantic (ODP Site 980) deduced from calcareous nannoplankton observations, Palaeogeogr. Palaeocl., 292, 295–305, https://doi.org/10.1016/j.palaeo.2010.04.002, 2010.
Sutherland, R., Dos Santos, Z., Agnini, C., Alegret, L., Lam, A. R., Westerhold, T., Drake, M. K., Harper, D. T., Dallanave, E., Newsam, C., Cramwinckel, M. J., Dickens, G. R., Collot, J., Etienne, S. J. G., Bordenave, A., Stratford, W. R., Zhou, X., Li, H., and Asatryan, G.: Neogene Mass Accumulation Rate of Carbonate Sediment Across Northern Zealandia, Tasman Sea, Southwest Pacific, Paleoceanogr. Paleocl., 37, e2021PA004294, https://doi.org/10.1029/2021PA004294, 2022.
Tiedemann, R. and Franz, S. O.: Deep-water circulation, chemistry, and terrigenous sediment supply in the equatorial Atlantic during the Pliocene, 3.3–2.6 Ma and 5–4.5 Ma, in: Proceedings of the Ocean Drilling Program, edited by: Shackleton, N. J., Curry, W. B., Richter, C., and Bralower, T. J., Proc. ODP, Sci. Results, Vol. 154, College Station, TX, Ocean Drilling Program, 299–318, https://doi.org/10.2973/odp.proc.sr.154.120.1997, 1997.
Vervoort, P., Kirtland Turner, S., Rochholz, F., and Ridgwell, A.: Earth System Model Analysis of How Astronomical Forcing Is Imprinted Onto the Marine Geological Record: The Role of the Inorganic (Carbonate) Carbon Cycle and Feedbacks, Paleoceanogr. Paleocl., 36, e2020PA004090, https://doi.org/10.1029/2020PA004090, 2021.
Voelker, A. H. L., Rodrigues, T., Billups, K., Oppo, D., McManus, J., Stein, R., Hefter, J., and Grimalt, J. O.: Variations in mid-latitude North Atlantic surface water properties during the mid-Brunhes (MIS 9–14) and their implications for the thermohaline circulation, Clim. Past, 6, 531–552, https://doi.org/10.5194/cp-6-531-2010, 2010.
Westerhold, T., Marwan, N., Drury, A. J., Liebrand, D., Agnini, C., Anagnostou, E., Barnet, J. S. K., Bohaty, S. M., De Vleeschouwer, D., Florindo, F., Frederichs, T., Hodell, D. A., Holbourn, A. E., Kroon, D., Lauretano, V., Littler, K., Lourens, L. J., Lyle, M., Pälike, H., Röhl, U., Tian, J., Wilkens, R. H., Wilson, P. A., and Zachos, J. C.: An astronomically dated record of Earth's climate and its predictability over the last 66 million years, Science, 369, 1383–1387, https://doi.org/10.1126/science.aba6853, 2020.
Wilkens, R. H., Westerhold, T., Drury, A. J., Lyle, M., Gorgas, T., and Tian, J.: Revisiting the Ceara Rise, equatorial Atlantic Ocean: isotope stratigraphy of ODP Leg 154 from 0 to 5 Ma, Clim. Past, 13, 779–793, https://doi.org/10.5194/cp-13-779-2017, 2017.
Yasuhara, M., Wei, C.-L., Kucera, M., Costello, M. J., Tittensor, D. P., Kiessling, W., Bonebrake, T. C., Tabor, C. R., Feng, R., Baselga, A., Kretschmer, K., Kusumoto, B., and Kubota, Y.: Past and future decline of tropical pelagic biodiversity, P. Natl. Acad. Sci. USA, 117, 12891–12896, https://doi.org/10.1073/pnas.1916923117, 2020.
You, Y., Huber, M., Muller, R. D., Poulsen, C. J., and Ribbe, J.: Simulation of the Middle Miocene Climate Optimum, Geophys. Res. Lett., 36, L04702, https://doi.org/10.1029/2008GL036571, 2009.
Zachos, J.: Trends, Rhythms, and Aberrations in Global Climate 65 Ma to Present, Science, 292, 686–693, https://doi.org/10.1126/science.1059412, 2001a.
Zachos, J. C.: Climate Response to Orbital Forcing Across the Oligocene-Miocene Boundary, Science, 292, 274–278, https://doi.org/10.1126/science.1058288, 2001b.
Zachos, J. C., Dickens, G. R., and Zeebe, R. E.: An early Cenozoic perspective on greenhouse warming and carbon-cycle dynamics, Nature, 451, 279–283, https://doi.org/10.1038/nature06588, 2008.
Zeeden, C., Hilgen, F., Westerhold, T., Lourens, L., Röhl, U., and Bickert, T.: Revised Miocene splice, astronomical tuning and calcareous plankton biochronology of ODP Site 926 between 5 and 14.4 Ma, Palaeogeogr. Palaeocl., 369, 430–451, https://doi.org/10.1016/j.palaeo.2012.11.009, 2013.
Zeeden, C., Meyers, S. R., Lourens, L. J., and Hilgen, F. J.: Testing astronomically tuned age models, Paleoceanography, 30, 369–383, https://doi.org/10.1002/2014PA002762, 2015.