the Creative Commons Attribution 4.0 License.
the Creative Commons Attribution 4.0 License.
 | 20 Feb 2023
Stability of alkalinity in ocean alkalinity enhancement (OAE) approaches – consequences for durability of CO2 storage
Niels Suitner
Julieta Schneider
Laura Marín-Samper
Javier Arístegui
Phil Renforth
Jan Taucher
Ulf Riebesell
According to modelling studies, ocean alkalinity enhancement (OAE) is one of the proposed carbon dioxide removal (CDR) approaches with large potential, with the beneficial side effect of counteracting ocean acidification. The real-world application of OAE, however, remains unclear as most basic assumptions are untested. Before large-scale deployment can be considered, safe and sustainable procedures for the addition of alkalinity to seawater must be identified and governance established. One of the concerns is the stability of alkalinity when added to seawater. The surface ocean is already supersaturated with respect to calcite and aragonite, and an increase in total alkalinity (TA) together with a corresponding shift in carbonate chemistry towards higher carbonate ion concentrations would result in a further increase in supersaturation, and potentially to solid carbonate precipitation. Precipitation of carbonate minerals consumes alkalinity and increases dissolved CO2 in seawater, thereby reducing the efficiency of OAE for CO2 removal. In order to address the application of alkaline solution as well as fine particulate alkaline solids, a set of six experiments was performed using natural seawater with alkalinity of around 2400 µmol kgsw−1. The application of CO2-equilibrated alkaline solution bears the lowest risk of losing alkalinity due to carbonate phase formation if added total alkalinity (ΔTA) is less than 2400 µmol kgsw−1. The addition of reactive alkaline solids can cause a net loss of alkalinity if added ΔTA > 600 µmol kgsw−1 (e.g. for Mg(OH)2). Commercially available (ultrafine) Ca(OH)2 causes, in general, a net loss in TA for the tested amounts of TA addition, which has consequences for suggested use of slurries with alkaline solids supplied from ships. The rapid application of excessive amounts of Ca(OH)2, exceeding a threshold for alkalinity loss, resulted in a massive increase in TA (> 20 000 µmol kgsw−1) at the cost of lower efficiency and resultant high pH values > 9.5. Analysis of precipitates indicates formation of aragonite. However, unstable carbonate phases formed can partially redissolve, indicating that net loss of a fraction of alkalinity may not be permanent, which has important implications for real-world OAE application.
Our results indicate that using an alkaline solution instead of reactive alkaline particles can avoid carbonate formation, unless alkalinity addition via solutions shifts the system beyond critical supersaturation levels. To avoid the loss of alkalinity and dissolved inorganic carbon (DIC) from seawater, the application of reactor techniques can be considered. These techniques produce an equilibrated solution from alkaline solids and CO2 prior to application. Differing behaviours of tested materials suggest that standardized engineered materials for OAE need to be developed to achieve safe and sustainable OAE with solids, if reactors technologies should be avoided.
- Article
(10520 KB) - Full-text XML
-
Supplement
(15264 KB) - BibTeX
- EndNote


The impacts of climate warming are increasingly severe (IPCC, 2021). To tackle this problem, the 2 ∘C target was stipulated in the 2015 Paris Agreement (UNFCCC, 2015). While many countries claim to have shown efforts to decrease greenhouse gas emissions, the overall emissions are still rising (Friedlingstein et al., 2022), and it seems now improbable to reach the target by mitigation alone, without the help of negative emission technologies (NETs) (IPCC, 2021). However, most discussed NETs or carbon dioxide removal (CDR) technologies are still immature for upscaling or even ready for operation.
Ocean alkalinity enhancement (OAE) is one of the CDR strategies being considered (NASEM, 2022). However, its potential impacts are not well understood, as well as the practicalities of operating at scale, like suitable approaches to monitoring and verification. This is due to the lack of laboratory and field experiments targeting OAE, while laboratory experiments, focusing on seawater carbonate chemistry in general, exist in large quantities, with limited implication for OAE application. Consequences of application and techniques for optimal deployment need, therefore, to be determined to develop sustainable ways of OAE. A number of model studies exist (Fakhraee et al., 2022; González and Ilyina, 2016; Ilyina et al., 2013; Kheshgi, 1995; Lenton et al., 2018) focusing on the consequences of OAE at the global scale or the applicability via (cargo) ships (Caserini et al., 2021). They are, however, based on a series of assumptions, e.g. that added alkalinity remains stable or is not lost, or negative net change in total alkalinity (TA) due application of OAE is not a consequence, and that alkalinity can be technically added to seawater.
One of the key questions to be solved for OAE is the stability of the added alkalinity (Moras et al., 2022). Additional alkalinity loss via carbonate phase formation (causing CO2 leakage), either via inorganic processes or triggered by biological activity, should be avoided. The carbonate supersaturation level is a driver for possible formation of new carbonate phases (Koishi, 2017). Nucleation of new phases is the greatest energy barrier to encompass before crystal growth can continue (Sun et al., 2015). After nucleation from a bulk solution and for the growth to proceed, a further energy barrier at the interface between the new phase and the surrounding solution matrix must be overcome (Koishi, 2017; Sear, 2007).
Carbonate nucleation in seawater, filtered with 0.2 µm filters to remove particles, with a salinity around 35 at 25 ∘C, starts at a saturation level of Ωcalcite around 19–20 (Morse and He, 1993), which corresponds to an Ωaragonite of around 12.5–13.5, depending on temperature and salinity. The filtering of water is for avoiding nuclei for condensation or providing surfaces for carbonate formation (Wurgaft et al., 2021). The energy barrier for carbonate formation on suitable surfaces, like on existing carbonate, is however lower. One of the until now unclear aspects in context of OAE is at which saturation levels carbonate formation in seawater occurs after application of alkalinity and at which time after application this is triggered. In addition, the abundance of possible seed particles and their surface area provided (quality and quantity) for possible heterogenous carbonate formation triggering an alkalinity loss needs to be understood for OAE management.
Addition of alkalinity without equilibrating the water with the atmospheric CO2 causes high saturation levels (due to more pronounced shifts in the carbonate system). Even under optimal natural conditions for air–sea gas exchange, CO2 equilibration could take weeks to months (Jones et al., 2014). Such a non-equilibrated system would be representative for any OAE application where CO2 uptake is not actively facilitated, or where ocean mixing of waters and ingassing is slow. Alternatively, OAE procedures could be conducted in a way that saturation levels after alkalinity application remain low, for example by equilibrating the ocean water with CO2 artificially or using substances which allow for lower saturation levels.
Part of the applied alkalinity due to OAE procedures maybe lost due to carbonate formation, meaning that OAE efficiency should be rated based on the net alkalinity added:
where ΔTAnet refers to net change of TA, TAfinal refers to absolute reached TA after TA addition (measured), TAinitial refers to initial TA of used seawater (measured), ΔTAadded refers to amount of increased TA by alkalinity addition, and ΔTAloss refers to amount of TA decline during the experiment (negative sign).
In order to test for the stability of alkalinity after simulated OAE application, this study aims to address the following five questions using insights from six conducted experiments:
-
What is the efficiency advantage of using pre-produced, CO2-equilibrated alkaline solutions over non-equilibrated alkaline solutions?
-
Do naturally occurring particles or added particles in the ocean water affect the stability range of added alkalinity?
-
Are fast-reacting solid alkaline materials like Ca(OH)2 or even slower ones like Mg(OH)2 useful for adding alkalinity to the seawater?
-
Does lost alkalinity due to carbonate formation recover due to redissolution to some part?
-
At which elevated bulk solution saturation levels can potential loss of alkalinity be expected after how much time?
In order to understand the consequences of different application procedures, materials, and boundary conditions for sustainable application of OAE, a set of six experiments was designed (Table 1) using these basic system setups:
-
Exp. I: A CO2-equilibrated system, using an aqueous solution for OAE, testing 4 d.
-
Exp. II: A non-CO2-equilibrated system using an aqueous solution for OAE, testing 4 d.
-
Exp. III: A CO2-equilibrated system with/without added carbonate particles and, using aqueous solution for OAE, testing a period of ∼ 90 d.
-
Exp. IV: A non-CO2-equilibrated system, using solid particles of magnesium hydroxide (Mg(OH)2) for OAE, testing 4 d.
-
Exp. V: A non-CO2-equilibrated system, using solid alkalinity of Ca(OH)2 for OAE and forcing TA loss to study TA recovery potential, testing 10 d.
-
Exp. VI: Adding excessive amounts of alkaline particles to test if TA loss can be avoided, testing 24 h.
Table 1Overview of the 6 experiments conducted (I–VI). Abbreviations are the following: abiotic (a), seawater filtered with 0.2 µm filters to remove plankton, and biotic (b), seawater filtered with 55 µm filters to remove larger plankton. The column CO2 refers to equilibrated to atmospheric CO2 levels (eq.) or not (neq.); water is the origin of used seawater (GC – Gran Canaria/Taliarte and the North Sea, see below for details). ΔTAadded is the range of added alkalinity per experiment. Numbers of the related research questions (see Introduction) are given in the concept column in brackets.
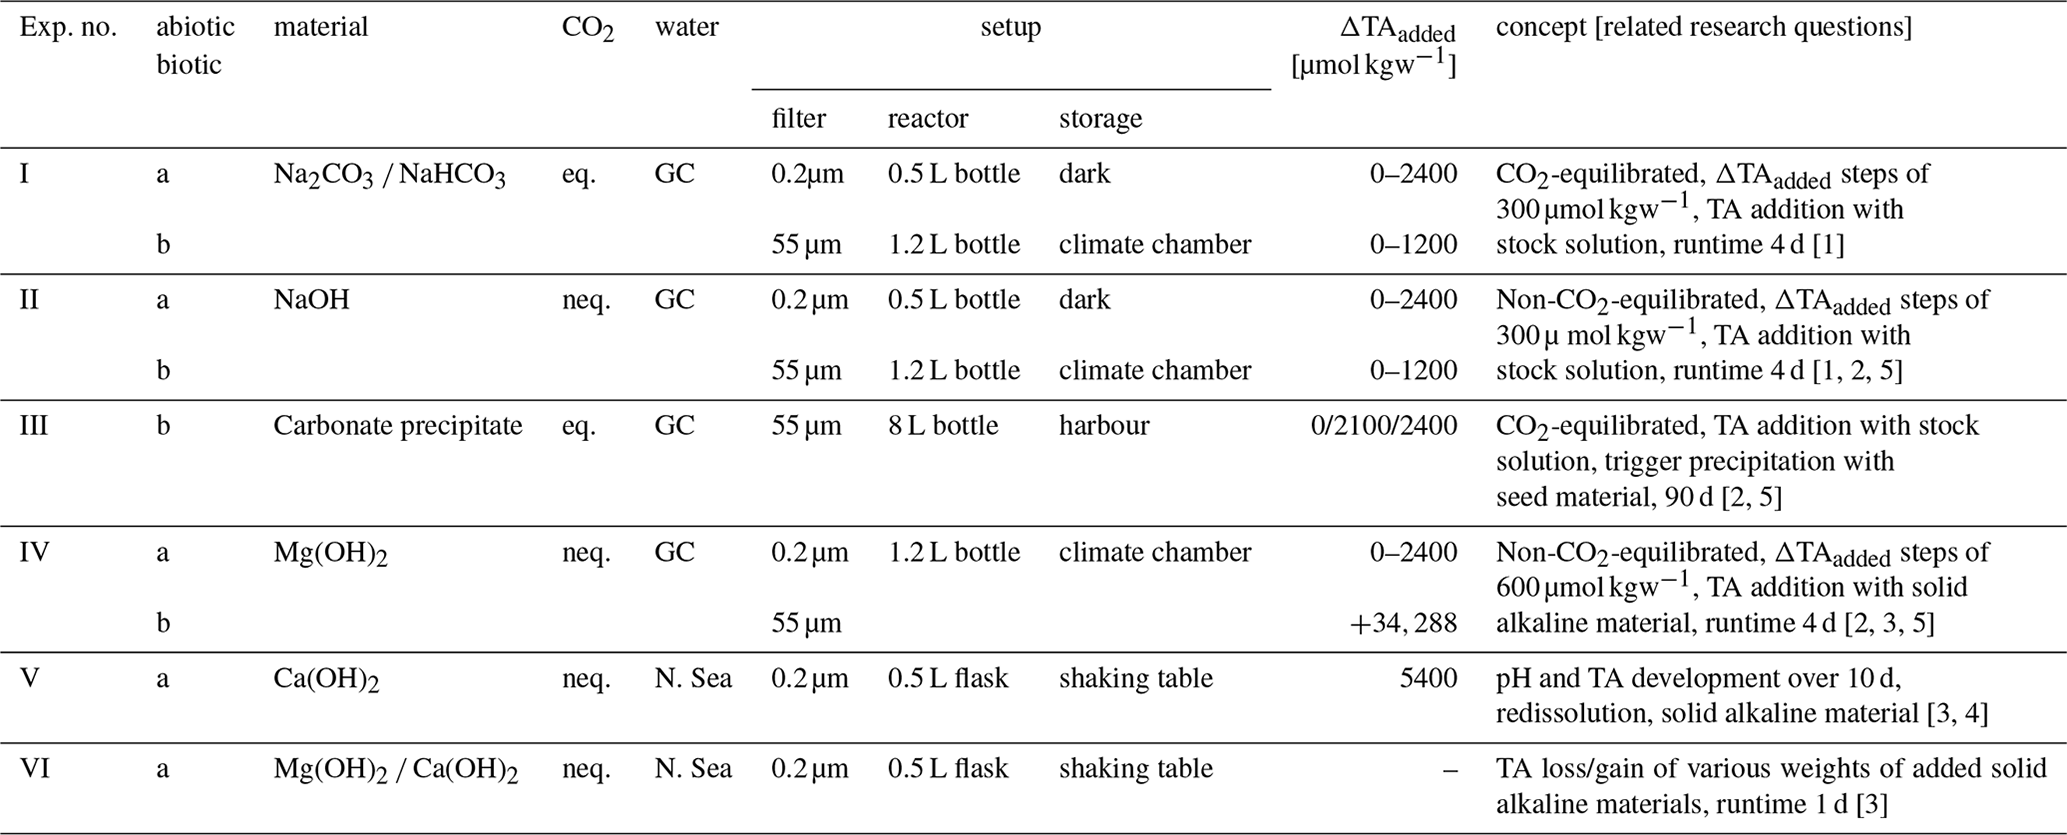
To examine how planktonic organisms and particles naturally occurring in the ocean might affect OAE performance, e.g. by serving as condensation nuclei for mineral precipitation, we performed two separate sets of experiments including and excluding biogenic particles (termed biotic and abiotic hereafter). For the abiotic approach, seawater was filtered through a 0.2 µm PC filter. Seawater for the biotic approach was filtered through a 55 µm filter to exclude larger and rare organisms (e.g. mesozooplankton) but keep the remainder.
For all experiments I to IV, oligotrophic coastal seawater (TAinitial ≈ 2411 µmol kgsw−1, S ≈ 36.6, pH ≈ 8.15, T ≈ 23 ∘C) was taken at 4 m depth in the vicinity of the harbour of Taliarte, Gran Canaria, on 16 September 2021 (I, II, IV) and 30 September 2021 (III). Seawater for the alkalinity recovery test, experiment V, was taken from the open North Sea (German Bight, 54.93∘ N 6.43∘ E, TAinitial ≈ 2297 µmol kgsw−1, S ≈ 32.9, pH ≈ 8.18, DSi 16 µmol L1−). CO2SYS (Pierrot et al., 2006) was used to determine the amount of alkaline solution/solid material needed to increase TA in several steps.
2.1 Experiment I and II: comparing CO2-equilibrated versus non-equilibrated alkalinity enhancement
For the abiotic equilibrated system (Ia), nine batch solutions were prepared adding TA in nine steps of 300 µmol kgsw−1, starting at an initial alkalinity value of ∼ 2400 µmol kgsw−1 (fresh untreated seawater, ΔTA0), with a maximum final treatment of TAfinal ∼ 4800 µmol kgsw−1 (ΔTA2400). The TA enhancement was achieved by adding calculated volumes of 0.5 M NaHCO3 and 0.5 M Na2CO3 solutions using calculations from CO2SYS to ensure CO2-equilibrated conditions (420 ppm – see attached data table for added volumes). While preparing stock solutions with NaHCO3 Na2CO3, solids dissolved entirely within seconds to several minutes. After taking an initial sample (day 0) from every batch, the remaining solutions were filled in portions of 400.0 g ± 0.5 g into 500 mL Dickson bottles (bottles for seawater TA and dissolved inorganic carbon (DIC) standards), each for a duration of 24 h or 96 h. All bottles were stored in the dark, unsealed – open to the laboratory atmosphere and kept at a constant temperature of 24 ∘C.
The exact same procedure was followed for the abiotic non-equilibrated system (IIa), except using a 0.5 M NaOH solution for the alkalinity enhancement and preventing gas exchange by filling the bottle to the top (≈ 525 g) and capping them airtight without headspace.
For the biotic equilibrated system (Ib) and non-equilibrated system (IIb) 1.2 L polycarbonate bottles were used, both filled to the top and capped airtight. Bottles were stored in a climate chamber (24 ∘C and 12/12 h light/dark intervals) over the duration of the experiment to ensure a stable environment for the microbial community. The same seawater, resources, and procedures for alkalinity enhancement were utilized as in the abiotic experiments Ia and IIa. Samples were taken just at the start (day 0) and the end of the experiment (day 4) to avoid headspace in the bottles. Starting with the initial value of seawater (TAinitial ΔTA0), the alkalinity was increased in eight 150 µmol kgsw−1 steps to 3600 µmol kgsw−1 (ΔTA1200).
2.2 Experiment III: testing the role of particles as condensation nuclei for mineral precipitation
We prepared a solution in equilibrium with the atmosphere, as described for experiment I, for the two highest ΔTA treatments, namely ΔTA2100 and ΔTA2400. Solutions were placed into 8 L PET bottles in two treatments: one without adding particles and one with adding previously precipitated carbonates (120 mg wet weight each) as seed material (precipitation nuclei), retrieved from a preceding experiment. The closed bottles were placed next to the pier in the harbour of Taliarte, Gran Canaria, about 1.5 m below the water surface, with average water temperatures around 20–23 ∘C. Samples of 150 mL each were taken at days 0, 2, 4, 6, 8, and 10. After 10 d of the experiment the contents of the bottles were transferred to 500 mL Dickson bottles and left alone, closed to the atmosphere, and in the dark for another 80 d. Two additional samples (40 mL each) were collected at days 46 and 90.
2.3 Experiments IV, V, and VI: testing alkalinization with solid Mg(OH)2 and Ca(OH)2
2.3.1 Experiment IV: Mg(OH)2
While for experiments I and II fast dissolving materials with relatively high solubilities were used to produce an alkaline solution, solid materials were used in experiments IV, V, and VI. Magnesium hydroxide in experiment IV was added as a powder directly into the reactor bottles. Because of a lower reactivity the material was not to be expected to dissolve immediately, so dissolution took place throughout the experimental duration of 4 d. Two different Mg(OH)2 materials from the companies (Negative Emissions Materials (brucite I) and Carl Roth (brucite II)) were utilized to compare their behaviour in dissolution and generation of alkalinity. Brucite I is a substance derived from the dissolution of olivine rich material; brucite II is an industrial product prepared for rapid dissolution. Both the abiotic and biotic approaches (distinction 0.2 µm filtration) were conducted in 1.2 L PC bottles and followed the same procedure as in Ib and IIb, filled airtight to the top and kept in the climate chamber, after mixing them gently for 5 min. The mass of added magnesium hydroxide was calculated to yield the same increase in alkalinity as in experiments I and II, assuming total dissolution could be achieved. The target concentrations ranged from 12.8 to 666 mg kgsw−1 and represented a solid alkalinity addition of 600, 1200, 1800, 2100, 2400, and 34 288 µmol kgsw−1 in ΔTAadded. The latter high addition was intended to simulate an approach assuming large amounts of particles being added, e.g. via ship disposal. The mixing at the beginning should simulate turbulence during application, assuming further low to no turbulence. Given the further still water, a scenario is simulated which lowers the particle boundary layer dynamics. This can be seen as a baseline scenario, where more turbulence might cause higher dissolution rates. In experiment IV liquid subsamples were taken at the start of the experiment and after 24 and 96 h. The brucite material was dried at 40 ∘C for 72 h before the experiments.
2.3.2 Experiment V: alkalinity recovery after mineral precipitation
This experiment focused on the addition of alkalinity due to redissolution of instable alkaline phases formed after Ca(OH)2 application causing an initial net loss of TA. 0.2 g Ca(OH)2 (ΔTAadded ≈ 5400 µmol kgsw−1) were dissolved in 500 mL PC Erlenmeyer flasks filled with 300 g of North Sea water (0.2 µm filtered) and left open to the laboratory atmosphere at 23 ∘C. The experiment was conducted in 12 time steps lasting from 15 min to 10 d, each time step with three replicates and one control flask without any added material. All experimental flasks were permanently placed on a shaking table (120 rpm, the maximum frequency without risking loss of water and to simulate favourable conditions for gas exchange). The pH of the seawater was continuously monitored in 5 min steps. About 100 mL per sample was used for the measurements.
2.3.3 Experiment VI: thresholds – the swing from TA loss to TA gain again
The experiment was set up to check if potential threshold values for net TA loss/gain with the combined effects of alkaline material addition plus mineral precipitation after 24 h exist in case larger amounts of solids are dissolved than in the previous experiments, resulting in the net loss of TA. A gradient of added solid masses to seawater, using the brucite II (experiment IV) and the Ca(OH)2 (experiment V), was used. For this the same seawater as in experiment V was used, adding up to 13.3 g brucite or 2 g Ca(OH)2 kg−1 of seawater and measuring TA after 24 h (see attached data tables for details). The same bottles (500 mL PC flasks) and experimental setup (shaking table) as in experiment V were used.
2.4 Measurements
Immediately after the end of an experiment each sample was filtered (0.2 µm – using Nalgene filtration bottles) to stop possible further reactions on larger particles and remove the biomass from the biotic approaches for further analysis. While filtering, all systems were kept airtight as much as possible to prevent gas exchange with the atmosphere. Samples which were analysed for DIC were filtered with a peristaltic pump and an attached 0.2 µm syringe filter to minimize the air exchange. Samples were measured for total alkalinity (TA), pH, salinity, conductivity, temperature, and biotic samples from experiment I and II for dissolved inorganic carbon (DIC). TA was determined by titration with 0.1 M hydrochloric acid within an 862 Compact Titrosampler (Metrohm) – for samples of day 46 and 90 in experiment III and all samples of experiment V a different titrator (888 Titrando, Metrohm) with a 0.02 M hydrochloric acid was used. DIC was analysed by infrared absorption, using a LI-COR LI-7000 on an AIRICA system (MARIANDA, Kiel). Calibration of TA and DIC measurements was determined against certified reference materials (CRM batches 143 and 190), supplied by Andrew Dickson, Scripps Institution of Oceanography (USA). Single determinations were made for TA measurements, except for experiments Ia and IIa, which were made on two technical replicates. DIC was measured on 2–3 technical replicates. Final values are numerical averages of these replicates. To analyse for pH, salinity, conductivity, and temperature a WTW multimeter (MultiLine® Multi 3630 IDS, pH-probe: SenTix 940 pH-electrode, conductivity: TetraCon 925 cell, Xylem) was employed. The pH-probe was calibrated with WTW buffer solutions according to NIST/PTB in four steps (1.679–9.180 at 25 ∘C) and corrected for seawater after Badocco et al. (2021). For the TetraCon 925 cell 0.01 mol L−1 KCl calibration standards for conductivity cells (WTW, traceable to NIST/PTB) were used.
Variables such as DIC, pCO2, or aragonite saturation state (Ωaragonite) were calculated using measured values of TA and pH (or DIC in the case of experiment Ib and experiment IIb) with CO2SYS version 2.5 Excel sheet (Pierrot et al., 2006), including error propagations based on Orr et al. (2018). The constants in CO2SYS were set to Lueker et al. (2000) for K1 and K2, Dickson (1990) for KHSO4, and Dickson and Riley (1979) for KHF and Uppström (1974) for [B]T Value, while using the seawater pH scale, were used. Filtrates of experiment IIa (day 0, 1, and 4) and V (day 10) were analysed by scanning electron microscopy (SEM) using a Tabletop Microscope Hitachi TM4000plus equipped with an energy-dispersive X-ray spectroscopy (EDX – Bruker Q75), to provide data for the elemental composition and a visual impression of precipitates.
3.1 Experiment I: equilibrated alkalinization
By adding defined amounts of a NaHCO3 Na2CO3 solution, CO2-equilibrated ΔTAadded steps of 300 µmol kgsw−1 for abiotic and 150 µmol kgsw−1 for biotic approaches were achieved, yielding a range from ΔTA0 (TAfinal=2411 µmol kgsw−1, Ωaragonite=4.2, pH = 8.15) up to ΔTA2400 (TAfinal=4750 µmol kgsw−1, Ωaragonite=13.2, pH = 8.45) for the abiotic and ΔTA1200 (TAfinal=3567 µmol kgsw−1, Ωaragonite=6.4, pH = 8.15) for the biotic experiment (Fig. 1). Achieved additions vary slightly from the targeted additions. The seawater TA was monitored after the initial alkalinity addition to determine if any alkalinity was lost subsequently due to carbonate phase formation processes. The alkalinity enhancement has taken place almost in a linear manner close to ideal (“1:1” dotted-grey line in Fig. 1a and d). As the solution was initially CO2-equilibrated with current atmospheric conditions, DIC, Ωaragonite, and pH value increased proportionally. No detectable loss in TA was observed after 1 and 4 d following the initial TA addition at time 0 for either the abiotic (0.2 µm filtered) or the biotic (55 µm filtered) treatment, including living planktonic organisms. Ωaragonite values remained with the exception of its highest value of 13.2 below the critical threshold of around 12.5 for Ωaragonite at salinity of 36.5 (corresponding to Ωcalcite ∼ 19 as identified by Morse and He, 1993) and prevented a potential loss of alkalinity due to precipitation. The pH value followed a quasi-linear trend with ΔTAadded and increased to 8.45 for the abiotic ΔTA2400 treatment (Fig. 1c). A relatively small decline in pH and Ωaragonite in the abiotic, equilibrated experiment can be observed.
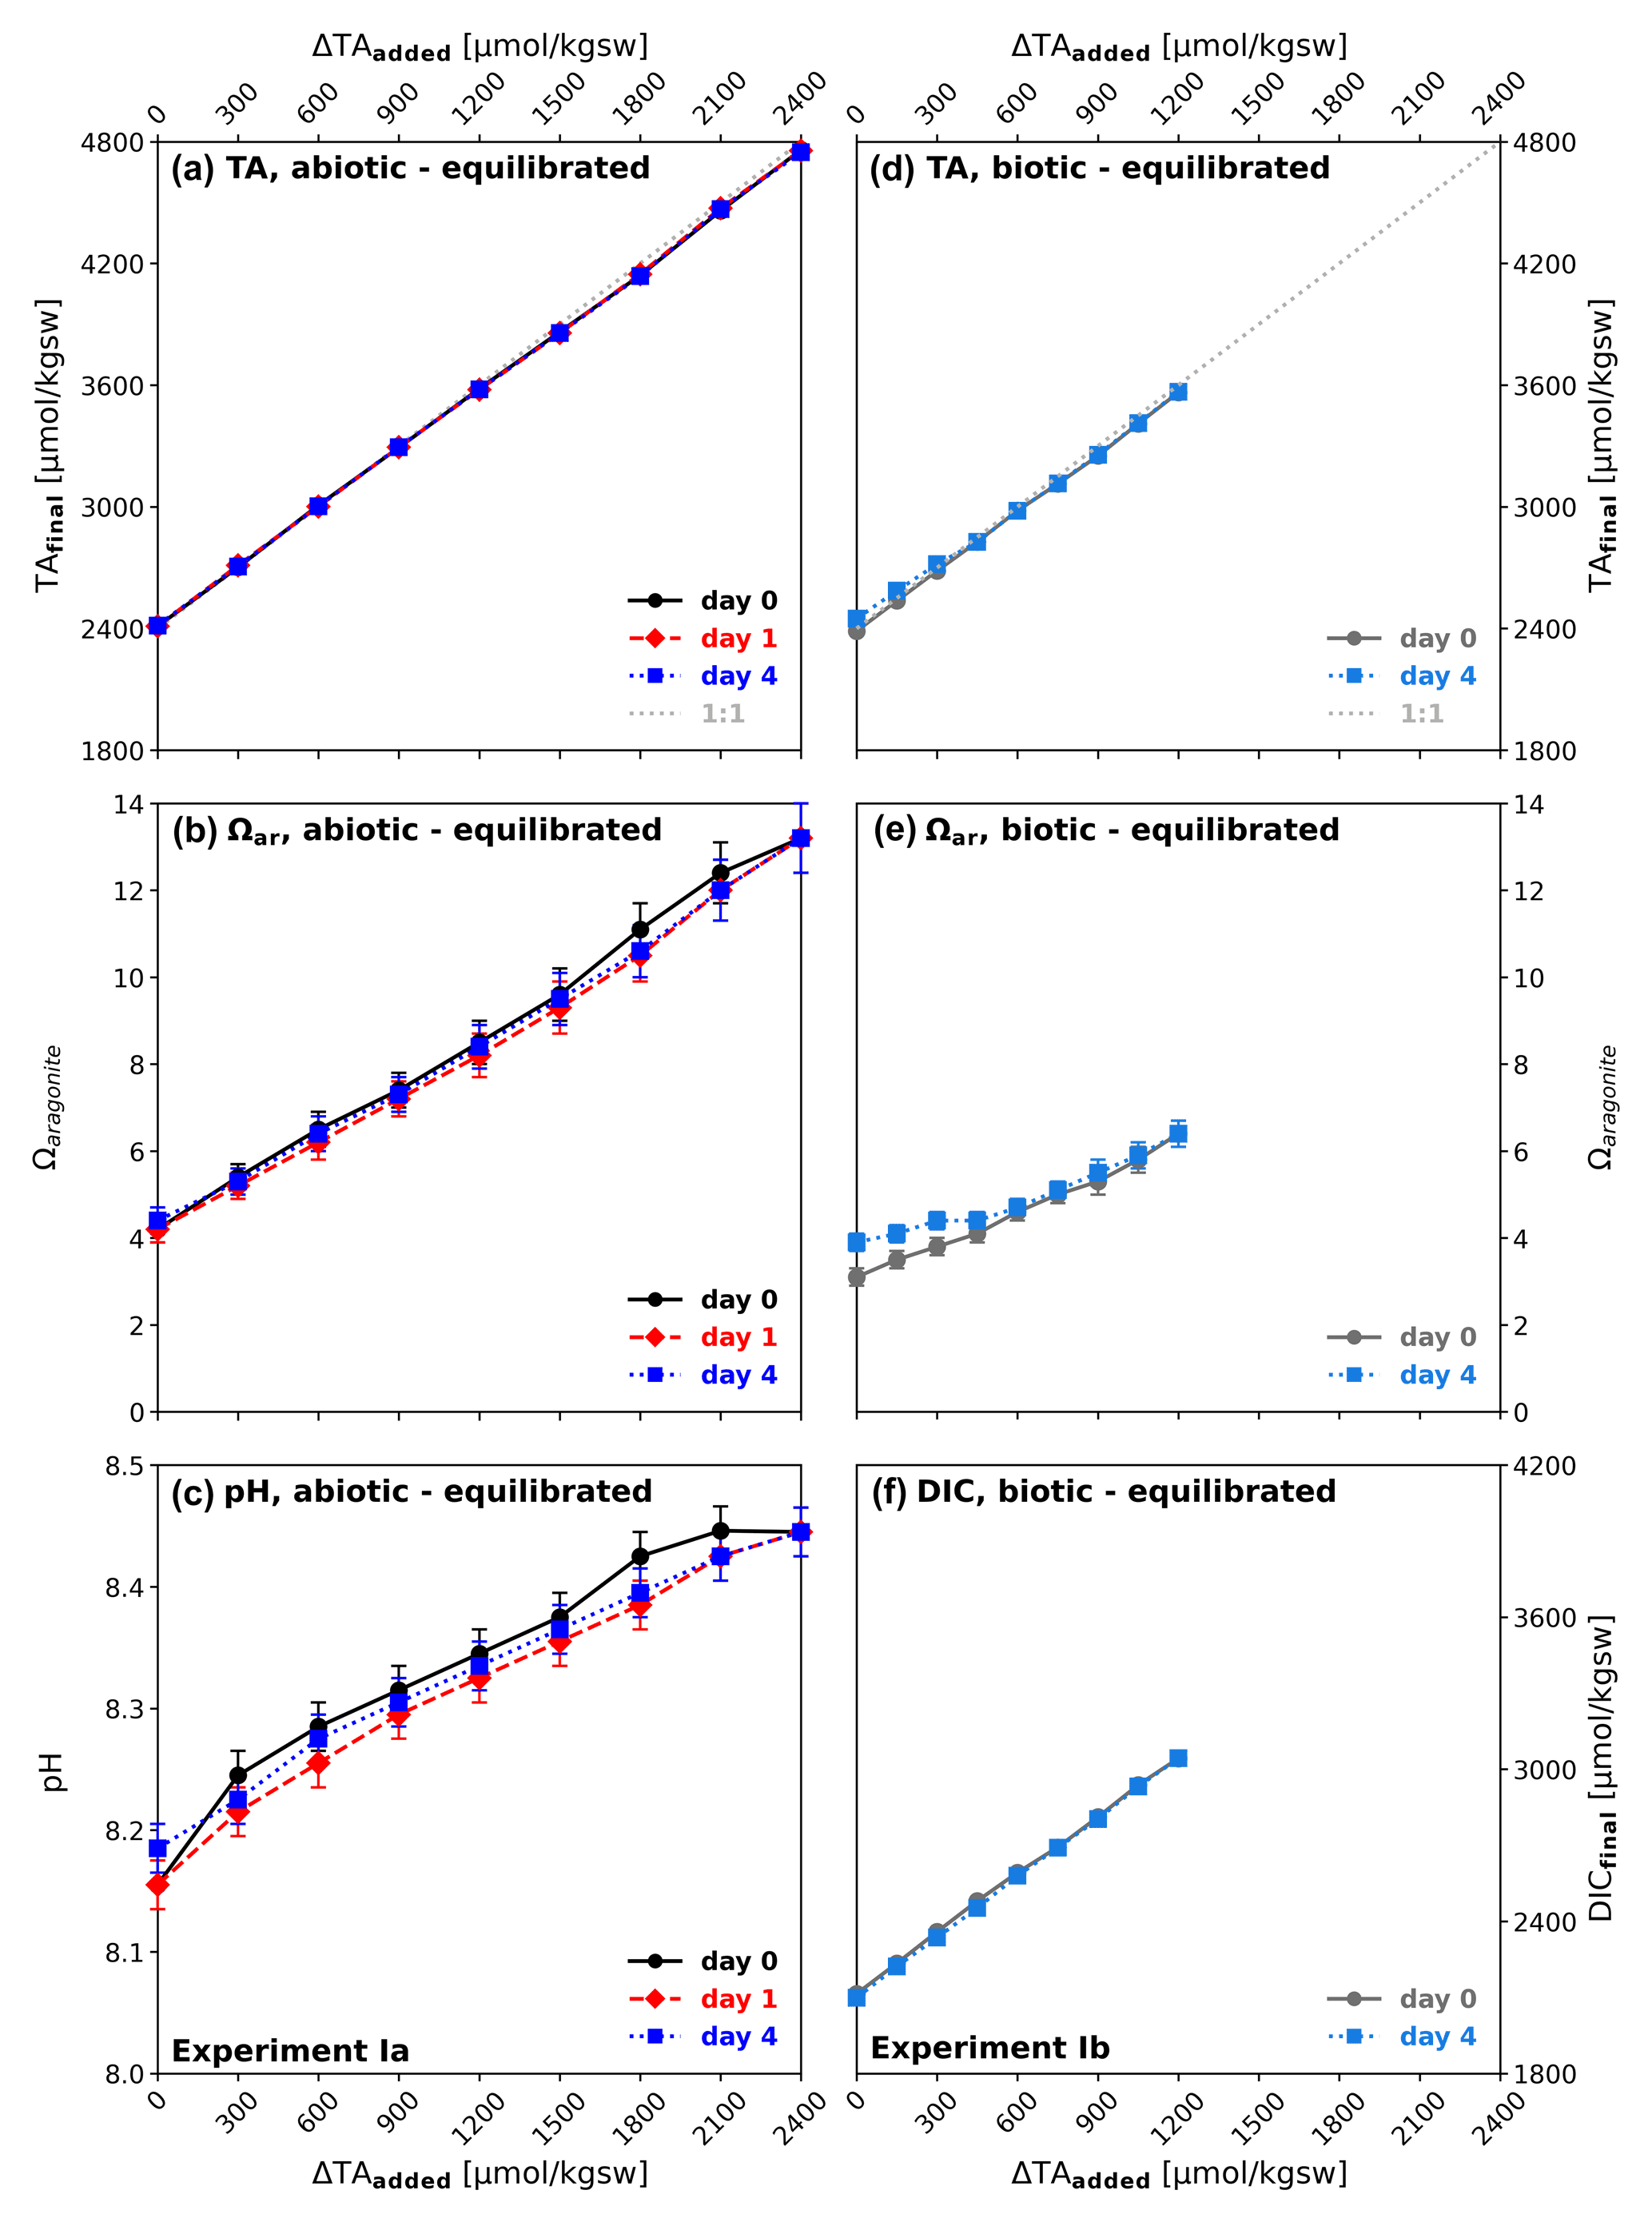
Figure 1Temporal development after CO2-equilibrated alkalinization: (a, b, c) experiment Ia, (d, e, f) experiment Ib; (a, d) ΔTAadded vs. TAfinal; (b, e) aragonite saturation state (Ωaragonite) in relation to ΔTAadded; (c) pH in relation to ΔTAadded; (f) DICfinal in relation to ΔTAadded. Black/grey symbols correspond to start of the experiment, red after 1 d, and blue after 4 d. TAinitial conditions of used seawater: ΔTA0≈2411 µmol kgsw−1, ΩAr=4.2, pH = 8.15.
3.2 Experiment II: non-equilibrated alkalinization
In the non-equilibrated experiment II, solely TA was increased by using a 0.5 M NaOH stock solution while DIC remained at the initial seawater level of 2006 µmol kgsw−1. Equilibration with the atmosphere was inhibited by closing the sample containers airtight. TAinitial increased at the highest level (ΔTA2400 with target level of ∼ 4800 µmol kgsw−1) to only 4622 µmol kgsw−1 (TAfinal) in the abiotic approach, with Ωaragonite ∼ 28 and a pH of 9.89. An immediate precipitation of 0.1–2 cm long mineral needles were observed floating in the abiotic reactor bottles just seconds after TA addition, suggesting that nucleation happens in the water. Precipitation on the wall of the vessel was not visible by eye. This is also reflected by a slight deviation from the idealized TA-addition line in Fig. 2a (“1:1” dotted-grey line), which indicates a noticeable decrease for the two highest TA additions (ΔTA2100 and ΔTA2400). ΔTA0 to ΔTA1800 maintained their intended alkalinity in both the abiotic and biotic treatments on day 0. After 1 d alkalinity loss can also be observed for ΔTA1800. The decline in TA for the three highest TA additions was now accompanied by visible precipitation on the inner wall of the reactors, suggesting that at this stage wall surfaces of the vessel acted as nucleation points. Alkalinity loss continued and on day 4 was also detected in the next lower treatment. At this stage the alkalinity in the four highest treatments dropped below values prior to alkalinity addition, marking a net loss of alkalinity compared to the initial seawater water level. Associated to this, Ωaragonite declined to values of 5.3 to 6.6 on day 4 (Fig. 2b), approaching the initial value of ∼ 4.2. pH, on the other hand, remained comparatively high, with only small decreases of 0.3–0.5 units down to values of 9.1–9.6 (Fig. 2). In the abiotic treatments ΔTA0 to ΔTA1200 alkalinity was stable and no precipitation was observed within the first four days, despite that for treatments ΔTA900 and ΔTA1200Ωaragonite was above the critical value. In contrast, in the biotic setup alkalinity loss occurred in ΔTA1050 and ΔTA1200 treatments at least on day 4, i.e. at lower alkalinity additions than in the abiotic treatments (Fig. 2d), with corresponding declines in Ωaragonite and DIC (Fig. 2e and f).

Figure 2Temporal development after non-equilibrated alkalinization: (a, b, c) experiment IIa, (d, e, f) experiment IIb; (a, d) ΔTAadded vs. TAfinal; (b, e) aragonite saturation state (Ωaragonite) in relation to ΔTAadded; (c) pH in relation to ΔTAadded; (f) DICfinal in relation to ΔTAadded. Black/grey symbols correspond to the start of the experiment, red after 1 d, and blue after 4 d. Note the different ranges of ΔTAadded in the abiotic and biotic set-up. The slightly higher start Ωaragonite for the biotic treatment at day 4 compared to day 1 is because Ωaragonite was calculated by using TA and DIC, while for the abiotic experiment using TA and pH.
3.3 Experiments I & II: TA/DIC development in equilibrated versus non-equilibrated alkalinization
While in the experiment simulating equilibrated alkalinization TA and DIC were added (as NaHCO3 and Na2CO3) in proportions (Fig. 3a, c) to maintain close to atmospheric CO2 levels, in the non-equilibrated alkalinization experiment only TA was added (as NaOH) (Fig. 3b, d), simulating alkalinization without any CO2 equilibration. Whereas the former yielded comparatively moderate changes in seawater carbonate chemistry, with only one Ωaragonite value slightly above the critical threshold of around 12.5 (identified by Morse and He, 1993), the non-equilibrated approach caused strong changes in the carbonate system with Ωaragonite values above 20 for ΔTA1500 to ΔTA2400 and between 15 and 17 for ΔTA1050 to ΔTA1200, i.e. well above the critical threshold. Consequently, while precipitation was absent in the abiotic and biotic set-up in the equilibrated treatment, strong alkalinity loss through precipitation occurred in the non-equilibrated experiment. While in the biotic set-up precipitation was observed at ΔTA1050 and ΔTA1200 (starting Ωaragonite 15 and 17, Fig. 2b), in the abiotic set-up precipitation only occurred at and above ΔTA1500, with no detectable precipitation at ΔTA900 and ΔTA1200 (starting Ωaragonite 16 and 19, Fig. 2e). The loss ratio in TA : DIC was about 2:1 (Fig. 3b, d) in all treatments, indicating the loss of alkalinity due to the precipitation of carbonates. Loss ratio in TA : DIC for the abiotic set-up was 2.12 for ΔTA1500, 1.98 for ΔTA1800, 2.06 for ΔTA2100, and 2.03 for ΔTA2400, and for the biotic set-up was 2.11 for ΔTA1050 and 2.09 for ΔTA1200.
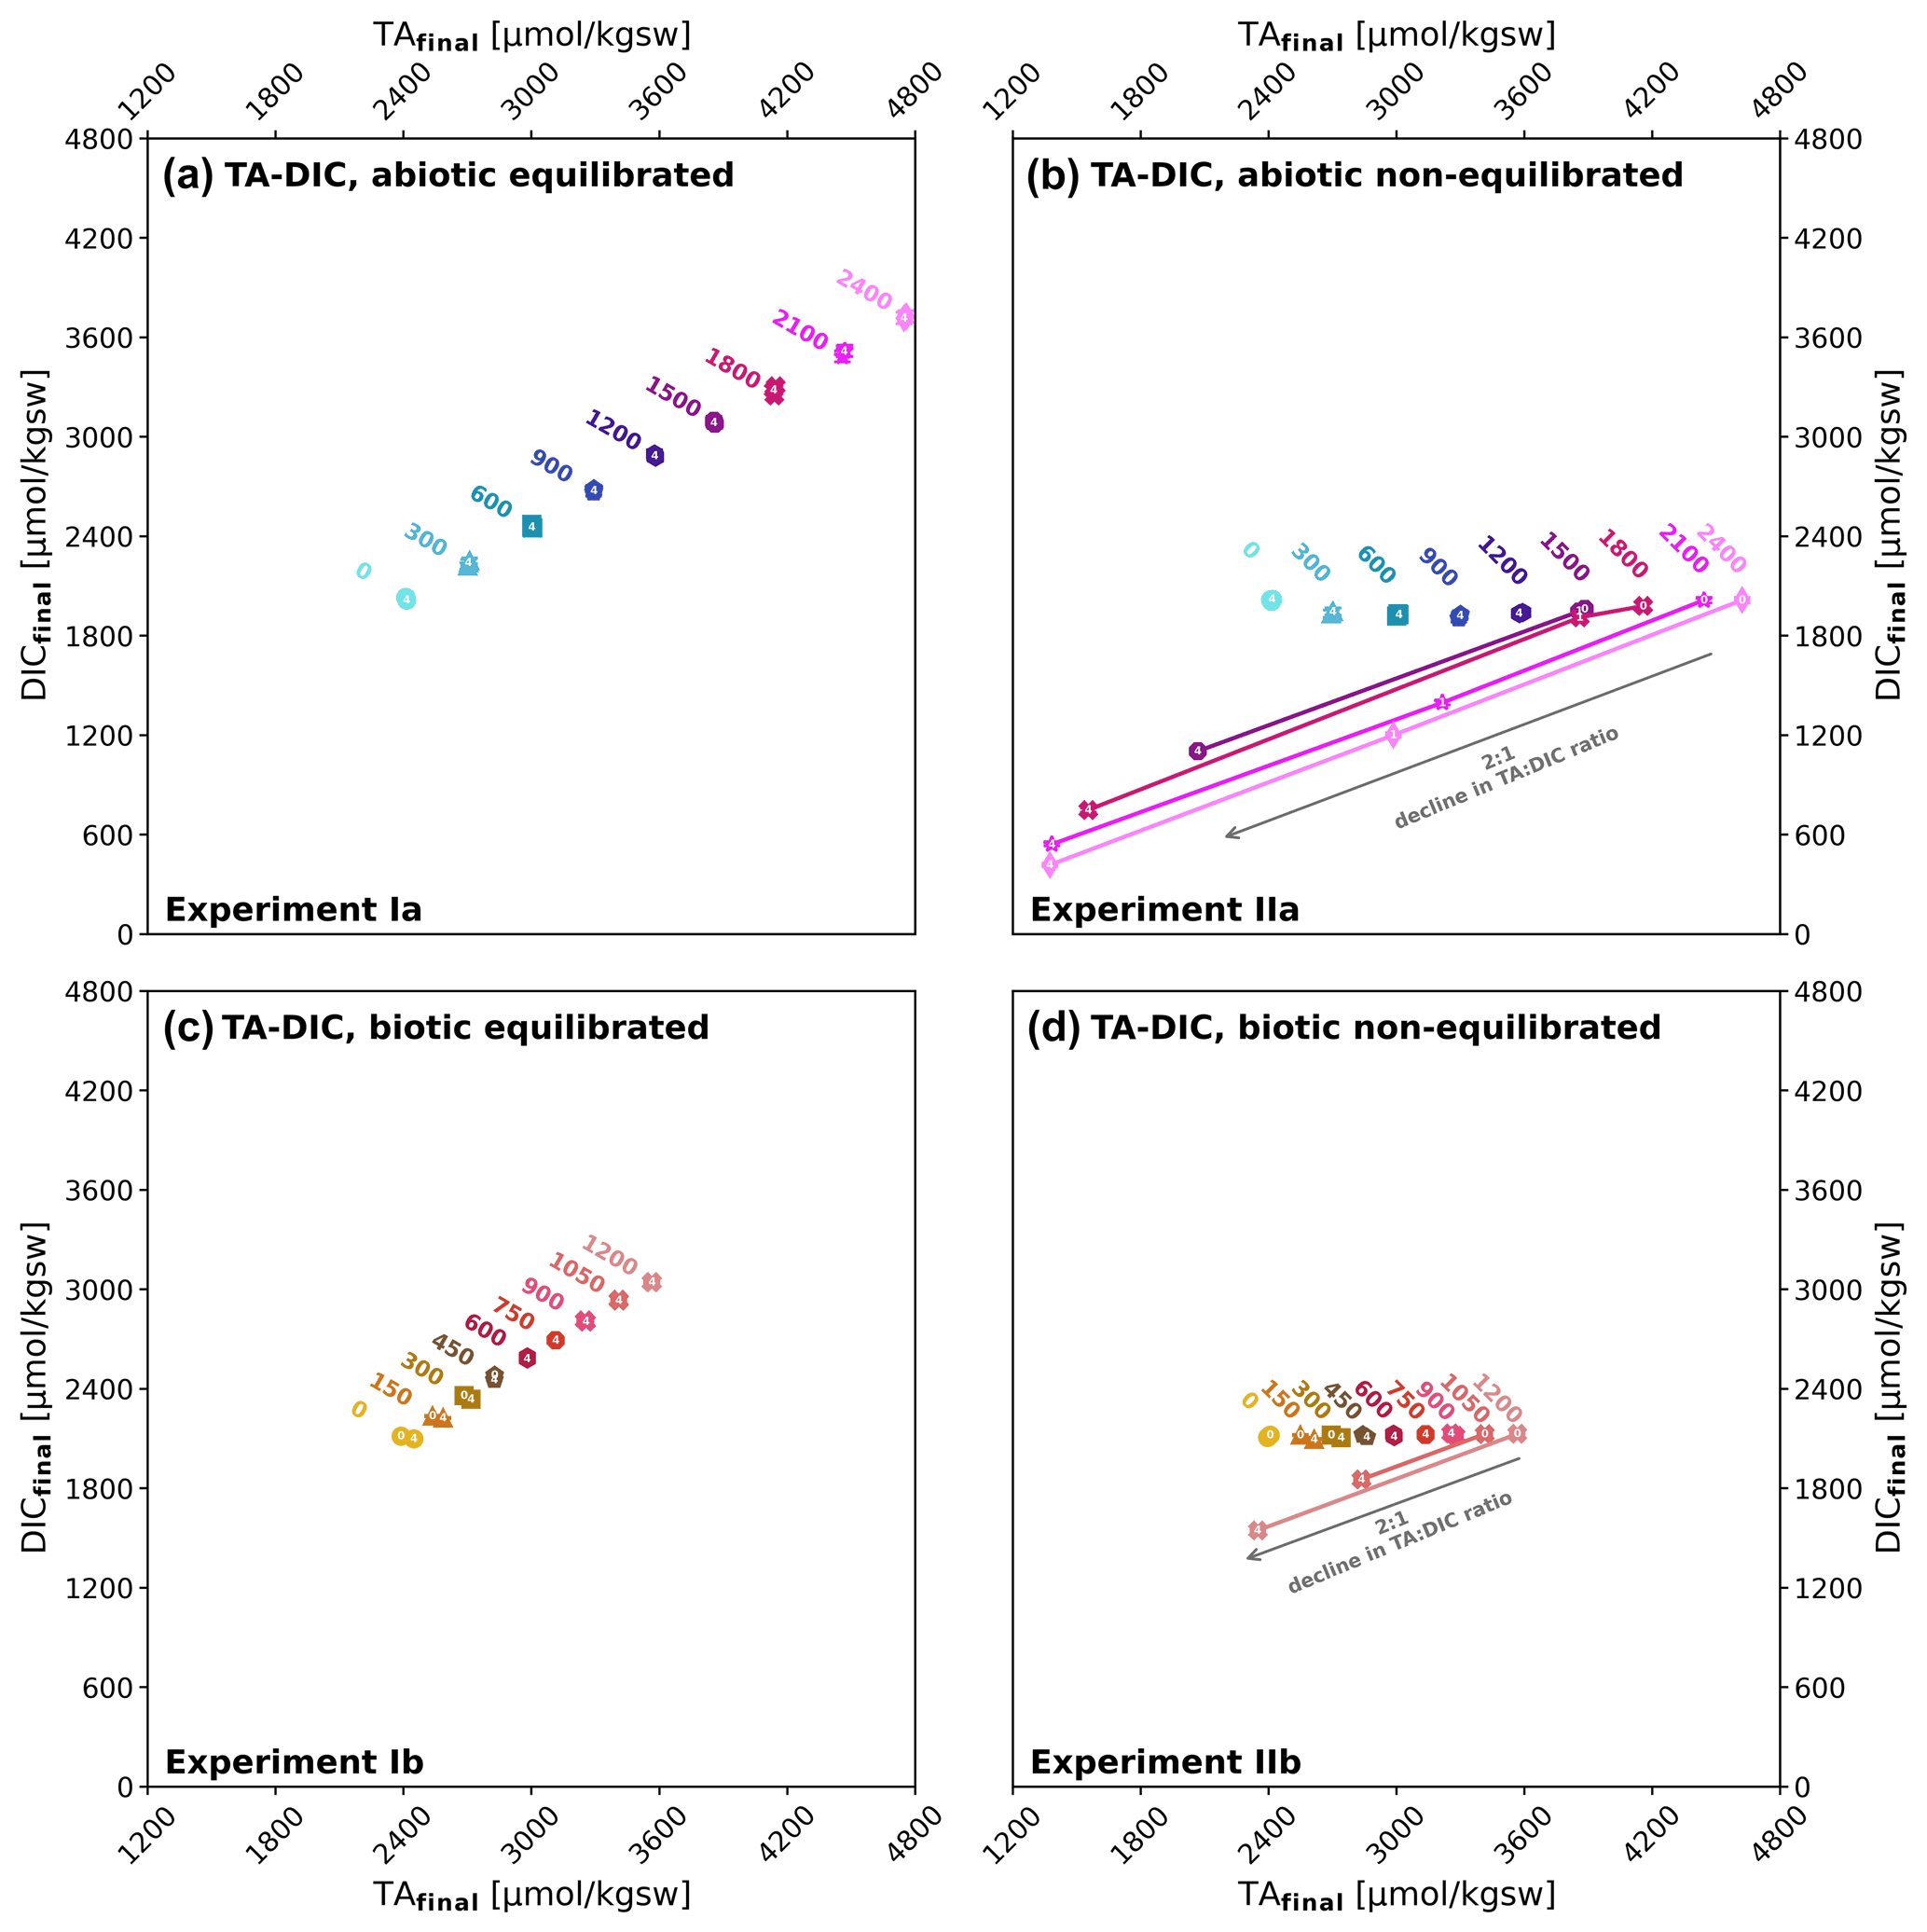
Figure 3TAfinal versus DICfinal at the start of the experiments I and II and after precipitation: (a–b) abiotic after 0, 1, and 4 d; (c–d) biotic after 0 and 4 d, equilibrated alkalinization (left, experiment I) and non-equilibrated alkalinization (right, experiment II). The TA : DIC change ratio of 2:1 indicates that alkalinity loss was due to carbonate precipitation. Sampling days (0, 1, and 4) are written on top of each data point marker. Due to overlapping in case of no change in data, the marker description is set as up to down. The grey arrows in (b) and (d) indicate an ideal 2:1 decline in TA : DIC.
3.4 Experiment III: long-term stability of added alkalinity in CO2-equilibrated approach
Experiment III was an extension of experiment I, testing for the long-term (up to 90 d) stability of added alkalinity in the two highest treatment levels (abiotic, ΔTA2100, and ΔTA2400), where for ΔTA2400 the start Ωaragonite is 13.5, above the critical Ωaragonite, while for ΔTA2100 Ωaragonite is 12.1. Without adding extra particles for the treatment ΔTA2100 just 50 µmol kgsw−1 TA were lost after 90 d, while the loss is significantly higher in case of the treatment ΔTA2400 (−693 µmol kgsw−1 ΔTAloss), which was above the Ωaragonite of about 12.5, identified as being critical for using filtered seawater. While untreated approaches have shown stable values in the first 10 d of runtime, an immediate and persistent decline in TAfinal could be observed for the treatments with added precipitates from previous experiments, functioning as seed material. ΔTA2100 with particles decreased by 199 µmol kgsw−1 after 10 d and 757 µmol kgsw−1 after 90 d, while the ΔTA2400 treatment dropped by 258 µmol kgsw−1 after 10 d and 945 µmol kgsw−1 after 90 d, see Fig. 4a.
As in experiment II, precipitation at the walls of the reactors was observed. As the treatments here are close to or slightly above (Fig. 4) the supersaturation level where carbonate formation naturally starts, it cannot be ruled out that a wall effect was triggered in the setup with ΔTA2400 without extra particles. Nonetheless, experiments in the free water would not face such a wall effect problem but might be facing a comparable fate due to other abundant surfaces like naturally occurring particles.
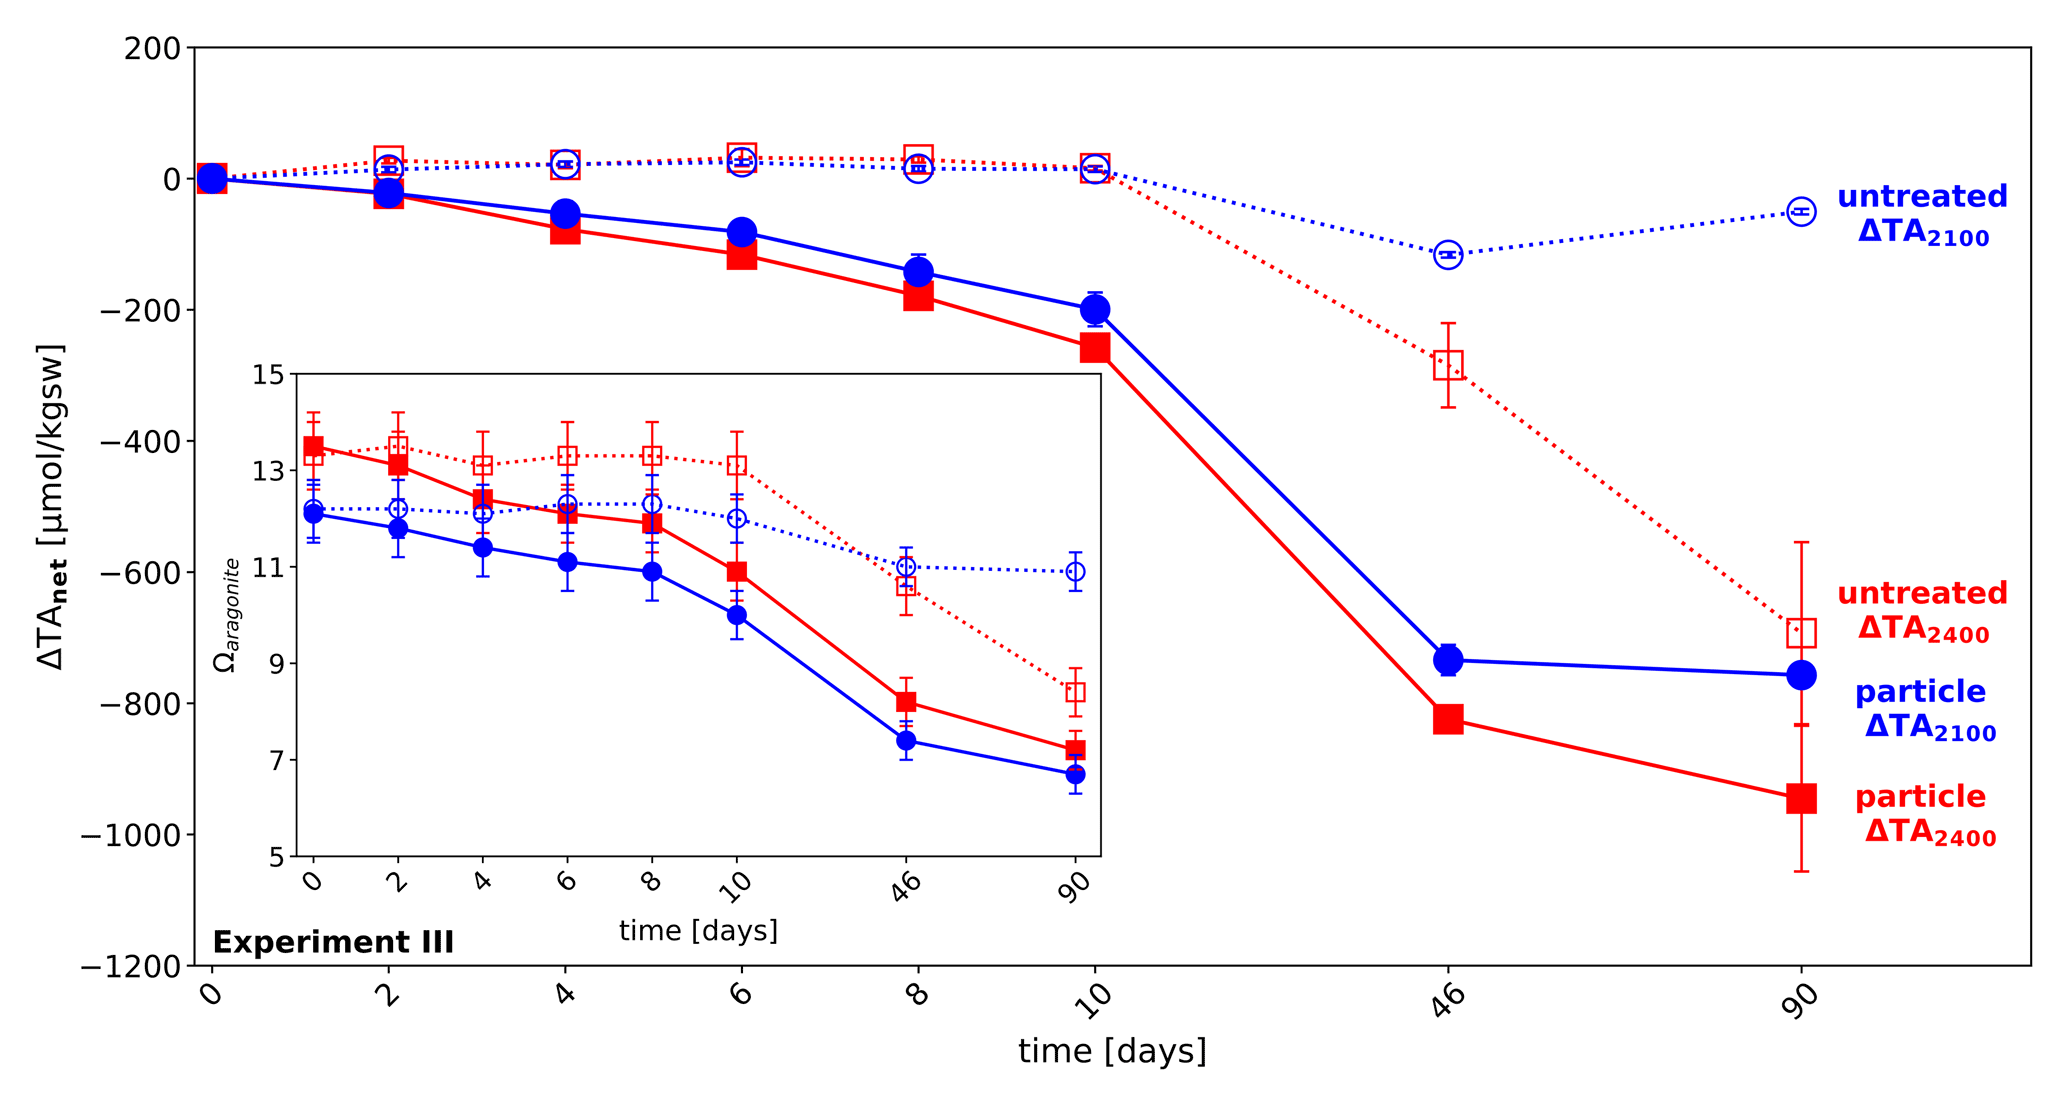
Figure 4Long-term stability of added alkalinity in the CO2-equilibrated approach: development of alkalinity loss (ΔTAloss) over time in the two highest alkalinity treatments of experiment I, ΔTA2400 (red) and ΔTA2100 (blue), in untreated mode (dotted lines), and with particle addition (solid line) over time. Insert: development of Ωaragonite in the above treatments. Error bars denote the standard deviations of two measures, except for untreated ΔTA2100 where only one measurement was taken due to technical problems.
3.5 Experiment IV: alkalinity addition with brucite
Unlike in the equilibrated and non-equilibrated experiments I and II, in which an alkaline solution was applied, brucite (Mg(OH)2) was added as a solid to enhance alkalinity. While NaHCO3 Na2CO3 (equilibrated) and NaOH (non-equilibrated) were fully dissolved in the stock solutions after seconds to several minutes, Mg(OH)2 dissolved relatively slowly. Due to a comparatively moderate reactivity in seawater, it never reached the point of full dissolution, with the exception of the ΔTA600 treatment, which is relatively close to the theoretical solubility of brucite in seawater (determined using PHREEQC, equilibrating seawater with atmospheric conditions) that corresponds to an increase of ΔTAadded of ≈ 500 µmol kgsw−1 (Fig. 5d). The consequences were transparent to increasingly blurry suspensions, dependent on the added amounts of material. Except for the ΔTA600, each reactor had visible residua at the bottom, right after the addition of the solid material. Consequently, the target ΔTAadded steps have not been reached like in the equilibrated and non-equilibrated treatments in experiments I and II. This also counts for the highest dosage of 1000 mg, corresponding to ΔTAadded of 34 288 µmol kgsw−1, see Fig. 5a and d.
Excluding the highest dosage, after the addition of brucite I, TAfinal reached only 2746 µmol kgsw−1 (ΔTAnet=335 µmol kgsw−1) for the target of ΔTA2400 at day 0, while for brucite II maximum increase in TAfinal was achieved at day 1 for ΔTA600. After 1 d of runtime no treatment achieved the target TAfinal values (Fig. 5a). TA collapsed in all reactors below or close to the initial seawater level at day 4 with the exception of biotic treatment ΔTA600. The decline of TA occurred in the form of a “runaway precipitation” as labelled by Moras et al. (2022), meaning carbonate formation causes lower TA levels than the initial values. This process led to lower TAfinal values with higher amounts of added brucite at the end of the experiments. Ωaragonite was enhanced moderately up to a maximum of 8.4 in the bulk solution in the abiotic ΔTA2400 reactor at day 0, then increased to 11.5 after day 1, and finally declined to relatively stable values of 6.8–8.3 after 4 d. pH values also just experienced a slight increase up to 8.5 at day 0, reached values of 8.5–9.0 in regular steps after 1 d, and continued rising in the same stable proportions to 8.6–9.1 (also see Fig. 5c.).
While brucite I formed aggregates of particles being insoluble for the duration of the experiment, brucite II (a commercial product for industrial use optimized) did not form aggregates and dissolved more efficiently, leading to higher TAfinal levels at day 0. Comparably to brucite I, ΔTAnet levels for brucite II declined in the following four days well below TAinitial for treatments > ΔTA600, declining to TAfinal ∼ 1200 µmol kgsw−1 for ΔTA1800−2400, while Ωaragonite for the same range consistently reached values of ∼ 5, or lower. Only ΔTA600 remained slightly above the initial seawater TA level after 4 d, but also declined significantly compared to day 0. For experiment IV all treatments showed the same general trends, independent of treatment (abiotic, biotic) or type of brucite.
The high ΔTAadded approach using 1000 mg brucite (corresponding to a theoretical solid material TA addition of 34 288 µmol kgsw−1) reached TAfinal values above 4000 µmol kgsw−1 at day 0, an Ωaragonite of 24 and pH values of 9.4. Immediate precipitation at the base of the bottles was observed. The total TAfinal increase on day 0, however, is on the same general trend.
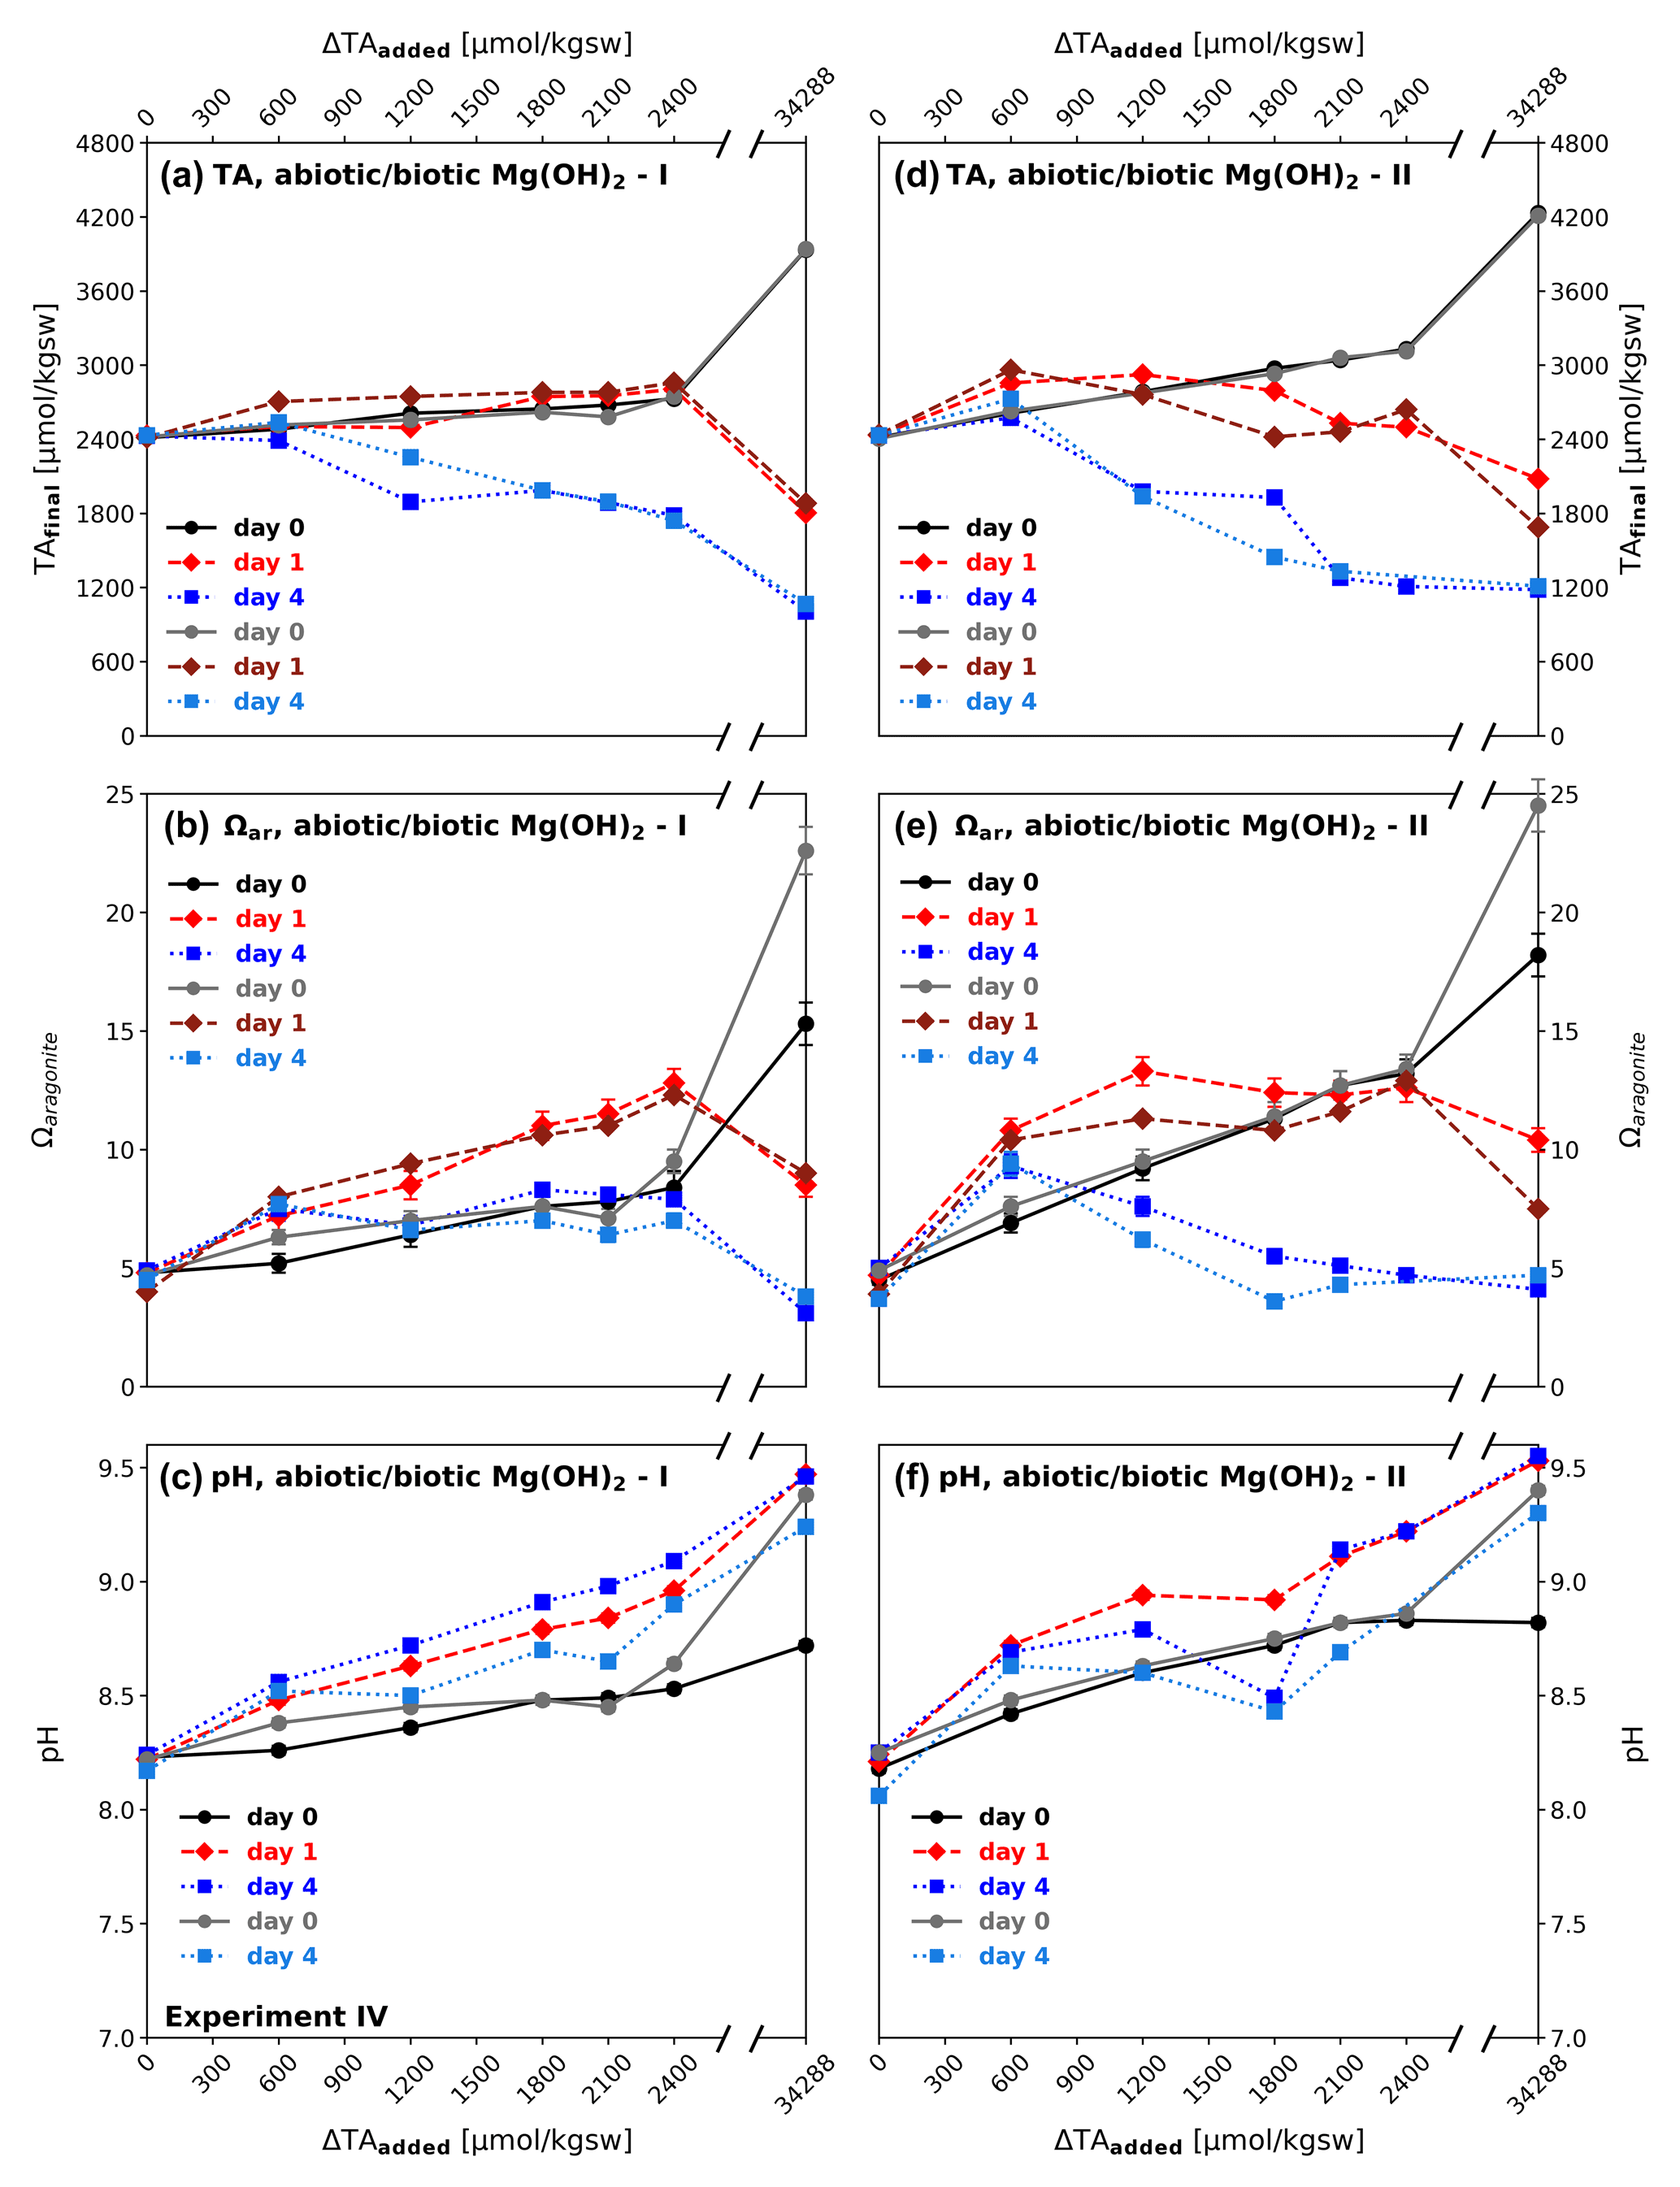
Figure 5Dissolution of particulate brucite (types I and II) over time in experiment IV: (a, d) development of alkalinity (TAfinal); (b, e) aragonite saturation state (Ωaragonite); and (c, f) pH immediately after addition (day 0 – black/grey), 1 d (red), and 4 d after (blue); abiotic treatments – black, red, and dark blue graphs; biotic – grey and light blue graphs. Brucite additions range from 19.2 mg (ΔTA600) to 1000 mg (ΔTA34 288). Comparable trends are observed in all treatments, independent of substrate type (brucite I and II) and set-up (abiotic/biotic).
3.6 Experiment IV: TA/DIC evolution brucite
Although for some treatments the TA : DIC development from day 0 to 1 shows some TAfinal increase, loss in DICfinal is the general pattern (Fig. 6). Towards day 4 a net loss of ΔTAnet and ΔDICnet can be observed in most treatments. The TA : DIC change ratio thereby differs from that observed in experiment II, where a ratio of 2:1 indicated pure carbonate precipitation, in this case it ranges between 1.2:1 and 1.9:1, clearly showing that in parallel to carbonate precipitation brucite dissolution was still ongoing. In all four treatments there is a tendency of higher TA : DIC change ratios with higher brucite addition, indicating alkalinity loss due to carbonate precipitation to increase relative to the alkalinity gain due to brucite dissolution. The higher TA : DIC ratios for brucite II (1.6:1 to 1.9:1) compared to brucite I (1.2:1 to 1.7:1) indicate higher carbonate precipitation for the former.
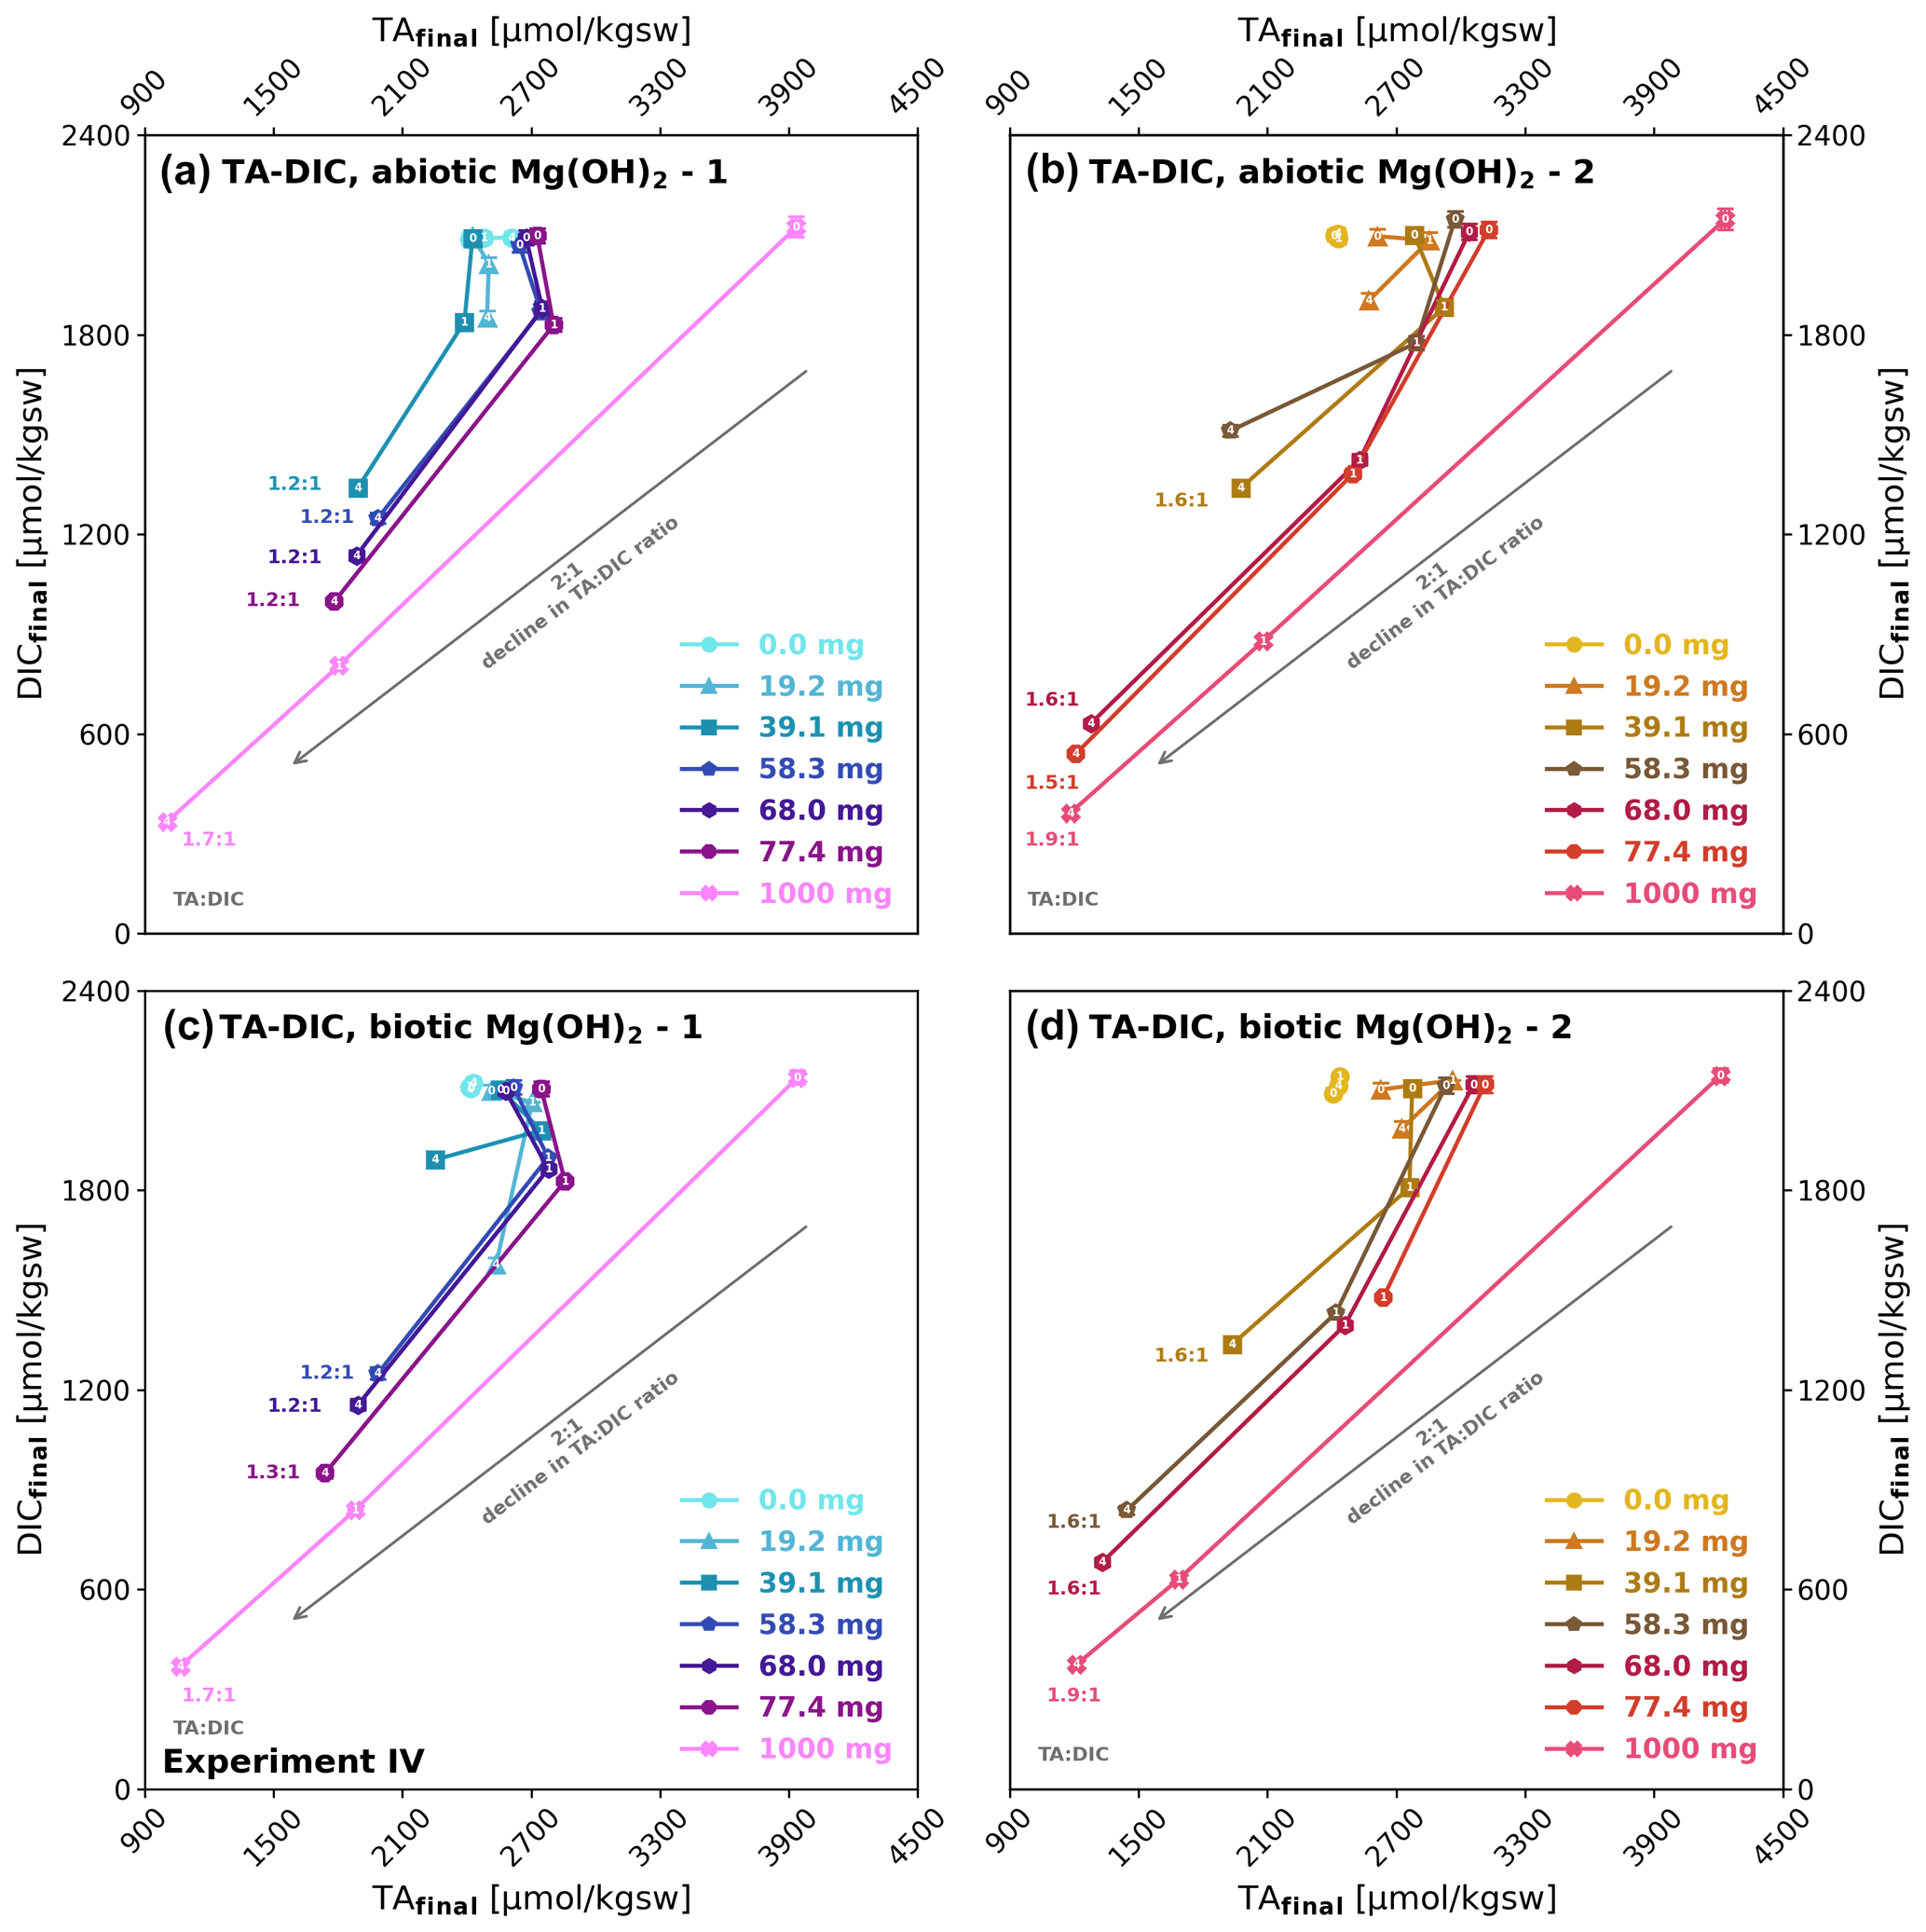
Figure 6Development of TAfinal versus DICfinal during brucite dissolution in experiment IV: (a, b) abiotic after 0, 1, and 4 d and (c, d) biotic after 0 and 4 d. The days of sampling (0, 1, and 4) are written on top of each data point marker. TA : DIC change ratios for brucite I (1.2:1) and brucite II (1.6:1) are indicating simultaneous precipitation and dissolution, while their difference could be described by their differing dissolution characteristics. The grey arrows indicate an ideal 2:1 decline in TA : DIC.
3.7 Experiment V: alkalinity recovery after mineral precipitation due to CO2 equilibration with time
This experiment was intended to test for possible recovery of alkalinity after its loss due to mineral precipitation. The addition of 0.66 g kgsw−1 Ca(OH)2 and its fast dissolution led to an immediate collapse of alkalinity down to 832 µmol kgsw−1 within 15 min, losing more than half of the initial seawater alkalinity (Fig. 7). At the same time, pH increased to above 10.3 and Ωaragonite with about 3.8 remained unchanged. In the following hour part of the alkalinity recovered, while Ωaragonite further increased to 12.8, accompanied by a steady decline in pH, caused by invasion of CO2 into the water. After an hour Ωaragonite and TAfinal started to decline for the next 48 h. After that a shift in the carbonate system causes a drastic decline in pH (inflection point at hour 60.4 at pH 9.082) and a slight increase in TAfinal, indicating that despite declining Ωaragonite some lost alkalinity is recovered, which is likely due the redissolution of carbonate forms, not crystallized yet into stable calcite or aragonite. The results show that it is possible to recover, on a time scale of days, some of the lost alkalinity, but despite using a shaking bath to accelerate CO2 invasion, even after 10 d about half of the initial alkalinity remains lost and the Ωaragonite levelled off below the start values.
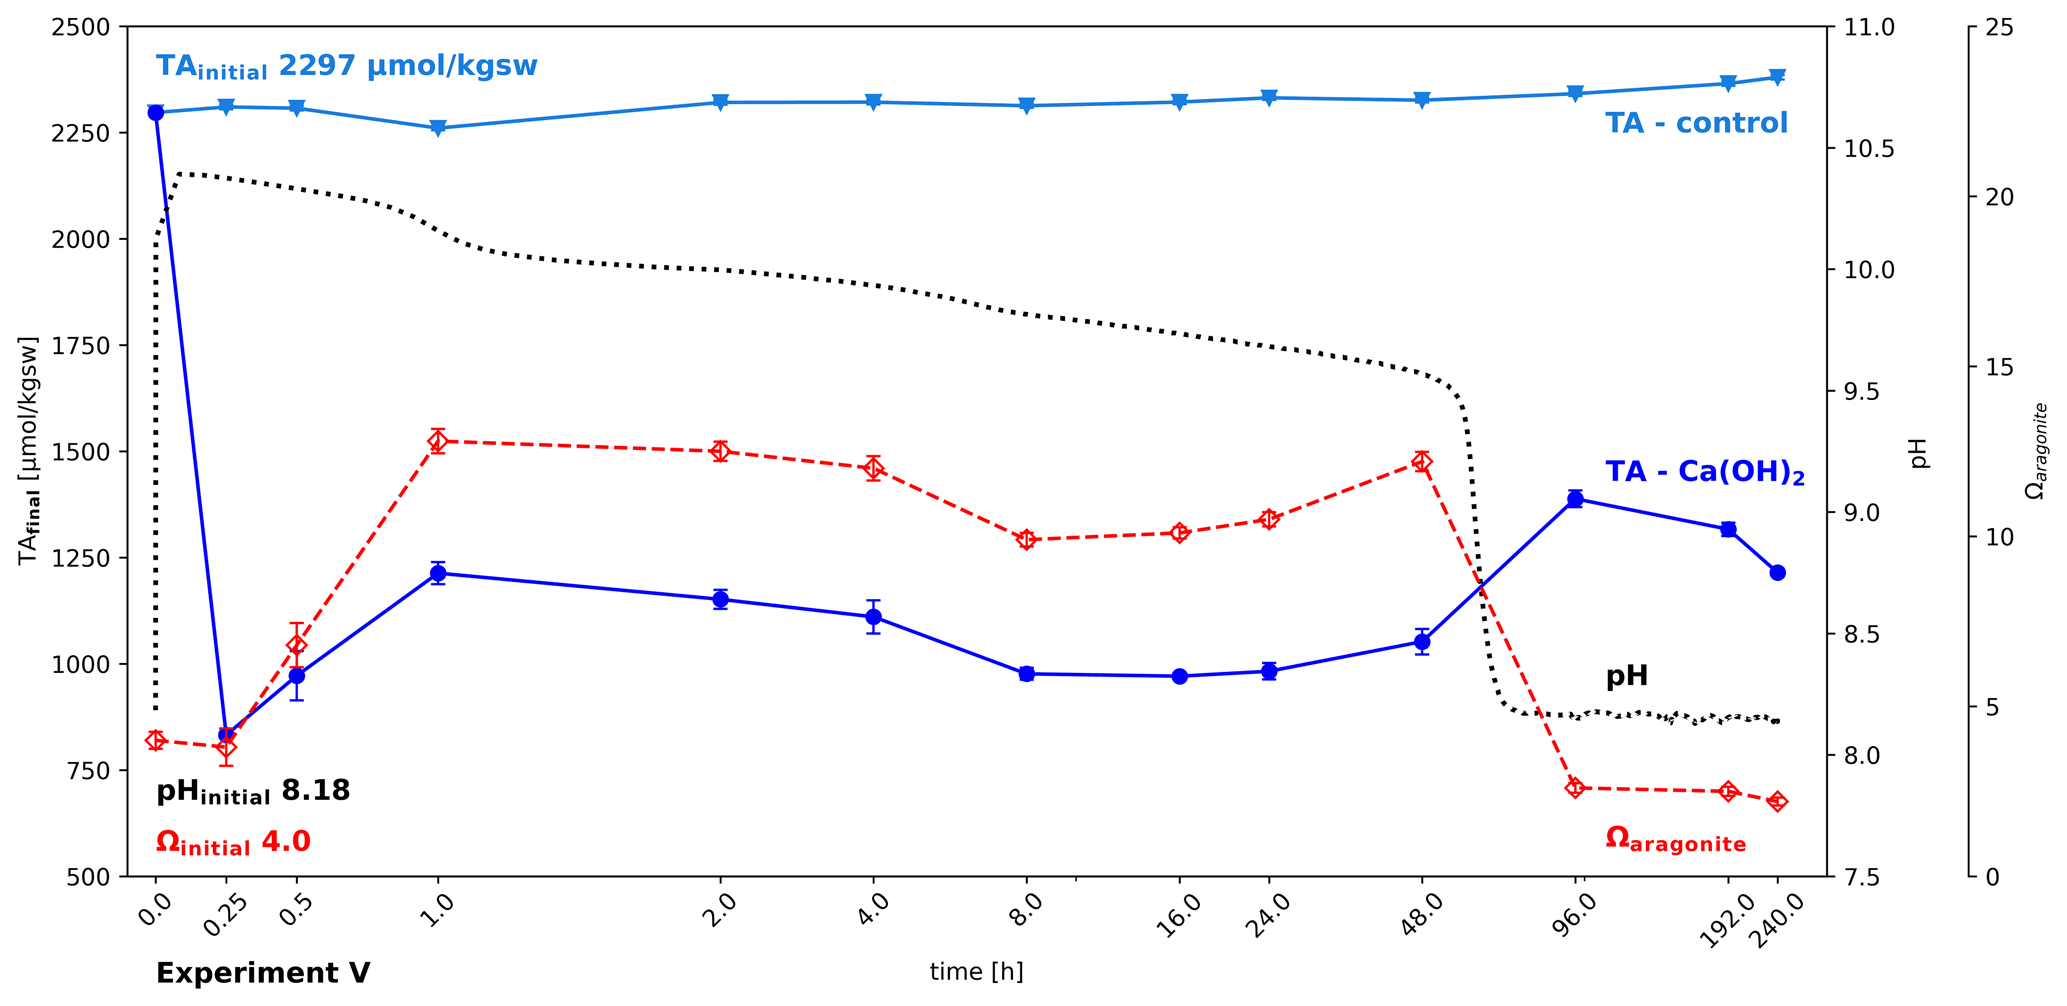
Figure 7Partial recovery of alkalinity after carbonate precipitation; change in alkalinity, pH, and Ωaragonite after adding 0.66 g Ca(OH)2 kgsw−1 to North Sea water in a shaking bath (simulating wave processes to allow accelerated air–water–CO2 exchange). Ca(OH)2 dissolution is so fast that it is hard to track. While the water gradually equilibrates with the atmosphere, a series of loss and gain of alkalinity can be observed.
3.8 Experiment VI: threshold of alkalinity addition to avoid carbonate precipitation
The addition of increasingly large amounts of Mg(OH)2 confirms that the increase in ΔTAadded after 24 h stops at Ωaragonite close to 12.9 (Fig. 8a). For larger additions a net loss of alkalinity was generated, which would subsequently lead to CO2 evasion. In the case of Ca(OH)2 (Fig. 8b) the net loss switches to alkalinity gain at the highest addition. However, the measured increase in alkalinity (∼ 21 000 µmol kgsw−1) is less than expected, based on the mineral addition (∼ 27 000 µmol kgsw−1), suggesting a lower efficiency and therefore higher cost of application. In later experiments, the highest dosage of added Ca(OH)2 shows that a gain in TA can still be achieved. Therefore, two threshold types are demonstrated with this experiment and experiment IV: one showing that a threshold level for losing alkalinity after adding a certain amount of solid alkalinity exists, based on material quality, and one gaining TA at higher levels by adding excess solid alkalinity to seawater with a high enough dosage. Interestingly, this effect is not visible using Mg(OH)2 at given higher amounts added, suggesting material-specific behaviour with different outcome for OAE application. In the case of brucite, an important difference to experiment IV is the use of a shaking bath, likely making the influence of particle surface processes less effective due to enforced advection of water around the particle surfaces. In addition, the shaking conditions causing faster exchange of CO2 with the atmosphere do not reflect water bodies directly below the sea surface.
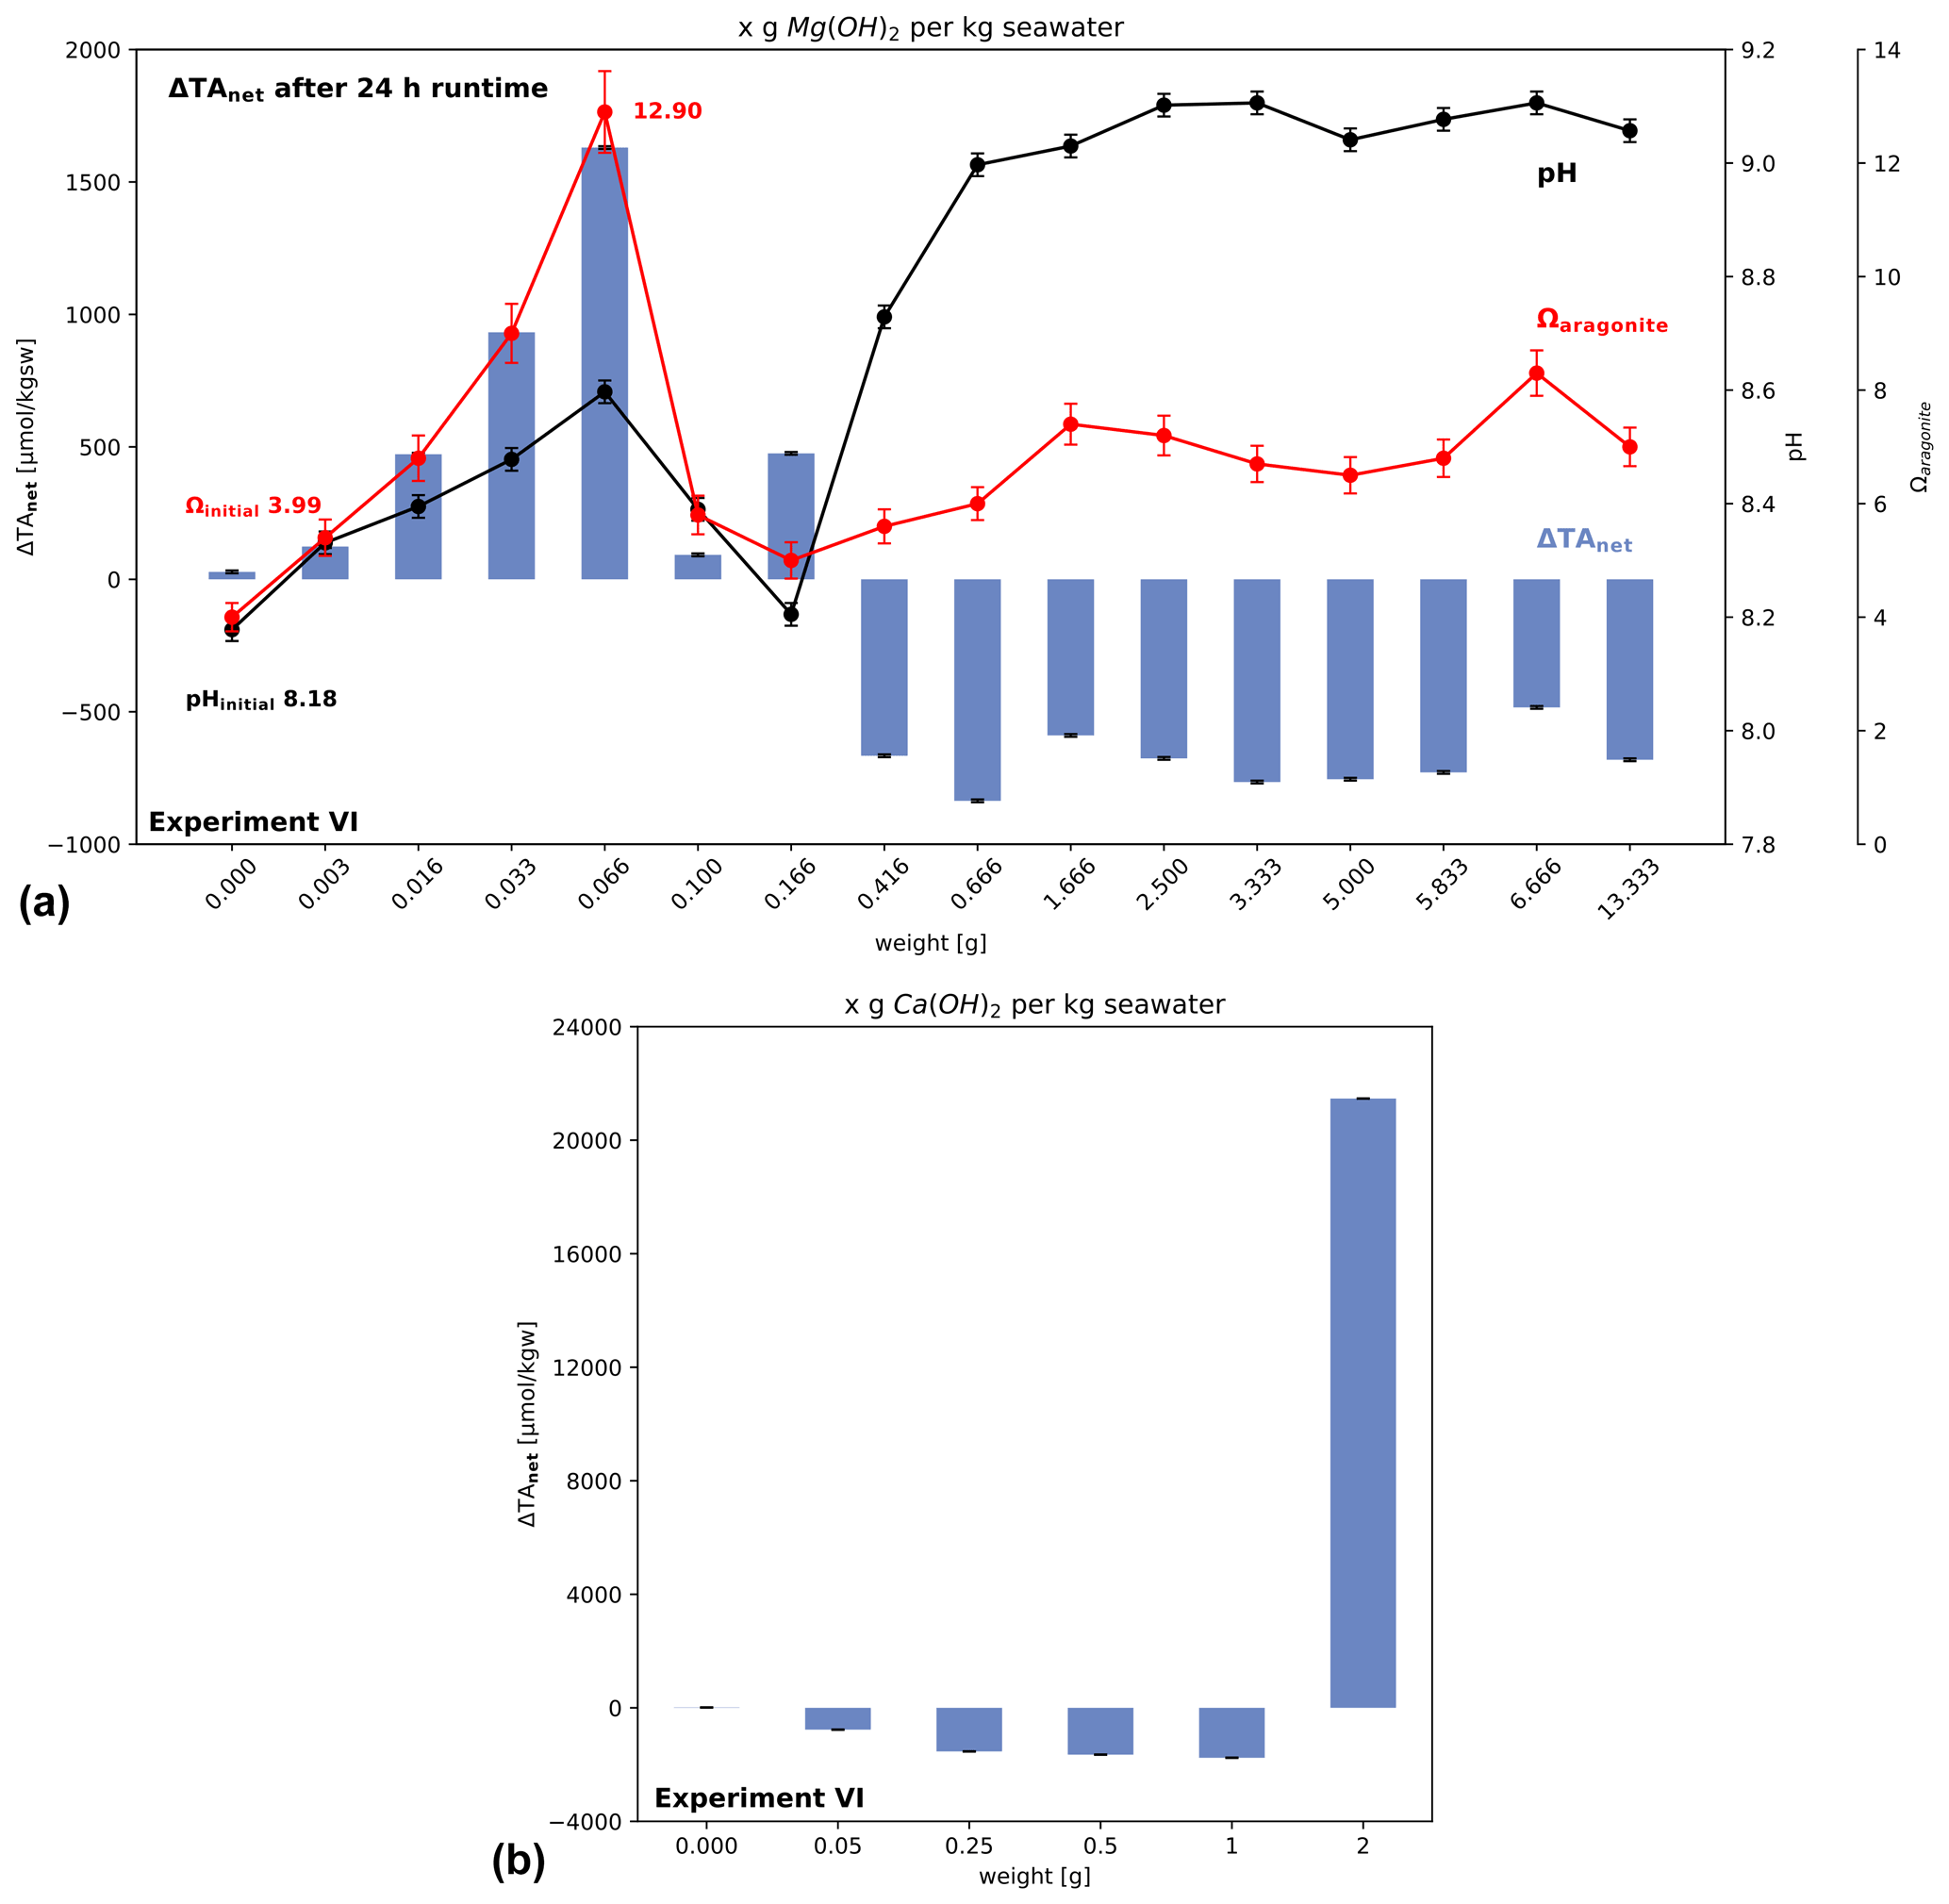
Figure 8Change in alkalinity after adding Mg(OH)2 or Ca(OH)2 to North Sea water in a shaking bath (simulating wave processes to allow accelerated air–water–CO2 exchange). (a) Net loss occurs when alkalinity addition exceeds the critical saturation level of aragonite, while in (b) it is shown, using Ca(OH)2, that for high added amounts of solid the ΔTAnet loss can be turned into a gain. Note for data in (b) no pH values are available for calculation of aragonite saturation levels.
3.9 SEM images of precipitates
An overview of the shapes and occurrence of calcium carbonate precipitates formed during the loss of alkalinity is provided in Fig. 9. They were derived from experiments IIa (ΔTA2400, NaOH – non-CO2-equilibrated, Fig. 9a–c) and V (ΔTA5400, Ca(OH)2, Fig. 9d) after 4 and 10 days, respectively. The precipitates showed a variety of symmetrical shapes and structures. These ranged from spheres (or ellipsoids), as the most abundant variant in experiment IIa, to particles with a bi- or multipolar stem (compare to Fig. 10 in Morse et al., 2007). These stems formed spherical patterns on the tips with elongated crystals, creating porous surfaces. The overall growth patterns showed the development from loosely attached and aligned needle-like crystals to stem-like structures (Fig. 9d) and finally spheres. In general, all sighted samples of experiment IIa and V in which precipitation occurred show the same type and style of precipitation, differing in size and quantity between higher alkalinity and temporal progressed treatments.
Figure 9a gives a general overview, showing all varieties and development stages. Observed average sizes range from 30–50 µm; single spheres in this evolved and high alkalinity treatment (ΔTA2400, after 4 d) reached up to 80 µm in diameter. Figure 9b shows a cluster of partially developed precipitates: bipolar stems with initial branching structures (I), a broken head of a developed particle (II) from the side, and a developed multipolar precipitate with 4–5 heads (III). Insight is given into the parallel-aligned crystal growth patterns of the stem as well as the structures branching out (II). Overall, the “polarity” of each particle seems to be determined in the early stages of formation; single needle-like crystals evolve into bipolar while early stage crystal branching grows into multipolar shapes. Figure 9c IV offers a clean-cut cross section through merged components (α), a hollow undeveloped stem (β), and a bipolar branched particle with a failed end which provides insight in the radial crystal growth structure of a head (γ). Attached to (γ) is a secondary gypsum crystal which most likely formed during the filtration process, covering the hollow root of the head. To give an overview of the elemental composition of the precipitates, an EDX analysis of (γ) was added to the supplements (including elemental mapping). Atom percentages reached 13.12 ± 0.80 % for Calcium, 6.15 ± 0.5 % for Magnesium, 32.63 ± 4.95 % for Carbon, and 46.03 ± 8.15 % for Oxygen, indicating the composition of a Mg-rich calcium carbonate mineral. Figure 9c V shows an example of an almost closed sphere with the central stem still visible. Particle VI in Fig. 9c represents a transition phase between a dumbbell shape to closed sphere with initial crystal growth bridging the gap between the two heads and starting to overgrow the central stem. Figure 9d gives a visual impression of the primitive initial needle-like crystals and undeveloped stems of precipitates formed in experiment V. In contrast to the complex forms observed in experiment IIa, primitive initial needle-like crystals and undeveloped stems are dominating here. The precipitation process lasted several days in experiment IIa, while it happened in a few minutes in experiment V.
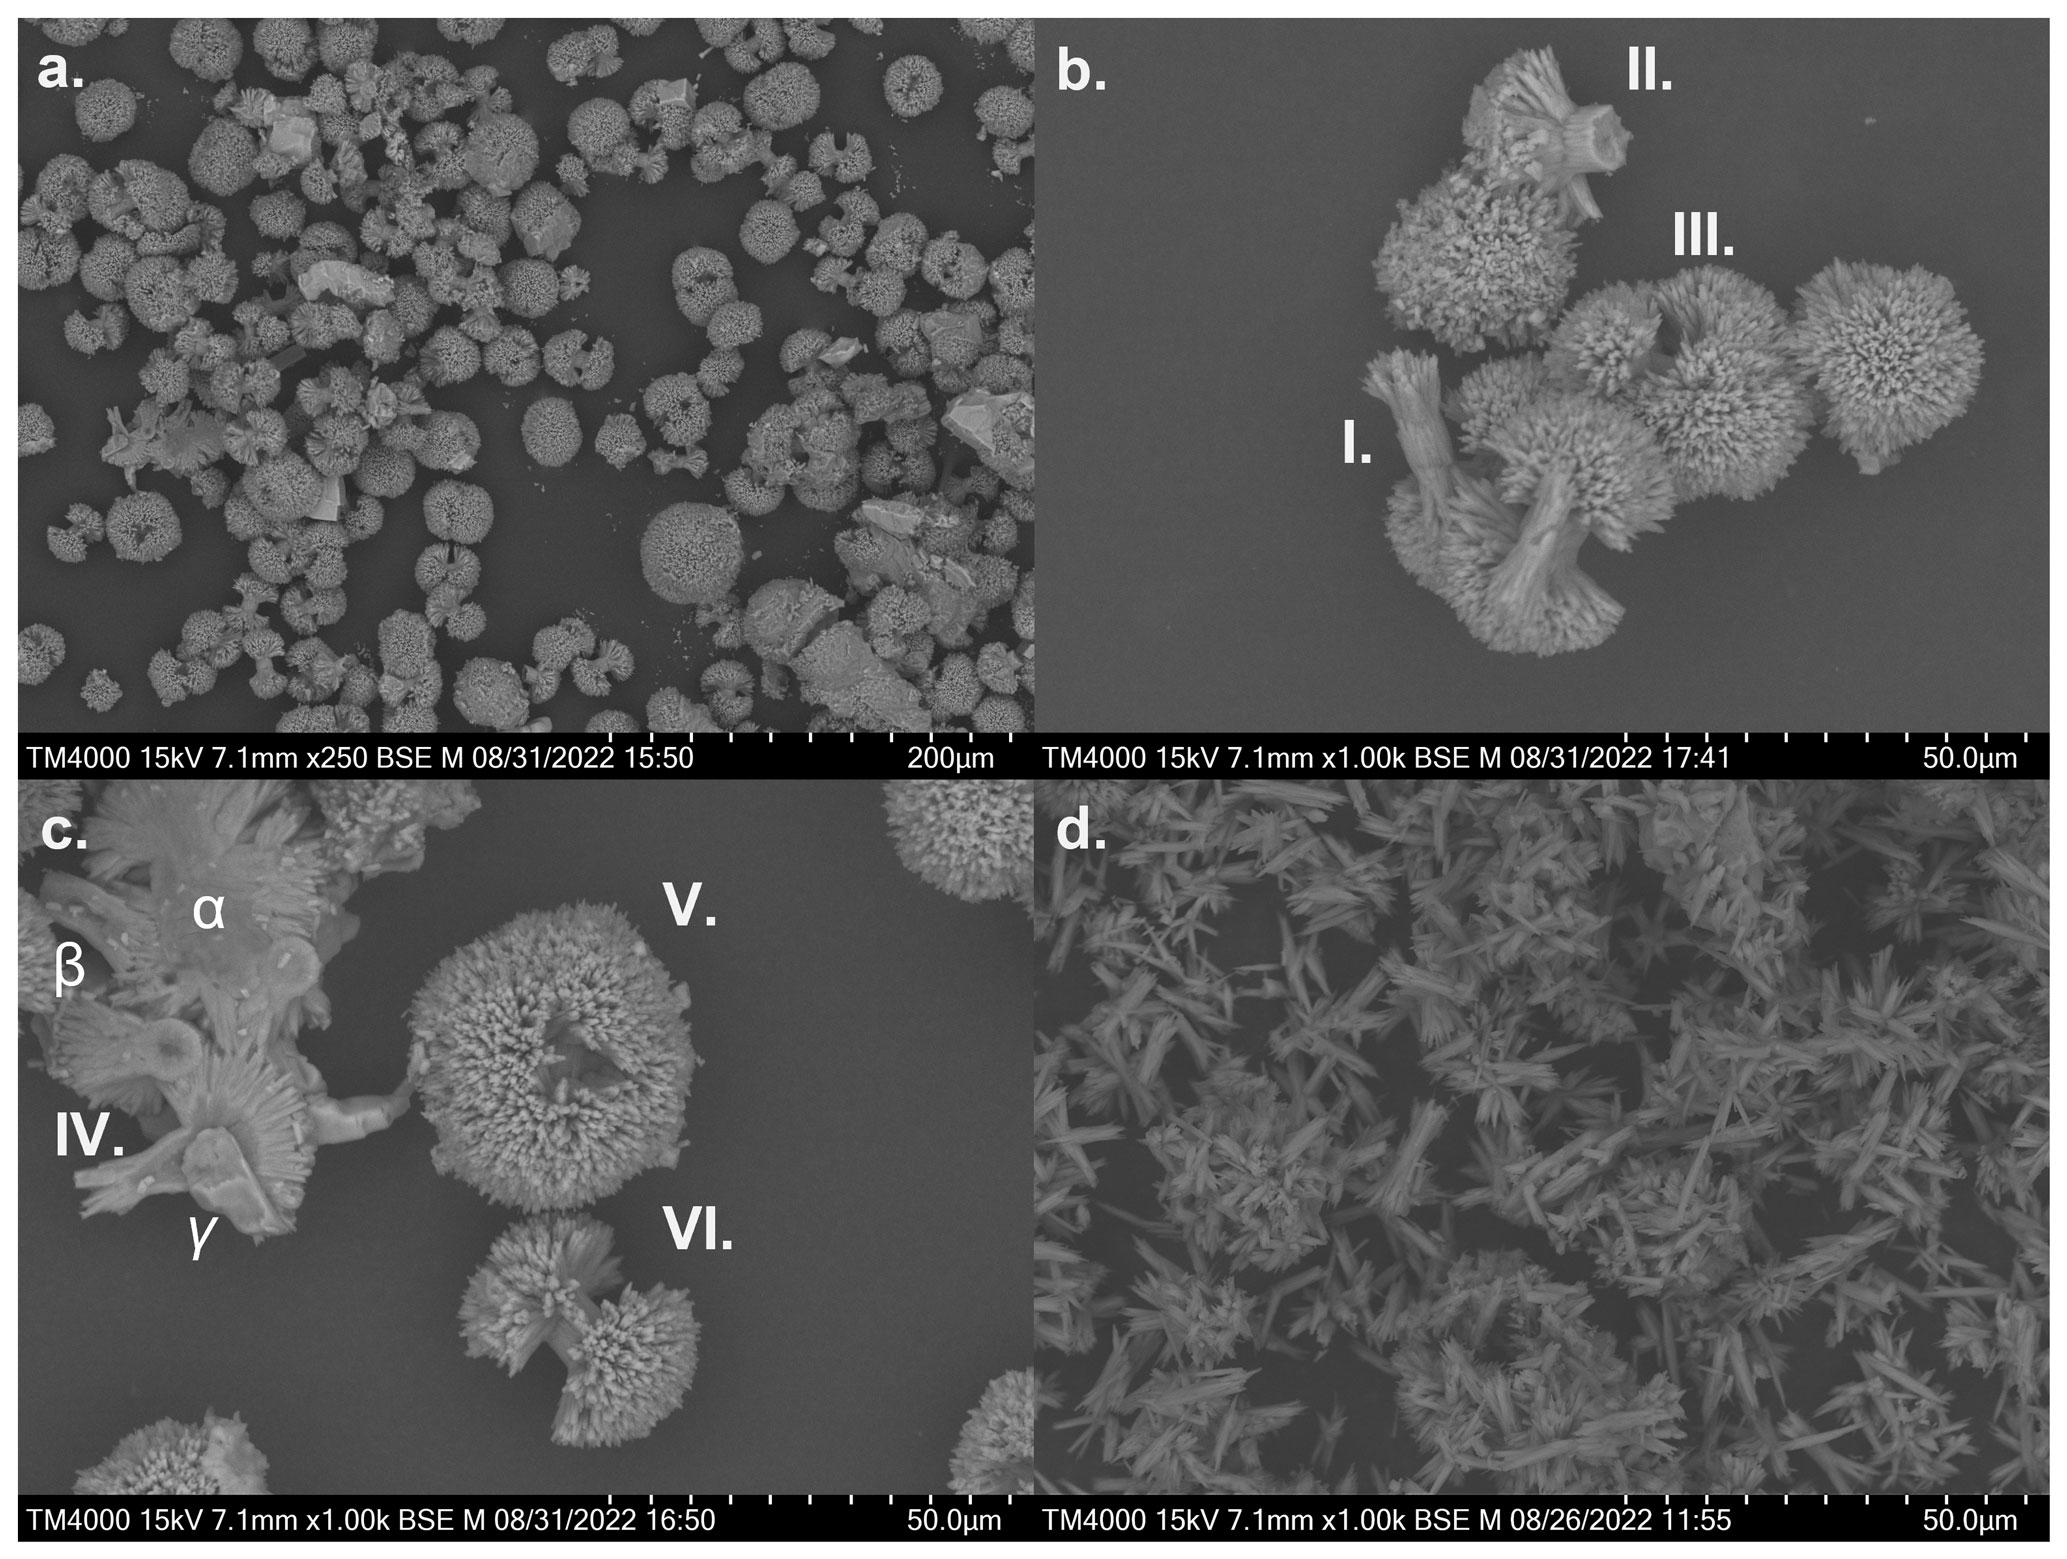
Figure 9Selection of scanning electron microscope images of filtered precipitates from experiments IIa (non-CO2-equilibrated – after 4 d) and V (Ca(OH)2): (a) overview of IIa; (b) cluster of precipitates; (c) detailed shot of precipitates and cross section through a cluster, showing the internal crystal growth structures (d) overview of precipitates from experiment V (Ca(OH)2 – after 10 d).
4.1 General discussion
Results show that the way alkalinity is added to the ocean is crucial to have sustained elevated alkalinity values and, more importantly, to avoid an alkalinity net loss through carbonate precipitation. Major controlling factors are (i) the type of mineral used, (ii) whether TA is introduced in solid form or as a solution, (iii) in the case of a solution, if it is already enriched with DIC for pCO2-equilibrium with the atmosphere or not, and (iv) the presence of biogenic or mineral particles in seawater, affecting “runaway precipitation” of carbonate (Moras et al., 2022) and associated net loss of TA.
In the approach of using alkaline solutions equilibrated with atmospheric CO2 (experiment I), no ΔTAnet loss was observed after 4 d, even at high ΔTAadded. The reason is that the carbonate system (based on Ω(ar) of the bulk solution) stayed within boundaries to avoid mineral precipitation for the duration of 4 d. In contrast, application of a solution with elevated alkalinity not equilibrated with atmospheric CO2 (experiment II, compare Figs. 1 and 2) caused already at the first day a sustained loss of alkalinity for the high alkalinity addition of 2400 µmol kgsw−1 (Fig. 2). The reason is that, for the same ΔTAadded, perturbations of the carbonate system that affect mineral precipitation are much stronger in this non-equilibrated scenario because alkalinity was added in the pure form of OH−, while in the equilibrated experiment alkalinity was added in precalculated ratios of HCO and CO to form a water in equilibrium with the atmosphere. Consequently, treatments with non-equilibrated conditions in experiment II reflect water bodies not being able to equilibrate in time before a loss due to critical oversaturation happens, likely to be close below the seawater surface given the slow equilibration with the atmosphere (Jones et al., 2014). This would indicate that usage of reactors to prepare suitable CO2-equilibrated alkaline solutions should be considered for large-scale OAE (see section below).
Relevant losses for the biotic treatment in experiment II, simulating non-equilibrium conditions, after 4 days were visible already for treatments with additions >900 µmol TA kgsw−1 (Fig. 2). Results of experiment II indicate that a lack of condensation nuclei in the filtered abiotic treatments prevented the start of precipitation at lower TA additions. The difference between biotic and abiotic treatments in experiment II is additional potential seed surface due to particles and plankton >0.2 and <55 µm, which may act as nucleation sites (“seed”) for precipitation. In fact, this has resulted in loss of ΔTAnet at lower ΔTAadded levels in the biotic treatment. The loss ratio of TA and DIC (ΔTA : ΔDIC) of 2:1 (Fig. 3b, d) support that the precipitates are carbonates (cf. Fig. 9). Comparable observations were made using quartz particles in Moras et al. (2022) because the abundance of potential surface nucleation sites lowers the threshold for alkalinity loss via precipitation.
Notably, once carbonate precipitation is initiated (Fig. 2), TA loss does not stop at Ωaragonite levels of 12.5–13.5 (corresponding to Ωcalcite levels of 19–20), which were reported (Morse and He, 1993) as threshold levels above which spontaneous carbonate nucleation occurs (in filtered seawater at 25 ∘C and salinity of 35). The threshold for carbonate nucleation is more specific than spontaneous carbonate formation and growth, e.g. on suitable surface providing optimal surface properties, with lower energy barriers than nucleation. Once the process of carbonate formation is triggered in this experiment it continues until a certain specific thermodynamic equilibrium is reached, which may not have been reached considering the duration of the experiments. Experiment III demonstrates that the loss of alkalinity can start without particles also at lower than the described critical Ωaragonite for filtered seawater if time is longer than 10 d, and that the presence of carbonate precipitates from former experiments accelerated this process (Fig. 4). Precipitation of minerals at the surface of the walls of the experimental vessel without adding particles underlines the relevance of surfaces added and their quality as can be seen by the difference in ΔTAnet for the cases adding carbonate precipitates and not to the bulk water (Fig. 4).
Experiment IV differs from experiments I to III, using alkaline solids Mg(OH)2 to produce alkalinity in the seawater while providing at the same time a reactive surface area. Carbonate formation and TA loss started in this experiment at Ωaragonite well below 12.5 of the bulk solutions. Dissolution–precipitation processes at the surface of the particles happen at the same time (Figs. 5 and 6), as indicated by the ΔTA:ΔDIC change ratios in the bulk water between 1.2:1 and 1.9:1, clearly lower than 2:1 as expected for carbonate formation alone (compare experiment 2, Fig. 3). The differences in ΔTA: ΔDIC change ratios for brucite I (1.2:1) and brucite II (1.6:1) for moderate solid ΔTAadded treatments up to ΔTA2400 indicate significant product-specific differences in simultaneous mineral dissolution and carbonate formation characteristics at their surfaces. This result calls for detailed product-specific evaluation of solid alkaline materials before application and quality control in case a certain material might be identified as being useful. In addition, this finding suggests that simple modelling of alkalinity addition based on a given mineral type provides no realistic insights into real-world ocean alkalinity enhancement applications. In addition, particle surface processes on added solid alkaline particles are to be considered. As shown in the equilibrated approach of experiment III with an added solute alkalinity instead of reactive particles, on longer timescales (here up to 90 d) also the presence of potential nucleation sites, in the form of suspended particles or other exposed surfaces, affect the stability of added alkalinity and hence have to be considered for OAE applications. Importantly, alkalinity loss processes identified in these laboratory-scale experiments need to be investigated in field trials for further verification and quantification.
4.2 Loss of alkalinity, carbonate formation, temporal stability, and potential recovery of alkalinity
The question of potential recovery of lost alkalinity is even more complicated (experiment V, Fig. 7) and is a critical aspect for OAE application: if lost alkalinity recovers after a certain time and target TA is reached, then such transient losses could be accepted. The simple experiment V with Ca(OH)2, lasting 10 d, illustrates that alkalinity consumed via carbonate formation may partly be released again, here probably facilitated by accelerated ingassing of CO2 using a shaking bath (Fig. 7), as indicated by the decline in pH after ∼ 2.5 d. This shaking bath experiment may not be representative for open ocean application, but shows the problem to face, a net loss of TA under certain conditions. Future experiments should gain insights under which conditions a temporal loss of alkalinity can be accepted if a net increase would be the result. This was not achieved in experiment V but could be given different application scenarios or dilution in time (cf. Moras et al., 2022).
In general, amorphous calcium carbonate (ACC) with variable proportion of Mg contents precipitates from water as a precursor prior to the crystallization of minerals like aragonite or calcite via transformation processes (Rodriguez-Blanco et al., 2017). Direct calcite or aragonite precipitation from water occurs only at high supersaturation levels (Rodriguez-Blanco et al., 2017), which were exceeded in some of the experiments here (cf. Fig. 9) .
The precursor ACC leading to an alkalinity loss via nucleation is not stable and can redissolve (Mergelsberg et al., 2020; Brečević and Nielsen, 1989; Clarkson et al., 1992), with reported solubilities more than 100 times larger than for calcite in pure water. Under which conditions ACC precursors formed during OAE can redissolve, to avoid longer-term alkalinity loss, and how fast mixing with untreated water has to be to avoid permanent loss of TA, is – based on few existing data (cf. Moras et al., 2022) – difficult to assess for OAE. Further experiments in the context of OAE are therefore needed. A good understanding of mixing rates of treated and untreated water at OAE application sites is therefore critical to avoid permanent TA loss.
The observations from the threshold experiment VI (Fig. 8) are making the application more non-trivial, as an excess application of alkaline solids could cause an addition of TA instead of a loss, but with for now unknown consequences for ecosystems due to temporal high pH values above 9.5 for a longer time (cf. Fig. 7 using lower doses compared to excess addition in experiment VI).
In addition, solid particles of different quality react differently if high application amounts per volume of seawater are used (Fig. 8). In the case of the used Ca(OH)2 a gain in ΔTAnet could be observed (Fig. 8b) using high dosages of material (2 g kgsw−1 versus 1 g kgsw−1, which lead to a ΔTAnet loss). For the brucite instead, even adding 13 g kgsw−1 lead not to a positive change in ΔTAnet after 24 h. This simple experiment VI suggests that ΔTAnet loss must not be necessarily the case using excess amounts of fast-dissolving minerals at the costs of high pH levels, local critical oversaturation levels, and lower efficiency. As long as consequences of such excess treatment of seawater are not well enough understood for sustainable OAE management, the combination of results from the experiments I to IV suggest that adding alkalinity to the ocean should be undertaken such that the rate of increase in ΔTAnet is equal to or less than the rate of re-equilibration of atmospheric CO2 to avoid critical oversaturation levels. Such control seems to be difficult to achieve with the direct addition of tested fine solids or highly alkaline liquids not in equilibrium with the atmosphere. It is possible to obtain greater control if a reactor is used to prepare a pre-equilibrated solution with elevated alkalinity without triggering precipitation (Ωaragonite < ∼ 12.5, cf. experiment I in Fig. 1b).
Before starting open ocean experiments, detailed model approaches are needed to assess these problems identified as follows: stability of added alkalinity, possible redissolution of temporary lost alkalinity, and excess application causing a ΔTAnet increase with co-precipitation of carbonates and possibly concerning duration of high pH values. This in turn needs more laboratory- or mesocosm-scale experiments to determine which role particles, present in natural waters, play by lowering the threshold level for potential ΔTAnet loss (cf. experiment IIa and IIb, abiotic with biotic particles, or Wurgraft et al., 2021) to parameterize models. By now, there are simply not enough reliable data existing to allow for reliable, realistic model calibration. A serious aspect considering that models are used to assess global and regional potential of OAE, which in turn is used to discuss which CDR methods are to be considered for future global CDR schemes.
Considering that temporally unstable precursors of carbonate minerals form during the application of OAE, as indicated by experiment V (Fig. 7), knowledge about the structure and behaviour of such unstable carbonate species formed is essential for discussing further the application scenarios of OAE. It is relevant to know the fraction and quality of formed unstable carbonate phases which might redissolve under given local and seasonal conditions, as well as application scenarios, because the question of a ΔTAnet loss or gain depends on it and if a ΔTAnet loss is only transient for a given acceptable time. Understanding which quality of particle surfaces, and surface area amounts per volume of water, trigger ΔTAnet loss is to be further investigated. It is known for a few particles only, e.g. it is a common laboratory routine to “seed” water with solid carbonates for the initiation of carbonate precipitation (Wurgaft et al., 2021; Morse et al., 2003; DeBoer, 1977). The abundance of suitable surfaces allow carbonate formation and alkalinity loss at lower bulk water saturation levels than is used to artificially precipitate carbonates from filtered seawater as shown by Wurgaft et al. (2021) and supported by results from Molnár et al. (2021) and experiment III (addition of precipitates from previous experiments). In addition, biotic processes may support carbonate formation at the small scale, via photosynthesis, modulating the local carbonate system via uptake of inorganic carbon (Wolf-Gladrow and Riebesell, 1997). Experiment II indicates that ocean-based particles lead to carbonate formation at lower ΔTAadded levels compared to filtered water, despite that in this specific seawater only few particles were present.
Because triggered carbonate precipitation aids or boosts further precipitation in seawater, it is in the context of an OAE application scenario it is essential to understand under which conditions alkalinity loss can be avoided, given the large variety of possible combinations of particles and biota in the world's ocean. The continued loss of alkalinity well below critical values of Ωaragonite once triggered was labelled “runaway precipitation” by Moras et al. (2022). This aspect needs further understanding based on the few experiments available, as ΔTAnet loss may stop under certain conditions and a possible regain of TA might happen (Fig. 7), which would be a relevant aspect of OAE management.
Specifically, the question about the time window until an amorphous carbonate cluster can redissolve when mixed with untreated seawater is essential for OAE treatment plans and management, considering that sustainable techniques for the application of OAE and monitoring are still missing. Essential global and regional data on stability of TA are still missing and need to be collected at the large scale, if OAE should be a practical CDR technology, which is one day emerging from the method idea to a real-world application technology.
4.3 Consequences for application strategies
Model assessments on the global potential of OAE for long-term CO2 removal do not consider the risks of alkalinity loss through increased carbonate precipitation (Burt et al., 2021; González and Ilyina, 2016; Ilyina et al., 2013; Kheshgi, 1995; Köhler et al., 2013).
Global modelling studies so far assumed very idealized conditions of OAE, e.g. a spatially and temporally homogenous increase in TA over years or decades. In reality, OAE will likely be achieved via point source release of solid or liquid TA, leading to spatially and temporally much stronger perturbations of the carbonate system, which may in turn trigger carbonate precipitation and ΔTAnet loss. This process might be further facilitated by the presence of particles in seawater, an aspect not considered in models so far.
Results from our study, as well as those from Moras et al. (2022) and Wurgaft et al. (2021), suggest that homogenous or heterogenous nucleation should be avoided to prevent ΔTAnet loss.
The loss of alkalinity in unfiltered water with elevated alkalinity in disequilibrium with the atmosphere after the addition of a solution without particles (Fig. 3, experiment II) starts at lower alkalinity additions than in filtered water. The water used in the experiments I to III is representative of oligotrophic ocean regions, which are low in particle abundance, but it cannot be ruled out that few suspended sediment grains are affecting the results due to the close distance to the coast. Wurgaft et al. (2021) showed that particles from river plumes can trigger alkalinity and DIC loss via carbonate precipitation at lower alkalinity levels than used here (∼ 2400 µmol kgsw−1) (Figs. 1 and 2). This observation suggests that without further investigation, application of OAE in such areas should be avoided.
Caserini et al. (2021) modelled a ship application of OAE, simulating an addition of a slurry of Ca(OH)2. In their model results, pH levels of 9.2 to 9.5 are reached in open water. Even if these high pH levels would be reached for only a short time (minutes to hours), results here suggest (Figs. 5 to 7) that ship OAE application procedures could result in critical saturation levels, triggering alkalinity loss (cf. experiment V and Moras et al., 2022). Experiment VI, however, showed that at the expense of high pH, application of high doses, exceeding the second threshold identified here, results in a ΔTAnet gain but no loss. But, in that case not all added solid alkalinity is transferred into liquid TA in seawater (Fig. 8: efficiency of 78 % after 24 h for the highest dose).
The addition of non-equilibrated alkaline liquid from a ship would have to be in a way that the saturation state remains below critical thresholds at the site of release. The distribution of the alkaline liquid might be operated via large nets with a network of distributed pressure nozzles causing instances of small point turbulence for effective mixing of treated water with untreated. Slow point addition rates would increase the ship time needed to deliver a cumulative amount of alkalinity change to the ocean. This would increase the cost and, where fossil bunker fuel is used, reduce the overall effectiveness of OAE if ship CO2 emissions are not used to produce alkaline solutions added to the ocean. The rate of the ship-based TA addition would likely be constrained by the rate of CO2 resupply to the treated seawater (in general the air–sea gas exchange) and the dilution rate of treated water with untreated.
To avoid that added solid particles act as seeds for carbonate precipitation, it may therefore be feasible to add engineered solid particles with sufficiently slow dissolution rates at the particle surface to prevent critical changes in seawater carbonate chemistry, while sink velocity is slow enough to allow for full dissolution close to the sea surface.
An alternative to open ocean addition is the use of reactors to produce equilibrated solutions for the addition into the sea (as shown by experiment I). Reactors for alkalinity production have been proposed for various purposes. For example, Kirchner et al. (2021) demonstrated on land that it is possible to produce alkaline solutions using limestone and seawater to scrub flue gases of a coal power plant. An alkalinity reactor at the industrial scale for counteracting water acidification in lakes after mining brown coal was built and operated in the Lausitz area, Germany (Koch and Mazur, 2016; LMBV, 2017). The pilot plant to this reactor was able to use solid CaO, Ca(OH)2, or CaCO3 and pure CO2 for alkalinity production.
A further alternative is suggested by experiment I. Na2CO3 and NaHCO3 dissolve quickly due to their high solubility in seawater. Results here (Figs. 1 and 3) show that the combination of Na2CO3 and NaHCO3 to produce a targeted alkaline solution equilibrated with atmospheric conditions gives the best outcome for a potentially sustainable alkalinity addition. The application of solid Na2CO3 was already suggested by Kheshgi (1995), but also discarded for global application due to limited natural resources.
It might therefore be worthwhile to study the production of Na2CO3 and NaHCO3 from CO2, NaCl, and H2O for OAE using solar thermal energy (Forster, 2014) or possibly as a product of electrochemical approaches (House et al., 2007; Rau et al., 2013). A review on NaHCO3 production techniques showed that this topic is under-researched (Bonfim-Rocha et al., 2019), opening up the possibility for improvements in terms of cost and energy demand. In addition, new concepts for Na2CO3 production (Forster, 2012, 2014; Wu et al., 2019) provide energetically improved and environmentally friendly production schemes. Such improvements are relevant in the context of needed energy resources.
Wu et al. (2019) suggest an energy demand of 5.32 GJ t−1 Na2CO3, a decrease by 61 % compared to standard Solvay process production. Using solar thermal energy for Na2CO3 (Forster, 2014) and NaHCO3 (Bonfim-Rocha et al., 2019) has the advantage that production is not a burden to the electrical energy grid. Energy costs would be in the range of other discussed CDR approaches, like 4 to 12 GJ t−1 CO2 for direct air capture (Shayegh et al., 2021; NASEM, 2022), or 3–6 GJ t−1 CO2 for other methods of OAE (Renforth and Henderson, 2017). If the Na carbonate solids were produced from NaCl solutions (e.g. through electrochemistry), methods for disposing of the waste HCl acid or the evolved Cl2 gas would need to be found (NASEM, 2022). However, HCl could also be a resource to other processes, like the extraction of needed elements for the global energy transformation from rocks.
4.4 Consequences of alkalinity leakage and impacts of OAE on biota
Model studies indicate that adding alkalinity to the ocean could remove between 3 and 10 Gt of carbon dioxide per year from the atmosphere, while at the same time counteracting ocean acidification (Feng et al., 2017; Harvey, 2008). However, the potential impact of adding alkaline materials on marine organisms and ecosystems is still largely unknown. Most of the alkalinity enhancement experiments carried out to date have used calcium or sodium hydroxides as alkaline substances (D'Olivo and McCulloch, 2017; Lenton et al., 2018; Albright et al., 2016; Cripps et al., 2013) and have been tested on a small number of calcifying organisms, like molluscs (Cripps et al., 2013; Waldbusser et al., 2014), corals (Comeau et al., 2012; Albright et al., 2016), and calcifying algae (Gore et al., 2018). In most cases, adding alkaline materials led to enhanced calcification in response to increased calcite and aragonite saturation states. The only in situ experiment in marine waters was carried out in a coral reef, leading to the restoration of calcification of corals that were affected by the decline in carbonate saturation state caused by acidification (Albright et al., 2016).
Other compounds (like iron, silica, or heavy metals) occurring in alkaline rocks that could be added to the water might stimulate or inhibit organism growth, potentially benefiting some organism over others, thereby changing community structure. For instance, a shift towards diatoms and diazotrophic phytoplankton might occur if silica and iron-rich olivine is used as an alkaline agent. On the contrary, the use of alkaline solutions could benefit calcifying plankton, like coccolithophorids (Köhler et al., 2013; Bach et al., 2019), although diverse adaptations within this group may lead to different responses to OAE (Langer, 2009). Moreover, the addition of technical and natural mineral products may also release trace metals, like nickel in the case of olivine dominated dunite (Montserrat et al., 2017).
Overall, the side effects of OAE on organisms, and more importantly on ecosystems, is largely unknown and deserves research at the experimental level to provide a better knowledge in order to make informed decisions on whether or not alkalinity enhancement is a feasible mitigation strategy.
From the inorganic geochemical perspective, the amount of potentially formed carbonate phases, their stability (potential re-dissolution), and the subsequent loss of alkalinity after OAE application determines the sustainability of OAE. Understanding these processes and their management will be crucial for the decision-making process regarding OAE application and its subsequent potential for CO2 sequestration.
For a given environmental setting, the risk of triggering the loss of alkalinity after OAE is determined by the carbonate saturation state, its temporal evolution, and particle surface processes, with the possibility of being steered by the surface area per volume of water as well as the quality of such surface. To avoid the loss of alkalinity and maximize alkalinity addition, the application of an alkaline solution in CO2-equilibrium with the atmosphere and/or solutions with saturation levels that avoid loss of alkalinity is favourable over the application of tested solid materials. Reactor solutions preparing alkaline solutions have been developed for other purposes, like counteracting lake acidification or scrubbing CO2 from flue gas, and their design could be a blueprint for OAE reactors.
Formation and redissolution of (temporally) instable carbonate phases are not well understood from the viewpoint of OAE management. This knowledge gap includes natural mixing processes of alkalinity-enhanced water with untreated water, therefore diluting potentially critical conditions in time before permanent secondary precipitation occurs. A pre-application assessment as part of OAE management requires therefore detailed information on the hydrodynamics and advection of CO2 into the water at the site of OAE application.
In addition, a broad spectrum of the effects of duration and degrees of oversaturation levels on permanent carbonate formation (Fig. 7) needs to be studied, including the effect of temperature affecting nucleation kinetics, which was not addressed here. It is likely that in colder waters than tested here, carbonate formation triggered by OAE is delayed via slower kinetics, offering more time for dilution with untreated water. A public database with increasing information on tested materials and gained parameters for OAE application might help in the future to refine OAE assessments on potentials and risks. Such a database should include knowledge on the ecosystem response to TA and pH changes, one aspect which is understudied.
In conclusion, this study outlined some of the relevant aspects where knowledge on applicability of OAE must be refined before safe and sustainable application boundary conditions and management procedures for OAE can be established.
All underlying raw data are provided in the Supplement. See the next section labelled “Supplement”.
The supplement related to this article is available online at: https://doi.org/10.5194/bg-20-781-2023-supplement.
JH conceived the idea for this work. NS, JH, and JT designed the experiments. NS performed the experiments with partial help of JT, CL, and JS. JH wrote the text with the help of all co-authors.
The contact author has declared that none of the authors has any competing interests.
Publisher’s note: Copernicus Publications remains neutral with regard to jurisdictional claims in published maps and institutional affiliations.
Peggy Bartsch (UHH) and Tom Jäppinen (UHH) are thanked for supporting the preparation and conduction of the experiments. This project has received funding from the European Union's Horizon 2020 research and innovation programme under grant agreement no. 869357 (project OceanNETs, ocean-based negative emission technologies – analysing the feasibility, risks, and co-benefits of ocean-based negative emission technologies for stabilizing the climate) and by the Deutsche Forschungsgemeinschaft (DFG, German Research Foundation) under Germany's Excellence Strategy – EXC 2037 “CLICCS – Climate, Climatic Change, and Society” – Project Number: 390683824, contribution to the Center for Earth System Research and Sustainability (CEN) of Universität Hamburg. This is a contribution to the BMBF-project CDRmare RETAKE-J (03F0895J).
This research has been supported by the Horizon 2020 (OceanNETs (grant no. 869357)) and the Deutsche Forschungsgemeinschaft (grant no. 390683824).
This paper was edited by Jean-Pierre Gattuso and reviewed by Scott C. Doney and Olivier Sulpis.
Albright, R., Caldeira, L., Hosfelt, J., Kwiatkowski, L., Maclaren, J. K., Mason, B. M., Nebuchina, Y., Ninokawa, A., Pongratz, J., Ricke, K. L., Rivlin, T., Schneider, K., Sesboüé, M., Shamberger, K., Silverman, J., Wolfe, K., Zhu, K., and Caldeira, K.: Reversal of ocean acidification enhances net coral reef calcification, Nature, 531, 362–365, https://doi.org/10.1038/nature17155, 2016.
Bach, L. T., Gill, S. J., Rickaby, R. E. M., Gore, S., and Renforth, P.: CO2 Removal With Enhanced Weathering and Ocean Alkalinity Enhancement: Potential Risks and Co-benefits for Marine Pelagic Ecosystems, Front. Clim., 1, 1038, https://doi.org/10.3389/fclim.2019.00007, 2019.
Badocco, D., Pedrini, F., Pastore, A., di Marco, V., Marin, M. G., Bogialli, S., Roverso, M., and Pastore, P.: Use of a simple empirical model for the accurate conversion of the seawater pH value measured with NIST calibration into seawater pH scales, Talanta, 225, 122051, https://doi.org/10.1016/j.talanta.2020.122051, 2021.
Bonfim-Rocha, L., Silva, A. B., Faria, S. H. B. D., Vieira, M. F., and Souza, M. D.: Production of Sodium Bicarbonate from CO2 Reuse Processes: A Brief Review, Int. J. Chem. React. Eng., 18, 1883, https://doi.org/10.1515/ijcre-2018-0318, 2019.
Brečević, L. and Nielsen, A. E.: Solubility of amorphous calcium carbonate, J, Cryst. Growth, 98, 504–510, https://doi.org/10.1016/0022-0248(89)90168-1, 1989.
Burt, D. J., Fröb, F., and Ilyina, T.: The Sensitivity of the Marine Carbonate System to Regional Ocean Alkalinity Enhancement, Front. Clim., 3, 624075, https://doi.org/10.3389/fclim.2021.624075, 2021.
Caserini, S., Pagano, D., Campo, F., Abbà, A., De Marco, S., Righi, D., Renforth, P., and Grosso, M.: Potential of Maritime Transport for Ocean Liming and Atmospheric CO2 Removal, Front. Clim., 3, 575900, https://doi.org/10.3389/fclim.2021.575900, 2021.
Clarkson, J. R., Price, T. J., and Adams, C. J.: Role of metastable phases in the spontaneous precipitation of calcium carbonate, J. Chem. Soc., 88, 243–249, https://doi.org/10.1039/FT9928800243, 1992.
Comeau, S., Alliouane, S., and Gattuso, J. P.: Effects of ocean acidification on overwintering juvenile Arctic pteropods Limacina helicina, Mar. Ecol. Prog. Ser., 456, 279–284, https://doi.org/10.3354/meps09696, 2012.
Cripps, G., Widdicombe, S., Spicer, J. I., and Findlay, H. S.: Biological impacts of enhanced alkalinity in Carcinus maenas, Mar. Pollut. Bull., 71, 190–198, https://doi.org/10.1016/j.marpolbul.2013.03.015, 2013.
DeBoer, R. B.: Influence of seed crystals on the precipitation of calcite and aragonite, Am. J. Sci., 277, 38–60, https://doi.org/10.2475/ajs.277.1.38, 1977.
Dickson, A. G.: Standard potential of the reaction: AgCl(s) + H2 (g) = Ag(s) + HCl(aq), and and the standard acidity constant of the ion HSO in synthetic sea water from 273.15 to 318.15 K, J. Chem. Thermodyn., 22, 113–127, https://doi.org/10.1016/0021-9614(90)90074-z, 1990.
Dickson, A. G. and Riley, J. P.: The estimation of acid dissociation constants in seawater media from potentionmetric titrations with strong base, I. The ionic product of water – Kw, Mar. Chem., 7, 89–99, https://doi.org/10.1016/0304-4203(79)90001-X, 1979.
D'Olivo, J. P. and McCulloch, M. T.: Response of coral calcification and calcifying fluid composition to thermally induced bleaching stress, Sci. Rep., 7, 2207, https://doi.org/10.1038/s41598-017-02306-x, 2017.
Fakhraee, M., Li, Z., Planavsky, N., and Reinhard, C.: Environmental impacts and carbon capture potential of ocean alkalinity enhancement, Commun. Earth Environ. [preprint], https://doi.org/10.21203/rs.3.rs-1475007/v1, 2022.
Feng, E. Y., Koeve, W., Keller, D. P., and Oschlies, A.: Model-Based Assessment of the CO2 Sequestration Potential of Coastal Ocean Alkalinization, Earth's Future, 5, 1252–1266, https://doi.org/10.1002/2017ef000659, 2017.
Forster, M.: Investigations for the environmentally friendly production of Na2CO3 and HCl from exhaust CO2, NaCl and H2O, J. Clean. Prod., 23, 195–208, https://doi.org/10.1016/j.jclepro.2011.10.012, 2012.
Forster, M.: Investigations to convert CO2, NaCl and H2O into Na2CO3 and HCl by thermal solar energy with high solar efficiency, J. CO2 Util., 7, 11–18, https://doi.org/10.1016/j.jcou.2014.06.001, 2014.
Friedlingstein, P., Jones, M. W., O'Sullivan, M., Andrew, R. M., Bakker, D. C. E., Hauck, J., Le Quéré, C., Peters, G. P., Peters, W., Pongratz, J., Sitch, S., Canadell, J. G., Ciais, P., Jackson, R. B., Alin, S. R., Anthoni, P., Bates, N. R., Becker, M., Bellouin, N., Bopp, L., Chau, T. T. T., Chevallier, F., Chini, L. P., Cronin, M., Currie, K. I., Decharme, B., Djeutchouang, L. M., Dou, X., Evans, W., Feely, R. A., Feng, L., Gasser, T., Gilfillan, D., Gkritzalis, T., Grassi, G., Gregor, L., Gruber, N., Gürses, Ö., Harris, I., Houghton, R. A., Hurtt, G. C., Iida, Y., Ilyina, T., Luijkx, I. T., Jain, A., Jones, S. D., Kato, E., Kennedy, D., Klein Goldewijk, K., Knauer, J., Korsbakken, J. I., Körtzinger, A., Landschützer, P., Lauvset, S. K., Lefèvre, N., Lienert, S., Liu, J., Marland, G., McGuire, P. C., Melton, J. R., Munro, D. R., Nabel, J. E. M. S., Nakaoka, S.-I., Niwa, Y., Ono, T., Pierrot, D., Poulter, B., Rehder, G., Resplandy, L., Robertson, E., Rödenbeck, C., Rosan, T. M., Schwinger, J., Schwingshackl, C., Séférian, R., Sutton, A. J., Sweeney, C., Tanhua, T., Tans, P. P., Tian, H., Tilbrook, B., Tubiello, F., van der Werf, G. R., Vuichard, N., Wada, C., Wanninkhof, R., Watson, A. J., Willis, D., Wiltshire, A. J., Yuan, W., Yue, C., Yue, X., Zaehle, S., and Zeng, J.: Global Carbon Budget 2021, Earth Syst. Sci. Data, 14, 1917–2005, https://doi.org/10.5194/essd-14-1917-2022, 2022.
González, M. F. and Ilyina, T.: Impacts of artificial ocean alkalinization on the carbon cycle and climate in Earth system simulations, Geophys. Res. Lett., 43, 6493–6502, https://doi.org/10.1002/2016gl068576, 2016.
Gore, S., Renforth, P., and Perkins, R.: The potential environmental response to increasing ocean alkalinity for negative emissions, Mitig. Adapt. Strat. Gl., 24, 1191–1211, https://doi.org/10.1007/s11027-018-9830-z, 2018.
Harvey, L. D. D.: Mitigating the atmospheric CO2increase and ocean acidification by adding limestone powder to upwelling regions, J. Geophys. Res., 113, C04028, https://doi.org/10.1029/2007jc004373, 2008.
House, K. Z., House, C. H., Schrag, D. P., and Aziz, M. J.: Electrochemical acceleration of chemical weathering as an energetically feasible approach to mitigating anthropogenic climate change, Environ. Sci. Technol., 41, 8464–8470, https://doi.org/10.1021/es0701816, 2007.
Ilyina, T., Six, K. D., Segschneider, J., Maier-Reimer, E., Li, H., and Núñez-Riboni, I.: Global ocean biogeochemistry model HAMOCC: Model architecture and performance as component of the MPI-Earth system model in different CMIP5 experimental realizations, J. Adv. Model. Earth Syst., 5, 287–315, https://doi.org/10.1029/2012ms000178, 2013.
IPCC: Summary for Policymakers, in: Climate Change 2021: The Physical Science Basis. Contribution of Working Group I to the Sixth Assessment Report of the Intergovernmental Panel on Climate Change, edited by: Masson-Delmotte, V., Zhai, P., Pirani, A., Connors, S. L., Péan, C., Berger, S., Caud, N., Chen, Y., Goldfarb, L., Gomis, M. I., Huang, M., Leitzell, K., Lonnoy, E., Matthews, J. B. R., Maycock, T. K., Waterfield, T., Yelekçi, O., Yu, R., and Zhou, B., Cambridge University Press, Cambridge, United Kingdom and New York, NY, USA, 3−-32, 2021.
Jones, D. C., Ito, T., Takano, Y., and Hsu, W.-C.: Spatial and seasonal variability of the air-sea equilibration timescale of carbon dioxide, Global Biogeochem. Cy., 28, 1163–1178, https://doi.org/10.1002/2014gb004813, 2014.
Kheshgi, H. S.: Sequestering atmospheric carbon dioxide by increasing ocean alkalinity, Energy, 20, 915–922, https://doi.org/10.1016/0360-5442(95)00035-F, 1995.
Kirchner, J. S., Lettmann, K. A., Schnetger, B., Wolff, J.-O., and Brumsack, H.-J.: Identifying Appropriate Locations for the Accelerated Weathering of Limestone to Reduce CO2 Emissions, Minerals, 11, 1261, https://doi.org/10.3390/min11111261, 2021.
Koch, C. B. and Mazur, K.: A new technology of pit lake treatment using calcium oxide and carbon dioxide to increase alkalinity, IMWA 2016 – Mining Meets Water – Conflicts and Solutions, International Mine Water Association, 284–291, ISBN 978-3-86012-533-5, 2016.
Köhler, P., Abrams, J. F., Völker, C., Hauck, J., and Wolf-Gladrow, D. A.: Geoengineering impact of open ocean dissolution of olivine on atmospheric CO2, surface ocean pH and marine biology, Environ. Res. Lett., 8, 014009, https://doi.org/10.1088/1748-9326/8/1/014009, 2013.
Koishi, A.: Carbonate mineral nucleation pathways, Doctoral dissertation, Université Grenoble Alpes, 194 pp., 2017.
Langer, G., Nehrke, G., Probert, I., Ly, J., and Ziveri, P.: Strain-specific responses of Emiliania huxleyi to changing seawater carbonate chemistry, Biogeosciences, 6, 2637–2646, https://doi.org/10.5194/bg-6-2637-2009, 2009.
Lenton, A., Matear, R. J., Keller, D. P., Scott, V., and Vaughan, N. E.: Assessing carbon dioxide removal through global and regional ocean alkalinization under high and low emission pathways, Earth Syst. Dynam., 9, 339–357, https://doi.org/10.5194/esd-9-339-2018, 2018.
LMBV: In-lake Neutralization of East German Lignite Pit Lakes: Technical History and New Approaches from LMBV, 2017.
Lueker, T. J., Dickson, A. G., and Keeling, C. D.: Ocean pCO2 calculated from dissolved inorganic carbon, alkalinity, and equations for K1 and K2: validation based on laboratory measurements of CO2 in gas and seawater at equilibrium, Mar. Chem., 70, 105–119, https://doi.org/10.1016/S0304-4203(00)00022-0, 2000.
Mergelsberg, S. T., Yoreo, J. J. d., Miller, Q. R. S., Marc Michel, F., Ulrich, R. N., and Dove, P. M.: Metastable solubility and local structure of amorphous calcium carbonate (ACC), Geochim. Cosmochim. Ac., 289, 196–206, https://doi.org/10.1016/j.gca.2020.06.030, 2020.
Molnár, Z., Pekker, P., Dódony, I., and Pósfai, M.: Clay minerals affect calcium (magnesium) carbonate precipitation and aging, Earth Pl. Sc. Lett., 567, 116971, https://doi.org/10.1016/j.epsl.2021.116971, 2021.
Montserrat, F., Renforth, P., Hartmann, J., Leermakers, M., Knops, P., and Meysman, F. J.: Olivine Dissolution in Seawater: Implications for CO2 Sequestration through Enhanced Weathering in Coastal Environments, Environ. Sci. Technol., 51, 3960–3972, https://doi.org/10.1021/acs.est.6b05942, 2017.
Moras, C. A., Bach, L. T., Cyronak, T., Joannes-Boyau, R., and Schulz, K. G.: Ocean alkalinity enhancement – avoiding runaway CaCO3 precipitation during quick and hydrated lime dissolution, Biogeosciences, 19, 3537–3557, https://doi.org/10.5194/bg-19-3537-2022, 2022.
Morse, J. W. and He, S.: Influences of T, S and PCO2 on the pseudo-homogeneous precipitation of CaCO3 from seawater: implications for whiting formation, Mar. Chem., 41, 291–297, https://doi.org/10.1016/0304-4203(93)90261-L, 1993.
Morse, J. W., Gledhill, D. K., and Millero, F. J.: CaCO3 precipitation kinetics in waters from the great Bahama bank, Geochim. Cosmochim. Ac., 67, 2819–2826, https://doi.org/10.1016/s0016-7037(03)00103-0, 2003.
Morse, J. W., Arvidson, R. S., and Lüttge, A.: Calcium Carbonate Formation and Dissolution, Chem. Rev., 107, 342–381, https://doi.org/10.1021/cr050358j, 2007.
NASEM: A Research Strategy for Ocean-based Carbon Dioxide Removal and Sequestration, National Academies of Sciences, Engineering, and Medicine, Washington (DC), https://doi.org/10.17226/26278, 2022.
Orr, J. C., Epitalon, J.-M., Dickson, A. G., and Gattuso, J.-P.: Routine uncertainty propagation for the marine carbon dioxide system, Mar. Chem., 207, 84–107, https://doi.org/10.1016/j.marchem.2018.10.006, 2018.
Pierrot, D., Lewis, E., and Wallace, D. W. R.: MS Excel Program Developed for CO2 System Calculations ORNL/CDIAC-105a (Co2sys_v2.5) [code], https://doi.org/10.3334/CDIAC/otg.CO2SYS_XLS_CDIAC105a, 2006.
Rau, G. H., Carroll, S. A., Bourcier, W. L., Singleton, M. J., Smith, M. M., and Aines, R. D.: Direct electrolytic dissolution of silicate minerals for air CO2 mitigation and carbon-negative H2 production, P. Natl. Acad. Sci. USA, 110, 10095–10100, https://doi.org/10.1073/pnas.1222358110, 2013.
Renforth, P. and Henderson, G.: Assessing ocean alkalinity for carbon sequestration, Rev. Geophys., 55, 636–674, https://doi.org/10.1002/2016rg000533, 2017.
Rodriguez-Blanco, J. D., Sand, K. K., and Benning, L. G.: ACC and vaterite as intermediates in the solution-based crystallization of CaCO3, in: New Perspectives on Mineral Nucleation and Growth, Springer, Cham., 93–111, https://doi.org/10.1007/978-3-319-45669-0_5, 2017.
Sear, R. P.: Nucleation: theory and applications to protein solutions and colloidal suspensions, J. Phys. Cond. Matt., 19, 033101, https://doi.org/10.1088/0953-8984/19/3/033101, 2007.
Shayegh, S., Bosetti, V., and Tavoni, M.: Future Prospects of Direct Air Capture Technologies: Insights From an Expert Elicitation Survey, Front. Clim., 3, 630893, https://doi.org/10.3389/fclim.2021.630893, 2021.
Sun, W., Jayaraman, S., Chen, W., Persson, K. A., and Ceder, G.: Nucleation of metastable aragonite CaCO3 in seawater, P. Natl. Acad. Sci. USA, 112, 3199–3204, https://doi.org/10.1073/pnas.1423898112, 2015.
UNFCCC: Report of the Conference of the Parties to the United Nations Framework Convention on Climate Change, 21st Session, 2015, Paris, Vol. 4, report no. FCCC/CP/2015/10, 2015.
Uppström, L. R.: The boron/chlorinity ratio of deep-sea water from the Pacific Ocean, Deep-Sea Res., 21, 161–162, https://doi.org/10.1016/0011-7471(74)90074-6, 1974.
Waldbusser, G. G., Hales, B., Langdon, C. J., Haley, B. A., Schrader, P., Brunner, E. L., Gray, M. W., Miller, C. A., and Gimenez, I.: Saturation-state sensitivity of marine bivalve larvae to ocean acidification, Nat. Clim. Change, 5, 273–280, https://doi.org/10.1038/nclimate2479, 2014.
Wolf-Gladrow, D. and Riebesell, U.: Diffusion and reactions in the vicinity of plankton: a refined model for inorganic carbon transport, Mar. Chem., 59, 17–34, https://doi.org/10.1016/S0304-4203(97)00069-8, 1997.
Wu, Y., Xie, H., Liu, T., Wang, Y., Wang, F., Gao, X., and Liang, B.: Soda Ash Production with Low Energy Consumption Using Proton Cycled Membrane Electrolysis, Ind. Eng. Chem. Res., 58, 3450–3458, https://doi.org/10.1021/acs.iecr.8b05371, 2019.
Wurgaft, E., Wang, Z. A., Churchill, J. H., Dellapenna, T., Song, S., Du, J., Ringham, M. C., Rivlin, T., and Lazar, B.: Particle Triggered Reactions as an Important Mechanism of Alkalinity and Inorganic Carbon Removal in River Plumes, Geophys. Res. Lett., 48, e2021GL093178, https://doi.org/10.1029/2021gl093178, 2021.