the Creative Commons Attribution 4.0 License.
the Creative Commons Attribution 4.0 License.
 | 15 Mar 2024
Data-based investigation of the effects of canopy structure and shadows on chlorophyll fluorescence in a deciduous oak forest
Hamadou Balde
Gabriel Hmimina
Yves Goulas
Gwendal Latouche
Abderrahmane Ounis
Kamel Soudani
Data from satellite, aircraft, drone, and ground-based measurements have already shown that canopy-scale sun-induced chlorophyll fluorescence (SIF) is tightly related to photosynthesis, which is linked to vegetation carbon assimilation. However, our ability to effectively use those findings are hindered by confounding factors, including canopy structure, fluctuations in solar radiation, and sun–canopy geometry that highly affect the SIF signal. Thus, disentangling these factors has become paramount in order to use SIF for monitoring vegetation functioning at the canopy scale and beyond. Active chlorophyll fluorescence measurements (FyieldLIF), which directly measures the apparent fluorescence yield, have been widely used to detect physiological variation of the vegetation at the leaf scale. Recently, the measurement of FyieldLIF has become feasible at the canopy scale, opening up new opportunities to decouple structural, biophysical, and physiological components of SIF at the canopy scale. In this study, based on top-of-canopy measurements above a mature deciduous forest, reflectance (R), SIF, SIF normalized by incoming photosynthetically active radiation (SIFy), FyieldLIF, and the ratio between SIFy and FyieldLIF (named Φk) were used to investigate the effects of canopy structure and shadows on the diurnal and seasonal dynamics of SIF. Further, random forest (RF) models were also used to not only predict FyieldLIF and Φk, but also provide an interpretation framework by considering additional variables, including the R in the blue, red, green, red-edge, and near-infrared bands; SIF; SIFy; and solar zenith angle (SZA) and solar azimuth angle (SAA). Results revealed that the SIF signal is highly affected by the canopy structure and sun–canopy geometry effects compared to FyieldLIF. This was evidenced by the weak correlations obtained between SIFy and FyieldLIF at the diurnal timescale. Furthermore, the daily mean captured the seasonal dynamics of daily mean and explained 58 % of its variability. The findings also revealed that reflectance in the near-infrared (R-NIR) and the NIRv (the product of R-NIR and normalized difference vegetation index (NDVI)) are good proxies of Φk at the diurnal timescale, while their correlations with Φk decrease at the seasonal timescale. With FyieldLIF and Φk as outputs and the abovementioned variables as predictors, this study also showed that the RF models can explain between 86 % and 90 % of FyieldLIF, as well as 60 % and 70 % of Φk variations under clear-sky conditions. In addition, the predictor importance estimates for FyieldLIF RF models revealed that R at 410, 665, 740, and 830 nm; SIF; SIFy; SZA; and SAA emerged as the most useful and influential factors for predicting FyieldLIF, while R at 410, 665, 705, and 740 nm; SZA; and SAA are crucial for predicting Φk. This study highlighted the complexity of interpreting diurnal and seasonal dynamics of SIF in forest canopies. These dynamics are highly dependent on the complex interactions between the structure of the canopy, the vegetation biochemical properties, the illumination angles (SZA and SAA), and the light conditions (ratio of diffuse to direct solar radiation). However, such measurements are necessary to better separate the variability in SIF attributable to radiation and measurement conditions from the subtler variability attributable to plant physiological processes.
- Article
(4041 KB) - Full-text XML
-
Supplement
(1828 KB) - BibTeX
- EndNote


Spatial and temporal information on vegetation status is crucial to gain a better understanding of vegetation functioning and productivity. Remotely sensed data mostly from satellite and airborne platforms have provided such information for decades now (Ustin and Middleton, 2021). However, most of the remote sensing methods used for detecting and monitoring the dynamics of vegetation properties were exclusively based on vegetation greenness derived from optical vegetation indices (VIs), such as the normalized difference vegetation index (NDVI), and more recently the near-infrared reflectance of vegetation index (NIRv), which have been broadly and successfully used to estimate some biophysical and biochemical attributes, including leaf area index (LAI), fraction of absorbed photosynthetically active radiation (fAPAR), and leaf chlorophyll content (Campbell et al., 2019; Zeng et al., 2022b).
Sun-induced chlorophyll fluorescence (SIF) is a direct indicator of the vegetation photosynthetic activity that responds to abiotic stresses, such as heat waves and droughts, earlier than VIs (Frankenberg et al., 2011; Guanter et al., 2014; Rascher et al., 2015; Jonard et al., 2020). Further, SIF is not directly impacted by soil background as green vegetation is the only source of chlorophyll fluorescence in the red and far-red. The potential carried by SIF is currently used for estimating and monitoring terrestrial gross primary productivity (GPP) across different vegetation types, including crops, deciduous forests, evergreen forests, tropical forests, wetlands, etc. (Li and Xiao, 2022; Verma et al., 2017; Wood et al., 2017; Balde et al., 2023), for assessing vegetation structural changes and estimating crop productivity (He et al., 2020; Liu et al., 2022).
However, because of the coarse spatial scale of the satellite products used in these abovementioned studies, the results are inconclusive, and it is still questioned whether SIF can provide reliable estimates of GPP at different spatial scales and temporal resolutions across different vegetation types and more particularly under various abiotic stress conditions (Paul-Limoges et al., 2018; Yazbeck et al., 2021; Lin et al., 2022; Balde et al., 2023; Sun et al., 2023b). Further, satellite SIF signals are also subject to the effects of the interactions between the roughness of upper canopy layers (tree forms, gaps) and the solar zenith (SZA) and solar azimuth angle (SAA). These interactions modulate the spatial and temporal distributions of sunlit and shaded leaves; the light distribution within the canopy; and the main physiological processes, such as photosynthesis, evapotranspiration, and stomatal conductance (Gao et al., 2022; Morozumi et al., 2023).
The recent increased availability of diurnal and seasonal time series of SIF data from airborne, drone, and ground-based measurements was crucial for gaining a better understanding of what drives SIF at various spatial and temporal scales and across biomes (Damm et al., 2015; Rascher et al., 2015; Yang et al., 2017; Goulas et al., 2017; Wang et al., 2021; Zhang et al., 2021; Wang et al., 2022; Xu et al., 2021; De Cannière et al., 2022). However, interpretation of locally measured SIF data should be cautiously carried out. In fact, rapid variations in fluorescence may be due to local effects linked to the conditions of illumination and to the light absorption by the canopy. These effects may lead to significant variations in SIF without substantial variations in photosynthesis of the entire canopy. Therefore, distinguishing the effects of endogenous factors related to canopy structure from the effects of photosynthesis changes in the SIF signal is warranted.
At the top of the canopy, the radiative transfer of SIF can be assumed with Eq. (1):
where PAR is the incoming photosynthetically active radiation (400–700 nm), which is the first driver of the canopy SIF signal (Miao et al., 2020). fAPAR is the fraction of absorbed PAR by the vegetation, and fesc is the fraction of all chlorophyll fluorescence photons emitted from all leaves and escaped from the canopy, also known as the fluorescence escape probability fraction, which is dependent on the biophysical and biochemical properties of the canopy and on the sun and view geometry. ΦF is the chlorophyll fluorescence quantum yield (the ratio of the total amount of photons emitted to the total amount of photons absorbed by the chlorophyll pigments); hence, it is a direct indicator of the photosynthetic efficiency. From Eq. (1), it is explicit that in order to interpret top-of-canopy SIF and use it as a proxy of ΦF and photosynthesis, it is necessary to understand and disentangle ΦF from the SIF canopy-structure-dependent variations (due to the spatiotemporal effect's variations in sunlit and shaded leaves and to the light distribution and attenuation within the canopy) that are contained in fAPAR and fesc.
Disentangling the photosynthetically dependent variations from the canopy-dependent ones in the SIF signal is critical to use SIF as a proxy of vegetation response to changing environmental conditions and to abiotic stresses at large scales. It is especially needed for the upcoming Fluorescence Explorer (FLEX) satellite mission that aims at providing measurements of SIF at its full spectral emission (670–780 nm) and with unprecedented spatial resolution (300 m) and repeated global coverage (Drusch et al., 2017). Therefore, the top-of-canopy SIF measured together with GPP at the carbon flux sites can play a substantial role for calibrating and validating FLEX products and airborne campaign measurements.
Recent studies have developed novel approaches based on theoretical insights to correct the SIF signal for multiple scattering and reabsorption effects (Zeng et al., 2019; Yang and van der Tol, 2018; Yang et al., 2020) by determining fesc and allowing the downscaling of SIF emission from canopy to fluorescence emission yield (Lu et al., 2020). This assumes that the entire canopy acts like a big leaf, with unique absorption, fluorescence, and photosynthetic properties. In this situation, fesc is the ratio of top-of-canopy SIF to SIF total, and it is closely related to canopy structural variations, including LAI, leaf angle distribution, reabsorption, and sun–canopy geometry, and varies across time and space (Zeng et al., 2019). Recently, fesc has been estimated using NIRv or the fluorescence correction vegetation index (FCVI). The former considers soil background effects and is the product of NDVI and the reflectance in the near-infrared (NIR) (Badgley et al., 2017), and it has successfully been used to assess photosynthesis productivity (Mengistu et al., 2021). The latter, FCVI, is framed as the difference between the NIR and the broadband visible reflectance (400–700 nm), considering that the reflectance is measured in the same direction as the SIF observations (Yang et al., 2020). Both approaches have shortcomings, as they cannot be universally applied, because some steps in the estimation of fesc using NIRv are inconsistent with the radiative transfer theory (Yang et al., 2020), and their effectiveness might be greatly compromised for SIF at the red band where the scattering is much weaker than in the near-infrared. The use of FCVI is also limited as it is not suitable in sparse vegetation canopies, and its computation requires hyperspectral data in the visible spectral range.
If one would like to disentangle the radiation and vegetation-structure-dependent SIF variations from the physiological information in the SIF signal, determining ΦF would be required. ΦF can be defined at the leaf scale or even at lower scales (chloroplasts) where the absorbed light energy is dissipated following three pathways: photosynthesis, fluorescence, and heat dissipation. Estimating leaf-scale ΦF from canopy SIF measurements is an ongoing work that is under exploration. In addition, the computation of total absorbed photosynthetically active radiation (APAR) requires measurements of the incident, transmitted, and reflected PAR, which cannot be measured at satellite or airborne platforms, and are not always available for all ground sites, even those belonging to major carbon flux observation networks, such as the Integrated Carbon Observation System (ICOS). This is the reason why for decades the apparent ΦF was estimated by normalizing the top-of-canopy SIF signal converted in quanta energy by the incident PAR (Daumard et al., 2012; Goulas et al., 2017). Recently, two promising approaches have been used by Zeng et al. (2022a) and Loayza et al. (2023) to estimate ΦF. To determine ΦF over cropped fields, including, rapeseed, barley, corn, wheat, and sugar beet, Zeng et al. (2022a) normalized canopy SIF by the near-infrared radiance of vegetation index (rNIRv, the product of NDVI and the reflected vegetation radiance in the near-infrared), while Loayza et al. (2023) used the integrated vegetation reflected radiance between 500 and 700 nm on a potato crop. These approaches have advantages, because the effects of canopy structure and sun–canopy geometry on ΦF estimates may be fully canceled out, the PAR is not needed as an input, and their applicability at the satellite scale is highly feasible. However, how much these methods are reliable and effective at estimating ΦF under varying environmental conditions and across diverse spatiotemporal scales and vegetation types is not well explored yet.
Luckily, chlorophyll fluorescence can be measured using active methods that allow direct evaluation of the physiological status of the vegetation at the leaf and canopy scales (Porcar-Castell et al., 2014; Moya et al., 2019; Loayza et al., 2023). In active techniques, a modulated source of light is used to excite the chlorophyll that fluoresces in the spectral range between 650 and 800 nm. For instance, the pulse-amplitude modulation techniques, which use a measuring pulsed light and an actinic continuous light, have been widely used at the leaf scale to provide direct chlorophyll fluorescence yield measurements, allowing for the evaluation of photosynthesis and vegetation responses to abiotic factors for decades (Baker, 2008; Magney et al., 2017). But its applicability at canopy and ecosystem scales was hindered by the technique's limitations (Ounis et al., 2001). In the last decades, this gap was filled based on the use of either lasers (or laser diodes) or light emitting diodes (LED), providing short pulses of light (microsecond to even picosecond), together with a synchronized detection to measure chlorophyll fluorescence under daylight conditions at the canopy scale with in situ or airborne remote sensing instruments (Moya et al., 2019; Ounis et al., 2016; Loayza et al., 2023). Therefore, the fluorescence efficiency can be directly observed at the canopy and landscape scales, which is useful to gain a better understanding of terrestrial vegetation functioning. Indeed, LED-induced chlorophyll fluorescence (FyieldLIF) is less affected by the temporal and spatial (horizontal and vertical) distribution of sunlit and shaded leaves on the upper surface and within the canopy compared to SIF, but it may be highly sensitive to environmental conditions, such as high wind speeds (Lopez Gonzalez, 2015).
In forest stands, such as temperate deciduous forests, when the vegetation green-up and senescence phases are excluded, LAI is merely constant. However, the spatial dynamics in LAI may be large from one plot to another. Thus, the canopy structural effect correction on the SIF signal is all the more crucial from a spatial viewpoint. Further, the SIF signal is subject to diurnal variations due to the complex interactions between lighting conditions (diffuse/total radiation, solar, and viewing angles) and canopy structure (Aasen et al., 2019; Xu et al., 2021). Therefore, correcting SIF from these effects, which are very local, is warranted for (i) interpreting and upscaling the SIF signal spatially and temporally across diverse vegetation types, (ii) disentangling the physiological response from variations due to exogenous effects on SIF, (iii) assessing how SIF responds to extreme environmental conditions (heat waves, drought, etc.), and ultimately (iv) gaining a better understanding of the relationships between SIF and GPP. Nevertheless, to the best of our knowledge, an attempt to use active fluorescence measurements at the canopy scale to correct SIF from canopy structure, incident sunlight, and sun–canopy geometry effects has not been addressed yet.
The main objective of this work is to use active chlorophyll fluorescence (FyieldLIF) as a reference measurement and to compare it to SIF yield (SIFy= SIF/PAR) in order to analyze and correct for the effects of canopy structure and sun–canopy geometry on top-of-canopy SIF at diurnal and seasonal timescales in a temperate deciduous forest, considering diverse environmental conditions. More specifically, this study intends to (i) evaluate the relationship between FyieldLIF and SIFy as well as evidence the effects of canopy structure and sun–canopy geometry on top-of-canopy SIF through their influence over this relationship and (ii) examine these effects with the aim of developing a correction method based on reflectance measurements and lightning conditions (solar angles, ratio of diffuse to total radiation, etc.).
2.1 Study site description
This study was conducted at the Fontainebleau-Barbeau forest site (FR-Fon), which is an eddy covariance (EC) flux observation site belonging to the ICOS network (Delpierre et al., 2016). The site is located 53 km southeast of Paris, France. It is occupied by a temperate deciduous broadleaf forest type. The dominant forest overstory consisted of mature sessile oak trees (Quercus petraea (Matt.) Liebl.), accounting for 79 % of the basal area (Maysonnave et al., 2022), with an understory of hornbeam (Carpinus betulus L.) (for more details, see http://www.barbeau.universite-paris-saclay.fr/, last access: 10 October 2023). The stand height is around 25 m. The soil is an Endostagnic Luvisol, covered by an oligomull humus (Maysonnave et al., 2022). The climate is temperate and characterized by an annual average rainfall of approximately 680 mm and an average air temperature of approximately 11 °C (Soudani et al., 2014). The LAI is approximately 5.8 m2 m−2 using the litter collection method over the 2012–2018 period (Soudani et al., 2021). At the Fontainebleau-Barbeau site, carbon and water fluxes have been continuously monitored at 35 m height using the EC method. The main micrometeorological variables, including incident and reflected radiations, are measured at high frequency (1 min), while vapor pressure deficit, precipitation, air and soil temperature, water table depth, soil moisture, and wind speed are either recorded or estimated at a half-hourly timescale.
2.2 Sun-induced and light-emitting-diode-induced chlorophyll fluorescence and reflectance measurements of the canopy
2.2.1 Sun-induced chlorophyll fluorescence measurement system
In the framework of the ECOFLUO1 project, a passive in situ spectral measurement automated instrument (named SIF3) was developed based on a collaboration between the Laboratoire de Météorologie Dynamique (LMD), École Polytechnique, France, and Laboratoire Écologie, Systématique et Évolution (ESE), Université Paris-Saclay, France. SIF3 acquires continuous measurements of incident and reflected radiation above the canopy. It was installed at the top of the 35 m high tower of the Fontainebleau-Barbeau site above the canopy in July 2021 (Supplement Fig. S1). To avoid artificial shading of the measured area, SIF3 was set to the southern part of the tower.
The SIF3 measurement system includes a control computer (LattePanda V1, LattePanda Shanghai, China, and two Arduino microcontrollers), two spectrometers with coolers, shutter controllers, a general cooler with temperature controller inside the box, two optical fibers, a reference panel, a servo motor, a PAR sensor, a GPS device, temperature and relative humidity sensors, and a camera. The two spectrometers are a high-resolution spectrometer (ASEQ instruments, Vancouver, Canada, HR1-T model, with thermoelectric cooling) and a broadband spectrometer (ASEQ, LR1-T model, with thermoelectric cooling). The high-resolution spectrometer (HR1-T) has a spectral range between 650 and 800 nm, a high spectral resolution with full width at half maximum (FWHM) of approximately 0.3 nm. The HR1-T was used to determine sun-induced chlorophyll fluorescence. The broadband spectrometer (LR1-T) has a spectral range between 400 and 1000 nm and a FWHM of approximately 1.5 nm. It was used to measure canopy reflectance and the optical vegetation indices (VIs).
In order to reduce the noise and dark current, both spectrometers were contained within a dry and thermoregulated box system that maintained the temperature at 19 ± 0.61 °C. SIF3 performs sequential vegetation reflected radiance measurements and irradiance measurements on a polytetrafluoroethylene (PTFE) reference panel (PMR10P1, Thorlabs, Maisons-Laffitte, France). The sequential measurements of SIF3 were first to measure the reference PTFE with LR1-T and HR1-T spectrometers and second to measure vegetation-reflected radiance with both spectrometers. Within one measurement of the target canopy or the reference, each spectrometer performed the following steps: (i) optimizing the integration time (IT) for measurement, (ii) measurement, and (iii) measurement of the dark current. The date and time at the start and end of each measurement were recorded. Two 15 m long optical fibers (FT1000EMT and FT1000UMT, Thorlabs, Maisons-Laffitte, France, for HR1-T and LR1-T spectrometers, respectively) with a 1000 µm core diameter and a numerical aperture (NA) of 0.39 were used to measure the irradiance of the reference and the radiance of the canopy, at the nadir position. The field of view (FOV) of each measuring channel is adjusted to 25° with the use of a Gershun tube to ensure a flatter spatial response and covered approximately 6 m2 of the canopy area. Long-pass optical filters (5CGA-550, cut-off wavelength 550 nm, and 5CGA-375, cut-off wavelength 375 nm; Newport, Irvine, CA, USA, for the HR1-T and LR1-T channels, respectively) were placed in front of each tube to avoid second-order detection and to protect fiber ends. The dark current measurements were subtracted from the reference and canopy measurements before SIF retrieval. The IT of each spectrum was automatically optimized to achieve values that are as high as possible but unsaturated to improve as much as possible the signal-to-noise ratio (SNR). Note that SIF3 integrates a quantum sensor to measure the PAR at high frequency and a camera that allows for taking RGB images of the canopy in the FOV. Before the installation of SIF3 in the field, we performed lens alignment and radiometric and spectral calibrations of the instrument using a calibrated light source (4P-GPS-060-SF and EHLS-100-075R, Labsphere, North Sutton, NH, USA).
2.2.2 Light-emitting-diode-induced chlorophyll fluorescence measurement system
FyieldLIF measurements were acquired with an active fluorometer instrument, named LIF, developed in the LMD laboratory, which was installed at the top of the 35 m high tower next to SIF3 above the canopy. This instrument is very similar to the one described by Moya et al. (2019). It uses a blue LED array (Enfis Ltd., Swansea, UK; peak wavelength 455 nm, FWHM 21 nm, radiant power 6 W) as an excitation source. To separate the chlorophyll fluorescence emission induced by the LED from that induced by daylight and from the reflected sunlight in the filter bandwidth, the LED light is pulsed at a variable frequency with a pulse duration of about 5 µs. Note that the instrument uses a bimodal excitation conditioned by the PAR: for PAR < 90 µmol m−2 s−1 (nighttime), the frequency is set at 30 Hz, while it is set at 200 Hz (daytime) for PAR > 100 µmol m−2 s−1. This bimodal excitation scheme helps to avoid variable fluorescence induction during night and to increase SNR during daytime. The instrument optical head consisted of two main parts: (i) the source module that includes the blue LED array, its electronic driver, a heat dissipation module, and a Fresnel lens (diameter 180 mm) to collimate the excitation light and (ii) a detection module that includes a second Fresnel lens of the same diameter, a set of optical filters, a large-area PIN photodiode (10×10 mm2, S3590, Hamamatsu Photonic, Japan), and a laboratory designed amplifier that selects the LED-induced fluorescence signal (FyieldLIF) from the reflected sunlight in the same wavelength band (LNIR, reflected sunlight in the near-infrared). This amplifier uses a sample and hold circuit (AD585, Analog Devices, Wilmington, MA, USA) to deliver the peak value of the fluorescence signal to the digital–analog (AD) conversion card (USB 6212, NI, Austin, Texas, USA) and a low-pass electronic filter to deliver LNIR to the same card. The set of optical filters includes a high-pass interferential filter with a cut-off wavelength at 400 nm to reject UV light, a second high-pass interferential filter with a cut-off wavelength at 650 nm to reject the excitation light, and a 3 mm thick RG9 filter (Schott, Germany) to select the far-red fluorescence emission over 725 nm. The FOV can be controlled thanks to an onboard camera (RLC-520A, Reolink, Hong Kong). We selected a top-of-canopy area in the FOV of the SIF instrument, resulting in a 9 m measuring distance with a viewing zenith angle of 30° However, as the FOV of the instrument is about 100 mrad, the measured area was about 0.4 m2, which is much smaller than the FOV of SIF3 (approximately 6 m2). Power supplies as well as synchronization and acquisition electronics are enclosed in a separate box, connected to the optical head by a 5 m long cable. FyieldLIF and LNIR data are stored on disk with an acquisition and control program written in LabVIEW (NI, Austin, Texas, USA) that runs on a LattePanda V1 microcomputer. Other variables such as PAR and LED, photodiode and box temperatures are also continuously monitored.
2.3 Canopy–sun-induced chlorophyll fluorescence retrieval
As spectral measurements are recorded in digital counts, they were converted into radiometric units before SIF retrieval. SIF was retrieved at the far-red oxygen observation band (O2-A) from the HR1-T canopy reflectance measurements. Data quality control was performed prior to SIF retrieval following the protocol proposed by Cogliati et al. (2015) to put aside abnormal data caused by abrupt changes in incident radiation. SIF retrieval was performed using the classical three-band Fraunhofer line discrimination (3FLD) method at the O2-A band (Meroni et al., 2009; Daumard et al., 2012).
The 3FLD approach is rooted in the FLD principle, which requires measurements in two channels, one inside and one outside a Fraunhofer or absorption line (Meroni et al., 2009). The FLD hypothesis is based on the consistency of reflectance and SIF at both bands. However, studies have found evidence that the two variables are not constant (Meroni et al. 2009). The 3FLD method rather assumes that reflectance and SIF vary linearly around the absorption band considered, which solves the limitation given by the FLD hypothesis and uses three spectral bands per absorption line to retrieve SIF (Zhang et al., 2021). The 3FLD SIF retrieval at 760 nm (O2-A band) can be derived as follows:
where L is the upwelling radiance. E is the downwelling irradiance measured on the reference panel. Indices “l”, “r”, and “in” represent the reference bands at the left, right, and inside the absorption band, respectively. wl and wr denote the weighting factors depending on the wavelength, λ, on the left, inside, and right of the absorption band. Within this study, the left, inside, and right bands were set at 757.86, 760.51, and 770.46 nm, respectively.
2.4 Theoretical derivations of Φk, vegetation indices, and SIF yield
NIRv has been used to isolate vegetation signal properties from soil background and to correct canopy-scale far-red SIF for scattering effects (Badgley et al., 2017). NIRv can be computed according to Badgley et al. (2017) and Zeng et al. (2019) using the following Eq. (4):
where R represents the spectral reflectance, and the index number denotes the wavelength range or wavelength at which the reflectance was measured. In Eq. (4), NIRv is largely dependent on the LAI, the leaf angle distribution, and the geometry of the sun–canopy, as well as on the influence of fluctuations in incident radiation at the diurnal and seasonal timescales. R-NIR was calculated at the 850 nm central wavelength.
FyieldLIF is an active measurement and is not directly dependent on the ambient light conditions. Thus, it is not impacted by ambient radiation changes, because the measured LED-induced chlorophyll fluorescence is directly and only emitted by the leaves targeted by the LED. Variations in FyieldLIF are then presumably only induced by changes in the photosynthetic pigment concentrations, in the leaf area inside the FOV, and in the vegetation functioning that modulates the chlorophyll fluorescence quantum yield. As no significant phenological changes occurred during the study period, we assumed that FyieldLIF is free from the vegetation structure and sun–canopy geometry effects and can be used as a reference measurement in this respect. The blue LED light can be considered as constant and, therefore, from Eq. (1) we can assume that ΦF is equal to FyieldLIF and then Eq. (1) becomes
From Eq. (6), we defined Φk as following:
Note that this is a simplification of the complex relation that does exist between SIFy and FyieldLIF, as SIF yield and FyieldLIF respond differently to canopy structure effects. At the diurnal timescale, Φk is subject to variations in leaf angle distribution, incident sunlight, or atmosphere conditions (clear or cloudy sky conditions), as well as to the effects of sun–canopy geometry (including SZA and SAA).
In remote sensing, the total amount of light absorbed by the canopy cannot be directly measured. This quantity is highly dependent on the solar angle and canopy structure (distribution of light and shaded areas at the top and inside the canopy). Hence, by normalizing the canopy-emitted SIF by the incident PAR, it is possible, as a first approximation and empirically, to partially disentangle the SIF signal from its dependence to incident radiation and thus to detect some changes in the vegetation properties or the plant physiological responses to abiotic factors. Therefore, the SIFy was calculated using the PAR measured at the top of the EC tower site. Note that the SIF fluxes were converted into quanta units following Daumard et al. (2012) prior to SIFy calculation.
2.5 Data analysis
In this study, we used data measurements from June to August 2022. As radiation-limited photosynthesis is expected in the early morning and late afternoon, due to lower incoming irradiance, only the data recorded between 09:00 and 16:00 UTC were considered in this study. The negative SIF values, the SIFy values higher than mean ± 3 standard deviation, and the PAR data less than 200 µmol m−2 s−1 were excluded in the analysis. First, we applied a linear model to analyze at the daily and seasonal timescales the strength of the relationships: (i) between SIFy and FyieldLIF and (ii) between NIRv and Φk. Note that daily means of SIFy, FyieldLIF, NIRv, and Φk are hereafter noted , , , and . The coefficient of determination (R2) and the p value are used to assess the strength of the correlations. These relations are examined at instantaneous (seconds to minutes) and daily (averaged data from 09:00 to 16:00 UTC) timescales. Second, we used random forest (RF) models as a tool to understand FyieldLIF and Φk dynamics by comparing their predictions based on a combination of remote sensing metrics. We chose RF models because they are non-parametric models and are well adapted for predicting nonlinear and multi-parameter relationships in complex situations and foremostly highly interpretable by using metrics, such as the importance of predictor variables and partial dependence (Breiman, 2001). Several types of RF models were designed for estimating FyieldLIF and Φk. The expression of each model and its purpose are given in Table 1. We used the clear-sky condition (the fraction of diffuse PAR over total PAR < 0.3) data to train the models. It is worth noting that for FyieldLIF predictions using all data (clear sky and cloudy conditions) or clear-sky condition data alone yielded the same results (data not shown), while for Φk, which was defined to represent the effects of canopy structure and sun–canopy geometry, only clear-sky conditions were used with respect to satellite conditions of data acquisition. To avoid the impact of correlations of predictors on the RF models' predictions, the correlations matrix between predictors was computed (Supplement Fig. S2 and S3), and then the least correlated predictors were selected to train our models. All RF models were established using 200 trees and sampled with replacement based on bag fraction of 80 % (80 % of the data for training and 20 % for testing). The out-of-bag (OOB) predictor importance estimates were determined to evaluate the contribution of each predictor. Model performance was evaluated using the OOB coefficient of determination (OOB R2) score and the adjusted coefficient of determination (adj. R2) of the correlations between the test dataset and the predictions, as well as the root mean squared error (RMSE). The closest the OOB R2 and adj. R2 are, the better the model is able to be generalized. All RF models were run using instantaneous measurements. For SIF and reflectance data extraction, MATLAB R2021a (MathWorks, Inc., USA) was used, and Python version 3.9.1 was used for data analysis and visualization (Scikit-learn, SciPy, Seaborn, Matplotlib, Pandas, and Numpy libraries).
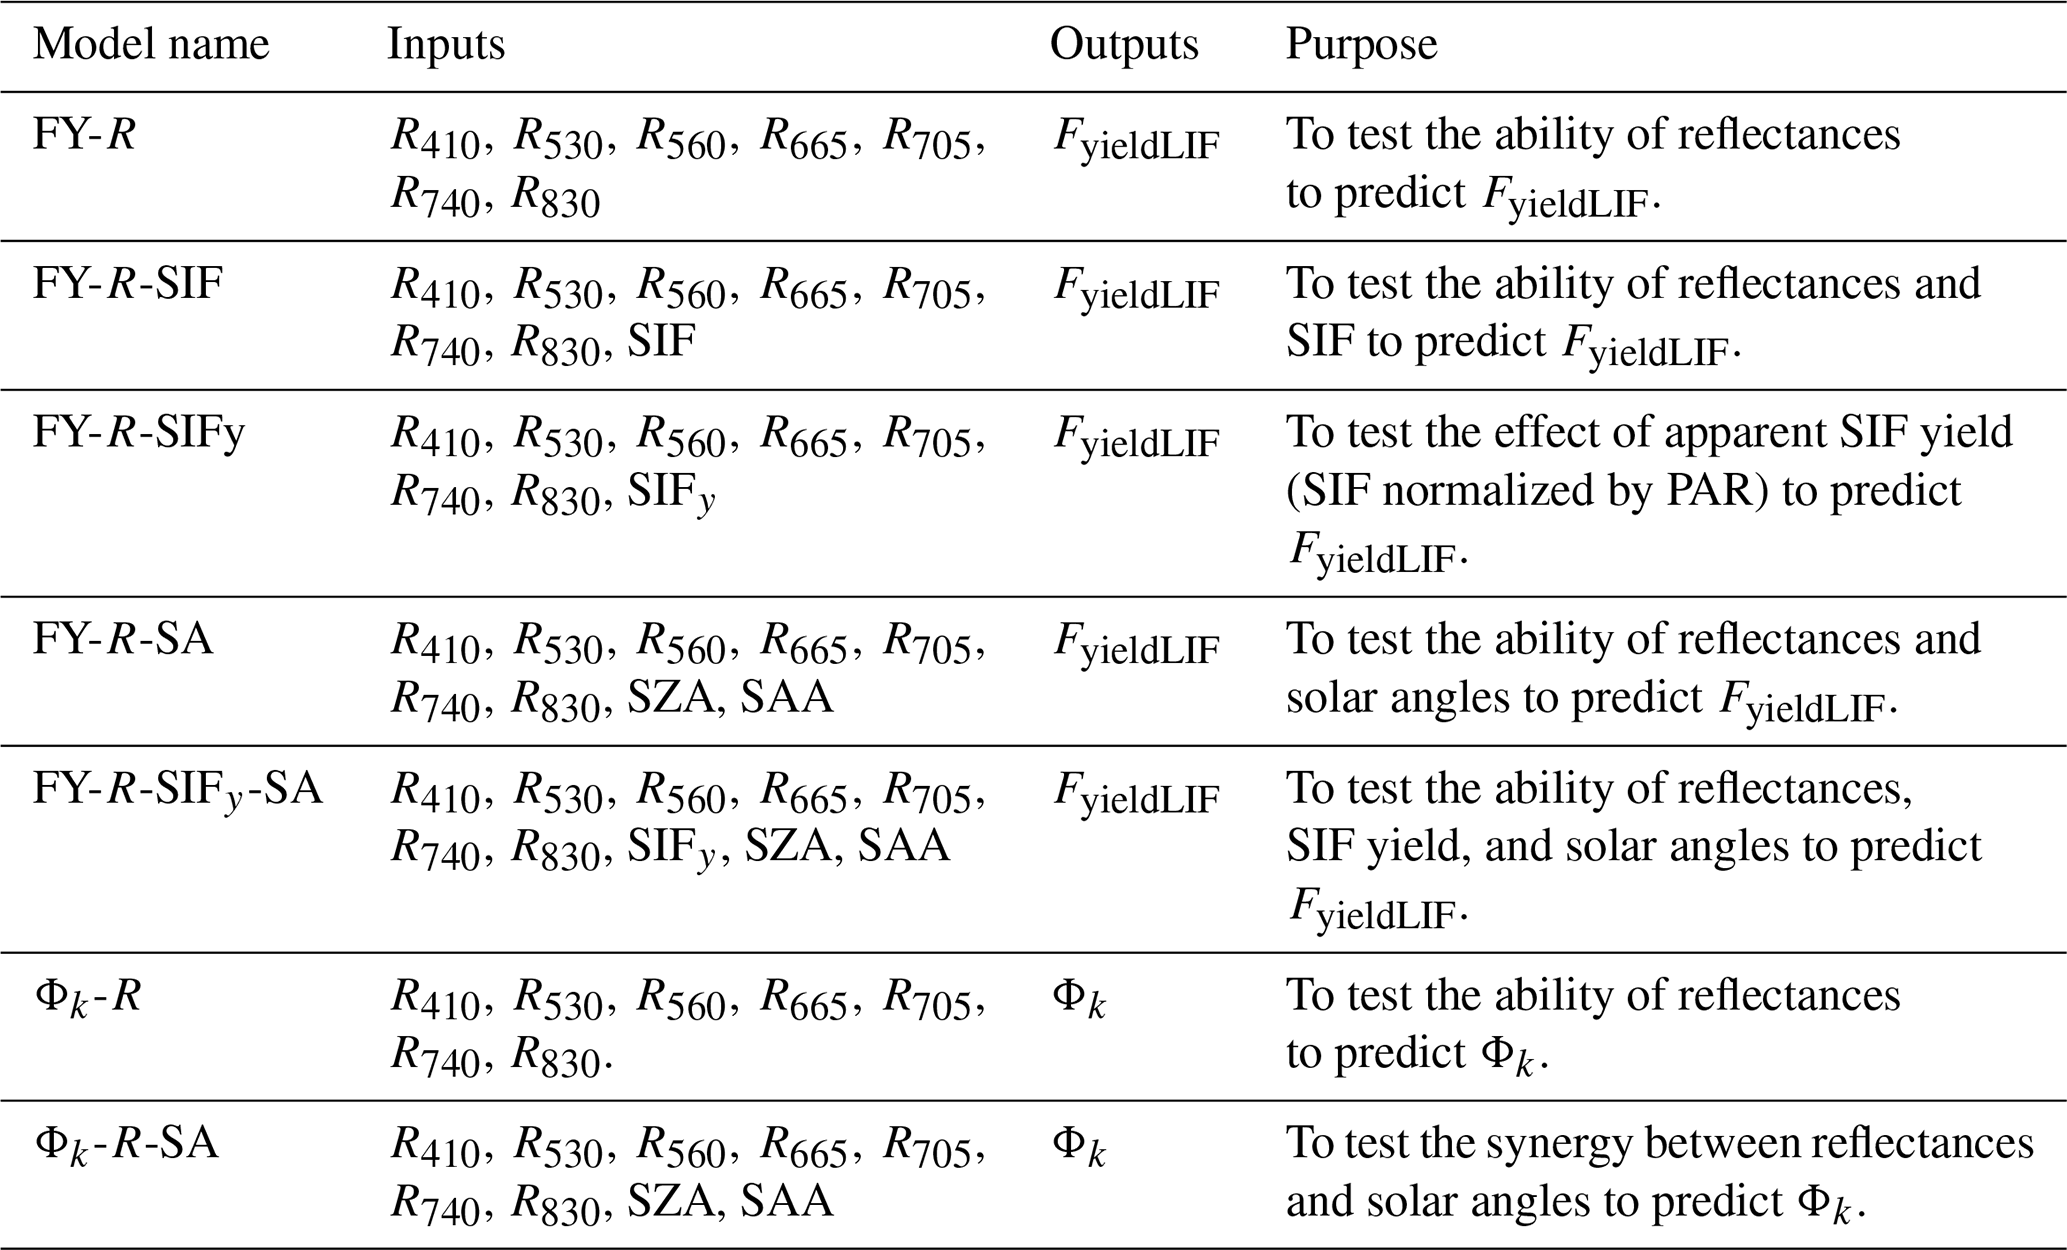
Table 1Random forest models for FyieldLIF and Φk predictions. R denotes spectral reflectance in blue (410 nm), red (530 nm and 560 nm), green (665 nm), red-edge (705 and 740 nm), and near-infrared (830 nm). SIF is the far-red sun-induced chlorophyll fluorescence at 760 nm, SIFy is the ratio of SIF over PAR, SA stands for solar angles, including solar zenith (SZA) and azimuth (SAA) angles. FyieldLIF is the LED-induced chlorophyll fluorescence, and Φk is the ratio between SIFy and FyieldLIF.
3.1 Relationships between canopy SIFy and FyieldLIF and their seasonal variations
The results, in Fig. 1a, show that the coefficients of determination of the relationships between SIFy and FyieldLIF were low and varied highly across the season, and that the ratio between diffuse PAR and total PAR cannot entirely explain this inter-daily variability. This indicates that at the diurnal scale SIFy was weakly correlated to FyieldLIF. Note that relations between SIFy and FyieldLIF analyzed at hourly timescale (hourly averages) relatively improved their correlation (Supplement Fig. S4). At the seasonal scale (daily averages), in Fig. 1b and c, the results show that the R2 between SIFy and FyieldLIF was 0.58, indicating that SIFy and FyieldLIF were better correlated at the seasonal timescale. The fraction of diffuse to total PAR cannot explain this correlation, and their agreements tend to diverge at some period of the season. Additionally, note that, overall, the magnitude of both variables has considerably decreased from the start to the end of the given period.
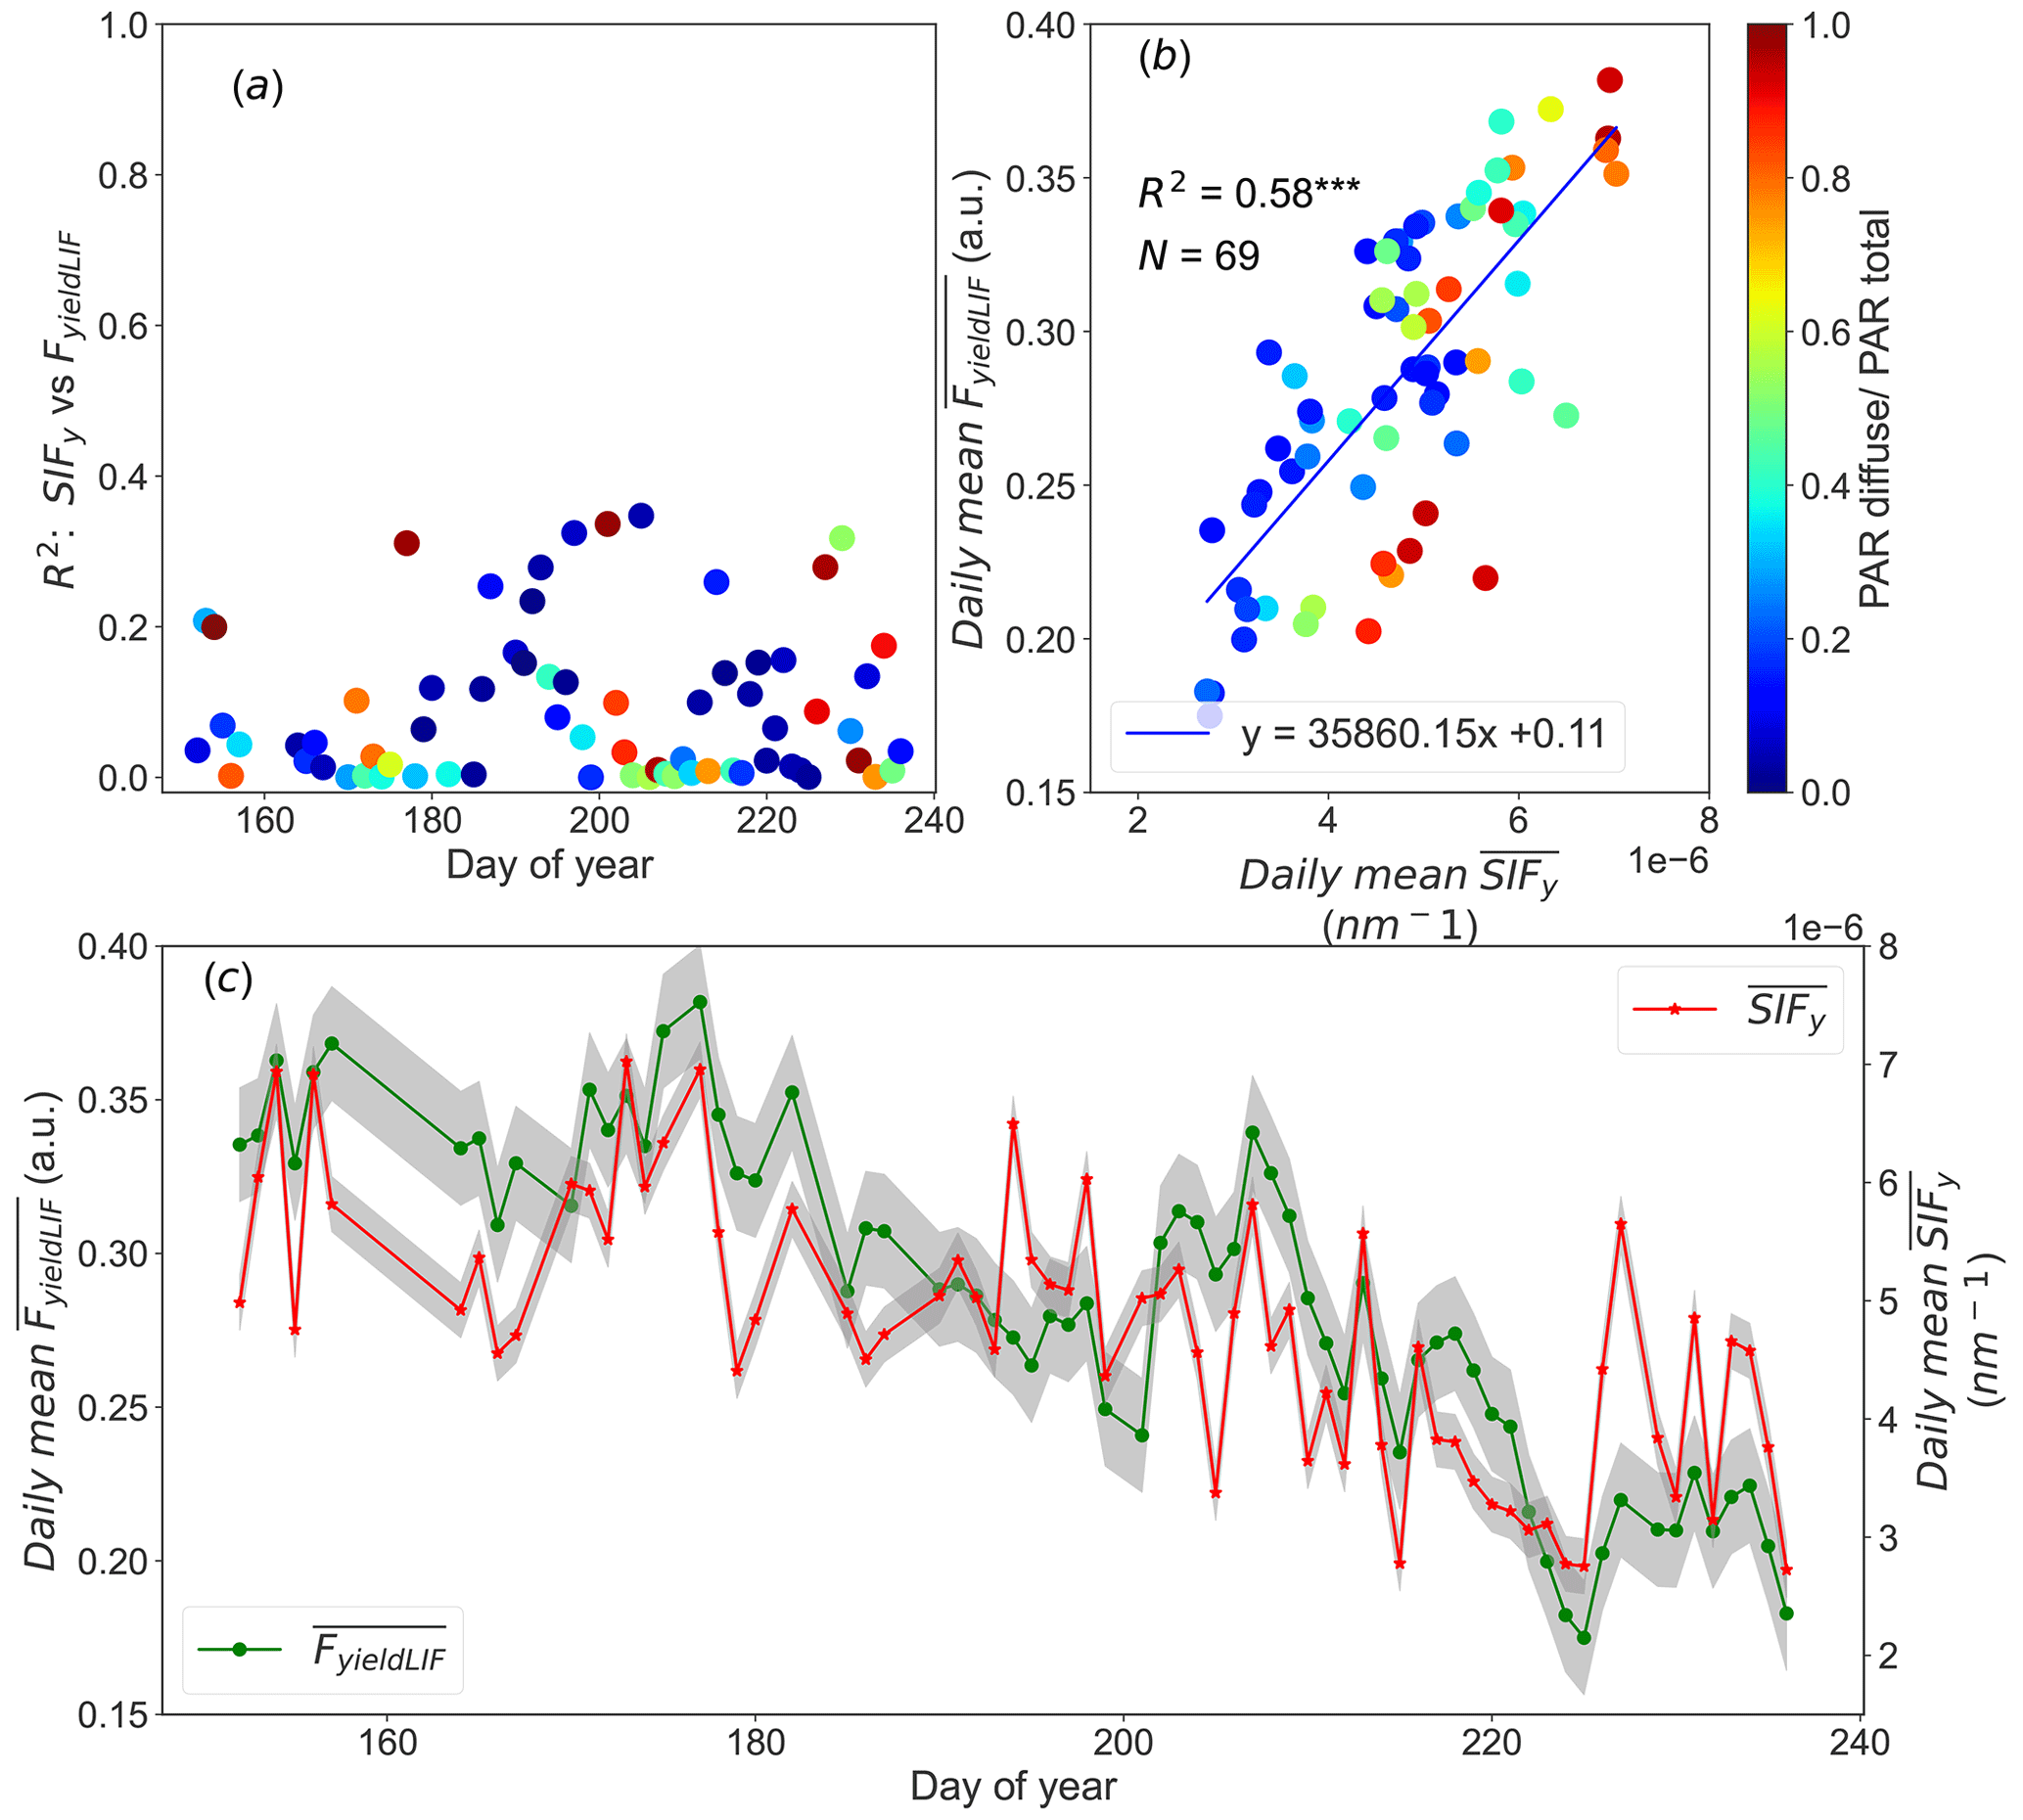
Figure 1Panel (a) shows the inter-daily variations in the coefficient of determination (R2) of the relationship between SIFy and FyieldLIF and panel (b) shows the relationship between daily mean and . In panels (a) and (b), the color of the points shows the fraction of diffuse to total PAR with the color scale on the left of panel (b). Panel (c) depicts seasonal dynamics of and . The shading around the lines indicates the 95 % confidence interval. The asterisks stand for the statistical significance level ( = P≤0.001).
3.2 Diurnal variations in PAR, NIRv, R-NIR, Φk, SIF, SIFy, and FyieldLIF
Figure 2 shows the diurnal cycles (from 09:00 to 16:00 UTC) of PAR, NIRv, R-NIR, Φk, SIF, SIFy, and FyieldLIF.
It shows three sunny and steady weather days, and so the PAR constantly increased in the morning to a maximum around noon and decreased in the afternoon for all days. Its values were between 1000 and almost 2000 µmol m−2 s−1.
The diurnal variations in NIRv and R-NIR exhibited similar patterns, with the lowest values recorded at noon. The depression observed in NIRv and R-NIR patterns from 10:00 to around 12:00 UTC is attributed to shadows observed within the FOV of the SIF3 instrument as has been shown by the sunlit leaves fraction determined from RGB images (Supplement Figs. S5 and S6).
Φk surged in the early morning hours (not shown) and then declined from 10:00 up to around 12:00 UTC; afterwards, it increased in the afternoon for all days. The depression observed in Φk between 10:00 and 12:00 UTC is simultaneous to the decline in NIRv and in R-NIR. This implies that diurnal dynamics in Φk may be due to the intra-daily pattern in the distribution of sunlit and shaded leaf fraction caused by the geometric relationships between canopy structure and the sun's geometry.
It is well known that diurnal SIF cycles are tightly linked with dynamics in PAR. Conversely, in Fig. 2 SIF exhibited different diurnal dynamics for all days than the incident PAR ones. The pattern in SIF declined from 10:00 to around 12:00 UTC and was afterwards dominated by dynamics in PAR. It can also be observed that the magnitude of SIF markedly decreased from 10 July to 6 August, being from 2.06 to 1.33 mW m−2 sr−1 nm−1 (approximately 35 % relative decrease in SIF emission).
The diurnal variations in SIFy surged in the early morning (not shown) and then decreased from 10:00 UTC to noon, and afterwards it increased in the afternoon for the three considered days. Similarly to SIF, the magnitude of SIFy also shows an overall decrease from 10 July to 6 August. In contrast, the diurnal pattern in FyieldLIF shows a continuous and significant decrease during the day, with a 10 % loss. Note that the range of FyieldLIF have also decreased over the given period. FyieldLIF appears insensitive to the canopy structure and sun–canopy geometry changes, compared to the dynamics in SIF and SIFy, which showed a significant decline in the morning. Besides, it is worth noting that FyieldLIF measurements are continuously recorded (day and night); the full diurnal cycles are presented in Supplement Fig. S7.
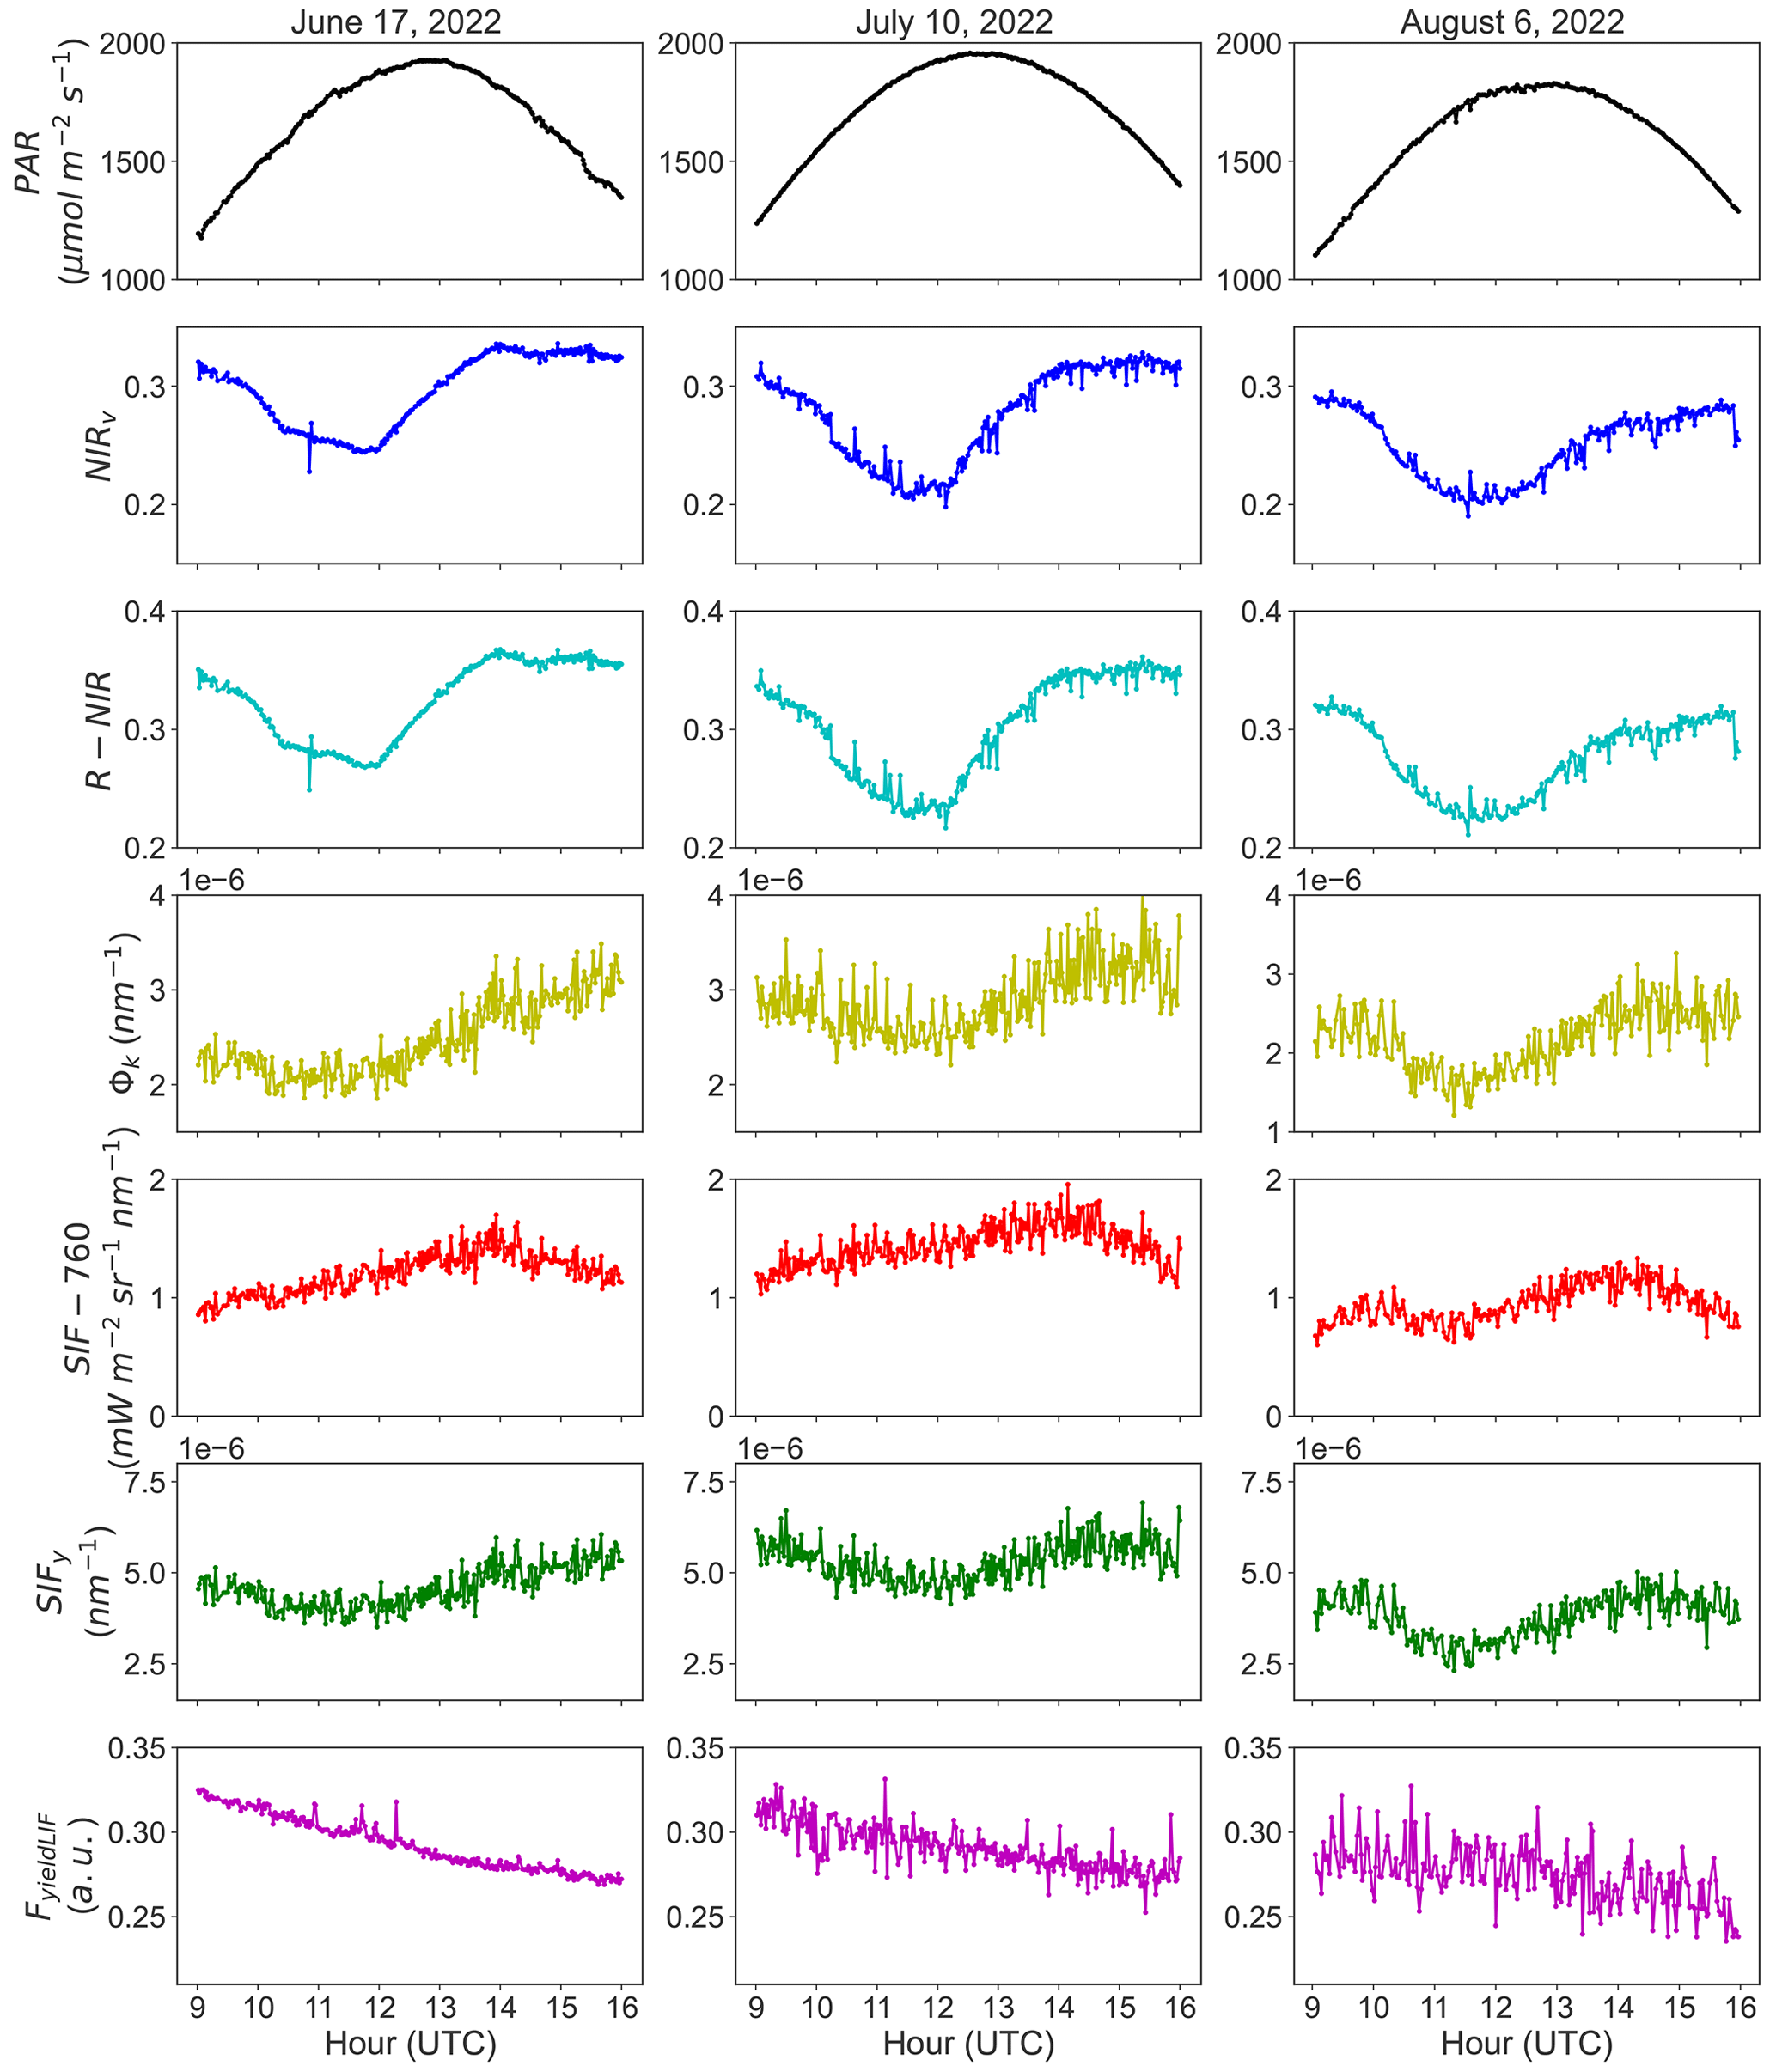
Figure 2Presents the diurnal patterns acquired during three clear sky days of the diurnal pattern of the photosynthetically active radiation (PAR, in black), the near-infrared reflectance of vegetation index (NIRv, in blue), the reflectance in the near-infrared (R-NIR, in cyan), the ratio between SIFy and FyieldLIF (Φk, in yellow), the SIF (SIF-760, in red), the ratio of SIF over PAR (SIFy, in green), and the active chlorophyll fluorescence (FyieldLIF, in magenta). The data correspond to 17 June, 10 July, and 6 August 2022. The noisy signals observed on 10 July and 6 August 2022 are due to high wind speed with an average value of 2.39 and 3.27 m s−1, respectively.
3.3 Relationship between Φk and NIRv as well as its seasonal variations
Figure 3a shows the R2 of the relationship between NIRv and Φk at instantaneous scale (acquisition time step) as a function of the fraction between diffuse and total PAR, while Fig. 3b depicts the relationships between Φk and NIRv at seasonal scale, and Fig. 3c underlines their seasonal dynamics.
Conversely to the weak correlation found between SIFy and FyieldLIF seen in Fig. 1a, the results in Fig. 3a show that there are relatively moderate and substantially good relationships between NIRv and Φk over the season. Thus, for most of the clear-sky condition (ratio diffuse PAR to total PAR < 0.3), NIRv may explain more than 50 % of the instantaneous variations in Φk at the diurnal scale, but the strength of the relationship between these two variables under clear skies remains variable. The lowest values of R2 are mostly related to diffuse sky conditions.
The results in Fig. 3b show a weak but statistically significant relationship between the daily mean and with an R2 of 0.16 at the seasonal scale. This indicates that is a weak proxy of at the seasonal scale. Furthermore, we can also infer that the fraction of diffuse to total PAR explains this correlation, as lower correlation values of and are closely related to clear-sky conditions and high correlation values to diffuse sky conditions. In addition, the seasonal dynamics in and (Fig. 3c) exhibited a good match for some days at the seasonal scale. The magnitude of and also varied significantly over the season, which can be caused by rapid changes in ambient environmental conditions and in leaf and canopy biochemical and structural properties. Note that an independent analysis, identical to the one presented here on the relationship between NIRv and Φk, was realized on the relationships between R-NIR and Φk. The results shown in Supplement Fig. S8 suggest that the R-NIR reflectance alone can also be a good proxy of Φk at the diurnal timescale. This is paramount for implementing this approach at the satellite scale.
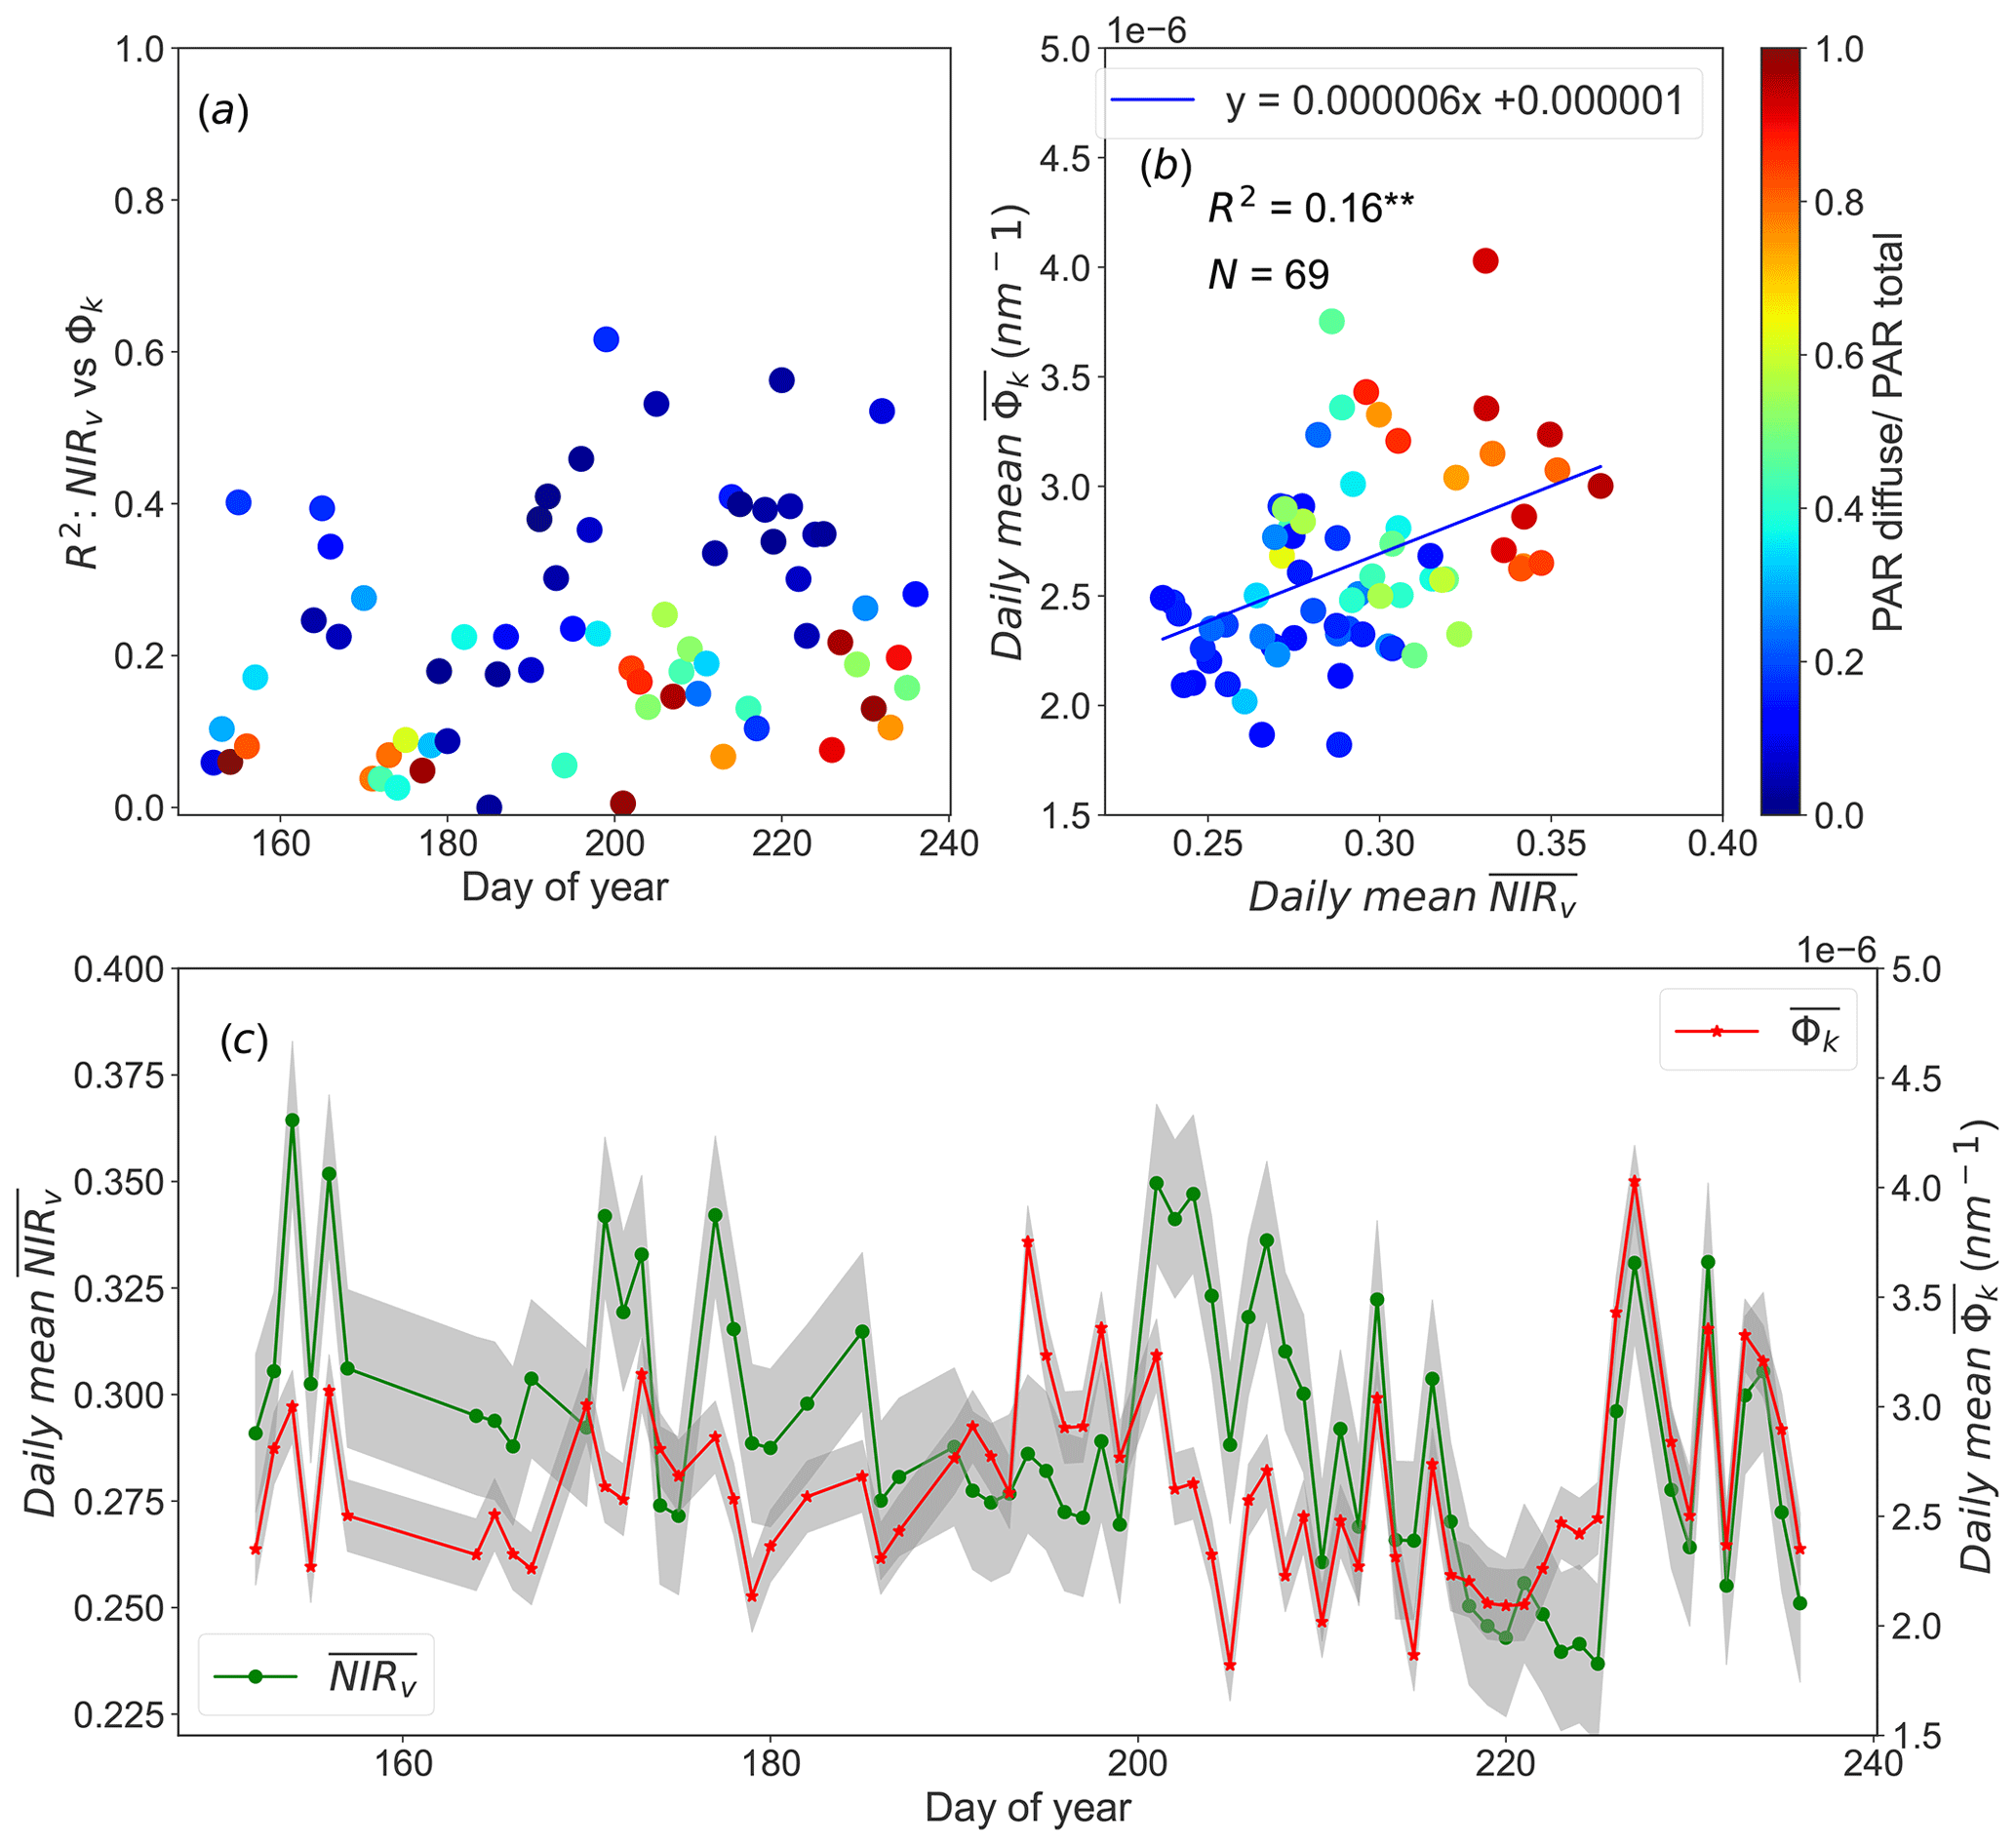
Figure 3Panel (a) exhibits the inter-daily variations of the coefficient of determination (R2) of the relationships between the near-infrared reflectance of vegetation index (NIRv) and the canopy Φk at instantaneous scale, as a function of the fraction between diffuse and total PAR. Panel (b) presents the seasonal relationship between the daily means and , as a function of the fraction between diffuse and total PAR. And panel (c) shows the seasonal dynamics in and . The shaded area indicates the 95 % confidence interval. The asterisks stand for the statistical significance level ( = P≤0.01).
3.4 Random forest models for predicting FyieldLIF and Φk in a temperate deciduous forest
We tested the potential of the RF modeling approach to predict FyieldLIF and Φk based on remotely sensed products. We intended to show FY-R-SIFy-SA and FY-R-SA models' results for FyieldLIF and Φk-R and Φk-R-SA results for Φk estimates. The other RF models' results for FyieldLIF are given in Supplement Fig. S9.
The results show that all random forest models had a strong performance on the prediction of FyieldLIF (Table 2), with OOB R2 varying between 0.86 and 0.90 and adj. R2 between 0.87 and 0.90. In Fig. 4, the RF models' residuals between observed and predicted FyieldLIF are randomly distributed, and FyieldLIF is not overestimated or underestimated. Note that adding SIF (FY-R-SIF, OOB R2=0.87 and adj. R2=0.88) or SIFy (FY-R-SIFy, OOB R2=0.88 and adj. R2=0.89) relatively increases the model performance compared to the FY-R model (FY-R, OOB R2=0.86 and adj. R2=0.87), but the difference between R2 is not statistically significant. Thus, the use of reflectance bands only allows us to predict FyieldLIF and SIF or SIFy and did not provide an additional improvement for predicting FyieldLIF at the acquisition time step. Substituting SIF for SZA and SAA also showed good model performance (FY-R-SA, OOB R2=0.90 and adj. R2=0.90). The FY-R-SIFy-SA model revealed a performance similar to the FY-R-SA model's one (FY-R-SIFy-SA, OOB R2=0.90 and adj. R2=0.90). The predictor importance estimates for the FY-R-SA model showed that SZA, SAA, and R410 contribute the most in determining FyieldLIF (Fig. 4d), while for the FY-R-SIFy-SA model SZA, R830, SAA, R410, and R740 (Fig. 4b) provide the most useful information for FyieldLIF predictions.
Table 2Random forest (RF) models' statistical results for predicting FyieldLIF. N denotes the number of data points used for the RF model's testing, Adj. R2 represents the adjusted coefficient of determination of the relationship between the test dataset FyieldLIF and the predicted FyieldLIF, OOB R2 is the model accuracy on the validation data set ( of the training set), and the RMSE is the root mean square error between observed FyieldLIF and RF model predicted FyieldLIF.
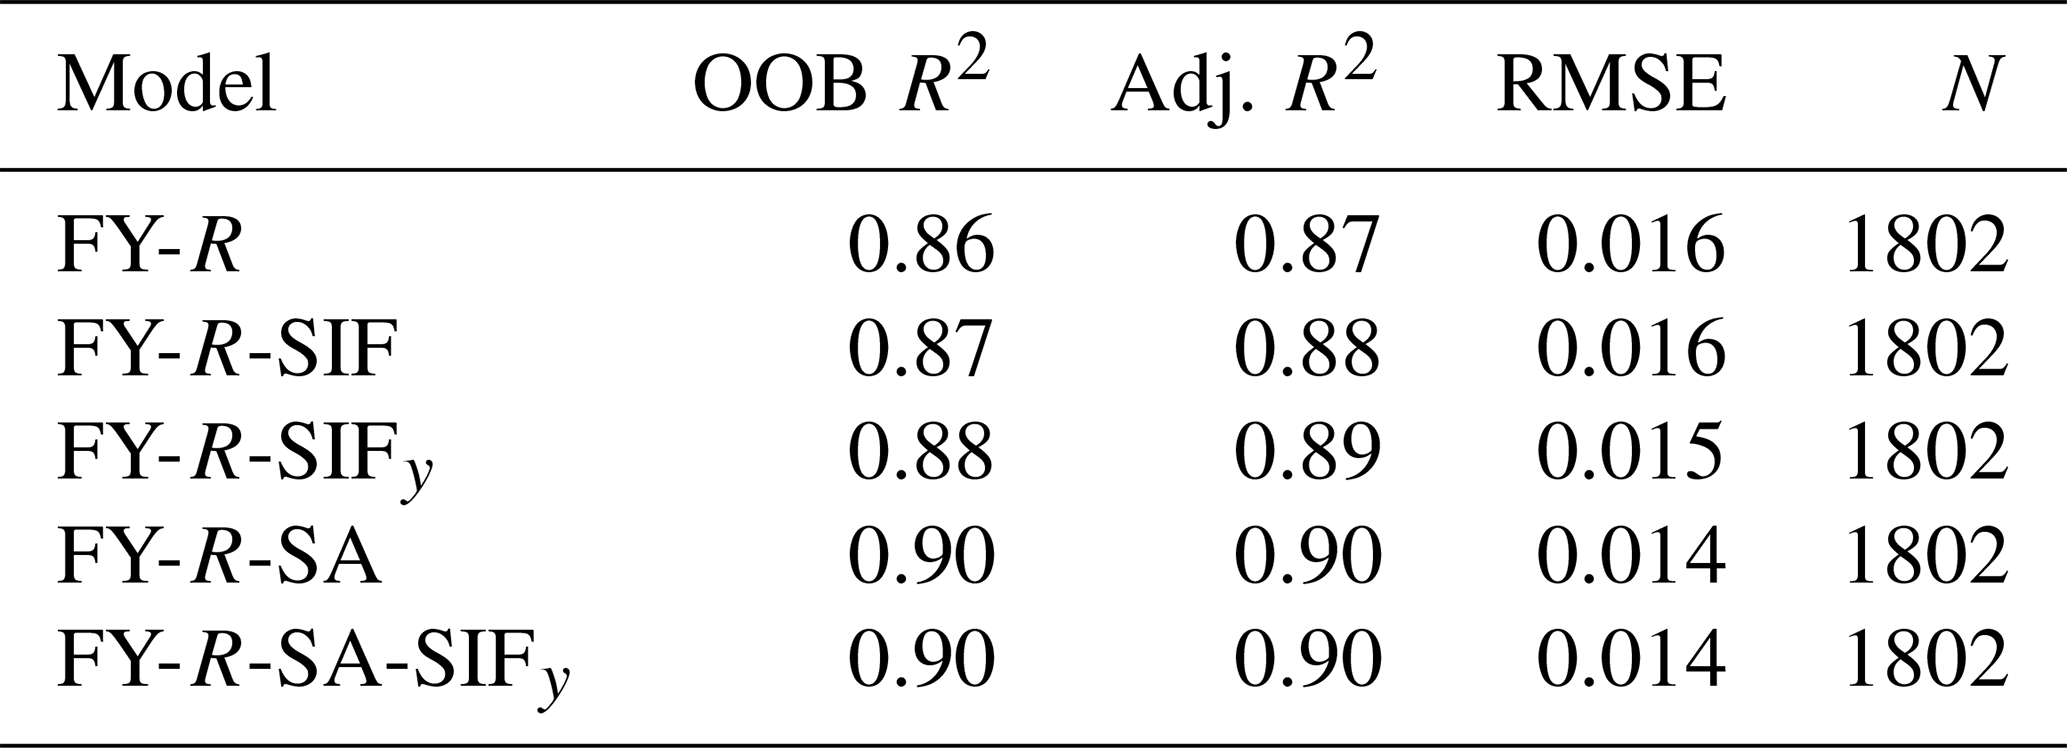
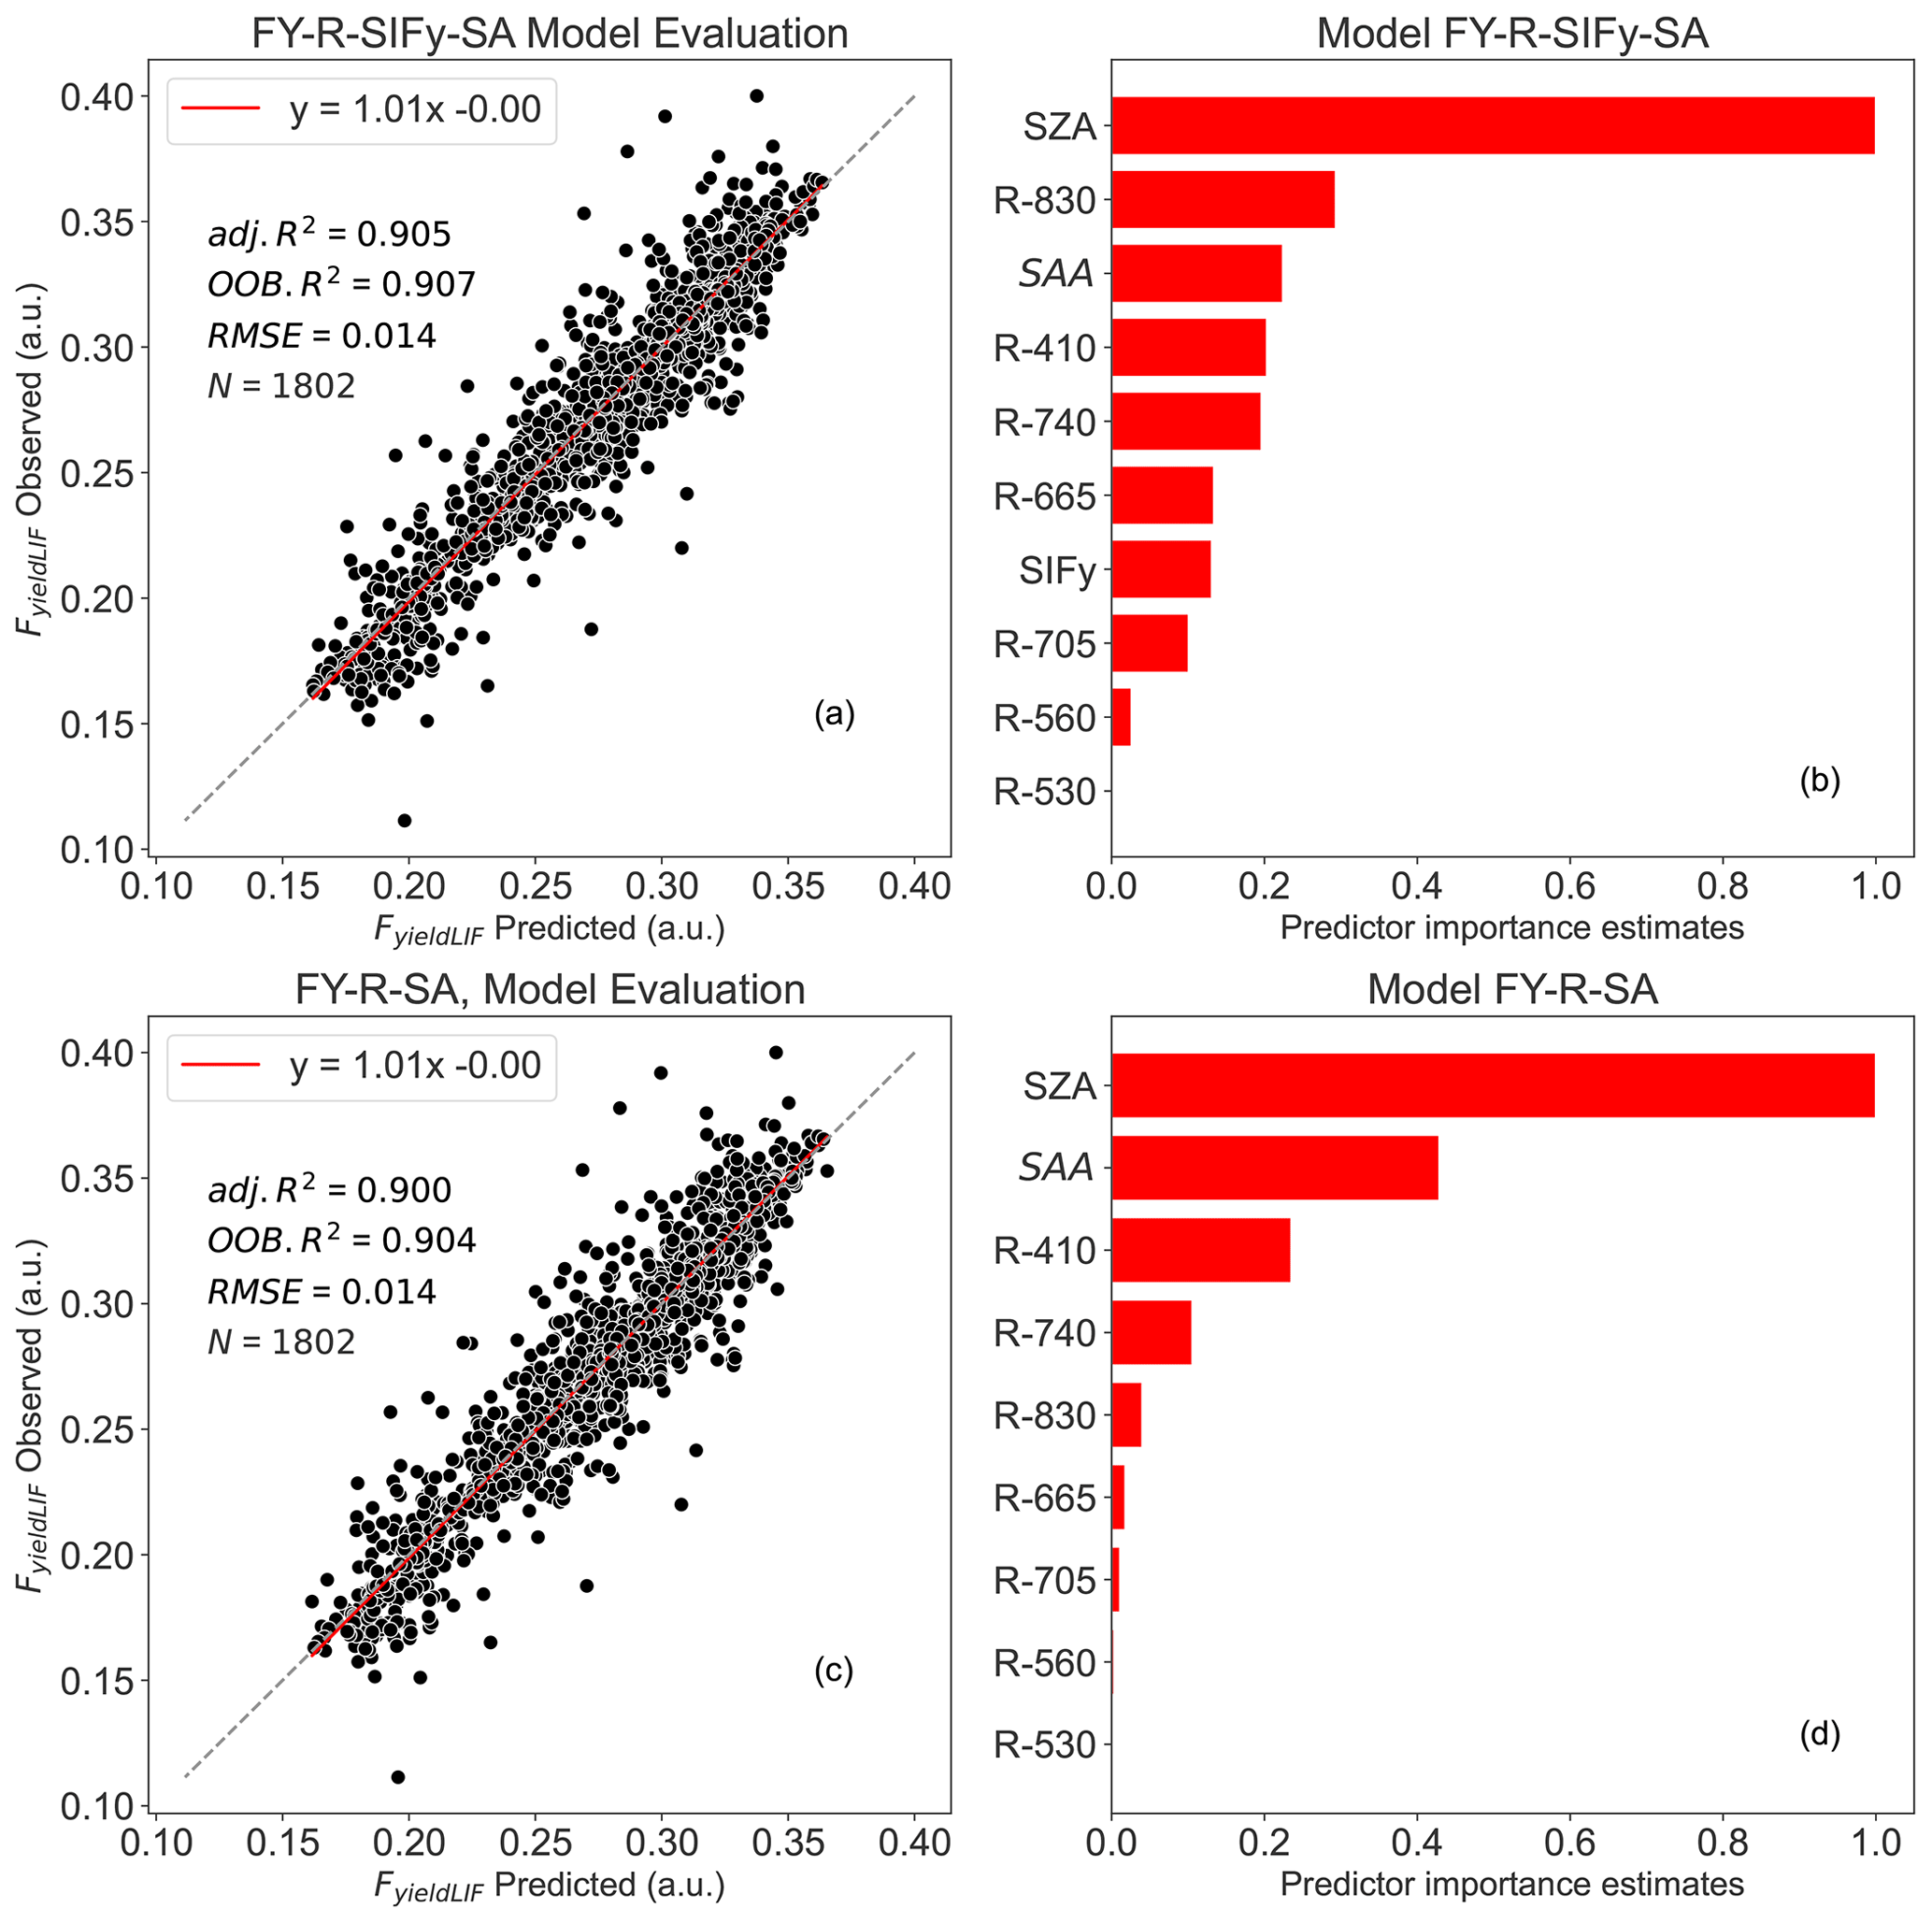
Figure 4Random forest (RF) model outputs: panel (a) depicts the FY-R-SIFy-SA model performance between observed and predicted FyieldLIF, panel (b) represents the predictor importance estimates for FY-R-SIFy-SA model, panel (c) represents the FY-R-SA model performance between observed and predicted FyieldLIF, and panel (d) represents the predictor importance estimates for FY-R-SA model. N denotes the number of data points used for the RF model's testing, adj. R2 represents the adjusted coefficient of determination of the relationship between the test dataset FyieldLIF and the predicted FyieldLIF, OOB R2 is the model accuracy on the validation data set ( of the training set), and the RMSE is the root mean square error between observed FyieldLIF and RF model predicted FyieldLIF. The dashed diagonal line depicts the 1:1 line. FY-R-SIFy-SA denotes FyieldLIF prediction using R, SIFy, and solar angles as inputs; FY-R-SA includes R, SZA, and SAA to predict FyieldLIF.
The results reveal that RF models had good performance in predicting Φk (Fig. 5). The best performing model was achieved using R and sun angles as inputs (Φk-R-SA, OOB R2=0.69 and adj. R2 = 0.70), while R alone explained 58 % of Φk on the validation dataset and 62 % on the test dataset (Φk-R, OOB R2=0.58 and adj. R2=0.62). The predictor importance estimates (Fig. 5b and d) show that R410, R740, R665, R705, SZA, and SAA are the main predictors for estimating Φk, underlining the dependency of Φk on shadow effects.
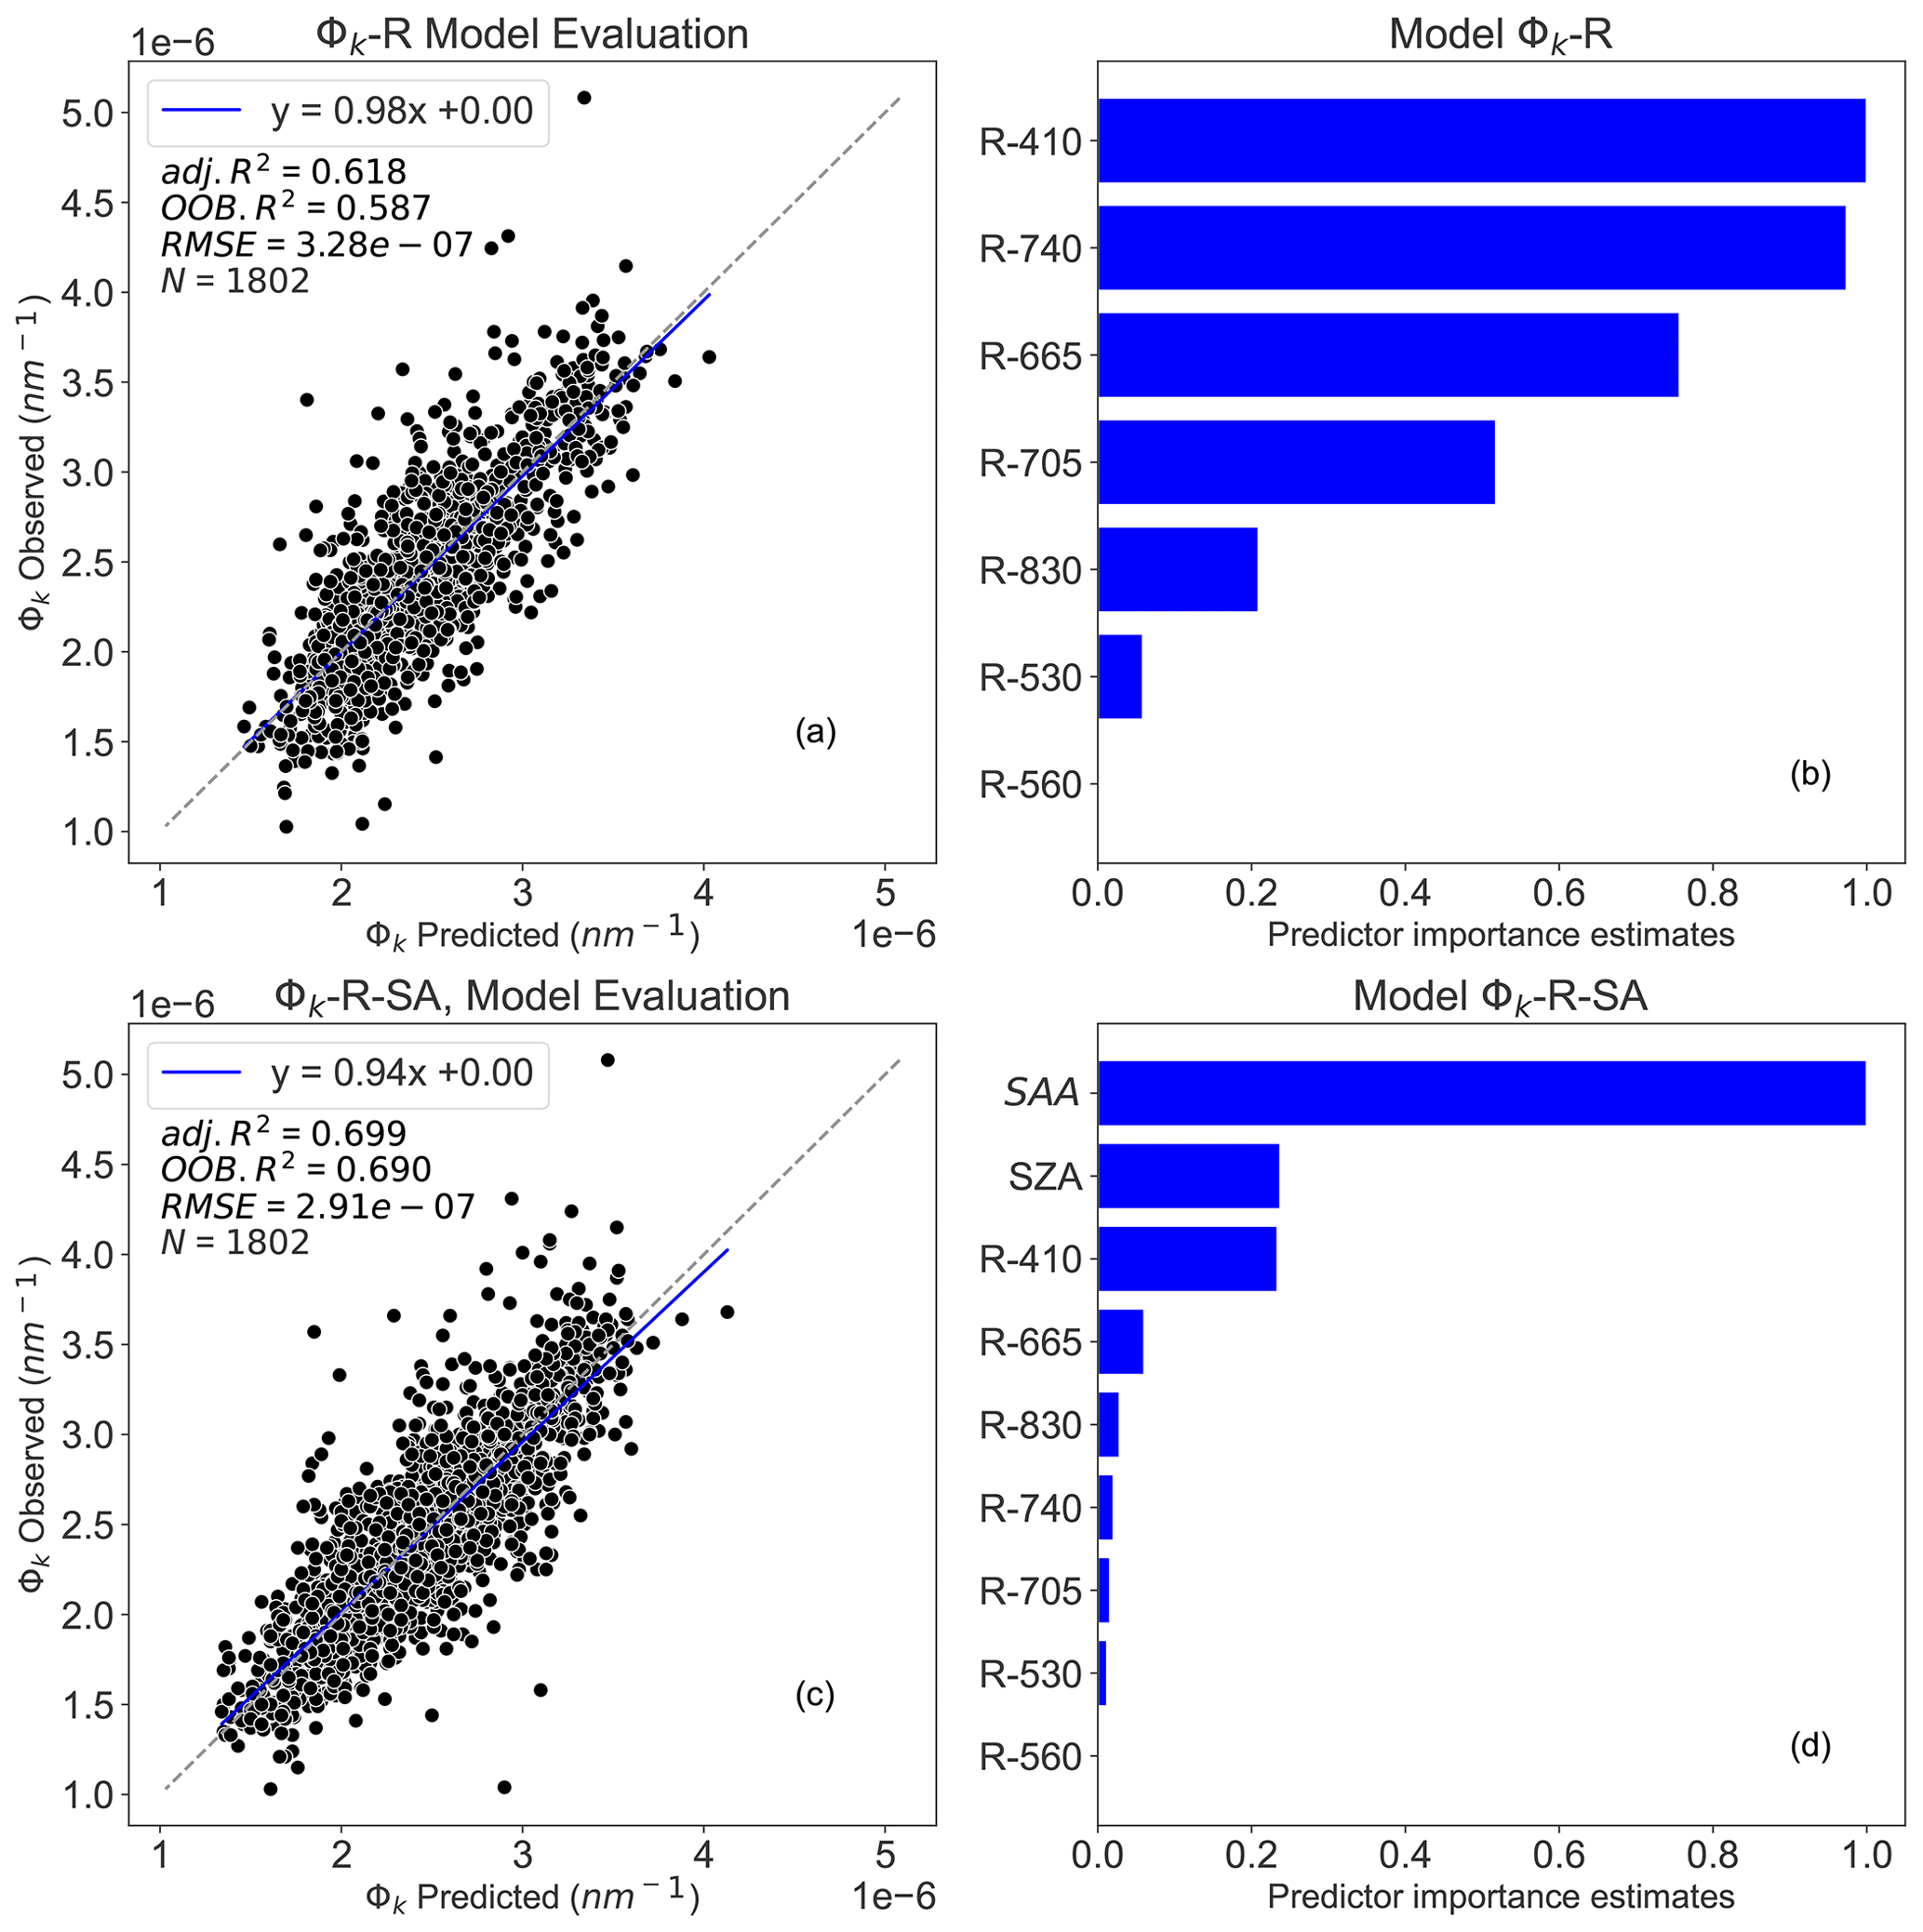
Figure 5Random forest (RF) model outputs: panel (a) depicts the Φk-R model performance between observed and predicted Φk, panel (b) presents the predictor importance estimates for Φk-R model, panel (c) represents the Φk-R-SA model performance between observed and predicted Φk, and panel (d) presents the predictor importance estimates for Φk-R-SA model. N denotes the number of data points used for the RF model's testing, adj. R2 represents the adjusted coefficient of determination of the relationship between observed and predicted Φk, OOB R2 is the model accuracy on the validation dataset ( of the training set), and the RMSE is the root mean square error between observed and RF model predicted Φk. The dashed diagonal line depicts the 1:1 line. Φk-R denotes Φk prediction using only R; Φk-R-SA integrates R, SZA, and SAA to estimate Φk.
4.1 Relationships between SIFy and FyieldLIF at instantaneous and daily timescales
The first objective of this study was to show the effects of canopy structure on the SIF signal. The relationship between SIFy and FyieldLIF was investigated at the daily and seasonal timescales during the growing season from June to August. The results demonstrated that SIFy and FyieldLIF were more correlated at the seasonal timescale than at the diurnal timescale. Passive SIF is highly dependent on both the structural and physiological properties of the leaf and canopy (Biriukova et al., 2021; Dechant et al., 2022). At the diurnal timescale, far-red SIF is strongly affected by canopy scattering and by the distribution of sunlit and shaded areas at the top and within the canopy (Dechant et al., 2020; Zhang and Zhang, 2023). This study showed that those factors strongly affected SIFy (SIF normalized by PAR). Further, as SIFy was estimated using PAR, but not absorbed radiations, SIFy estimation did not consider the conditions of radiation extinction within the canopy. Therefore, the canopy structural effects can strongly blur the information on the physiological functioning of the vegetation provided by SIFy and hence lead to low correlations between SIFy and FyieldLIF. Thus, interpreting SIFy signal for inferring vegetation physiology at the diurnal scale should be carried out with great care, considering the effects of canopy structure and the complex interactions between structure and illumination geometry. The development of new methods and models are warranted to better explore the possibility to use SIF as a proxy for vegetation functioning at high frequency (seconds to minutes), especially when the vegetation structure is complex and heterogenous, such as in forest stands. On the other hand, the better correlation found at the seasonal timescale can be explained by a potential removal of short-term changes in illumination conditions, canopy structure, and sun–canopy geometry. Note that the seasonal variability of is also driven by the seasonal changes in leaf biochemical properties and solar zenith and azimuth angles. The leaf biochemical properties can also drive the seasonal dynamics in , leading to a better correlation. This may explain why the fraction of the diffuse to total PAR could not entirely explain the relation between and (Fig. 1b). In summary, our results underlined that it is difficult to decouple vegetation structural and physiological effects in SIF, owing to fluctuations of sun–canopy geometry throughout the day at the diurnal timescale and the difficulties linked to the accurate estimation of total SIF and the fraction of absorbed PAR at the canopy scale (Chang et al., 2021).
4.2 Effects of canopy structure and sun–canopy geometry on diurnal dynamics in SIF, NIRv, R-NIR, Φk, SIFy, and FyieldLIF
The fraction of absorbed solar radiation by the canopy (fAPAR) and the fraction of emitted chlorophyll fluorescence that reaches the sensor heavily impact SIF. The results obtained during clear sky days revealed that NIRv, R-NIR, and Φk exhibited similar diurnal patterns. This suggests that the diurnal variations in NIRv (i.e., the product of NDVI and R-NIR) and in Φk (i.e., the product of fAPAR and fesc) were dominated by the bidirectional NIR reflectance effect as has been shown in Chang et al. (2021). These authors pointed out that the diurnal dynamics in NIRv were determined by the diurnal pattern of the reflectance in the NIR within maize crop rows that were under shadow conditions at midday. Sun et al. (2023a) clearly stated that the dynamics of the fluorescence escape fraction (fesc) in a homogeneous C3 crop canopy appears to exhibit a diurnal pattern similar to directional reflectance. Further, at intra-daily timescale, Φk is likely to be driven by canopy structure (shadow, leaf angle distribution, etc.) and sun–canopy geometry (SZA and SAA) effects, in particular the distribution of fractions of sunlit and shaded leaves. This situation can lead to large variability of the diurnal patterns in NIRv and Φk as has been shown in Fig. 2.
The results also highlighted that, at the diurnal timescale, the peaks in SIF and PAR do not match (Fig. 2), which is probably due to the effects of sun–canopy geometry. Indeed, directionality effects can induce variations in the fraction of sunlit and shaded leaves within the FOV, modulating the actual amount of radiation reaching the leaves (different from the incident radiation measured at the sensor, unaffected by shading) and therefore affecting canopy total SIF emission. This finding is in contradiction with several studies that showed that the diurnal patterns in SIF are mainly dominated by PAR (Campbell et al., 2019; Wang et al., 2021) but in agreement with Nichol et al. (2019), who showed that the peaks of PAR and SIF did not match in a Boreal Scots pine canopy. Further, note that at high incident PAR the light energy might exceed the capacity of photosynthesis. In this case, the plant photoprotective mechanism known as non-photochemical heat dissipation is activated, leading first to stomatal closure and hence to SIF emission reduction (Jonard et al., 2020; De Cannière et al., 2022).
The results also showed that the diurnal dynamics in SIFy and FyieldLIF did not match (Fig. 2). This is probably due to both physiological and canopy structure effects. The early decline of SIFy before noon could be likely due not only to shadow effects, but also to the fact that the PAR was high. These findings corroborate with previous studies (Loayza et al., 2023; Li et al., 2020; Moya et al., 2019). For instance, Loayza et al. (2023) found that under clear-sky conditions, at the diurnal timescale, within potato plants, firstly the chlorophyll fluorescence yield declined drastically when the PAR reached values higher than 1000 µmol m−2 s−1, and secondly FyieldLIF continuously decreased for PAR > 600 µmol m−2 s−1. Thus, the continuous decline of FyieldLIF observed here (Fig. 2) is likely caused by the fact that the PAR was higher than 1250 µmol photon m−2 s−1 for the chosen days. Within this situation, the vegetation photosynthetic capacity could be overwhelmed, and the energy-dependent and non-energy-dependent non-photochemical heat dissipation can be triggered. Note that energy-dependent heat dissipation can last from a few seconds to a few minutes, while non-energy-dependent heat dissipation can lead to photoinhibition or photobleaching and can last longer (hours to weeks) (Porcar-Castell et al., 2014). Both mechanisms can induce a decrease in SIFy and FyieldLIF at the diurnal timescale.
4.3 Relationships between NIRv and Φk at daily and seasonal timescales
Strong correlations were found between NIRv and Φk at the diurnal timescale. However, their correlations varied largely depending on the ratio of diffuse to total PAR, with high correlation corresponding to clear-sky conditions and low correlation to diffuse sky conditions. This result suggests that under clear-sky conditions NIRv is a relatively good proxy of Φk and hence can be used to take canopy structure and sun–canopy geometry (i.e., crown shadow, reabsorption, and scattering within leaves and canopies) effects on SIF at the diurnal timescale into account. Indeed, with diffuse sky conditions, canopy structure, shadows, and sun–canopy geometry play a minor role in the variations in NIRv and Φk, even though there are still strong fluctuations in incident light, justifying the low correlations observed between NIRv and Φk during diffuse sky conditions. On the other hand, the positive weak but statistically significant correlation found between daily mean and daily mean at the seasonal timescale indicates that and relations were driven by the fraction between diffuse and total PAR. Indeed, this underlined well the NIRv usage, because it was meant to correct reabsorption and scattering effects on SIF at daily and seasonal timescales (Badgley et al., 2017).
4.4 Random forest models for FyieldLIF and Φk predictions
How we can determine and properly disentangle the confounding factors, including structural, biophysical, and physiological canopy components that all contribute to remotely sensed SIF, remains a challenging task. SIF has emerged as a promising tool for determining and characterizing structural and physiological vegetation traits. However, the relationships between these confounding factors and SIF are often complex and site-specific and thus require a model with a set of parameters incorporating these complexities. Therefore, in this study, we examined the potential of RF modeling approaches to predict FyieldLIF and Φk based on different remotely sensed input variables under clear-sky conditions.
For FyieldLIF, the RF models can explain between 86 % and 90 % of the variability in FyieldLIF (see Table 2 and Fig. 4), sustaining that directional reflectance, chlorophyll fluorescence, and sun–canopy geometry (SZA and SAA) can effectively capture relevant variations in FyieldLIF. For instance, FY-R-SA and FY-R-SIFy-SA models' predictor importance estimates showed that SZA, SAA, R410, R740, and R830 provide the most useful information for FyieldLIF predictions (Fig. 4). The reflectance in the blue spectral band (R410) is largely affected by the strong blue light absorption by the chlorophyll pigments and it is highly subject to leaves or canopy shadow conditions, while reflectance in the red-edge (R740) and near-infrared bands characterize the leaf area index and the chlorophyll content of the entire forest (Zeng et al., 2022b). The red-edge region is mainly used to determine leaf and canopy chlorophyll contents. Because of these abovementioned characteristics of R, it is not surprising that the combination of reflectance at specific spectral bands can be used to infer effective and relevant information that allow for capturing FyieldLIF variations. The data also revealed that adding SIF or SIFy as predictors did not significantly improve the model performance estimates as it has been shown in Balde et al. (2023). This result indicates that even at high temporal resolution the contribution of SIF or SIFy is important compared to each reflectance band individually, but the combined effect of reflectance bands could mitigate or hide the use of SIF as vegetation physiological proxy. The results showed that SZA and SAA significantly improved the model prediction for FyieldLIF (FY-R-SA). First, the contribution of SZA can be attributed to the illumination conditions, because incoming radiation is tightly related to SZA. Second, the effect of SAA is attributable to the anisotropy in reflectance and canopy structure in the azimuthal plane.
For Φk, results indicate that RF models can explain between 60 % and 70 % of the variability in Φk (Fig. 5a and b). The unexplained 30 % or 40 % in Φk variance evidenced that the ratio SIFy over FyieldLIF strongly varies and depends on several factors, including canopy structure, sun geometry, and illumination conditions. Therefore, this suggests that mechanistic models that used NIRv to approximate the product of fAPAR and fesc are simplistic and do no fully account for the complex interactions between incident radiation and canopy structure, notably due to the distribution of light and shaded leaves at the top and inside of the forest canopy.
In this work, the simultaneous and continuous active and passive measurements of chlorophyll fluorescence at the canopy scale in a sessile oak mature forest allowed us to analyze the diurnal cycles of key variables, including SIF, SIFy, NIRv, and FyieldLIF. A novel remote sensing indicator, Φk, the ratio between SIFy and FyieldLIF, which is also theoretically the product of fAPAR and fesc, was introduced. On the one hand, the relationship between SIFy and FyieldLIF was evaluated, and on the other hand, the relation between NIRv and Φk was examined at daily and seasonal scales. Further, several random forest models with reflectances, SIF, and sun angles as inputs were also used to not only predict FyieldLIF and Φk, but also to provide sensitivity analysis and interpretation of the model outputs.
The results showed that the SIF signal is highly impacted by the canopy structure and the sun–canopy geometry effects, as evidenced by the weak correlations found between SIFy and FyieldLIF at diurnal timescale using instantaneous measurements. However, SIFy captured the seasonal dynamics of FyieldLIF by explaining 58 % of the variations in FyieldLIF. The results also revealed that NIRv and reflectance at near-infrared (R-NIR) are good proxies of Φk at the diurnal timescale, while their correlations diverged at the seasonal scale.
Based on random forest models, the combination of reflectance, chlorophyll fluorescence, and sun geometry (SZA and SAA) allow us to predict FyieldLIF and Φk at the diurnal timescale under clear-sky conditions. For instance, the RF models were able to explain 86 %–90 % of FyieldLIF variability, and 60 %–70 % of Φk variations were explained. Furthermore, the data also revealed that adding SIF or SIFy as predictors did not improve much the model performance compared to the reflectance-based model. But the predictor importance estimates showed that SIF and SIFy provide useful and impactful information in determining FyieldLIF. This result indicates that even at high temporal resolution the contribution of SIF or SIFy is important compared to each reflectance band individually, but the combined effect of reflectance bands could mitigate or hide the use of SIF as vegetation functioning proxy.
Overall, this study provides insights into understanding the complex and difficult relationship that exists between passive SIF and active chlorophyll fluorescence, as well as into the use of remote sensing data that are readily accessible at the satellite scale (spectral reflectance at 10 nm resolution, sun geometry, and chlorophyll fluorescence) to predict FyieldLIF and Φk at the canopy scale.
The computer codes (MATLAB and Python) used in this study are available upon request from the corresponding author.
The supplement related to this article is available online at: https://doi.org/10.5194/bg-21-1259-2024-supplement.
Conceptualization: all co-authors; methodology: HB, GH, YG, KS; instrument design and development: YG, AO, GL, GH; software: HB and GH; validation: HB; formal analysis: HB; investigation: HB; resources: HB, GH, YG, KS; data curation: HB and GH; writing (original draft preparation): HB; writing (reviewing and editing): all co-authors; visualization: HB; supervision: KS, YG, GH, GL; project administration: YG and KS; funding acquisition: YG and KS. All authors have read and agreed to the final version of the manuscript.
The contact author has declared that none of the authors has any competing interests.
Publisher’s note: Copernicus Publications remains neutral with regard to jurisdictional claims made in the text, published maps, institutional affiliations, or any other geographical representation in this paper. While Copernicus Publications makes every effort to include appropriate place names, the final responsibility lies with the authors.
We warmly thank Daniel Berveiller, Nicolas Delpierre, Alexandre Morfin, and Clotilde Pérot-Guillaume for their participation on data acquisition and management at Barbeau forest site.
This ongoing PhD work is jointly funded by the “Centre National d'Études Spatiales” (CNES) and ACRI-ST (Toulouse, France) (contract CNES-ACRI-ST-Ecole polytechnique-CNRS no. 3425). This work was also supported by CNES through the VELIF project focused on the FLEX mission (contract nos. 4500073234 and 4500073501), The “Program National de Télédétection Spatiales” (PNTS) across the C-FLEX project and EIT Climate-KIC project via the Agriculture Resilience, Inclusive, and Sustainable Enterprise (ARISE) project (EIT 190733).
This paper was edited by Xi Yang and reviewed by two anonymous referees.
Aasen, H., Van Wittenberghe, S., Sabater Medina, N., Damm, A., Goulas, Y., Wieneke, S., Hueni, A., Malenovský, Z., Alonso, L., Pacheco-Labrador, J., Cendrero-Mateo, M. P., Tomelleri, E., Burkart, A., Cogliati, S., Rascher, U., and Mac Arthur, A.: Sun-Induced Chlorophyll Fluorescence II: Review of Passive Measurement Setups, Protocols, and Their Application at the Leaf to Canopy Level, Remote Sens., 11, 927, https://doi.org/10.3390/rs11080927, 2019.
Badgley, G., Field, C. B., and Berry, J. A.: Canopy near-infrared reflectance and terrestrial photosynthesis, Sci. Adv., 3, e1602244, https://doi.org/10.1126/sciadv.1602244, 2017.
Baker, N. R.: Chlorophyll Fluorescence: A Probe of Photosynthesis In Vivo, Ann. Rev. Plant Biol., 59, 89–113, https://doi.org/10.1146/annurev.arplant.59.032607.092759, 2008.
Balde, H., Hmimina, G., Goulas, Y., Latouche, G., and Soudani, K.: Synergy between TROPOMI sun-induced chlorophyll fluorescence and MODIS spectral reflectance for understanding the dynamics of gross primary productivity at Integrated Carbon Observatory System (ICOS) ecosystem flux sites, Biogeosciences, 20, 1473–1490, https://doi.org/10.5194/bg-20-1473-2023, 2023.
Biriukova, K., Pacheco-Labrador, J., Migliavacca, M., Mahecha, M. D., Gonzalez-Cascon, R., Martín, M. P., and Rossini, M.: Performance of Singular Spectrum Analysis in Separating Seasonal and Fast Physiological Dynamics of Solar-Induced Chlorophyll Fluorescence and PRI Optical Signals, J. Geophys. Res.-Biogeo., 126, e2020JG006158, https://doi.org/10.1029/2020JG006158, 2021.
Breiman, L.: Random Forests, Mach. Learn., 45, 5–32, https://doi.org/10.1023/A:1010933404324, 2001.
Campbell, P., Huemmrich, K., Middleton, E., Ward, L., Julitta, T., Daughtry, C., Burkart, A., Russ, A., and Kustas, W.: Diurnal and Seasonal Variations in Chlorophyll Fluorescence Associated with Photosynthesis at Leaf and Canopy Scales, Remote Sens., 11, 488, https://doi.org/10.3390/rs11050488, 2019.
Chang, C. Y., Wen, J., Han, J., Kira, O., LeVonne, J., Melkonian, J., Riha, S. J., Skovira, J., Ng, S., Gu, L., Wood, J. D., Näthe, P., and Sun, Y.: Unpacking the drivers of diurnal dynamics of sun-induced chlorophyll fluorescence (SIF): Canopy structure, plant physiology, instrument configuration and retrieval methods, Remote Sens. Environ., 265, 112672, https://doi.org/10.1016/j.rse.2021.112672, 2021.
Cogliati, S., Verhoef, W., Kraft, S., Sabater, N., Alonso, L., Vicent, J., Moreno, J., Drusch, M., and Colombo, R.: Retrieval of sun-induced fluorescence using advanced spectral fitting methods, Remote Sens. Environ., 169, 344–357, https://doi.org/10.1016/j.rse.2015.08.022, 2015.
Damm, A., Guanter, L., Paul-Limoges, E., van der Tol, C., Hueni, A., Buchmann, N., Eugster, W., Ammann, C., and Schaepman, M. E.: Far-red sun-induced chlorophyll fluorescence shows ecosystem-specific relationships to gross primary production: An assessment based on observational and modeling approaches, Remote Sens. Environ., 166, 91–105, https://doi.org/10.1016/j.rse.2015.06.004, 2015.
Daumard, F., Goulas, Y., Champagne, S., Fournier, A., Ounis, A., Olioso, A., and Moya, I.: Continuous Monitoring of Canopy Level Sun-Induced Chlorophyll Fluorescence During the Growth of a Sorghum Field, IEEE Trans. Geosci. Remote Sens., 50, 4292–4300, https://doi.org/10.1109/TGRS.2012.2193131, 2012.
De Cannière, S., Vereecken, H., Defourny, P., and Jonard, F.: Remote Sensing of Instantaneous Drought Stress at Canopy Level Using Sun-Induced Chlorophyll Fluorescence and Canopy Reflectance, Remote Sens., 14, 2642, https://doi.org/10.3390/rs14112642, 2022.
Dechant, B., Ryu, Y., Badgley, G., Zeng, Y., Berry, J. A., Zhang, Y., Goulas, Y., Li, Z., Zhang, Q., Kang, M., Li, J., and Moya, I.: Canopy structure explains the relationship between photosynthesis and sun-induced chlorophyll fluorescence in crops, Remote Sens. Environ., 241, 111733, https://doi.org/10.1016/j.rse.2020.111733, 2020.
Dechant, B., Ryu, Y., Badgley, G., Köhler, P., Rascher, U., Migliavacca, M., Zhang, Y., Tagliabue, G., Guan, K., Rossini, M., Goulas, Y., Zeng, Y., Frankenberg, C., and Berry, J. A.: NIRVP: A robust structural proxy for sun-induced chlorophyll fluorescence and photosynthesis across scales, Remote Sens. Environ., 268, 112763, https://doi.org/10.1016/j.rse.2021.112763, 2022.
Delpierre, N., Berveiller, D., Granda, E., and Dufrêne, E.: Wood phenology, not carbon input, controls the interannual variability of wood growth in a temperate oak forest, New Phytol., 210, 459–470, https://doi.org/10.1111/nph.13771, 2016.
Drusch, M., Moreno, J., Del Bello, U., Franco, R., Goulas, Y., Huth, A., Kraft, S., Middleton, E. M., Miglietta, F., Mohammed, G., Nedbal, L., Rascher, U., Schuttemeyer, D., and Verhoef, W.: The FLuorescence EXplorer Mission Concept – ESA's Earth Explorer 8, IEEE Trans. Geosci. Remote Sens., 55, 1273–1284, https://doi.org/10.1109/TGRS.2016.2621820, 2017.
Frankenberg, C., Fisher, J. B., Worden, J., Badgley, G., Saatchi, S. S., Lee, J.-E., Toon, G. C., Butz, A., Jung, M., Kuze, A., and Yokota, T.: New global observations of the terrestrial carbon cycle from GOSAT: Patterns of plant fluorescence with gross primary productivity: CHLOROPHYLL FLUORESCENCE FROM SPACE, Geophys. Res. Lett., 38, L17706, https://doi.org/10.1029/2011GL048738, 2011.
Gao, S., Huete, A., Kobayashi, H., Doody, T. M., Liu, W., Wang, Y., Zhang, Y., and Lu, X.: Simulation of solar-induced chlorophyll fluorescence in a heterogeneous forest using 3-D radiative transfer modelling and airborne LiDAR, ISPRS J. Photogramm. Remote Sens., 191, 1–17, https://doi.org/10.1016/j.isprsjprs.2022.07.004, 2022.
Goulas, Y., Fournier, A., Daumard, F., Champagne, S., Ounis, A., Marloie, O., and Moya, I.: Gross Primary Production of a Wheat Canopy Relates Stronger to Far Red Than to Red Solar-Induced Chlorophyll Fluorescence, Remote Sens., 9, 97, https://doi.org/10.3390/rs9010097, 2017.
Guanter, L., Zhang, Y., Jung, M., Joiner, J., Voigt, M., Berry, J. A., Frankenberg, C., Huete, A. R., Zarco-Tejada, P., Lee, J.-E., Moran, M. S., Ponce-Campos, G., Beer, C., Camps-Valls, G., Buchmann, N., Gianelle, D., Klumpp, K., Cescatti, A., Baker, J. M., and Griffis, T. J.: Global and time-resolved monitoring of crop photosynthesis with chlorophyll fluorescence, P. Natl. Acad. Sci. USA, 111, E1327–E1333, https://doi.org/10.1073/pnas.1320008111, 2014.
He, L., Magney, T., Dutta, D., Yin, Y., Köhler, P., Grossmann, K., Stutz, J., Dold, C., Hatfield, J., Guan, K., Peng, B., and Frankenberg, C.: From the Ground to Space: Using Solar-Induced Chlorophyll Fluorescence to Estimate Crop Productivity, Geophys. Res. Lett., 47, e2020GL087474, https://doi.org/10.1029/2020GL087474, 2020.
Jonard, F., De Cannière, S., Brüggemann, N., Gentine, P., Short Gianotti, D. J., Lobet, G., Miralles, D. G., Montzka, C., Pagán, B. R., Rascher, U., and Vereecken, H.: Value of sun-induced chlorophyll fluorescence for quantifying hydrological states and fluxes: Current status and challenges, Agr. Forest Meteorol., 291, 108088, https://doi.org/10.1016/j.agrformet.2020.108088, 2020.
Li, X. and Xiao, J.: TROPOMI observations allow for robust exploration of the relationship between solar-induced chlorophyll fluorescence and terrestrial gross primary production, Remote Sens. Environ., 268, 112748, https://doi.org/10.1016/j.rse.2021.112748, 2022.
Li, Z., Zhang, Q., Li, J., Yang, X., Wu, Y., Zhang, Z., Wang, S., Wang, H., and Zhang, Y.: Solar-induced chlorophyll fluorescence and its link to canopy photosynthesis in maize from continuous ground measurements, Remote Sens. Environ., 236, 111420, https://doi.org/10.1016/j.rse.2019.111420, 2020.
Lin, J., Shen, Q., Wu, J., Zhao, W., and Liu, L.: Assessing the Potential of Downscaled Far Red Solar-Induced Chlorophyll Fluorescence from the Canopy to Leaf Level for Drought Monitoring in Winter Wheat, Remote Sens., 14, 1357, https://doi.org/10.3390/rs14061357, 2022.
Liu, Y., Chen, J. M., He, L., Zhang, Z., Wang, R., Rogers, C., Fan, W., de Oliveira, G., and Xie, X.: Non-linearity between gross primary productivity and far-red solar-induced chlorophyll fluorescence emitted from canopies of major biomes, Remote Sens. Environ., 271, 112896, https://doi.org/10.1016/j.rse.2022.112896, 2022.
Loayza, H., Moya, I., Quiroz, R., Ounis, A., and Goulas, Y.: Active and passive chlorophyll fluorescence measurements at canopy level on potato crops. Evidence of similitude of diurnal cycles of apparent fluorescence yields, Photos. Res., 155, 271–288, https://doi.org/10.1007/s11120-022-00995-8, 2023.
Lopez Gonzalez, M. d. l. L.: Seguimiento del estrés hídrico en la vid mediante técnicas de fluorescencia de la clorofila y otros métodos ópticos, Thesis, Universidad de Castilla-La-Mancha, Albacete, https://ruidera.uclm.es/items/38a54238-b996-4d8f-8076-ada1630f4073 (last access: 9 March 2024), 2015.
Lu, X., Liu, Z., Zhao, F., and Tang, J.: Comparison of total emitted solar-induced chlorophyll fluorescence (SIF) and top-of-canopy (TOC) SIF in estimating photosynthesis, Remote Sens. Environ., 251, 112083, https://doi.org/10.1016/j.rse.2020.112083, 2020.
Magney, T. S., Frankenberg, C., Fisher, J. B., Sun, Y., North, G. B., Davis, T. S., Kornfeld, A., and Siebke, K.: Connecting active to passive fluorescence with photosynthesis: a method for evaluating remote sensing measurements of Chl fluorescence, New Phytol., 215, 1594–1608, https://doi.org/10.1111/nph.14662, 2017.
Maysonnave, J., Delpierre, N., François, C., Jourdan, M., Cornut, I., Bazot, S., Vincent, G., Morfin, A., and Berveiller, D.: Contribution of deep soil layers to the transpiration of a temperate deciduous forest: quantification and implications for the modelling of productivity, Ecology, bioRxiv 2022.02.14.480025, https://doi.org/10.1101/2022.02.14.480025, 2022.
Mengistu, A. G., Mengistu Tsidu, G., Koren, G., Kooreman, M. L., Boersma, K. F., Tagesson, T., Ardö, J., Nouvellon, Y., and Peters, W.: Sun-induced fluorescence and near-infrared reflectance of vegetation track the seasonal dynamics of gross primary production over Africa, Biogeosciences, 18, 2843–2857, https://doi.org/10.5194/bg-18-2843-2021, 2021.
Meroni, M., Rossini, M., Guanter, L., Alonso, L., Rascher, U., Colombo, R., and Moreno, J.: Remote sensing of solar-induced chlorophyll fluorescence: Review of methods and applications, Remote Sens. Environ., 113, 2037–2051, https://doi.org/10.1016/j.rse.2009.05.003, 2009.
Miao, G., Guan, K., Suyker, A. E., Yang, X., Arkebauer, T. J., Walter-Shea, E. A., Kimm, H., Hmimina, G. Y., Gamon, J. A., Franz, T. E., Frankenberg, C., Berry, J. A., and Wu, G.: Varying Contributions of Drivers to the Relationship Between Canopy Photosynthesis and Far-Red Sun-Induced Fluorescence for Two Maize Sites at Different Temporal Scales, J. Geophys. Res.-Biogeo., 125, e2019JG005051, https://doi.org/10.1029/2019JG005051, 2020.
Morozumi, T., Kato, T., Kobayashi, H., Sakai, Y., Tsujimoto, K., Nakashima, N., Buareal, K., Lan, W., and Ninomiya, H.: Row orientation influences the diurnal cycle of solar-induced chlorophyll fluorescence emission from wheat canopy, as demonstrated by radiative transfer modeling, Agr. Forest Meteorol., 339, 109576, https://doi.org/10.1016/j.agrformet.2023.109576, 2023.
Moya, I., Loayza, H., López, M. L., Quiroz, R., Ounis, A., and Goulas, Y.: Canopy chlorophyll fluorescence applied to stress detection using an easy-to-build micro-lidar, Photosynth. Res., 142, 1–15, https://doi.org/10.1007/s11120-019-00642-9, 2019.
Nichol, C. J., Drolet, G., Porcar-Castell, A., Wade, T., Sabater, N., Middleton, E. M., MacLellan, C., Levula, J., Mammarella, I., Vesala, T., and Atherton, J.: Diurnal and Seasonal Solar Induced Chlorophyll Fluorescence and Photosynthesis in a Boreal Scots Pine Canopy, Remote Sens., 11, 273, https://doi.org/10.3390/rs11030273, 2019.
Ounis, A., Evain, S., Flexas, J., Tosti, S., and Moya, I.: Adaptation of a PAM-fluorometer for remote sensing of chlorophyll fluorescence, Photosyn. Res., 68, 113–120, https://doi.org/10.1023/A:1011843131298, 2001.
Ounis, A., Bach, J., Mahjoub, A., Daumard, F., Moya, I., and Goulas, Y.: Combined use of LIDAR and hyperspectral measurements for remote sensing of fluorescence and vertical profile of canopies, Rev. Teledetec., 87, 87–94, https://doi.org/10.4995/raet.2015.3982, 2016.
Paul-Limoges, E., Damm, A., Hueni, A., Liebisch, F., Eugster, W., Schaepman, M. E., and Buchmann, N.: Effect of environmental conditions on sun-induced fluorescence in a mixed forest and a cropland, Remote Sens. Environ., 219, 310–323, https://doi.org/10.1016/j.rse.2018.10.018, 2018.
Porcar-Castell, A., Tyystjärvi, E., Atherton, J., van der Tol, C., Flexas, J., Pfündel, E. E., Moreno, J., Frankenberg, C., and Berry, J. A.: Linking chlorophyll a fluorescence to photosynthesis for remote sensing applications: mechanisms and challenges, J. Exp. Bot., 65, 4065–4095, https://doi.org/10.1093/jxb/eru191, 2014.
Rascher, U., Alonso, L., Burkart, A., Cilia, C., Cogliati, S., Colombo, R., Damm, A., Drusch, M., Guanter, L., Hanus, J., Hyvärinen, T., Julitta, T., Jussila, J., Kataja, K., Kokkalis, P., Kraft, S., Kraska, T., Matveeva, M., Moreno, J., Muller, O., Panigada, C., Pikl, M., Pinto, F., Prey, L., Pude, R., Rossini, M., Schickling, A., Schurr, U., Schüttemeyer, D., Verrelst, J., and Zemek, F.: Sun-induced fluorescence – a new probe of photosynthesis: First maps from the imaging spectrometer HyPlant, Glob. Change Biol., 21, 4673–4684, https://doi.org/10.1111/gcb.13017, 2015.
Soudani, K., Hmimina, G., Dufrêne, E., Berveiller, D., Delpierre, N., Ourcival, J.-M., Rambal, S., and Joffre, R.: Relationships between photochemical reflectance index and light-use efficiency in deciduous and evergreen broadleaf forests, Remote Sens. Environ., 144, 73–84, https://doi.org/10.1016/j.rse.2014.01.017, 2014.
Soudani, K., Delpierre, N., Berveiller, D., Hmimina, G., Pontailler, J.-Y., Seureau, L., Vincent, G., and Dufrêne, É.: A survey of proximal methods for monitoring leaf phenology in temperate deciduous forests, Biogeosciences, 18, 3391–3408, https://doi.org/10.5194/bg-18-3391-2021, 2021.
Sun, Y., Gu, L., Wen, J., van der Tol, C., Porcar-Castell, A., Joiner, J., Chang, C. Y., Magney, T., Wang, L., Hu, L., Rascher, U., Zarco-Tejada, P., Barrett, C. B., Lai, J., Han, J., and Luo, Z.: From remotely sensed solar-induced chlorophyll fluorescence to ecosystem structure, function, and service: Part I – Harnessing theory, Glob. Change Biol., 29, 2926–2952, https://doi.org/10.1111/gcb.16634, 2023a.
Sun, Y., Wen, J., Gu, L., Joiner, J., Chang, C. Y., van der Tol, C., Porcar-Castell, A., Magney, T., Wang, L., Hu, L., Rascher, U., Zarco-Tejada, P., Barrett, C. B., Lai, J., Han, J., and Luo, Z.: From remotely-sensed solar-induced chlorophyll fluorescence to ecosystem structure, function, and service: Part II – Harnessing data, Glob. Change Biol., 29, 2893–2925, https://doi.org/10.1111/gcb.16646, 2023b.
Ustin, S. L. and Middleton, E. M.: Current and near-term advances in Earth observation for ecological applications, Ecol. Process., 10, 1–57, https://doi.org/10.1186/s13717-020-00255-4, 2021.
Verma, M., Schimel, D., Evans, B., Frankenberg, C., Beringer, J., Drewry, D. T., Magney, T., Marang, I., Hutley, L., Moore, C., and Eldering, A.: Effect of environmental conditions on the relationship between solar-induced fluorescence and gross primary productivity at an OzFlux grassland site: OCO SIF, MODIS, and GPP, J. Geophys. Res.-Biogeo., 122, 716–733, https://doi.org/10.1002/2016JG003580, 2017.
Wang, N., Suomalainen, J., Bartholomeus, H., Kooistra, L., Masiliūnas, D., and Clevers, J. G. P. W.: Diurnal variation of sun-induced chlorophyll fluorescence of agricultural crops observed from a point-based spectrometer on a UAV, Int. J. Appl. Earth Obs., 96, 102276, https://doi.org/10.1016/j.jag.2020.102276, 2021.
Wang, X., Biederman, J. A., Knowles, J. F., Scott, R. L., Turner, A. J., Dannenberg, M. P., Köhler, P., Frankenberg, C., Litvak, M. E., Flerchinger, G. N., Law, B. E., Kwon, H., Reed, S. C., Parton, W. J., Barron-Gafford, G. A., and Smith, W. K.: Satellite solar-induced chlorophyll fluorescence and near-infrared reflectance capture complementary aspects of dryland vegetation productivity dynamics, Remote Sens. Environ., 270, 112858, https://doi.org/10.1016/j.rse.2021.112858, 2022.
Wood, J. D., Griffis, T. J., Baker, J. M., Frankenberg, C., Verma, M., and Yuen, K.: Multiscale analyses of solar-induced florescence and gross primary production: Multiscale GPP-SIF RELATIONS, Geophys. Res. Lett., 44, 533–541, https://doi.org/10.1002/2016GL070775, 2017.
Xu, S., Atherton, J., Riikonen, A., Zhang, C., Oivukkamäki, J., MacArthur, A., Honkavaara, E., Hakala, T., Koivumäki, N., Liu, Z., and Porcar-Castell, A.: Structural and photosynthetic dynamics mediate the response of SIF to water stress in a potato crop, Remote Sens. Environ., 263, 112555, https://doi.org/10.1016/j.rse.2021.112555, 2021.
Yang, H., Yang, X., Zhang, Y., Heskel, M. A., Lu, X., Munger, J. W., Sun, S., and Tang, J.: Chlorophyll fluorescence tracks seasonal variations of photosynthesis from leaf to canopy in a temperate forest, Glob. Change Biol., 23, 2874–2886, https://doi.org/10.1111/gcb.13590, 2017.
Yang, P. and van der Tol, C.: Linking canopy scattering of far-red sun-induced chlorophyll fluorescence with reflectance, Remote Sens. Environ., 209, 456–467, https://doi.org/10.1016/j.rse.2018.02.029, 2018.
Yang, P., van der Tol, C., Campbell, P. K. E., and Middleton, E. M.: Fluorescence Correction Vegetation Index (FCVI): A physically based reflectance index to separate physiological and non-physiological information in far-red sun-induced chlorophyll fluorescence, Remote Sens. Environ., 240, 111676, https://doi.org/10.1016/j.rse.2020.111676, 2020.
Yazbeck, T., Bohrer, G., Gentine, P., Ye, L., Arriga, N., Bernhofer, C., Blanken, P. D., Desai, A. R., Durden, D., Knohl, A., Kowalska, N., Metzger, S., Mölder, M., Noormets, A., Novick, K., Scott, R. L., Šigut, L., Soudani, K., Ueyama, M., and Varlagin, A.: Site Characteristics Mediate the Relationship Between Forest Productivity and Satellite Measured Solar Induced Fluorescence, Front. For. Glob. Change, 4, 695269, https://doi.org/10.3389/ffgc.2021.695269, 2021.
Zeng, Y., Badgley, G., Dechant, B., Ryu, Y., Chen, M., and Berry, J. A.: A practical approach for estimating the escape ratio of near-infrared solar-induced chlorophyll fluorescence, Remote Sens. Environ., 232, 111209, https://doi.org/10.1016/j.rse.2019.05.028, 2019.
Zeng, Y., Chen, M., Hao, D., Damm, A., Badgley, G., Rascher, U., Johnson, J. E., Dechant, B., Siegmann, B., Ryu, Y., Qiu, H., Krieger, V., Panigada, C., Celesti, M., Miglietta, F., Yang, X., and Berry, J. A.: Combining near-infrared radiance of vegetation and fluorescence spectroscopy to detect effects of abiotic changes and stresses, Remote Sens. Environ., 270, 112856, https://doi.org/10.1016/j.rse.2021.112856, 2022a.
Zeng, Y., Hao, D., Huete, A., Dechant, B., Berry, J., Chen, J. M., Joiner, J., Frankenberg, C., Bond-Lamberty, B., Ryu, Y., Xiao, J., Asrar, G. R., and Chen, M.: Optical vegetation indices for monitoring terrestrial ecosystems globally, Nat. Rev. Earth Environ., 3, 477–493, https://doi.org/10.1038/s43017-022-00298-5, 2022b.
Zhang, Y., Zhang, Q., Liu, L., Zhang, Y., Wang, S., Ju, W., Zhou, G., Zhou, L., Tang, J., Zhu, X., Wang, F., Huang, Y., Zhang, Z., Qiu, B., Zhang, X., Wang, S., Huang, C., Tang, X., and Zhang, J.: ChinaSpec: a Network for Long-term Ground-based Measurements of Solar-induced Fluorescence in China, J. Geophys. Res.-Biogeo., 126, e2020JG006042, https://doi.org/10.1029/2020JG006042, 2021.
Zhang, Z. and Zhang, Y.: Solar angle matters: Diurnal pattern of solar-induced chlorophyll fluorescence from OCO-3 and TROPOMI, Remote Sens. Environ., 285, 113380, https://doi.org/10.1016/j.rse.2022.113380, 2023.
“Télédétection in-situ de la fluorescence chlorophyllienne pour le suivi du fonctionnement carboné des écosystèmes en support à la mission FLEX”