the Creative Commons Attribution 4.0 License.
the Creative Commons Attribution 4.0 License.
 | 17 Jan 2024
A global fuel characteristic model and dataset for wildfire prediction
Joe R. McNorton
Francesca Di Giuseppe
Effective wildfire management and prevention strategies depend on accurate forecasts of fire occurrence and propagation. Fuel load and fuel moisture content are essential variables for forecasting fire occurrence, and whilst existing operational systems incorporate dead fuel moisture content, both live fuel moisture content and fuel load are either approximated or neglected. We propose a mid-complexity model combining data driven and analytical methods to predict fuel characteristics. The model can be integrated into earth system models to provide real-time forecasts and climate records taking advantage of meteorological variables, land surface modelling, and satellite observations. Fuel load and moisture is partitioned into live and dead fuels, including both wood and foliage components. As an example, we have generated a 10-year dataset which is well correlated with independent data and largely explains observed fire activity globally. While dead fuel moisture correlates highest with fire activity, live fuel moisture and load are shown to potentially enhance prediction skill. The use of observation data to inform a dynamical model is a crucial first step toward disentangling the contributing factors of fuel and weather to understand fire evolution globally. This dataset, with high spatiotemporal resolution (∼9 km, daily), is the first of its kind and will be regularly updated.
- Article
(16110 KB) - Full-text XML
-
Supplement
(842 KB) - BibTeX
- EndNote


Landscape fires have wide-ranging consequences for local ecosystems, meteorology, regional air quality, and global atmospheric composition. They occur across various environments, including forests, croplands, and savannahs, where both living and dead vegetation act as fuel sources. Fire behaviour, duration, emissions, and impact on the landscape can vary based on fuel characteristics. Ground fires, fuelled by organic-rich soil such as peat, are associated with below-ground burning (Turetsky et al., 2015). Surface, ladder, and crown fires, fuelled by vegetation at different levels (floor level, mid-level, and canopy level, respectively), represent above-ground burning. The intensity of these fires is influenced by the availability of fuel and its curing state. Consequently, these characteristics have implications for emissions and the injection height of aerosols and trace gases into the atmosphere. In addition, they modify the fire impact on the landscape, affecting the albedo as well as surface heat and moisture fluxes, which results in atmospheric feedbacks. For example, given sufficient fire intensity and suitable atmospheric conditions, pyroconvective clouds may form, a process which is, in part, subject to fuel characteristics (Badlan et al., 2021). The examination and quantification of wildfire impacts is relevant for Earth system models (ESMs). Integrating vegetation fires in ESMs presents numerous challenges relating to the complexity of modelling the temporal evolution of fire spread and the spatial representation of fuel characteristics at a fine scale (<10 km). Such resolutions are not currently resolved by ESMs, either used for weather forecasting (∼10 km) or climate simulations (∼100 km).
To comprehensively model vegetation impact on wildfires several variables must be considered. One such variable is fuel load, which is the total mass of vegetation per unit area and provides the baseline of biomass available. Fuel load can be further partitioned between wood and foliage, both alive and dead. Fuel moisture content of both live (LFMC) and dead (DFMC) vegetation is another key variable, which modulates flammability (Yebra et al., 2013). Both fuel load and moisture content directly influence fire occurrence, intensity, and rate of spread. Fuel moisture content is expressed as the proportion of water relative to the total dry mass of vegetation. LFMC is controlled by various ecophysiological traits and environmental factors affecting transpiration, such as soil moisture and humidity (Castro et al., 2003). DFMC is independent of transpiration and is determined by meteorological factors, including precipitation, solar radiation, as well as fuel composition and structure.
The global monitoring of fuel load and moisture content presents several challenges. Globally, peat fire fuel is difficult to estimate and model in near real time (NRT) given the measurement and process uncertainty (Spawn et al., 2020). Remote sensing techniques can be utilized to estimate the fuel load for above-ground fires (Xiao et al., 2019), although they are limited to sensor coverage in both time and space. Alternatively, fuel can be estimated using land surface models with dynamic vegetation (Thonicke et al., 2010), although similar limitations apply as they are simulated at coarse resolution. Concerning fuel moisture content, recent studies have shown the potential of satellite-based observations in generating high-resolution global LFMC products (Quan et al., 2021; Zhu et al., 2021). Whilst these results are promising, sparse daily coverage limits global NRT estimates required to fully characterize fuel evolution. Satellite-based passive microwave vegetation optical depth (VOD) retrievals can be used to estimate LFMC content with NRT global coverage (Forkel et al., 2023); however, these are provided at a coarse spatial resolution (∼0.25∘) and are likely to be subject to noise from soil moisture and vegetation type. Additionally, VOD provides an estimate of total moisture content, which itself is dependent on total fuel load, further entangling the signal. Modelling efforts to introduce LFMC estimates based on variables such as soil moisture are in development across the community (Rabin et al., 2017).
This paper presents a novel modelling framework that combines satellite observations and numerical weather prediction simulations to infer fuel load and fuel moisture content. The framework is integrated into the operational system of the European Centre for Medium-Range Weather Forecasts (ECMWF) and aims to provide real-time estimations of fuel characteristics, enabling the assessment of landscape flammability daily, or even subdaily (Fig. 1). The model represents an initial step in categorizing above-ground fuel load and moisture, providing a foundation for diagnosing landscape fire disturbance in an operational weather forecasting system and to generate a long-term record of these essential climate variables. The framework includes foliage and wood fuel load, including both alive and dead components, as well as LFMC and DFMC. The output provides information on fuel evolution and fire danger, acting as the first step toward developing a global mid-complexity fire rate-of-spread model. Additionally, the model output could be used for modelling other land surface processes, such as trace gas fluxes or biochemical soil properties, with the future aim of achieving full dynamical coupling of fires between the land surface and atmosphere.
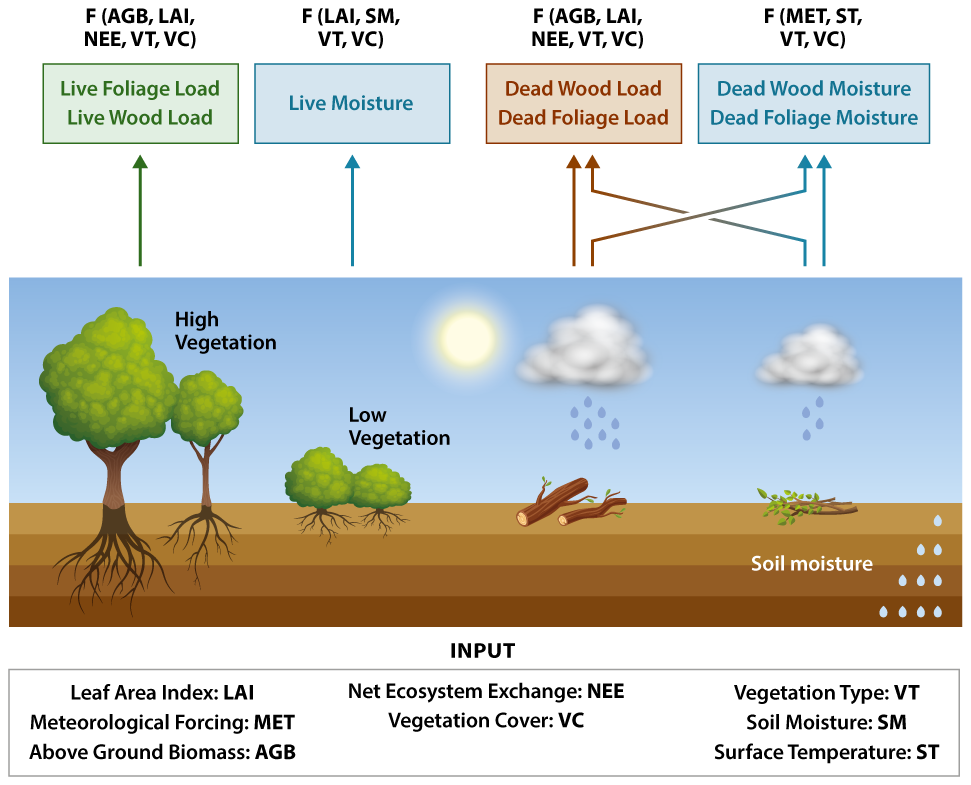
Figure 1A schematic of the fuel characteristic model showing the required input data and the dependencies for the output variables.
To assess the operational capability of the model and evaluate performance in simulating fuel characteristics relative to observed fire activities globally, the model was retrospectively run for the period from 2010 to 2019. The resulting dataset, available daily at a global scale with a horizontal resolution of ∼9 km, can be used for research throughout the fire community and beyond. The second and third sections of the paper detail the calculation and categorization of fuel load and moisture, followed by independent validation of each component. The final two sections establish relationships between the dataset and active fire observations while defining thresholds for active fire conditions.
2.1 Fuel load model
Various methods can be employed to estimate above-ground biomass (AGB), which represents the above-ground component of the total fuel load. Dynamic global vegetation models (DGVMs) offer the advantage of providing AGB estimates with high temporal resolution using atmospheric forcing and surface variables. However, these models often lack consensus at fine spatial resolutions and fail to account for the impact of human-induced disturbances on the landscape (Yang et al., 2020). Satellite-based and even in situ AGB estimates could provide AGB information for fire forecasting. However, existing datasets typically suffer from limited coverage, and those that do provide global coverage are not readily available in near real time (NRT) or lack the high temporal resolution necessary for accurate fire forecasting (e.g. Santoro and Cartus, 2021).
In this study, we have integrated satellite-derived AGB data with modelled net ecosystem exchange (NEE) to estimate daily above-ground fuel load at a horizontal resolution of approximately 9 km for the period from 2010 to 2019. The initial AGB estimate for 2010 was obtained from the ESA Biomass Climate Change Initiative (ESA-CCI) version 3 dataset (Santoro and Cartus, 2021). This dataset combines synthetic aperture radar (SAR) backscatter observations from Envisat ASAR and ALOS-1 PALSAR-1 satellites. Using the BIOMASAR algorithm, the dataset relates forest backscatter to canopy density and height, which is then used to infer live AGB globally for 2010 at 100 m horizontal resolution as a static map (Santoro et al., 2021).
To update AGB over time, we incorporated NEE data generated by the ECLand land surface model (Boussetta et al., 2021) forced by ERA-5 meteorology (Hersbach et al., 2020). ECLand represents the surface component of the operational Integrated Forecasting System (IFS) model employed by ECMWF. The model simulations ran from 2010 to 2019, producing daily NEE output at a horizontal resolution of Tco2559 (approximately 4.4 km). Model NEE was derived using the A-gs scheme, which depends on meteorological and land surface variables (e.g. temperature and soil moisture), as well as plant-specific physiological traits (Boussetta et al., 2013).
As model NEE is prone to biases, the operational Copernicus Atmosphere Monitoring Service, which provides atmospheric CO2 forecasts (Agustí-Panareda et al., 2019), employs an online bias correction scheme. This approach involves applying scaling factors to model NEE values based on a climatology of optimized fluxes derived from atmospheric inversions (Chevallier et al., 2010; Agustí-Panareda et al., 2016). Here instead we bias corrected the NEE based on differences between the 2018 and 2010 ESA-CCI product following the recommended guidelines (Santoro et al., 2021). This resulted in our average AGB values for 2010 and 2018 being equivalent to the ESA-CCI product but with the inclusion of daily variability. Moreover, this correction accounts for the additional non-carbon component of biomass variability, which is absent in the ECLand model.
The modelled AGB, representing the fuel load, was further subdivided into foliage and wood mass, considering both alive and dead components as these are considered relevant for fire modelling methodologies. To accomplish this, we initially obtained a static estimation of the live-to-dead mass ratio for each of the 20 vegetation types defined in the ECLand model. These ratios were based on literature estimates (Table S1 in the Supplement). Each ∼9 km grid cell consisted of low and high vegetation fractions, which were used to derive the grid-cell-specific ratio. The dead fraction was subsequently divided between foliage and wood based on a fixed percentage (DFP) per vegetation type (Table S1), which remained constant over time.
The allocation of live mass to foliage (TFlive) varied temporally and was determined using vegetation-specific leaf mass per unit area (LMA) and observed leaf area index (LAI) following the methodology described by Harper et al. (2016). We updated this approach to suit the vegetation types used in the ECLand model. Our definition of live foliage includes leaf mass only, while dead foliage includes small branches for the purpose of the fuel moisture model. LAI observations, aggregated to the model horizontal resolution, were taken from the CONFESS dataset, which provides 1 km monthly global LAI (Boussetta and Balsamo, 2021).
The temporal variability in live wood mass (TWlive), which is a representation of seasonal short-lived wood mass (e.g. twigs), was determined as being proportional to LAI using the power law relationship proposed by Enquist et al. (1998) and vegetation-specific coefficients provided by Eq. (4) in Harper et al. (2018). The remaining component of live wood (SWlive), which is a representation of long-lived wood mass which remains regardless of LAI state (e.g. trunk), was assumed to be constant over time, preserving the live-to-dead fuel load ratio (L:D) when averaged over the entire time series (Eq. 1). Consequently, for any given time, the fuel load of live foliage and wood can be calculated, while the dead foliage (TFdead) and wood (TWdead) are obtained as the residuals based on Eqs. (2) and (3), respectively:
The majority of total fuel load was allocated to SWlive with relatively little seasonal variability in live wood mass, TWlive, particularly in low latitude regions. The LAI dependence resulted in an increased fraction of live mass during the growing season, with relative increases largest in foliage but absolute increases largest in wood (Fig. 2).
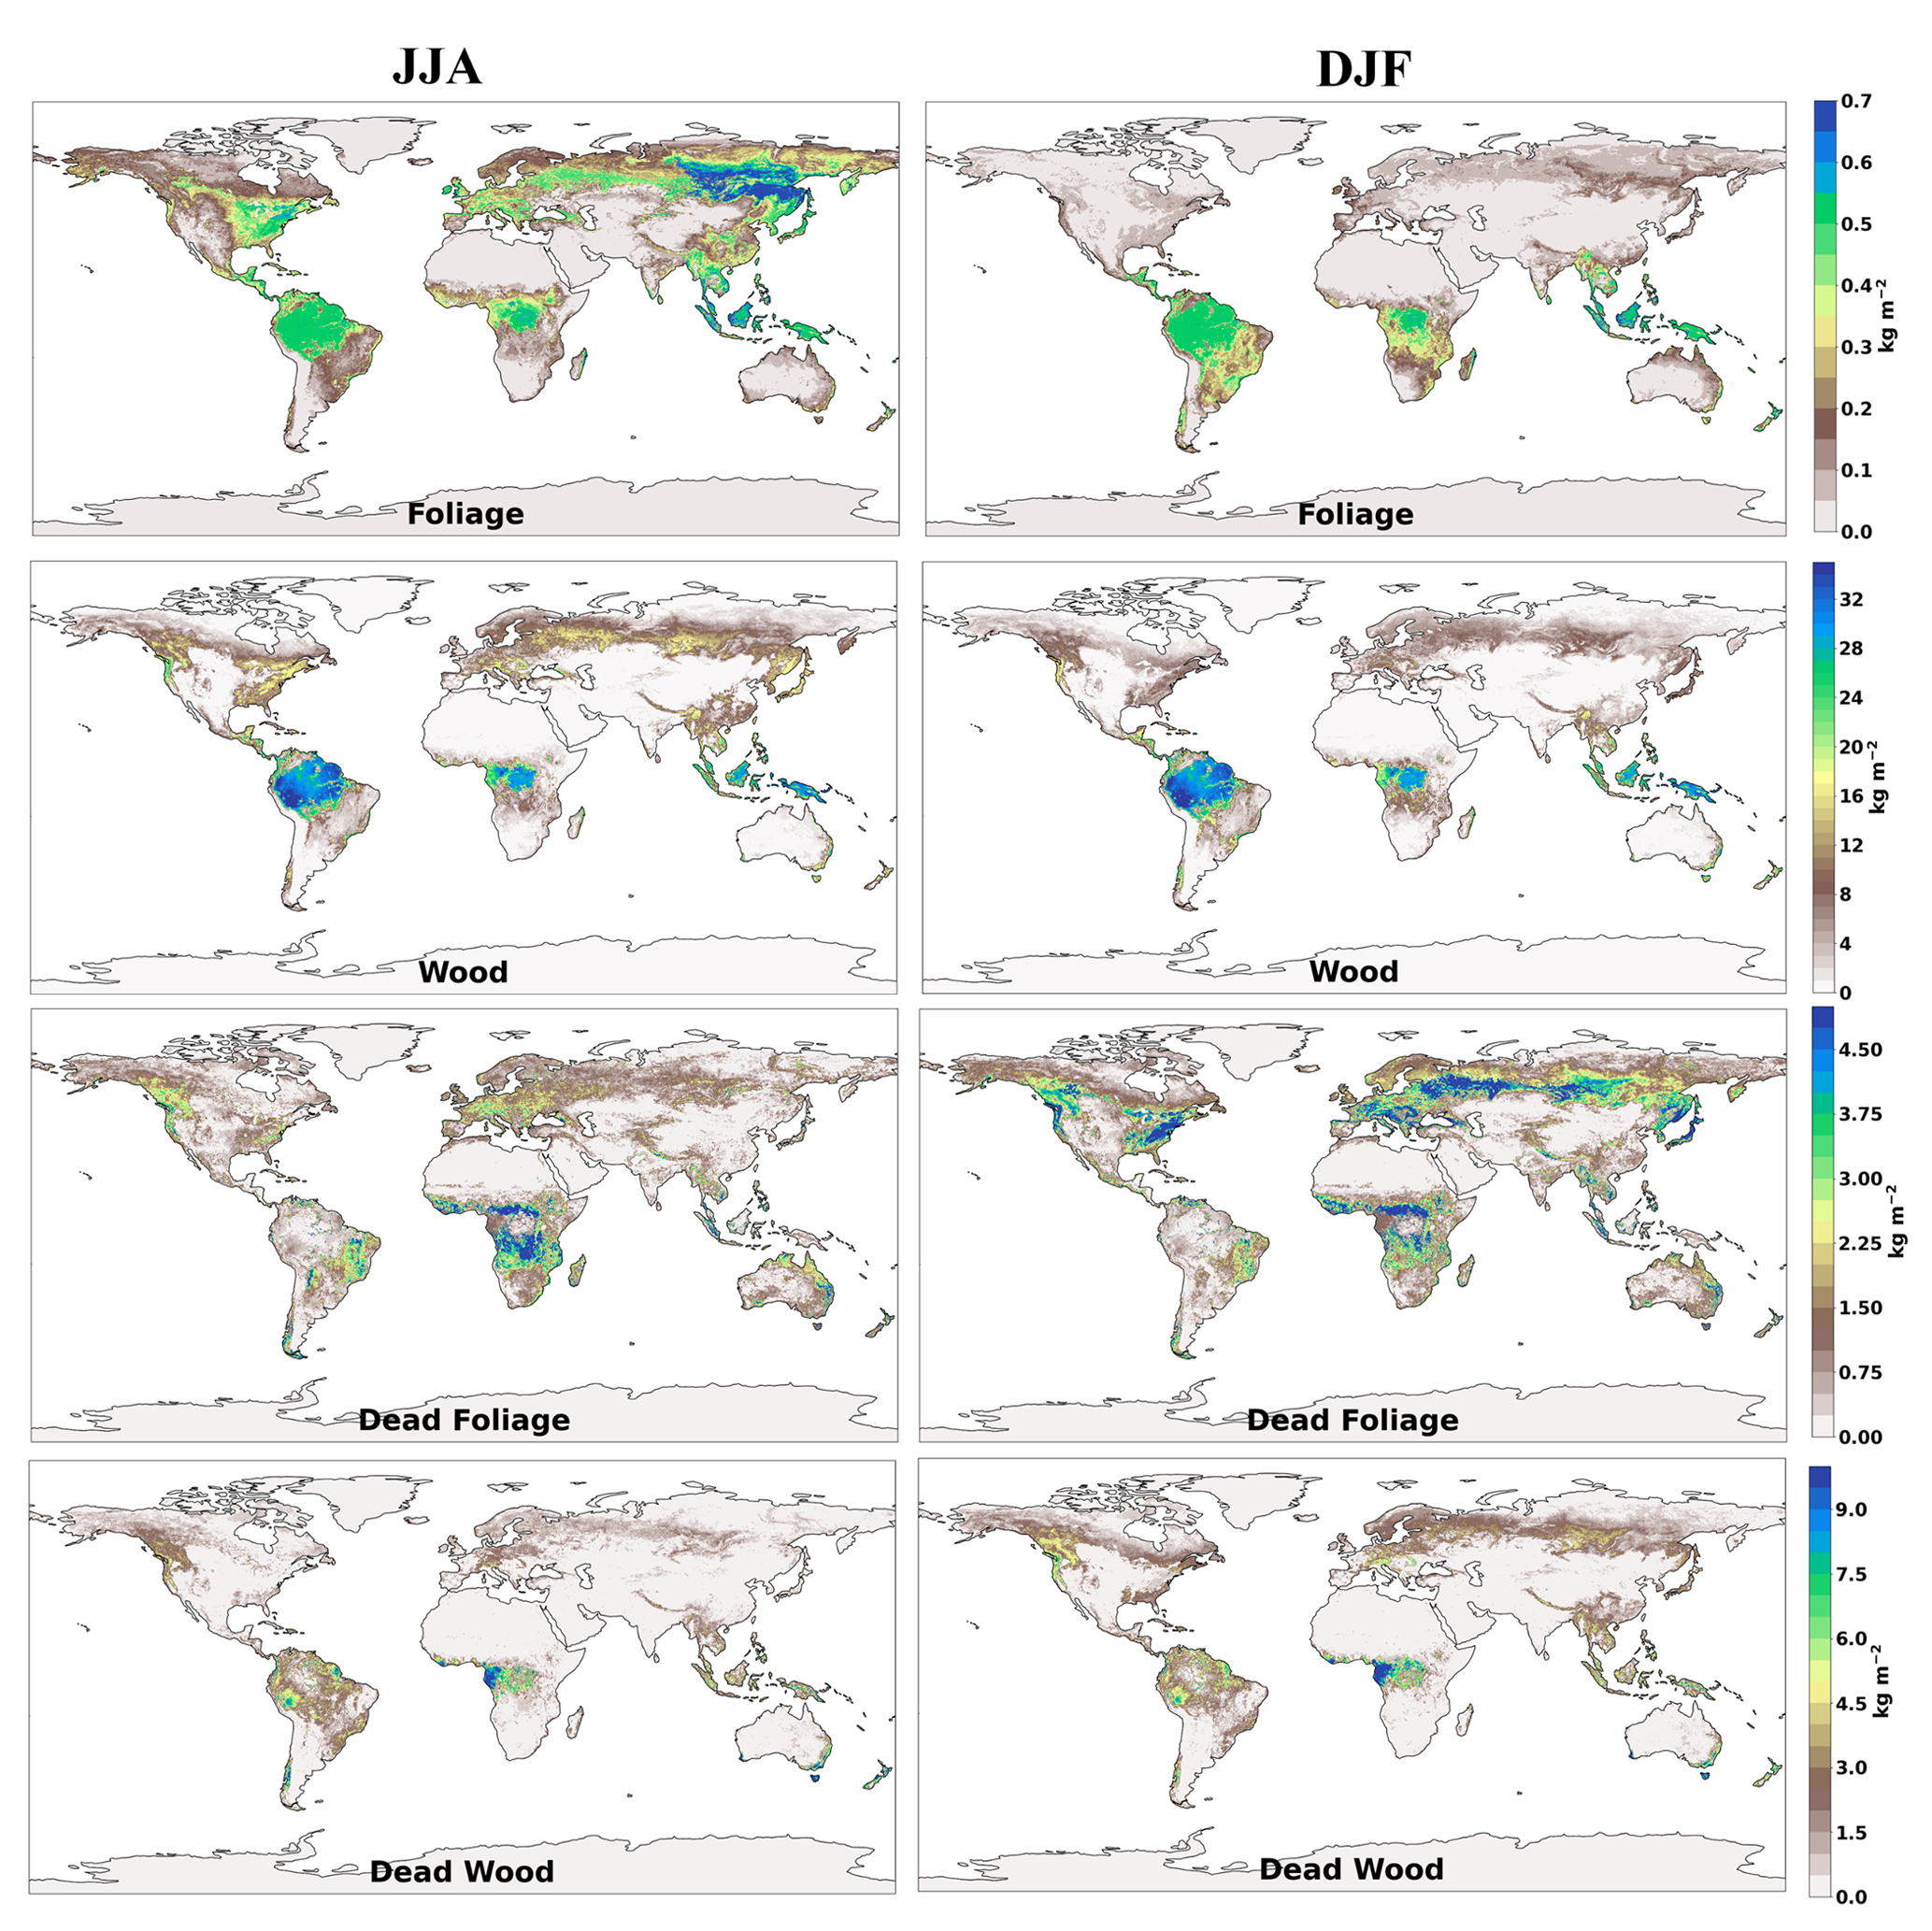
Figure 2Global fuel load (in kilograms per square metre) for June, July, and August (JJA; left column) and December, January, and February (DJF; right column) averaged between 2010 and 2019. The fuel is categorized into live foliage (top row) and wood (second row), and dead foliage (third row), and wood (bottom row).
The allocation of fuel load based on region and fuel type (see Fig. 3 and Table 1) demonstrated the anticipated seasonal shifts between live and dead fuel load in the boreal region. During winter months, up to 50 % of the fuel load consisted of dead fuel, decreasing to approximately 10 % during summer months. A similar yet narrower range in the dead fuel fraction was observed in temperate regions (17 %–41 %), while in tropical regions, the dead fraction constituted only 11 %–17 % of the total fuel load. On average, globally, dead fuel accounted for 22 % of the total fuel load, with an approximately equal distribution between foliage and wood. The remaining mass comprises 2 % living leaf matter and 76 % living wood. These findings agree with a recent study by van Wees et al. (2022), which estimated that litter made up approximately 21 % of the above-ground fuel load. Furthermore, they also found an approximately equal split between foliage and wood.
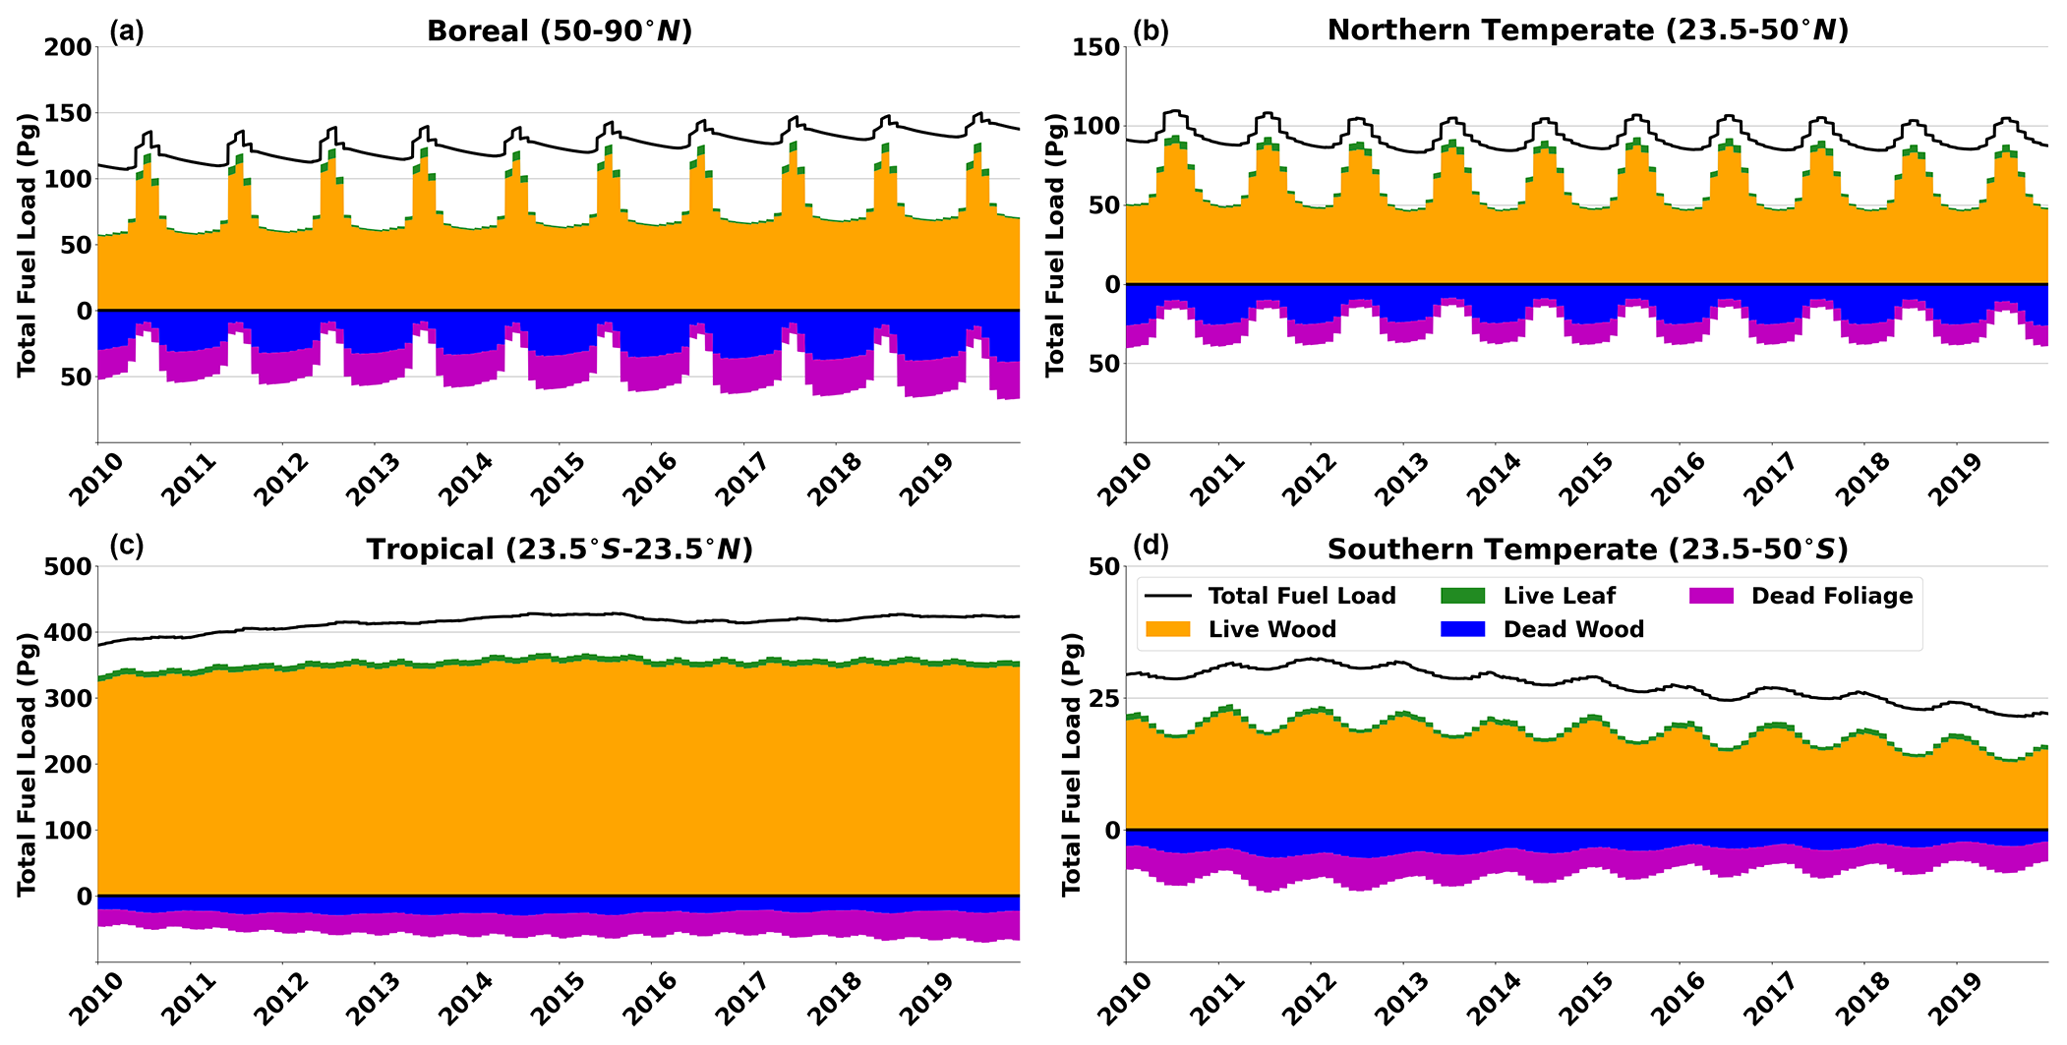
Figure 3Daily time series of area summed fuel total load between 2010 and 2019 for the boreal (a), northern temperate (b), tropical (c), and southern temperate (d) regions (black line). Also shown are the live leaf (green), live wood (orange), dead foliage (purple), and dead wood (blue) components of fuel load.
Table 1Area summed categorized and total fuel loads for four regions and globally averaged between 2010 and 2019 in petagrams (Pg) with the standard deviation across all times. Also included is the average yearly trend for each region and globally in petagrams per year.
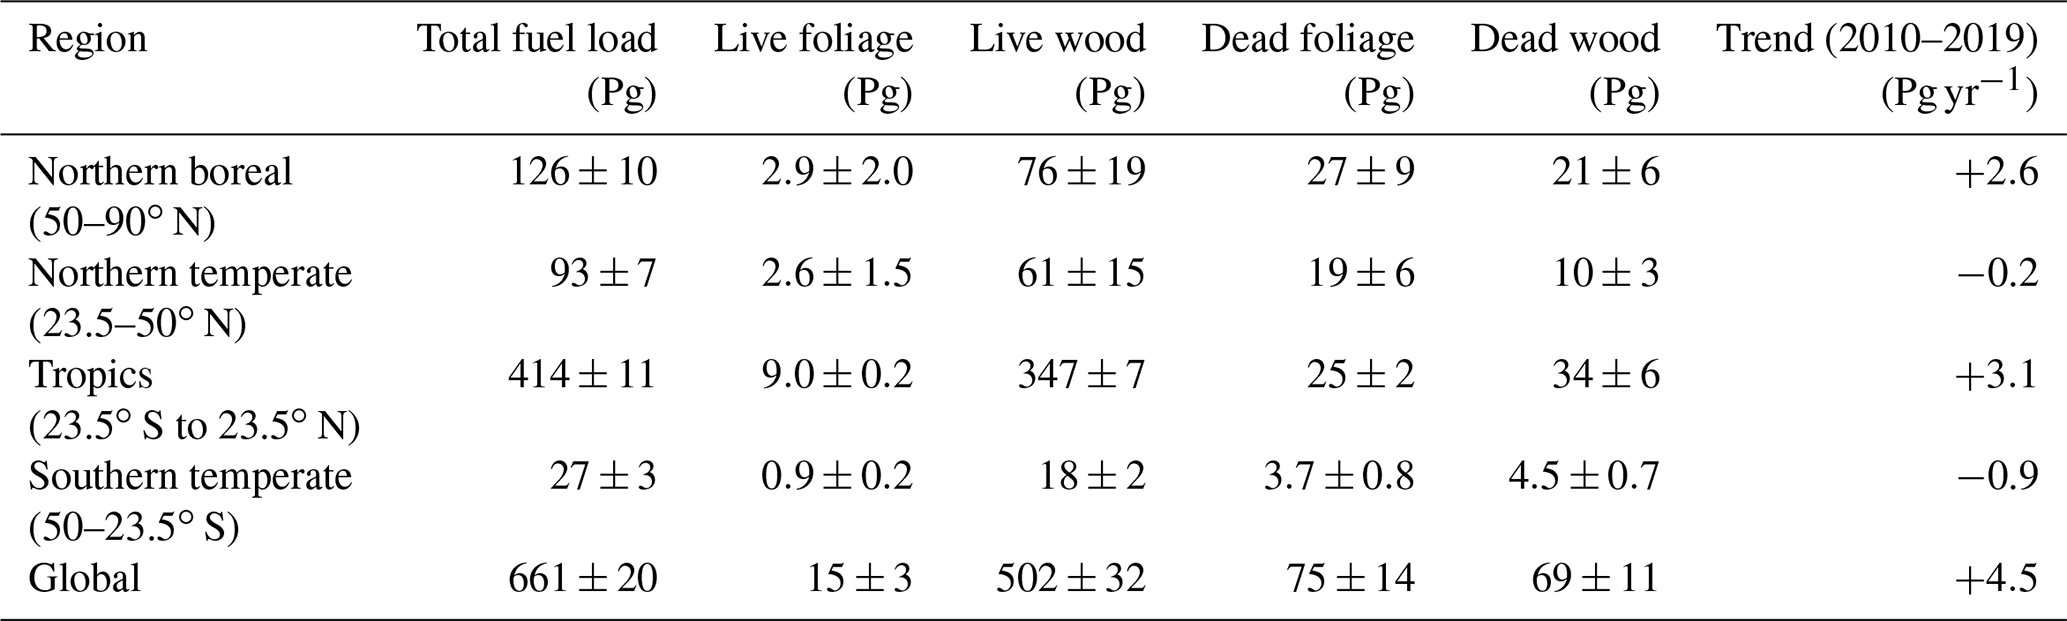
Tropical regions contain the largest proportion of the total fuel load, accounting for 414 ± 11 Pg or 63 %, aligning with previous findings (e.g. Pan et al., 2011; Erb et al., 2018). In comparison, the temperate (120 ± 7 Pg or 18 %) and boreal (126 ± 10 Pg or 19 %) regions exhibit similar fuel loads, with a higher proportion attributed to dead mass.
Analysis reveals a positive 10-year trend in fuel load (2010–2019), with an overall increase of +4.5 Pg yr−1. The tropics (+3.1 Pg yr−1) and boreal (+2.6 Pg yr−1) regions contribute significantly to this trend. A small negative trend is found in the northern (−0.2 Pg yr−1) and southern (−0.9 Pg yr−1) temperate regions. The southern temperate region exhibits a relatively large negative trend of −3 % yr−1. These findings, specifically the negative trend in southern temperate AGB, align with the spatial distribution of the trend observed previously (Xu et al., 2023).
Whilst fuel load data presented here is at ∼9 km daily resolution, ECland permits finer spatiotemporal resolution. Given the coarse resolution forcing data and the variability in vegetation mass, this is not considered here. It should be noted that LAI is updated monthly, resulting in a step change in fuel load allocation, whilst variability in total fuel load within a given month is driven by the model.
2.2 Validation of fuel load
Model fuel load was validated against various regional datasets that were independent of our calibration data, although some techniques and observations used to estimate above-ground biomass (AGB) were similar (Fig. 4; Table S2). Mauro et al. (2021) used random forest models which utilized observations including airborne laser scanning data between 2008 and 2016 to estimate above-ground live forest biomass in Oregon, USA, at 30 m resolution as a static map. When combining the live wood and foliage estimates from our study for the same region and averaging over the 2010–2016 period, a comparative analysis reveals reasonably consistent results in terms of total living above-ground biomass. Specifically, Mauro et al. (2021) reported a value of 2.14 Pg, while our study found a slightly lower estimate of 1.88 ± 0.05 Pg.
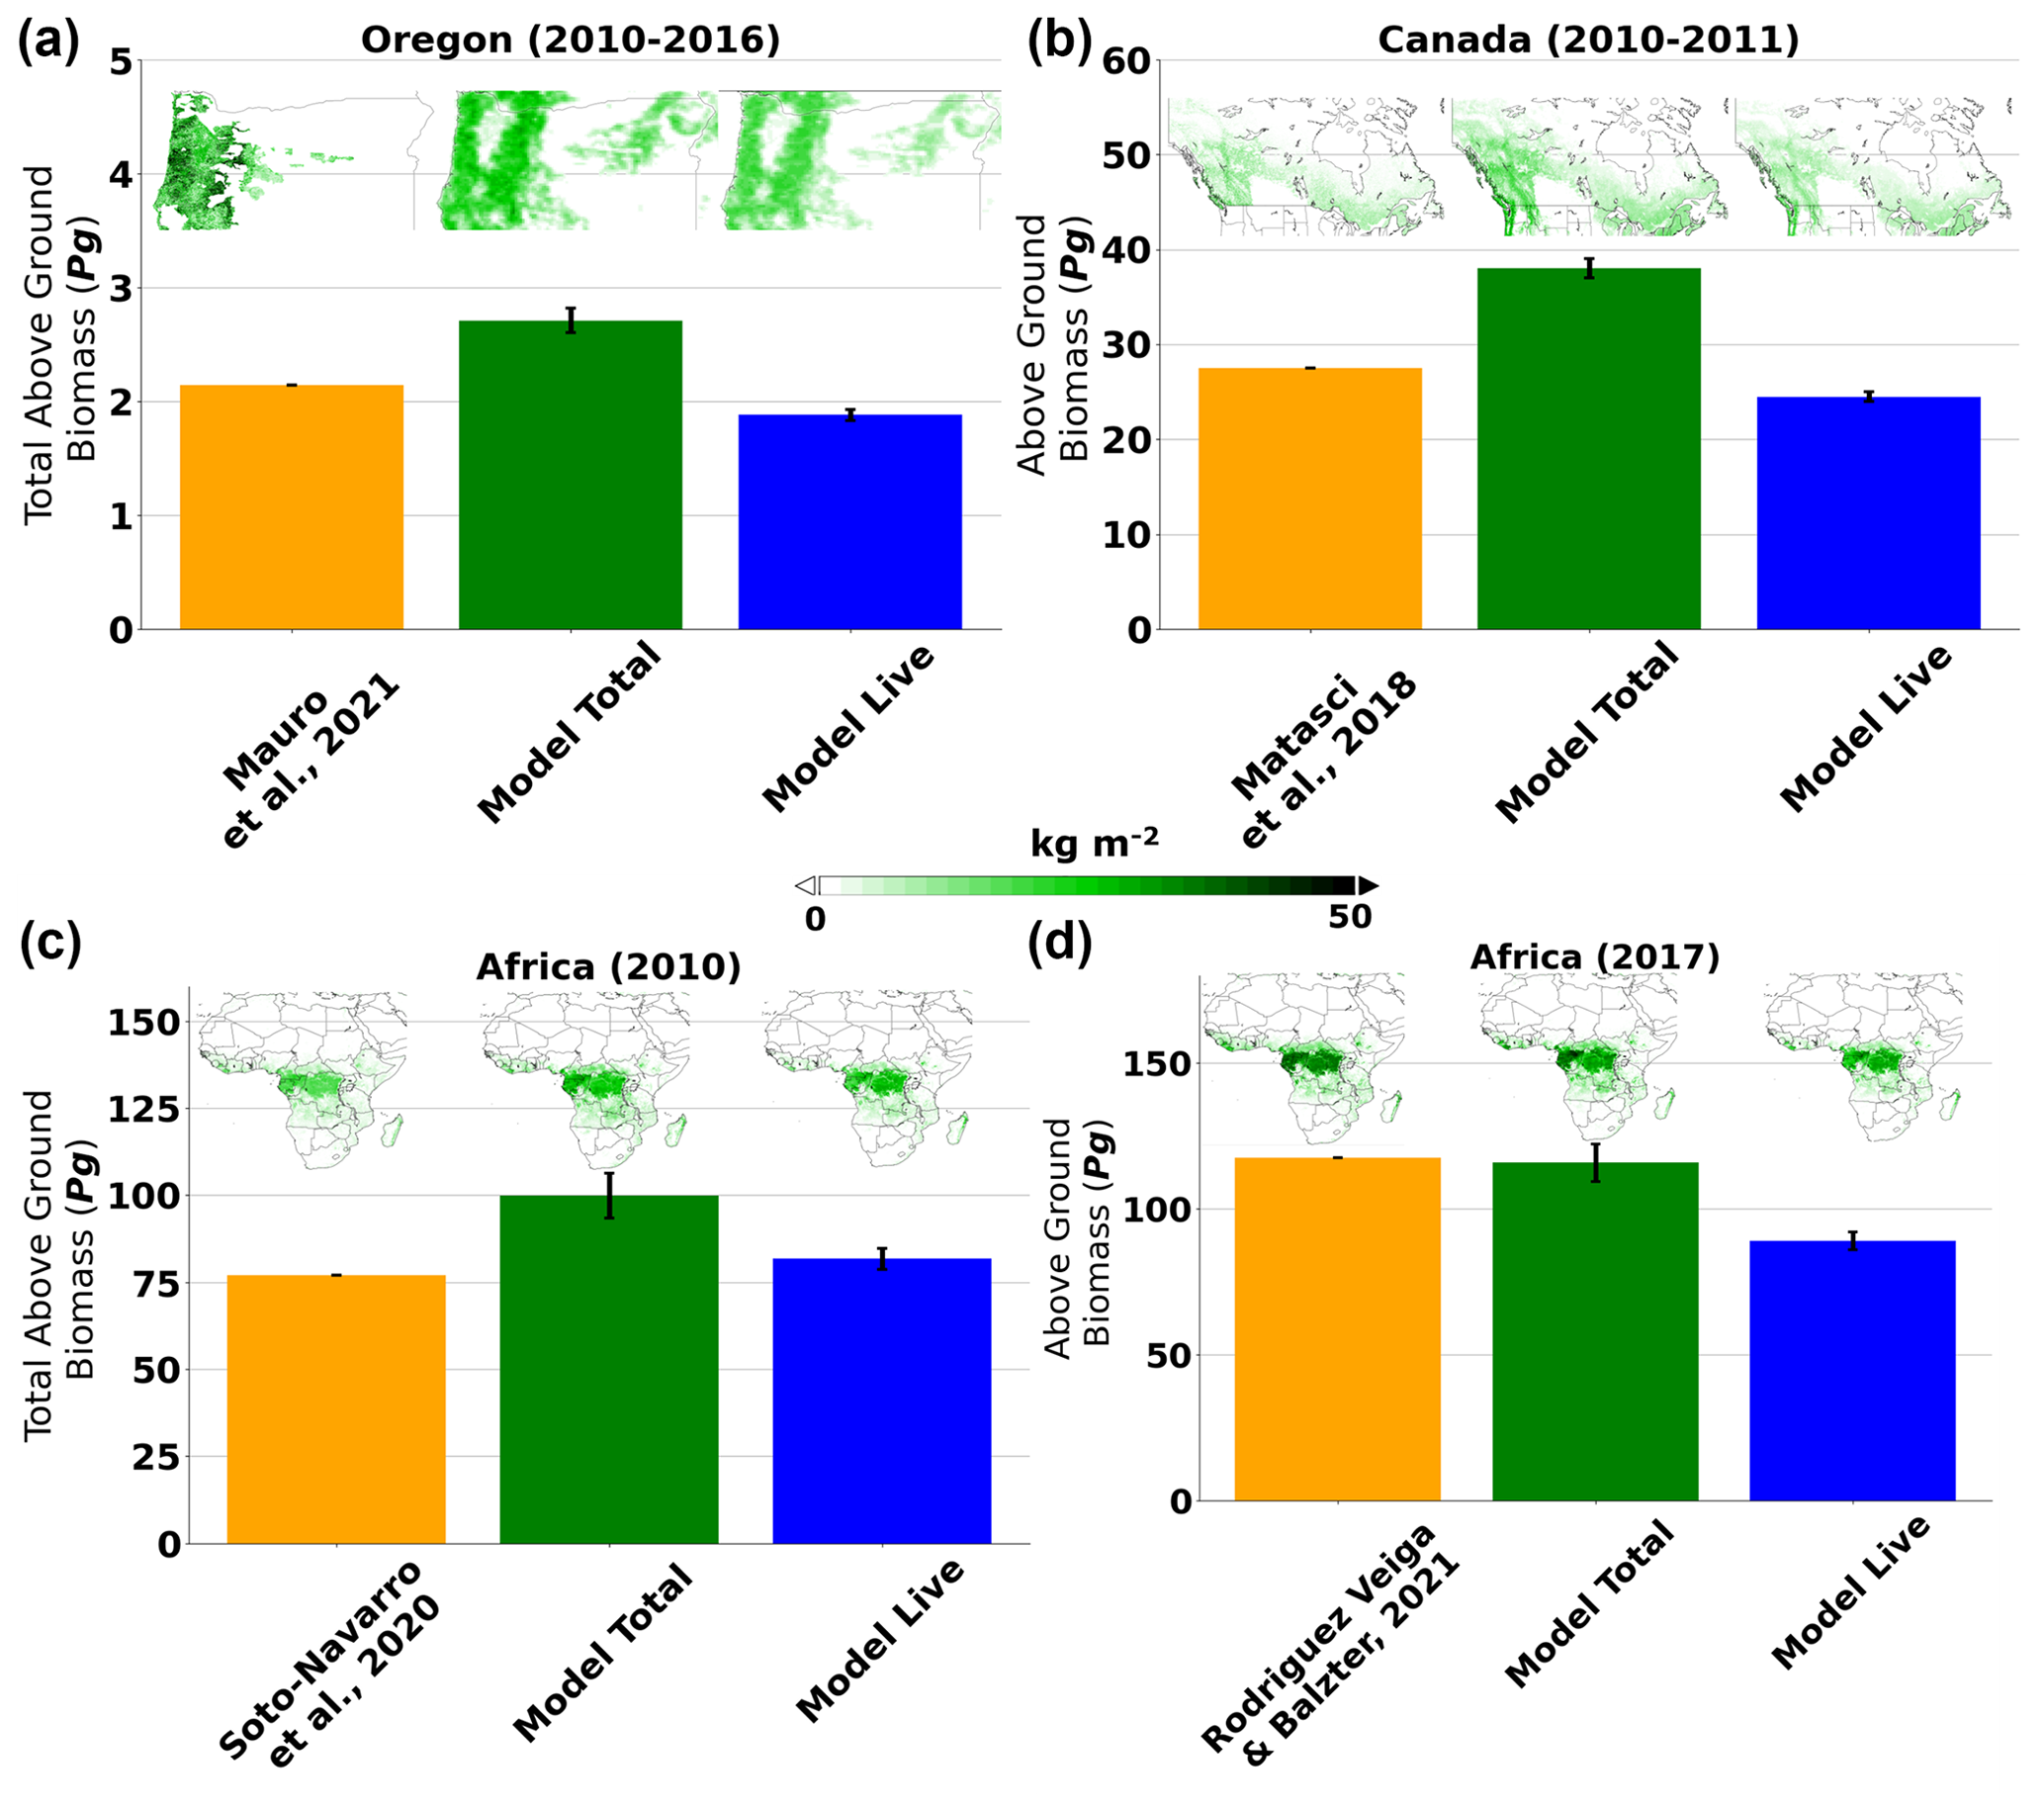
Figure 4Comparison of observation derived and modelled above-ground biomass for Oregon, USA (a), Canada (b), and Africa (c, d), including ∼9 km spatial distribution maps and standard deviation error bars. The values are computed as yearly or multi-year averages and the live component of model biomass is also shown.
Matasci et al. (2018) employed a combination of lidar and Landsat observation data, along with a random forest-based distance metric, to generate forest biomass estimates for Canada at a resolution of 30 m, spanning the period from 1985 to 2011. Although their focus was primarily on the estimation of biomass in living forested regions, the methodology utilized is sensitive to some extent to dead material. The living fuel load presented here for 2010–2011 (24.5 Pg) shows an expected slight underestimate when compared with their findings (27.5 Pg). However, it is important to note that our total estimated fuel load (38.0 Pg) is significantly higher, as it encompasses all above-ground dead fuel in addition to the living fuel load.
For further validation, we utilized two separate estimates of African biomass: one from 2010 by Soto-Navarro et al. (2020) and another from 2017 by Rodriguez Veiga and Balzter (2021). Soto-Navarro et al. (2020) employed the same ESA-CCI product for 2010 as used in this study. However, their dataset includes a savannah and woodland biomass product specific to Africa, derived from an L-band PALSAR mosaic dataset provided by JAXA at a resolution of 25 m (Bouvet et al., 2018). They also incorporated below-ground biomass information and their study reports above-ground carbon biomass rather than total fuel load, which they approximate to be half the total dry mass. Consequently, comparing the two products may not be entirely appropriate as they estimate different quantities. Their value for above- and below-ground carbon biomass (77.1 Pg) for Africa for 2010 is slightly lower than the above-ground live total fuel load found here (81.8 Pg), but the spatial distributions agree.
Rodriguez Veiga and Balzter (2021) employed a comprehensive approach, integrating lidar, synthetic aperture radar (SAR), and optical-based data to estimate above-ground biomass across Africa for 2017. Their estimation (117.5 Pg), provided at a resolution of 100 m, is comparable to our combined live and dead fuel load (115.9 Pg) for 2017, although our live fraction is noticeably lower (89.0 Pg). Overall, the model agreement across the four independent datasets evaluated suggests the model produces an accurate estimation of fuel load.
The dead fuel load and the ratio of live-to-dead fuel is difficult to validate given the lack of global observations. We performed site-specific evaluation of our estimated dead fuel and ratios using field measurements compiled by van Wees et al. (2022). The observation database includes estimates of total leaf, grass, stem, dead wood, and dead fine fuel load. By subsampling the dataset where all or some of these variables were available, we evaluated our modelled data against 202 data points between 2010 and 2019 (Fig. S1 in the Supplement). Given that the observations are site specific and model resolution is at a relatively coarse ∼9 km resolution, the representation error caused by the failure of the model to capture subgrid heterogeneity was expected to be large. Furthermore, modelled values were expected to be larger than observations as the estimated quantities differ, the observations represent the total carbon per unit area, whilst the model estimates the total fuel load. Despite these differences, the model provides reasonable agreement with observed total fuel load (R: 0.43) with the expected positive bias. For live load and dead fuel load specifically, there is also some agreement (R: 0.39 for both). The ratio of live-to-dead fuel load provides an R value of 0.53. Whilst these values show that the model does not provide perfect agreement with observations, we consider the results to be encouraging considering the expected considerable representation error.
Fuel state, in addition to quantity, is a key component for modelling fire danger and risk. This includes, amongst other things, fuel arrangement, structure, and moisture content. Here we focus on a model derived moisture content for both live and dead fuel, with DFMC further subdivided between foliage and wood. An estimation for LFMC is possible from satellite sensors (Quan et al., 2021; Zhu et al., 2021); however data are not available in NRT and often have gaps. Vegetation optical depth from passive microwave satellite retrievals can provide an estimation of absolute LFMC (Forkel et al., 2023). However, to derive the relative LFMC the signal must be separated from the vegetation mass. For example, a high VOD value could indicate either a high fuel load with a moderate moisture content or a moderate fuel load with a high moisture content. Alternatively, more accurate in situ measurements are available (e.g. Yebra et al., 2019); however, these represent local values typically obtained using destructive sampling and as such are not suitable at the global scale.
3.1 Live fuel moisture content model
To estimate daily LFMC from 2010 to 2019 at ∼9 km we used a semi-empirical model based on key variables determined using a random forest regression (Fig. S2). A semi-empirical approach was opted for as it provided a physical constraint on the modelled LFMC, which was required as the modelled LFMC range was not fully represented by the training data. Furthermore, the evaluation of the optimized models against independent LFMC observations showed only a minor improvement when using a random forest approach.
The model was trained on Globe-LFMC data based on in situ destructive sampling measurements (Yebra et al., 2019). The data were taken from 1383 sampling sites in 11 countries and represents a range of vegetation types. Measurements typically involve weighing the vegetation, drying the vegetation, and then re-weighing it to determine the moisture fraction. To avoid sampling noise generated from the considerable variability in observed LFMC, we averaged observations for specific sites into monthly bins between 2010 and 2018, resulting in 25 410 samples. The spatial representation error was expected to be considerable as observations are point specific for an induvial plant, whereas the model is sampled at 9 km horizontal resolution, thus limiting the success of the model.
Subsampling of Globe-LFMC data permitted seven vegetation-specific parameter optimizations to be performed. The ECLand equivalent of these are crops, short grass, evergreen needleleaf trees, deciduous broadleaf trees, mixed crops/grassland, deciduous shrubs, and broadleaf savannah, whilst the remaining vegetation types used the coefficients of their most closely associated type from those seven. LAI values, previously described from the CONFESS dataset at 9 km monthly resolution, were used in the optimization as well as monthly 9 km four-layer soil moisture taken from ERA5-Land (Muñoz-Sabater et al., 2021). Vegetation-specific layer-weighted soil moisture (SM) values were then calculated based on the fractional root distribution per layer, taken from ECLand approximations (Boussetta et al., 2021).
Model parameters were optimized using the trust-region reflective algorithm based on the assumption that LFMC varies with soil moisture and LAI following an asymptotic regression (Eq. 4), by which we assume that as soil moisture and LAI increase, so too does LFMC at a decreasing rate from a minimum LFMC, LFMCmax−A, up to a maximum LFMC, LFMCmax. We consider the independent contribution from soil moisture and LAI as well as their combined influence on LFMC. In a generalized approach we consider the dormant stages of vegetation to be represented by the coefficient α, the vegetation resistance to draught conditions by β, and the growth phase by γ. The resulting vegetation-specific model coefficients for LFMC is presented in Table S3. As vegetation cover in ECLand is given as low or high, we provide the values of both components and the combined values in the dataset:
The optimized parameters provide reasonable agreement with Globe-LFMC for most vegetation types, R=0.36–0.72, except for crops, R=0.24 (Fig. S3). This is expected given that irrigation is not considered by ECLand resulting in inaccurate crop soil moisture. The dependency on LAI and soil moisture varies between vegetation type, with soil moisture values between 0.1 and 0.2 typically representing a noticeable drop-off in LFMC toward a fire prone state (Fig. 5). All vegetation types are sensitive to soil moisture changes, whilst only some are sensitive to a combination of LAI and soil moisture (short grass, evergreen needleleaf, deciduous broadleaf, and deciduous shrubs). The maximum LFMC in forested areas is lower than that of grasslands and shrublands, which is expected given that a large fraction of biomass is allocated to the relatively dry wood in forested regions.
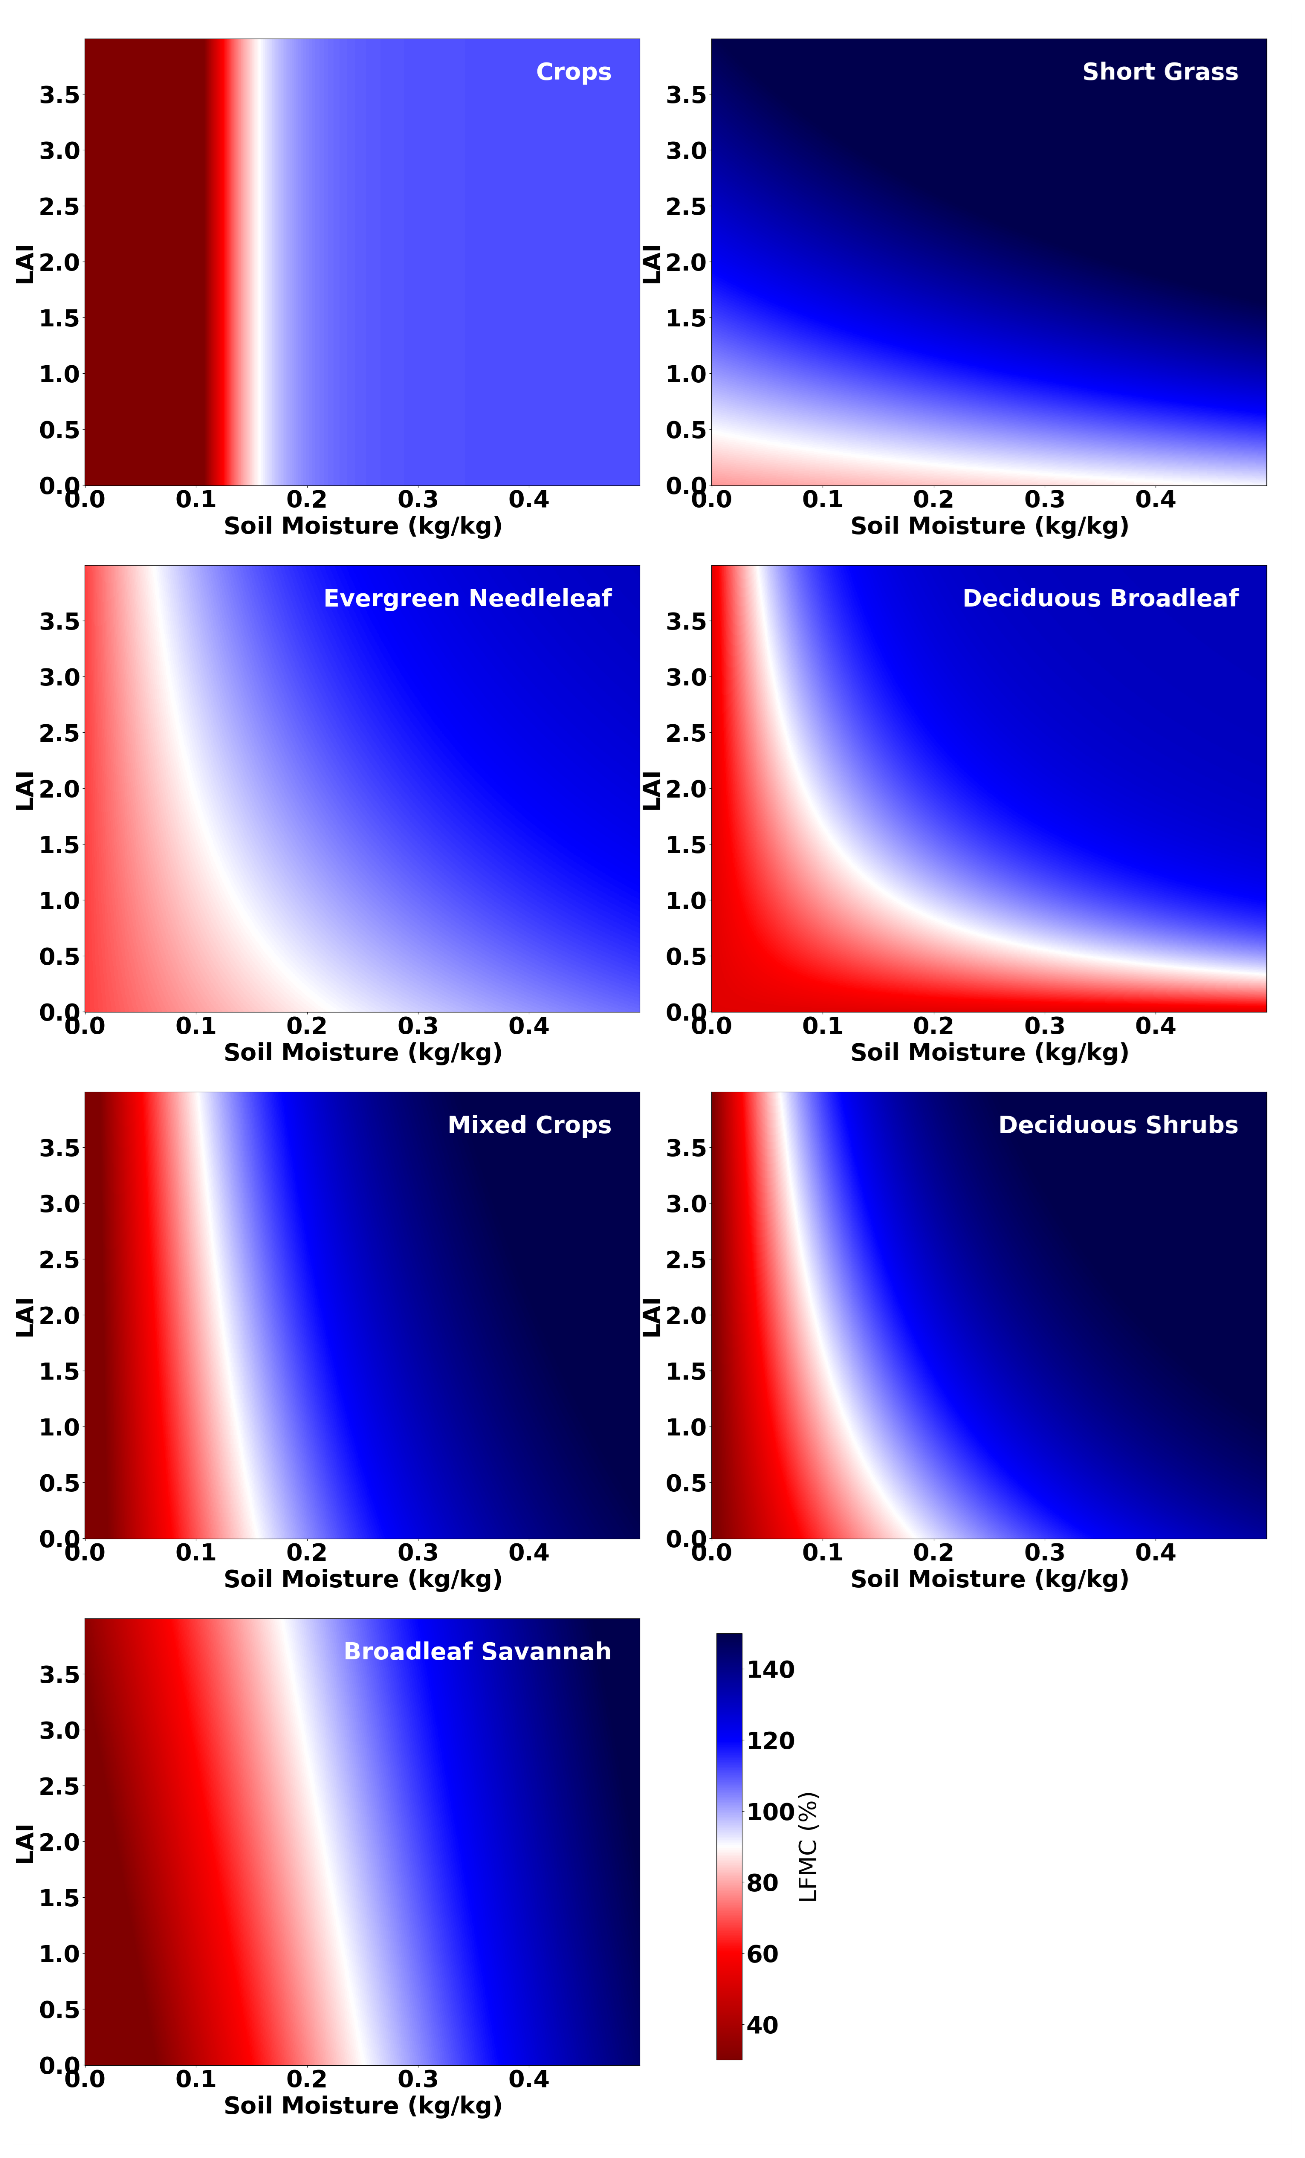
Figure 5Modelled live fuel moisture content as a function of soil moisture and LAI for seven different vegetation types.
3.2 Live fuel moisture content validation
Model LFMC was validated against estimates obtained by combining retrievals from the Moderate Resolution Imaging Spectroradiometer (MODIS) with radiative transfer model (RTM) inversion techniques (Quan et al., 2021). Their method to estimate daily LFMC at 500 m resolution involved generating look-up tables based on RTM simulations considering three land cover classes: forest, grassland, and shrubland. They provide data at 8 d intervals including all dates relevant to this study (2010–2019). Given the spatiotemporal resolution of both datasets for comparison, they were averaged to monthly 9 km resolution.
There is generally a good spatial agreement between the two products, with well-known fire prone regions, such as the western USA, African savannahs, or Australian shrubland, showing relatively low LFMC values in both datasets (Fig. 6). Tropical forests are drier in the MODIS dataset, whilst boreal regions are moister, relative to our dataset. Differences in land cover classification between datasets could explain some of these differences. The most noticeable difference is the range in values. When considering values above 30 %, which we assume as a threshold for live fuel, the MODIS derived mean (134 % ± 70 %) is considerably larger than our findings (112 % ± 20 %), with a larger variability. Our average value and variability compare well with the Globe-LFMC dataset (108 % ± 36 %), although that dataset is not necessarily representative of a global value.
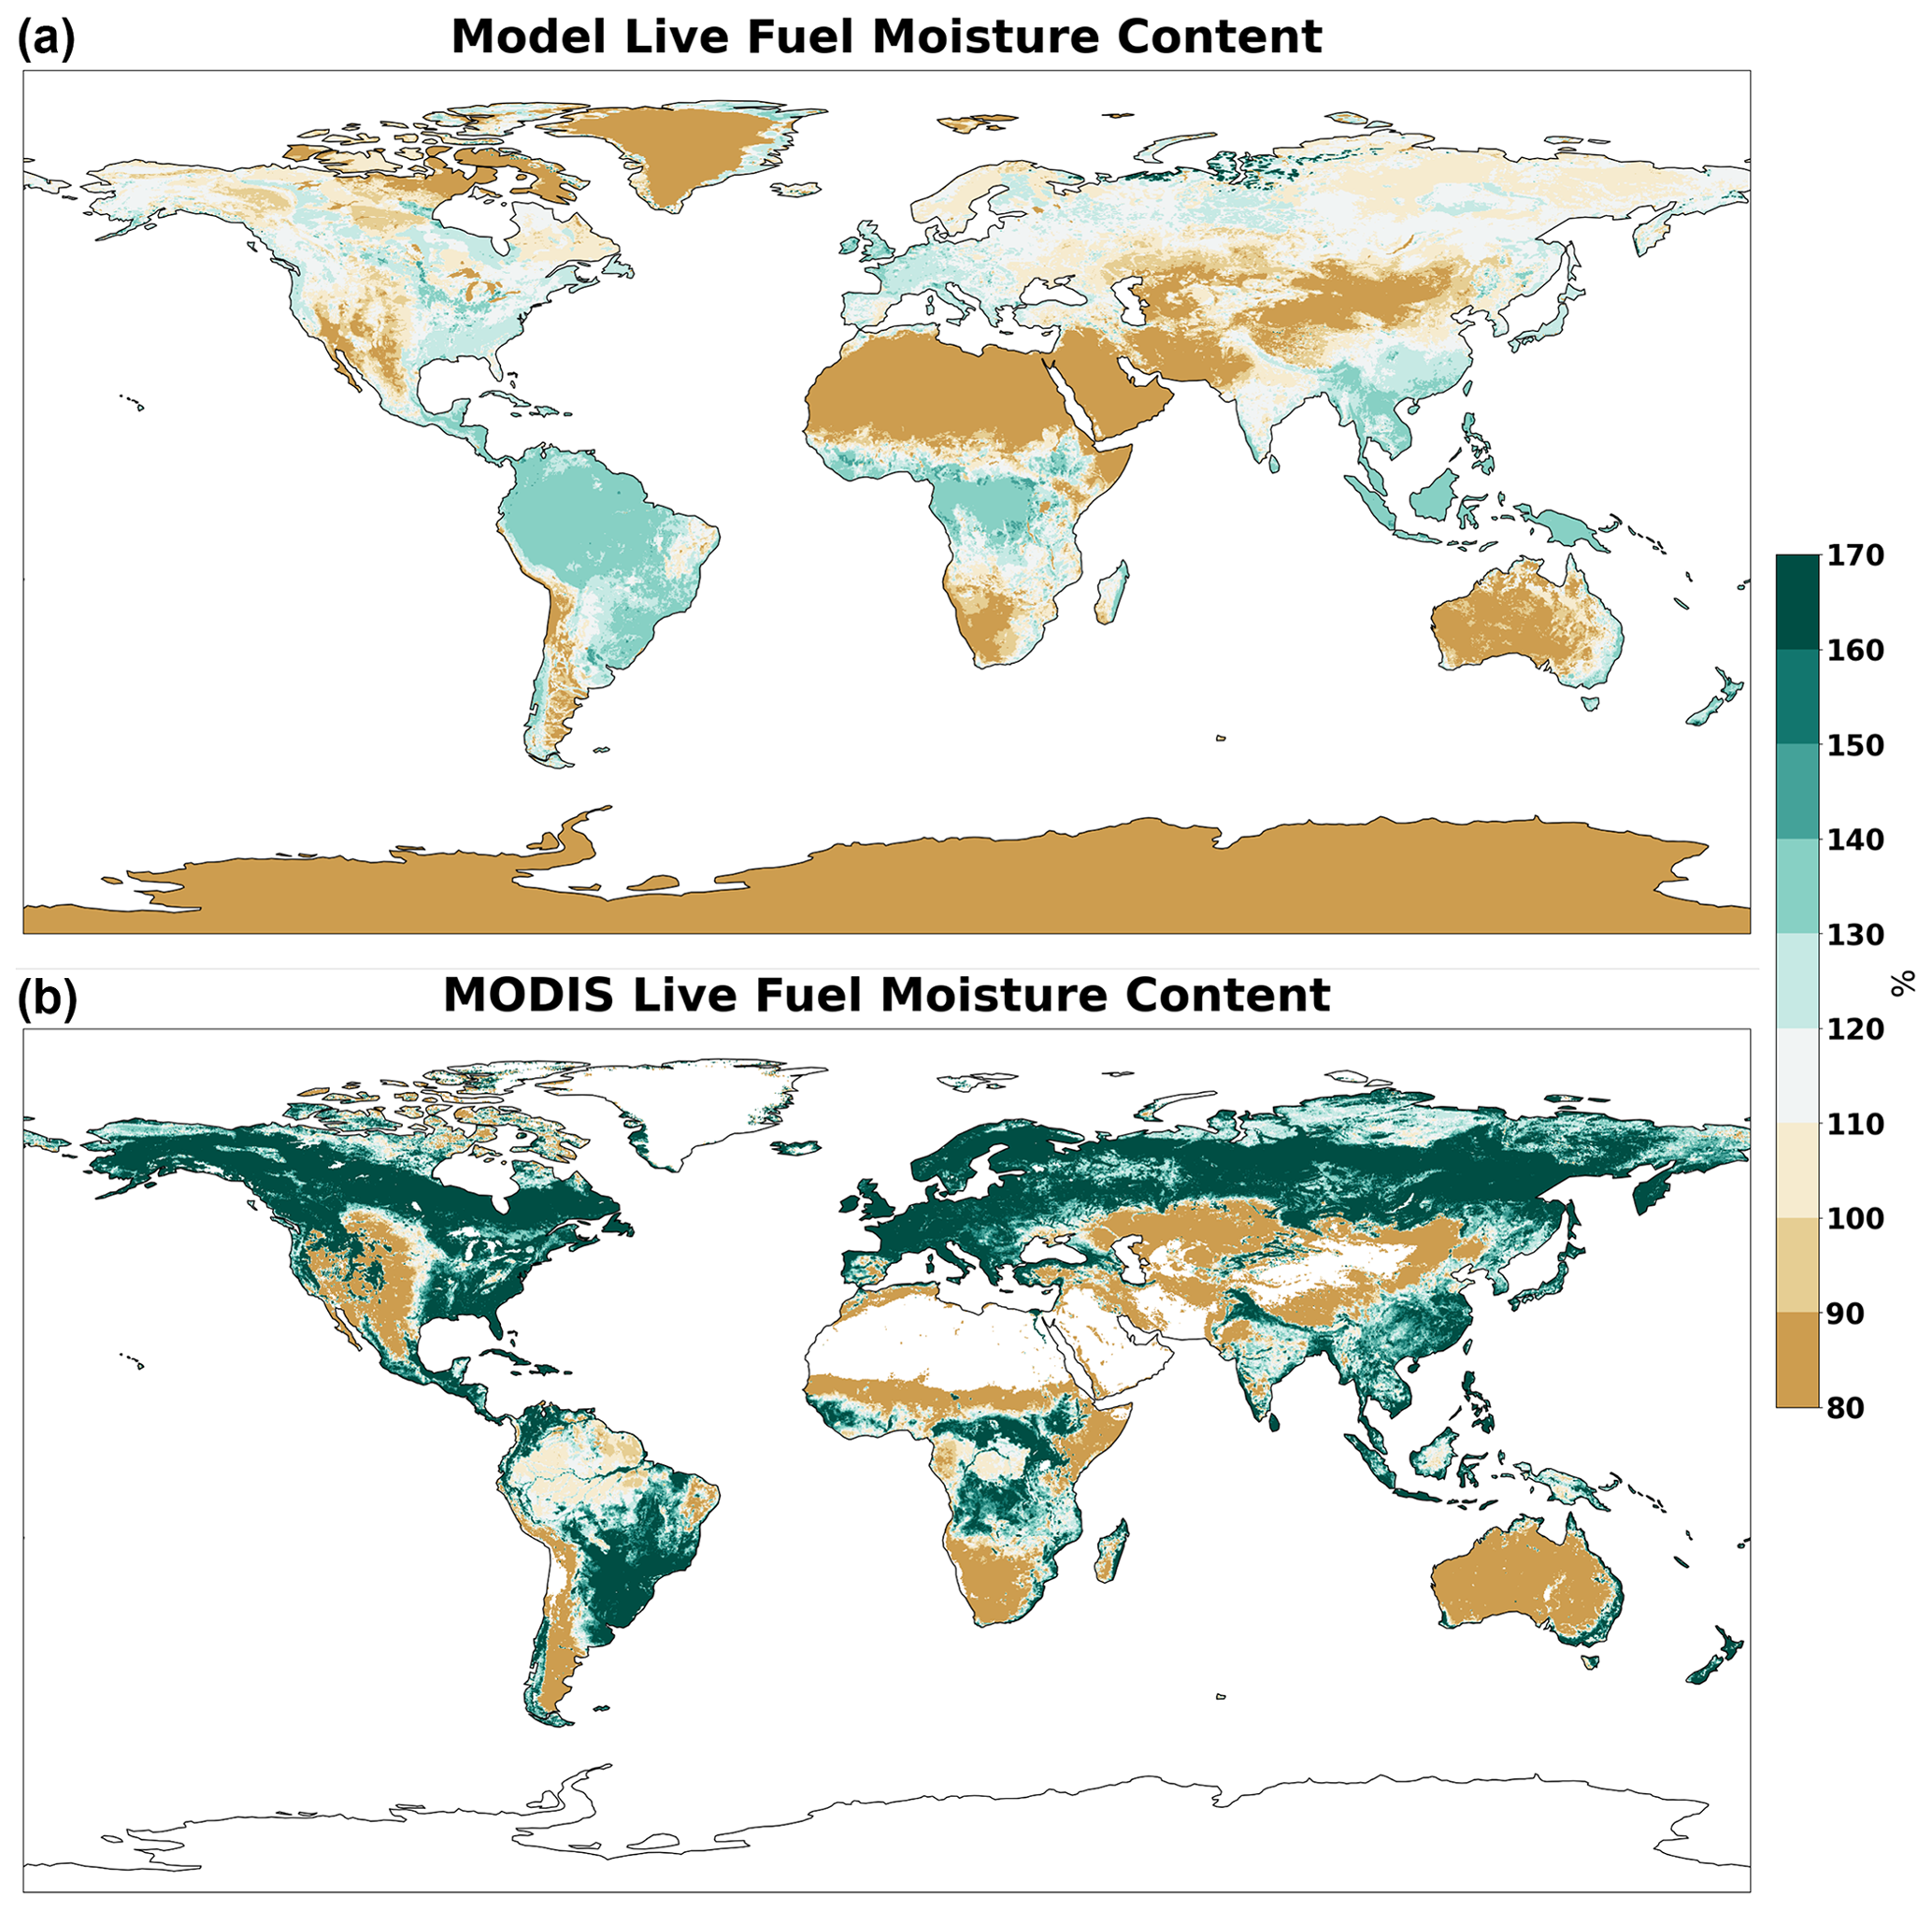
Figure 6Average live fuel moisture content (%) maps between 2010 and 2019 at ∼9 km spatial resolution derived from model estimates (a) and MODIS-based estimates (b).
There is generally a good agreement between the two datasets when considering all points for all years between 2010 and 2019 (Fig. 7). Agreement between MODIS and our dataset is also vegetation-type dependent. By using the ECLand vegetation cover maps we separate the correlation by type. The resulting correlation with herbaceous vegetation types is relatively high with R values of 0.65 (short grass), 0.62 (deciduous shrubs), and 0.50 (broadleaf savannah). Forested regions show poorer correlation, with evergreen needleleaf forests negatively correlated () and deciduous broadleaf forests only weakly correlated (R=0.33). This is expected given the complexity involved in estimating forest LFMC, which is highly heterogeneous. Satellite observations are typically representative to the top of canopy moisture and not the entire forest structure (Quan et al., 2021). Comparatively, the model presented here provides an improved correlation in forested areas when evaluated against the Globe-LFMC training data for both evergreen needleleaf (R=0.36) and deciduous broadleaf (R=0.42) forests.
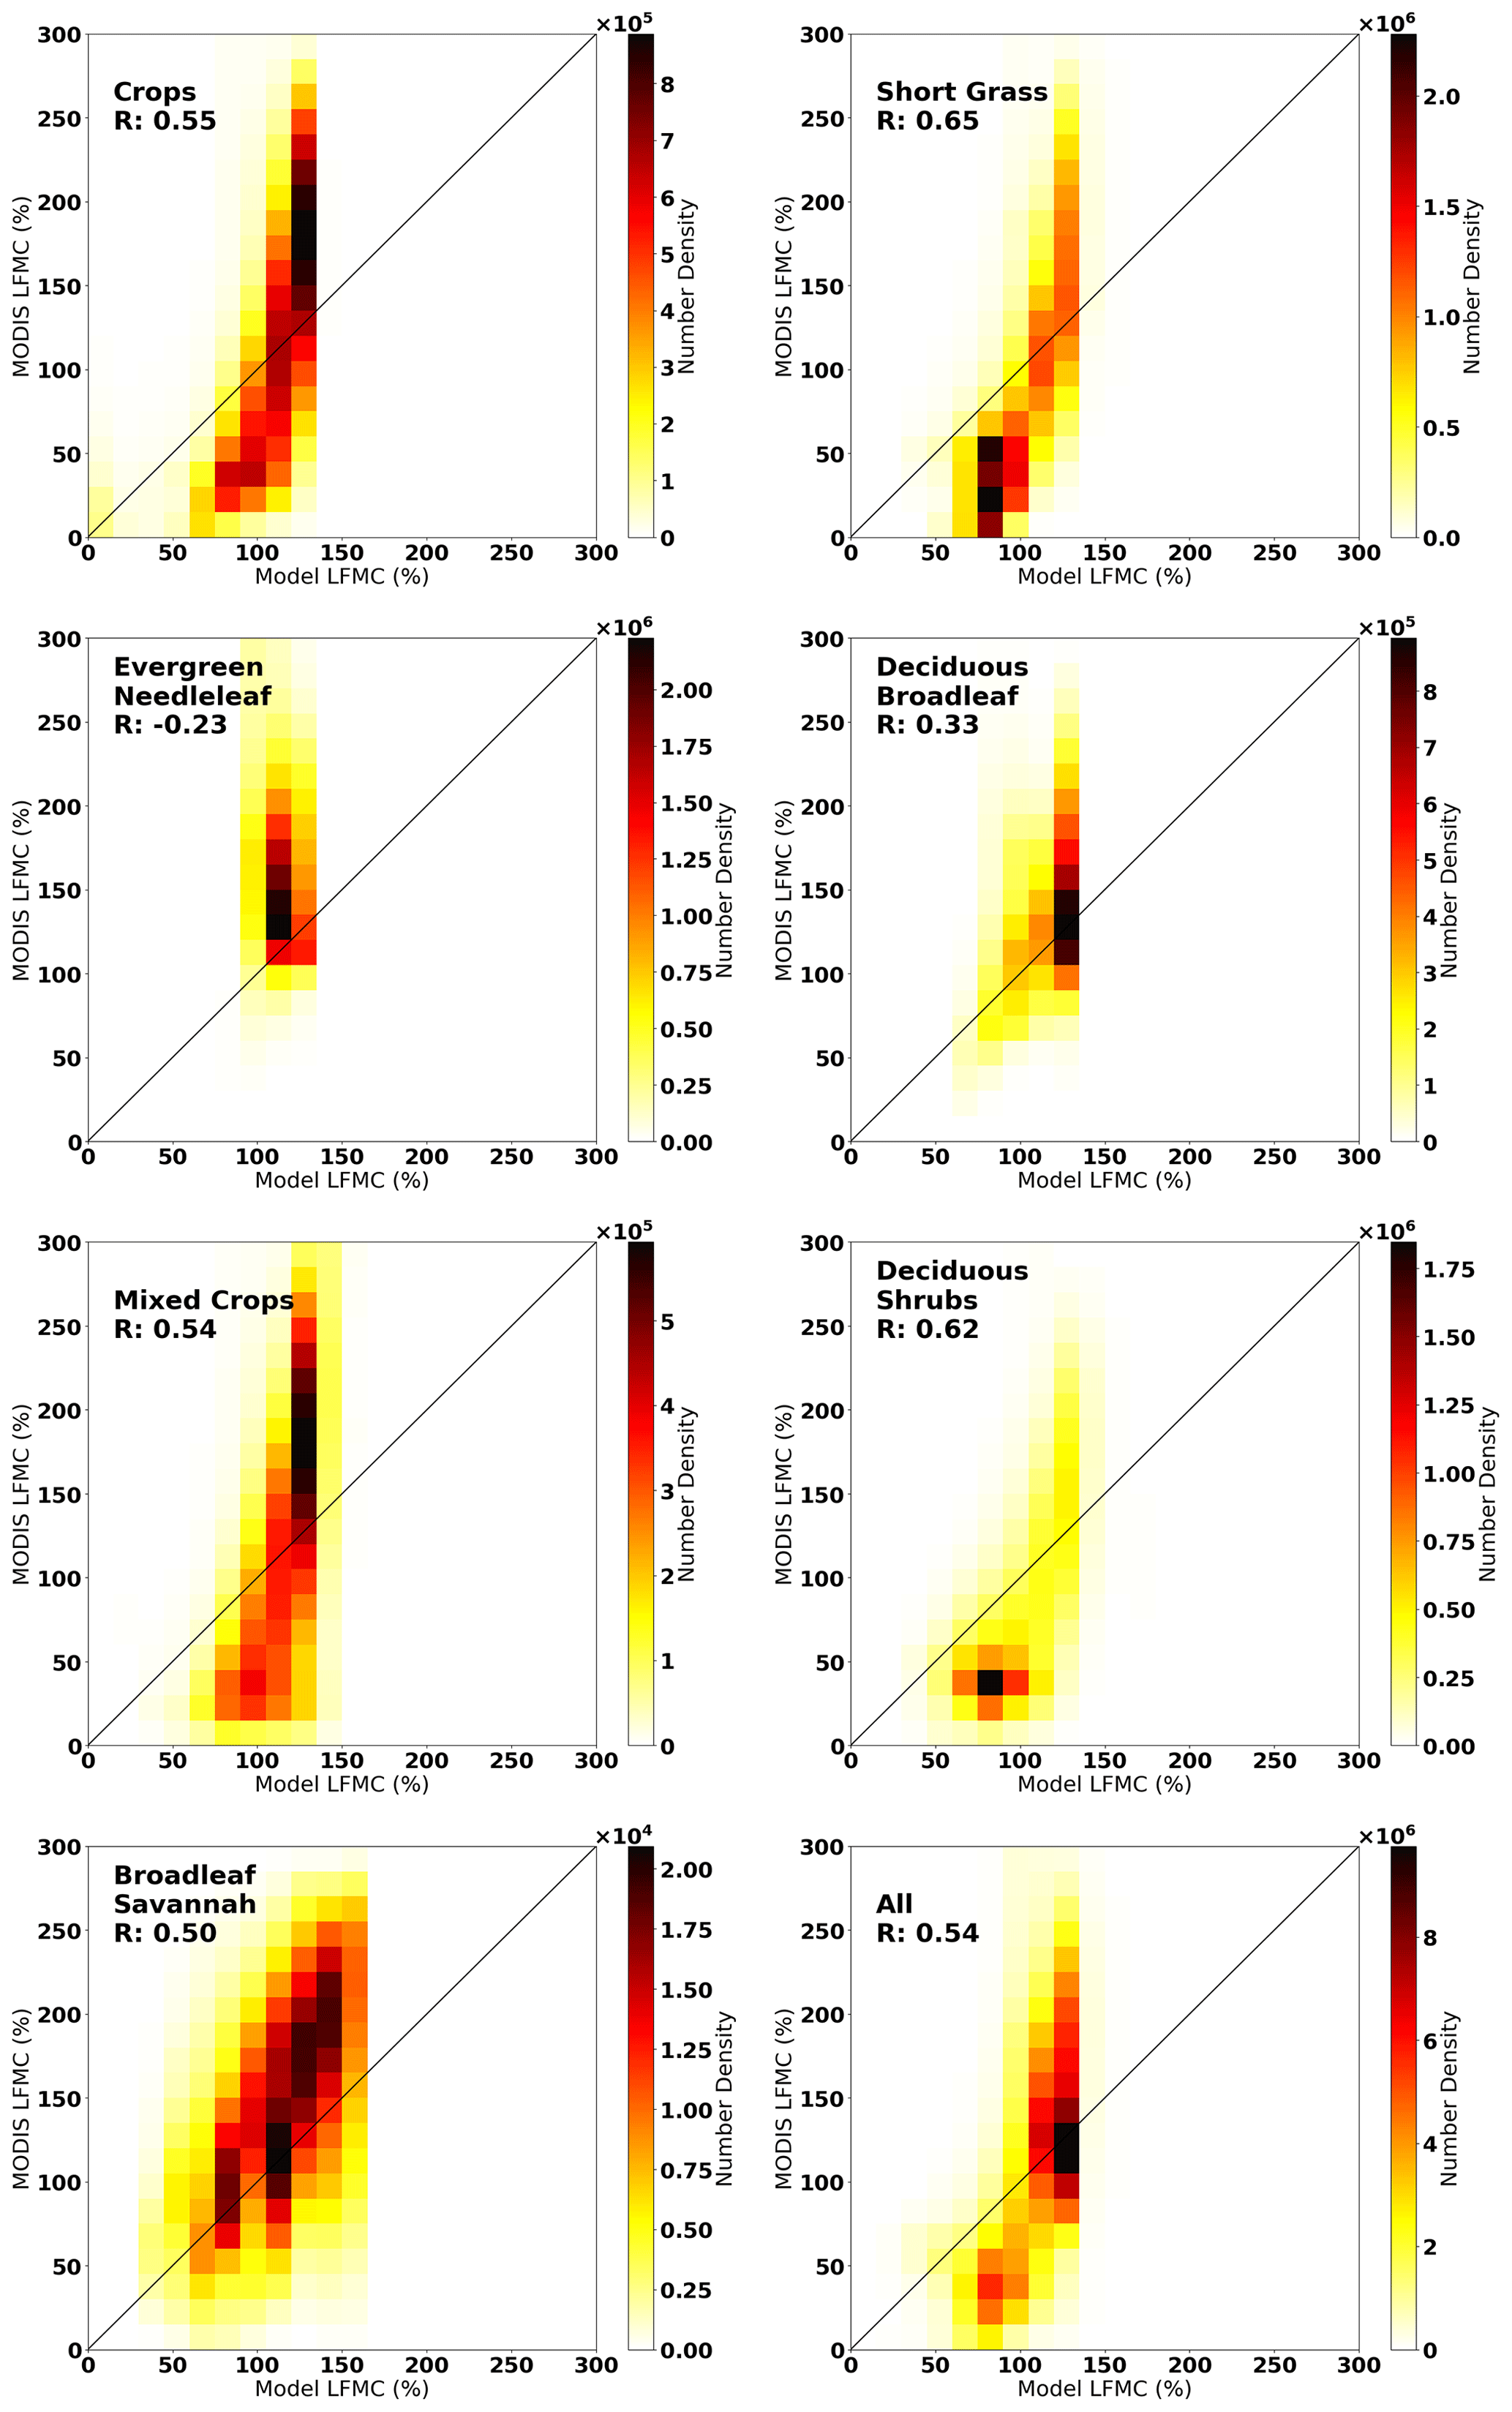
Figure 7A density heat map showing the correlation of modelled and MODIS-derived live fuel moisture content for seven vegetation types and for all vegetation types (bottom right) globally between 2010 and 2019. The R value is given for each type.
The spread in values is bias low in our model relative to that of Quan et al. (2021), with both extreme low (<40 %) and high (>150 %) values typically not represented in our estimates. This is the result of the asymptotic regression approach where anomalously high values are unlikely to ever occur, as they tend toward a theoretical maximum LFMC. Given that our focus is to establish the fire prone state of the vegetation, any values over 150 % can be considered non-flammable and their exact values are not essential for fire modelling.
3.3 Dead fuel moisture content model
Current operational fire forecasting systems and fire weather indices (FWI) typically depend on an estimation of DFMC as a proxy for flammability (Van Wagner, 1974; Vitolo et al., 2020). Whilst observations of DFMC can be made at a local scale (e.g. Matthews, 2014), there is no global observation-based product which could be implemented as an alternative to modelling.
An estimation of daily DFMC from 2010 to 2019 at ∼ 9 km was made by generalizing the “Nelson model”, which is a physically based model for moisture content of a 10 h fuel (Nelson, 2000). The model was developed using hourly air temperature, humidity, radiation, and precipitation as inputs to derive heat and moisture transfer both internally and at the surface. Here, as in Carlson et al. (2007), we extended the model to include 1, 10, 100, and 1000 h fuels. The four classifications are based on the response time of the fuel to changes in moisture and are commonly associated with the fuel diameter. Given that the fuel model produces dead foliage and wood, we further grouped the DFMC fuel types: 1 and 10 h fuel moisture were used for foliage, including small branches, whereas 100 and 1000 h fuel moisture provided DFMC for wood. The weighting between the two fuels for both is dependent on the vegetation type (Table S4), based on the National Fire Danger Rating System (Deeming et al., 1977).
We simplify the Nelson model by considering only the surface exchange of moisture between the atmosphere and fuel surface due to precipitation and vapour pressure differences, as given by Eqs. (12) and (15) of Nelson (2000). We expand the model to 1, 10, 100, and 1000 h fuels by modifying various coefficients and stick radius to 0.2, 0.64, 2.0, and 6.4 cm, respectively, based on Carlson et al. (2007).
Model time step is important for the stability of the model, and the treatment of precipitation as an input can alter the output noticeably. For example, intense precipitation, R, over a short period might result in a small change in DFMC, dMR; however, the same total R spread over a longer period will result in larger dMR. To account for the impact of time-step duration we adjust the precipitation coefficients given by Nelson (2000). For this study we apply daily time steps, dt, for DFMC; however, in the future when the model is integrated within ECland, the time step will decrease significantly to less than 1 h and the coefficients will be adjusted further. The resulting updates to Eq. (12) of Nelson (2000) can then be applied to each fuel type as given by Eqs. (5)–(8). Maximum dMR values are taken from Carlson et al. (2007), which may not be fully compatible with our system given that their model uses 1 h time steps:
The impact of the vapour pressure effect on DFMC, dMV, is also considered based on Eq. (15) of Nelson (2000) and using the same constants where applicable. As with precipitation, this is updated following stick radius and density recommendations from Carlson et al. (2007) to account for all fuel types. The vapour pressure at the fuel surface, calculated following Eq. (20) of Nelson (2000), is dependent on humidity, surface pressure, skin temperature, and air temperature which were taken from ERA5-Land (Muñoz-Sabater et al., 2021), although operationally they can be taken from the atmospheric component of the IFS model. The resulting DFMC evolves through time and is updated by adding dMR and dMV at each time step.
3.4 Case study validation
Derived DFMC and LFMC were first validated using extreme wildfire case studies. Fire occurrence was spatially correlated with both moisture variables averaged over the entire month in which the wildfire events occurred, although often the wildfires occurred on timescales of either less than or more than 1 month. We overlaid a fuel load mask, considering regions where either dead or live fuel was above 1 or 2 kg m−2, for DFMC and LFMC, respectively. Fire observations were taken from the MODIS Collection 6 and Collection 6.1 Active Fire Dataset (Giglio et al., 2020) in which active fires were detected using a contextual algorithm (Giglio et al., 2016) based on retrievals in the mid-infrared bands. Specifically, we used the MCD14ML product, which provides geographic coordinates of active fires at a monthly resolution. Observations were aggregated onto the fuel moisture dataset resolution (∼9 km). For comparison the spatial maps were compared with the average moisture content for the specific month taken from the 9 remaining years of the dataset (2010–2019). Cases studies were evaluated representing four distinct wildfire events: tropical forest, boreal forest, temperate forest, and mixed shrubland. It is important to note that LFMC is dependent on both phenology and meteorological conditions, and as a result it may not always provide a suitable direct correlation with the fire susceptibility of vegetation.
3.4.1 Bolivia, August 2010
The Bolivian wildfires in 2010 were mainly concentrated in the department of Santa Cruz in the east of the country, burning a total area of 38 000 km2 (Bustillo Sánchez et al., 2021). This diverse region contains a mixture of tropical dry and wet forests as well as savannahs, making the fuel characteristics difficult to model using a single vegetation type. The Chiquitanía seasonally dry tropical forest, located between the Amazon and Gran Chaco dry forest, was the most affected region. The fires were concentrated toward the end of the dry season in August and were the result of human activities, above average winds, and a La Niña event causing drought (Singh et al., 2022). Within the ECLand classification the fires mainly occurred in evergreen broadleaf forest.
Evaluation of both DFMC and LFMC, relative to the 2011–2019 average, showed a noticeable reduction in moisture content over the entire eastern Bolivian region in August 2010 (Fig. 8). Fire-detected cells within the mapped domain, 62∘ W, 21∘ S to 56∘ W, 15∘ S and where live fuel load is above 2 kg m−2, had an August average LFMC for 2011–2019 of 107 % ± 11 %, whereas for 2010 this decreased to just 91 % ± 16 %. The average DFMC, where dead fuel load is above 1 kg m−2, was 27 % ± 10 % for August 2011–2019 and also higher than for 2010, when it was 16 % ± 12 %. It should be noted that the DFMC values reported are a mass weighted average of the foliage and wood DFMC combined. This suggests that based on fuel moisture alone, the elevated fire risk for 2010 is detected by the dataset. The exact thresholds for likely ignition for both LFMC and DFMC are vegetation dependent and, to establish fire danger from the values derived here, need to be explored in more detail. It should also be noted that the August average climatology for 2011–2019 will contain instances of fire occurrence. For comparison, LFMC for cells with no fire detection are closer in value for the 2011–2019 August average, 108 % ± 11 %, when compared with 2010, 99 % ± 15 %. The average DFMC of those same cells, with no fire detection, were 27 % ± 9 % for 2011–2019, compared with 15 % ± 11 % for 2010, a similar difference to that seen in fire-detected cells. Given the noticeable difference in LFMC, our findings suggest that forest fires in this region, for this period, were dependent on LFMC values rather than DFMC, although dead fuel burning likely contributed to the fire activity. Importantly, no fire detection does not mean no occurrence as both overpass time and, moreover, atmospheric and land surface conditions may result in no detection. Furthermore, high fuel load and low moisture content produce favourable conditions for fire occurrence but still require an ignition event. Finally, fuel load is not updated following a burn event, and as a result, our estimates for fuel load are likely to be overestimated following a fire.
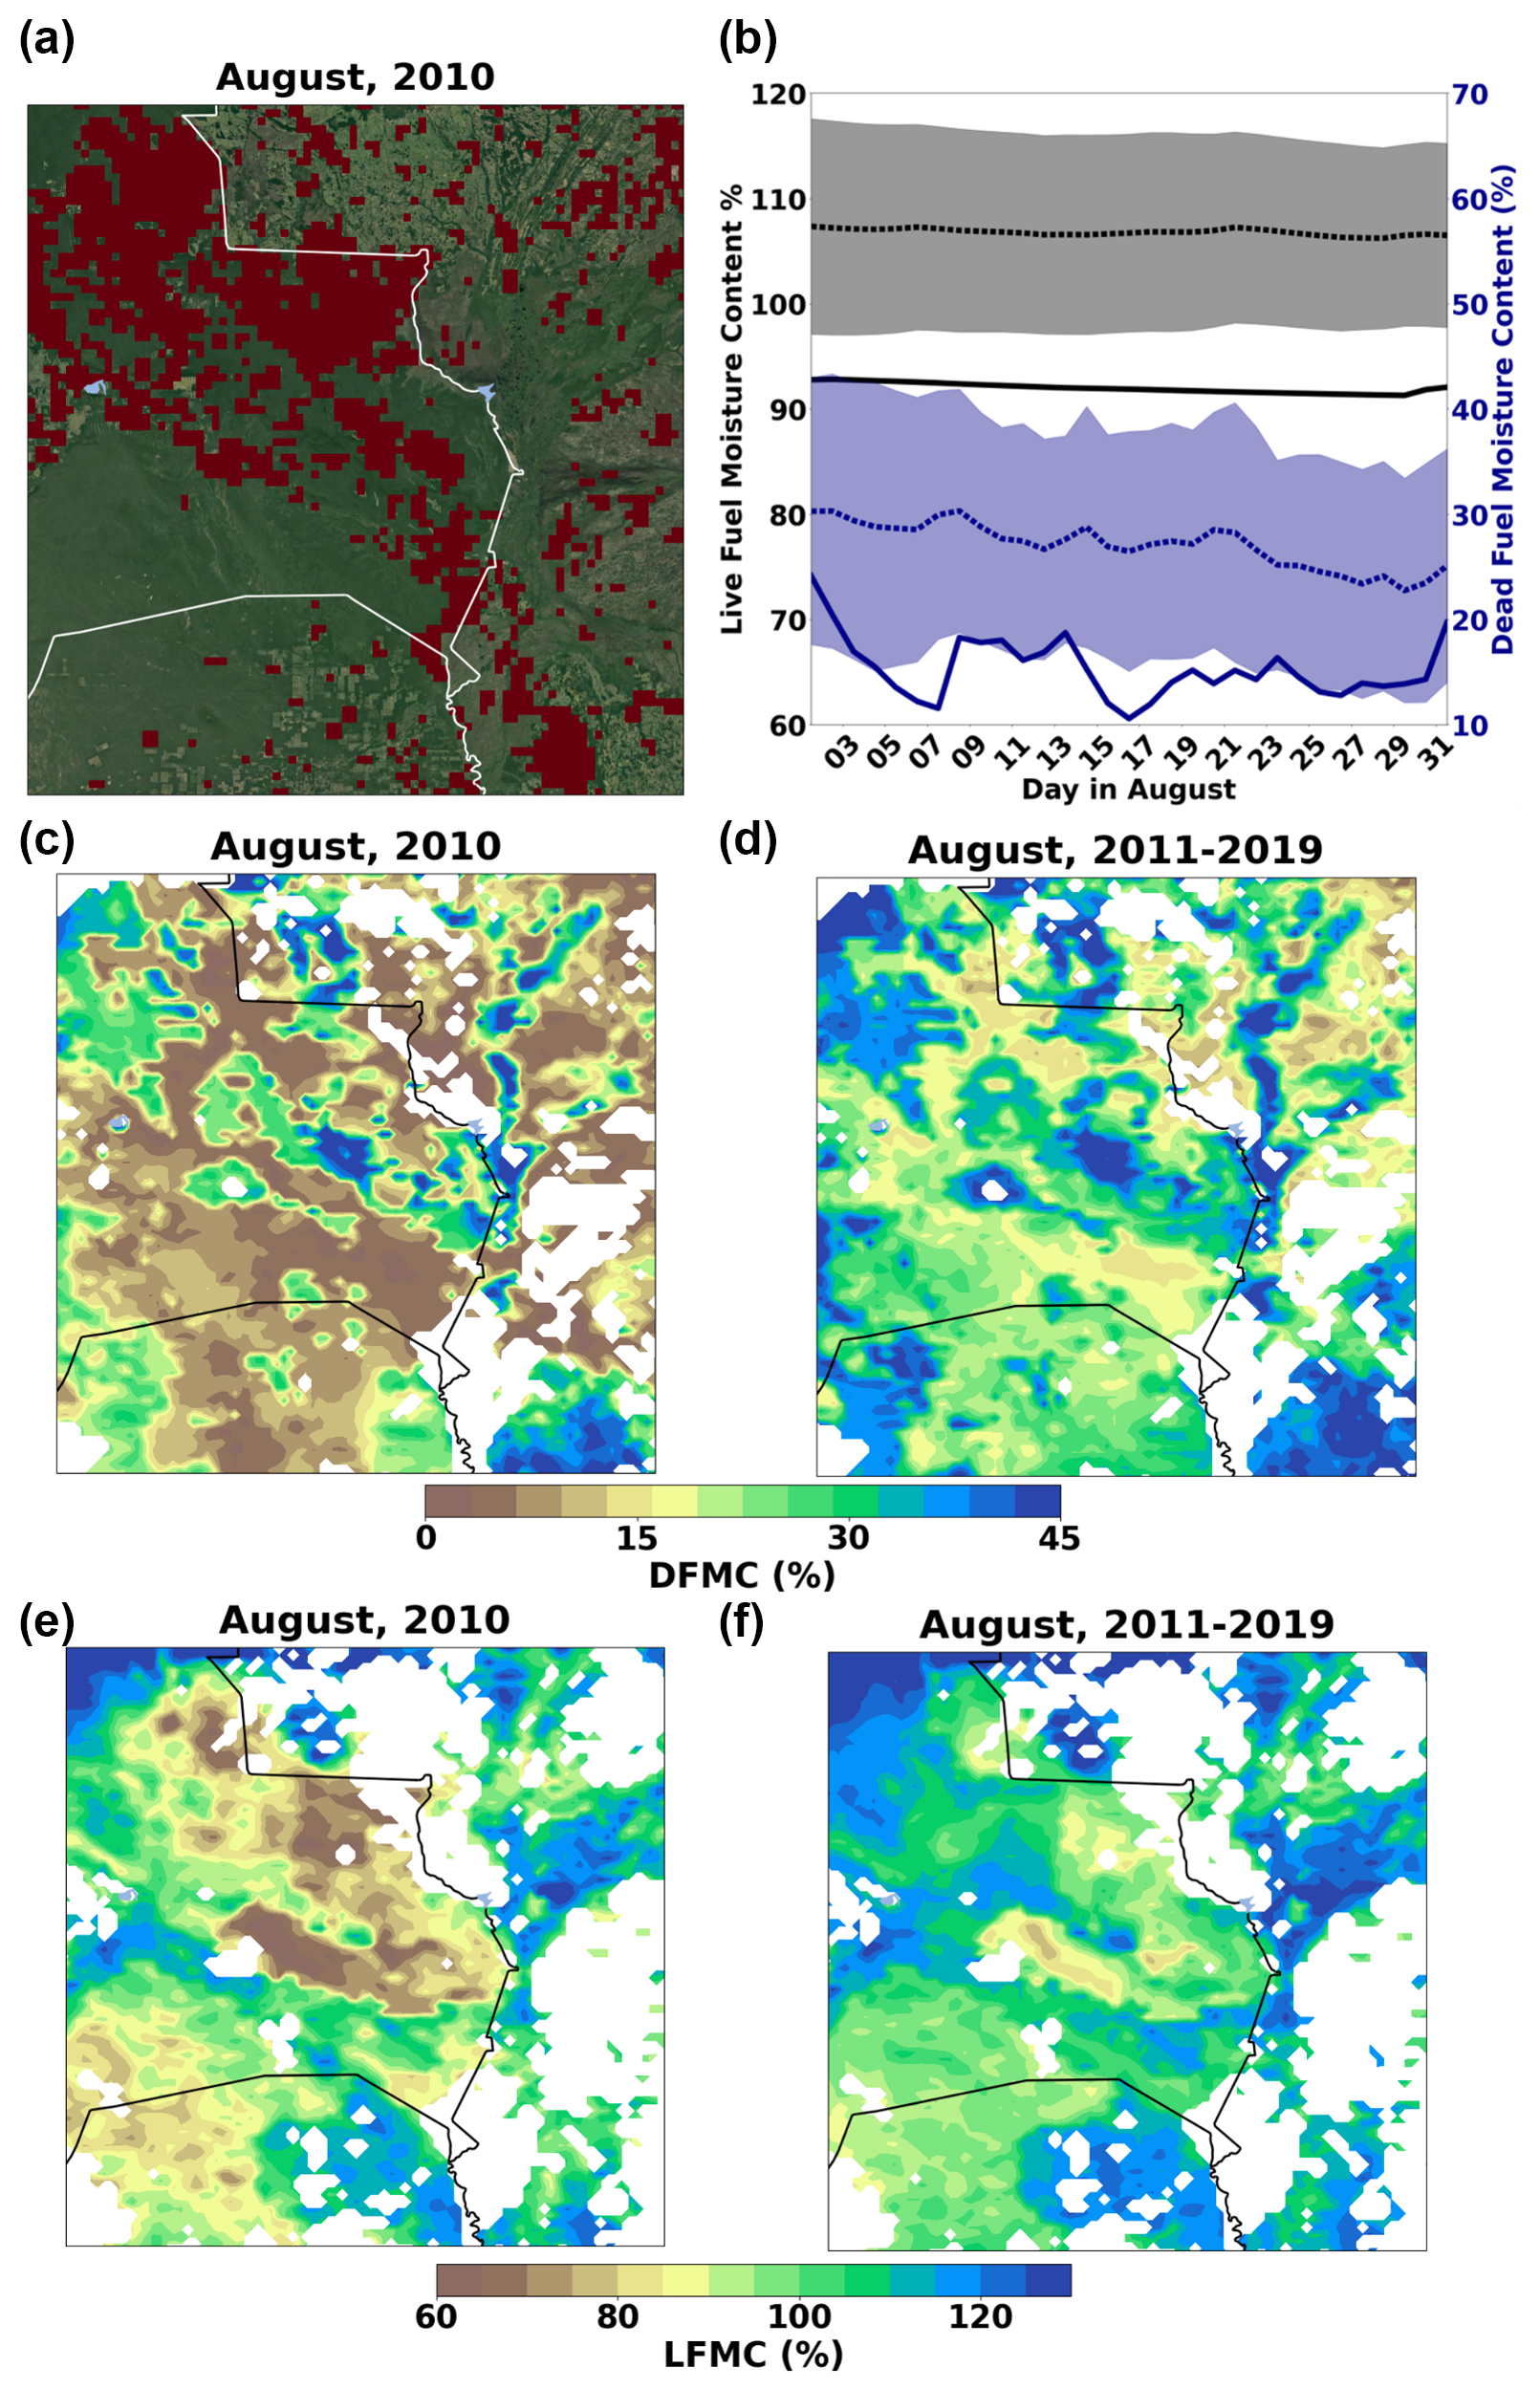
Figure 8Spatial distribution of August 2010 active fire detections from MODIS over Bolivia, where red indicates positive detection (a). The August 2010 (solid line) and August 2011–2019 (dotted line) regional average live fuel moisture content (black) and dead fuel moisture content (blue) for the same domain is shown (b). Also shown is a spatial representation at ∼9 km of the average August 2010 (a, c, e) and August 2011–2019 (b, d, f) dead (c, d) and live (e, f) fuel moisture content.
Most of the Bolivian fires in August 2010 occurred in the second half of the month, when both DFMC and LFMC of the fire-detected cells was lowest (Fig. 8). For August 2010 daily variability in the average DFMC (± 2.4 %) was larger than that of LFMC (± 0.8 %). This suggests that the onset of fire risk from low DFMC is likely to occur more rapidly than for LFMC. This is expected as LFMC is more resilient to drought conditions given the dependency on soil moisture and not surface moisture.
3.4.2 Canada, July 2014
The 2014 summer wildfire season in the Northwest Territories, Canada, was the worst in recorded history in the region, resulting in a burnt area of 34 000 km2 (Kochtubajda et al., 2019). The fire-affected region, predominantly to the west and north of Great Slave Lake, is relatively homogeneous, covered in evergreen needleleaf forests. We focus our analysis on July, when fire occurrence was highest. The diagnosed moisture content is only reflective of fuel flammability and not directly increased fire occurrence. For 2014, increased fire occurrence was, in part, attributed to changes in lightning-induced ignitions (Veraverbeke et al., 2017).
The region south of Great Slave Lake, which was not subject to significant wildfire activity in 2014, has the same average LFMC in July, 121 % ± 8 %, as the 2011–2019 climatology, 121 % ± 8 % (Fig. 9), whereas fire-detected cells, within the mapped domain (119∘ W, 59∘ N to 108∘ W, 65∘ N) with live fuel load above 2 kg m−2, exhibited a lower average LFMC in 2014, 107 % ± 9 %, relative to 2010–2019, 112 % ± 8 %. Most of these cells are concentrated to the west and north of Great Slave Lake and northeast of Lac La Martre. Similarly, for DFMC, where dead fuel load is above 1 kg m−2, fire-detected cells provide a lower average value for 2014, 27 % ± 21 %, relative to 2010–2019, 37 % ± 16 %. The relative change in moisture content between the fire event years and the climatology is smaller than for the Bolivian fires. Given the difference in vegetation type between the two events, this would suggest that evergreen forests require only a small change in moisture content to noticeably increase fire risk. As previously mentioned, an anomalously high number of lightning-induced ignitions in July 2014 contributed to the severity of the wildfire seasons. However, our derived moisture content values would suggest that in addition to this, the fuel characteristics were favourable for an above-average fire season.
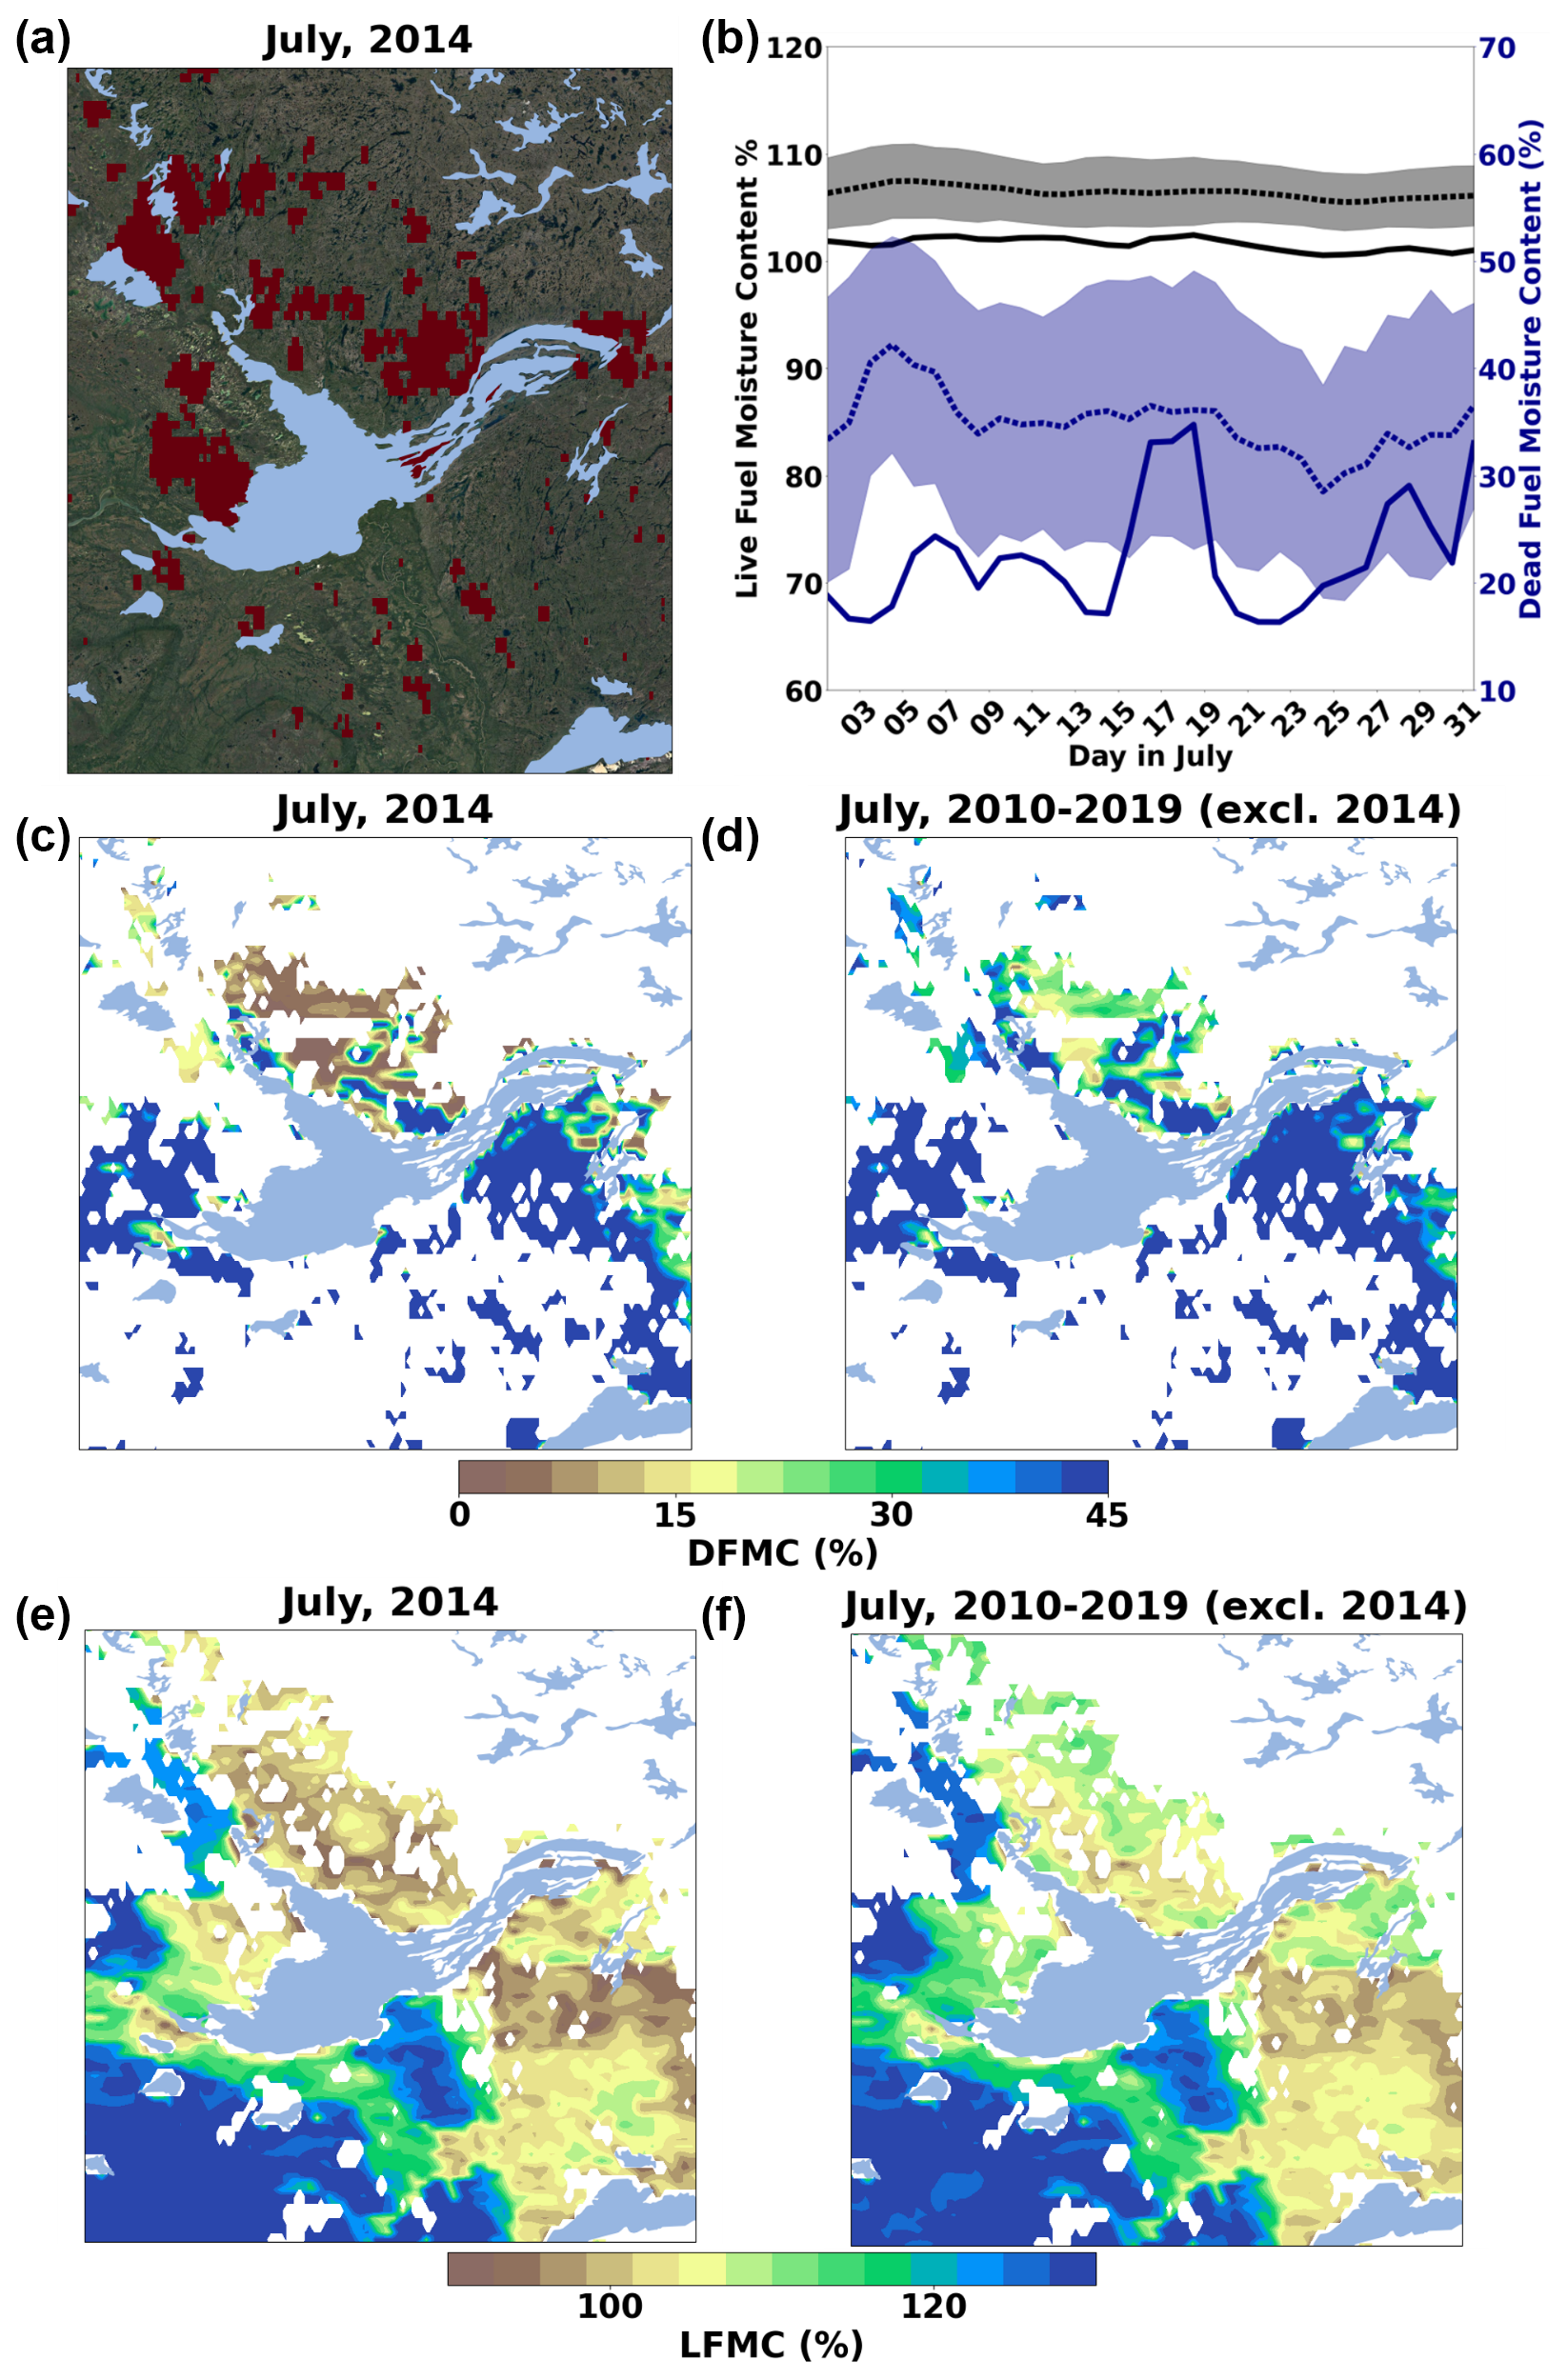
Figure 9Spatial distribution of July 2014 active fire detections from MODIS over Northwest Territories, Canada, where red indicates positive detection (a). The July 2014 (solid line) and July 2010–2019 excluding 2014 (dotted line) regional average live fuel moisture content (black) and dead fuel moisture content (blue) for the same domain is shown (b). Also shown is a spatial representation at ∼9 km of the average July 2014 (a, c, e) and July 2010–2019 excluding 2014 (b, d, f) dead (c, d) and live (e, f) fuel moisture content.
The fire season in the Northwest Territories spanned the months before and after July, and this is reflected in the low DFMC and LFMC both at the start and end of July, relative to the climatology. The variability in DFMC (± 5.4 %) is once again larger than for LFMC (± 0.6 %) and, as with the Bolivian fires, both LFMC and DFMC are typically beyond the spread of the climatology.
3.4.3 Portugal, June 2017
In June 2017, following an intense heatwave, wildfires in Portugal resulted in 5000 km2 of land being burnt (Turco et al., 2019). The most destructive single event occurred on 17 June in the Pedrógão Grande municipality in central Portugal and resulted in 66 fatalities and 450 km2 of burnt land (Ribeiro et al., 2020). Boer et al. (2017) found that current methods based on simplified assumptions of fuel state failed to predict the fire danger of the Pedrógão Grande event, and as a result, it seems a fitting case study for our LFMC and DFMC. The land cover in the region is mainly evergreen needleleaf forests with a smaller mixture of broadleaf trees and shrubs (Pinto et al., 2022). The fires often spread to the wildland urban interface resulting in complex evolution beyond the simple correlation between moisture content and fire occurrence.
Relative to the previous two case studies, the Pedrógão Grande wildfires covered a smaller area and were concentrated in specific events which were relatively isolated (Fig. 10). Given the relatively dense urbanization in the area, it is unlikely these events were able to spread in the same way as the more rural Bolivian and Canadian wildfires. Additionally, the area is subject to a lower fuel load density as indicated by the relatively limited number of grid cells with live fuel load above 2 kg m−2 or dead fuel load above 1 kg m−2. In such heterogeneous environments ignitions events become more relevant as individual fires tend to cover a smaller area. Fire-detected cells above the fuel threshold were found to have a lower LFMC on average in June 2017, 111 % ± 5 %, relative to the 2010–2019 average excluding 2017, 117 % ± 6 %. The average DFMC for June 2017, 4 % ± 2 %, was three times lower than the 2010–2019 average, 12 % ± 3 %. As with the Canadian wildfires, also in evergreen needleleaf forest, and unlike with the Bolivian fires, in evergreen broadleaf forest the relative difference between LFMC between the fire year and the climatology is small. This further supports the idea that fire risk in needleleaf forests noticeably increases with only a slight decrease in LFMC.
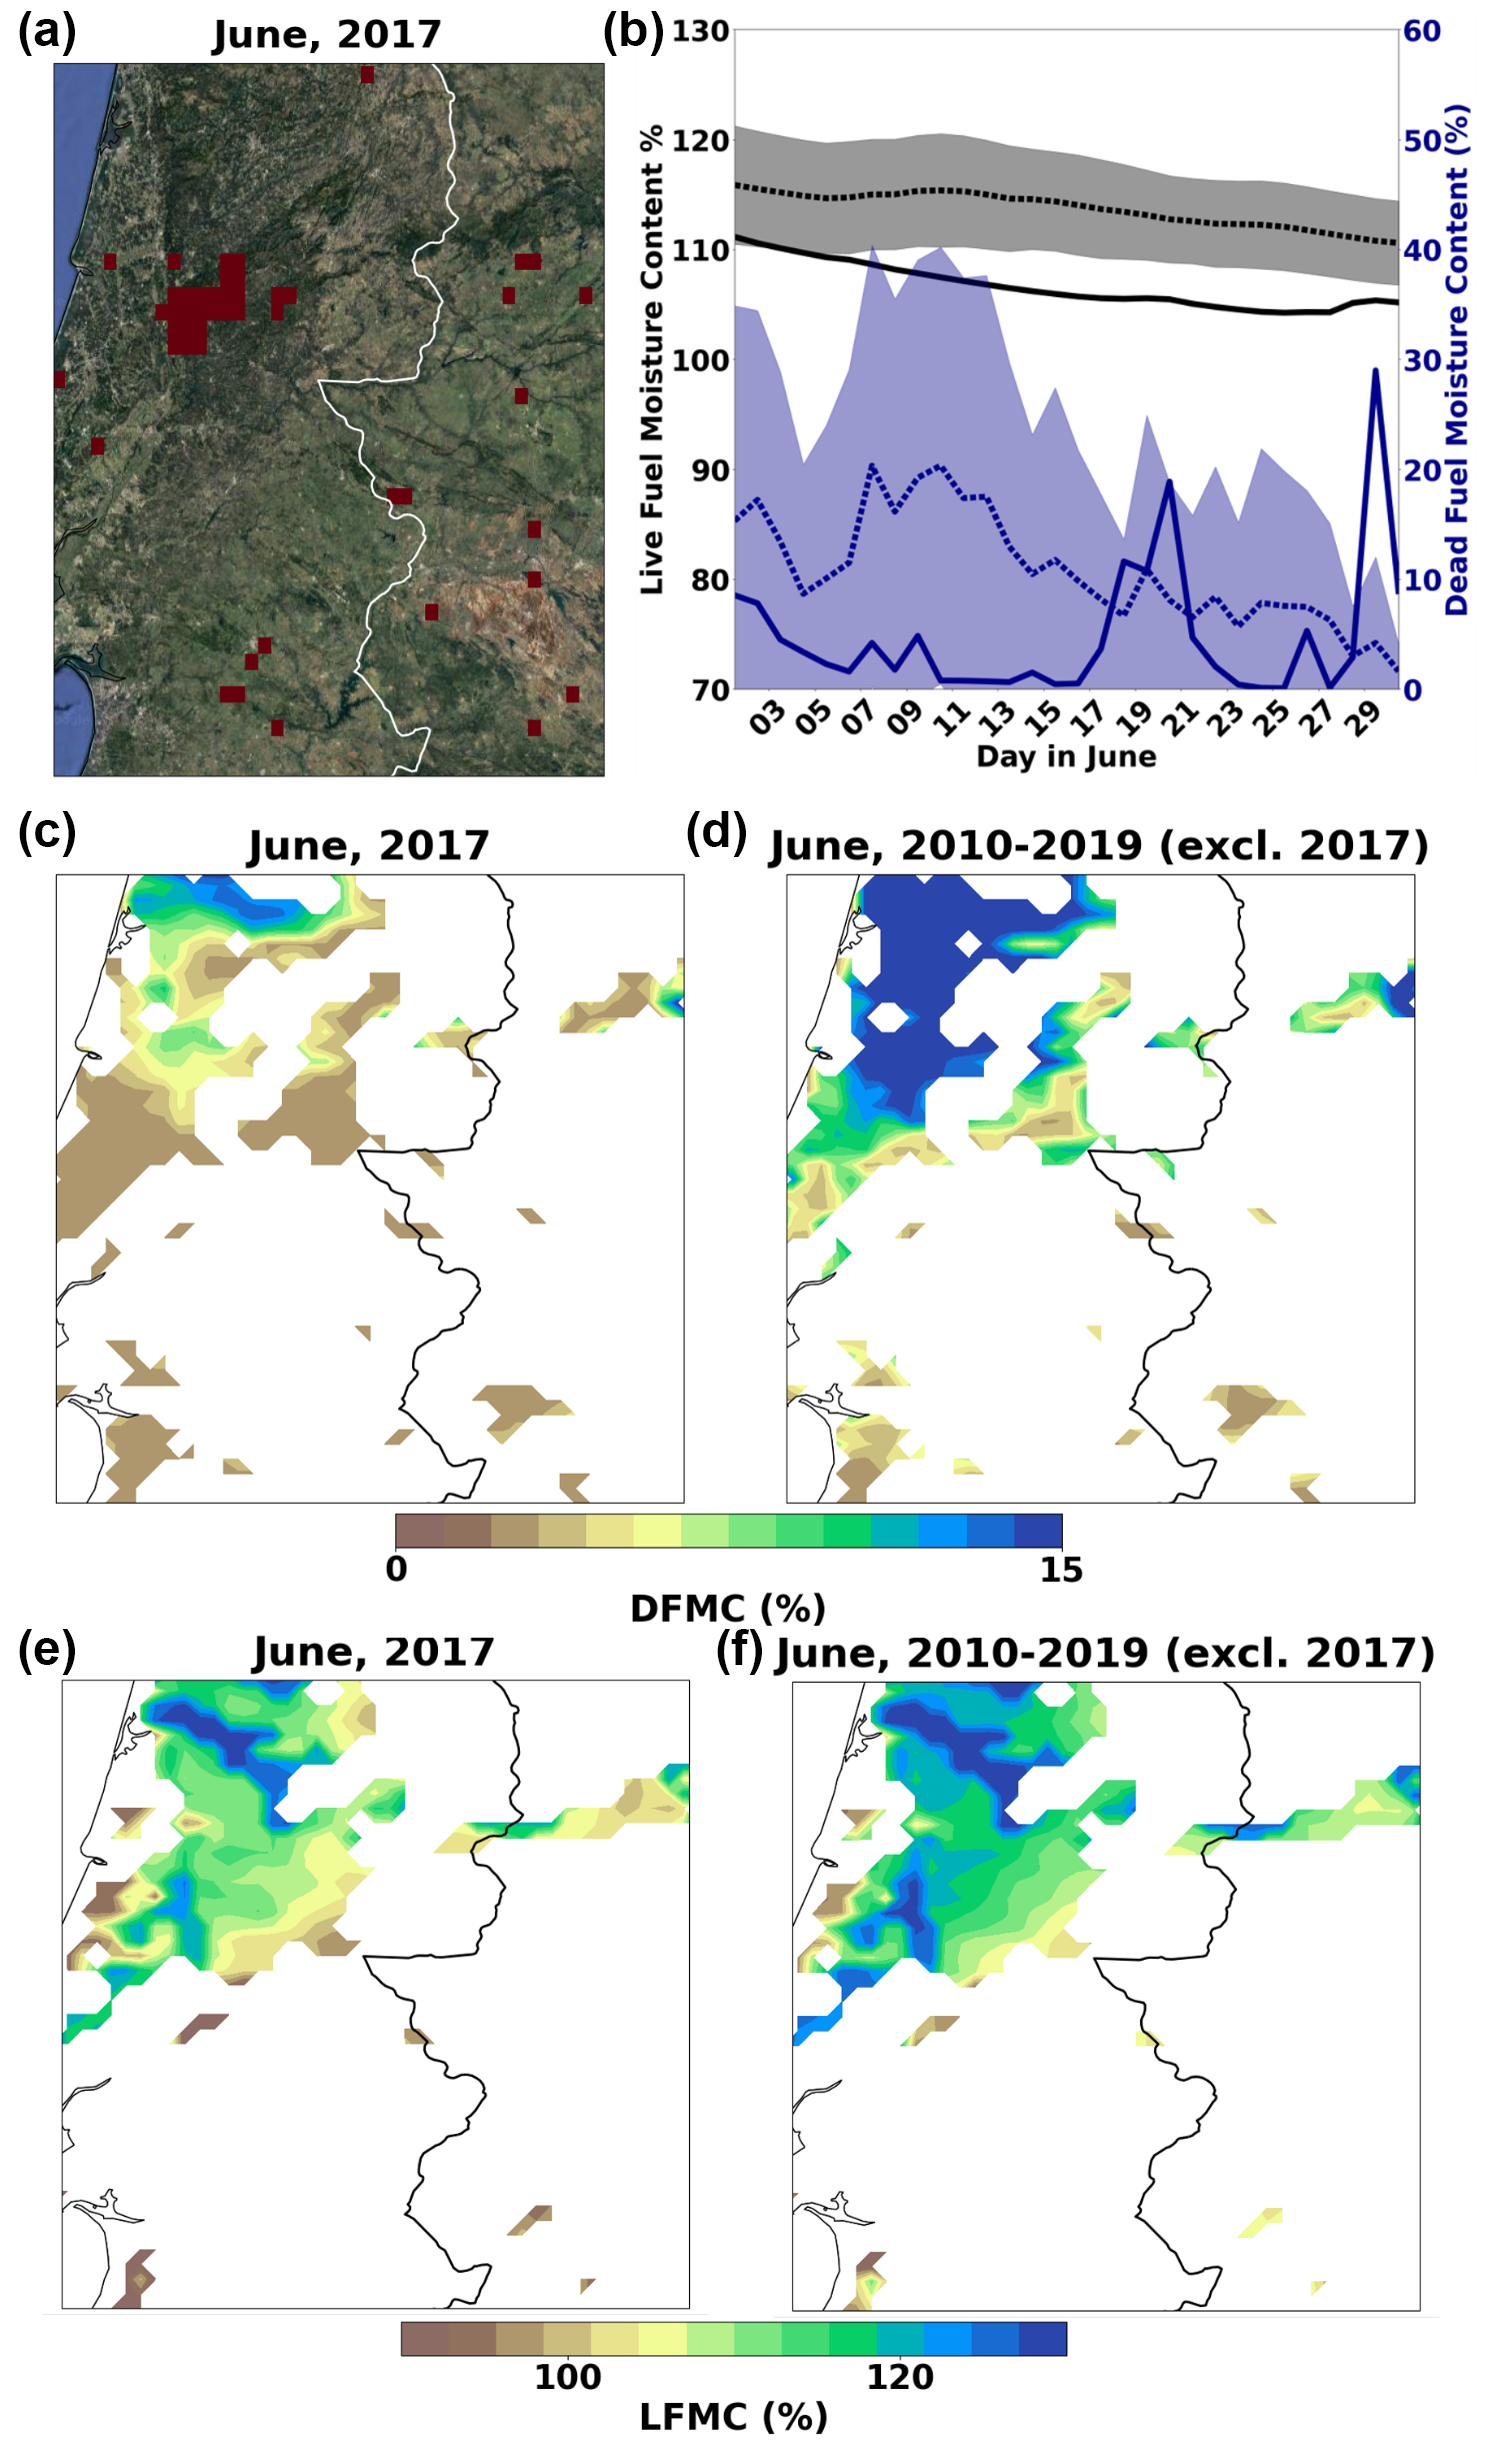
Figure 10Spatial distribution of June 2017 active fire detections from MODIS over central Portugal where red indicates positive detection (a). The June 2017 (solid line) and June 2010–2019 excluding 2017 (dotted line) regional average live fuel moisture content (black) and dead fuel moisture content (blue) for the same domain is shown (b). Also shown is a spatial representation at ∼9 km of the average June 2017 (a, c, e) and June 2010–2019 excluding 2017 (b, d, f) dead (c, d) and live (e, f) fuel moisture content.
Unlike the previous two case studies, the Portuguese wildfires in June 2017 were isolated to only a few events and as such fuel characteristics at specific dates can be investigated. The Pedrógão Grande event on 17 June coincides with low DFMC values in the region, 4 %, following a week of consistently low DFMC values, 0.8 % ± 0.3 %. These values are higher relative to climatology values of 8 % for 17 June and 14 % ± 4 %, for the preceding week. Initial LFMC values at the start of the month were within the average spread; however, as the month progressed, the average values drifted lower to 105 % on the 17 June, compared with a climatology average of 114 %. As the vegetation type for these fires is the same as that for the Canadian wildfires in 2014, this would suggest that evergreen needleleaf forests have a model LFMC fire danger threshold around 110 %.
3.4.4 Australia, December 2019
The Australian wildfire season in late 2019 and early 2020 resulted in the largest burnt area and fire severity in the region in recorded history (Deb et al., 2020). This followed the country's warmest and driest year on record (Filkov et al., 2020). The fires resulted in a burnt area of 100 000 km2 (Davey and Sarre, 2020). The fires centred around the southeast of the country in the state of New South Wales. The fire resulted in major environmental damage, at least 33 human deaths, agricultural damage, loss of over 3000 houses, and large-scale emissions of both short-lived atmospheric pollutants, causing poor air quality, and long-lived greenhouse gases. The major fires occurred in December 2019 and January 2020. Here, given the time series of the data, we analysed fuel characteristics for December. Much of central Australia is covered by areas with sparse vegetation, meaning that although moisture content is low, there is insufficient fuel for large-scale wildfires. Both the urbanized and forested regions are found in more coastal areas where the fuel moisture content is higher. Large-scale wildfires typically occur at the forest–shrubland interface where, in the right conditions, there is both sufficient fuel and low moisture content.
Deb et al. (2020) found there were incidents of wildfire occurrence in Australia during the 2019–2020 season where DFMC was low, below a fire threshold, and LFMC was high, above a threshold; however, there were also incidents where the opposite occurred. This suggests that both or either threshold was met from which ignition events resulted in fire spread. The fire-affected areas were typically evergreen broadleaf forests; however, given the heterogeneous nature of the landscape, several different vegetation classifications, defined in ECLand, were burnt. The forest–shrubland interface is clearly denoted by the boundary of the live fuel threshold, which is applied as a mask to the fuel data for all points below 2 kg m−2 (Fig. 11). Fire-detected cells above this threshold were found to have a lower LFMC in December 2019, 108 % ± 15 %, relative to the 2010–2018 average, 124 % ± 8 %. This supports a fire risk threshold between the two values. The average DFMC for December 2019, 25 % ± 17 %, was lower than the 2010–2019 average, 34 % ± 13 %.
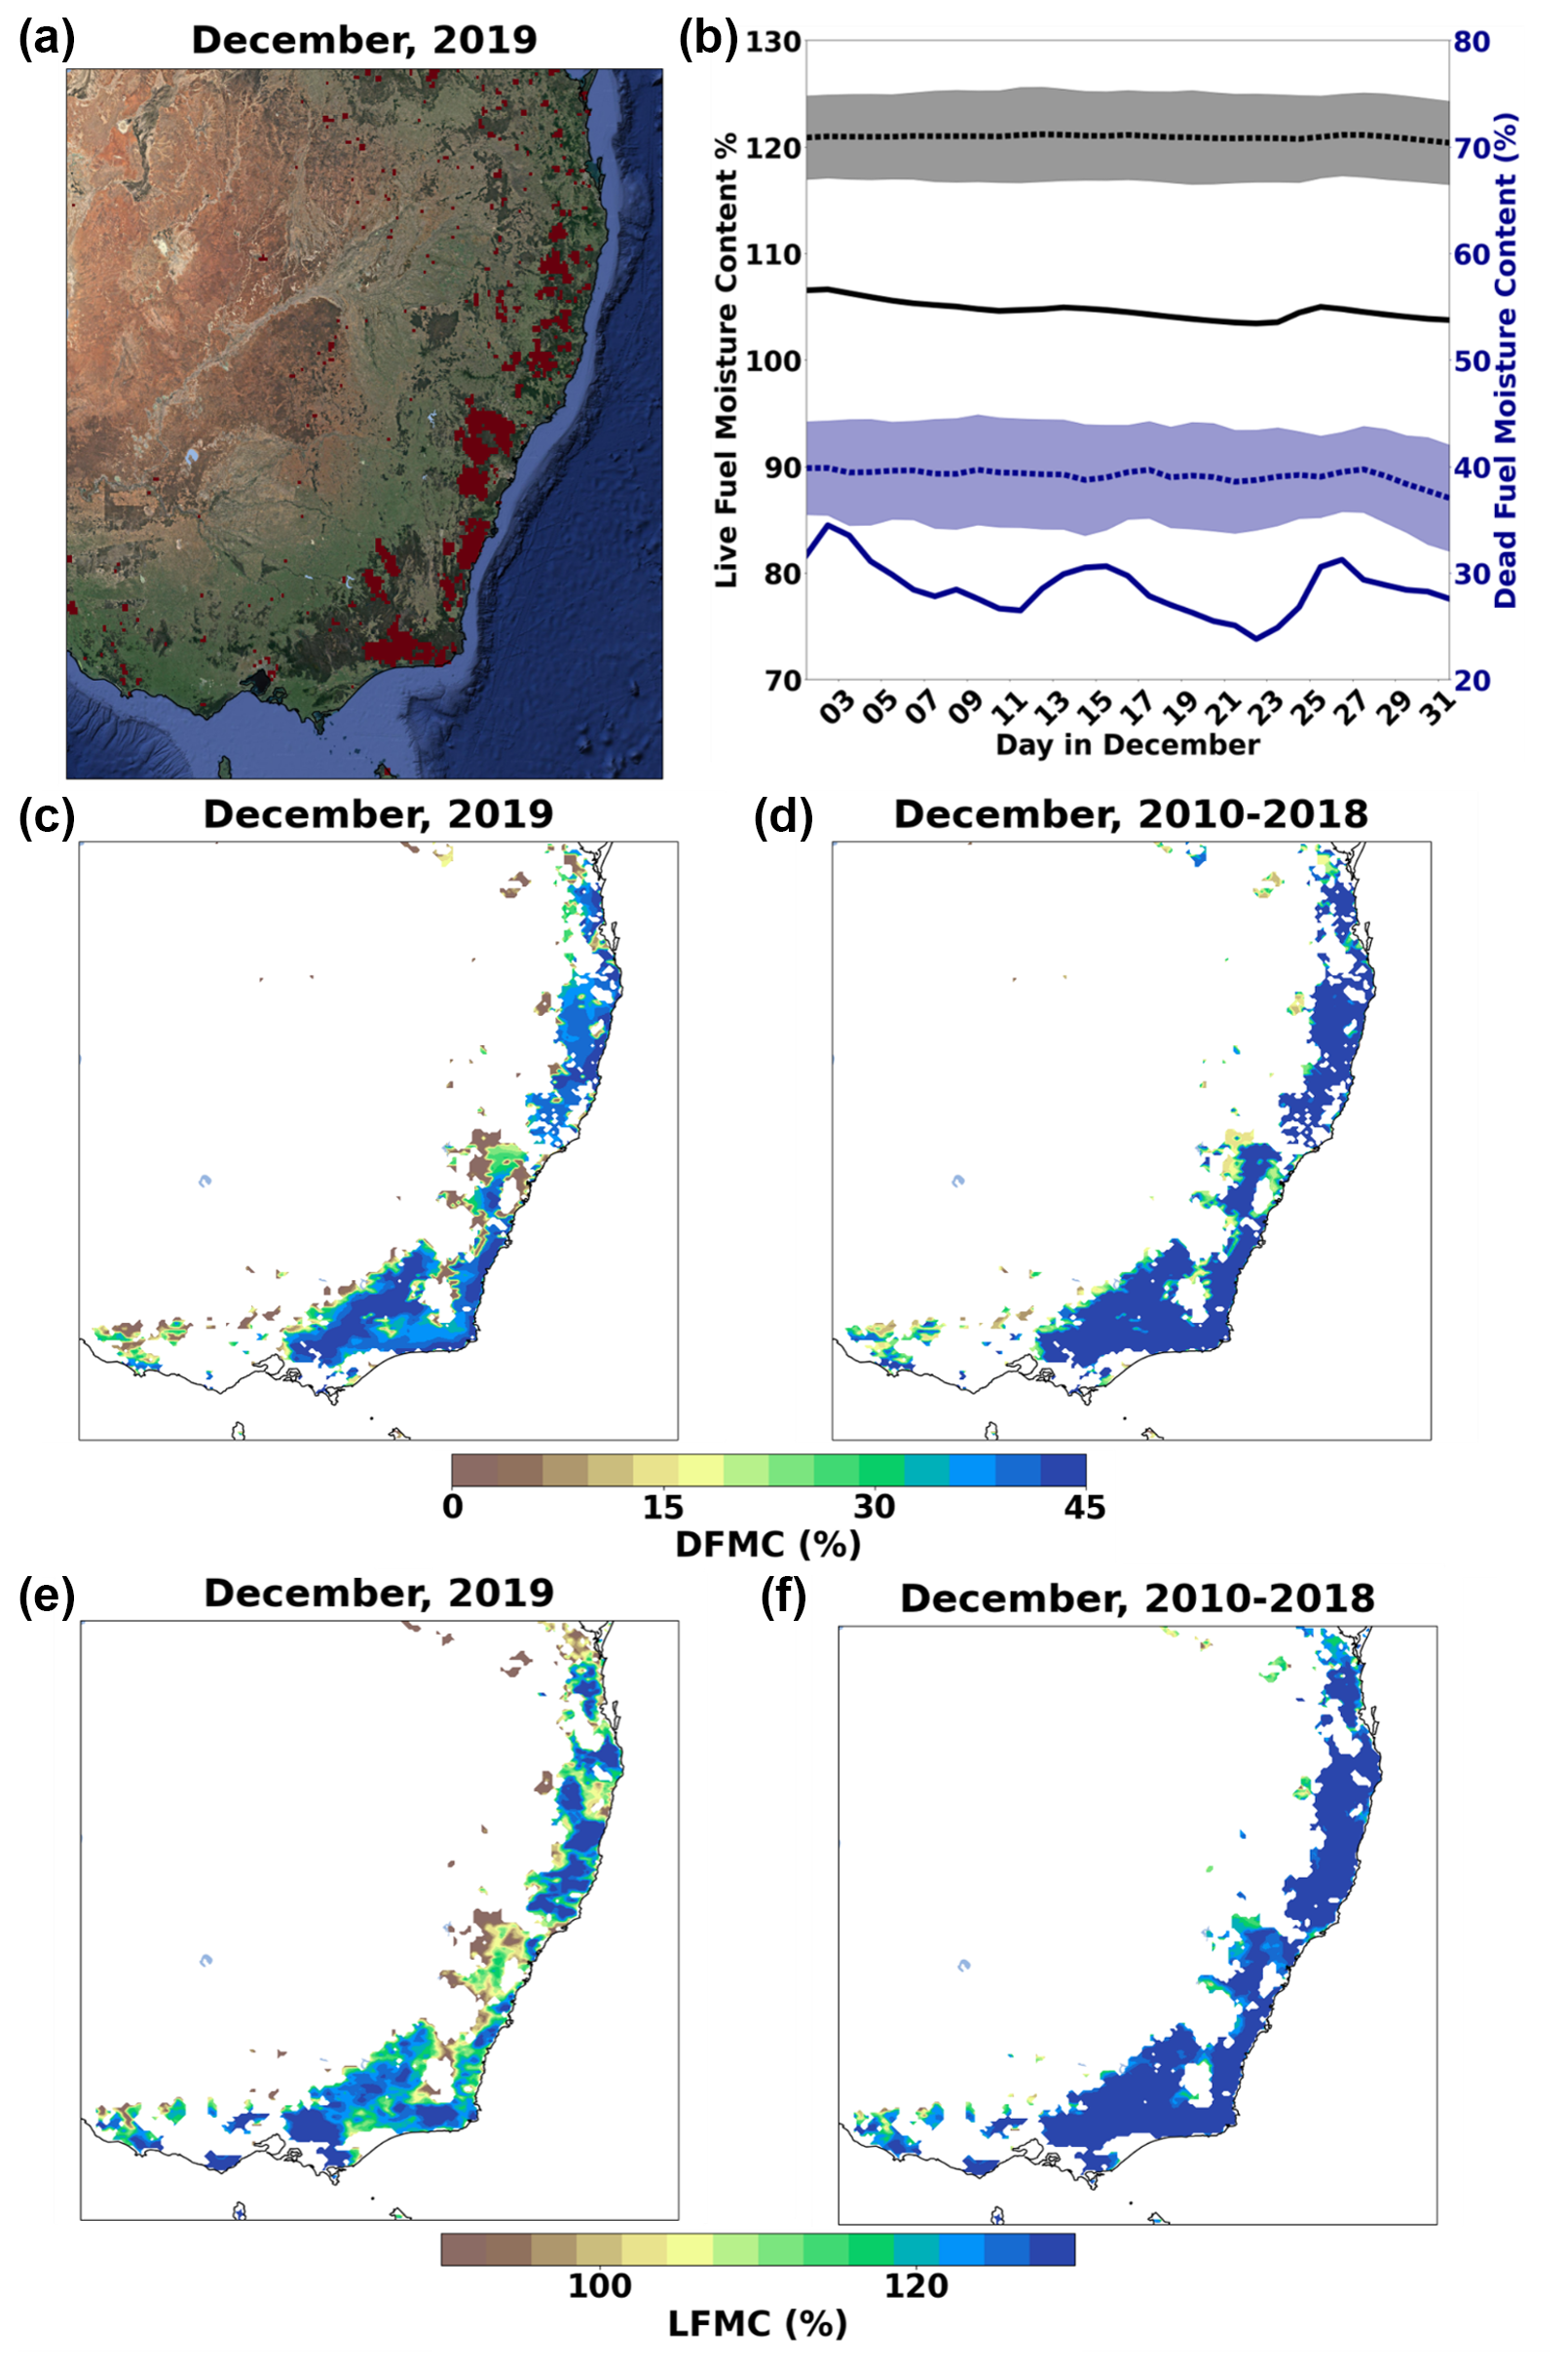
Figure 11Spatial distribution of December 2019 active fire detections from MODIS over southeast Australia, where red indicates positive detection (a). The December 2019 (solid line) and December 2010–2018 (dotted line) regional average live fuel moisture content (black) and dead fuel moisture content (blue) for the same domain (b). Also shown is a spatial representation at ∼9 km of the average December 2019 (a, c, e) and December 2010–2018 (b, d, f) dead (c, d) and live (e, f) fuel moisture content.
The wildfire season in 2019 occurred for multiple months either side of December, and as a result, no significant trend in DFMC or LFMC is identified throughout the month. Both DFMC and LFMC values fall below the spread of the climatology for all days of the month. As with the previous case studies, DFMC exhibits a higher variability throughout the month, ± 2.4 %, relative to LFMC, ± 0.8 %.
Various fire indices are used to define fire risk, including the fire severity index (FSI; Van Wagner, 1987). Like the FWI, the FSI is based on meteorological inputs and neglects land surface variables. The FSI is currently used operationally at ECMWF within the fire danger system (Di Giuseppe et al., 2016). We compared our area averaged daily fuel load and moisture with the FSI over several fire prone regions over the 10-year period for which the dataset is available. These were then evaluated against active fire counts from MODIS over the region at a daily frequency. As previously mentioned, the phenology influences LFMC, and as a simple approach to correct for this, we used the monthly anomaly of LFMC to illustrate fire danger.
The results show that FSI is typically well correlated with fire activities in the selected domains (Fig. 12). It should be noted that high FSI values are also found in regions with little or no fire activity, for example, hot deserts, which are not shown. This is because little or no vegetation cover can still result in high FSI values, as this index only accounts for weather conditions. The regions and times selected include several significant wildfire events, but the intention here is to also evaluate the interannual and seasonal variability of the fire prone regions and evaluate how well the different variables correlate with fire activity.
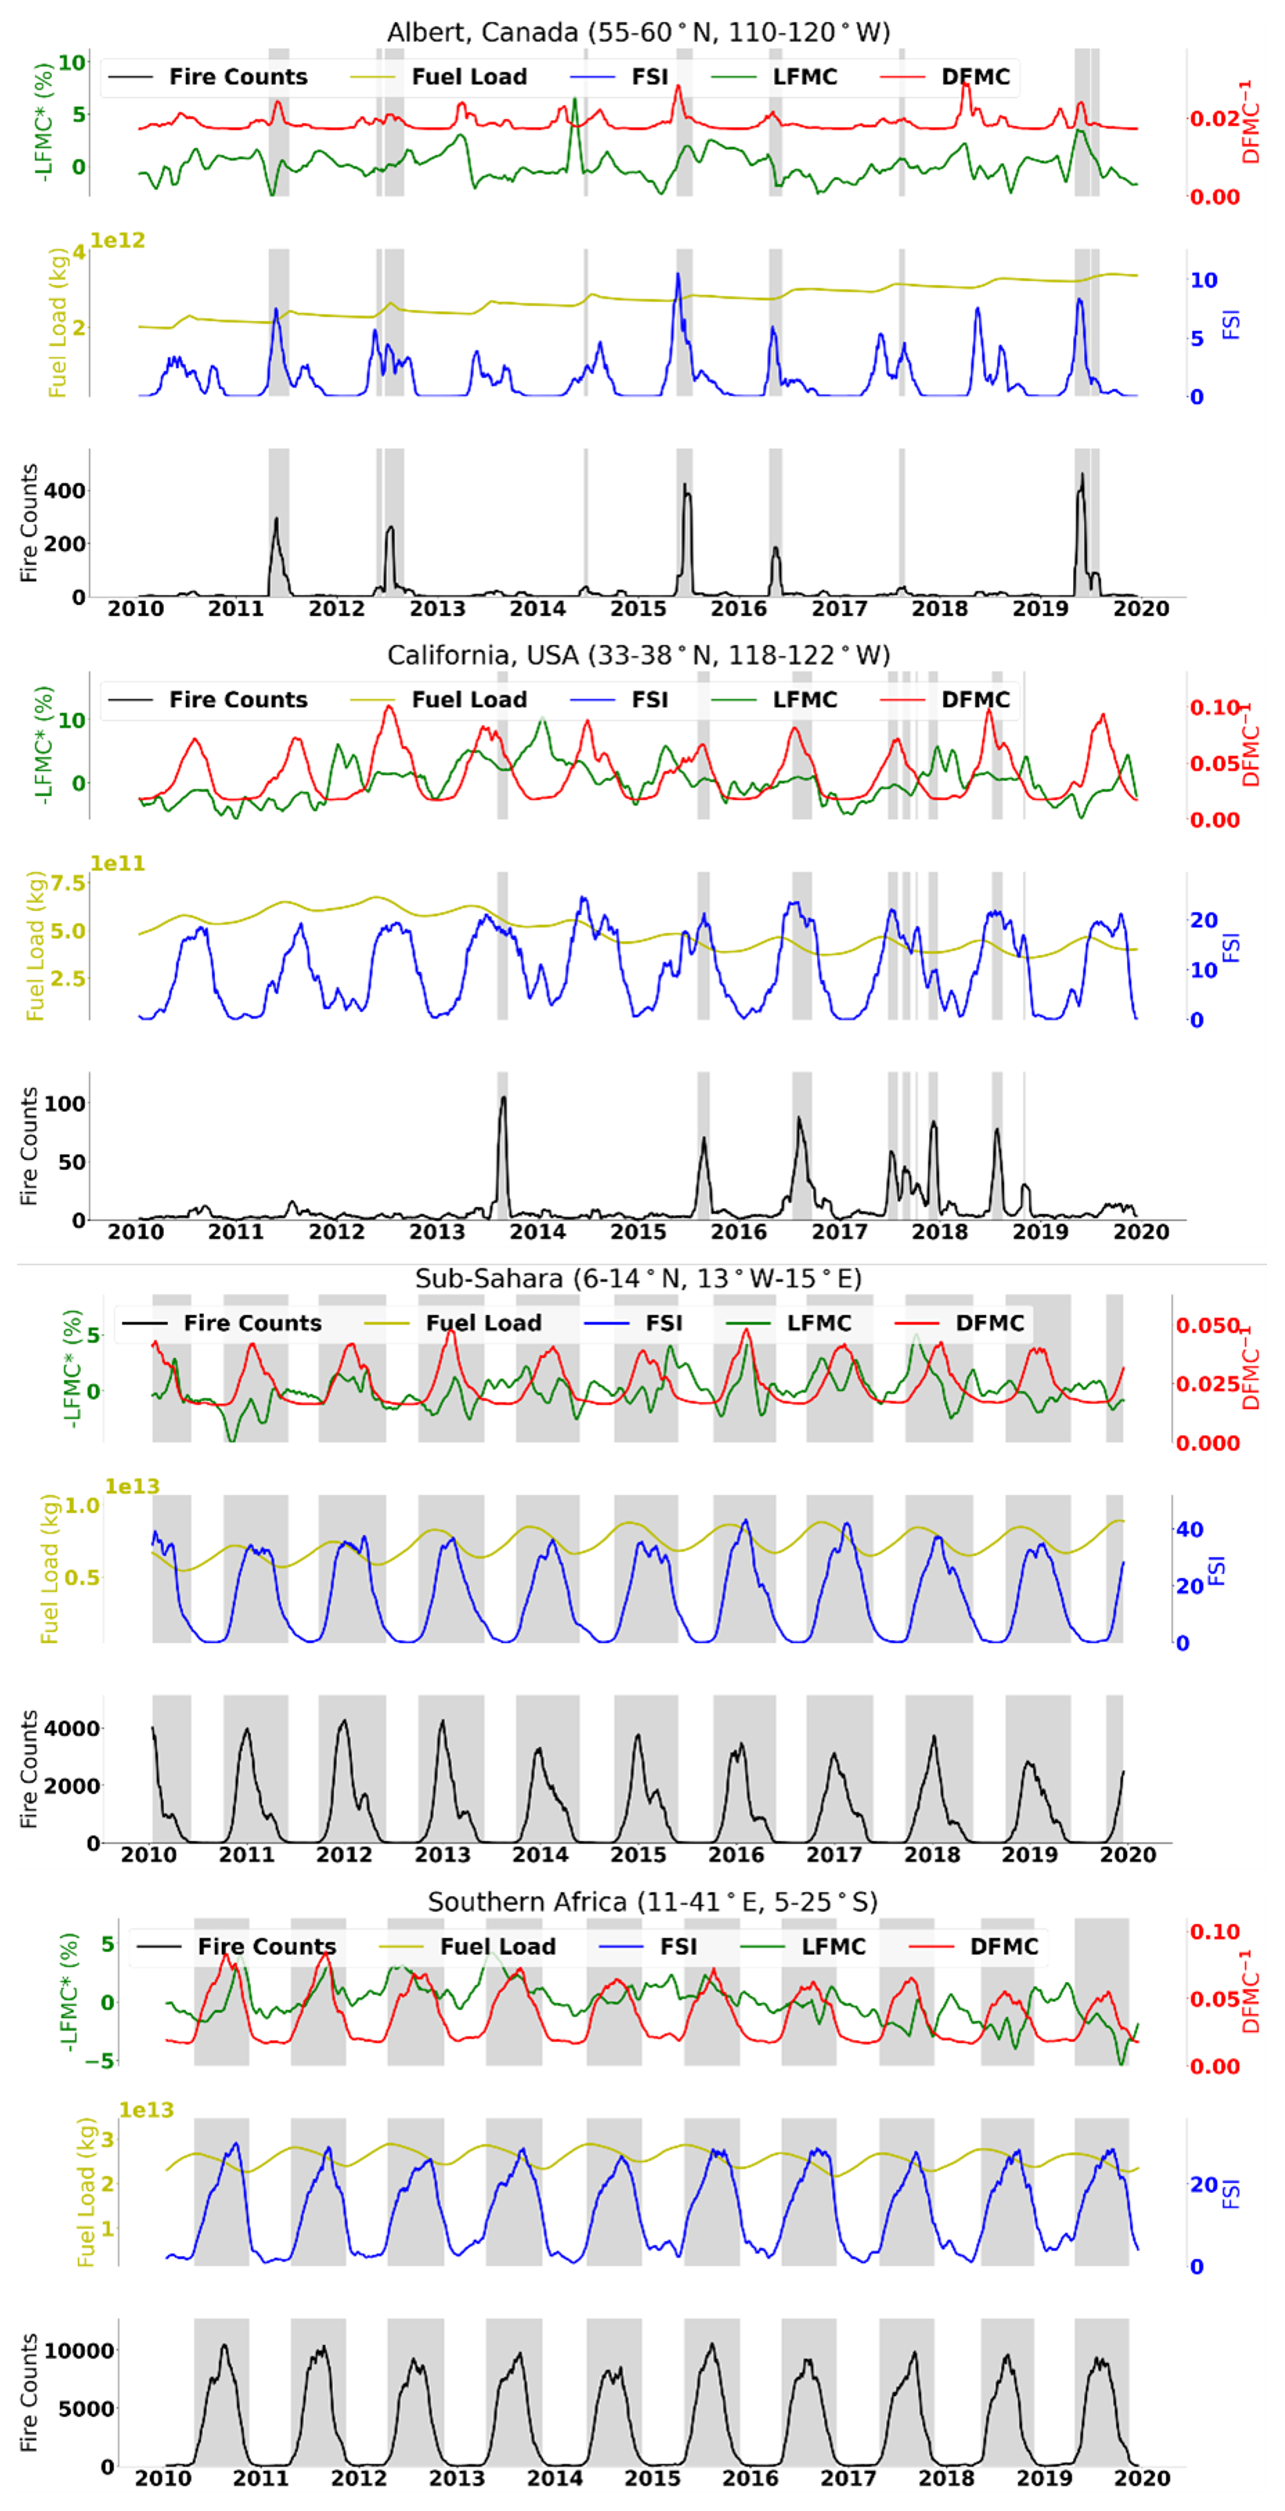
Figure 12Time series between 2010 and 2019 of fire counts (black), fuel load (yellow), FSI (blue), negative LFMC anomaly (green), DFMC−1 (red) for Albert, Canada (top), California, USA (second panel), northern sub-Sahara (third panel), and southern Africa (bottom) using a 30 d average. Shaded regions denote active fire seasons.
The Alberta, Canada, domain is also dominated by evergreen needleleaf forests. During the time series two significant fires events occurred in the region: the Richardson fire between May and July of 2011, which resulted in a burnt area of evergreen needleleaf forest of 5800 km2 (Pinno et al., 2013), and the entire 2019 wildfire season. Both the 2012 and 2015 fire seasons also saw significant fire activity. For ease of analysis, we considered the inverse of both LFMC and DFMC as the correlation variable. Seasonal fire activity is reasonably well captured by both FSI (R=0.58) and DFMC (R=0.38), whilst the LFMC anomaly (R=0.18) is less well correlated due to the relationship between phenology and LFMC. Given that DFMC, FSI, and LFMC are not the only contributors to fire activity, a larger correlation value was not necessarily expected. The skill of the FSI is unsurprising given that the index was developed using similar evergreen needleleaf forests. Both DFMC and FSI values suggested an active fire season in 2018, which was not reflected by fire counts, possibly owing to a lack of ignitions. Although the LFMC anomaly generally correlated weakly with fire activity, the second lowest LFMC anomaly in the dataset coincided with the active fire season in 2019. As expected, the low interannual and seasonal variability in fuel load is not found to be a contributing factor to fire activity.
In California, USA, domain seasonal fires are common, and the largest within the period was the Thomas fire in December 2017 resulting in a burnt area of 1100 km2 (Nauslar et al., 2018). The fuel load in the region is dominated by evergreen needleleaf forest in our model, but the Thomas fire specifically involved the burning of various vegetation types. As with the Alberta domain, the FSI (R=0.84) was developed for such environments and so performs well at representing active fire seasons, as does DFMC (R=0.90). The LFMC anomaly showed a weaker correlation with fire activity (R=0.35). The interannual variability in fire activity is not well reflected in either DFMC or FSI, as these values represent the fire risk only in the event of an ignition. As an example, the lowest regional DFMC and highest FSI occurred in 2012 and 2014, respectively, and neither year saw significant fire activity. The Thomas fire occurred when the fire risk forecast, given by FSI, was low, as was the regional DFMC. There was, however, an anomalously low LFMC during that period (third lowest in the 10-year record), suggesting that had LFMC been considered in fire risk, a more accurate forecast may have been provided. Seasonal variability in fuel load is small and not thought to be a contributing factor in fire activity; however, fuel type, dead/alive, and leaf/wood may influence the likelihood of fire in the region and requires further investigation.
The sub-Saharan Northern Hemisphere region of Africa, including the Sahel, encompasses large fire prone savannah areas. The region contributes approximately one-third of the total burnt area globally for a given year (Humber et al., 2019). Agricultural burns are common in the region and are, in part, independent of the metrics used in this study. The difference in vegetation makes the nature of savannah wildfires noticeably different to the previously evaluated forest fires. Unlike the two previous case studies, fires in the region are often fuel limited with fast turnover savannah grasses returning in the growing season. Although fire counts correlated well with both DFMC (R=0.86) and FSI (R=0.84), both variables tend to peak in the last week of January toward the end of the dry season. In contrast to this, fire counts and fuel load typically peak in the last week of December, and this is caused by a reduction in available fuel later in the dry season. Given a relatively small interannual variability in fire season, the anomaly in LFMC is not a useful variable for interannual prediction.
The southern Africa domain encompasses deciduous and evergreen broadleaf forests in the north and broadleaf savannah and deciduous shrubland in the south. As with the Northern Hemisphere sub-Sahara African domain, agricultural burns in the area are common resulting in fire counts unrelated to fuel characteristics. Both the DFMC (R=0.94) and FSI (R=0.86) correlated well with fire counts; however, they suggest a prolonged fire season with a seasonal peak at the start and end of September, respectively. This contrasts with the fire count data, which show a relatively short fire season, peaking in August whilst the fuel load is still high. This once again highlights the importance of considering fuel load in forecasting fire activity. LFMC is only weakly correlated with fire count (R=0.15); however, three of the four most active fire seasons, 2010, 2011, and 2013, coincide with the 3 years with the lowest LFMC anomalies.
These results provide examples of fire thresholds as described by Kelley et al. (2019). These thresholds for fire activity can be controlled by either fuel load availability, fuel moisture content, ignition frequency, suppression capacity, or a combination of all of these. (It should be noted that the fire risk thresholds specific to the vegetation type described in the previous section are not included in this evaluation.)
A global comparison with MODIS active fire and our modelled fuel moisture was performed to evaluate potential thresholds for fire activity. The comparison was made by first selecting only locations where active fires were detected at least five times in the 10-year period. For simplicity, for this analysis we ignore potential limitations of fuel load. For both DFMC and LFMC, thresholds were expected to be vegetation-type dependent, and as a result, we categorized each grid cell globally by the dominant type in the ECLand model. We defined threshold values for fire risk based on the ratio of fire-detected to non-fire-detected values, for both DFMC and LFMC (Fig. 13). If the percentage of fire detections relative to non-fire detections for a given moisture content exceeds 6.0 %, the fire risk is considered extreme. Additional risk values are applied based on the percentage of fire detections relative to non-fire detections for very high risk (4.5 %), high risk (3 %), moderate risk (2 %), low risk (1.5 %), and very low risk (1 %). These thresholds are intended as a simplified measure of fire risk and would need to be further refined based on fuel load and atmospheric conditions to generate a fire risk forecast.
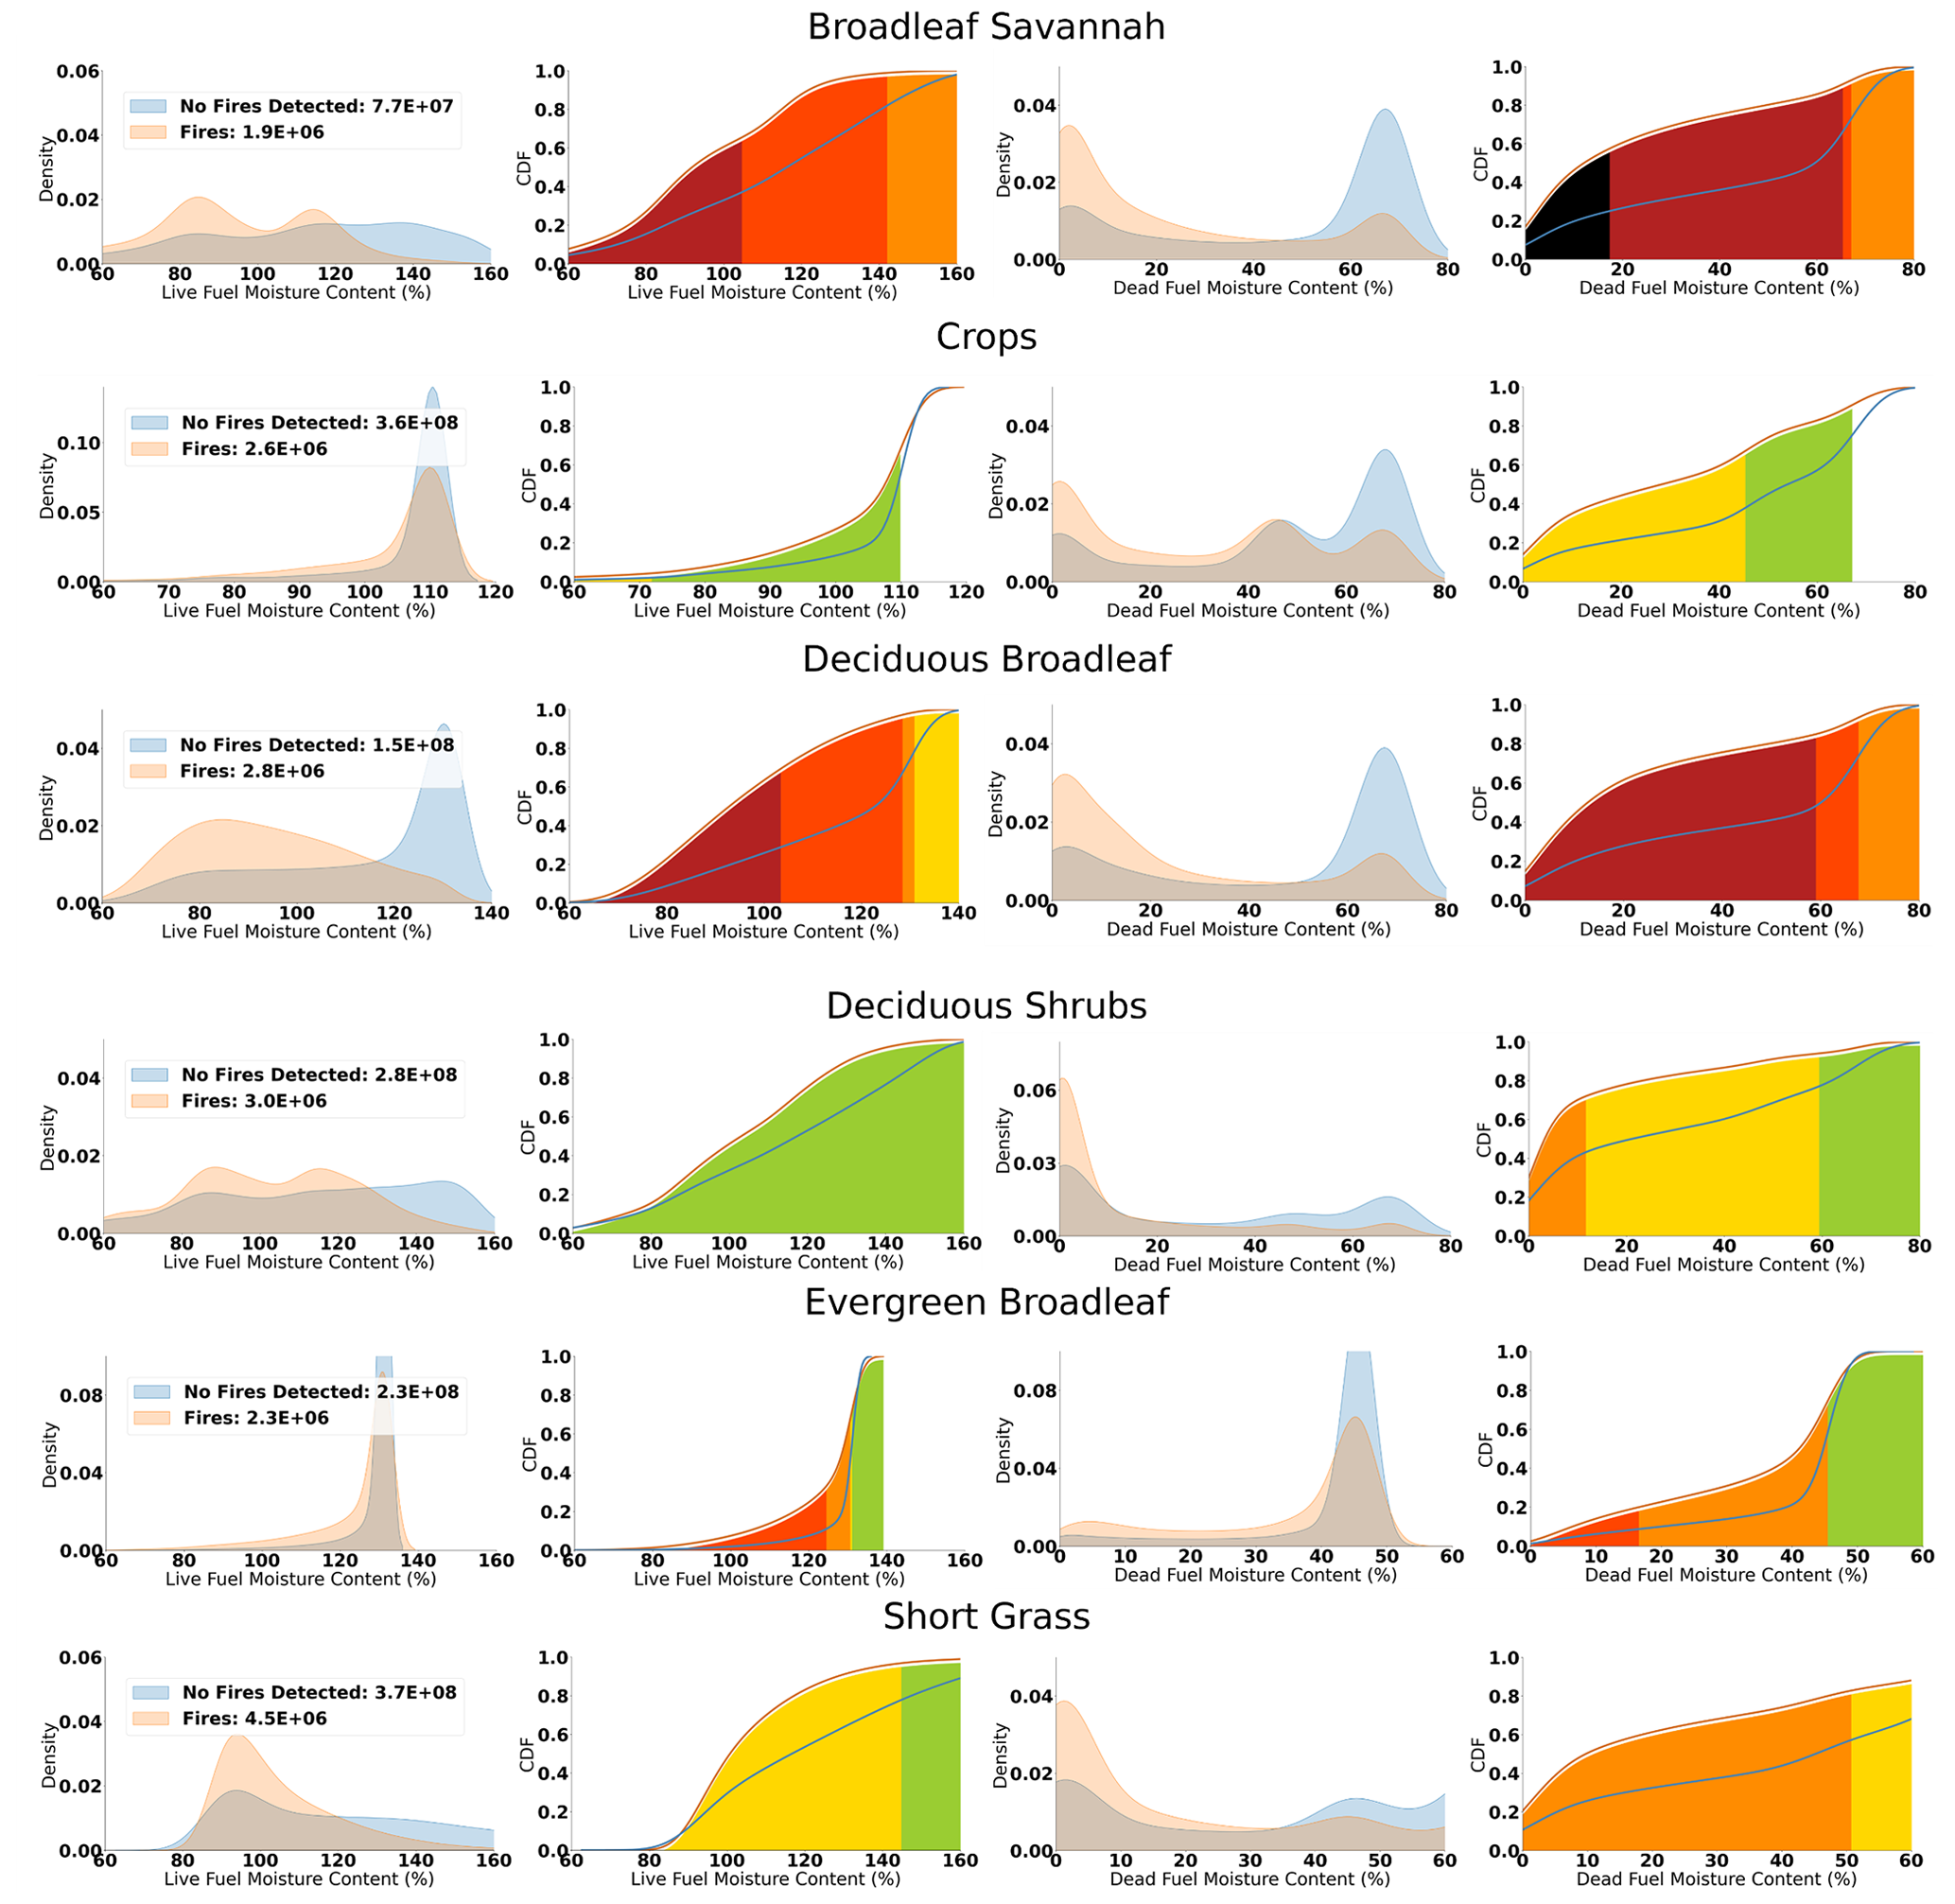
Figure 13A kernel density estimation (KDE; first and third columns) and cumulative distribution function (CDF; second and fourth columns) for both live (first and second columns) and dead (third and fourth columns) fuel moisture content for the six vegetation types where fires most frequently occur. The KDE plots are divided between values where active fire detection occurred (red curve) and where no detection occurred (blue curve), with the total number of values to which this is applicable in the legend. Similarly, the CDF is split between active fire detection values (red line) and no detection (blue line). The shaded regions below the red CDF curve indicate the moisture content thresholds for very low (green), low (yellow), moderate (orange), high (orange-red), very high (red), and extreme (black) fire risk.
The results show the fuel moisture is negatively correlated with fire activity for all vegetation types, and more so for DFMC, suggesting that our values are suitable as a proxy for fire danger. For LFMC the relationship is complicated by vegetation typically uptaking more moisture in the growing season and drying in the dormant season. The fire risk associated with LFMC should therefore consider plant phenology, which requires further investigation. The probability of fire occurrence differs between vegetation type as expected, which emphasizes the importance of categorizing fuel. Globally, fires most often occur over short grass, for which we estimate a moderate fire risk for DFMC below 51 % or a low fire risk for LFMC below 145 % or DFMC between 51 % and 68 %. These relatively low risks are expected given that short grass has the largest global coverage of the vegetation types. Relative to the number of grid cells considered for each vegetation type, fires most often occur in broadleaf savannah regions, with active fires detected in fire prone regions 2.5 % of the time, followed by deciduous broadleaf, 1.8 %. When the LFMC drops below 104 % in both these regions, the fire risk increases to very high, whilst for DFMC this occurs when values drop below 65 % for broadleaf savannah and 58 % for deciduous broadleaf. The fire risk in broadleaf savannah becomes extreme for DFMC values below 17 %. We only report on fire risk for the six vegetation types which have the highest fire occurrence; however, fire risks are generated for all vegetation types in ECLand.
This study provides the methodology for modelling fuel characteristics relevant for wildfires suitable for an operational forecasting system. More specifically, we outline a framework for estimating fuel load and moisture into four distinct categories: live foliage, live wood, dead foliage, and dead wood. To complement the methodology, we have compiled a 10-year daily global dataset at 9 km horizontal resolution based on a combination of modelling and earth observation data. The framework permits for characterization at a higher spatiotemporal resolution, with plans to introduce this in the IFS infrastructure hosted by ECMWF.
We found that approximately 78 % of global above-ground fuel is made up of living matter, 2 % is leaf, and 76 % is wood, although this figure varies considerably between regions and time of the year. Spatially, 63 % of the total fuel is found in tropical regions with the rest split between boreal, 19 %, and temperate, 18 %, regions, in agreement with previous studies (Pan et al., 2011; Erb et al., 2018). The fuel type, not just load, is important for assessing not just fire danger but even fire type (ground, crown, etc.). At any given time, most fuel is not suitable for burning owing to a high fuel moisture content. The consideration of fuel type and load is currently missing from operational fire danger models and such an approach affords the opportunity to easily improve the ability to predict wildfire risk.
The derived fuel load was found to be in good agreement with previous studies (Matasci et al., 2018; Soto-Navarro et al., 2020; Mauro et al., 2021; Rodriguez Veiga and Balzter, 2021), although the seasonality of the fuel load and type requires further validation when future observation-based products become available. The 2010–2019 dataset presented here is constrained by available observation-based AGB estimates, which are required to bias correct model NEE. However, in an operational context it may be possible to utilize a bias correction scheme based on atmospheric CO2 inversions (Agustí-Panareda et al., 2019). This may be favourable as the scheme is used operationally and has been extensively validated using observations. Land use change, which is not modelled, limits the accuracy of the derived fuel load in some regions where the vegetation type is likely to change. The fuel load reported here does not include the reduction in load in response to fire activity, as such changes require a fully integrated fire model.
As with fuel load, fuel moisture was derived for both live and dead vegetation. Live fuel moisture was computed based on a vegetation-dependent asymptotic regression of LAI and four layers of soil moisture, which was trained from observed fuel moisture content (Yebra et al., 2019). We generally found good spatiotemporal agreement with moisture derived from satellite observations reported by Quan et al. (2021); however, our estimated range in moisture content is lower than their estimates and the overall average LFMC is 20 % lower. Whilst there is general agreement when considering herbaceous vegetation types, there is a poor correlation over forested areas. The reasons for this are unclear and could relate to the difficulty in estimating below-canopy moisture content from MODIS.
Dead fuel moisture was estimated by expanding the Nelson model for moisture to 1, 10, 100, and 1000 h fuels (Nelson, 2000). This was derived using ERA-5 meteorology and ECLand vegetation types for both dead foliage, including small branches, and for slow drying dead wood. Several assumptions are made about the structure of dead fuel and the vegetation-specific fuel allocation for different drying times. As globally derived DFMC is not available, we validated the estimated DFMC, alongside LFMC, by comparing values with several significant fire episodes in different biomes. The results showed that fire occurrence increased as both LFMC and DFMC decreased for all case studies. DFMC most closely represents operational fire risk products relating to FWI, and evaluation against one such product, FSI, showed general agreement between the two variables.
Vegetation-specific fire risk based on both live and dead moisture content was derived by comparing active fire detection and no detection from MODIS. These thresholds highlight the importance of considering vegetation type when evaluating fire risk. For example, broadleaf savanna exhibits an extremely high fire risk at low DFMC values (<17 %); however, high and very high risk exists for a broad range of DFMC values up to 65 %. Whereas only a small change in LFMC in evergreen broadleaf forests can result in a switch from very low (>131 %) to high risk (<124 %). These fire risks need to be refined further in future work and should factor in other components such as ignition sources, fuel, and meteorological conditions.
As a final validation we evaluated our fuel characteristics against an operational fire danger index, FSI, using observed fire counts over several fire prone regions. We found that whilst FSI typically correlates well with fire activity, it overestimates fire activity in fuel limited regions and neglects increased fire risk from low LFMC values. For one such incident, the Thomas fire in California, neither DFMC nor FSI accurately capture the expected fire behaviour; however, an anomalously low LFMC may have created the conditions by which the fire was able to spread effectively. In fuel limited savanna and shrubland regions FSI estimates a prolonged fire season, whereas the fire counts are considerably higher in the first part of the dry season when there is available fuel. This analysis highlights the importance of not just deriving fuel characteristics as a limiting factor in fire activity, but also of allocating both fuel load and moisture content appropriately into subcategories using available model information, such as vegetation type or LAI. Neither LFMC nor fuel load strongly correlate directly with fire activity; however, they should be considered when formulating both fire danger and fire spread as they are shown to influence fire activity depending on the domain of interest.
This study provides a framework by which coupled land–atmosphere models can estimate key fuel characteristics relevant for predicting fire activity in near real time. The dataset provided is intended for use by the wider community to investigate fire activity amongst other things. Of the variables included, DFMC most accurately represents existing fire danger indices, like FWI. The use of fuel load, type, and LFMC for fire risk requires further model development, although they already compare well with fire activity and are shown to be limiting or contributing factors to fire activity in certain regimes. The further development of a full fire risk and fire spread model requires consideration of ignition and spread based on meteorology and orography. Future modelling applications could use the framework outlined here to not only provide the risk of fire occurrence but also the risk of fire spread and intensity based on fuel characteristics and meteorology. The diagnosed fuel load and type can complement existing fire radiative power products to better estimate trace gas and aerosol emissions from wildfires. It should be noted that our estimates of fuel load currently neglect soil carbon, which can significantly contribute to ground fires and biomass burning emissions (Walker et al., 2020), but this will be incorporated in future versions of the fuel model.
The skill of our model is limited by potential drift in fuel load when unconstrained by observations, either through inverse trace gas analysis or direct AGB estimates. As a result, the framework would need to be further adapted for future climate scenarios but would be suitable for past climates where estimates of AGB are available.
The 2010–2019 daily ∼9 km resolution fuel characteristic dataset (ECMWF Fuel Characteristics V1) is hosted on the Copernicus Climate Data Store. It is currently only available by direct file transfer via ftp or sftp commands from cems_fuelmodel_data@aux.ecmwf.int with the password “fuelmodel”. The data are stored as monthly files in subfolders of fuel load and fuel moisture for both live and dead fuel.
Data will be made available through weblinks in the upcoming ECMWF Data Store.
The supplement related to this article is available online at: https://doi.org/10.5194/bg-21-279-2024-supplement.
JRM and FDG conceptualized the modelling framework. JRM gathered external data for use in the model. The model code was written by JRM. Analysis and dataset production were performed by JRM. The manuscript was written by JRM and FDG.
The contact author has declared that neither of the authors has any competing interests.
Publisher's note: Copernicus Publications remains neutral with regard to jurisdictional claims made in the text, published maps, institutional affiliations, or any other geographical representation in this paper. While Copernicus Publications makes every effort to include appropriate place names, the final responsibility lies with the authors.
This work was funded by the Copernicus Emergency Management Service contract no. 942604 between the Joint Research Centre and ECMWF.
This paper was edited by Paul Stoy and reviewed by two anonymous referees.
Agustí-Panareda, A., Massart, S., Chevallier, F., Balsamo, G., Boussetta, S., Dutra, E., and Beljaars, A.: A biogenic CO2 flux adjustment scheme for the mitigation of large-scale biases in global atmospheric CO2 analyses and forecasts, Atmos. Chem. Phys., 16, 10399–10418, https://doi.org/10.5194/acp-16-10399-2016, 2016.
Agustí-Panareda, A., Diamantakis, M., Massart, S., Chevallier, F., Muñoz-Sabater, J., Barré, J., Curcoll, R., Engelen, R., Langerock, B., Law, R. M., Loh, Z., Morguí, J. A., Parrington, M., Peuch, V.-H., Ramonet, M., Roehl, C., Vermeulen, A. T., Warneke, T., and Wunch, D.: Modelling CO2 weather – why horizontal resolution matters, Atmos. Chem. Phys., 19, 7347–7376, https://doi.org/10.5194/acp-19-7347-2019, 2019.
Badlan, R. L., Sharples, J. J., Evans, J. P., and McRae, R. H. D.: Factors influencing the development of violent pyroconvection. Part I: fire size and stability, Int. J. Wildland Fire, 30, 484–497, https://doi.org/10.1071/WF20040, 2021.
Boer, M. M., Nolan, R. H., Resco De Dios, V., Clarke, H., Price, O. F., and Bradstock, R. A.: Changing Weather Extremes Call for Early Warning of Potential for Catastrophic Fire, Earths Future, 5, 1196–1202, https://doi.org/10.1002/2017EF000657, 2017.
Boussetta, S. and Balsamo, G.: Vegetation dataset of Land Use/Land Cover and Leaf Area Index. CONFESS-H2020, https://confessh2020.files.wordpress.com/2021/08/confess-d1-1-v1-0-.pdf (last access: 21 August 2023), 2021.
Boussetta, S., Balsamo, G., Beljaars, A., Panareda, A.-A., Calvet, J.-C., Jacobs, C., van den Hurk, B., Viterbo, P., Lafont, S., Dutra, E., Jarlan, L., Balzarolo, M., Papale, D., and van der Werf, G.: Natural land carbon dioxide exchanges in the ECMWF integrated forecasting system: Implementation and offline validation, J. Geophys. Res.-Atmos., 118, 5923–5946, https://doi.org/10.1002/jgrd.50488, 2013.
Boussetta, S., Balsamo, G., Arduini, G., Dutra, E., McNorton, J., Choulga, M., Agustí-Panareda, A., Beljaars, A., Wedi, N., Munõz-Sabater, J., de Rosnay, P., Sandu, I., Hadade, I., Carver, G., Mazzetti, C., Prudhomme, C., Yamazaki, D., and Zsoter, E.: ECLand: The ECMWF Land Surface Modelling System, Atmosphere, 12, 723, https://doi.org/10.3390/atmos12060723, 2021.
Bouvet, A., Mermoz, S., le Toan, T., Villard, L., Mathieu, R., Naidoo, L., and Asner, G. P.: An above-ground biomass map of African savannahs and woodlands at 25 m resolution derived from ALOS PALSAR, Remote Sens. Environ., 206, 156–173, https://doi.org/10.1016/j.rse.2017.12.030, 2018.
Bustillo Sánchez, M., Tonini, M., Mapelli, A., and Fiorucci, P.: Spatial assessment of wildfires susceptibility in Santa Cruz (Bolivia) using random forest, Geosciences (Switzerland), 11, 224, https://doi.org/10.3390/geosciences11050224, 2021.
Carlson, J. D., Bradshaw, L. S., Nelson, R. M., Bensch, R. R., and Jabrzemski, R.: Application of the Nelson model to four timelag fuel classes using Oklahoma field observations: model evaluation and comparison with National Fire Danger Rating System algorithms, Int. J. Wildland Fire, 16, 204–216, https://doi.org/10.1071/WF06073, 2007.
Castro, F. X., Tudela, A., and Sebastià, M. T.: Modeling moisture content in shrubs to predict fire risk in Catalonia (Spain), Agr. Forest Meteorol., 116, 49–59, https://doi.org/10.1016/S0168-1923(02)00248-4, 2003.
Chevallier, F., Ciais, P., Conway, T., Aalto, T., Anderson, B., Bousquet, P., Brunke, E., Ciattaglia, L., Esaki, Y., Fröhlich, M., Gomez, A., Gomez-Pelaez, A., Haszpra, L., Krummel, P., Langenfelds, R., Leuenberger, M., Machida, T., Maignan, F., Matsueda, H., Morguí, J., Mukai, H., Nakazawa, T., Peylin, P., Ramonet, M., Rivier, L., Sawa, Y., Schmidt, M., Steele, L., Vay, S., Vermeulen, A., Wofsy, S., and Worthy, D.: CO2 surface fluxes at grid point scale estimated from a global 21 year reanalysis of atmospheric measurements, J. Geophys. Res.-Atmos., 115, D21307, https://doi.org/10.1029/2010JD013887, 2010.
Davey, S. M. and Sarre, A.: Editorial: the 2019/20 Black Summer bushfires, Aust. Forestry, 83, 47–51, https://doi.org/10.1080/00049158.2020.1769899, 2020.
Deb, P., Moradkhani, H., Abbaszadeh, P., Kiem, A. S., Engström, J., Keellings, D., and Sharma, A.: Causes of the Widespread 2019–2020 Australian Bushfire Season, Earths Future, 8, e2020EF001671, https://doi.org/10.1029/2020EF001671, 2020.
Deeming, J. E., Burgan, R. E., and Cohen, J. D.: The national fire-danger rating system–1978, Intermountain Forest and Range Experiment Station, Forest Service, USA, 1977.
Di Giuseppe, F., Pappenberger, F., Wetterhall, F., Krzeminski, B., Camia, A., Libertá, G., and San Miguel, J.: The Potential Predictability of Fire Danger Provided by Numerical Weather Prediction, J. Appl. Meteorol. Clim., 55, 2469–2491, https://doi.org/10.1175/JAMC-D-15-0297.1, 2016.
Enquist, B. J., Brown, J. H., and West, G. B.: Allometric scaling of plant energetics and population density, Nature, 395, 163–165, https://doi.org/10.1038/25977, 1998.
Erb, K.-H., Kastner, T., Plutzar, C., Bais, A. L. S., Carvalhais, N., Fetzel, T., Gingrich, S., Haberl, H., Lauk, C., Niedertscheider, M., Pongratz, J., Thurner, M., and Luyssaert, S.: Unexpectedly large impact of forest management and grazing on global vegetation biomass, Nature, 553, 73–76, https://doi.org/10.1038/nature25138, 2018.
Filkov, A. I., Ngo, T., Matthews, S., Telfer, S., and Penman, T. D.: Impact of Australia's catastrophic 2019/20 bushfire season on communities and environment. Retrospective analysis and current trends, Journal of Safety Science and Resilience, 1, 44–56, https://doi.org/10.1016/j.jnlssr.2020.06.009, 2020.
Forkel, M., Schmidt, L., Zotta, R.-M., Dorigo, W., and Yebra, M.: Estimating leaf moisture content at global scale from passive microwave satellite observations of vegetation optical depth, Hydrol. Earth Syst. Sci., 27, 39–68, https://doi.org/10.5194/hess-27-39-2023, 2023.
Giglio, L., Schroeder, W., and Justice, C. O.: The collection 6 MODIS active fire detection algorithm and fire products, Remote Sens. Environ., 178, 31–41, https://doi.org/10.1016/j.rse.2016.02.054, 2016.
Giglio, L., Schroeder, W., Hall, J., and Justice, C.: MODIS Collection 6 Active Fire Product User's Guide Revision C, https://modis-fire.umd.edu/files/MODIS_C6_Fire_User_Guide_C.pdf (last access: 21 August 2023), 2020.
Harper, A. B., Cox, P. M., Friedlingstein, P., Wiltshire, A. J., Jones, C. D., Sitch, S., Mercado, L. M., Groenendijk, M., Robertson, E., Kattge, J., Bönisch, G., Atkin, O. K., Bahn, M., Cornelissen, J., Niinemets, Ü., Onipchenko, V., Peñuelas, J., Poorter, L., Reich, P. B., Soudzilovskaia, N. A., and Bodegom, P. V.: Improved representation of plant functional types and physiology in the Joint UK Land Environment Simulator (JULES v4.2) using plant trait information, Geosci. Model Dev., 9, 2415–2440, https://doi.org/10.5194/gmd-9-2415-2016, 2016.
Harper, A. B., Wiltshire, A. J., Cox, P. M., Friedlingstein, P., Jones, C. D., Mercado, L. M., Sitch, S., Williams, K., and Duran-Rojas, C.: Vegetation distribution and terrestrial carbon cycle in a carbon cycle configuration of JULES4.6 with new plant functional types, Geosci. Model Dev., 11, 2857–2873, https://doi.org/10.5194/gmd-11-2857-2018, 2018.
Hersbach, H., Bell, B., Berrisford, P., Hirahara. S., Horányi, A., Muñoz-Sabater, J., Nicolas, J., Peubey, C., Radu, R., Schepers, D., Simmons, A., Soci, C., Abdalla, S., Abellan, X., Balsamo, G., Bechtold, P., Biavati, G., Bidlot, J., Bonavita, M., De Chiara, G., Dahlgren, P., Dee, D., Diamantakis, M., Dragani, R., Flemming, J., Forbes, R., Fuentes, M., Geer, A., Haimberger, L., Healy, S., Hogan, R., Hólm, E., Janisková, M., Keeley, S., Laloyaux, P., Lopez, P., Lupu, C., Radnoti, G., de Rosnay, P. Rozum, I., Vamborg, F., Villaume, S., and Thépaut, J.: The ERA5 global reanalysis, Q. J. Roy. Meteor. Soc., 146, 1999–2049, https://doi.org/10.1002/qj.3803, 2020.
Humber, M. L., Boschetti, L., Giglio, L., and Justice, C. O.: Spatial and temporal intercomparison of four global burned area products, Int. J. Digit. Earth, 12, 460–484, https://doi.org/10.1080/17538947.2018.1433727, 2019.
Kelley, D. I., Bistinas, I., Whitley, R., Burton, C., Marthews, T. R., and Dong, N.: How contemporary bioclimatic and human controls change global fire regimes, Nat. Clim. Change, 9, 690–696, https://doi.org/10.1038/s41558-019-0540-7, 2019.
Kochtubajda, B., Stewart, R. E., Flannigan, M. D., Bonsal, B. R., Cuell, C., and Mooney, C. J.: An Assessment of Surface and Atmospheric Conditions Associated with the Extreme 2014 Wildfire Season in Canada's Northwest Territories, Atmos. Ocean, 57, 73–90, https://doi.org/10.1080/07055900.2019.1576023, 2019.
Matasci, G., Hermosilla, T., Wulder, M. A., White, J. C., Coops, N. C., Hobart, G. W., Bolton, D. K., Tompalski, P., and Bater, C. W.: Three decades of forest structural dynamics over Canada's forested ecosystems using Landsat time-series and lidar plots, Remote Sens. Environ., 216, 697–714, https://doi.org/10.1016/j.rse.2018.07.024, 2018.
Matthews, S.: Dead fuel moisture research: 1991–2012, Int. J. Wildland Fire, 23, 78–92, https://doi.org/10.1071/WF13005, 2014.
Mauro, F., Hudak, A. T., Fekety, P. A., Frank, B., Temesgen, H., Bell, D. M., Gregory, M. J., and McCarley, T. R.: Regional modeling of forest fuels and structural attributes using airborne laser scanning data in Oregon, Remote Sens.-Basel, 13, 1–38, https://doi.org/10.3390/rs13020261, 2021.
Muñoz-Sabater, J., Dutra, E., Agustí-Panareda, A., Albergel, C., Arduini, G., Balsamo, G., Boussetta, S., Choulga, M., Harrigan, S., Hersbach, H., Martens, B., Miralles, D. G., Piles, M., Rodríguez-Fernández, N. J., Zsoter, E., Buontempo, C., and Thépaut, J.-N.: ERA5-Land: a state-of-the-art global reanalysis dataset for land applications, Earth Syst. Sci. Data, 13, 4349–4383, https://doi.org/10.5194/essd-13-4349-2021, 2021.
Nauslar, N. J., Abatzoglou, J. T., and Marsh, P. T.: The 2017 north bay and southern california fires: A case study, Fire, 1, 1–17, https://doi.org/10.3390/fire1010018, 2018.
Nelson Jr., R. M.: Prediction of diurnal change in 10 h fuel stick moisture content, Can. J. Forest Res., 30, 1071–1087, https://doi.org/10.1139/x00-032, 2000.
Pan, Y., Birdsey, R. A., Fang, J., Houghton, R., Kauppi, P. E., Kurz, W. A., Phillips, O. L., Shvidenko, A., Lewis, S. L., Canadell, J. G., Ciais, P., Jackson, R. B., Pacala, S. W., McGuire, A. D., Piao, S., Rautiainen, A., Sitch, S., and Hayes, D.: A Large and Persistent Carbon Sink in the World's Forests, Science, 333, 988–993, https://doi.org/10.1126/science.1201609, 2011.
Pinno, B. D., Errington, R. C., and Thompson, D. K.: Young jack pine and high severity fire combine to create potentially expansive areas of understocked forest, Forest Ecol. Manag., 310, 517–522, https://doi.org/10.1016/j.foreco.2013.08.055, 2013.
Pinto, P., Silva, Á. P., Viegas, D. X., Almeida, M., Raposo, J., and Ribeiro, L. M.: Influence of Convectively Driven Flows in the Course of a Large Fire in Portugal: The Case of Pedrógão Grande, Atmosphere-Basel, 13, 414, https://doi.org/10.3390/atmos13030414, 2022.
Quan, X., Yebra, M., Riaño, D., He, B., Lai, G., and Liu, X.: Global fuel moisture content mapping from MODIS, Int. J. Appl. Earth Obs., 101, 102354, https://doi.org/10.1016/j.jag.2021.102354, 2021.
Rabin, S. S., Melton, J. R., Lasslop, G., Bachelet, D., Forrest, M., Hantson, S., Kaplan, J. O., Li, F., Mangeon, S., Ward, D. S., Yue, C., Arora, V. K., Hickler, T., Kloster, S., Knorr, W., Nieradzik, L., Spessa, A., Folberth, G. A., Sheehan, T., Voulgarakis, A., Kelley, D. I., Prentice, I. C., Sitch, S., Harrison, S., and Arneth, A.: The Fire Modeling Intercomparison Project (FireMIP), phase 1: experimental and analytical protocols with detailed model descriptions, Geosci. Model Dev., 10, 1175–1197, https://doi.org/10.5194/gmd-10-1175-2017, 2017.
Ribeiro, L. M., Rodrigues, A., Lucas, D., and Viegas, D. X.: The impact on structures of the pedrógão grande fire complex in June 2017 (Portugal), Fire, 3, 1–22, https://doi.org/10.3390/fire3040057, 2020.
Rodriguez Veiga, P. and Balzter, H.: Africa Aboveground Biomass map for 2017, University of Leicester, UK [data set], https://doi.org/10.25392/leicester.data.15060270.v1, 2021.
Santoro, M. and Cartus, O.: ESA Biomass Climate Change Initiative (Biomass_cci): Global datasets of forest above-ground biomass for the years 2010, 2017 and 2018, v3, NERC EDS Centre for Environmental Data Analysis, UK [data set], https://doi.org/10.5285/5f331c418e9f4935b8eb1b836f8a91b8, 2021.
Santoro, M., Cartus, O., Carvalhais, N., Rozendaal, D. M. A., Avitabile, V., Araza, A., de Bruin, S., Herold, M., Quegan, S., Rodríguez-Veiga, P., Balzter, H., Carreiras, J., Schepaschenko, D., Korets, M., Shimada, M., Itoh, T., Moreno Martínez, Á., Cavlovic, J., Cazzolla Gatti, R., da Conceição Bispo, P., Dewnath, N., Labrière, N., Liang, J., Lindsell, J., Mitchard, E. T. A., Morel, A., Pacheco Pascagaza, A. M., Ryan, C. M., Slik, F., Vaglio Laurin, G., Verbeeck, H., Wijaya, A., and Willcock, S.: The global forest above-ground biomass pool for 2010 estimated from high-resolution satellite observations, Earth Syst. Sci. Data, 13, 3927–3950, https://doi.org/10.5194/essd-13-3927-2021, 2021.
Singh, M., Sood, S., and Collins, C. M.: Fire Dynamics of the Bolivian Amazon, Land, 11, 1436, https://doi.org/10.3390/land11091436, 2022.
Soto-Navarro, C., Ravilious, C., Arnell, A., de Lamo, X., Harfoot, M., Hill, S. L. L., Wearn, O. R., Santoro, M., Bouvet, A., Mermoz, S., Le Toan, T., Xia, J., Liu, S., Yuan, W., Spawn, S. A., Gibbs, H. K., Ferrier, S., Harwood, T., Alkemade, R., Schipper, A. M., Schmidt-Traub, G., Strassburg, B., Miles, L., Burgess, N. D., and Kapos, V.: Above and below ground biomass carbon, UN Environment Programme World Conservation Monitoring Centre (UNEP-WCMC) [data set], https://doi.org/10.34892/RH7V-HG80, 2020.
Spawn, S. A., Sullivan, C. C., Lark, T. J., and Gibbs, H. K.: Harmonized global maps of above and belowground biomass carbon density in the year 2010, Scientific Data, 7, 112, https://doi.org/10.1038/s41597-020-0444-4, 2020.
Thonicke, K., Spessa, A., Prentice, I. C., Harrison, S. P., Dong, L., and Carmona-Moreno, C.: The influence of vegetation, fire spread and fire behaviour on biomass burning and trace gas emissions: results from a process-based model, Biogeosciences, 7, 1991–2011, https://doi.org/10.5194/bg-7-1991-2010, 2010.
Turco, M., Jerez, S., Augusto, S., Tarín-Carrasco, P., Ratola, N., Jiménez-Guerrero, P., and Trigo, R. M.: Climate drivers of the 2017 devastating fires in Portugal, Sci. Rep.-UK, 9, 13886, https://doi.org/10.1038/s41598-019-50281-2, 2019.
Turetsky, M. R., Benscoter, B., Page, S., Rein, G., van der Werf, G. R., and Watts, A.: Global vulnerability of peatlands to fire and carbon loss, Nat. Geosci., 8, 11–14, https://doi.org/10.1038/ngeo2325, 2015.
Van Wagner, C. E.: Structure of the Canadian forest fire weather index. 1333. Environment Canada, Canadian Forestry Service, Ottawa, Canada, https://meteo-wagenborgen.nl/wp/wp-content/uploads/2019/08/van-Wagner-1974.pdf (last access: 4 January 2024), 1974.
Van Wagner, C. E.: Development and structure of the Canadian forest fire weather index system, Forestry Technical Report, 35, Canadian Forestry Service, Ottawa, Canada, 1987.
van Wees, D., van der Werf, G. R., Randerson, J. T., Rogers, B. M., Chen, Y., Veraverbeke, S., Giglio, L., and Morton, D. C.: Global biomass burning fuel consumption and emissions at 500 m spatial resolution based on the Global Fire Emissions Database (GFED), Geosci. Model Dev., 15, 8411–8437, https://doi.org/10.5194/gmd-15-8411-2022, 2022.
Veraverbeke, S., Rogers, B. M., Goulden, M. L., Jandt, R. R., Miller, C. E., Wiggins, E. B., and Randerson, J. T.: Lightning as a major driver of recent large fire years in North American boreal forests, Nat. Clim. Change, 7, 529–534, https://doi.org/10.1038/nclimate3329, 2017.
Vitolo, C., di Giuseppe, F., Barnard, C., Coughlan, R., San-Miguel-Ayanz, J., Libertá, G., and Krzeminski, B.: ERA5-based global meteorological wildfire danger maps, Scientific Data, 7, 216, https://doi.org/10.1038/s41597-020-0554-z, 2020.
Walker, X. J., Rogers, B. M., Veraverbeke, S., Johnstone, J. F., Baltzer, J. L., Barrett, K., Bourgeau-Chavez, L., Day, N. J., de Groot, W. J., Dieleman, C. M., Goetz, S., Hoy, E., Jenkins, L. K., Kane, E. S., Parisien, M. A., Potter, S., Schuur, E. A. G., Turetsky, M., Whitman, E., and Mack, M. C.: Fuel availability not fire weather controls boreal wildfire severity and carbon emissions, Nat. Clim. Change, 10, 1130–1136, https://doi.org/10.1038/s41558-020-00920-8, 2020.
Xiao, J., Chevallier, F., Gomez, C., Guanter, L., Hicke, J. A., Huete, A. R., Ichii, K., Ni, W., Pang, Y., Rahman, A. F., Sun, G., Yuan, W., Zhang, L., and Zhang, X.: Remote sensing of the terrestrial carbon cycle: A review of advances over 50 years, Remote Sens. Environ., 233, 111383, https://doi.org/10.1016/j.rse.2019.111383, 2019.
Xu, L., Saatchi, S. S., Yang, Y., Yu, Y., Pongratz, J., Bloom, A. A., Bowman, K., Worden, J., Liu, J., Yin, Y., Domke, G., McRoberts, R. E., Woodall, C., Nabuurs, G.-J., de-Miguel, S., Keller, M., Harris, N., Maxwell, S., and Schimel, D.: Changes in global terrestrial live biomass over the 21st century, Science Advances, 7, eabe9829, https://doi.org/10.1126/sciadv.abe9829, 2023.
Yang, H., Ciais, P., Santoro, M., Huang, Y., Li, W., Wang, Y., Bastos, A., Goll, D., Arneth, A., Anthoni, P., Arora, V., Friedlingstein, P., Harverd, V., Joetzjer, E., Kautz, M., Lienert, S., Nabel, J., O'Sullivan, M., Sitch, S., Vuichard, N., Wiltshire, A., and Zhu, D.: Comparison of forest above-ground biomass from dynamic global vegetation models with spatially explicit remotely sensed observation-based estimates, Global Change Biol., 26, 3997–4012, https://doi.org/10.1111/gcb.15117, 2020.
Yebra, M., Dennison, P. E., Chuvieco, E., Riaño, D., Zylstra, P., Hunt, E. R., Danson, F. M., Qi, Y., and Jurdao, S.: A global review of remote sensing of live fuel moisture content for fire danger assessment: Moving towards operational products, Remote Sens. Environ., 136, 455–468, https://doi.org/10.1016/j.rse.2013.05.029, 2013.
Yebra, M., Scortechini, G., Badi, A., Beget, M., Boer, M., Bradstock, R., Chuvieco, E., Danson, F., Dennison, P., Resco de Dios, V., Di Bella, C., Forsyth, G., Frost, P., Garcia, M., Hamdi, A., He, B., Jolly, M., Kraaij, T., Martín, M., Mouillot, F., Newnham, G., Nolan, R., Pellizzaro, G., Qi, Y., Quan, X., Riaño, D., Roberts, D., Sow, M., and Ustin, S.: Globe-LFMC, a global plant water status database for vegetation ecophysiology and wildfire applications, Sci. Data, 6, 155, https://doi.org/10.1038/s41597-019-0164-9, 2019.
Zhu, L., Webb, G. I., Yebra, M., Scortechini, G., Miller, L., and Petitjean, F.: Live fuel moisture content estimation from MODIS: A deep learning approach, ISPRS J. Photogramm., 179, 81–91, https://doi.org/10.1016/j.isprsjprs.2021.07.010, 2021.