the Creative Commons Attribution 4.0 License.
the Creative Commons Attribution 4.0 License.
 | 08 Aug 2024
From Iron Curtain to green belt: shift from heterotrophic to autotrophic nitrogen retention in the Elbe River over 35 years of passive restoration
Alexander Wachholz
James W. Jawitz
Dietrich Borchardt
We investigate changes to in-stream nitrogen retention and metabolic processes in the Elbe River between 1978 and 2020. We analyzed multidecadal time series data and developed a metabolic nitrogen demand model to explain trends in dissolved inorganic nitrogen (DIN) retention, gross primary production (GPP), and ecosystem respiration (ER) during a period of highly dynamic pollution pressures in the Elbe River (central Europe). Our findings reveal a marked increase in summer DIN retention and a decrease in winter DIN retention, establishing a distinct seasonal pattern. We identified three distinct periods in the Elbe's DIN retention dynamics: dominantly heterotrophic under high organic and inorganic pollution pressure (1980–1990), transition (1990–2003), and dominantly autotrophic with lower pollution (2003–2017). We link these changes to reduced industrial pollution, improved wastewater treatment, and a shift in the in-stream balance between heterotrophic and autotrophic processes. During the first period, high ER caused elevated metabolic nitrogen demands, primarily driven by heterotrophic processes. As pollution from industrial and wastewater emissions decreased, GPP rates increased and ER gradually declined, prompting a shift towards an autotrophic-dominated nitrogen retention regime. Our study indicates tight coupling of nutrient reduction from external sources and dominant processes of natural attenuation in large rivers, which needs to be considered for projections of recovery trajectories for sustainable water quality.
- Article
(1122 KB) - Full-text XML
-
Supplement
(818 KB) - BibTeX
- EndNote


Large river systems have been substantially impacted by anthropogenic pressures associated with economic development, including observed long-term trends of ecosystem degradation throughout much of the 20th century (Vörösmarty et al., 2015; Meybeck et al., 2018). However, ecosystem protection regulations promulgated in recent decades have supported the recovery of many river ecosystems (Minaudo et al., 2015; Westphal et al., 2019), including producing improvements in river metabolic regimes (Diamond et al., 2022; Jarvie et al., 2022) and reductions in dissolved inorganic nitrogen loads (Wachholz et al., 2022). Many studies have examined the terrestrial drivers of these multidecadal trajectories of river ecosystems (Ehrhardt et al., 2019; Dupas et al., 2018; Van Meter et al., 2017). However, little is known about the impact of these long-term changes on the in-stream processes. An important in-stream process that is susceptible to external pressures is in-stream retention of dissolved inorganic nitrogen (DIN), which plays a crucial role in watershed nitrogen (N) budgets. On a global scale, inland waters retain 60 % of the annual terrestrial nitrogen input (Schlesinger and Bernhardt, 2013). This important ecosystem function also helps protect downstream ecosystems from eutrophication (Bianchi et al., 2010) induced by highly reactive forms of nitrogen, such as nitrate and ammonium (Seitzinger et al., 2002). In-stream DIN retention is closely linked to other ecosystem functions, especially stream metabolism (Hall and Tank, 2003; Heffernan and Cohen, 2010). Long-term changes in metabolism (Arroita et al., 2019), nitrogen loading (Ballard et al., 2019), and nitrogen composition (Wachholz et al., 2022) have been observed in rivers. Here, we are interested in associated long-term patterns of in-stream DIN retention.
Here we use in-stream DIN retention as an overarching term for all processes that, temporarily or permanently, remove DIN from the water. These processes include assimilation by heterotrophic and autotrophic organisms and denitrification. In-stream DIN retention is performed by bacteria, algae, and macrophytes in the water column and in sediments (Deutsch et al., 2009; Middelburg and Nieuwenhuize, 2000) that either assimilate DIN into their biomass or use it for metabolic processes. The activity of these organisms is influenced by various environmental factors such as water temperature, residence time, and nutrient concentrations (Collos and Harrison, 2014; Rasmussen et al., 2011; Snell et al., 2019). While travel time (Bertuzzo et al., 2017) and water temperature (Sherman et al., 2016) are often assumed to be the primary controls of in-stream DIN retention, the composition of DIN can also play a significant role. For instance, NH4 N is favored over NO3 N by many algae and bacteria (Cejudo et al., 2020). If sufficient NH4 N is available, the DIN uptake by unicellular algae can increase by a factor of 2–16 (Collos and Harrison, 2014). Understanding of DIN retention should also consider the relative contributions of algae, bacteria, and macrophytes, each of which has preferences for different DIN species (Bergbusch et al., 2021; Collos and Harrison, 2014), incorporates N into its biomass at different stoichiometric ratios (Diamond et al., 2022; Godwin and Cotner, 2018), and has different growth efficiencies (the ratio of consumed resources that are assimilated into biomass; e.g., del Giorgio, 1997).
While long-term trends in the drivers and correlates with in-stream DIN retention are relatively well known (e.g., Ballard et al., 2019; Wachholz et al., 2022; Diamond et al., 2022), their consequences for in-stream DIN retention itself are understudied. This leaves considerable uncertainty in long-term watershed N budgets, which are already uncertain due to hard-to-quantify phenomena such as time lags (Lutz et al., 2022). Therefore, we propose the following research question: how do the magnitude and dominant processes of in-stream DIN retention change in response to long-term changes in DIN composition and river trophic regime? To answer this question, we studied the Elbe River from 1978 to 2017. During this period, the Elbe River underwent a significant transition: before 1990, most of its catchment lay beyond the Iron Curtain and experienced significant chemical pollution, especially from heavy fertilizer use due to the agro-industrial revolution in the German Democratic Republic (GDR) after the 1960s (Bauerkaemper, 2004). Furthermore, large amounts of untreated wastewater from urban and industrial areas further polluted the stream (Netzband et al., 2002). However, after the GDR's collapse in 1989, industrial facilities closed, and wastewater treatment plants (WWTPs) were rapidly constructed in the 1990s following German reunification in 1991, resulting in decreased emissions from these sources and improved water quality in the Elbe (Adams et al., 2001). Parts of the Elbe's remaining floodplain are now located within the European Green Belt, with the aim to preserve its valuable functions for flood retention and biodiversity (Serra-Llobet et al., 2022).
Previous work suggests a shift from a heterotrophic system (primary production/respiration < 1) to an autotrophic system (primary production/respiration > 1; Doretto et al., 2020) following the reduction in riverine biological oxygen demand in response to wastewater treatment improvements after the GDR collapse (Lehmann and Rode, 2001). However, the concomitant changes in DIN retention during this period have not been examined.
Quantitative links between in-stream metabolism and nutrient retention have been described by many authors (Hall and Tank, 2003; Heffernan and Cohen, 2010; Kamjunke et al., 2021; Rode et al., 2016; Zhang et al., 2023). The N demand of gross primary production (GPP) and ecosystem respiration (ER) in an ecosystem can be estimated, subject to assumptions about growth efficiencies (the share of GPP/ER that leads to biomass growth), biomass C : N ratios, and photosynthetic/respiratory quotients (O2 : C ratio during photosynthesis/respiration; Hall and Tank, 2003). As both autotrophic and heterotrophic microorganisms use DIN as their preferred N source (Rier and Stevenson, 2002), those assumptions allow us to link the dissolved oxygen (DO) and the DIN balance of a river segment. Other processes, however, disturb this link by influencing either DO or DIN but not both. Possible examples are other biological processes such as nitrification (retains DO but does not affect the DIN budget directly) and denitrification (removes NO3 N but does not consume DO). However, physicochemical effects such as adsorption or desorption of NH4 N also influence the DIN budget of a river segment without affecting the DO budget (Triska et al., 1994).
GPP in the Elbe is mostly caused by phytoplankton (Hardenbicker et al., 2014), and phytoplankton activity is closely linked to the in-stream N processes in the Elbe in recent years (Ritz and Fischer, 2019; Kamjunke et al., 2021). In-stream denitrification is assumed to be of lesser importance in the Elbe, at least after reunification (Ritz et al., 2017; Schulz et al., 2023). The strong decrease in NH4 N concentrations after 1990 (Adams et al., 2001) suggests that nitrification and sorption processes play a minor role in the Elbe's DIN retention, as less NH4 N is available. Before 1990, in-stream oxygen concentrations were low (Lehmann and Rode, 2001), and NH4 N concentrations were high (Adams et al., 2001). We, therefore, expect that nitrification and denitrification occurred at relatively higher rates, with weaker coupling between DIN retention and metabolic processes.
To summarize, we hypothesize a strong coupling between metabolic processes and in-stream DIN retention (Heffernan and Cohen, 2010). We predict that this coupling will be weakened during periods of high pollution (such as during the late phases of the GDR before 1990) when processes such as denitrification, nitrification, and sorption influence the DO and N cycles independently.
To test our hypothesis, we quantified DIN retention using a two-station mass balance approach along an 110 km eighth-order segment of the Elbe with no noteworthy tributaries. Furthermore, we quantified changes in the trophic regime in the Elbe by estimating gross primary production (GPP) and ecosystem respiration (ER) using the single-station hourly oxygen mass-balance approach (Odum, 1956). We linked in-stream DIN retention to metabolic rates using stoichiometric constraints and assessed the relative importance of autotrophic and heterotrophic processes.
2.1 Overview
We used DIN and DO mass balances to assess the magnitude and responsible processes of in-stream DIN retention over 42 years, from 1978 to 2020. We inversely modeled DO concentrations using a maximum likelihood estimation method to quantify in-stream metabolic processes (GPP and ER) over time. We linked metabolism and in-stream DIN retention using a simple model based on stoichiometric constraints and growth efficiencies.
2.2 Study site
We studied the last 111 km of a 1094 km eighth-order river (the Elbe; Fig. 1a, b), between Schnakenburg (kilometer 474) and Geesthacht (kilometer 585), which was behind the Iron Curtain before 1990. The German Elbe is free flowing, meaning that for at least 474 km upstream of the studied segment, no dams are present. The studied segment has no noteworthy tributaries and is located 30 km downstream of the last larger tributary (Havel), which contributes between 10 % and 20 % of the Elbe discharge (Fig. S1). The annual mean discharge at the downstream station Geesthacht (kilometer 585) is 716 m3 s−1 (IKSE, 2005). Lateral groundwater discharge was estimated to be < 0.05 m3 s−1 km−1 for the Elbe at stream kilometer 450 (Zill et al., 2023), corresponding to 5.5 m3 s−1 for the entire segment or less than 1 % of the annual mean discharge, and was therefore not considered. We estimate the depth of the segment to be between 2.8 and 4.5 m and the width between 270 and 450 m during flow conditions between the 5th and 95th percentiles (see Sect. 2.5 for details). PO4 P concentrations oscillated between 0.2 and 0.3 mg L−1 before 1990 and between 0 and 0.1 mg L−1 afterward (Wachholz et al., 2024). The aquatic productive season occurs between April and October, as indicated by increased chlorophyll-a concentrations, and without macrophytes primary production in the Elbe is assumed to be caused by phytoplankton (Hardenbicker et al., 2018).
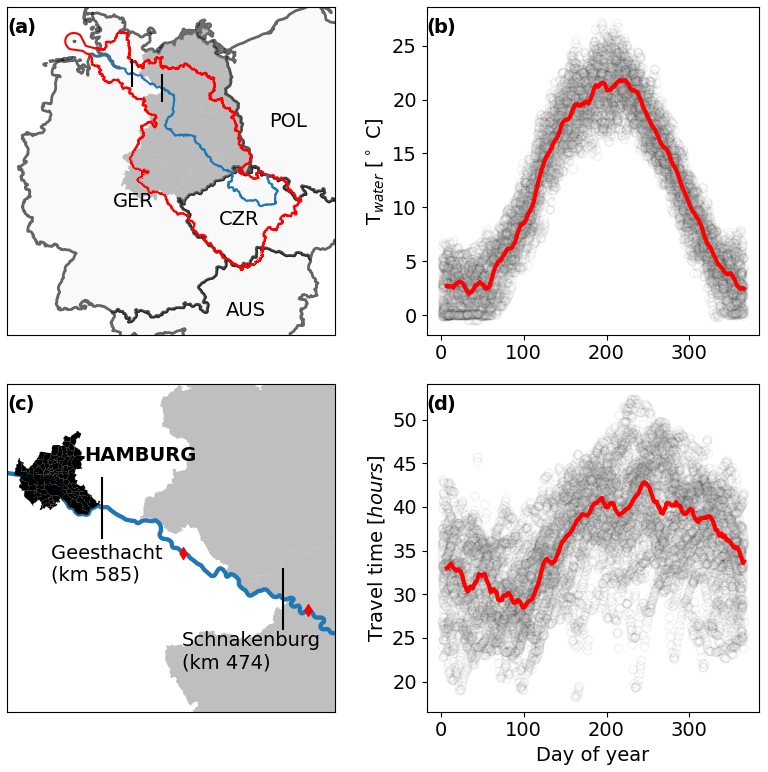
Figure 1Location of the river segment investigated (a, c) in Europe. The blue line marks the main stream of the Elbe, and the red outline represents the catchment. Vertical black lines mark the beginning and the end of the segment (sampling locations). Red diamonds in panel (c) indicate discharge gages. The former area of the German Democratic Republic (GDR) is represented by the gray shaded area. Intra-annual patterns of water temperature (b) and travel time (d). Circles show raw data, and red lines are multi-year 7-day running means for each day of the year.
2.3 Two-station mass balance
To quantify in-stream DIN retention, we use a two-station mass balance approach (e.g., Ritz and Fischer, 2019). All samples were collected and analyzed by the federal state authority of Lower Saxony. Nitrate samples were analyzed using liquid ion chromatography (DIN EN ISO 10304-1) and ammonium using flow analysis and spectrometric detection (DIN EN ISO 11732). It is not documented if and how the detection method changed over the period monitored. However, the time series exhibited no obvious break points (Fig. S2). The upstream site (Schnackenburg) is located at stream kilometer 474 and has weekly (1978–1991) and bi-weekly (1991–2021) water quality (NO3 N and NH4 N) time series available. Nitrite (NO2 N) was not considered, as even in high nitrogen pollution periods, it made up between 1 % and 3 % of the DIN for both input and output (Fig. S3). The upstream discharge gage (Wittenberge) is located 21 km upstream of the sampling site (Fig. 1c). The downstream site (Geesthacht) at stream kilometer 585 has weekly NO3 N and NH4 N data from 1980 to 1988, bi-weekly until 2006, and monthly afterward. A data gap from 1988 to 1993 for the downstream site was filled with data from another sampling site located at stream kilometer 598 (Zollenspieker), as both sites exhibit very similar nitrogen concentrations (Wachholz et al., 2022, their Fig. S2). The downstream discharge gage (Neu Darchau) is located 50 km upstream of the sampling site used to estimate DIN load (Geesthacht station, Fig. 1c). However, the difference in catchment area between the sampling site and the gage is less than 3 % (Wachholz et al., 2022). We consider this by assuming a 10 % error in discharge measurements in our uncertainty propagation, while a previous mass balance study (Ritz and Fischer, 2019) reported errors ≤ 5 % in the Elbe, according to personal communication with the state authorities responsible for the measurements. The same study also reported an error of 10 % for the laboratory quantification of nitrogen compounds, according to the German standard procedures that were also used in this study.
2.3.1 WRTDS model
To reconcile differences in sampling dates between the upstream and downstream stations, daily loads of NO3 N and NH4 N were estimated using the Weighted Regressions on Time, Discharge, and Season (WRTDS) function of the R package Exploration and Graphics for RivEr Trends (EGRET; Hirsch et al., 2010). The WRTDS function uses a weighted regression approach to estimate daily loads and concentrations, accounting for non-linearity and non-stationarity in the relationships between the time, discharge, season, and concentrations over time. Measured and simulated daily concentrations showed very good agreement (R2>0.7 and percent bias < 3; see Fig. S4).
2.3.2 Retention metrics
Using the daily loads provided by the WRTDS function, we calculated in-stream DIN retention Robs as
where L is the DIN load [kg d−1]. Uncertainty in Robs was computed based on Gaussian error propagation (Sect. S2). We then calculate the relative retention, RR,
and the area-weighted retention, U [kg d−1 m−2],
where A [m2] is the bottom area of the river segment (Stream Solute Workshop, 1990). We calculate Robs, RRobs, and Uobs for DIN. We corrected the Lout time series for travel time to align the inflow and outflow time series. The estimated travel times for the segment ranged from 19 to 52 h (Fig. 1d), but since loads were only available as daily means, we evaluated corrections in increments of single days (Table S1) and found that shifting Lout 1 d ahead of the Lin series led to the best fit between the inflow and outflow time series.
2.4 Channel geometry estimations
Calculating area-weighted retention rates and inverse modeling of in-stream metabolism for a river segment requires knowledge of the surface area, water residence times, and channel depth. The methods to obtain these estimates are summarized below but are described in detail and validated in Sect. S1 and Fig. S5. We used discharge-based transfer functions to estimate the geometrical parameters at different water levels (e.g., Booker and Dunbar, 2008). We estimated travel time τ using a transfer function proposed by Scharfe et al. (2009) for the German Elbe. For the channel area of the investigated segment, we established a transfer function based on discharge, which we parametrized with channel areas derived under different discharge conditions from Sentinel 2 images using a surface water detection algorithm (Normalized Difference Water Index). We employed a power law model for the channel depth based on data from Aberle et al. (2010).
2.5 Metabolism model
The single-station method for metabolism estimation in rivers uses DO data from a single monitoring station to estimate the rates of gross primary production (GPP) and ecosystem respiration (ER) in the river (e.g., Hall et al., 2016):
where GPP and ER are the daily rates [mmol m−3 d−1] of the respective parameters, PPFD24 is the photosynthetic photon flux density for the day and PPFDt per hour [µmol m−3 d−1], k600 is the gas exchange rate [m d−1], Sc is the dimensionless Schmidt number for oxygen (Wanninkhof, 1992) that is calculated based on water temperature, DOt and DOmax are the actual and maximum (at 100 % saturation) DO concentrations [µmol L−1], and z is the channel depth [m].
2.6 Data preparation and metabolism estimation
Implementation of Eq. (4) requires hourly estimates of PPFD, DO, DOmax, z, and Sc. We interpolated diurnal DO concentrations by fitting sine functions to a time series of daily mean, minimum, and maximum values from 1978 to 2017, as described in Sect. S3. Simulated DO concentrations were validated with 2 years of hourly measured values showing the characteristics of a good fit (R2=0.96, RMSE = 0.42 mg L−1). We estimated hourly solar radiation (as PPFD) based on the method proposed by Duffie and Beckman (2013), which is implemented in the Python package solarPy. We calculated DO saturation based on the method of Weiss (1970) using hourly air pressure data from the German weather service (DWD), Seehausen station (ID 4642), and daily mean water temperature measured together with the DO data. We estimated k600 for the segment with a hydraulic equation from Raymond et al. (2012, their Eq. 7 of Table 2; see Sect. S4 for details), and we used maximum likelihood estimation (e.g., Van de Bogert et al., 2007) to fit parameter distributions for GPP and ER for each day of the time series. We used a limited memory Broyden–Fletcher–Goldfarb–Shanno algorithm, implemented in the Python package Scipy (Virtanen et al., 2020; function minimize (method L-BFGS-B)), to minimize the negative log likelihood between the modeled DO concentrations and the observed DO data (e.g., Van de Bogert et al., 2007). We constrained daily GPP and ER estimates to be between 0 and (−) 50 [g O2 m−2 d−1] and use (−)10 [g O2 m−2 d−1] as an initial estimate.
In particular, the use of estimated k600 and the daily mean water temperature might introduce large uncertainties into our GPP and ER estimations. To quantify these uncertainties, we estimated the daily standard deviation σ of k600 (based on the parameter variability described in Raymond et al., 2012), the daily water temperature (based on hourly data that are available some years), and DOmax (based on the propagation of the standard deviations from water temperature) for each day (see Sect. S4). We performed 100 bootstrap iterations for each day, drawing errors from normal distributions, N ∼ (0, σ), for the parameters k600, DOmax, and daily water temperature. We reported the mean and standard deviations of the resulting GPP and ER estimations. We assessed the goodness of fit for the GPP and ER estimations by simulating DO concentrations using the mean daily GPP and ER rates and comparing those to observed DO concentrations, reporting daily R2 and root mean square error values (Fig. S10). We further assessed the effects of the uncertainty in k600, DOmax, and daily water temperature on estimated GPP and ER by performing a simplified one-factor-at-a-time sensitivity analysis for 2 exemplary years (see Fig. S11). The model implementation in Python can be found at github.com/alexiwach/MetabolismModelElbe. We also assessed the areal extent of the metabolic signal and found that it was in line with the mass balance analysis (see Sect. S4).
2.7 Estimating the N demand of metabolic processes
The demand for N caused by GPP and ER can be estimated based on the respective organisms' growth efficiency (GE), the photosynthetic and respiratory quotient (PQ and RQ), and the C : N ratio of their biomass (e.g., Hall and Tank, 2003). GE [–] describes the proportion of resources and energy captured by photosynthesis (GEAUTO) or respiration (GEHET) that is incorporated into new biomass (del Giorgio et al., 1997; Hall and Tank, 2003). PQ and RQ describe the ratio of O2 produced/consumed per CO2 consumed/produced (Berggren et al., 2012; Hall and Tank, 2003). These two concepts can be used to assess how much C is incorporated into biomass for any given GPP and ER rate. Via the C : N ratio of the biomass (C : NHET and C : NAUT), the N demand can then be estimated. Since autotrophic and heterotrophic microbes prefer DIN to other forms of nitrogen (Rier and Stevenson, 2002) and DIN is always available at concentrations > 1 mg L−1, we interpret the N demand as DIN demand.
For autotrophic processes, we can formulate the following:
where UAUT [mol m−2 d−1] is the DIN demand of the GPP rate [mol m−3 d−1] and PQ [mol C mol−1 O2], GEAUT is the autotrophic growth efficiency [–], C : NAUT is the carbon to nitrogen ratio in the autotrophic biomass, and z is the channel depth [m] used to convert volumetric GPP to areal retention rates. Similarly, we can formulate the following for heterotrophic processes:
however, it is well known that the ER is not only caused by heterotrophic bacteria but also by autotrophs (e.g., Hall and Tank, 2003). A way to correct autotrophic respiration is to subtract the non-biomass-producing fraction of GPP from ER (Hall and Tank, 2003).
Combining Eqs. (5), (7), and (8) allows us to estimate the complete metabolic N demand Umet as follows:
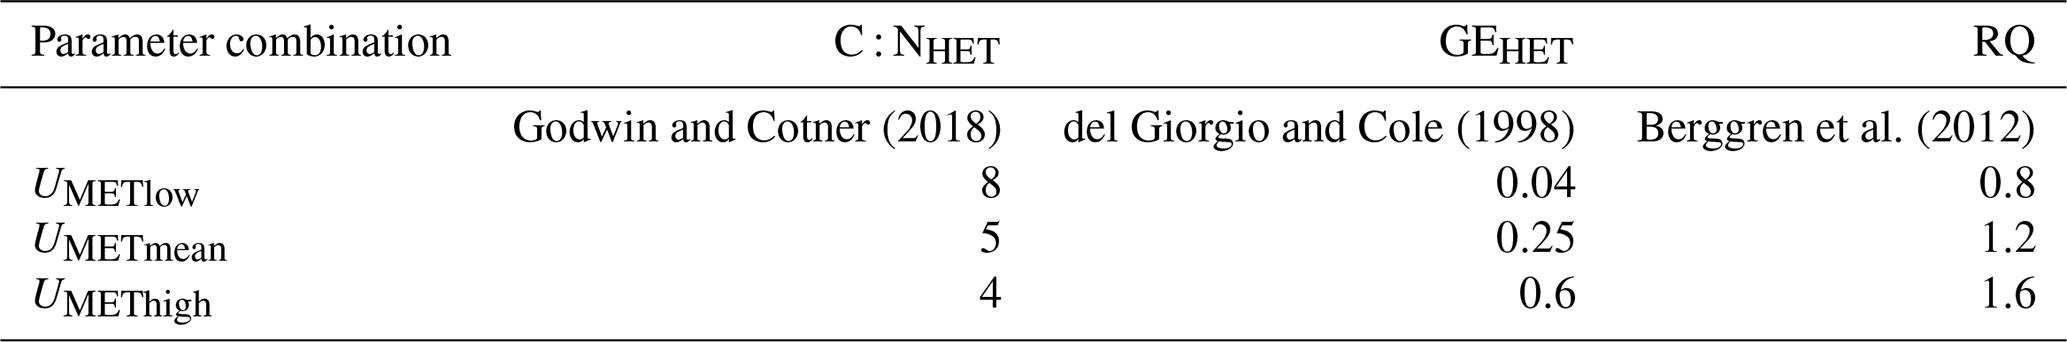
Calculating Umet based on GPP and ER rates therefore requires estimations of six parameters. For C : NAUT, we used 7.3, which was reported for phytoplankton biomass in the Elbe, and we used PQ = 1 [mol C mol−1 O2] and GEAUTO=0.5, which have been successfully used to explain assimilatory DIN uptake in the Elbe (Kamjunke et al., 2021). It is well known that the parameters C : NHET, GEHET, and RQ show strong variability across ecosystems (Godwin and Cotner, 2018; del Giorgio and Cole, 1998; Berggren et al., 2012). Since they all affect Umet, we evaluated three parameter combinations that would lead to low, intermediate, and high Umet values (Table 1).
Table 1Parameter combinations for the estimation of the metabolic nitrogen demand. C : NHET is the carbon to nitrogen ratio of heterotrophic organisms, GEHET is the heterotrophic growth efficiency [–], and RQ is the respiratory quotient [mol O2 mol−1 C].
We compared Umet estimated from each of these parameter combinations to Uobs based on the mass balance approach. Umet as introduced here only considers the nitrogen demand directly associated with assimilation related to primary production or respiration. Other processes, e.g., denitrification, are not considered but are discussed later.
3.1 DIN retention
The highest Uobs values during the entire time series were observed during regime 1 (1978–1990), oscillating between 1 and 2 g m−2 d−1 (Fig. 2a). Starting in middle of regime 1, Uobs decreased and oscillated mostly between 0 and 1 for the rest of the time series, with some negative values occurring during the winter in 3 years (2008, 2011, and 2018). During regime 1, Uobs peaked shortly before the aquatic growing season (days 106–122, April–May) and showed clear summer peaks (day 182, July) afterward. The relative retention, however, showed a consistent summer peak during the entire time series (days 190–220, July–August), while the amplitude increased in regimes 2 and 3 (19 % to 34 %; Fig. 2b). Annual mean loads decreased throughout all three regimes, from 0.44 to 0.18 kt d−1, with a substantial decrease in annual minima around 1989 (Fig. 2c). Likewise, the share of NH4 N from the DIN load declined from 36 % to 6 %. Concentrations of NH4 N did not reach values > 1 mg L−1 until later in regime 2.
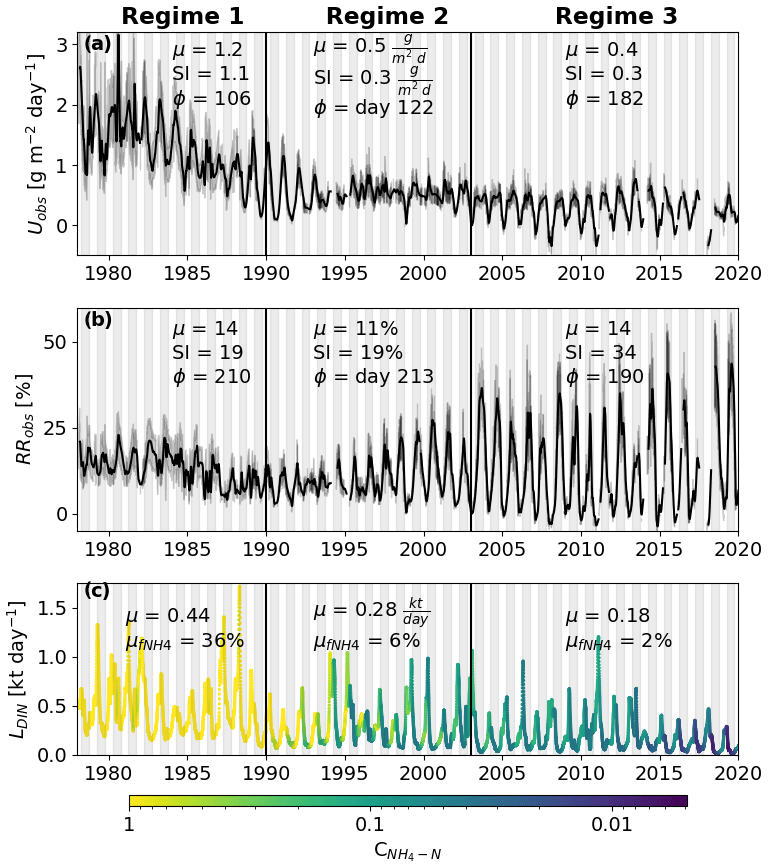
Figure 2Area-weighted (Uobs; panel a) and relative dissolved inorganic nitrogen (DIN) retention rates (RRobs; panel b) estimated using a two-station mass balance approach. The three vertical black lines correspond to the major changes in U. Regime 1 shows a high mean (μ), a strong seasonal amplitude (SI) and peaks during spring (Φ is day 106). Regime 3 has a much lower μ and SI, while the day of the peak occurs during summer (Φ is day 182). Regime 2 represents the transition between the two regimes. The black lines represent a 30 d moving average value, and the shaded area around the black line shows raw values with a 90 % confidence interval. Panel (c) shows the DIN load (L) received by the investigated segment of the Elbe. The color represents the corresponding ammonium concentration. is the mean fraction of DIN that consists of ammonium. The white background represents the colder 6 months of the year (October–April) and the dark background the warmer 6 months.
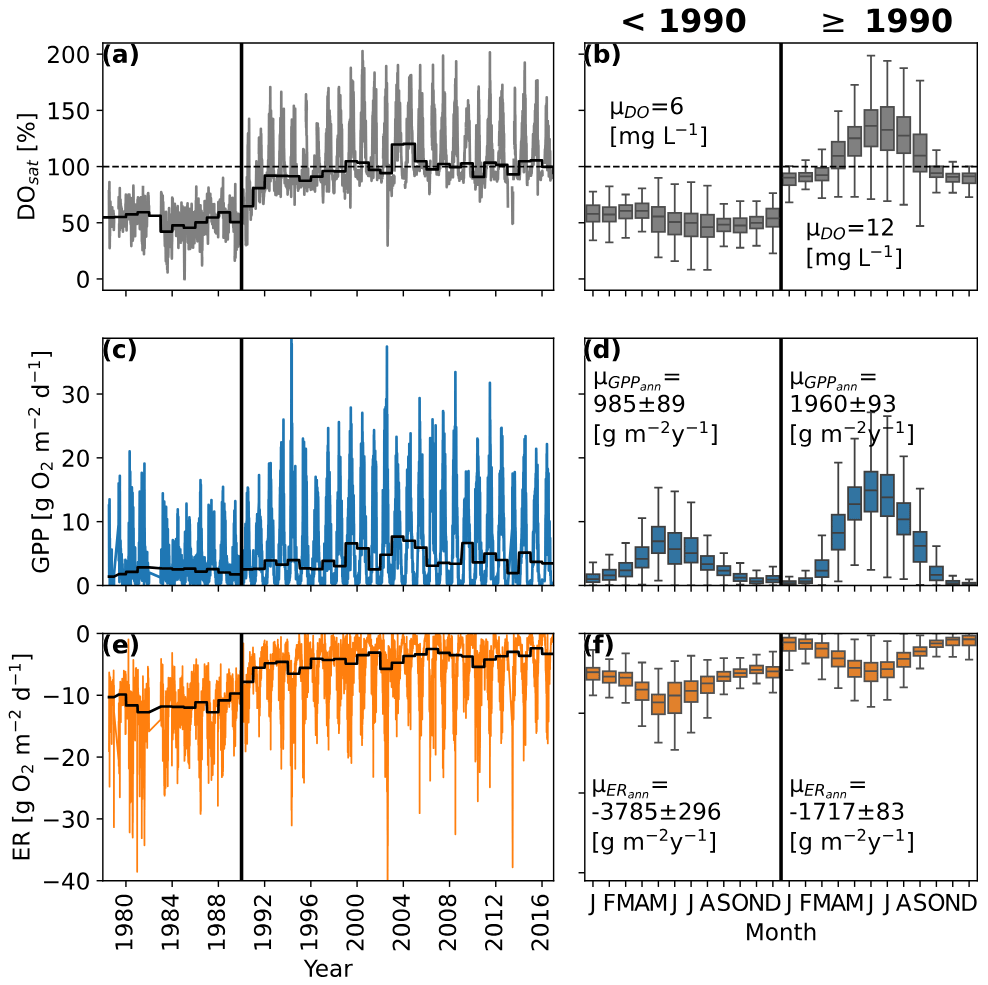
Figure 3Time series of daily dissolved oxygen saturation (DOsat; a), daily gross primary production estimates (GPP; c), and ecosystem respiration estimates (ER; e). The black lines show the annual median DO, GPP, and ER values. Panels (b), (d), and (f) show the mean monthly patterns for DOsat, GPP, and ER before and after 1990. μDO represents the mean DO concentrations and μGPPann and μGPPann the mean annual GPP and ER rates.
3.2 Metabolism
3.2.1 Oxygen saturation
The multidecadal pattern of DO in the Elbe showed distinct behavior before and after 1990, coinciding with German reunification and the fall of the Iron Curtain (Fig. 3a). Oxygen saturation before 1990 oscillated between 20 % and 70 % but increased rapidly after 1990, reaching supersaturation for the first time in 1991. Before 1990 there was no clear intra-annual pattern (Fig. 2b), but for the rest of the time series, DOsat oscillated seasonally between ∼ 80 % and ∼ 180 %, peaking around day 180 and coinciding with the annual peaks of residence time, water temperature, and area-weighted DIN retention (Figs. 1b, c and 2a).
3.2.2 Gross primary production and ecosystem respiration
Similar to DOsat, GPP showed a clear change around 1990, with low annual peaks (10–15 g O2 m−2 d−1) before and higher ones (∼ 15–25 g O2 m−2 d−1) in the following years (Fig. 3c). Compared to DOsat, the timing of the GPP peak stayed similar throughout the time series (July; Fig. 3d).
While the seasonal pattern of ER stayed similar (peaks in May, June, and July) throughout the time series, annual ER rates were reduced to less than half after 1990 (Fig. 3e, f). Most apparent are higher ER rates during the winter months before 1990. In contrast to GPP, ER rates started to change as early as 1987.
Considering annual mean net ecosystem productivity (NEP = GPP-ER), the segment of the Elbe investigated was a net-heterotrophic system before 1990, which means more O2 was consumed than was produced. High ER rates before 1990 led to a DO deficit of ∼ 2800 g O2 m−2 yr−1. After 1990, reduced ER and increased GPP rates turned the NEP of the segment and led to an oxygen surplus of ∼ 240 g O2 m−2 yr−1.
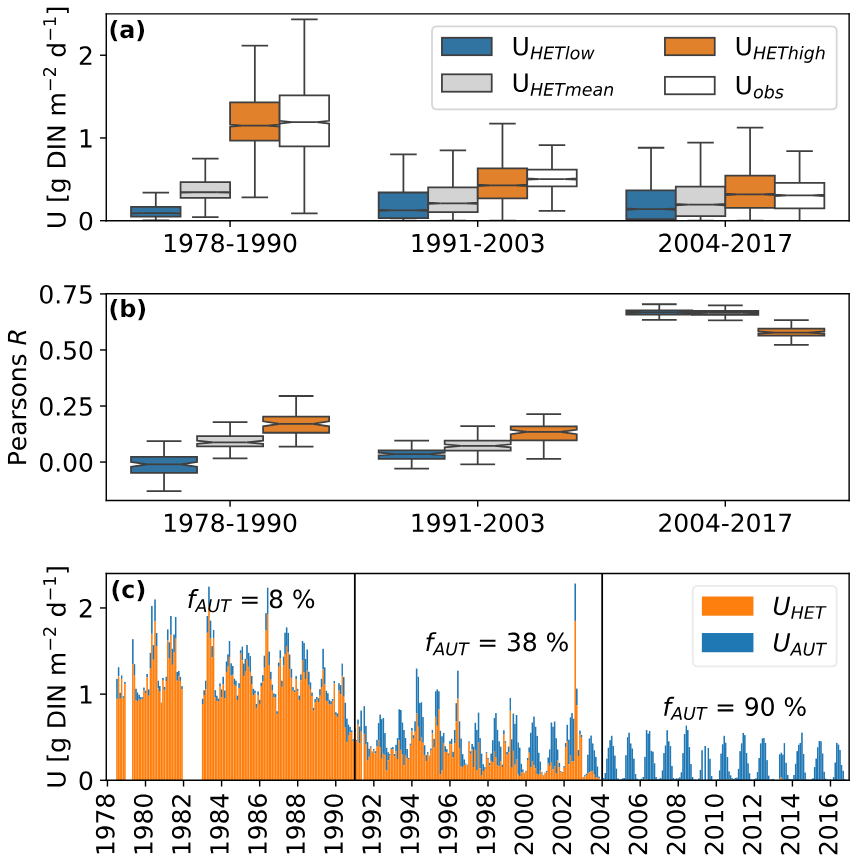
Figure 4(a) Simulated and observed in-stream nitrogen retention during three periods. The different colored boxplots represent the three parametrizations of heterotrophic nitrogen demands described in Table 1. Uobs represents retention rates based on the two-station mass balance described in Sect. 2.3. (b) Pearson correlation coefficients for the three parametrizations of heterotrophic nitrogen demands with Uobs. (c) Monthly mean time series of U based on the best-fit parameter combinations for each period: UHEThigh for periods 1 and 2 and UHETlow for period 3. The colors indicate the share of the heterotrophic and autotrophic nitrogen demand. fAUT is the fraction of U caused by autotrophic nitrogen demand [%].
3.3 Linking metabolism and DIN retention
The different parametrizations of heterotrophic nitrogen demand show diverging performance over the three investigated periods that correspond to the three regimes of Uobs shown in Fig. 2. Between 1978 and 2003, only the parametrization UMEThigh led to a similar distribution of U as was observed (Fig. 4a). During the last period (2004–2016), all parameter combinations led to U distributions that were similar to the observations. Pearson's R reveals poor correlation between simulated and observed U values before 2003, with the best results shown by the UMEThigh parametrization (Fig. 4b). This changes for the period 2004–2016, where overall better R values were achieved, and the best results resulted from the parametrizations UMETlow and UMETmean. The share of autotrophic nitrogen demand to total metabolic nitrogen demand fAUT increased for all three parametrizations (Fig. 4c). The highest fAUT values come from the parametrization with low heterotrophic nitrogen demand (UMETlow) and vice versa.
4.1 DIN retention
We classified observed in-stream nitrogen retention Uobs under three regimes. Regime 1 had the highest retention, showed a pronounced seasonal amplitude, and peaked shortly before the beginning of the aquatic vegetation period during the colder half of the year (Fig. 2a). Peaks outside the warmer half of the year were not expected, as water temperature (Sherman et al., 2016) and residence time (Bertuzzo et al., 2017), considered the main drivers of in-stream DIN retention, are lower during this period. During regime 2, Uobs gradually decreased, reduced its amplitude, and shifted its annual peak into summer, where it remained in regime 3. Higher DIN retention rates during phases of higher DIN pollution, as observed in regime 1, have already been reported by Kelly et al. (2021). They also remarked on changes in the drivers of Uobs, which reached high values even in the cold season during phases of high pollution, a fact that agrees with our observations. We interpret regime 2 as a transition period, corresponding to the long-term improvements in wastewater treatment that followed German reunification in 1990 and took multiple years (IKSE, 2010). During this period, NH4 N concentrations started to decrease first during summer, indicating changes in point source inputs (Wachholz et al., 2022). During regime 3, Uobs shows a stable pattern, with peaks coinciding with high water temperatures and residence times (Fig. 1b, c).
As neither temperature nor discharge exhibited noteworthy trends in seasonality in the Elbe during the studied period (Markovic et al., 2013; Mudersbach et al., 2016), we interpret this seasonality change as an indicator of a change in other driving processes, most likely in the abundance and metabolic activity of the responsible organisms. While the DIN input has a constant seasonal pattern, its magnitude and composition (share of NH4 N) changed remarkably throughout the time series (Fig. 2c). As biota such as algae are known to form their assemblages according to environmental factors such as light, temperature, and nutrient availability (Snell et al., 2019), a biotic regime shift could have contributed to the Uobs changes.
4.2 Metabolism
4.2.1 Dissolved oxygen
Analyses of the oxygen saturation in the investigated segment of the Elbe revealed a constant saturation deficit, which was replaced by a strong seasonal pattern with pronounced supersaturation during summer (Fig. 3a) after 1990. It is understood that the oxygen budget of the Elbe after 1990 is controlled by primary production, which rapidly increased after 1990 (Lehmann and Rode, 2001; Petersen and Callies, 2002). The absence of supersaturation before 1990 could be related to high concentrations of suspended solids, which are known to limit GPP in rivers (Trentman et al., 2022) and which were observed to decrease in the Elbe following the improvements in wastewater treatment after 1990 (Hillebrand et al., 2018). However, toxic effects from industrial waste also seem plausible, as concentrations for many organic and inorganic pollutants rapidly decreased around 1990 (Adams et al., 2001). However, a lack of primary production would not explain the significant DO saturation deficit before 1990. From a mass balance perspective, only high rates of ER could have caused that phenomenon.
Further assessment of this requires estimation of the Elbe's metabolic processes, which we carried out using a maximum likelihood estimation.
4.2.2 Gross primary production and ecosystem respiration
GPP and ER estimations revealed an increase in GPP and a decrease in ER around 1990 (Fig. 3c, d). While the GPP increase was sudden and mostly affected summer peaks, ER started to decrease in the late 1980s and also shows drastically reduced rates during the winter months. Compared to DOsat, the timing of the GPP peak stayed similar throughout the time series (∼ day 190 (July); Fig. 3d), which suggests constant drivers but some limitation before 1990. It is well known that light and flow regimes control the metabolism of rivers (Bernhardt et al., 2022), so the peak during high temperature and residence times is to be expected and suggests another limiting factor before 1990 (e.g., high light attenuation from substances or sediments delivered by WWTP effluents).
The higher rates of ER before 1990 could have been supported by high loads of organic pollutants from wastewater (Adams et al., 1996). Compared to the increase in GPP, the slower ER decrease could be explained by the gradual improvements in water treatment throughout the 1990s and early 2000s (Adams et al., 2001; Wachholz et al., 2022). However, it has to be acknowledged that ER started to change before 1990. This could have been caused by an early onset of the industrial collapse of the GDR, affecting some industrial wastewater emitters, or by improved wastewater treatment before the GDR collapse.
Another interesting observation is the high winter ER before 1990. One must consider that the term ER from Eq. (4) contains all processes that consume DO in the balance, including nitrification. NH4 N was present in high concentrations in the Elbe River before 1990 (Fig. 2c). It is well known that nitrification can significantly contribute to oxygen depletion (Powers et al., 2017) and that nitrification rates during cold periods increase with NH4 N concentrations (Cavaliere and Baulch, 2019). This correlates with our observation of high DIN retention rates outside the warmer half of the year, as nitrifying and denitrifying organisms also have nitrogen demands.
It has to be acknowledged that the metabolic estimations presented here are based on a few speculative assumptions. Nevertheless, the model showed overall good agreement with the observed DO data (Fig. S10). R2 was generally the highest during spring (> 0.8) and lowest in winter (∼ 0.6). R2 performance was similar for the period before and after 1990. Considering the root-mean square error, all seasons in both periods show values between 0 and 2.5 mg O2 m−2 d−1, with the exception of summer after 1990 where the mean root mean square error is around 7 mg O2 m−2 d−1. This is, however, the part of the year with the highest GPP and ER values, and since the R2 in this period and season is > 0.7, we still consider that the model performance is good.
Our simple one-factor-at-a-time sensitivity analysis revealed that both GPP and ER are most susceptible to changes in k600 (Fig. S11). Since this parameter was also estimated from a hydraulic equation and could not be verified for the studied segment, this introduces an unquantified uncertainty to our results. GPP, however, was affected very little by variability in k600 compared to ER, and as similar summer GPP rates were found in the Elbe in other studies (e.g., Kamjunke et al., 2021), we assume that the GPP values and long-term changes have a high certainty. The absolute ER and k600 values for the Elbe could not be independently verified. However, the reduction in ER rates due to wastewater treatment improvements seems plausible. If we assume k600 to be solely driven by hydraulic factors, for which we found no indication of change, then an overall decrease in ER could be a likely mechanistic explanation for the observed changes in DO.
4.3 Linking metabolism and DIN retention
Despite its simple nature, the metabolic N demand model showed promising results in predicting mean DIN retention rates (Fig. 4a–c). Between 1979 and 1990, only the parametrization UMEThigh was able to mimic the distribution of observed DIN retention rates correctly. Only after 2003 did the model gain noteworthy predictive capabilities for the observed daily DIN retention rates (R≥0.7) for the parametrizations UMETlow and UMETmean, with the parametrization UMEThigh performing worse (R≈0.5). The overall observation of low model performance before 2003 can be interpreted as a weakened coupling between metabolic processes and in-stream DIN retention. As we hypothesized, processes such as denitrification, NH4 N sorption, and nitrification can impact the DIN and oxygen balance differentially, weakening the link between both elemental cycles. While we have no independent information on the rates of denitrification, NH4 N sorption, and nitrification in the studied segment before 1990, we argue that the circumstances indicate that they were likely higher than after 2000. With little NH4 N present in the segment after the improvements in wastewater treatment, neither sorption nor nitrification could have occurred at high rates. Nitrification, on the other hand, is assumed to have been a major drain on the oxygen budget of the Elbe before reunification (Wachholz et al., 2024). Denitrification is assumed to be a minor part of the Elbe's DIN retention in recent years (Schulz et al., 2023), but it is known that lower DO concentrations in eutrophic rivers, as were experienced in the Elbe before 1990, can promote denitrification (Rysgaard et al., 1994). The DIN retention after 2003 is likely largely due to assimilation by heterotrophic and autotrophic organisms and, therefore, closely linked to the metabolic processes, as indicated by the improved model performance in this period.
Our findings also have implications for how much of the metabolic nitrogen demand comes from the assimilation by autotrophic organisms. The UMEThigh parametrization, which is the only one able to explain the high DIN retention values before 1990 (Fig. 4a), predicts that more than 90 % of DIN retention comes from heterotrophic nitrogen demands. Even if this parametrization is unrealistic and denitrification would have been a major part of the observed DIN retention, it seems likely that most DIN retention, at least before 1990, was caused by heterotrophic organisms. On the other hand, after 2003, UMETlow and UMETmean show the best performance and predict that between 50 % and 80 % of the observed DIN retention was caused by autotrophic organisms. We interpret this as a shift between an in-stream DIN retention regime dominated by heterotrophic activity to one dominated by autotrophic activity.
As in-stream processes are greatly influenced by the hydroclimate of the river (e.g., Bernhardt et al., 2022) and changes in its flow regime, as caused for example by dams (e.g., Aristi et al., 2014), these are competing drivers for the observed changes. At least as of 2013, no systematic trends in the Elbe's flow regime had been documented (Mudersbach et al., 2016). The Elbe's water temperature is rising (∼ 0.01 °C yr−1) in concert with rising air temperatures, and a phase shift towards 2-week-earlier warming has been described (Markovic et al., 2013). Based on these findings, however, we find it unlikely that hydroclimatic changes caused the changes in in-stream processes described here.
Our results also highlight the importance of the parameters RQ, GHHET, and C : NHET, which, within reasonable bounds, can change heterotrophic nitrogen demand by a factor of 10 (Fig. 4a). GEHET is often positively correlated with overall bacterial productivity or phosphorus concentrations (del Giorgio and Cole, 1998; Smith and Prairie, 2004). As both declined during the studied period, a decline in GEHET, as suggested by the decreasing performance of the UMEThigh parametrization, seems plausible. For RQ, the quality of the available organic matter seems to be important, with small organic acids leading to especially high RQs (Bergren et al., 2012; Allesson et al., 2016). However, this was not assessed in this study. Overall, the variability in the literature values for GHHET is 10 times higher than for RQ (Table 1). Understanding and constraining the variability in these parameters, especially GEHET, is therefore paramount for a better understanding of carbon, oxygen, and nitrogen cycles in rivers. In our simple analysis, we ignored variability in the parameters C : NAUT, GEAUT, and PQ, which could explain the still-improvable fits of the metabolic nitrogen demand model after 2003.
4.4 Ecological implications
Long-term changes in GPP and ER can have a multitude of ecological implications for the river segment itself or for downstream ecosystems. For example, high ER and low GPP, as we observed in the Elbe before 1990, can lead to increased riverine CO2 emissions (Attermeyer et al., 2021). Higher primary production in the Elbe after 1990 caused greater export of organic matter to the estuary during summer, which supported higher rates of estuarine ecosystem respiration, which in turn decreased DO concentrations (Amann et al., 2012) and reduced available habitats for fish species over extended stretches of the tidal zones in the estuary (Mann, 1996).
The changed seasonality of DIN retention also likely had an impact on downstream ecosystems. Even though absolute retention rates before 1990 were higher (Fig. 2a), only 20 %–25 % of DIN was retained during summer (Fig. 2b), when algal blooms are most likely to occur. After German reunification, the decreased DIN load (Fig. 2c) and increased in-stream retention led to less DIN being exported to the estuary during summer, decreasing the probability of DIN-induced estuarine algal blooms (Anderson et al., 2008).
Our study provides valuable insights into the long-term effects of inorganic and organic pollution reduction and the tight coupling with the ecosystem functions of DIN retention and metabolism within large rivers. The shift from a heterotrophic-dominated to an autotrophic-dominated DIN retention regime has implications for the carbon cycle and algal blooms in downstream ecosystems.
Our findings highlight the importance of considering different dimensions of integrative ecosystem functions (metabolism and DIN retention) when assessing long-term ecological changes in rivers, such as eutrophication. Dissolved oxygen concentration time series alone are sufficient to support our findings of a heterotrophic to autotrophic regime shift, but estimates of GPP, ER, and DIN retention were required to support a quantitative assessment of the magnitude and consequences of this shift. The discovery of decoupled responses of ER and GPP to improvements in water quality offers new insights into the timescales of aquatic ecosystem responses to changing external forcing and informs realistic estimates of the efficiency of nutrient management and the achievement of environmental objectives.
Q, DIN, temperature, and DO time series can be downloaded from the FGG Elbe web portal (https://www.elbe-datenportal.de/FisFggElbe/, Flussgebietsgemeinschaft Elbe, 2022). The code for the metabolism estimation can be found at https://github.com/alexiwach/MetabolismModelElbe (Wachholz, 2024). The code used for the mass balance analysis and figure creation is available from the author upon reasonable request.
The supplement related to this article is available online at: https://doi.org/10.5194/bg-21-3537-2024-supplement.
Conceptualization: all Authors. Methodology – AW and JWJ. Data curation – AW. Formal analyses and investigation – AW and JWJ. Writing (original draft) – AW. Writing (review and editing) – AW, JWJ, and DB. Supervision – JWJ and DB.
The contact author has declared that none of the authors has any competing interests.
Publisher’s note: Copernicus Publications remains neutral with regard to jurisdictional claims made in the text, published maps, institutional affiliations, or any other geographical representation in this paper. While Copernicus Publications makes every effort to include appropriate place names, the final responsibility lies with the authors.
This research has been supported by the Helmholtz Gemeinschaft (grant no. HIRS-0017).
The article processing charges for this open-access publication were covered by the Helmholtz Centre for Environmental Research – UFZ.
This paper was edited by Ji-Hyung Park and reviewed by Jacob Diamond and one anonymous referee.
Aberle, J., Nikora, V., Henning, M., Ettmer, B., and Hentschel, B.: Statistical characterization of bed roughness due to bed forms: A field study in the Elbe River at Aken, Germany, Water Resour. Res., 46, W03521, https://doi.org/10.1029/2008WR007406, 2010.
Adams, M. S., Ballin, U., Gaumert, T., Hale, B. W., Kausch, H., and Kruse, R.: Monitoring selected indicators of ecological change in the Elbe River since the fall of the iron curtain, Environ. Conserv., 28, 333–344, https://doi.org/10.1017/S0376892901000364, 2001.
Allesson, L., Ström, L., and Berggren, M.: Impact of photochemical processing of DOC on the bacterioplankton respiratory quotient in aquatic ecosystems, Geophys. Res. Lett., 43, 7538–7545, https://doi.org/10.1002/2016GL069621, 2016.
Amann, T., Weiss, A., and Hartmann, J.: Carbon dynamics in the freshwater part of the Elbe estuary, Germany: Implications of improving water quality, Estuarine, Coast. Shelf Sci., 107, 112–121, https://doi.org/10.1016/j.ecss.2012.05.012, 2012.
Aristi, I., Arroita, M., Larrañaga, A., Ponsatí, L., Sabater, S., Von Schiller, D., Elosegi, A., and Acuña, V.: Flow regulation by dams affects ecosystem metabolism in Mediterranean rivers, Freshwater Biol., 59, 1816–1829, https://doi.org/10.1111/fwb.12385, 2014.
Arroita, M., Elosegi, A., and Hall Jr., R. O.: Twenty years of daily metabolism show riverine recovery following sewage abatement, Limnol. Oceanogr., 64, S77–S92, https://doi.org/10.1002/lno.11053, 2019.
Attermeyer, K., Casas-Ruiz, J. P., Fuss, T., Pastor, A., Cauvy-Fraunié, S., Sheath, D., Nydahl, A. C., Doretto, A., Portela, A. P., Doyle, B. C., Simov, N., Gutmann Roberts, C., Niedrist, G. H., Timoner, X., Evtimova, V., Barral-Fraga, L., Bašić, T., Audet, J., Deininger, A., Busst, G., Fenoglio, S., Catalán, N., de Eyto, E., Pilotto, F., Mor, J.-R., Monteiro, J., Fletcher, D., Noss, C., Colls, M., Nagler, M., Liu, L., Romero González-Quijano, C., Romero, F., Pansch, N., Ledesma, J. L. J., Pegg, J., Klaus, M., Freixa, A., Herrero Ortega, S., Mendoza-Lera, C., Bednařík, A., Fonvielle, J. A., Gilbert, P. J., Kenderov, L. A., Rulík, M., and Bodmer, P.: Carbon dioxide fluxes increase from day to night across European streams, Commun. Earth Environ., 2, 1–8, https://doi.org/10.1038/s43247-021-00192-w, 2021.
Ballard, T. C., Sinha, E., and Michalak, A. M.: Long-Term Changes in Precipitation and Temperature Have Already Impacted Nitrogen Loading, Environ. Sci. Technol., 53, 5080–5090, https://doi.org/10.1021/acs.est.8b06898, 2019.
Bauerkaemper, A.: The industrialization of agriculture and its consequences for the natural environment: an inter-German comparative perspective, Hist. Soc. Res., 29, 124–149, 2004.
Bergbusch, N. T., Hayes, N. M., Simpson, G. L., and Leavitt, P. R.: Unexpected shift from phytoplankton to periphyton in eutrophic streams due to wastewater influx, Limnol. Oceanogr., 66, 2745–2761, https://doi.org/10.1002/lno.11786, 2021.
Berggren, M., Lapierre, J.-F., and del Giorgio, P. A.: Magnitude and regulation of bacterioplankton respiratory quotient across freshwater environmental gradients, ISME J., 6, 984–993, https://doi.org/10.1038/ismej.2011.157, 2012.
Bernhardt, E. S., Savoy, P., Vlah, M. J., Appling, A. P., Koenig, L. E., Hall, R. O., Arroita, M., Blaszczak, J. R., Carter, A. M., Cohen, M., Harvey, J. W., Heffernan, J. B., Helton, A. M., Hosen, J. D., Kirk, L., McDowell, W. H., Stanley, E. H., Yackulic, C. B., and Grimm, N. B.: Light and flow regimes regulate the metabolism of rivers, P. Natl. Acad. Sci. USA, 119, e2121976119, https://doi.org/10.1073/pnas.2121976119, 2022.
Bertuzzo, E., Helton, A. M., Hall, R. O., and Battin, T. J.: Scaling of dissolved organic carbon removal in river networks, Adv. Water Res., 110, 136–146, https://doi.org/10.1016/j.advwatres.2017.10.009, 2017.
Bianchi, T. S., DiMarco, S. F., Cowan, J. H., Hetland, R. D., Chapman, P., Day, J. W., and Allison, M. A.: The science of hypoxia in the Northern Gulf of Mexico: A review, Sci. Total Environ., 408, 1471–1484, https://doi.org/10.1016/j.scitotenv.2009.11.047, 2010.
Booker, D. J. and Dunbar, M. J.: Predicting river width, depth and velocity at ungauged sites in England and Wales using multilevel models, Hydrol. Process., 22, 4049–4057, https://doi.org/10.1002/hyp.7007, 2008.
Cavaliere, E. and Baulch, H. M.: Winter nitrification in ice-covered lakes, PLOS ONE, 14, e0224864, https://doi.org/10.1371/journal.pone.0224864, 2019.
Cejudo, E., Taylor, W., and Schiff, S.: Epilithic algae from an urban river preferentially use ammonium over nitrate, Int. Aquat. Res., 12, 30–39, https://doi.org/10.22034/iar(20).2020.671068, 2020.
Collos, Y. and Harrison, P. J.: Acclimation and toxicity of high ammonium concentrations to unicellular algae, Mar. Pollut. Bull., 80, 8–23, https://doi.org/10.1016/j.marpolbul.2014.01.006, 2014.
del Giorgio, P. A., Cole, J. J., and Cimbleris, A.: Respiration rates in bacteria exceed phytoplankton production in unproductive aquatic systems, Nature, 385, 148–151, https://doi.org/10.1038/385148a0, 1997.
del Giorgio, P. A. and Cole, J. J.: Bacterial Growth Efficiency in Natural Aquatic Systems, Annu. Rev. Ecol. Syst., 29, 503–541, https://doi.org/10.1146/annurev.ecolsys.29.1.503, 1998.
Deutsch, B., Voss, M., and Fischer, H.: Nitrogen transformation processes in the Elbe River: Distinguishing between assimilation and denitrification by means of stable isotope ratios in nitrate, Aquat. Sci., 71, 228–237, https://doi.org/10.1007/s00027-009-9147-9, 2009.
Diamond, J. S., Moatar, F., Cohen, M. J., Poirel, A., Martinet, C., Maire, A., and Pinay, G.: Metabolic regime shifts and ecosystem state changes are decoupled in a large river, Limnol. Oceanogr., 67, S54–S70, https://doi.org/10.1002/lno.11789, 2022.
Doretto, A., Piano, E., and Larson, C. E.: The River Continuum Concept: lessons from the past and perspectives for the future, Can. J. Fish. Aquat. Sci., 77, 1853–1864, https://doi.org/10.1139/cjfas-2020-0039, 2020.
Duffie, J. A. and Beckman, W. A.: Solar Engineering of Thermal Processes, John Wiley & Sons, 936 pp., https://doi.org/10.1002/9781118671603, 2013.
Dupas, R., Minaudo, C., Gruau, G., Ruiz, L., and Gascuel‐Odoux, C.: Multidecadal Trajectory of Riverine Nitrogen and Phosphorus Dynamics in Rural Catchments, Water Resour. Res., 54, 5327–5340, https://doi.org/10.1029/2018WR022905, 2018.
Ehrhardt, S., Kumar, R., Fleckenstein, J. H., Attinger, S., and Musolff, A.: Trajectories of nitrate input and output in three nested catchments along a land use gradient, Hydrol. Earth Syst. Sci., 23, 3503–3524, https://doi.org/10.5194/hess-23-3503-2019, 2019.
Flussgebietsgemeinschaft Elbe: Fachinformationssystem der FGG Elbe, Elbe Daten Portal [data set], https://www.elbedatenportal.de/FisFggElbe/, last access: 26 November 2022.
Godwin, C. M. and Cotner, J. B.: What intrinsic and extrinsic factors explain the stoichiometric diversity of aquatic heterotrophic bacteria?, ISME J., 12, 598–609, https://doi.org/10.1038/ismej.2017.195, 2018.
Hall Jr., R. O. and Tank, J. L.: Ecosystem metabolism controls nitrogen uptake in streams in Grand Teton National Park, Wyoming, Limnol. Oceanogr., 48, 1120–1128, https://doi.org/10.4319/lo.2003.48.3.1120, 2003.
Hall, R. O., Tank, J. L., Baker, M. A., Rosi-Marshall, E. J., and Hotchkiss, E. R.: Metabolism, Gas Exchange, and Carbon Spiraling in Rivers, Ecosystems, 19, 73–86, https://doi.org/10.1007/s10021-015-9918-1, 2016.
Hardenbicker, P., Rolinski, S., Weitere, M., and Fischer, H.: Contrasting long-term trends and shifts in phytoplankton dynamics in two large rivers, Int. Rev. Hydrobiol., 99, 287–299, https://doi.org/10.1002/iroh.201301680, 2014.
Heffernan, J. B. and Cohen, M. J.: Direct and indirect coupling of primary production and diel nitrate dynamics in a subtropical spring-fed river, Limnol. Oceanogr., 55, 677–688, https://doi.org/10.4319/lo.2010.55.2.0677, 2010.
Hillebrand, G., Hardenbicker, P., Fischer, H., Otto, W., and Vollmer, S.: Dynamics of total suspended matter and phytoplankton loads in the river Elbe, J. Soil. Sediment., 18, 3104–3113, https://doi.org/10.1007/s11368-018-1943-1, 2018.
Hirsch, R. M., Moyer, D. L., and Archfield, S. A.: Weighted Regressions on Time, Discharge, and Season (WRTDS), with an Application to Chesapeake Bay River Inputs1, JAWRA J. Am. Water Resour. Assoc., 46, 857–880, https://doi.org/10.1111/j.1752-1688.2010.00482.x, 2010.
IKSE: Die Elbe und ihr Einzugsgebiet: Ein geographisch-hydrologischer und wasserwirtschaftlicher Überblick. Internationale Kommission zum Schutz der Elbe (IKSE), https://digital.bibliothek.uni-halle.de/pe/content/titleinfo/1485813 (last access: 12 April 2021), 2005.
IKSE: Abschlussbericht Aktionsprogramm Elbe 1996–2010, Internationale Kommission zum Schutz der Elbe (IKSE), https://www.ikse-mkol.org/fileadmin/media//user_upload/D/06_Publikationen/03_Aktionsprogramme und Bestandsaufnahmen/2010_IKSE-AP-Abschlussbericht.pdf (last access: 12 April 2021), 2010.
Jarvie, H. P., Macrae, M. L., Anderson, M., Celmer-Repin, D., Plach, J., and King, S. M.: River metabolic fingerprints and regimes reveal ecosystem responses to enhanced wastewater treatment, J. Environ. Qual., 51, 811–825, https://doi.org/10.1002/jeq2.20401, 2022.
Kamjunke, N., Rode, M., Baborowski, M., Kunz, J. V., Zehner, J., Borchardt, D., and Weitere, M.: High irradiation and low discharge promote the dominant role of phytoplankton in riverine nutrient dynamics, Limnol. Oceanogr., 66, 2648–2660, https://doi.org/10.1002/lno.11778, 2021.
Kelly, M. C., Zeglin, L. H., Husic, A., and Burgin, A. J.: High Supply, High Demand: A Fertilizer Waste Release Impacts Nitrate Uptake and Metabolism in a Large River, J. Geophys. Res.-Biogeo., 126, e2021JG006469, https://doi.org/10.1029/2021JG006469, 2021.
Lehmann, A. and Rode, M.: Long-term behaviour and cross-correlation water quality analysis of the river Elbe, Germany, Water Res., 35, 2153–2160, https://doi.org/10.1016/S0043-1354(00)00488-7, 2001.
Lutz, S., Ebeling, P., Musolff, A., Nguyen, T., Sarrazin, F., Van Meter, K., Basu, N., Fleckenstein, J., Attinger, S., and Kumar, R.: Pulling the Rabbit out of the Hat: Unravelling Hidden Nitrogen Legacies in Catchment-Scale Water Quality Models, Hydrol. Process., 36, e14682, https://doi.org/10.1002/hyp.14682, 2022.
Mann, R. H. K.: Environmental requirements of European non-salmonid fish in rivers, Hydrobiologia, 323, 223–235, https://doi.org/10.1007/BF00007848, 1996.
Markovic, D., Scharfenberger, U., Schmutz, S., Pletterbauer, F., and Wolter, C.: Variability and alterations of water temperatures across the Elbe and Danube River Basins, Climatic Change, 119, 375–389, https://doi.org/10.1007/s10584-013-0725-4, 2013.
Meybeck, M., Lestel, L., Carré, C., Bouleau, G., Garnier, J., and Mouchel, J. M.: Trajectories of river chemical quality issues over the Longue Durée: the Seine River (1900S–2010), Environ. Sci. Pollut. Res., 25, 23468–23484, https://doi.org/10.1007/s11356-016-7124-0, 2018.
Middelburg, J. and Nieuwenhuize, J.: Nitrogen uptake by heterotrophic bacteria and phytoplankton in the nitrate-rich Thames estuary, Mar. Ecol. Prog. Ser., 203, 13–21, https://doi.org/10.3354/meps203013, 2000.
Minaudo, C., Meybeck, M., Moatar, F., Gassama, N., and Curie, F.: Eutrophication mitigation in rivers: 30 Years of trends in spatial and seasonal patterns of biogeochemistry of the Loire River (1980–2012), Biogeosciences, 12, 2549–2563, https://doi.org/10.5194/bg-12-2549-2015, 2015.
Mudersbach, C., Bender, J., and Netzel, F.: An analysis of changes in flood quantiles at the gauge Neu Darchau (Elbe River) from 1875 to 2013, Proc. IAHS, 373, 193–199, https://doi.org/10.5194/piahs-373-193-2016, 2016.
Netzband, A., Reincke, H., and Bergemann, M.: The river elbe, J. Soil. Sediment., 2, 112–116, https://doi.org/10.1007/BF02988462, 2002.
Odum, H. T.: Primary Production in Flowing Waters1, Limnol. Oceanogr., 1, 102–117, https://doi.org/10.4319/lo.1956.1.2.0102, 1956.
Petersen, W. and Callies, U.: Assessment of Primary Production by Statistical Analysis of Water-quality Data, Acta Hydroch. Hydrob., 30, 34–40, https://doi.org/10.1002/1521-401X(200207)30:1<34::AID-AHEH34>3.0.CO;2-M, 2002.
Powers, S. M., Baulch, H. M., Hampton, S. E., Labou, S. G., Lottig, N. R., and Stanley, E. H.: Nitrification contributes to winter oxygen depletion in seasonally frozen forested lakes, Biogeochemistry, 136, 119–129, https://doi.org/10.1007/s10533-017-0382-1, 2017.
Rasmussen, J. J., Baattrup-Pedersen, A., Riis, T., and Friberg, N.: Stream ecosystem properties and processes along a temperature gradient, Aquat. Ecol., 45, 231–242, https://doi.org/10.1007/s10452-010-9349-1, 2011.
Raymond, P. A., Zappa, C. J., Butman, D., Bott, T. L., Potter, J., Mulholland, P., Laursen, A. E., McDowell, W. H., and Newbold, D.: Scaling the gas transfer velocity and hydraulic geometry in streams and small rivers, Limnol. Oceanogr., 2, 41–53, https://doi.org/10.1215/21573689-1597669, 2012.
Rier, S. T. and Stevenson, R. J.: Effects of light, dissolved organic carbon, and inorganic nutrients on the relationship between algae and heterotrophic bacteria in stream periphyton, Hydrobiologia, 489, 179–184, https://doi.org/10.1023/A:1023284821485, 2002.
Ritz, S. and Fischer, H.: A Mass Balance of Nitrogen in a Large Lowland River (Elbe, Germany), Water, 11, 2383, https://doi.org/10.3390/w11112383, 2019.
Ritz, S., Dähnke, K., and Fischer, H.: Open-channel measurement of denitrification in a large lowland river, Aquat. Sci., 80, 11, https://doi.org/10.1007/s00027-017-0560-1, 2017.
Rode, M., Halbedel Née Angelstein, S., Anis, M. R., Borchardt, D., and Weitere, M.: Continuous In-Stream Assimilatory Nitrate Uptake from High-Frequency Sensor Measurements, Environ. Sci. Technol., 50, 5685–5694, https://doi.org/10.1021/acs.est.6b00943, 2016.
Rysgaard, S., Risgaard-Petersen, N., Niels Peter, S., Kim, J., and Lars Peter, N.: Oxygen regulation of nitrification and denitrification in sediments, Limnol. Oceanogr., 39, 1643–1652, https://doi.org/10.4319/lo.1994.39.7.1643, 1994.
Scharfe, M., Callies, U., Blöcker, G., Petersen, W., and Schroeder, F.: A simple Lagrangian model to simulate temporal variability of algae in the Elbe River, Ecol. Model., 220, 2173–2186, https://doi.org/10.1016/j.ecolmodel.2009.04.048, 2009.
Schlesinger, W. H. and Bernhardt, E. S.: The Global Cycles of Nitrogen, Phosphorus and Potassium, Chap. 12, in: Biogeochemistry, 4th Edn., edited by: Schlesinger, W. H. and Bernhardt, E. S., Academic Press, 483–508, https://doi.org/10.1016/B978-0-12-814608-8.00012-8, 2020.
Schulz, G., van Beusekom, J. E. E., Jacob, J., Bold, S., Schöl, A., Ankele, M., Sanders, T., and Dähnke, K.: Low discharge intensifies nitrogen retention in rivers – A case study in the Elbe River, Sci. Total Environ., 904, 166740, https://doi.org/10.1016/j.scitotenv.2023.166740, 2023.
Seitzinger, S. P., Styles, R. V., Boyer, E. W., Alexander, R. B., Billen, G., Howarth, R. W., Mayer, B., and Breemen, N. V.: Nitrogen retention in rivers: Model development and application to watersheds in the northeastern U.S.A., Biogeochemistry, 57, 199–237, https://doi.org/10.1023/A:1015745629794, 2002.
Serra-Llobet, A., Jähnig, S. C., Geist, J., Kondolf, G. M., Damm, C., Scholz, M., Lund, J., Opperman, J. J., Yarnell, S. M., Pawley, A., Shader, E., Cain, J., Zingraff-Hamed, A., Grantham, T. E., Eisenstein, W., and Schmitt, R.: Restoring Rivers and Floodplains for Habitat and Flood Risk Reduction: Experiences in Multi-Benefit Floodplain Management From California and Germany, Front. Environ. Sci., 9, 778568, https://doi.org/10.3389/fenvs.2021.778568, 2022.
Sherman, E., Moore, J. K., Primeau, F., and Tanouye, D.: Temperature influence on phytoplankton community growth rates, Global Biogeochem. Cy., 30, 550–559, https://doi.org/10.1002/2015GB005272, 2016.
Smith, E. M. and Prairie, Y. T.: Bacterial metabolism and growth efficiency in lakes: The importance of phosphorus availability, Limnol. Oceanogr., 49, 137–147, https://doi.org/10.4319/lo.2004.49.1.0137, 2004.
Snell, M. A., Barker, P. A., surridge, B. W. J., Benskin, C. H. M., Barber, N., Reaney, M., tych, W., Mindham, D., Large, A. R. G., Burke, S., and Haygarth, M.: Strong and recurring seasonality revealed within stream diatom assemblages, Sci. Rep., 9, 3313, https://doi.org/10.1038/s41598-018-37831-w, 2019.
Stream Solute Workshop: Concepts and Methods for Assessing Solute Dynamics in Stream Ecosystems, J. North Am. Benthol. Soc., 9, 95–119, https://doi.org/10.2307/1467445, 1990.
Trentman, M. T., Tank, J. L., Davis, R. T., Hanrahan, B. R., Mahl, U. H., and Roley, S. S.: Watershed-scale Land Use Change Increases Ecosystem Metabolism in an Agricultural Stream, Ecosystems, 25, 441–456, https://doi.org/10.1007/s10021-021-00664-2, 2022.
Triska, F. J., Jackman, A. P., Duff, J. H., and Avanzino, R. J.: Ammonium sorption to channel and riparian sediments: A transient storage pool for dissolved inorganic nitrogen, Biogeochemistry, 26, 67–83, https://doi.org/10.1007/BF02182880, 1994.
Van de Bogert, M. C., Carpenter, S. R., Cole, J. J., and Pace, M. L.: Assessing pelagic and benthic metabolism using free water measurements, Limnol. Oceanogr.-Meth., 5, 145–155, https://doi.org/10.4319/lom.2007.5.145, 2007.
Van Meter, K. J., Basu, N. B., and Cappellen, P. V.: Two centuries of nitrogen dynamics: Legacy sources and sinks in the Mississippi and Susquehanna River Basins, Global Biogeochem. Cy., 31, 2–23, https://doi.org/10.1002/2016gb005498, 2017.
Virtanen, P., Gommers, R., Oliphant, T. E., Haberland, M., Reddy, T., Cournapeau, D., Burovski, E., Peterson, P., Weckesser, W., Bright, J., van der Walt, S. J., Brett, M., Wilson, J., Millman, K. J., Mayorov, N., Nelson, A. R. J., Jones, E., Kern, R., Larson, E., Carey, C. J., Polat, İ., Feng, Y., Moore, E. W., VanderPlas, J., Laxalde, D., Perktold, J., Cimrman, R., Henriksen, I., Quintero, E. A., Harris, C. R., Archibald, A. M., Ribeiro, A. H., Pedregosa, F., van Mulbregt, P., and SciPy 1.0 Contributors: SciPy 1.0: Fundamental Algorithms for Scientific Computing in Python, Nat. Method., 17, 261–272, https://doi.org/10.1038/s41592-019-0686-2, 2020.
Vörösmarty, C. J., Meybeck, M., and Pastore, C. L.: Impair-then-Repair: A Brief History and Global-Scale Hypothesis Regarding Human-Water Interactions in the Anthropocene, Daedalus, 144, 94–109, https://doi.org/10.1162/DAED_a_00345, 2015.
Wachholz, A.: Long-term metabolism model for the Elbe, Zenodo [Code], https://doi.org/10.5281/zenodo.13209788, 2024.
Wachholz, A., Jawitz, J. W., Büttner, O., Jomaa, S., Merz, R., Yang, S., and Borchardt, D.: Drivers of multi-decadal nitrate regime shifts in a large European catchment, Environ. Res. Lett., 17, 064039, https://doi.org/10.1088/1748-9326/ac6f6a, 2022.
Wachholz, A., Borchardt, D: Vom Eisernen Vorhang zum grünen Band, Korrespondenz Wasserwirtschaft, 4, 245–251, https://doi.org/10.3243/kwe2024.04.002, 2024.
Wanninkhof, R.: Relationship between wind speed and gas exchange over the ocean, J. Geophys. Res.-Ocean., 97, 7373–7382, https://doi.org/10.1029/92JC00188, 1992.
Weiss, R. F.: The solubility of nitrogen, oxygen and argon in water and seawater, Deep-Sea Res. Oceanogr. Abstr., 17, 721–735, https://doi.org/10.1016/0011-7471(70)90037-9, 1970.
Westphal, K., Graeber, D., Musolff, A., Fang, Y., Jawitz, J. W., and Borchardt, D.: Multi-decadal trajectories of phosphorus loading, export, and instream retention along a catchment gradient, Sci. Total Environ., 667, 769–779, https://doi.org/10.1016/j.scitotenv.2019.02.428, 2019.
Zhang, X., Yang, X., Hensley, R., Lorke, A., and Rode, M.: Disentangling In-Stream Nitrate Uptake Pathways Based on Two-Station High-Frequency Monitoring in High-Order Streams, Water Resour. Res., 59, e2022WR032329, https://doi.org/10.1029/2022WR032329, 2023.
Zill, J., Siebert, C., Rödiger, T., Schmidt, A., Gilfedder, B. S., Frei, S., Schubert, M., Weitere, M., and Mallast, U.: A way to determine groundwater contributions to large river systems: The Elbe River during drought conditions, J. Hydrol., 50, 101595, https://doi.org/10.1016/j.ejrh.2023.101595, 2023.