the Creative Commons Attribution 4.0 License.
the Creative Commons Attribution 4.0 License.
 | 25 Jan 2024
Reviews and syntheses: Remotely sensed optical time series for monitoring vegetation productivity
Lammert Kooistra
Katja Berger
Benjamin Brede
Lukas Valentin Graf
Helge Aasen
Jean-Louis Roujean
Miriam Machwitz
Martin Schlerf
Clement Atzberger
Egor Prikaziuk
Dessislava Ganeva
Enrico Tomelleri
Holly Croft
Pablo Reyes Muñoz
Virginia Garcia Millan
Roshanak Darvishzadeh
Gerbrand Koren
Ittai Herrmann
Offer Rozenstein
Santiago Belda
Miina Rautiainen
Stein Rune Karlsen
Cláudio Figueira Silva
Sofia Cerasoli
Jon Pierre
Emine Tanır Kayıkçı
Andrej Halabuk
Esra Tunc Gormus
Frank Fluit
Zhanzhang Cai
Marlena Kycko
Thomas Udelhoven
Jochem Verrelst
Vegetation productivity is a critical indicator of global ecosystem health and is impacted by human activities and climate change. A wide range of optical sensing platforms, from ground-based to airborne and satellite, provide spatially continuous information on terrestrial vegetation status and functioning. As optical Earth observation (EO) data are usually routinely acquired, vegetation can be monitored repeatedly over time, reflecting seasonal vegetation patterns and trends in vegetation productivity metrics. Such metrics include gross primary productivity, net primary productivity, biomass, or yield. To summarize current knowledge, in this paper we systematically reviewed time series (TS) literature for assessing state-of-the-art vegetation productivity monitoring approaches for different ecosystems based on optical remote sensing (RS) data. As the integration of solar-induced fluorescence (SIF) data in vegetation productivity processing chains has emerged as a promising source, we also include this relatively recent sensor modality. We define three methodological categories to derive productivity metrics from remotely sensed TS of vegetation indices or quantitative traits: (i) trend analysis and anomaly detection, (ii) land surface phenology, and (iii) integration and assimilation of TS-derived metrics into statistical and process-based dynamic vegetation models (DVMs). Although the majority of used TS data streams originate from data acquired from satellite platforms, TS data from aircraft and unoccupied aerial vehicles have found their way into productivity monitoring studies. To facilitate processing, we provide a list of common toolboxes for inferring productivity metrics and information from TS data. We further discuss validation strategies of the RS data derived productivity metrics: (1) using in situ measured data, such as yield; (2) sensor networks of distinct sensors, including spectroradiometers, flux towers, or phenological cameras; and (3) inter-comparison of different productivity metrics. Finally, we address current challenges and propose a conceptual framework for productivity metrics derivation, including fully integrated DVMs and radiative transfer models here labelled as “Digital Twin”. This novel framework meets the requirements of multiple ecosystems and enables both an improved understanding of vegetation temporal dynamics in response to climate and environmental drivers and enhances the accuracy of vegetation productivity monitoring.


Vegetation productivity, the rate at which solar energy is converted into biomass through photosynthesis, is the origin of all fuel, fibre, and food by which humanity and many other species live and should therefore be closely monitored. The total amount of photosynthesis on Earth defines the planetary boundary of production, which is a measure of how much of the planet's productivity humans have appropriated (Ryu et al., 2019). According to the United Nations (UN), the global population is expected to reach 9.7 billion by 2050, presenting a significant challenge for ensuring sufficient future food production. The productivity of plants is a crucial factor in meeting this challenge, as it directly affects the amount of food that can be produced. Plant productivity thus fundamentally delineates the habitability of our planet (Running et al., 2000).
The intensification and spatial expansion of human activities in recent centuries have profoundly altered the world's natural and cultural landscapes (Winkler et al., 2021) and have had a significant impact on ecosystem processes and their functions in society. An integrative proxy for this global change is the altered regime of vegetation productivity.
As a key characteristic of ecosystem conditions, global vegetation productivity reflects both the spatial distribution and change in the vegetation coverage (EEA, 2021). The key climatic drivers of vegetation productivity are temperature, water supply, and solar radiation (Madani et al., 2018), which interact to constrain the magnitude and temporal dynamics of ecosystem productivity depending on soil conditions. In the twenty-first century, it is expected that vegetation productivity will decrease due to the impacts of climate change in the Northern Hemisphere and may negatively affect the global land carbon (C) sink with unknown feedback effects (Zhang et al., 2022b).
Due to variations in vegetation composition, climate, soil properties, and management practices, among other factors, vegetation productivity is heterogeneous across space. In addition, this variation occurs at all timescales, from diurnal over seasonal to inter-annual. Thus, to achieve accurate global estimates of plant productivity that explicitly account for spatial and temporal variation, it is essential to acquire continuous spatial observations over time using optical Earth observation (EO) satellites. Remotely sensed time series (TS) from those EO data streams provide the basis for phenological monitoring, which is unequivocally related to productivity (e.g. Zhu et al., 2016). Phenological monitoring is the study of the timing of recurrent, annual biological events (e.g. budburst, flower blossoming, leaf senescence), and shifts in the timing of seasonal phenological events have been shown to be related to inter-annual variations in annual productivity (e.g. Park et al., 2019). Consequently, among the objectives of the EO satellite missions launched in the last 5 decades, primary importance has been given to observing the productivity and health of natural and cultivated vegetation land covers (e.g. Chevrel et al., 1981; Huete et al., 2002; Zhang et al., 2003; Atzberger, 2013). Novel satellite systems are launched constantly, and significant improvements in data-driven and physically based data analysis techniques are made (Baret and Buis, 2008).
These developments demand a systematic overview of the state-of-the-art TS studies related to vegetation productivity, presenting the unprecedented availability of continuous multi-sensor data streams, constantly updated data repositories, and the latest processing techniques and toolboxes. Recent review papers have focused on global land surface phenology (LSP) research (Zeng et al., 2020; Caparros-Santiago et al., 2021) but lacked the relationship to vegetation productivity. Other reviews were restricted to specific ecosystems (Berra and Gaulton, 2021) or sensors (Eitel et al., 2016). Microwave-based studies were covered by Teubner et al. (2018); Wild et al. (2022).
Therefore, we formulate for this review the following main research question: what are the state-of-the-art methods for estimating vegetation productivity using remotely sensed TS data streams, and what are the key gaps, challenges, and opportunities for further improvement?
To address this question, our main emphasis is on the precise EO-based estimation of productivity with consideration of the trend towards the increasing availability of higher-spatial-resolution EO data. Global change is resulting in a landscape that is more fragmented, scattered, and characterized by small-scale patterns. One example is the upcoming trend of agroforestry to make agriculture more resilient. As a consequence, the analysis of productivity needs to integrate high-resolution EO data. Hence, we will focus on the literature that uses remotely sensed optical TS and derived proxies for quantifying productivity, with a greater emphasis on the spatial scale than on the minimum number of time steps.
The review is divided into seven sections, where Sect. 1 provides a tangible definition of productivity and introduces the main productivity metrics and methods. Section 2 describes the available optical sensor platforms. Section 3 provides the methods in detail and toolboxes for processing, analysing, and modelling TS data streams. In Sect. 4 we outline three different strategies for validating productivity products. The outcomes of the systematic literature review are provided in Sect. 5. In Sect. 6 we provide an outlook on future challenges to assess vegetation productivity from TS data, followed by a conclusion (Sect. 7).
1.1 Definition of productivity adopted for this review
Productivity in ecosystems quantifies the rate at which autotrophic organisms, such as green plants, convert energy into organic metabolic assimilates (Scurlock and Olson, 2002; Larcher, 2003). Vegetation productivity is controlled by two processes: (i) the assimilation of CO2 substrate through photosynthesis (source activity) and (ii) tissue growth from the accumulated carbohydrates into stored biomass (sink activity) (Körner, 2015). Plant photosynthesis is driven by incoming photosynthetic active radiation, CO2 concentrations, temperature, and water and nutrient availability (e.g. Ryu et al., 2019).
Vegetation productivity is commonly defined by four measures: gross primary productivity (GPP), net primary productivity (NPP), net ecosystem productivity (NEP), and net biome productivity (NBP). The interplay of these main productivity measures is illustrated in Fig. 1.
Over small spatial extents (< 1 km2), NEP is usually directly estimated through eddy-covariance (EC) methods, where the vertical, turbulent fluxes of CO2 are measured within the atmospheric boundary layer using CO2 concentration measurements from an infrared gas analyser (IRGA) along with high-frequency sonic anemometer wind velocity measurements. NEP is subsequently partitioned into GPP and ecosystem respiration (Re), where estimated Re values are commonly derived from nighttime fluxes (i.e. NEP = Re) when GPP is zero and extrapolated to daytime fluxes. The ratio of NPP to GPP is termed the carbon use efficiency and represents the capacity to which plants are able to transform assimilated CO2 into stored biomass, after carbon losses through autotrophic respiration (Ra). The carbon use efficiency of vegetation varies according to factors such as plant species, nutrient availability, light, temperature, and water availability. However, the ratio of NPP to GPP is typically thought to be around 0.45, according to empirical studies, satellite products and process-based models (He et al., 2018), indicating that 55 % of the carbon captured by plants is directed towards respiration and thus cannot be utilized for net production and growth (Field et al., 1998). NBP is the net amount of carbon dioxide that is assimilated by an ecosystem over a period of time, after accounting for all losses of carbon dioxide through respiration, decomposition, and other processes. NBP is thus a measure of the overall health and productivity of an ecosystem, and it is an important factor in the global carbon cycle. Input and losses of NBP are on a rather long timescale for natural landscapes, and for agriculture it refers to harvest (e.g. Prescher et al., 2010; Turner et al., 2007).
Although NPP and GPP are common metrics to express the productivity of any ecosystem, in the literature different definitions or terms can be found. For instance, in agroecosystems, productivity often refers to aboveground (and below-ground) biomass (AGB) and yield (Chopping et al., 2011; Mariotto et al., 2013). In forestry, productivity is also often related to AGB or harvestable wood (Battles, 2022). For natural ecosystems, AGB, (e.g. Ramoelo et al., 2015; Lumbierres et al., 2017) but also directly NPP and GPP, is commonly used to express productivity (see, e.g. reviews by Anav et al., 2015; Liao et al., 2023). In the current review, we refer to all of these productivity metrics, which are summarized in the following.
Definitions of productivity metrics
Productivity is the rate at which a quantity (e.g. energy) is accumulated by producers (e.g. plants) over time within a given area. Here we give an overview of metrics for productivity adopted in our review.
-
Gross primary productivity (GPP). This is the total amount of C photosynthesized by plants (Myneni et al., 1995) in a given time (g C m−2 d−1) and also describes the largest carbon flux between the biosphere and the atmosphere (approximately 130 Gt C yr−1) (Krause et al., 2022).
-
Net primary productivity (NPP). This denotes the remaining C from photosynthesis after respiration losses from plants (Ra) (g C m−2 d−1), which is invested for the maintenance of cells and the growth of tissues (Roxburgh et al., 2005).
-
Net ecosystem productivity (NEP). This is defined as NPP minus soil heterotrophic respiration (Rh) by microorganisms (g C m−2 d−1), i.e. C loss from the decomposition of woody detritus, soil organic matter, vegetation mortality, grazing, etc. (Landsberg and Gower, 1997). It reflects the temporal change in C that can be stored in an ecosystem (Harmon et al., 2011). NEP thus quantifies the loss or accumulation of C within an ecosystem and defines if it is acting as a sink or source of C.
-
Net biome productivity (NBP). This represents the net change in carbon within ecosystems on a regional scale. It is calculated by adjusting NEP for lateral carbon transfers to neighbouring biomes, which may occur through various processes such as harvest, organic matter export in rivers, or losses from disturbances such as wildfires (e.g. Schulze et al., 2021; Prescher et al., 2010).
-
Aboveground biomass (AGB). This is the total amount of plant matter on the soil surface in a given area or ecosystem that has accumulated over time, as a result of photosynthesis and plant metabolism (kg C m−2). AGB plays a crucial role in quantifying the productivity of forests as it specifies the amount of stored carbon per unit area and subsequently the capacity for water filtration, soil retention, and biodiversity conservation (Powell et al., 2010; Goetz et al., 2009).
-
Crop yield. This is defined as the amount of the harvested product (e.g. kilograms of grain) per unit cropped area (kg ha−1) and is a measure of productivity referring to the part of biomass that can be used for the nutrition of humans, feeding of livestock, the production of fuel, or construction materials (Carletto et al., 2015).
-
Harvestable wood. This refers to productivity in forests, typically given in cubic metres of harvestable wood grown per year on a forested site (m3 ha−1) (FAO, 2010).
.
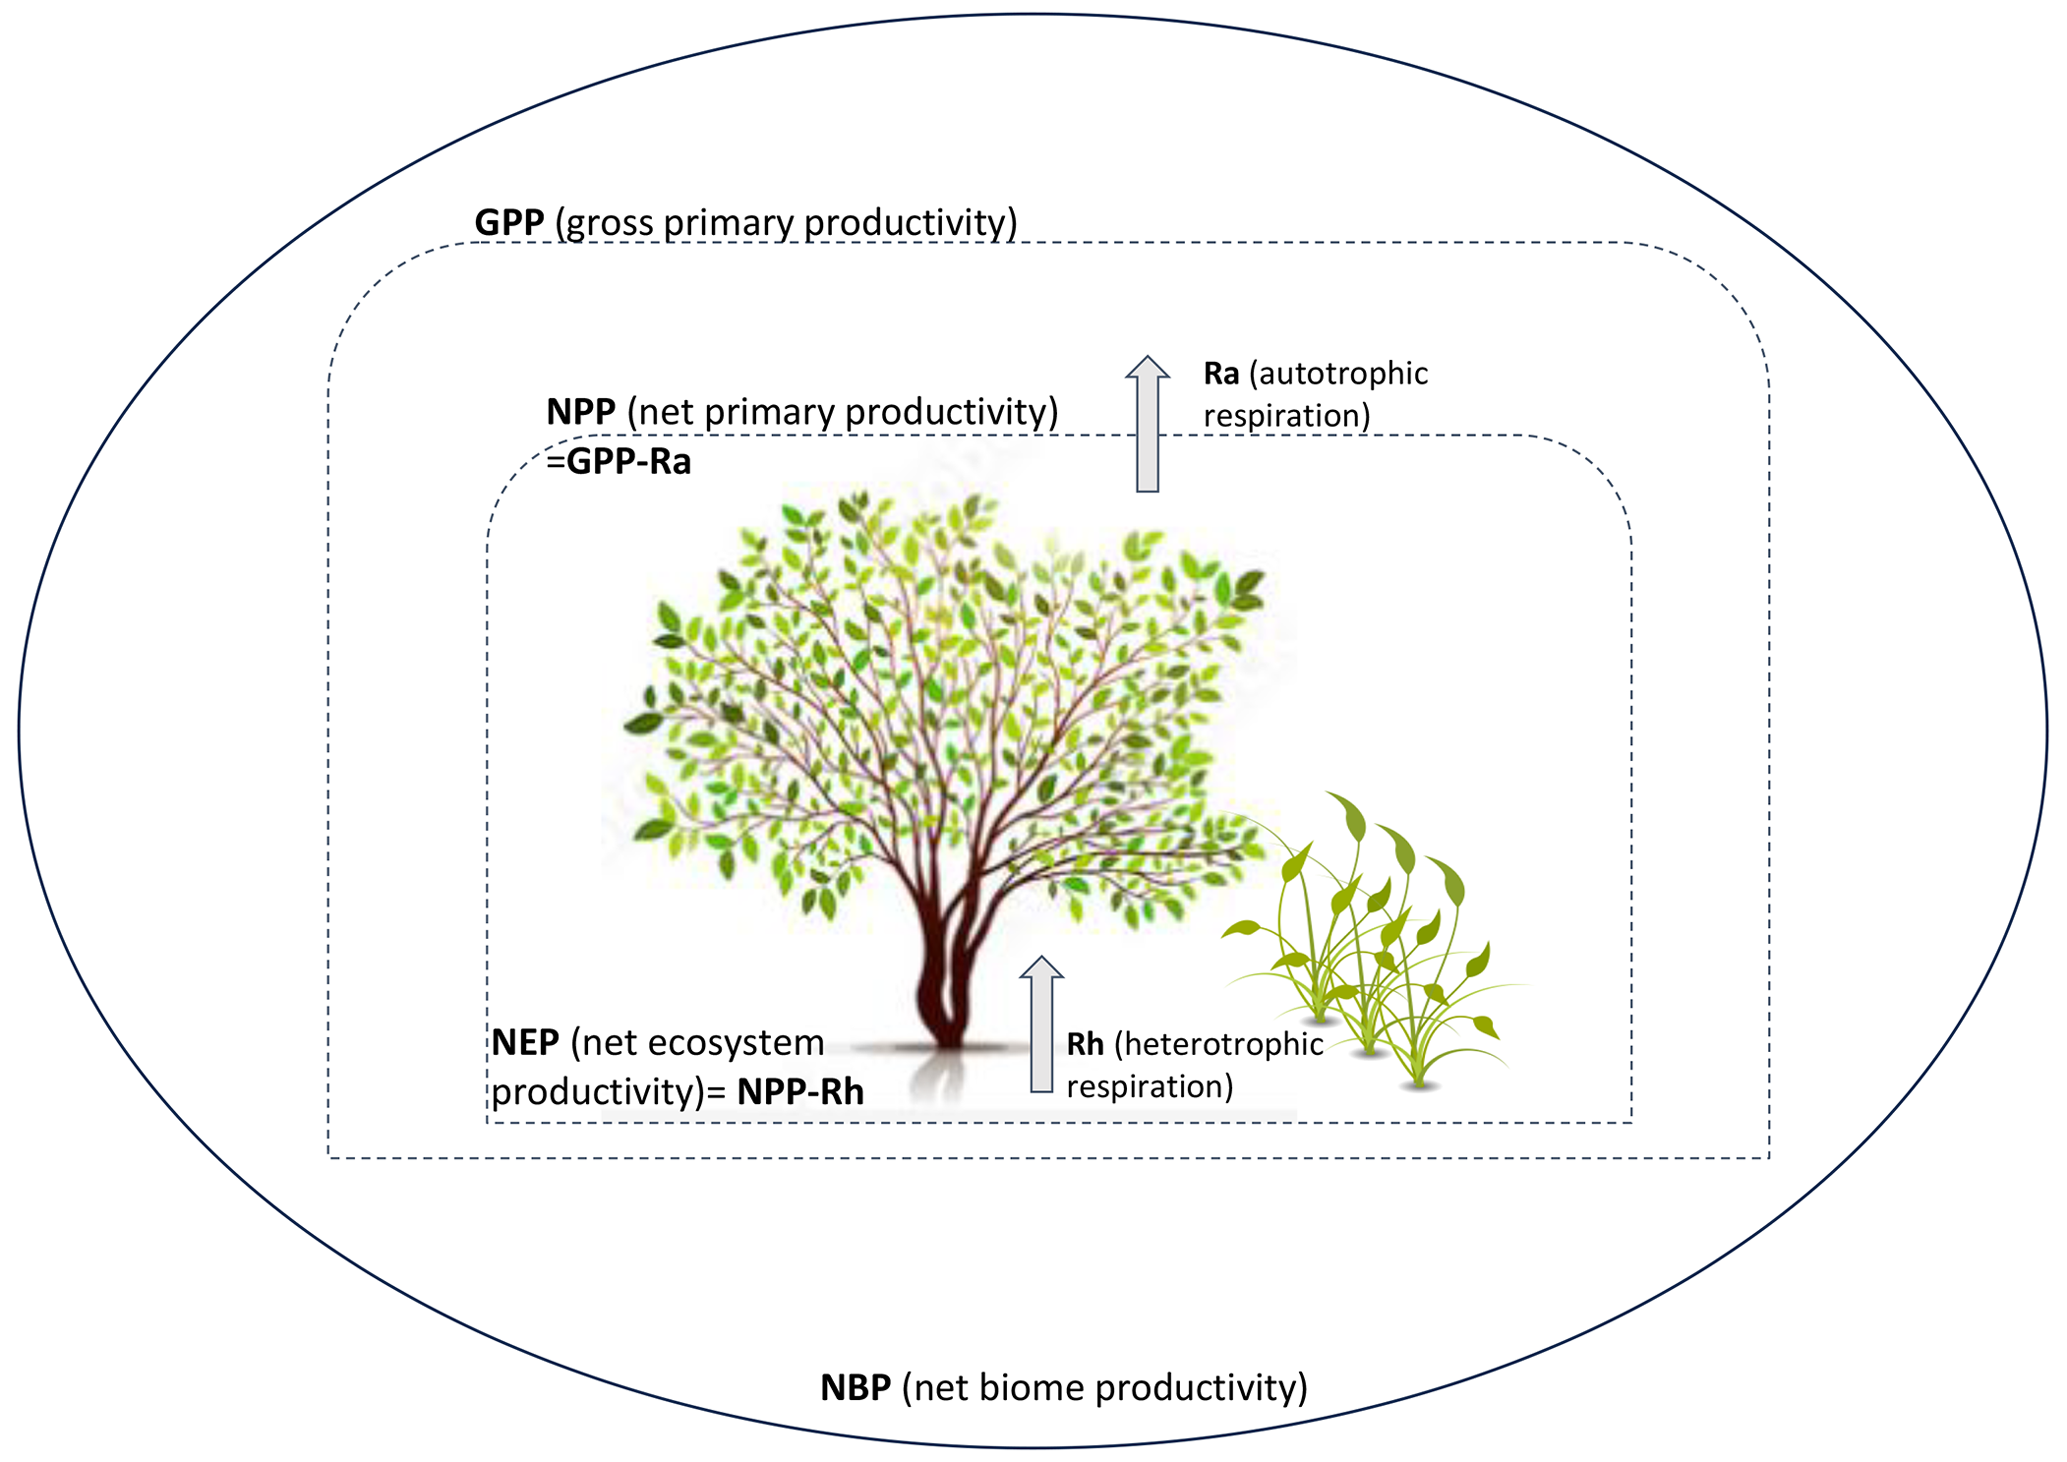
Figure 1Distinction and interplay between GPP, NPP, NEP, and NBP with autotrophic (plants) and heterotrophic respiration. Inspired by Mancini et al. (2016).
1.2 Measuring productivity with optical Earth observation data
The presence of strong absorption features in optical wavelengths, which relate to biochemical properties such as pigment and water content, has led to a large body of research using optical sensors to monitor vegetation productivity, mitigating the need for direct measurements (e.g. Boisvenue et al., 2016; Brinkmann et al., 2011; Cai et al., 2021; Dusseux et al., 2022; Erasmi et al., 2021; Hill and Donald, 2003). Given the employment of optical sensors routinely recording data at different scales, generated data streams have gradually become a well-established source of information in a wide array of vegetation monitoring applications, such as assessing climate change impact and carbon modelling (e.g. Campbell et al., 2022; Wocher et al., 2022), drought monitoring (e.g. Atzberger et al., 2013), or biodiversity assessment (e.g. Lausch et al., 2020).
Traditionally, spectral vegetation indices (VIs) have been used to derive plant productivity metrics (e.g. Erasmi et al., 2021; Fiore et al., 2020). Advanced studies focused on dynamically integrating vegetation traits within more complex data-driven and process-based models to estimate GPP (e.g. Ardö, 2015; Pei et al., 2022). For instance, light use efficiency (LUE) schemes (Monteith, 1972) can model GPP as a function of the amount of incoming photosynthetically active radiation (PAR) and the fraction of absorbed PAR (fAPAR) along with an LUE term (e.g. Zhao et al., 2005; Wang et al., 2017); see also the extensive review by Pei et al. (2022) and seminal papers by Moulin et al. (1998) and Delécolle et al. (1992). VIs that are sensitive to fAPAR and related vegetation traits (e.g. chlorophyll content, leaf area index or LAI) have been integrated into LUE-based approaches to represent physiological constraints on GPP (e.g. Gitelson et al., 2003; Cheng et al., 2014b; Xie et al., 2019). Data-driven remote sensing (RS)-based approaches may include the establishment of statistical relationships through empirical approaches or, more recently, with machine learning (ML) algorithms (see review by Liao et al., 2023). Over the last decade, solar-induced fluorescence (SIF) from space measurements has become increasingly popular, giving a more direct measure of photosynthetic activity and thus serving as perhaps the most straightforward remotely sensed proxy for GPP (e.g. Frankenberg et al., 2011; Guanter et al., 2012).
In the most complex modelling approaches, GPP is inferred using process-based dynamic vegetation models (DVMs) (e.g. Krinner et al., 2005; Sitch et al., 2003; Liu et al., 2014). DVMs can be both diagnostic and prognostic tools, able to simulate responses to climatic change including prognoses of carbon budgets (e.g. Rayner et al., 2005; Ardö, 2015). Ardö (2015) suggested that the integration of the realistic processes simulated by DVMs with high-resolution RS observations (i.e. in the form of VIs and traits) may support more accurate productivity metrics estimation. These approaches are discussed in more detail in Sect. 3.
Overall, the development of methodologies is further accelerated by a vast increase in the long-term vision of EO data, the availability of historical data, and enhanced facilities through numerous data repositories. Subsequently, data analytics and data-driven ML methods have helped the spread and penetration of these (big) data into data-based services worldwide (Liu, 2015; Gorelick et al., 2017).
Over the last 2 decades, the optical EO domain has seen an increasing number of space missions with various sensors aboard, complemented by airborne campaigns and in situ measurements from widespread ground-based networks. This increase in the abundance of EO data has contributed to the establishment of consistent global databases with quality-checked optical data, which can be used to estimate vegetation productivity metrics, such as GPP, NPP, AGB, yield, among others (see Sect. 1.1) at almost any spatial and temporal scales (Kuenzer et al., 2015). The relevant sensor platforms serving to collect observations for deriving vegetation productivity information are graphically illustrated in Fig. 2 and described in the following sections.
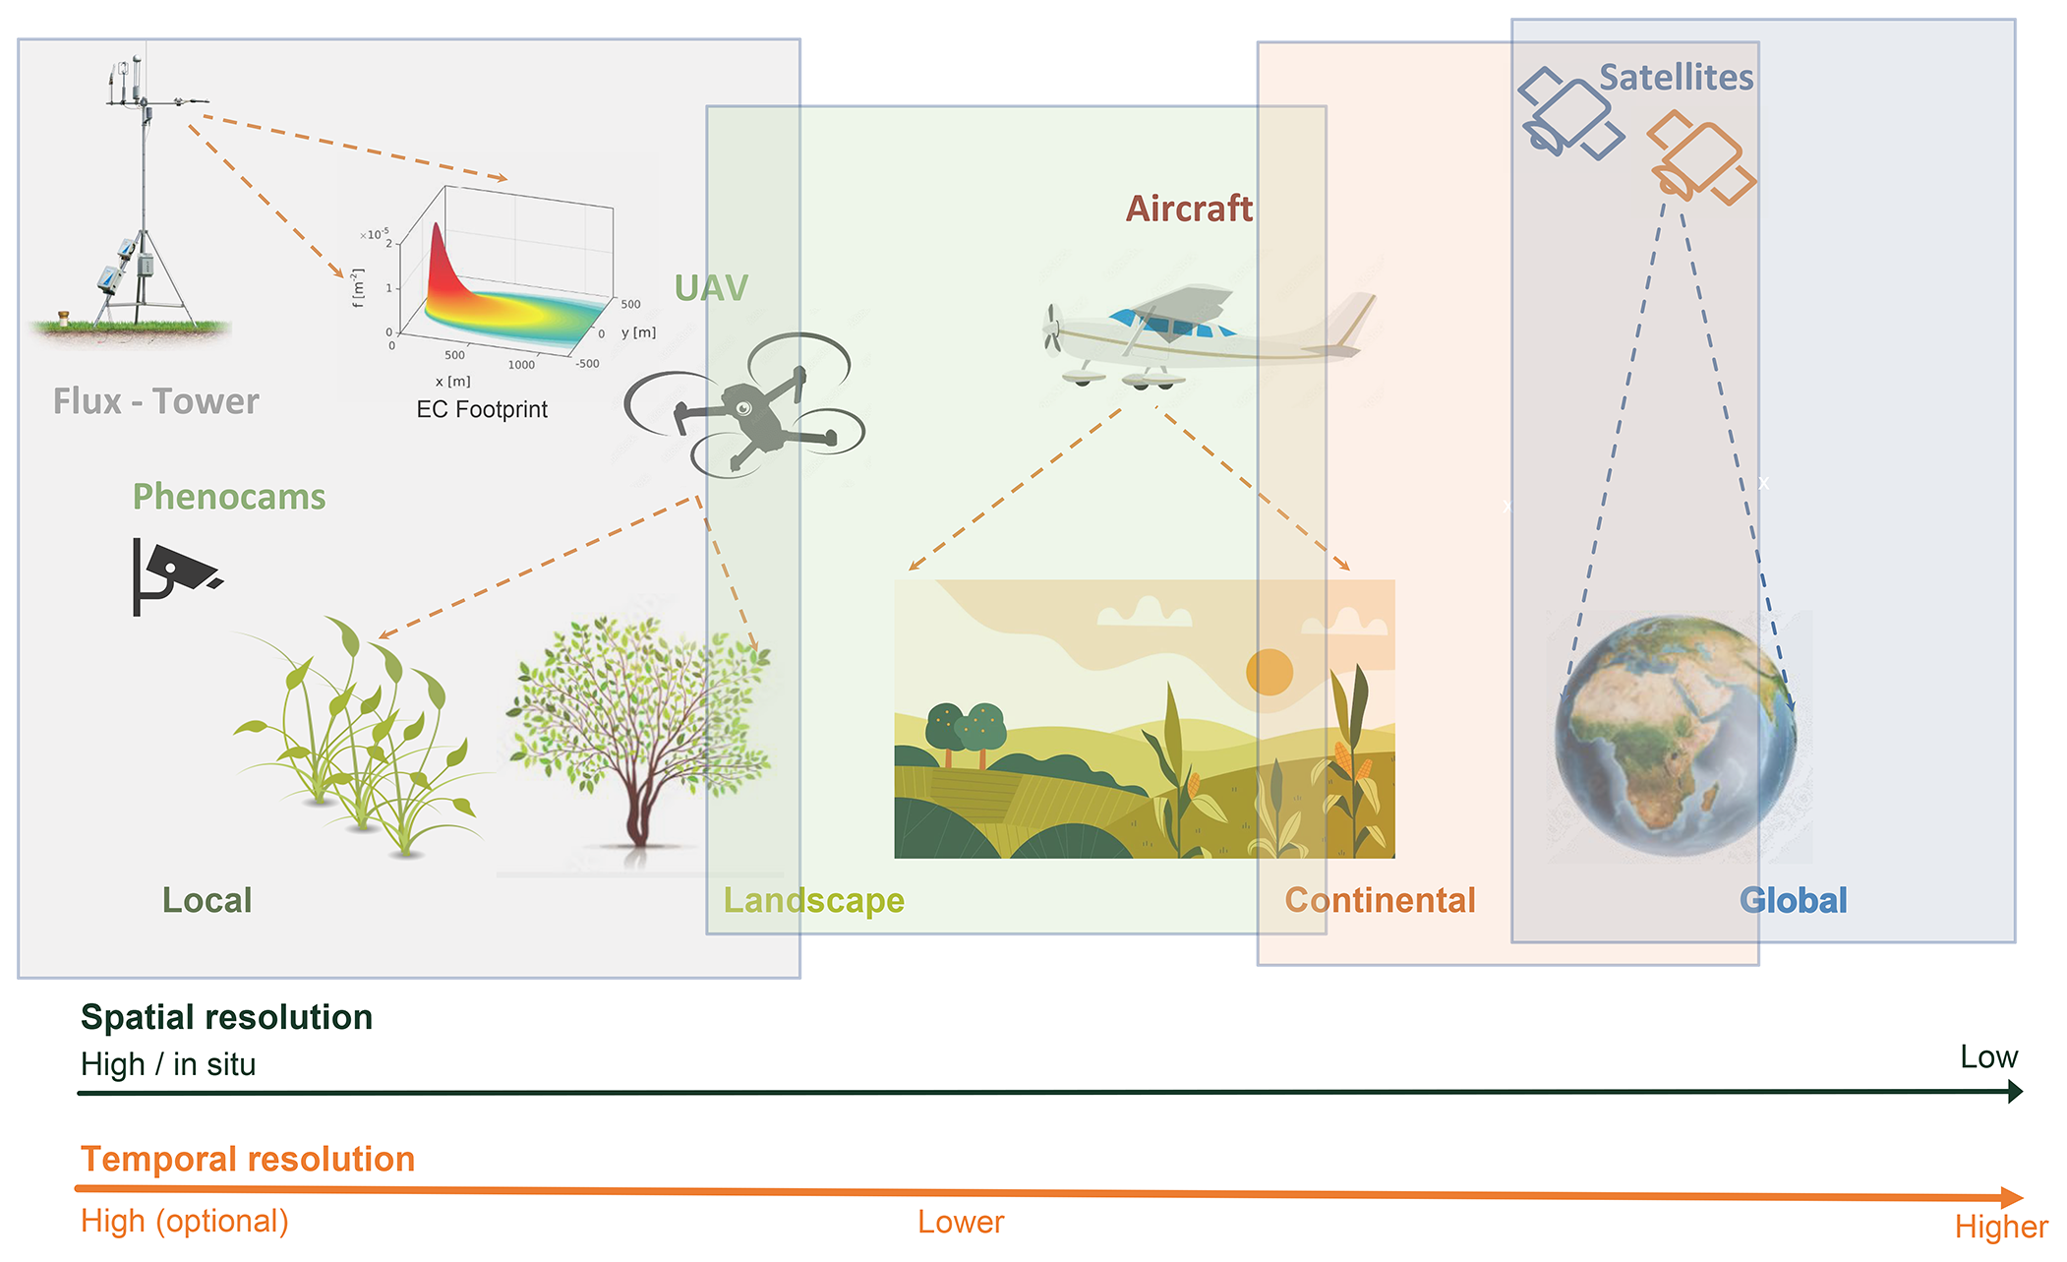
Figure 2Overview of near and RS platforms used for vegetation productivity related TS analysis, i.e. flux towers with an exemplary footprint, phenocams, UAVs, aircraft, and satellites. The platforms are arranged in order from left to right, starting with the highest spatial resolution and progressively decreasing (i.e. from high to low), although EC footprint sizes may vary. In terms of temporal resolution, the leftmost platforms, i.e. phenocams, typically offer higher optional temporal resolutions. Moving towards the right, the temporal resolution decreases (e.g. with aircraft platforms), and it then increases again as we transition towards EO satellite platforms. Figure elements are our own creations, except for the flux tower is from https://www.licor.com/env/support/Eddy-Covariance/videos/ec-method-02.html, last access: 13 January 2024 and EC footprint (Kljun et al., 2015).
2.1 Time series from EO satellites
In recent years, the availability of free satellite data has dramatically increased, amounting to petabytes of data. This expansion is due to the decreasing costs of data acquisition and the constant reduction in required computational resources and storage infrastructure. The review by Ustin and Middleton (2021) provides a detailed description of this trend. The availability of such data reinforces the usefulness of satellite data streams for capturing vegetation dynamics at various spatial scales, from monitoring local ecological habitats to conducting global studies (Cavender-Bares et al., 2020). Figure 3 summarizes the available optical (main) sensors starting from the 1970s with their spatial resolution and revisit time.
Low-elevation orbit (LEO) satellites have onboard sensors scanning at moderate (i.e. hectometric to kilometric) spatial resolutions, such as the Advanced Very High-Resolution Radiometer (AVHRR), Moderate Resolution Imaging Spectroradiometer (MODIS), Visible Infrared Imaging Radiometer Suite (VIIRS), PROBA-V (Project for On-Board Autonomy – Vegetation), and Ocean and Land Colour Instrument (OLCI) onboard Sentinel-3. They provide high-frequency and long-term TS and thus support a deep investigation of the land surface phenology and trends along with a thorough monitoring of vegetation productivity of the entire Earth (see reviews by Zeng et al., 2020; Pipia et al., 2022). On the other hand, geostationary Earth observation (GEO) satellites offer an opportunity to capture rapid changes in vegetation dynamics thanks to their high revisit frequency, spanning over a few minutes. For instance, mapping vegetation on an hourly basis by means of GEO satellites was explored by Fensholt et al. (2006), using the SEVIRI instrument onboard Meteosat Second Generation (MSG). Another mission of interest is NASA's Earth Polychromatic Imaging Camera (EPIC) onboard NOAA's Deep Space Climate Observatory (DSCOVR) (Yang et al., 2017). The EPIC team's primary responsibility is to develop and validate algorithms that produce a series of products, including the vegetation green LAI (GLAI) and its sunlit portion at a spatial resolution of 10 km. GLAI and its sunlit portion are critical state parameters in many ecosystem productivity models (e.g. Bonan et al., 2003; Bi et al., 2022).
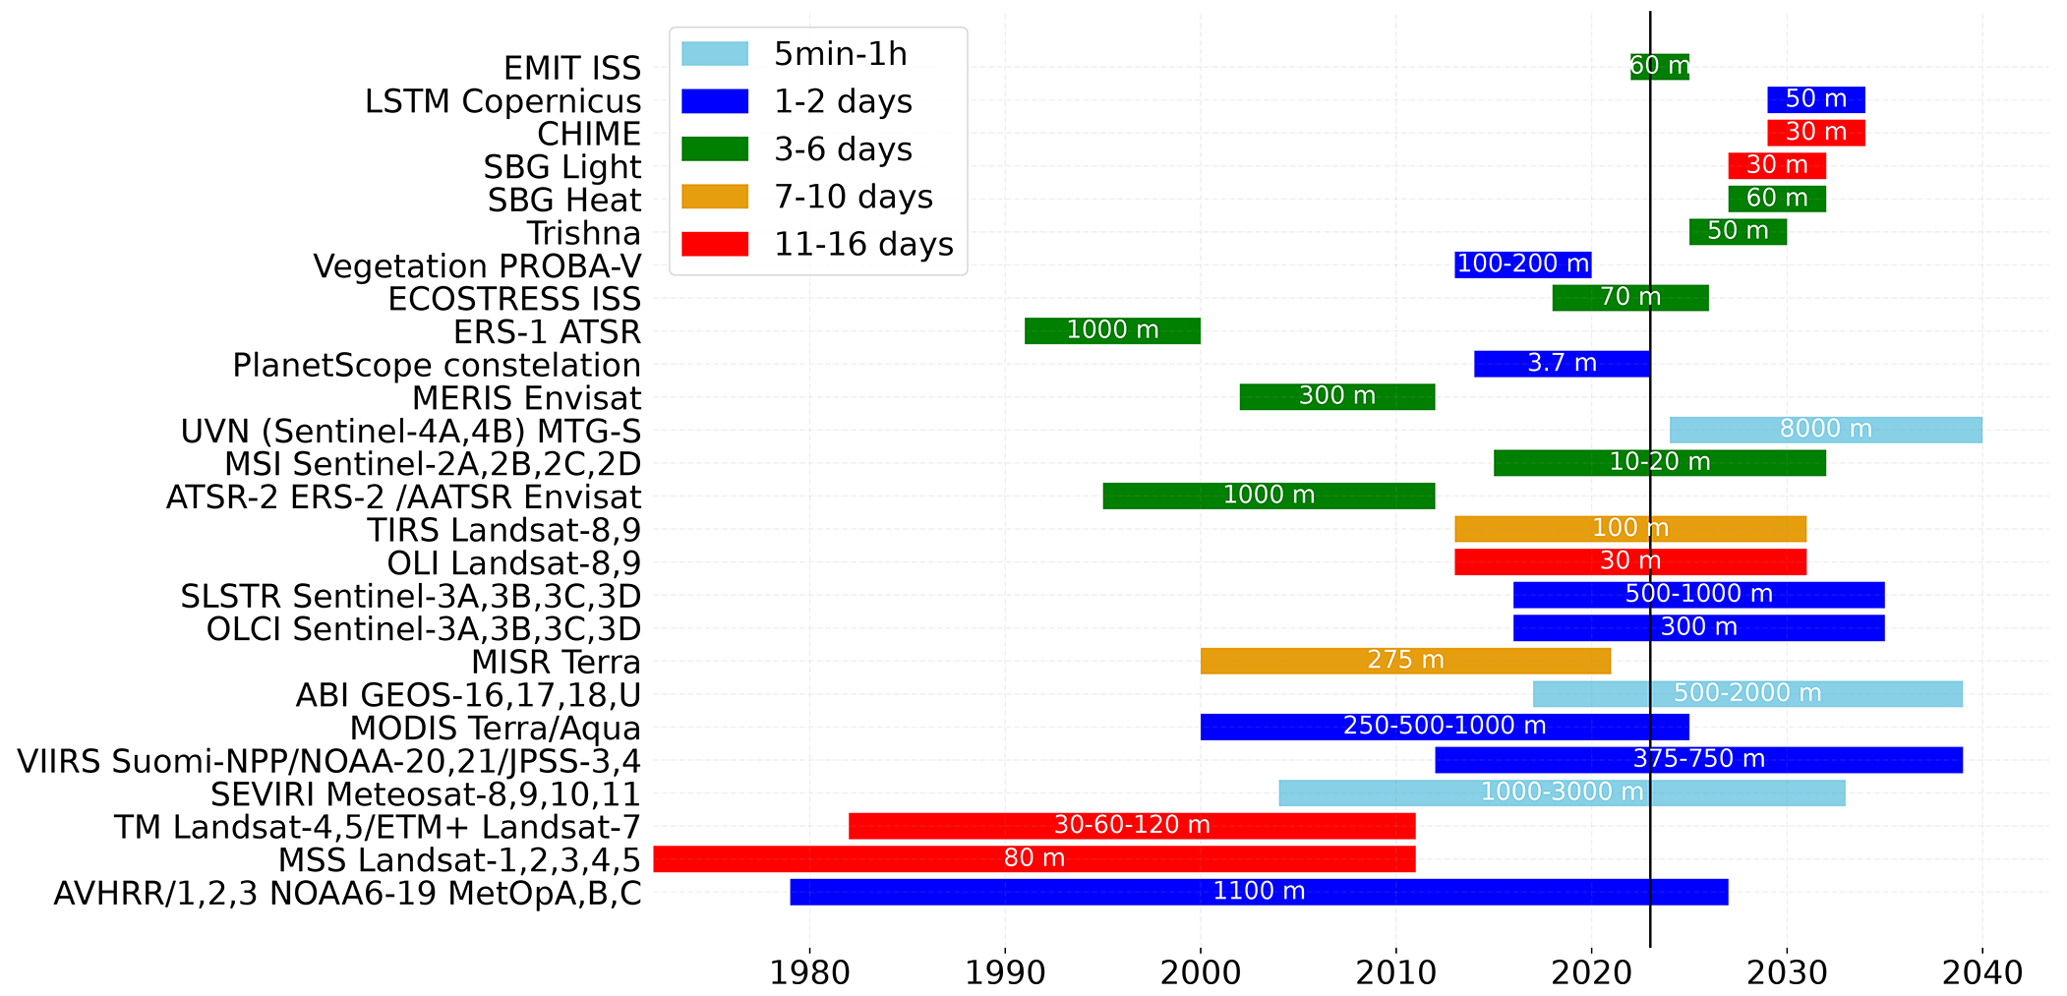
Figure 3Optical EO sensors providing TS data starting from the 1970s. Different colours indicate the revisit time, and the spatial resolution for each sensor is given within the corresponding bars.
Launched in 2018, the ECOSTRESS mission onboard the International Space Station (ISS) delivers nominally daily land surface temperature (LST) products in taking advantage of the fast orbiting ISS (note that the real revisit period for a given location is variable and depends on the instrument's orbital cycle on board the ISS). The spatial resolution of the products is 70 m except for two products of 30 m, due to the low altitude (Li et al., 2021b). In addition to the opening of the Landsat archives in 2008, further momentum was gained through the European Sentinel missions (Berger et al., 2012). From 2015 onward, Sentinel-2 (S2) optical imagery has been offering unprecedented perspectives on the temporal variability of plant productivity of different ecosystems, e.g. grasslands (Dusseux et al., 2022) or forests (Lin et al., 2019) and its divergence over fine spatial scales. Compared to earlier land satellite missions, such as MODIS or Landsat, S2 provides improvements in revisit time (5 d at the Equator), spatial resolution (10–20 m) and spectral configuration (more and narrower vegetation-related bands) (Drusch et al., 2012). A 5 d revisit time may still pose limitations in acquiring a satisfactory number of cloud-free scenes required to construct a comprehensive composite product for productivity modelling in a dynamic ecosystem. This constraint becomes particularly crucial during transitional phases such as bud-burst and senescence, as well as (a)biotic stress events or following rainfall in water-limited ecosystems like drylands. It is worth mentioning that the near-polar orbit of S2 allows for a higher number of acquisitions when approaching the poles. For instance, over the high Arctic archipelago of Svalbard, S2 images can be obtained twice a day, allowing for regional-scale mapping of plant productivity via LSP metrics (Karlsen et al., 2021). For continental Europe, continuous phenological mapping using S2 is today operational in the Copernicus pan-European High-Resolution Vegetation Phenology and Productivity product suite (HR-VPP) project (Tian et al., 2021). The exploitation of Sentinel-3 OLCI data even ensures a daily global coverage although at a moderate spatial resolution (300 m), but with a higher number of bands, allowing the derivation of essential vegetation traits for productivity monitoring studies (e.g. Yang et al., 2021b; Reyes-Muñoz et al., 2022).
Until recently, a fine temporal revisit time was at the expense of fine spatial resolution. However, a new generation of satellite constellations is breaking these formerly restrictive inter-dependencies (see Fig. 3) with, for instance, the PlanetScope satellites that offer multispectral images at 3 m spatial resolution in daily revisit intervals (Roy et al., 2021).
2.2 Time series from piloted aircraft and unoccupied aerial vehicles
Aircraft constitute flexible and adaptable platforms to explore new protocols of measurements, support applied studies (e.g. Cheng et al., 2014a; Atzberger et al., 2015), and therefore provide data for the derivation of productivity metrics. However, in contrast to orbital platforms, the regular acquisition of TS using an aircraft is a logistical and financial burden. This may explain why we could identify only a few studies that employed piloted aircraft to acquire optical TS for the estimation of vegetation productivity metrics, such as Damm et al. (2015) focusing on SIF. In this study, the authors conducted a thorough evaluation of the correlation between far-red SIF measured at 760 nm and GPP across three ecosystems, namely perennial grassland, cropland, and mixed temperate forest, using multi-temporal Airborne Prism EXperiment (APEX) acquisitions. The authors concluded that RS of SIF more consistently correlated to GPP than conventional greenness-based indices.
To capture time trends on a smaller patch scale, unoccupied aerial vehicles (UAV) have emerged as a more efficient and cheaper option than aircraft. Theoretically, UAVs meet most requirements for TS acquisitions regarding covering high spatial, spectral, and temporal resolutions (Berni et al., 2009; Aasen et al., 2018). UAVs are flexible and in contrast to satellite systems may be deployed whenever weather conditions are favourable for a desired measurement. Also, UAVs offer the necessary flexibility to sample diurnal cycles, which are relevant to capturing trends in productivity. To date, a range of multi-spectral and a few science-grade hyperspectral sensors have become available on the commercial market (Aasen et al., 2018), allowing for even faster system integration. In terms of TS analysis for productivity, so far UAV measurements have been mainly employed to fill gaps in satellite observations caused by cloudiness or sparse data (Dash et al., 2018; Alvarez-Vanhard et al., 2021). A recent phenotyping UAV study, however, collected UAV data from a soybean field trial at unprecedented temporal resolution (Borra-Serrano et al., 2020), which allowed for fitting growth curves with high accuracy (> 90 %) to derive relevant traits but also seed yield.
2.3 Multi-sensor and multi-scale synergies for time series
As data from different platforms and sensor modalities provide complementary information in terms of spatial, spectral, and temporal domains, the fusion of RS observations is increasingly coming into focus. For example, in the review study by Berger et al. (2022), the synergistic usage of multiple optical spectral domains was described to detect the stress of crops. Since productivity is affected by crop stress, improved stress detection and monitoring would also help in productivity studies. While biotic and abiotic stressors can only be disentangled through synergistic multi-sensor usage, in productivity studies this synergy may be less relevant. Instead, multi-scale approaches, for instance, by combining spectral information from aircraft, UAVs, and EO satellites (as described above) are more essential. In this way, advantages of at least two platform types can be explored, such as more frequent availability or higher spatial resolution data (e.g. Gevaert et al., 2015; Sagan et al., 2019; Alvarez-Vanhard et al., 2021). By providing a higher number of observations, multi-sensor fusion improves the spatiotemporal continuity through gap-filling, leading to higher consistency and accuracy of current satellite products related to vegetation productivity (e.g. Claverie et al., 2018; Manivasagam et al., 2019; Sadeh et al., 2021). Although not explicitly treated in this review, the fusion of synthetic aperture radar (SAR) and optical TS data can additionally be beneficial for productivity monitoring in regions with frequent cloud coverage (e.g. Pipia et al., 2019; Mercier et al., 2020; Caballero et al., 2023).
This section introduces several methods for deriving productivity metrics from remotely sensed TS data, including trend analysis, land surface phenology, and process models. Each method has its own strengths and weaknesses, and the best approach to use will depend on the specific application. The final sub-chapter of this chapter will introduce a variety of toolboxes that can be used to process and analyse remotely sensed TS data and derive productivity metrics. By providing a comprehensive overview of the different methods and tools available, this paper aims to help researchers and practitioners select the best approach to deriving productivity metrics from remotely sensed TS data for their specific needs.
3.1 Time series sources and pre-processing
3.1.1 Vegetation indices
Spectral VIs are widely applied methods for monitoring trends and deriving plant productivity metrics (e.g. Gutman, 1999; Huete et al., 2002; Atzberger and Eilers, 2011a; Rasmussen et al., 2014; Kang et al., 2018; Zeng et al., 2020; Shammi and Meng, 2021). Certainly, the most widely used VI in EO observation TS analysis is the normalized difference vegetation index (NDVI) (Rouse et al., 1974; Tucker, 1979). Its popularity comes from the fact that NDVI explores the contrasting behaviour of reflectance in the visible red and near-infrared (NIR) spectral domains, which strongly relate to vegetation biomass and, by extension, canopy-level plant photosynthetic activity. NDVI has the great benefit of being available to the research community through long observational records of more than 5 decades, specifically from AVHRR, the Landsat series, and MODIS (e.g. Huang et al., 2021; Li et al., 2021a). In addition to NDVI, other VIs have also been used to model temporal variations in productivity, including the enhanced vegetation index (EVI), which also accounts for canopy background and atmospheric influences (Huete et al., 2002). Multiple studies have explored TS of NDVI and EVI with direct linkages to vegetation productivity metrics, such as GPP (e.g. Shi et al., 2017; Shammi and Meng, 2021), or as part of GPP assimilation schemes (e.g. Zhang et al., 2015; Liu et al., 2021a). However, biomass-sensitive VIs often overestimate GPP at the start and end of the growing season, when leaf chlorophyll content decouples from LAI (Croft et al., 2014, 2015). Recently, novel VIs have been proposed for TS analysis, such as the Plant Phenology Index (PPI, Jin and Eklundh, 2014), which is used for the calculation of the HR-VPP product at 10 m resolution as part of the Copernicus Land Monitoring Service (Tian et al., 2021).
Despite their widespread usage, spectral VIs also suffer from several drawbacks. Reducing the spectral signals into simple indices intrinsically leads to remaining spectral information unexploited, which potentially could inform about plant physiology (e.g. Atzberger et al., 2011; Verrelst et al., 2019a). In general, these parametric methods neglect the effect of the background soil and other confounding factors (e.g. Darvishzadeh et al., 2008; Verrelst et al., 2008, 2010; Gao et al., 2022). In addition, they tend to be proxies for a small set of the physiological properties of vegetation only, leaving their empirical biophysical and biochemical meaning often ambiguous (e.g. Myneni et al., 1995; Morcillo-Pallarés et al., 2019).
3.1.2 Quantitative traits
A more explicit cause–effect alternative to obtaining TS of VIs can be derived from the radiative transfer theory. Radiative transfer models (RTMs) offer the possibility of deriving biochemical and biophysical traits at leaf (e.g. Jacquemoud et al., 1996; Ceccato et al., 2001; Féret et al., 2017) and canopy levels (e.g. Myneni et al., 1997; Rautiainen, 2005; Richter et al., 2009; Darvishzadeh et al., 2011) from optical remotely sensed data. RTMs describe the relationship between biochemical and biophysical traits and plant optical properties based on physical laws. Various inversion strategies have been developed based on lookup tables, numerical optimization methods, and ML methods, i.e. so-called hybrid approaches. An overview of RTM-based retrieval methods is provided by the reviews of Kimes et al. (1998), Baret and Buis (2008), Verrelst et al. (2015a), and Verrelst et al. (2019a). Building upon these RTM inversion strategies, a few traits are operationally retrieved from routinely acquired EO data of land missions such as MODIS or S2. The most widely produced vegetation products are LAI and fAPAR but also fractional vegetation cover and to a lesser extent canopy chlorophyll content (e.g. Myneni et al., 2015; Yan et al., 2016; Fang et al., 2019; Xu et al., 2022). To obtain productivity metrics, TS data streams of the traits have been integrated into various GPP assimilation schemes (e.g. Jung et al., 2007; Xie et al., 2019; Chen et al., 2022).
Apart from those routinely generated vegetation products, a wide range of experimental studies present alternative retrieval methods or methods focused on the retrieval of other biochemical traits, e.g. leaf and canopy water content and leaf chlorophyll content (e.g. Croft et al., 2020; Estevez et al., 2021; Caballero et al., 2023). Typically, these studies have been limited to the processing of single-date observations or at best multi-temporal acquisitions for a restricted time window. Given those experimental retrievals, efforts to provide TS of a range of biochemical and biophysical traits were conducted by a few studies (e.g. Verger et al., 2016; Salinero-Delgado and Verrelst, 2021). An important note on the use of RTMs to derive quantitative traits concerns their sensitivity to phenological developmental stages of vegetation: Schiefer et al. (2021) demonstrated that trait retrieval accuracy has a strong dependency on phenology. A possible solution would be to use expert knowledge and in situ data to enable a more precise parameterization of the RTMs depending on the phenological (macro)phase. At the same time, fast processing speeds are required to retrieve traits from TS data streams. This points towards hybrid retrieval schemes including active learning, i.e. relying on tuning RTM simulations against in situ measured traits and training of ML algorithms (e.g. Verrelst et al., 2021; Berger et al., 2021).
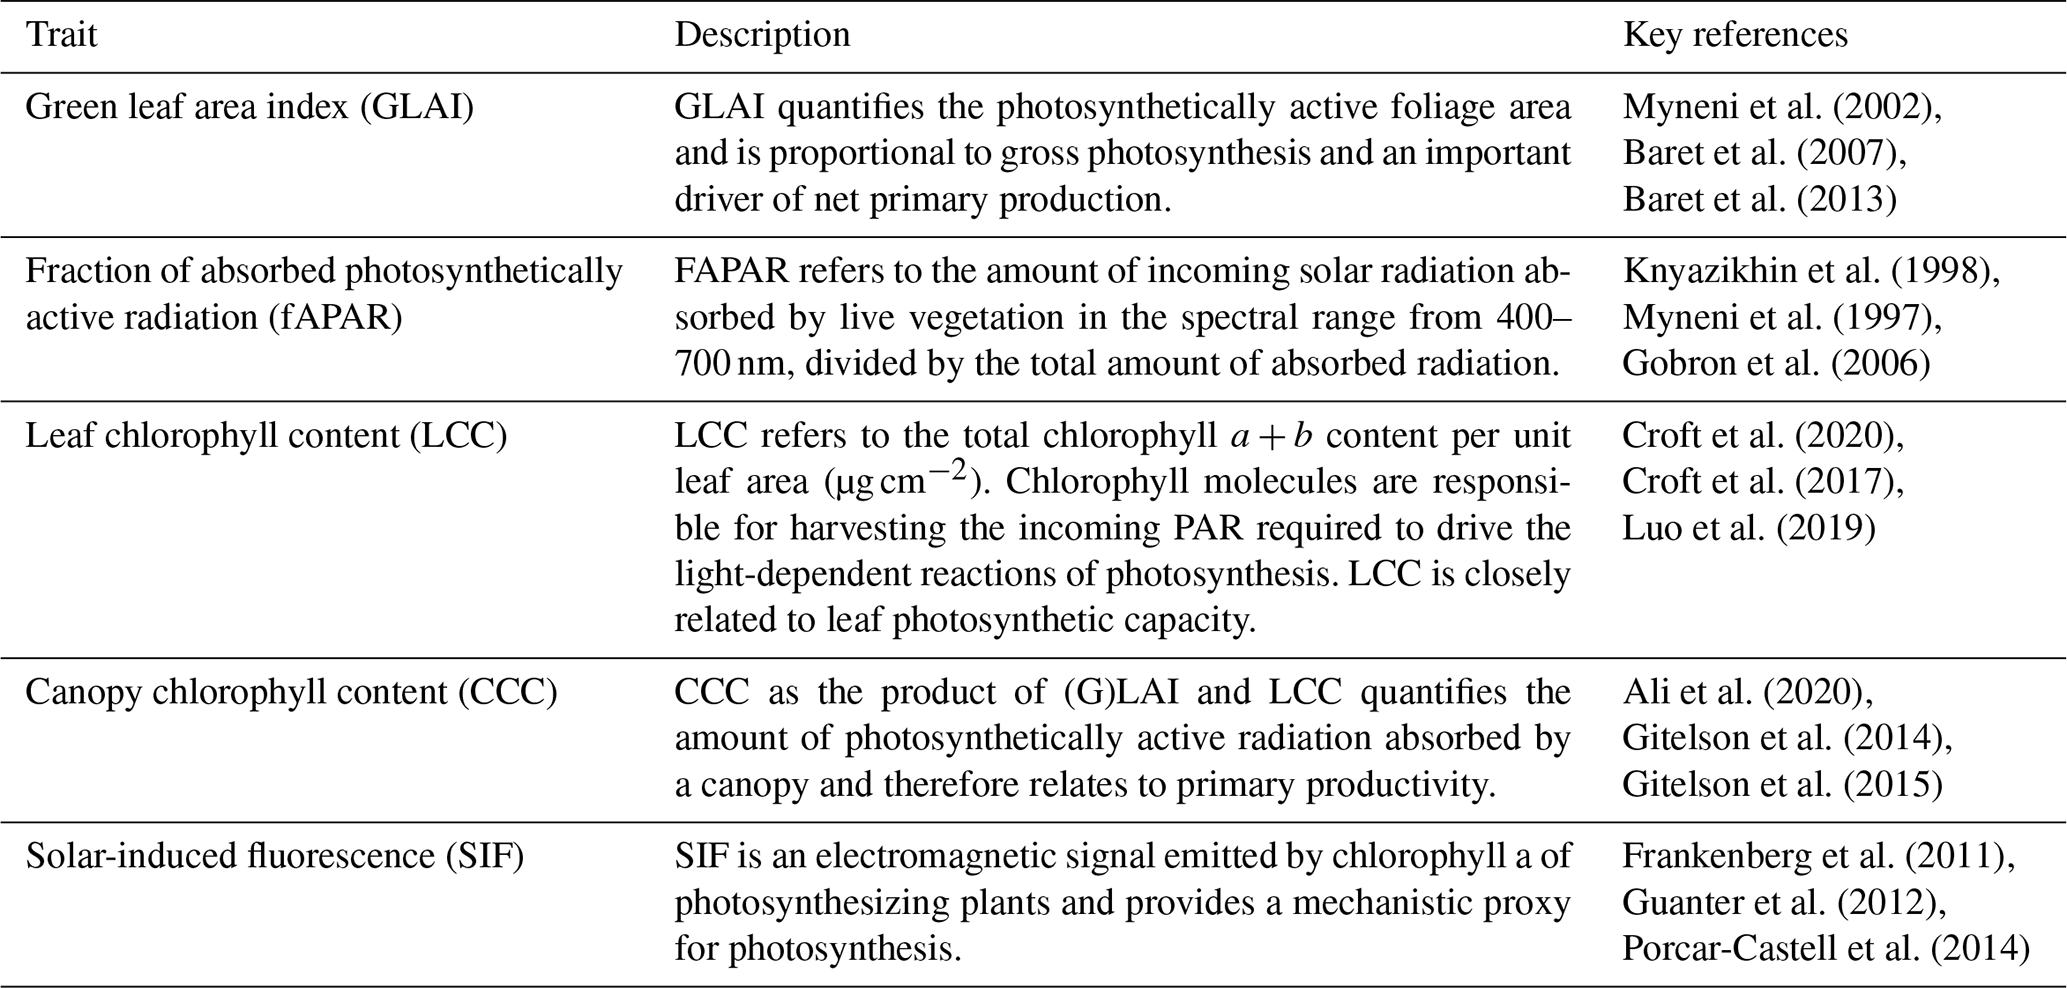
An overview of widely used quantitative traits in TS processing available from RTM inversion and their potential relationship to vegetation productivity is given in Table 1. These traits can be further used within defined methodologies to derive productivity metrics given in Sect. 1.1, such as GPP. The capability of advanced RTMs such as SCOPE (Soil Canopy Observation, Photochemistry and Energy fluxes, (Van der Tol et al., 2009; Yang et al., 2021a)) to model SIF is promising. SIF is a strong proxy for actual photosynthetic activity in canopies (e.g. Porcar-Castell et al., 2014; Verrelst et al., 2015b, 2016), and over the years various SCOPE-based SIF retrieval schemes have been proposed to derive GPP, usually by taking ecosystem-specific characteristics into account (e.g. Damm et al., 2015; Norton et al., 2019; Pacheco-Labrador et al., 2019; Yang et al., 2022).
Myneni et al. (2002)Baret et al. (2007)Baret et al. (2013)Knyazikhin et al. (1998)Myneni et al. (1997)Gobron et al. (2006)Croft et al. (2020)Croft et al. (2017)Luo et al. (2019)Ali et al. (2020)Gitelson et al. (2014)Gitelson et al. (2015)Frankenberg et al. (2011)Guanter et al. (2012)Porcar-Castell et al. (2014)Table 1Overview of widely used biophysical variables inferable from RTM inversion to assess vegetation productivity information.
3.1.3 Gap-filling and smoothing methods
Continuous, complete, and unbiased TS data are often a key prerequisite to monitoring of vegetation productivity using optical EO sensors. Here, one of the biggest challenges is data gaps. In reality, the availability of continuous data is often hampered by (1) sub-optimum to inadequate weather conditions, such as clouds, snow, dust, and aerosols (e.g. Kandasamy et al., 2013), or (2) instrumentation errors and uncertainties (Graf et al., 2023), as well as calibration issues (e.g. Brinckmann et al., 2013). Cloud cover is the most stringent limitation of optical satellite data. The majority of the terrestrial Earth's surface is more or less regularly covered by clouds, and for some areas persistent cloud cover can last for weeks (e.g. Atkinson et al., 2012; Wilson and Jetz, 2016). In such cases, data sparsity leads to biased estimates, decreased statistical power, increased standard errors, and substantial uncertainty in findings (Dong and Peng, 2013). For instance, clouds can mask key stages of phenological events, leading to unreliable monitoring practices such as productivity predictions (e.g. Karlsen et al., 2018). Notably, the amount of data gaps and noise strongly depends on the season, topography, location, or environment (e.g. Beck et al., 2006; Vuolo et al., 2017).
The spatiotemporal gap-filling of missing TS data has therefore become a crucial step for monitoring the life cycle of vegetation and inter- and intra-annual variations in plant productivity (e.g. Beck et al., 2006; Schwartz, 2013; Kovács et al., 2023; Belda et al., 2020a; Amin et al., 2022). A high-quality signal can be assumed to represent the true seasonal trajectory of vegetation and should be carefully processed to retain the short-term character of data (e.g. using smoothing filters or splines). Signals with a high degree of noise need to be constrained by fitting to a predefined function to avoid unrealistic variations (e.g. asymmetric Gaussian or logistic functions). TS filters and splines can to some degree balance between retaining or smoothing short-term variations, and with these methods parameter settings can be defined that balance smoothness with fidelity to the data (Atzberger and Eilers, 2011b). Important considerations when applying smoothing to TS data are whether data should be fitted to the upper envelope to compensate for signal bias (Chen et al., 2004; Jönsson and Eklundh, 2004), how to treat data points labelled as sub-optimal quality (e.g. cloud shadow pixels), and how to handle long periods of missing data (Beck et al., 2007; Jönsson et al., 2018; Bolton et al., 2020). Gap-filling and smoothing methods can be categorized into (1) smoothing and interpolation methods, (2) data transformation methods, and (3) fitting methods (Kovács et al., 2023). An exhaustive overview of available methods is provided in recent reviews by Zeng et al. (2020) and Pipia et al. (2022), and it is therefore not repeated here.
3.2 Assessment of vegetation productivity using trend analysis and anomaly detection
Long TS data streams of VIs (Sect. 3.1.1) or quantitative traits (Sect. 3.1.2) are particularly well suited for trend analysis, a widely used method for monitoring plant productivity (Eastman et al., 2009). Such analysis includes aspects such as abrupt or gradual changes in trends, as well as timing, number, and direction of such changes (Verbesselt et al., 2010). An example of TS decomposition is shown in Fig. 4. Each of these components can be further analysed, for example, using separate trend models for annually derived attributes (Stellmes et al., 2013; Munawar and Udelhoven, 2020).
Regarding trend analysis, the study by Karkauskaite et al. (2017), for instance, explored data from MODIS (from 2000 to 2014) to evaluate the performance of PPI, NDVI, and EVI in analysing the trends of SOS in boreal regions of the Northern Hemisphere. The authors compared the VI trend results with in situ GPP-retrieved SOS from a network of flux tower observations. Although all three VIs produced similar trends in SOS, a pronounced land cover dependence was observed, with PPI-SOS outperforming the other two spectral indices in approximating vegetation productivity, i.e. GPP.
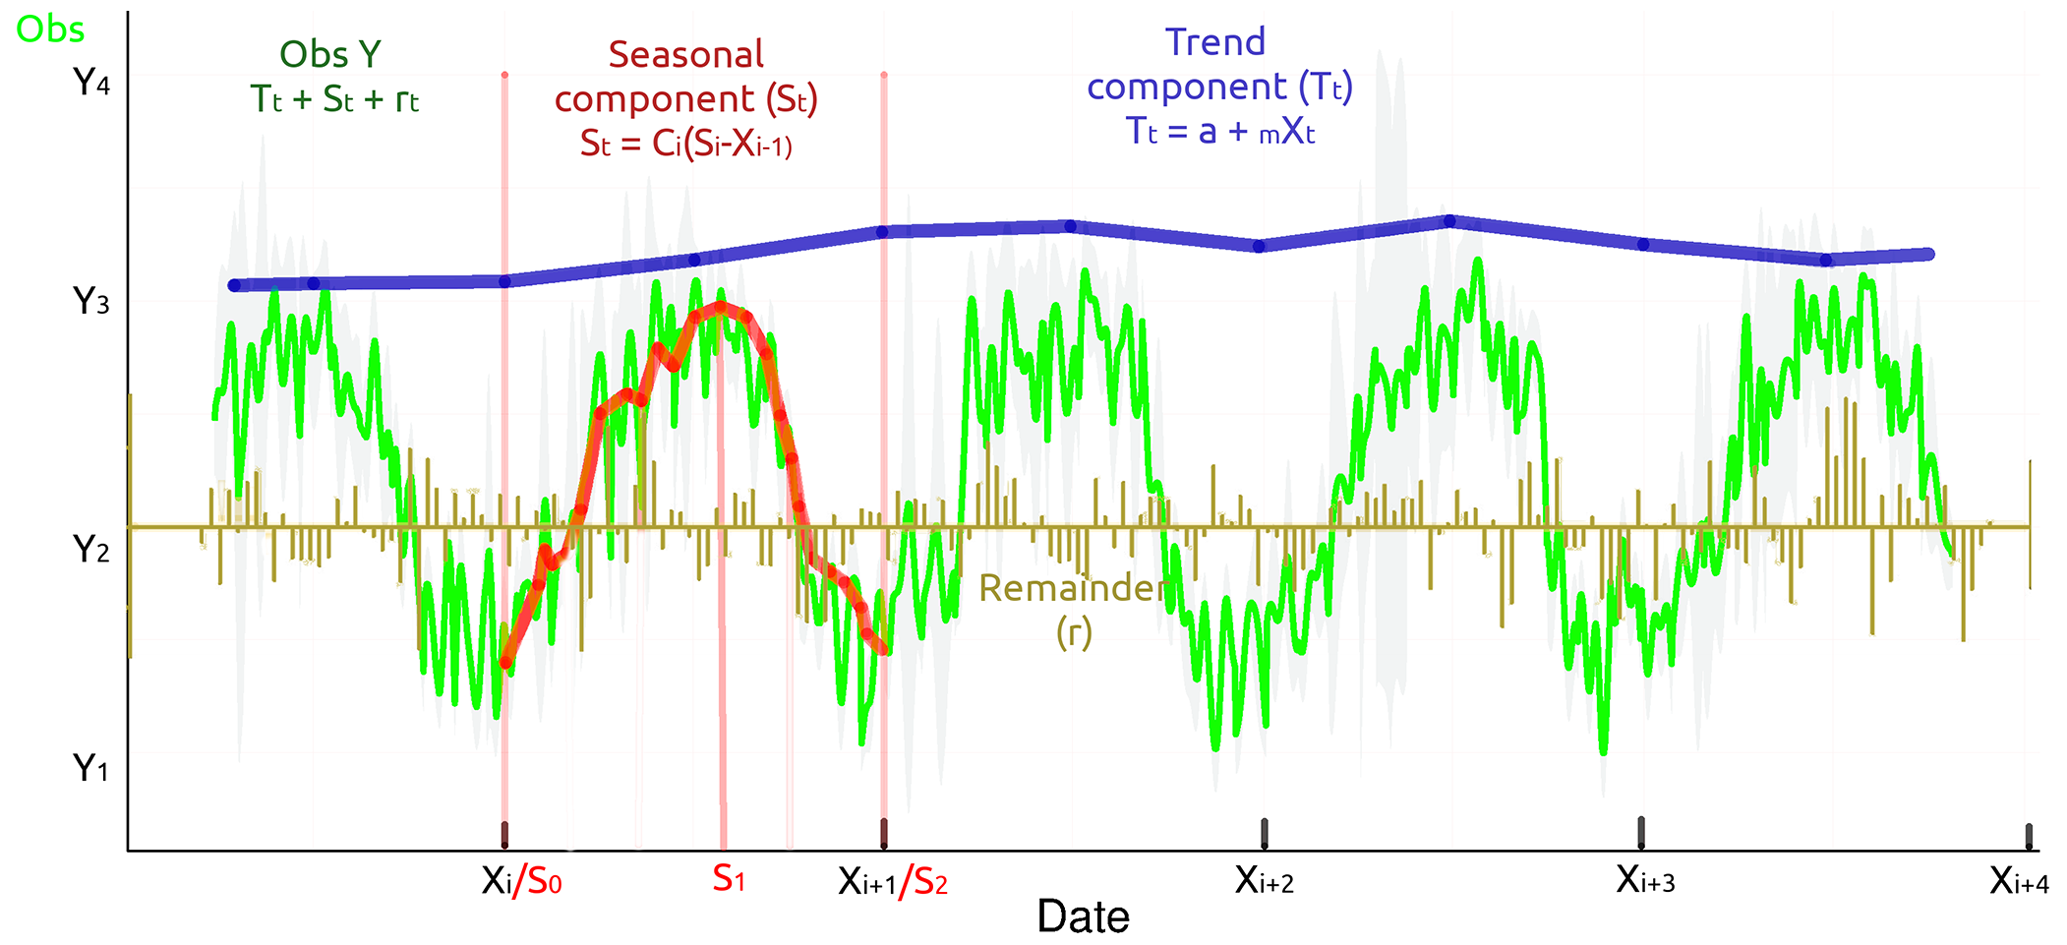
Figure 4Generic plot showing the different components for TS analysis. Point observations result from the coupling of a general trend, a seasonal component, and a remainder quantity. The decomposition allows for measuring the trend at specific points by disentangling seasonal effects.
In the context of anomaly detection, specific indices have been proposed: the Vegetation Condition Index (VCI) (Kogan, 1995) informs about overall vegetation conditions by referencing actual NDVI values with long-term statistics over the same period. The main application of VCI is related to drought detection (Klisch and Atzberger, 2016; Rembold et al., 2015a). Similarly, the Vegetation Productivity Index (VPI) (Smets et al., 2015) was proposed to detect anomalies in vegetation productivity. Importantly, these methods were developed for natural ecosystems such as boreal forests or sub-tropical savannahs where the vegetation type is assumed to not change from year to year. Thus, these indices are not appropriate for ecosystems with regular changes in species composition, e.g. agricultural croplands with crop rotation schedules. A deep-learning approach for forecasting VCI was presented by Lees et al. (2022), demonstrating the usefulness of detecting drought conditions in Kenya using this anomaly index.
In addition to decomposing and analysing trend patterns of a VI TS, an option is linking the VI to other environmental variables that influence vegetation productivity using distributed lag models (Udelhoven, 2011). However, relationships between climatic variables and responses in VI TS tend to be non-linear, spatially non-stationary, and sensitive to the scale of analysis. Simple regression model techniques such as ordinary least squares (OLS) fail to model vegetation productivity accurately. To overcome such shortcomings, geographically weighted regression (GWR) approaches were suggested (Georganos et al., 2017).
3.3 Assessment of vegetation productivity using land surface phenology
Land surface phenology describes the seasonal timing and duration of vegetative growth using TS of VIs (Sect. 3.1.1) or biophysical variables (Sect. 3.1.2) (De Beurs and Henebry, 2004). Typical LSP metrics are dates and values for the start of the season (SoS), end of the season (EoS), length of the growing season (LoS), the peak of the season (PoS), season amplitude, and steepness of the greening and browning periods (Reed et al., 1994; Beck et al., 2006). Depending on the vegetation type studied, varying names can be found in the literature, such as the onset of greenness and the start of senescence for deciduous forests (e.g. Duchemin and Courrier, 1999; Kang et al., 2003; Badeck et al., 2004). A diversity of mathematical methods have been proposed for extracting the metrics from smooth seasonal trajectories. Most are based on absolute or relative thresholds of the seasonal amplitude (e.g. Bolton et al., 2020; Jönsson and Eklundh, 2004), whereas others are purely mathematical parameters, such as inflexion points or derivatives of different order (e.g. Fisher et al., 2006; Elmore et al., 2012; Melaas et al., 2013). A comprehensive review of the definition and extraction of LSP metrics is provided by Zeng et al. (2020).
Commonly, LSP metrics are used to study the impact of environmental changes on ecosystems: shifts in LSP, e.g. the earlier timing of SoS, indicate climate change (Abbas et al., 2021). For instance, Wood et al. (2021) used 3 decades of AVHRR data over the U.S. Northwestern Plains to study the impact of climate change and agricultural management on phenology. They concluded that climate factors such as precipitation and temperature can have a significant impact on productivity, but other factors such as soil nutrients, disturbance, and management practices also play a role.
The concept of LSP also has its drawbacks. Apart from the influence of the smoothing technique and the method used to extract the LSP metrics, Helman (2018) stressed that changes in vegetation species composition rather than phenological transitions could produce a false-positive signal in LSP. Moreover, LSP metrics show high sensitivity to the frequency and temporal coverage of observations as well as cloud contamination, which can affect the estimation of productivity metrics (Younes et al., 2021).
3.4 Assessment of vegetation productivity using dynamic process models and data assimilation
A more advanced perspective is given by combining remotely sensed TS data with simulations of plant physiological processes and their temporal development. Simulated plant growth driven and/or constrained by TS data streams and environmental covariates can be used to study processes that are not directly quantifiable from the satellite data itself – such as the amount of AGB increase over time (Delécolle et al., 1992). Here, EO data offer the possibility of providing a dynamic, spatially continuous parameterization of model input variables (e.g. Bach and Mauser, 2003; Verhoef and Bach, 2003; Hank et al., 2015).
Process-based dynamic vegetation models can have different levels of complexity concerning their ability to simulate biophysical and biochemical processes in plants (e.g. Quillet et al., 2010; Ardö, 2015). Based solely on empirical data, canopy structure dynamics models (CSDMs) have been proposed to simulate a TS of canopy traits such as LAI as a function of temperature (growing degree days) (e.g. Baret et al., 2000; Koetz et al., 2005). Using the concept of LUE, Goudriaan and Monteith (1990) described vegetation dry matter accumulation as a function of leaf area expansion. By including further knowledge about physiological processes and plant morphology, more advanced DVMs can be created to simulate ecosystem productivity such as for boreal forests (e.g. Liu et al., 1997) or croplands (e.g. Delécolle et al., 1992; Launay and Guerif, 2005; Liu et al., 2016). For instance, The Breathing Earth System Simulator (BESS) model (Ryu et al., 2011; Jiang and Ryu, 2016) couples atmosphere and canopy processes, two-leaf photosynthesis, and energy balance to provide evapotranspiration and GPP.
Fischer et al. (1997) already distinguished three different strategies to combine remotely sensed TS of vegetation with process-based models, which can be seen as state-of-the-art, as delineated in Fig. 5: (1) model forcing, (2) model recalibration, and (3) coupled forward modelling. In the model forcing strategy (Fig. 5, 1), the remotely observed state variables (e.g. fAPAR, LAI) are forced (input) into the process model (e.g. BESS by Tagliabue et al., 2019). In the recalibration strategy (Fig. 5, 2), also known as “data assimilation”, remotely sensed state variables are used to readjust DVM parameters or inputs whenever an observation becomes available. While the first two strategies involve inverse modelling to obtain the remotely sensed state variables, the third approach relies entirely on forward modelling (Fig. 5, 3). It couples a DVM with an RTM to simulate vegetation optical properties, which are then compared to remotely sensed data. The main advantage of this strategy is the avoidance of inverse modelling, which is not only ill-posed but usually also computationally intensive. Shiklomanov et al. (2021), for instance, coupled three existing models, namely the Ecosystem Demography model version 2 (ED2, Medvigy et al., 2009), PROSPECT-5 (Féret et al., 2008), and a simple soil reflectance model to the EDR model. Their model predicts the full range of high-spectral-resolution surface reflectance, which is dependent on the current state of the ED2 model. Another relevant example is provided by Wang et al. (2023) with Climate Modeling Alliance (CliMA) Land, which is able to simulate data streams of productivity metrics such as GPP, transpiration, canopy reflectance, and fluorescence spectra that can be observed by satellites in a high temporal resolution. The authors demonstrated the potential of CliMA Land in tracking the spatial patterns of productivity metrics (GPP) compared to data-driven methods. Similarly, Poulter et al. (2023) recently coupled the LPJ-wsl global DVM and the canopy radiative transfer model PROSAIL. LPJ-PROSAIL can generate global, gridded TS of daily visible to shortwave infrared (VSWIR) spectra (400–2500 nm) taking into account temporal and spatial variability. Overall, these studies demonstrate that the model couplings (DVM and RTM) are valuable tools for monitoring the development of vegetation activity at the global scale, in strong relation to the carbon cycle and hydrology. With this, the method can provide the prerequisite of the Digital Twin concept allowing for model productivity with high fidelity for longer time periods, and it can eventually evaluate different future scenarios.
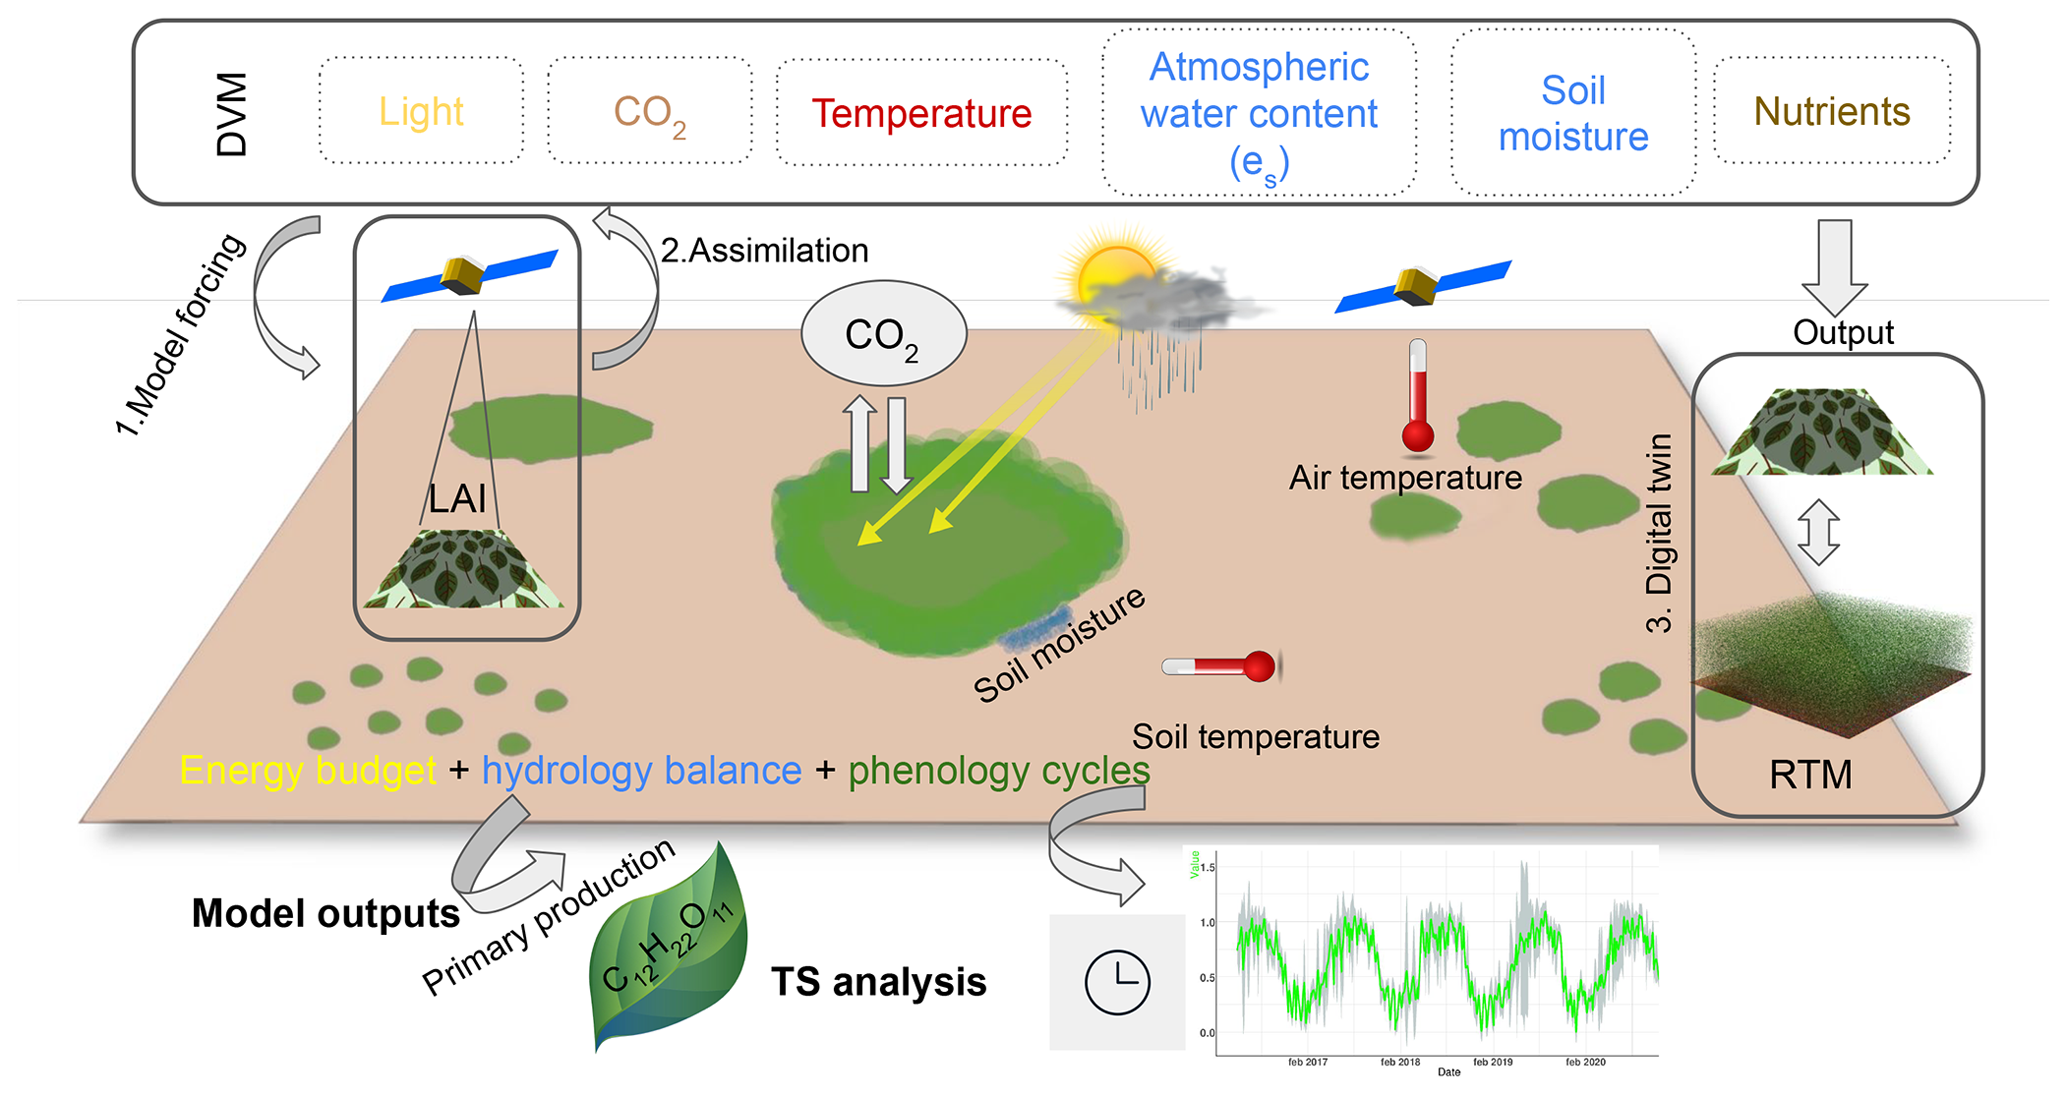
Figure 5Three strategies to combine remotely sensed TS with process-based DVMs: (1) model forcing, (2) data assimilation (including model recalibration and re-initialization), and (3) coupled forward modelling of DVMs and RTMs (Digital Twin).
3.5 Toolboxes for vegetation productivity studies
A variety of sophisticated software packages have been developed to facilitate the processing and analysis of large image TS and ultimately provide key information about vegetation dynamics and ultimately about productivity metrics. In most cases, these packages are openly available and share common purposes, although they differ in specific features and methodologies. Broadly, we can distinguish toolboxes for TS processing, TS analysis and change detection, traits retrieval, and process modelling (i.e. DVM). Table 2 lists the toolboxes according to this categorization, including functionalities and implementation. Note that we have compiled this list to the best of our knowledge; however, it is possible that it may not include all existing toolboxes.
Jönsson and Eklundh (2004)Belda et al. (2020a)Udelhoven (2010)Leopold et al. (2020)Verbesselt et al. (2010)Van Den Bergh et al. (2012)Eerens et al. (2014)Araya et al. (2018)van der Linden et al. (2015)Verrelst et al. (2012)Table 2Toolboxes recommended and used for converting remotely sensed TS into gap-filled VI and vegetation trait products and to derive LSP metrics and trends, which can all be ultimately used for estimating productivity metrics. Note that this list is not necessarily exhaustive but rather a selection of some of the most notable tools that we are aware of to the best of our knowledge.
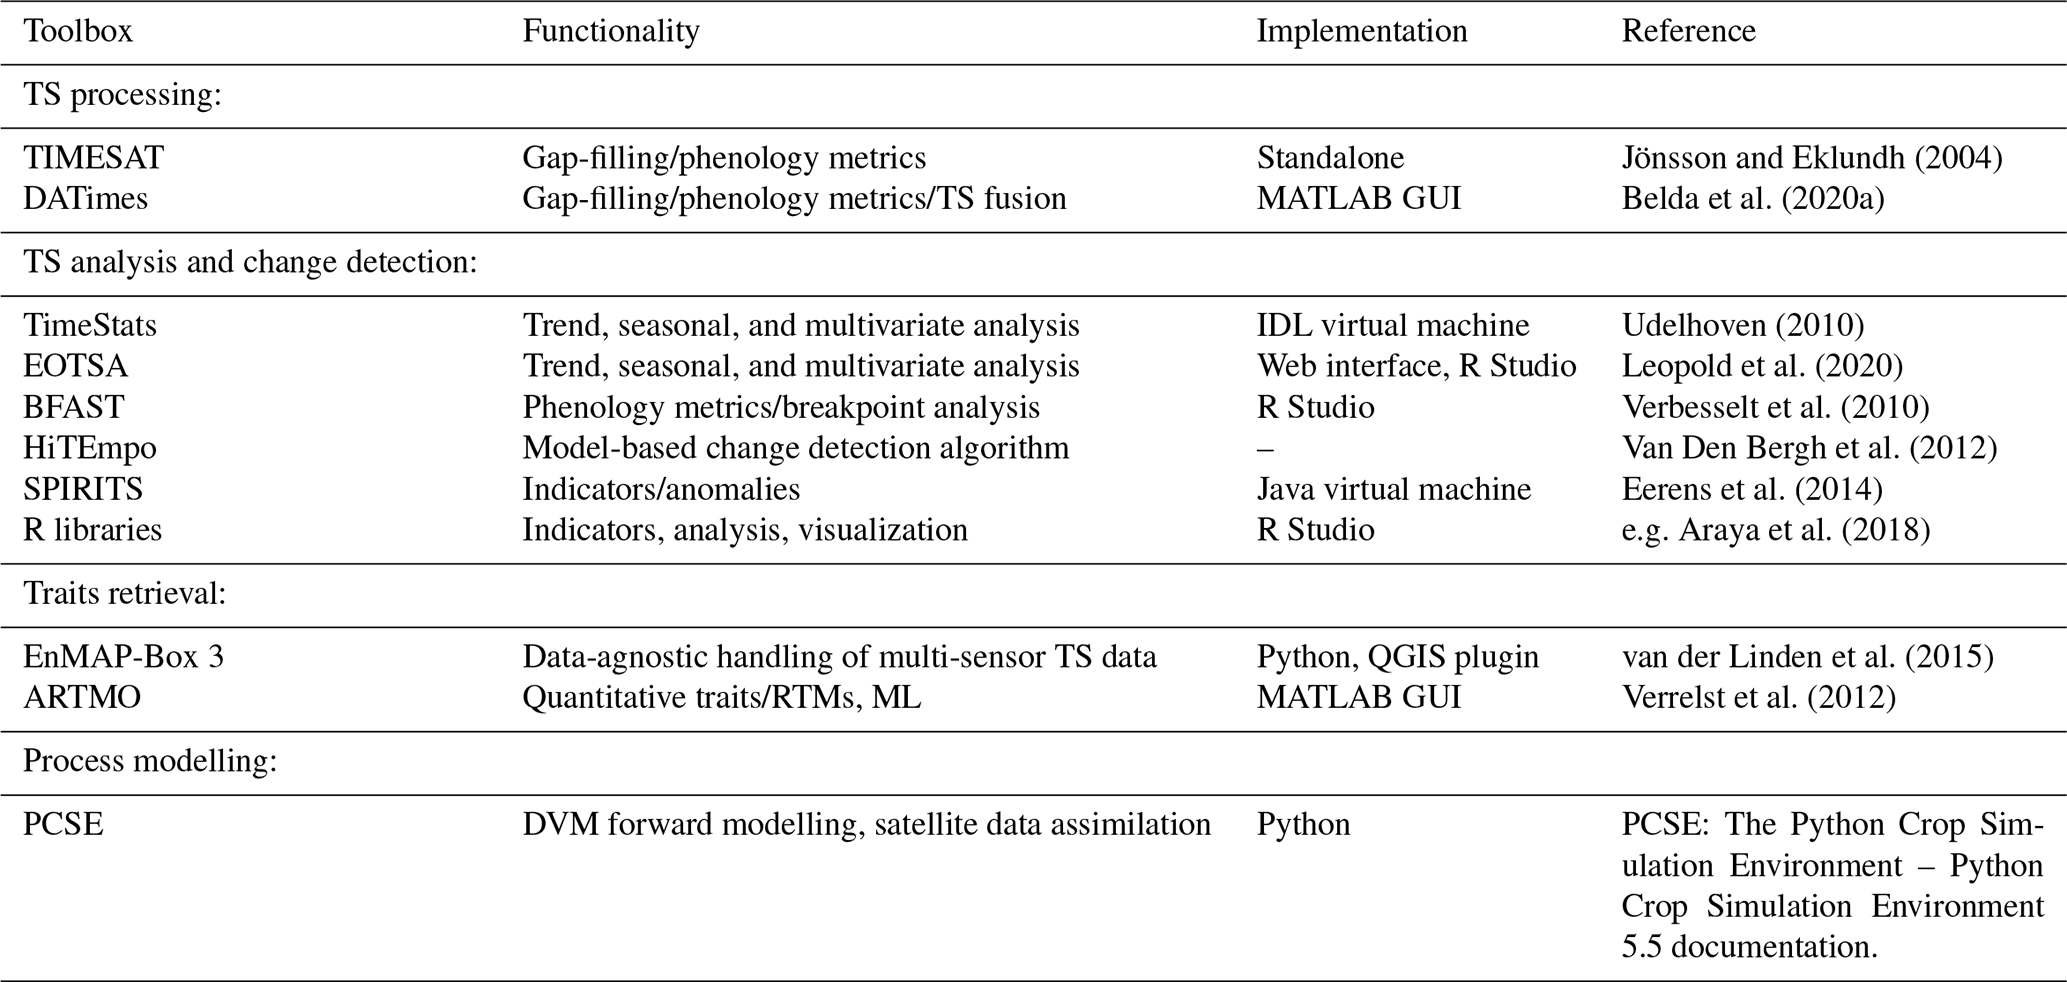
TIMESAT (Jönsson and Eklundh, 2004), for instance, is able to transform noisy signals into smooth seasonal curves and to extract seasonality metrics, like SoS, EoS, and LoS, or integrated values. Originally developed for coarse spatial resolution data (e.g. AVHRR or MODIS), with mostly equidistantly spaced temporal observations, recent versions have adopted the characteristics of satellites with high spatial resolution but infrequent temporal observations, such as Landsat and S2. While TIMESAT uses least-squares methods, the Decomposition and Analysis of Time Series software (DATimeS) (Belda et al., 2020a) expands established TS interpolation methods to over 20 conventional (e.g. Whittaker smoother Eilers, 2003) and advanced ML fitting algorithms, like Gaussian process regression (GPR), which is particularly efficient for reconstructing multi-seasonal vegetation patterns (Belda et al., 2020b). In this way, DATimeS provides interpolated VI and trait values from unevenly spaced TS and associated uncertainties and allows for extraction of phenological metrics for each crop and season. DATimeS then also enables the calculation of the same seasonality metrics as TIMESAT and also has built the option to fuse TS of two data sources, e.g. optical and radar data (Pipia et al., 2019). Apart from TIMESAT and DATimeS, there are other software tools to analyse VI TS data for phenology-related studies including Phenological Parameters Estimation Tool, enhanced TIMESAT, Phenosat, CropPhenology, and QPhenoMetrics (Zeng et al., 2020).
TimeStats (Udelhoven, 2011) goes beyond the extraction of phenological metrics as it expands TS analysis methods to parametric and non-parametric methods for trend detection, generalized least-squares regression, distributed lag models, cross-spectra analysis, windowed trend and frequency analysis, continuous wavelet transform, and empirical mode decomposition. Based on some of those methods within TimeStats, predefined workflows were implemented in a web interface called EOTSA (Earth Observation Time Series Analysis) Toolbox (Leopold et al., 2020). EOTSA allows online access to satellite data archives (currently the full PROBA-V database) without the need for local data storage. Figure 6 shows two examples where NDVI TS was analysed at the continental scale using EOTSA. In the first example, seasonal characteristics (mean NDVI, annual magnitude, peaking time) were derived (step 1), followed by a trend analysis (step 2) (Fig. 6b). The colour composite of the trends for the seasonal characteristics reveals spatiotemporal patterns. Figure 6c shows an example of multivariate TS analysis in which NDVI was regressed against lagged rainfall using distributed lag modelling after pre-whitening the TS. Regions with positive correlation at higher lags depict the dependence of vegetation biomass production on accumulated previous rainfall amounts. These can be, for instance, located in semi-arid areas occupied by natural grassland.
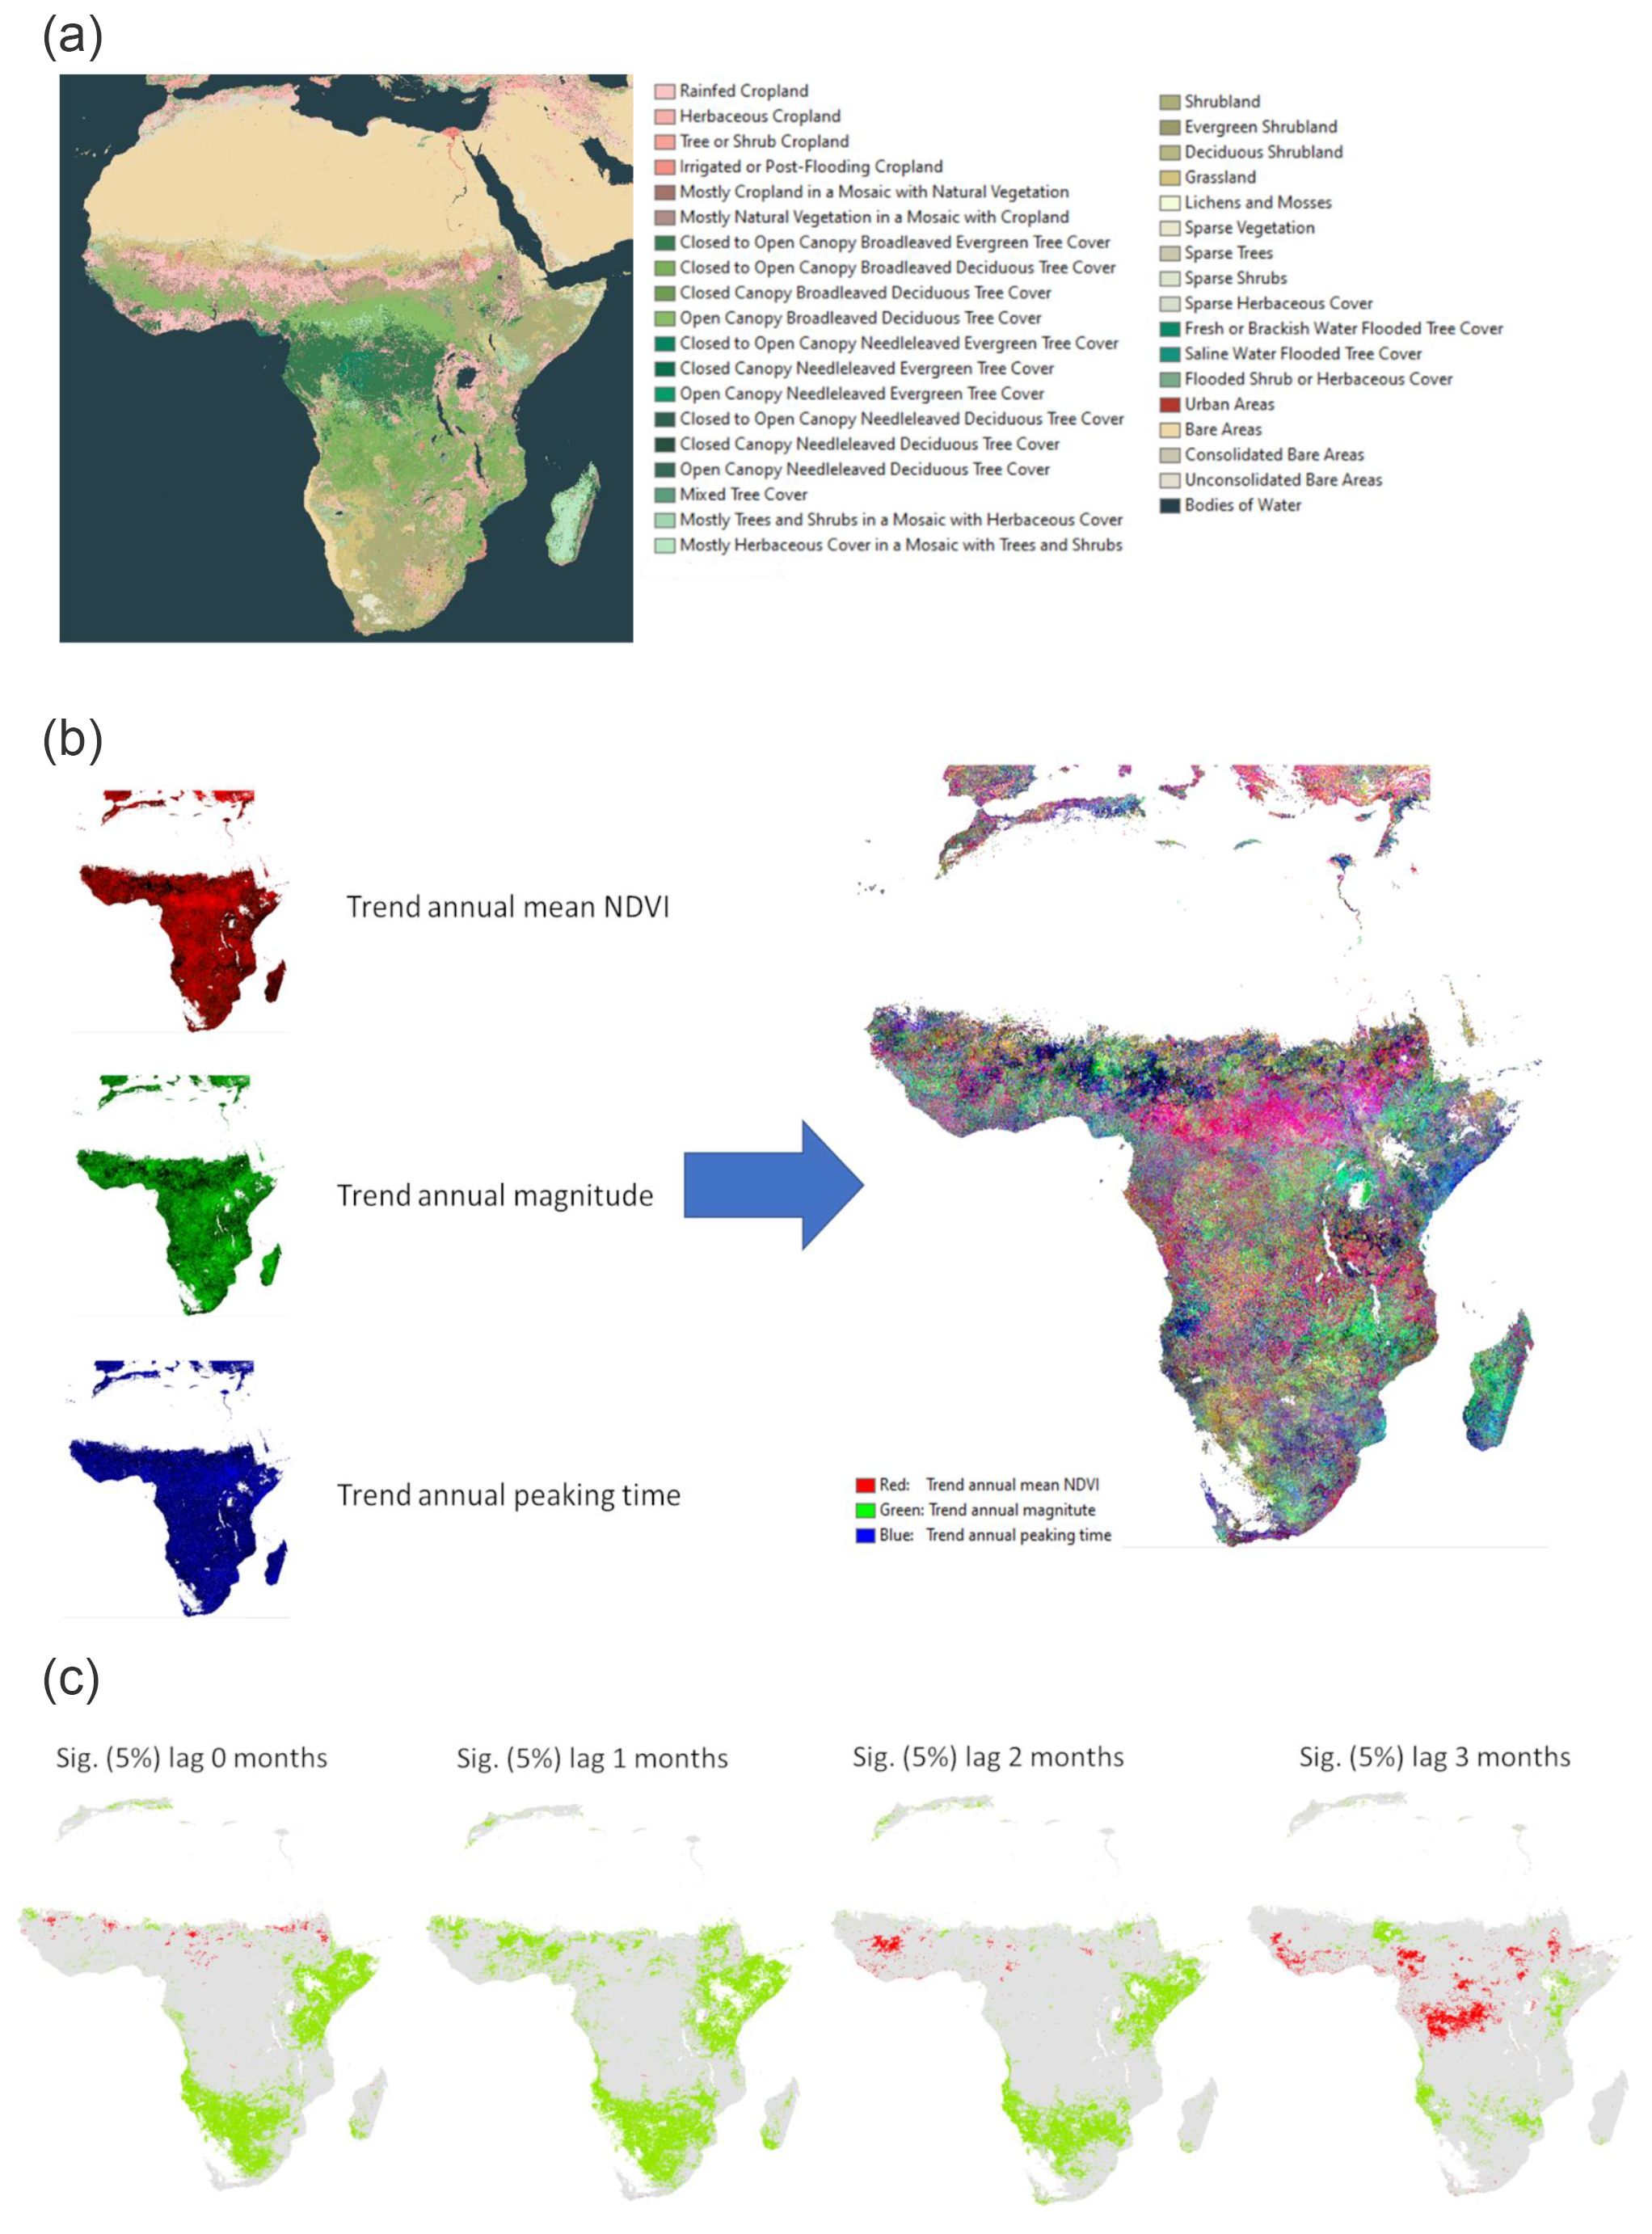
Figure 6Land cover map of Africa and legend (a), trend analysis for a TS of MODIS satellite images (period: 2015–2019) displayed as an RGB colour composite (b), and results from distributed lag modelling where NDVI was regressed against lagged rainfall (c). Prepared with EOTSA RStudio version.
BFAST (Verbesselt et al., 2010) is a generic change detection approach that considers seasonal, trend, and remainder components through iterative estimation of the time and number of abrupt changes within TS, and characterisation of change by its magnitude and direction typically applied in forest monitoring studies.
HiTempo (Van Den Bergh et al., 2012) is a software tool created to aid in the study of TS analysis of hyper-temporal sequences of satellite image data. The platform was specifically designed to simplify the exhaustive evaluation and comparison of algorithms while ensuring the reproducibility of experiments.
SPIRITS (Eerens et al., 2014) is a comprehensive software toolbox designed for environmental monitoring, with a particular emphasis on generating clear and evidence-based information for crop production and decision-makers. SPIRITS provides a vast array of tools for extracting vegetation indicators from image TS and estimating the potential impact of anomalies on crop production (Rembold et al., 2015b). With its user-friendly graphical interface, SPIRITS offers an integrated and adaptable analysis environment that facilitates sequential tasking and provides a high degree of automation for processing chains.
The EnMAP-Box 3 (van der Linden et al., 2015) provides a user-friendly GUI with tools for collecting and visualizing spectral profiles from various sources such as raster images. Furthermore, the QGIS processing framework has been expanded by incorporating many algorithms typically utilized in EO data and imaging spectroscopy analysis for a diversity of ecosystems. The “Agricultural Applications”, for instance, provide empirical and physically based trait retrieval strategies which can be explored for deriving productivity information (e.g. Danner et al., 2021).
Regarding RTMs, the Automated Radiative Transfer Models Operator (ARTMO) toolbox (Verrelst et al., 2011) is an outstanding example. ARTMO provides GUI-based access to several leaf and canopy RTMs and atmospheric RTMs and offers sophisticated strategies for forward and inverse modelling including state-of-the-art ML methods.
Finally, there are a host of available R packages, e.g. CropPhenology, for extraction of crop phenology from TS based on VIs (Araya et al., 2018); the phenofit package, intended for daily vegetation TS and monitoring of vegetation phenology from satellite VIs (Kong et al., 2022); or LPDynR, a tool to calculate the Land Productivity Dynamics indicator (Rotllan-Puig et al., 2021). Moreover, there are Python libraries for phenology and vegetation productivity apps available for ODC. The aim of the ODC initiative is to enhance the worth and influence of worldwide EO satellite data. It does so by offering an open and free-to-use data exploitation structure and by encouraging a community to cultivate, maintain, and expand the technology and its range of applications (Killough, 2018).
While the aforementioned toolboxes focus on the usage of remotely sensed data only, we found only a few tools that allow users to work with DVMs. Many DVMs are (often) based on FORTRAN programming and lack graphical user interfaces or high-level programming interfaces. The Python Crop Simulation Environment (PCSE) has ported old-style DVMs to modern Python programming, but considerable coding skills are still required to make use of it. PCSE offers a platform for carrying out crop simulation modelling along with tools to read supporting data (such as weather, soil, and agricultural management) and components for simulating various biophysical processes including phenology, respiration, and evapotranspiration. Additionally, PCSE features implementations of widely used crop and grassland simulation models like WOFOST, LINGRA, and LINTUL3. WOFOST, for instance, has been employed in the operational crop yield forecasting system MARS, which is used to monitor crops and predict yields worldwide (De Wit et al., 2019; Lecerf et al., 2019). Furthermore, the code of specific process models has been made available via the specific websites of the model authors, e.g. the BESS model.
Validation is a critical step in ensuring the accuracy and reliability of estimated quantities or (vegetation) products derived from remotely sensed TS datasets (Justice et al., 2000). The validation process involves comparing the estimates with those from independent sources, such as in situ observations, to evaluate their overall quality and suitability for a particular application. The comparison between remotely sensed data products and ground-based measurements enables the detection of errors and biases in the retrieved products and improves the interpretation and understanding of the underlying ecological processes (Wu et al., 2019). Ultimately, validation is essential for ensuring that remotely sensed TS data can be used to accurately estimate GPP, NPP, and other vegetation productivity metrics.
4.1 Validation strategies
In the context of productivity monitoring, we distinguish three distinct validation methods:
-
in situ validation,
-
local sensor networks,
-
multi-product intercomparison.
These methods are illustrated in Fig. 7, which showcases how they interplay to provide accuracy, time resolution, and spatial representation, as further elaborated below.
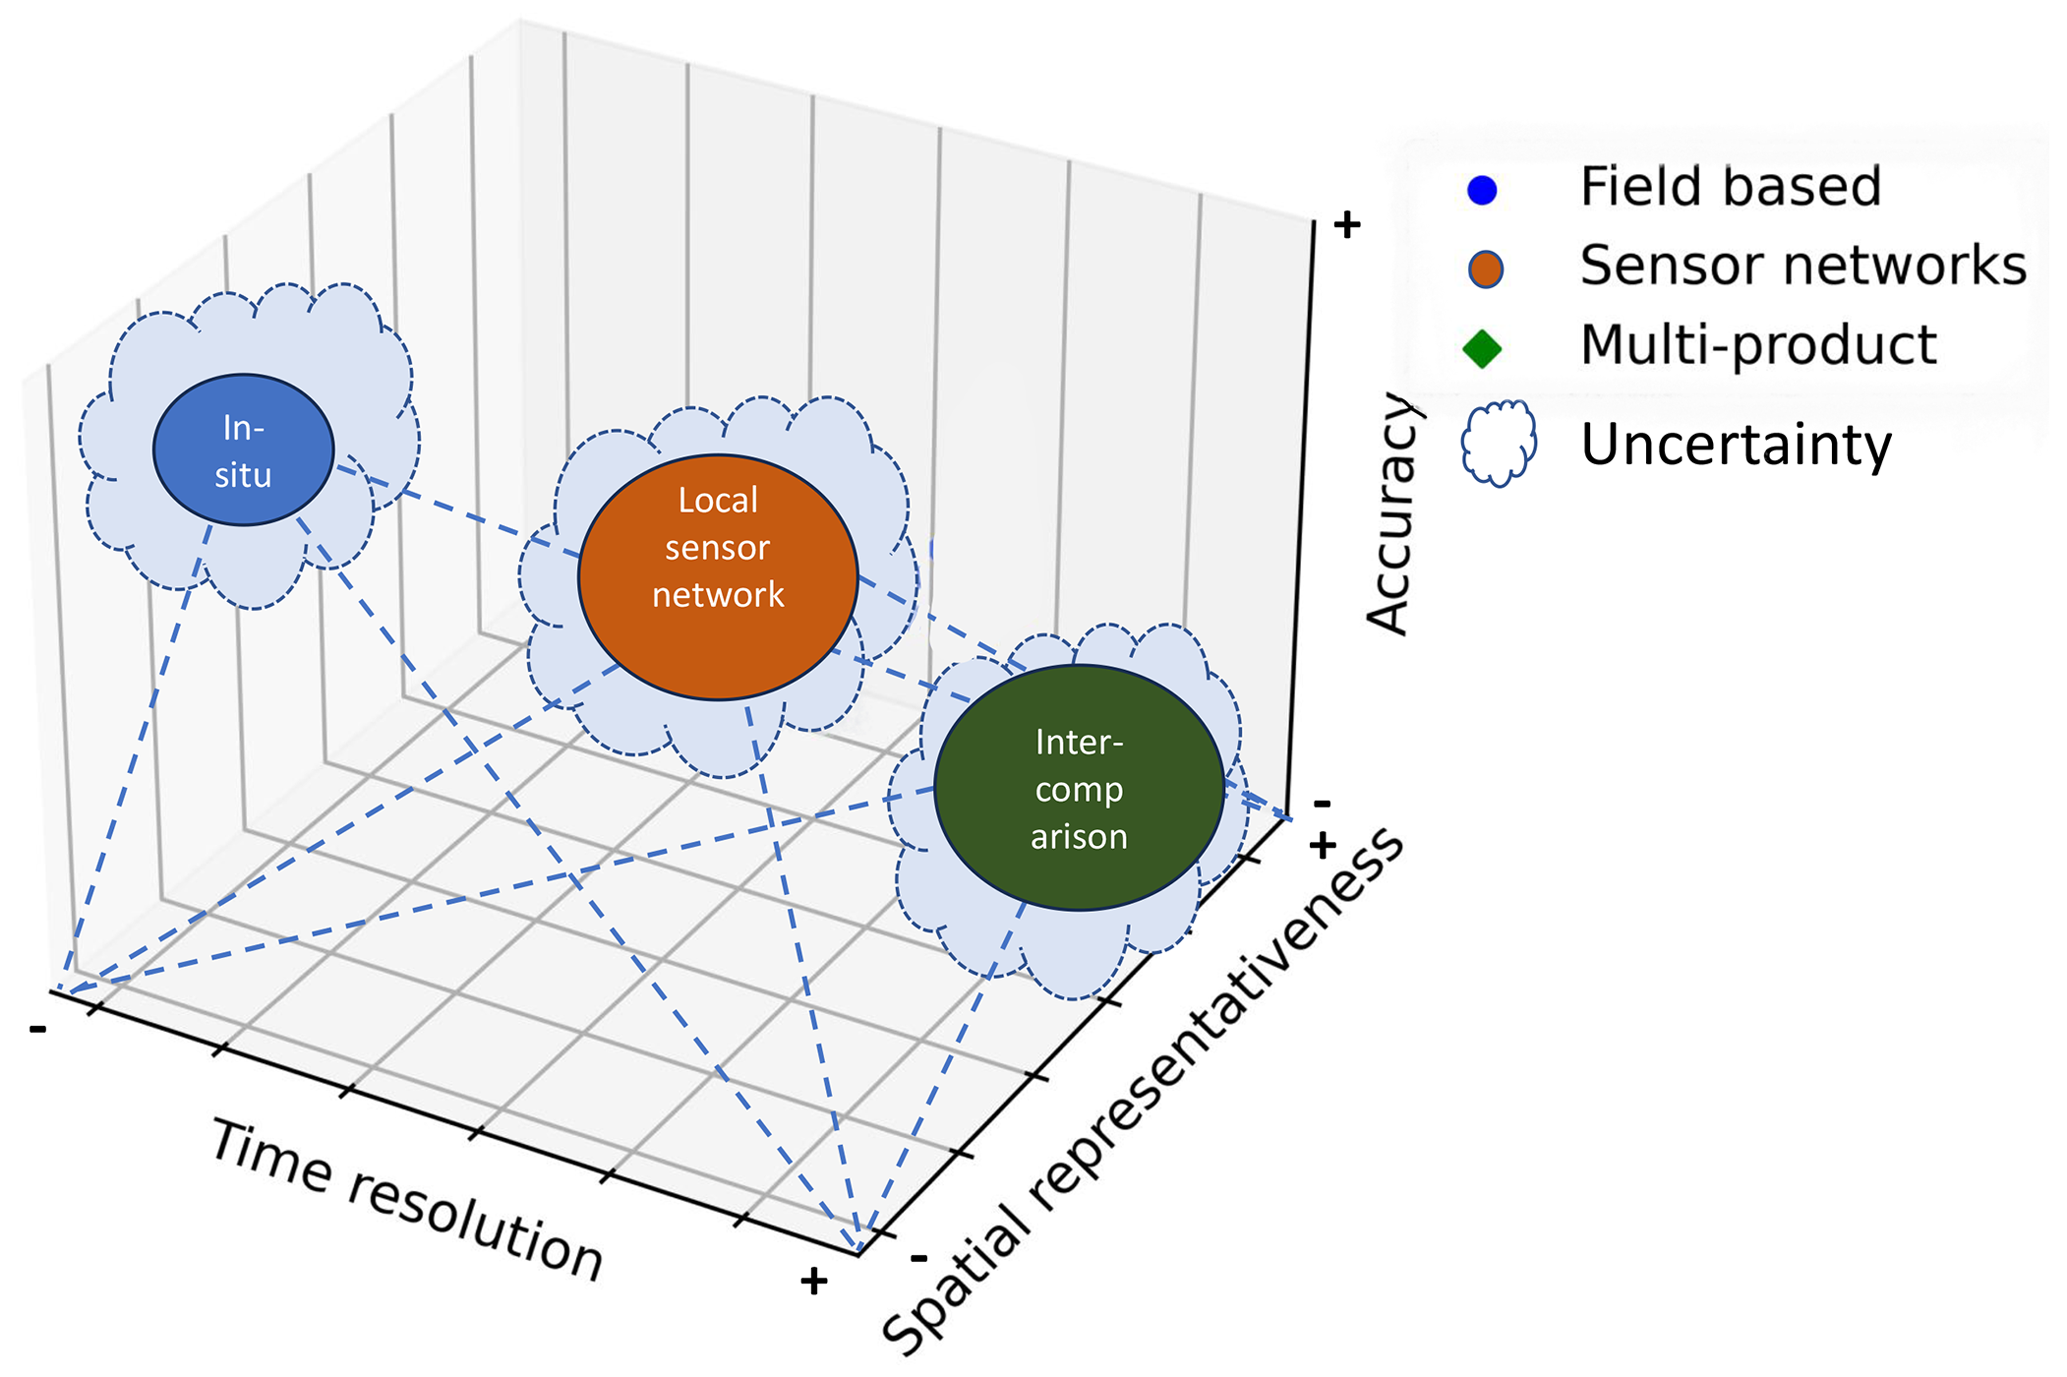
Figure 7Interplay of the three main approaches (field-based: in situ validation, sensor networks, and multi-product intercomparisons) of validating vegetation productivity, as a function of time, spatial representation and accuracy.
The first validation strategy involving in situ validation involves comparing RS data products to direct ground-based observations of productivity metrics. Examples include the direct determination of AGB, litter biomass, and crop yield. In many cases, in situ data are collected by harvesting plots and determining dry biomass (e.g. Zhang and Zhang, 2016; Liu et al., 2021b). One prominent dataset is the ORNL DAAC Net Primary Productivity data collection (ORNL DAAC, 2023). It comprises field measurements of AGB and estimated NPP from roughly 100 terrestrial study sites across the globe, including different types of forests, grasslands, and crops. These data were gathered from various published literature and other available sources of information. In situ validation provides a means of calibrating models to ensure consistency over time, which is essential for long-term studies.
The second validation strategy, local sensor networks, is perhaps the most widespread and promising strategy for validating productivity products (i.e. metrics) from EO data. This category refers to a network of distinct sensors, comprising spectral radiometers, phenocams, and eddy-covariance (EC) flux towers (e.g. Baldocchi et al., 2001; Baldocchi, 2003; Hilker et al., 2011; Toomey et al., 2015). Such an approach requires deploying validation sites or observation networks with standardized observation protocols (Morisette et al., 2006). The employment of spectroradiometers, phenocams, and EC systems is a valuable tool for both providing continuous, high-resolution (i.e. sub-daily) estimates of vegetation productivity over daily to decadal time frames and serving as validation for satellite-based products. Phenocams capture time-lapse images of vegetation, allowing for the monitoring of phenological events such as leaf emergence, flowering, and senescence. This information is valuable for tracking the growth and development of vegetation, as well as for identifying changes in productivity due to environmental stressors. For example, the SpecNet network (SpecNet, 2022) aims to link optical measurements with flux sampling and standardized field optical methods (e.g. Gamon et al., 2006, 2010). The Committee on Earth Observing Satellites (CEOS) Group on Calibration and Validation is currently leading efforts concerning the development of best-practice phenology validation protocols and the establishment of ground-reference sites across different biomes (NASA, 2023). The use of EC techniques for providing direct measurements of the exchange of carbon, water, and energy between vegetation and the atmosphere (Baldocchi et al., 2001) has provided an extremely valuable means of measuring plant productivity across diurnal to decadal timescales. The longest-running flux tower is located in Harvard Forest and has been providing continuous measurements at half-hourly intervals since 1989 (Urbanski et al., 2007). Several national and regional networks of flux towers exist (e.g. Ameriflux, Chinaflux, Ozflux, ICOS), which has enabled the contribution of EC data to improve our understanding of plant–environment interactions to go beyond a single site or ecosystem to regional-to-global studies. To address data consistency and allow cross-site comparisons, FLUXNET was established in 1997, which is a “network of networks” and has led to harmonized methods and datasets. The latest dataset of FLUXNET, FLUXNET2015, contains gap-filled TS data streams of GPP, Re, and meteorological data for 1500 site years, along with an estimation of uncertainties (Pastorello et al., 2020). However, there are concerns about the spatial and temporal representative of EC data, due to the disproportionate predominance of flux towers being located in North America and Europe (Chu et al., 2017). To scale from the footprint of individual flux tower sites to gridded, spatially and temporally explicit products, a variety of ML techniques have been employed, including neural networks, regression trees, and kernel methods (Beer et al., 2010; Jung et al., 2011, 2020). EO data are usually used, along with meteorological data within the ML algorithms, to extrapolate across time and space. These EC-derived products, such as those within the FLUXCOM initiative (Jung et al., 2020) have been extensively used in validating other sources of vegetation productivity estimates, including those from satellite-based EO data streams and terrestrial biosphere models (Chu et al., 2017).
The integration of these diverse ground-based sensing techniques together with EO data streams is suitable for monitoring large-scale vegetation dynamics, and it can aid in the interpretation and validation of productivity models obtained from remotely sensed data (Balzarolo et al., 2014). From a technical point of view, it is common to find literature that explores the accuracy of satellite imagery validated through such near-surface sensors. Additionally, there is increasing usage of similar networks focused on different aspects of vegetation and supported by the spread of low-cost and IoT sensors, for example, the TreeTalker network (Valentini et al., 2019; Tomelleri et al., 2022).
The third validation strategy, multi-product comparison, involves the benchmarking of multiple productivity products or different models using EO data. This validation approach requires a thorough comparison of the obtained products with similar ones to check for consistency (Beer et al., 2010; Lin et al., 2022; Meroni et al., 2012). A critical aspect of this approach is ensuring that the models or products being compared are fit for purpose. In other words, they must be appropriate for the specific application or use case. Additionally, the cross-comparison of distinct types of models, such as (an ensemble of different) DVMs and data-driven approaches (e.g. Ardö, 2015; Jung et al., 2020), can provide valuable insights into the strengths and weaknesses of each model type. Benchmarking models using EO data can help to improve their accuracy and reduce errors in their predictions, which is essential for applications such as monitoring global climate change and assessing the health of ecosystems. It can also aid in developing more advanced primary productivity models that can better account for the complexities of ecological processes and environmental variability.
4.2 Bridging the scaling gap
Scaling issues remain one of the most significant challenges in extracting vegetation productivity, regardless of the metric chosen (Zeng et al., 2020; Caparros-Santiago et al., 2021). The disparity in spatial and temporal resolution between in situ measurements and remotely sensed data often creates uncertainty in the extracted vegetation productivity estimates. While in situ (point) observations are typically species specific, RS platforms capture a mixture of vegetation types within their large geographic footprint. Consequently, directly comparing in situ and remotely derived productivity estimates can be difficult if not impossible. Furthermore, while in situ observations or local sensor networks provide a high level of detail and accuracy, their geographical coverage is often limited and may not be indicative for large-scale studies (see also Fig. 7). In contrast, EO data products from multiple satellites offer broader coverage, but they suffer from coarser spatial resolutions. This trade-off between detail and coverage presents a significant challenge in scaling in situ observations or local sensor networks (categories 1 and 2) into the larger scale captured by EO data. Therefore, to overcome the scaling challenge and enhance the accuracy of remotely derived vegetation productivity metrics (see Sect. 1.1), an effective protocol for the calibration and validation of such metrics using in situ observations, sensor networks, and multi-product and multi-model intercomparisons is essential; see also the multiscale validation scheme as outlined in Malenovskỳ et al. (2019).
This section aims to complement the previous sections by taking a tour across principal thematic applications through a meta-review. We do not assess the calculation of productivity applied in these studies. Instead, we aim to provide a thorough overview of how remotely sensed TS data were explored to estimate productivity for agricultural, forestry, and other natural ecosystem applications. In this way, readers will be redirected towards specific scientific studies analysing productivity with a multitude of proxies and methods for these application domains.
5.1 Systematic literature review
The systematic literature review followed the guidelines of the Preferred Reporting Items for Systematic Reviews and Meta-Analyses (PRISMA) (Page et al., 2021). The SCOPUS and Web of Science web catalogues were queried for published, peer-reviewed studies. In SCOPUS, the title, abstract, and keywords were searched with the query “time AND series AND productivity AND `remote sensing' AND (vegetation OR forest OR crop)”, while the topic field in the Web of Science catalogue was searched for “ `time series' AND (vegetation OR forest OR crop) AND productivity”. The resulting 915 records of the two databases were merged into one database by omitting duplicated records as identified by their DOI (Fig. A1). The records were further screened to include research articles and conference contributions in the English language, excluding review studies. Furthermore, the studies were required to use RS analysis of terrestrial vegetation with at least two observations in time. For each entry, a range of attributes was recorded (Table 3).
Unlike other studies, which defined a TS as consisting of a minimum of several observations, we included studies with a minimum of two images without an upper limit. This allowed us to include studies that have traditionally been labelled under the topic of change detection analysis. We chose to do this for two reasons. First, we believe that the minimum number of observations in a TS is arbitrary, and we wanted to take a more comprehensive approach to examining the aspect of time. Second, the number of studies using long TS consisting of high-resolution (10–30 m pixel size) images is relatively small. Considering only long TS data streams would have excluded many studies that observe productivity from Landsat and Sentinel-2 satellites.
Table 3Attributes retrieved from selected studies for the systematic review.
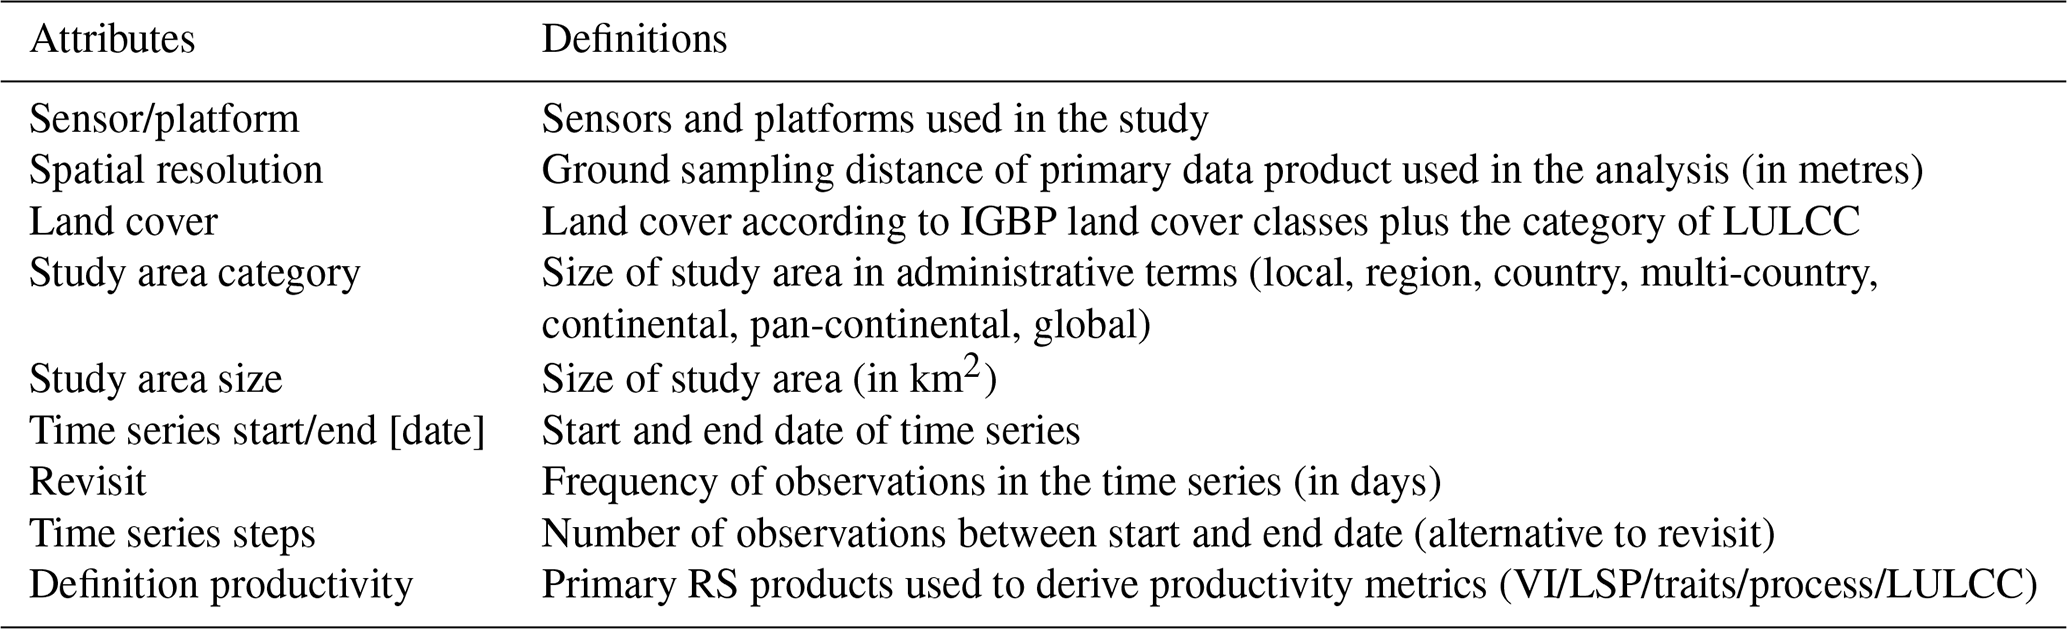
Figure 8 shows the number of published papers per number of explored TS observations. Note that the x axis starts with “2”. There is a skewed normal distribution with a median of 227 temporal observations and a long tail towards a higher number of observations. The 75th percentile is reached at 786 observations.
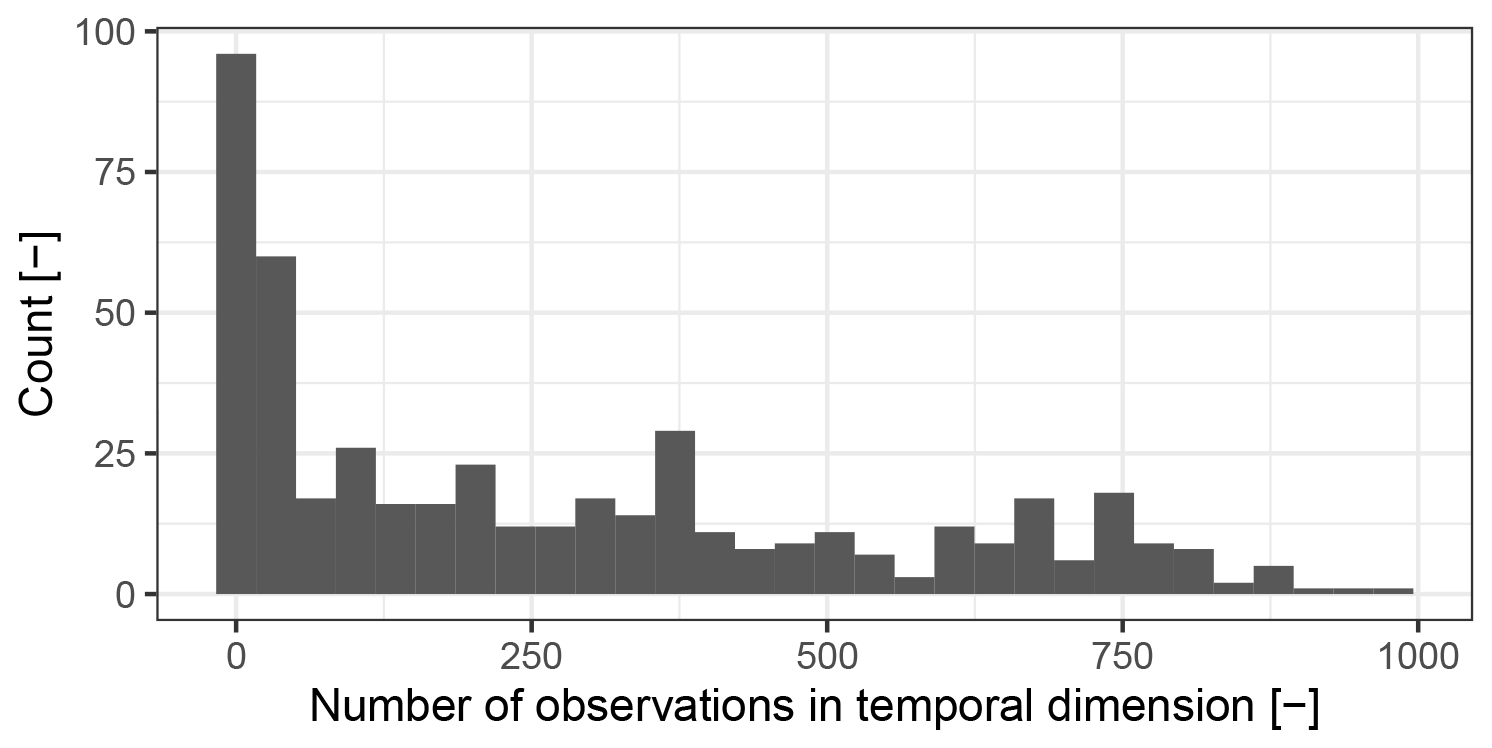
Figure 8Histogram of number time steps used by the reviewed studies. A total of 33 studies with ≥ 1000 steps have been removed in order to facilitate representation.
Figure 9a summarizes which RS-derived products or methods were used by the studies to approximate productivity. Note that some studies referred to productivity but did not specifically state if the generated products were meant to be a representation of productivity, this required care in the interpretation of the results. Generally, productivity proxies were categorized into (1) VIs, being the simple algebraic transformation of spectral observations (see also Sect. 3.1.1); (2) phenological metrics, i.e. derivatives of observations over time, as described in Sect. 3.3); (3) traits, i.e. biophysical or biochemical properties of vegetation at the time of observation (see also Sect. 3.1.2); (4) processes, which implies the use of DVM (see also Sect. 3.4); and finally (5) land use and land cover change classifications (LULCCs). VIs were most often employed to describe productivity, as seen in almost 50 % of all analysed studies. Specifically, most studies relied on NDVI TS, which may be the most used and well-known method to analyse TS in the context of vegetation productivity. VIs were followed by traits, processes, and phenological metrics, and cover characteristics as less often used proxies.
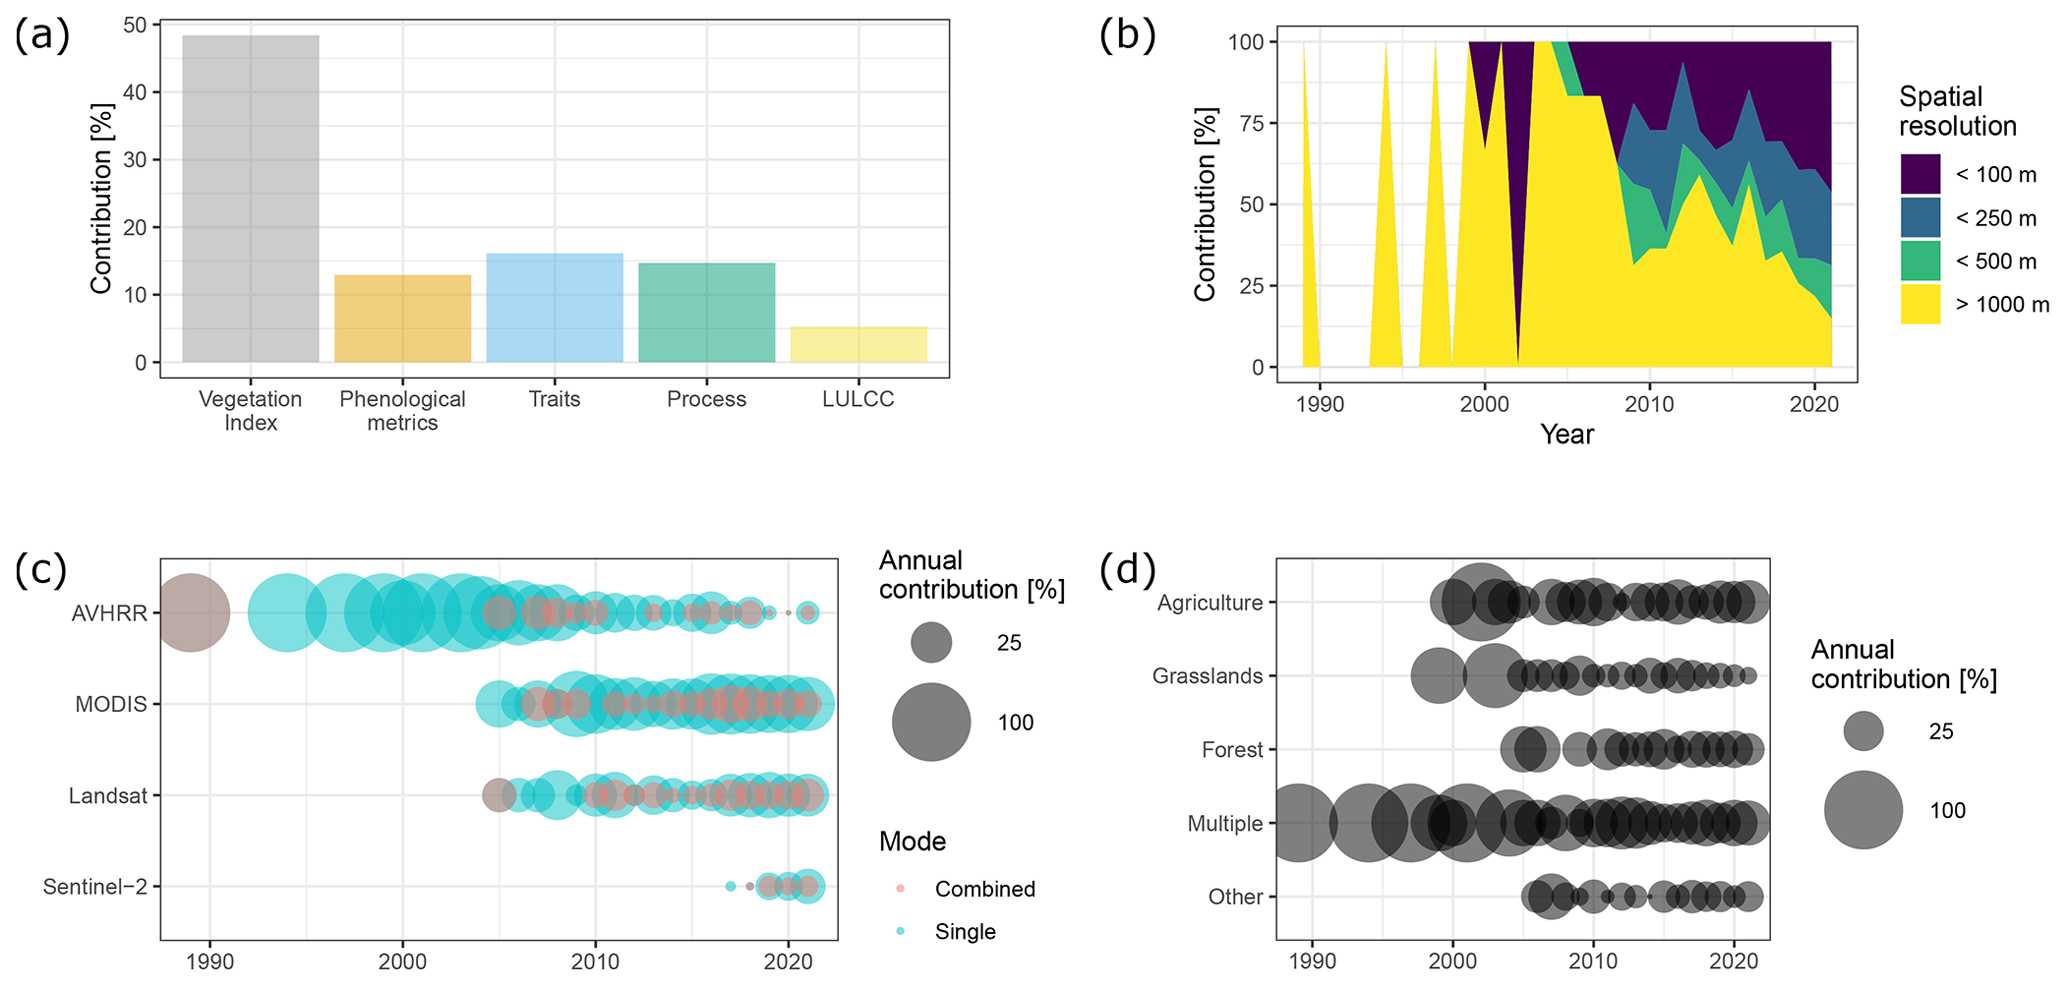
Figure 9Results of systematic literature review: (a) definitions and RS products used in the context of vegetation productivity, i.e. to derive the productivity metrics, in reviewed studies. (b) Trends in spatial resolutions (pixel size) at which spatial products were produced in reviewed studies. (c) Trends in satellite missions (or sensors) used. Only the four dominant missions, AVHRR, MODIS, Landsat, and Sentinel-2, are shown. (d) Trends in assessed aggregated land cover types in reviewed studies. The category “Other” includes studies covering multiple land cover types and land cover and land use change studies.
Figure 9b and c show the trends in spatial resolution and sensors underlying the vegetation productivity studies, respectively. In both panels, three phases can be distinguished: first, the dominance of AVHRR-based and coarse-resolution studies until 2005 (e.g. Wessels et al., 2004). In this period, only 21 studies (3.7 %) were published. Second, a rising contribution of MODIS and Landsat marked the period from 2005 until 2017 (e.g. Boisvenue et al., 2016). During this period the number of studies per year increased from 6 (1.1 %) in 2005 to 52 (9.2 %) in 2017. In Fig. 9b, the years 2013 and 2016 appeared to be outliers with the highest portion of studies having a larger than 1000 m resolution. The 2016 outlier can be explained with the publication of the Global Inventory Monitoring and Modeling System (GIMMS) third-generation NDVI (NDVI3g) long-term TS dataset based on AVHRR (Pinzon and Tucker, 2014). The last phase started in 2017 and is marked by an increasing trend towards sub-1000 m resolution studies driven by the increased availability of longer-term Landsat and MODIS TS. Studies combining both sensors make up 6.3 % of all (e.g. Knauer et al., 2017; Kussul et al., 2017). Moreover, an unprecedented amount of other sensor TS data became available; see Fig. 3. Despite the launch of the Sentinel-2A only being in 2015, 29 studies (5.1 %) have already made use of it for analysis (e.g. Abdi et al., 2021).
In Fig. 9d, trends in assessed aggregated land cover types of the reviewed studies are indicated. The category “Other” includes studies covering multiple land cover types and land cover and land use change studies. Hereby, the dominance of agricultural studies can be clearly seen, followed by the multiple, forests (e.g. Boisvenue et al., 2016), and finally grasslands categories (e.g. Brinkmann et al., 2011).
5.2 Agricultural applications
Exploration of TS data has been focused on cultivated areas due to the high significance of agroecosystems for providing global food security. In agricultural applications, grain or fruit yield is often considered the primary metric for productivity. Being indicated as “Vegetation Index” or “Traits” in Fig. 9a, these studies used VIs or quantitative traits as one of several inputs in data-driven or process models (e.g. He and Mostovoy, 2019; Ma et al., 2021; Guo et al., 2019) or transformed those into phenological metrics, such as calendar and thermal time or LoS (e.g. Duveiller et al., 2013; Azzari et al., 2017) to predict yield. With regards to VIs, mainly NDVI was used to predict crop yield (e.g. Lopresti et al., 2015; Suijker and Medrano, 2018). For instance, corn and soybean yield was estimated from 6-year TS MODIS-driven NDVI by training regression tree-based models (Johnson, 2014), and for grapes the yield was forecasted by training a separate artificial neural network with Landsat NDVI, LAI, and normalized difference water index (NDWI) over 3 years (Arab et al., 2021). In a more complex set-up, Houborg et al. (2015) retrieved leaf chlorophyll content from Landsat TS data to constrain community land model simulations of GPP, while Yan et al. (2009) predicted the seasonal dynamics of GPP using a satellite-based vegetation photosynthesis model (VPM). The inclusion of multiple and heterogeneous data sources as inputs for ML models can improve results for crop yield forecasting. For instance, Perich et al. (2023) evaluated four different methods (including ML and deep learning) for pixel-based, within-field crop yield forecasts for five cereal crops from S2 time series data across 5 years (2017–2021) and 54 fields. While their models showed good performance in general, the results also demonstrated that the ability to predict yield for unseen years varied. This indicates that EO data alone might not be sufficient to explain complex productivity metrics such as yield. The importance of climate TS data, such as maximum temperatures and accumulated rainfall, along with EO data when training ML models was emphasized for crop yield forecasting by Kamir et al. (2020).
As a more direct proxy for plant photosynthetic activity, SIF may be able to directly indicate yield or agricultural production. The study by Somkuti et al. (2020), for instance, showed the potential of integrated GOSAT-derived SIF TS data to estimate crop yield. This research line of yield prediction has since then been adapted using other satellite sources of SIF (e.g. GOME-2, TROPOMI), thereby confirming that SIF contributes to improved yield prediction models (e.g. Peng et al., 2020; Sloat et al., 2021; Li et al., 2022).
5.3 Applications in forestry
In the last 3 decades, the bulk of research on forest productivity TS has focused on estimating AGB and thus carbon sequestration and better understanding the role of forests in regulating the climate. To accomplish these tasks, various types of data have often been combined, such as TS of satellite multispectral data (Landsat) with light detection and ranging (lidar) and radar (e.g. Powell et al., 2010; Pflugmacher et al., 2014; Nguyen et al., 2020). The review by Nguyen et al. (2020) stated that innovative Landsat-based approaches for estimating forest AGB dynamics across space and time have been developed in recent years. Methods have become more advanced and robust over time. For instance, Landsat data can be used to fill in missing data points in AGB maps, which can improve the overall quality of the maps and make them more useful for applications such as carbon accounting and forest monitoring. Landsat data have been also used to estimate AGB over large areas and long time periods, even in areas where there are limited field data. Furthermore, recovery metrics can be used to improve the accuracy of AGB models since Landsat data can provide information about the dynamics of forests over time, which is not always captured by traditional AGB models.
Furthermore, forest disturbances can play a crucial role in ecosystem dynamics affecting productivity. Therefore, TS analysis of forest productivity is a fundamental tool for analysing the magnitude and frequency of such events. Many of these forest disturbances are related and have increased due to climate change. Storms and forest fires have been highlighted as the most significant abiotic disturbances in Europe in recent years (Senf and Seidl, 2021). In addition, satellite TS analysis shows an increased trend in the frequency and intensity of droughts, and illustrative studies have been conducted for northern Europe (e.g. Reinermann et al., 2019; Senf et al., 2020; Descals et al., 2023). Climate change is also increasing the frequency of biotic disturbances like insect outbreaks (Senf et al., 2017; Olsson et al., 2017). Insect outbreaks in forests have a significant impact on productivity by defoliating trees and changing the structure of the forest. All these factors put our forests under increasing pressure and limit the forests' role as the global carbon sink. Therefore, it is essential to monitor temporal and spatial patterns of forest productivity by adopting suitable tools like EO data. To this end, many novel initiatives are related to this specific ecosystem. Examples are actions based on available data like the FAO's Global Forest Observations Initiative (GFOI) (Penman et al., 2016). In recent years, the main concern in forest science has moved towards accurate carbon stock and fluxes estimations, for which the focus on EO has shifted from multispectral proxy productivity estimations to precise forest extension and AGB measurements by means of lidar, radar, and SIF observations. Remotely sensed SIF has become a widely used method to study temporal variations in deciduous and evergreen forests. In particular, SIF retrieved from GOSAT (Lee et al., 2013), GOME-2 (e.g. Koren et al., 2018; Getachew Mengistu et al., 2021), and TROPOMI (e.g. Doughty et al., 2019) was explored to study the relatively subtle seasonal variations in tropical forests and provided new insights into vegetation activity during the transitions between wet and dry seasons.
5.4 Applications for natural ecosystems
For natural ecosystems, many studies assessed spatial and temporal trends in vegetation productivity for specific ecosystem types, often based on phenology indicators derived from TS of spectral VIs or by integrating those in DVMs. Among natural ecosystems, several studies focused on African semi-arid ecosystems (Sahel, South Africa) (Fensholt et al., 2013), the Arctic tundra (Beamish et al., 2020), the northern taiga (Canada, Alaska, Siberia, and Scandinavia) (Fiore et al., 2020) and the central Asian grasslands, specifically in the Tibetan Plateau (You et al., 2019; Liu et al., 2020) and the Chinese–Mongolian area (Tüshaus et al., 2014; Gao et al., 2017). Regarding productivity, these studies assessed droughts, fires, changes in phenology metrics, land degradation, and vegetation mortality (e.g. Mayr et al., 2018; Buitink et al., 2020). The most used EO missions are MODIS and AVHRR, mainly through the analysis of NDVI and GPP TS, or to a lesser extent, other proxies (EVI, fAPAR) or metrics (NPP) of productivity (e.g. Rankine et al., 2017; Lara et al., 2018). The spatial coverage of these studies is global or regional, while the temporal extent is decadal, as MODIS and AVHRR cover a larger time period, from the 1980s to the present. Multiple studies took advantage of MODIS ready-to-use products (NDVI, EVI, fAPAR, GPP or NPP), which are compatible with specific phenology analysis software; see also Sect. 3.5. The MODIS GPP algorithms were also used in GPP estimation studies (e.g. Feagin et al., 2020) and for a comparison with a LUE-based DVM (Liu et al., 2011). Studies also compared the results of estimating GPP using MODIS and S2 TS data (e.g. Cai et al., 2021).
More recently, satellite SIF data became a valuable source for productivity estimations in natural ecosystems, among others to better capture seasonal periods of water stress and early-season GPP dynamics in drylands (Smith et al., 2018; Wang et al., 2019). Similarly, Merrick et al. (2019) studied satellite SIF data for different biomes, such as grasslands and savannas (among others). The authors concluded that the inclusion of SIF facilitated the differentiation of various vegetation types based on their functional characteristics and seasonal changes, explaining differences in year-round productivity dynamics. Despite being one of the most sensitive ecosystems, wetlands have been the least researched in the TS context, which might be due to their complexity. A few studies explored MODIS TS and EC flux tower data (e.g. Kang et al., 2018; Wang et al., 2021). Wang et al. (2021), for instance, used TS of the MOD17A3 annual NPP product to reveal spatial and temporal trends of NPP in China, among others. Analyses for wetlands are also oriented towards classifying changes in wetland extent on multi-temporal S2 imagery. Products derived from multi-temporal data were used (S2, Landsat), like NDVI for instance, to model NPP by means of the Carnegie–Ames–Stanford approach (Zhang, 2021; Zhang et al., 2022a).
5.5 The role of productivity as a sink for carbon across ecosystems
Vegetation productivity, or GPP specifically, characterizes the “gross” terrestrial carbon sink, the gross amount of CO2 annually sequestered by vegetation. NPP corresponds to the net carbon gain by plants, as it is the difference between the carbon produced by GPP and Ra (Fig. 10). The appropriation of NPP is also a measure of vegetation contribution to climate change mitigation (Alexandrov and Matsunaga, 2008). Overall, knowledge about the productivity of aboveground carbon stocks in forests, agriculture, and natural ecosystems is essential for global climate scenarios (Erasmi et al., 2021).
Terrestrial ecosystems, along with the oceans, serve as a natural buffer that restricts the increase in CO2 in the atmosphere by absorbing and sequestering nearly half of emitted CO2 (Friedlingstein et al., 2022).
Figure 10 delineates the different levels of productivity, which are GPP, NPP, NEP, and NBP with respect to their carbon loss processes and flux densities over time. With increasing timescales, the four main fluxes are characterized by decreasing amounts of stored carbon due to diverse loss processes (GPP > NPP > NEP > NBP). Compared to GPP and NPP; NEP and especially NBP are relatively small (Watson et al., 2000). As denoted in Fig. 10, distinct ecosystems vary a lot in this respect. While an agricultural system (non-permanent crops) usually releases all carbon during one season, natural and forest ecosystems can store carbon for decades, depending on climate, but also on the amount of woody vegetation and tree age (Machwitz et al., 2015). This emphasizes the crucial role of TS data acquisition in monitoring the development of these carbon pools.
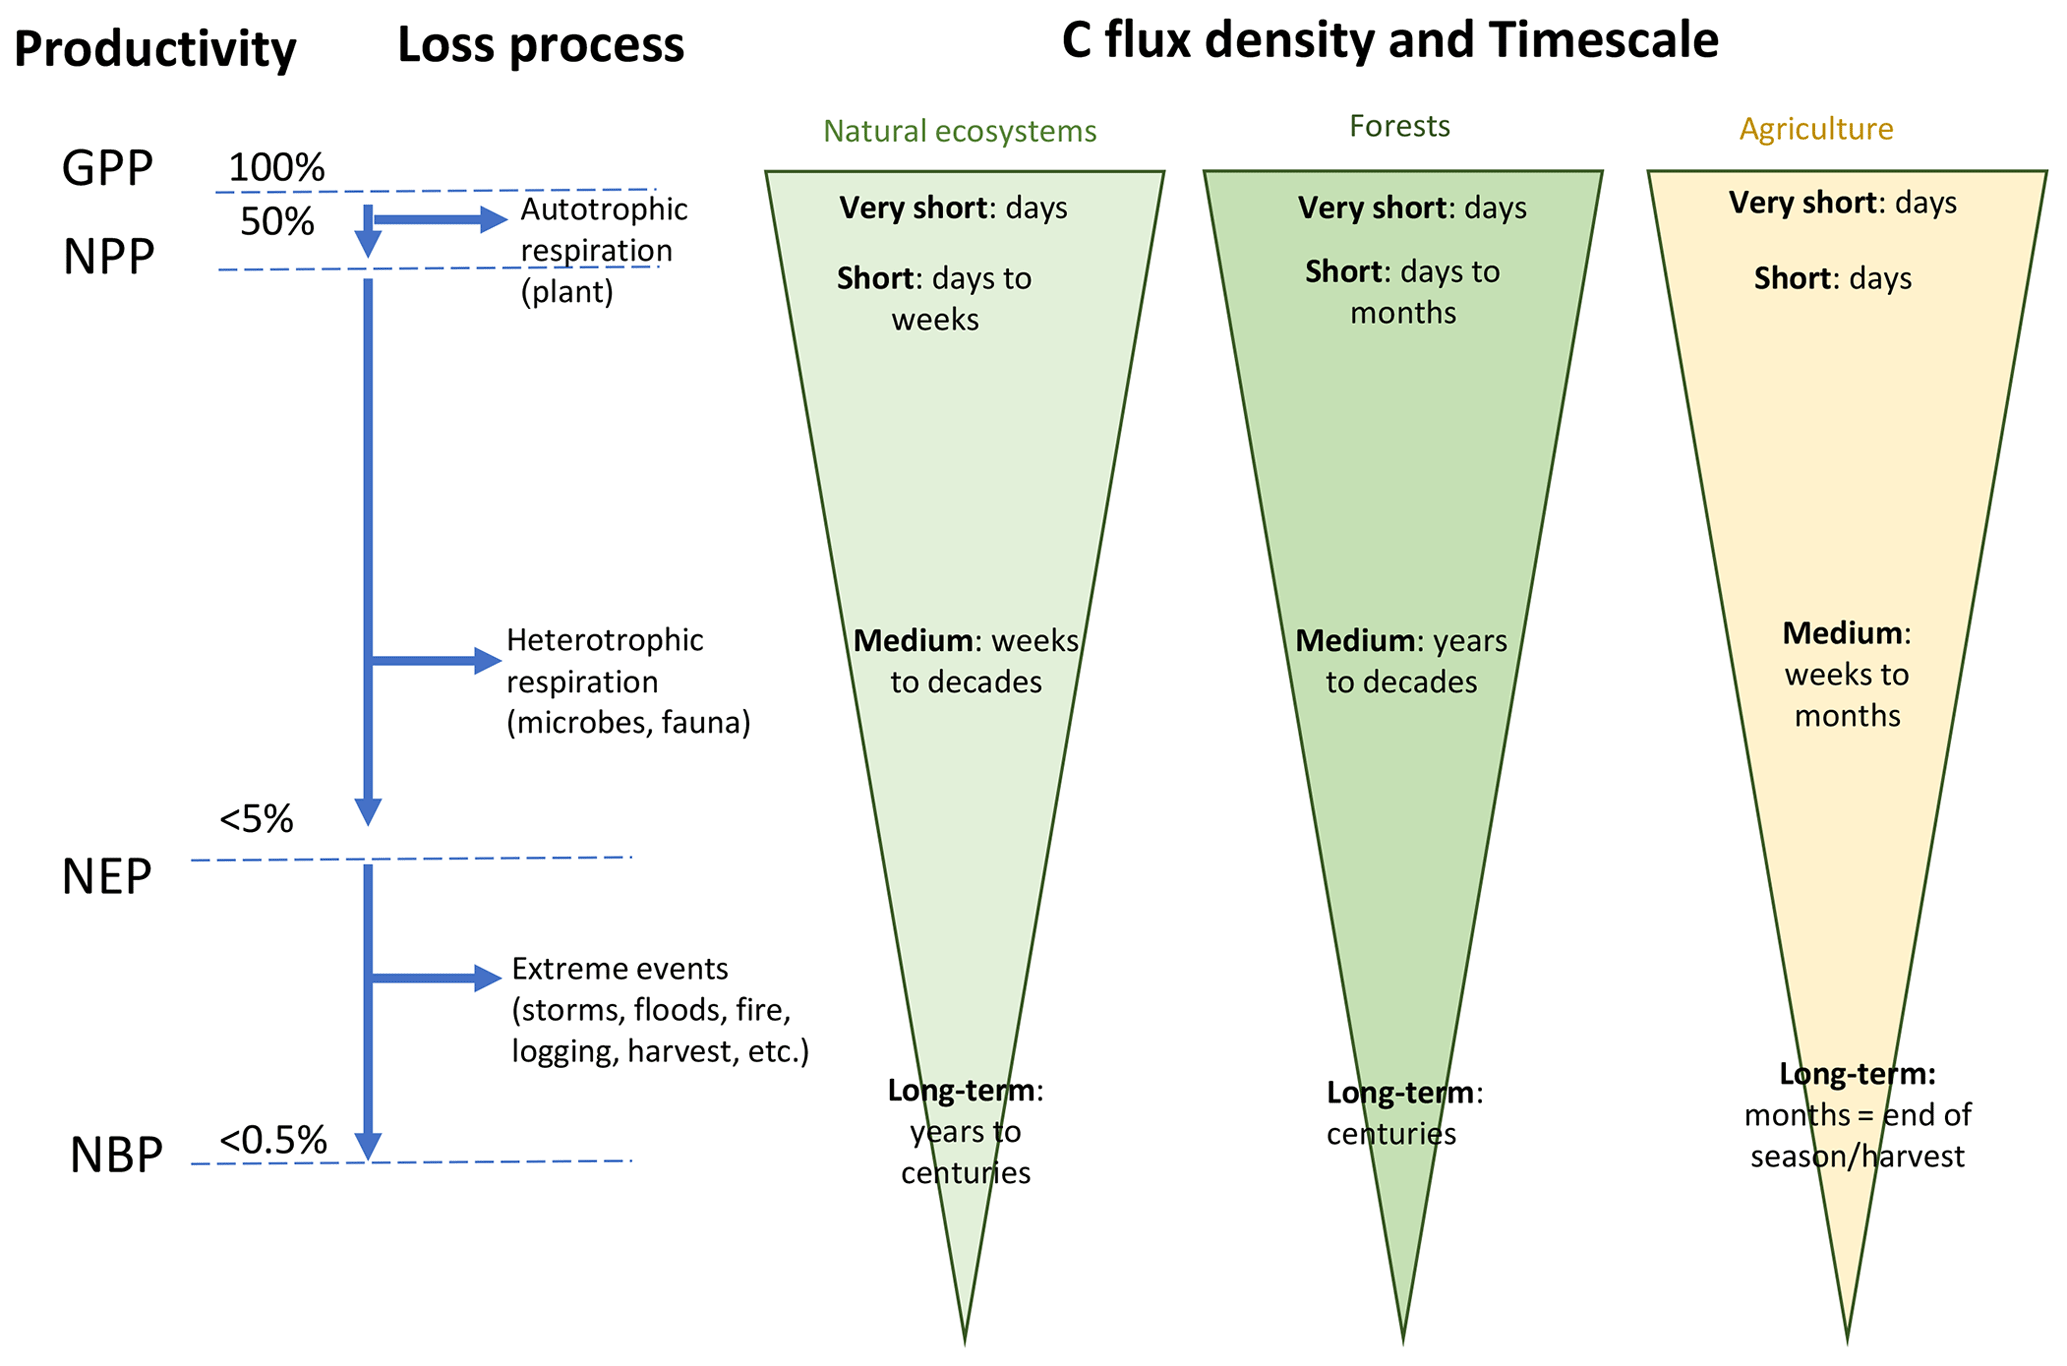
Figure 10Overview of productivity terms along with their loss processes and C flux density over timescales and for the main ecosystems. Note that the given percentages are common average values and may vary.
Due to the vast expansion of cultivated surfaces worldwide, the role of productivity of managed land within the global carbon cycle has also increased significantly and deserves particular dedication. Hereby, different factors have been found to influence the dynamics of carbon as sources or sinks, such as climate, tillage measures, fertilization or irrigation, among others (Luo et al., 2010). For example, tillage usually leads to a loss of soil organic carbon by organic decomposition; however, in combination and depending on other management practices a larger amount can be stored again by the crops (Haddaway et al., 2017).
The largest terrestrial carbon sink is the world's forests. In a general view, the global forest carbon stock in 2020 was 662 Gt (FAO, 2020), from which 44 % is contained in the AGB. The tropics have the largest proportion of the world's forests, and hence they are highly relevant in terms of global climate regulation. However, tropical rainforests are under threat due to deforestation, logging, or cultivation, among other factors. These human activities lead to the loss of biodiversity and carbon storage and thus to a transition of being carbon sources for the atmosphere. Also, other forest types play essential roles in this context, such as needle-leaf forest systems. A study in southern Sweden, for instance, focused on the plantation of needle-leaf trees (Grelle et al., 2023). The stands underwent a transition from positive (sources) to negative (sinks) annual carbon fluxes approximately 8 to 13 years after disturbance, influenced by site productivity and management, with net carbon gains of around 5 tC ha−1 yr−1. Additionally, tree-crop-based agroecosystems, such as vineyards, have been linked to carbon storage facilities, with fixation rates up to 7.23 tC ha−1 yr−1, where the contribution of root systems implies 9 %–26 % (Brunori et al., 2016) (which, however, cannot be quantified by EO techniques). A recent study on carbon density simulation in woody vegetation highlighted the need to advance model–data integration employing TS data streams for a better understanding of the global terrestrial carbon cycle (Bultan et al., 2022).
Our review revealed that multiple gaps, challenges, and opportunities exist to accurately estimate vegetation productivity from remotely sensed TS data streams. In this final section, we will discuss the main priority areas of research giving an outlook towards required efforts.
6.1 Key challenges
Efficient use of increasingly available and longer time series datasets. Over the past few decades, there has been an increasing number of TS datasets made available with enhanced spatial details as depicted in Fig. 3. Despite this progress, there may still be limitations in terms of the spatial and temporal resolutions for specific objectives and applications of monitoring vegetation productivity trends and processes. Some of these limitations include gaps in available long-term datasets due to persistent cloud cover, and discontinuity of sensors, leading to uncertainties in variable retrievals being relevant for vegetation productivity metrics. While with the advent of cloud-computing platforms access to EO data TS has never been as easy as nowadays, access to other RS resources (local airborne campaigns) is more fragmented and not always open. From a user's perspective, currently there are a broad range of high-level, free, and easy-to-use toolboxes available (as shown in Table 2), allowing and facilitating efficient TS processing.
Processes and factors affecting vegetation productivity. One important goal will be to adopt TS datasets to develop and test methods for heterogeneous natural environments, as the current focus is largely on croplands (see Fig. 9d). Satellite TS data streams can effectively capture, characterize, and quantify the spatiotemporal variation in natural processes. However, some approaches (discussed in Sect. 3) may only provide a relative characterization of vegetation productivity. To increase our understanding, process-based models (i.e. DVMs) are required to provide the mechanistic basis (linking to modelling domains) necessary to capture productivity variations in natural environments. Integrated modelling is a potential approach to address this need.
Availability of validation data and approaches. Effective validation of remotely sensed vegetation productivity products and derived productivity metrics is essential for ensuring their reliability and usefulness for a variety of applications. However, the collection of appropriate validation data (see Sect. 4) can be challenging for certain ecosystems. Moreover, there may be discrepancies in the terminology used by different scientific communities, which can hinder effective communication and collaboration. Thus, it is crucial to facilitate interdisciplinary exchanges to promote a common understanding of the terminology and concepts related to RS, as well as to foster collaborations that can help address knowledge gaps and advance the field.
Use of TS-based approaches to identify drivers of productivity change. TS-based approaches can be utilized to identify the drivers of productivity change, particularly concerning critical societal issues such as deforestation, land degradation, and climate change. Bultan et al. (2022), for instance, summarized that plant productivity has been underestimated using DVMs due to missing data from unprecedented extreme events, such as droughts. By providing a long-term perspective and enabling the detection of subtle changes over time, accurate TS data can help here and support more accurate predictions of future trends and impacts. Therefore, the use of TS-based approaches can play an important role in informing decision-making processes and promoting sustainable development.
Role for deep-learning (DL) approaches to be adopted for explorative analysis and support system understanding. Classical RS data analysis methods for vegetation monitoring (including productivity studies) usually require (manual) selection of appropriate features from the input data, for instance, spectral indices, texture metrics, or temporal segments. The abundance of ways to derive such variables makes it difficult to find the most effective set of predictors for the automated identification of disturbances in vegetation productivity. Deep learning (DL) has been identified as a powerful method that can learn the most appropriate data transformations to get the most relevant data features for solving a specific problem (Kattenborn et al., 2021; Cherif et al., 2023). However, a key condition is the availability of a large training dataset, i.e. if the dataset is small, then conventional ML methods may be more suitable. For analysing data streams of temporal dynamics, recurrent neural networks (RNNs) are of particular interest because they can recognize temporal patterns regardless of data gaps due to missing images or cloud cover. Similar to convolutional neural networks (CNNs) for spatial patterns, RNNs make a selection of temporal features (e.g. trend, phenological indicators) obsolete (Kattenborn et al., 2021). A combination of RNN and CNN potentially enables an end-to-end processing scheme in the spatial and temporal domain and is considered by some authors a potential game changer in analysing TS data for vegetation applications such as productivity studies (Reichstein et al., 2019). Transformers are an alternative to RNNs that originate from natural language processing. Like RNNs, transformers are designed to process sequential input data, but unlike RNNs, they process the entire input all at once, which allows for more parallelization and reduced training times. Very recently, transformers have started to advance into RS applications (Aleissaee et al., 2023).
6.2 Development of an integrated modelling approach towards the Digital Twin concept
We suggest that vegetation productivity research should focus on the integration of suitable multi-domain radiative transfer models (e.g. SCOPE) with process models (i.e. DVMs) (Moulin et al., 1998; Delécolle et al., 1992) to build Digital Twins of various ecosystems (Berger et al., 2022). This concept of real-time virtual representations allows us to mirror behaviour and states over the lifetimes of ecosystems and thus has the potential to overcome current limitations. Therefore, we should aim to develop a conceptual Digital Twin framework that implies a DVM with a fully integrated RTM for efficient vegetation productivity monitoring using RS TS data streams. Such integrated models directly simulate remotely observed signals based on the status of the underlying DVM at a point in time. This means the coupled DVM–RTM simulates the spectral signatures of the canopy (400 to 2500 nm) as well as SIF emission, along with physiological processes. To effectively assimilate the sensor data, it is necessary to create strategies that consider the varying availability of data from different sensors and sensor modalities over time. These strategies should enable continuous updates to the model, allowing for partial assimilation of variables while maintaining internal constraints and connections to additional variables.
Utilizing DVMs, which offer a continuous sequence of temporal growth dynamics, can be beneficial in identifying anomalies and enhancing the creation of continuous system descriptions. In this regard, incorporating a comprehensive numerical model that assimilates such data represents a significant advancement. Moreover, to accelerate the forward simulations, surrogate models, or emulators can be used to replace some of the more intricate models (Verrelst et al., 2019b). Since DVMs are partly driven by weather variables, they may also allow the integration of weather forecasts and/or climate scenarios in such model designs. This dynamic nature would meet the requirements of a Digital Twin of ecosystems, which besides the representation of the current status also predicts their future behaviour (Verdouw et al., 2021).
Monitoring vegetation productivity is critical for understanding its health and functioning across ecosystems. In recent years, the increasing availability and quality of optical TS data streams resulted in a large-scale use for monitoring vegetation productivity metrics (e.g. GPP, NPP, crop yield, or AGB) for their range of application domains adopting both RS-derived phenological indicators and increasingly more complex integrated modelling approaches. In this review, we identified a vast number of studies that used remotely sensed TS data streams and distinct methods for inferring productivity metrics. These efforts led to valuable insights into vegetation dynamics across ecosystems, including agriculture, forests, grasslands, and others. As the perhaps most urgent topic nowadays, spatially explicit estimation of vegetation productivity is crucial for understanding the role of ecosystems in the carbon cycle. By using satellite data to estimate the amount of carbon stored in vegetation, we can better understand the impact of land use changes (e.g. deforestation) and other human activities on the global carbon balance, and thus climate change. The availability of long-term satellite TS data streams with improved spatial and temporal detail has increased steadily over the past decades. More recently, the emergence of routinely acquired SIF products proved to provide a more direct linkage towards photosynthetic activity and became increasingly integrated into vegetation productivity processing chains. Validation efforts in ensuring the accuracy, robustness, and reliability of RS-based productivity estimates are another essential aspect of the processing chains. Validation can be performed in several ways, including in situ measurements, local sensor networks, and inter-comparisons of available productivity products or models. The definition of harmonized validation strategies is critical to ensure that the methods used to infer productivity from EO data are robust and accurate across various ecosystems and conditions. It also provides confidence in the data and models used to inform management decisions and climate change mitigation strategies. Additionally, we foresee that due to the advancements in artificial intelligence, the processing approaches of TS data streams will diversify, and at the same time the modelling approaches will significantly advance towards holistic processing and representations of vegetation productivity. Our proposed conceptual framework of a Digital Twin aims to address the limitations of existing approaches and may provide more accurate and efficient productivity estimation supporting the management of ecosystems at varying scales.
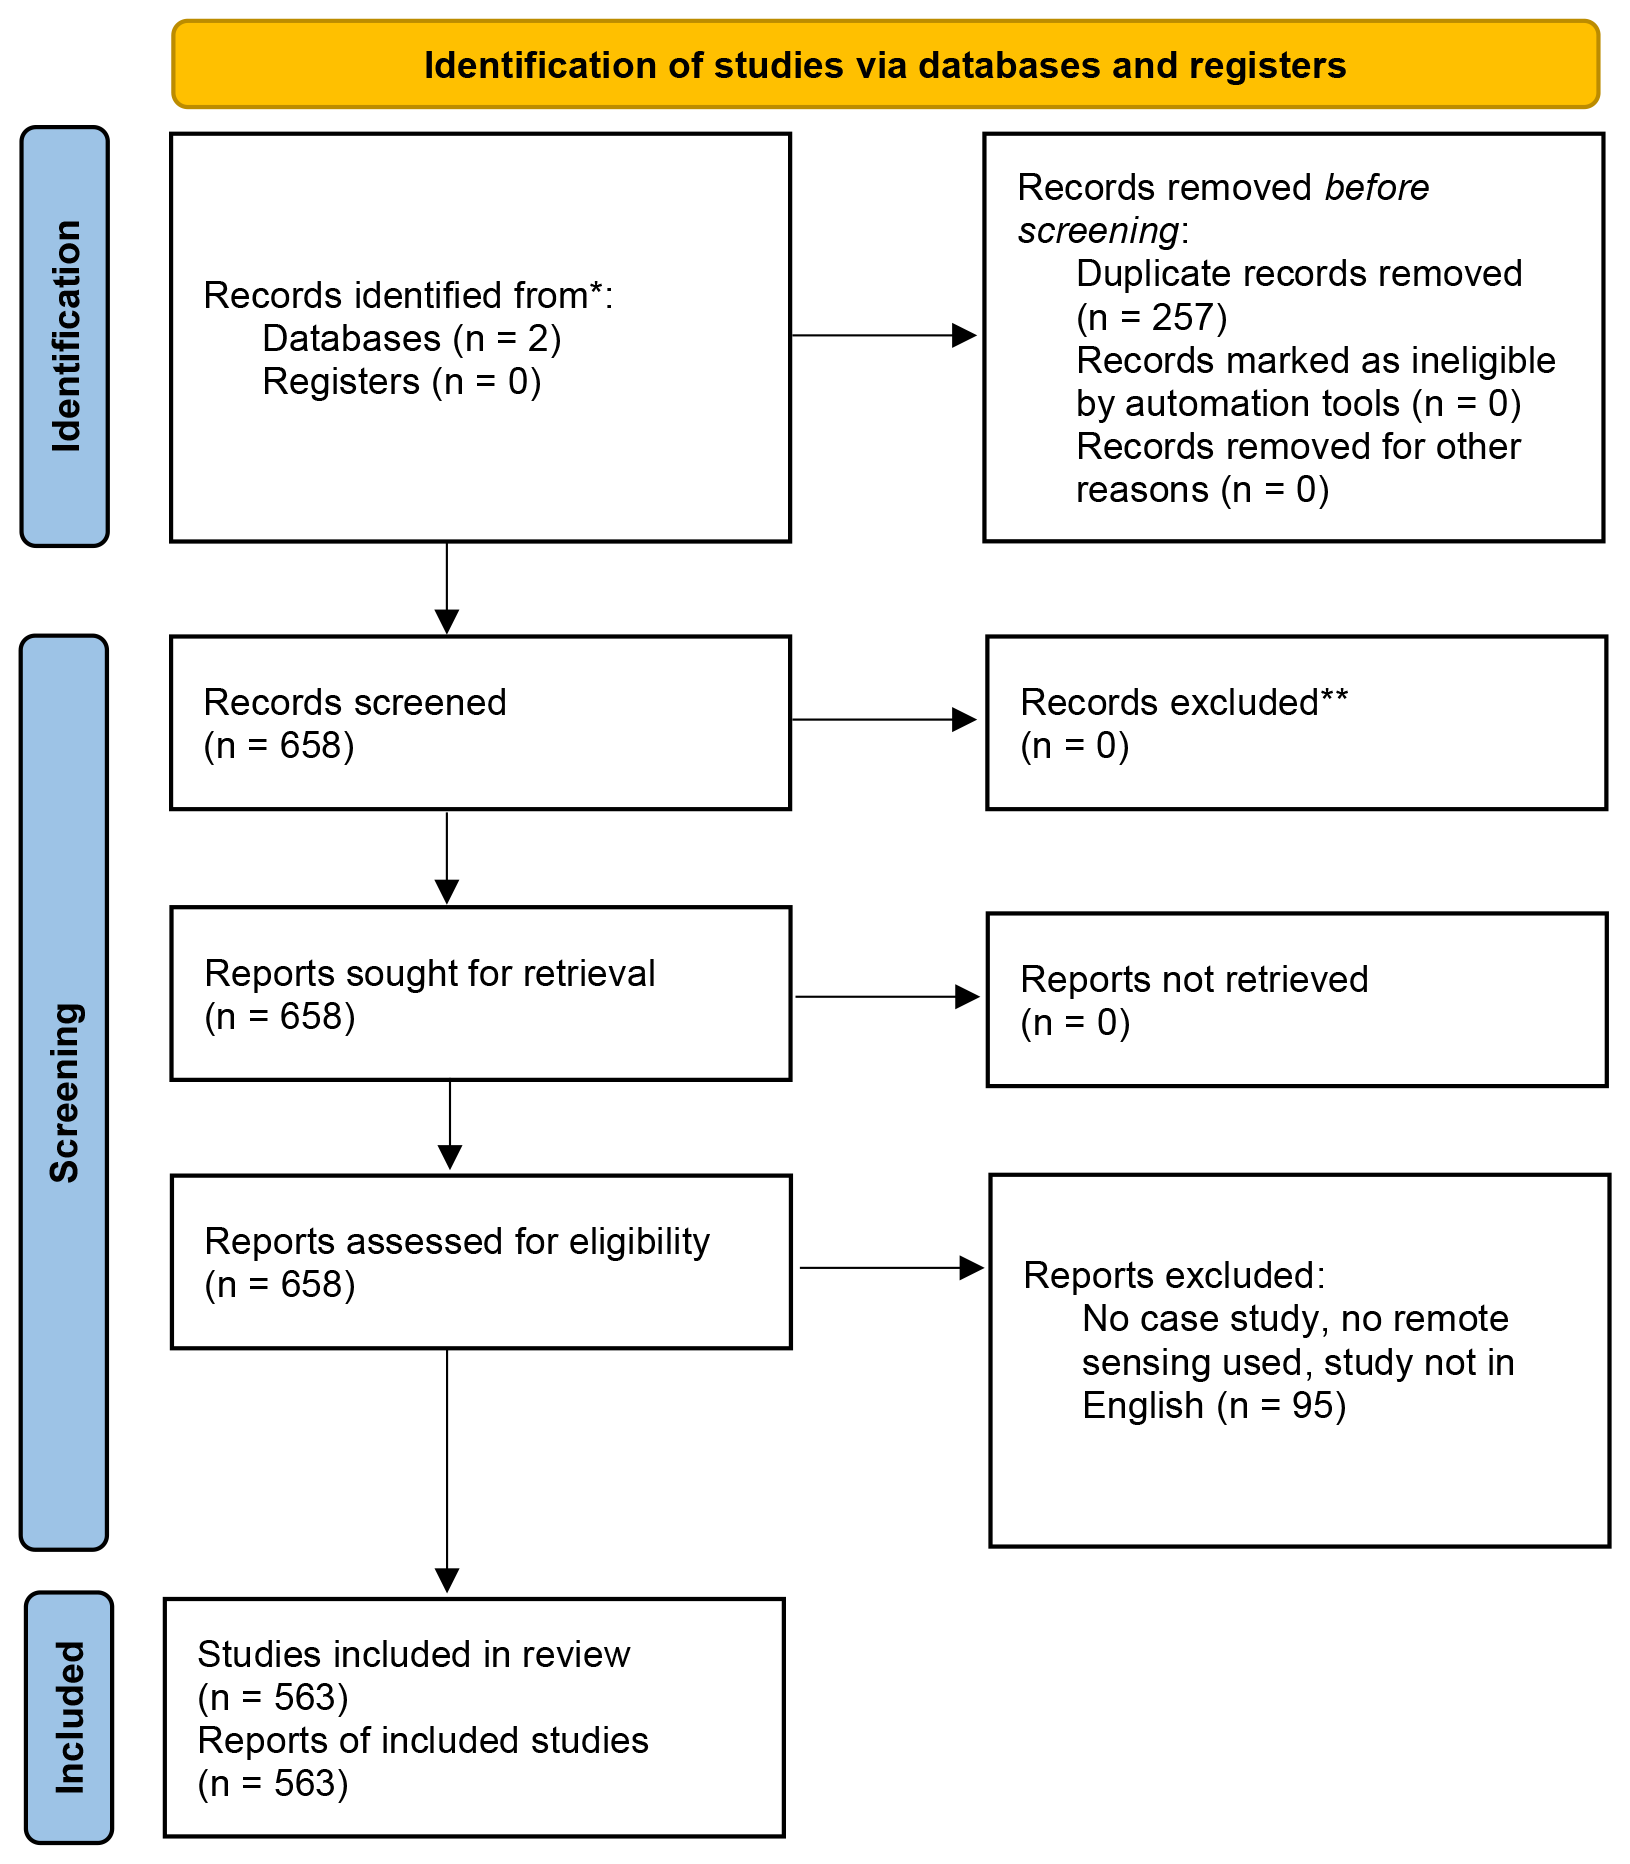
Figure A1Identification of studies via databases and registers according to PRISMA (Page et al., 2021).
The list of selected records from the systematic literature review, extracted information and R code for plotting are available at Zenodo: https://doi.org/10.5281/zenodo.10524851 (Brede et al., 2024).
Conceptualization: LK, KB, MM, MS, BB, JV, HA. Formal analysis: BB, DG, ET, FF, GK, IH, LK, LG, MK MR, MM, OR, RD, SRK, VEG. Investigation: KB, JV, ET, MR, MM. Methodology: LK, KB, HA, JLR, LVG, BB, JV. Software: KB, EP, JV. Supervision: LK, KB, JV, HA, JLR. Visualization: DG, MM, PRM, MS, KB, AH, BB. Writing – original draft: LK, KB, JV, HA, JLR, MM, LVG, BB, CA, VGM, EP, GK, BB, ET, OR, MS, SB, CSF, SRK, PRM. Writing – review and editing: LK, KB, MM, MS, JV, HA, JLR, ZC, LVG, MR, MK, SC, GK, VGM, JP, HC, ETG, MK.
The contact author has declared that none of the authors has any competing interests.
Publisher's note: Copernicus Publications remains neutral with regard to jurisdictional claims made in the text, published maps, institutional affiliations, or any other geographical representation in this paper. While Copernicus Publications makes every effort to include appropriate place names, the final responsibility lies with the authors.
We thank the two reviewers for contributing to the discussion of our manuscript and therefore substantially helping to improve the study. Santiago Belda was partially supported by Generalitat Valenciana (SEJIGENT/2021/001) and the European Union – NextGenerationEU (ZAMBRANO 21-04).
The research was mainly supported by the Action CA17134 SENSECO (Optical synergies for spatiotemporal sensing of scalable ecophysiological traits) funded by COST (Euro10 pean Cooperation in Science and Technology, https://www.cost.eu, last access: 18 October 2023). The research was further funded by the European Research Council (ERC) under the FLEXINEL project (grant no. 101086622). Katja Berger, Pablo Reyes Muñoz, and Jochem Verrelst were funded by the European Union (ERC, 15 FLEXINEL, 101086622).
This paper was edited by Paul Stoy and reviewed by three anonymous referees.
Aasen, H., Honkavaara, E., Lucieer, A., and Zarco-Tejada, P.: Quantitative Remote Sensing at Ultra-High Resolution with UAV Spectroscopy: A Review of Sensor Technology, Measurement Procedures, and Data Correction Workflows, Remote Sens., 10, 1091, https://doi.org/10.3390/rs10071091, 2018. a, b
Abbas, S., Nichol, J. E., and Wong, M. S.: Trends in vegetation productivity related to climate change in China's Pearl River Delta, PLOS ONE, 16, e0245467, https://doi.org/10.1371/journal.pone.0245467, 2021. a
Abdi, A. M., Carrié, R., Sidemo-Holm, W., Cai, Z., Boke-Olén, N., Smith, H. G., Eklundh, L., and Ekroos, J.: Biodiversity decline with increasing crop productivity in agricultural fields revealed by satellite remote sensing, Ecol. Indic., 130, 108098, https://doi.org/10.1016/j.ecolind.2021.108098, 2021. a
Aleissaee, A. A., Kumar, A., Anwer, R. M., Khan, S., Cholakkal, H., Xia, G.-S., and Khan, F. S.: Transformers in Remote Sensing: A Survey, Remote Sens., 15, 1860, https://doi.org/10.3390/rs15071860, 2023. a
Alexandrov, G. A. and Matsunaga, T.: Normative productivity of the global vegetation, Carbon Balance Manage., 3, 1–13, https://doi.org/10.1186/1750-0680-3-8, 2008. a
Ali, A. M., Darvishzadeh, R., Skidmore, A., Gara, T. W., O'Connor, B., Roeoesli, C., Heurich, M., and Paganini, M.: Comparing methods for mapping canopy chlorophyll content in a mixed mountain forest using Sentinel-2 data, Int. J. Appl. Earth Obs., 87, 102037, https://doi.org/10.1016/j.jag.2019.102037, 2020. a
Alvarez-Vanhard, E., Corpetti, T., and Houet, T.: UAV & satellite synergies for optical remote sensing applications: A literature review, Sci. Remote Sens., 3, 100019, https://doi.org/10.1016/j.srs.2021.100019, 2021. a, b
Amin, E., Belda, S., Pipia, L., Szantoi, Z., El Baroudy, A., Moreno, J., and Verrelst, J.: Multi-Season Phenology Mapping of Nile Delta Croplands Using Time Series of Sentinel-2 and Landsat 8 Green LAI, Remote Sens., 14, 1812, https://doi.org/10.3390/rs14081812, 2022. a
Anav, A., Friedlingstein, P., Beer, C., Ciais, P., Harper, A., Jones, C., Murray-Tortarolo, G., Papale, D., Parazoo, N. C., Peylin, P., Piao, S., Sitch, S., Viovy, N., Wiltshire, A., and Zhao, M.: Spatiotemporal patterns of terrestrial gross primary production: A review, Rev. Geophys., 53, 785–818, 2015. a
Arab, S. T., Noguchi, R., Matsushita, S., and Ahamed, T.: Prediction of grape yields from time-series vegetation indices using satellite remote sensing and a machine-learning approach, Remote Sens. Appl. Soc. Environ., 22, 100485, https://doi.org/10.1016/j.rsase.2021.100485, 2021. a
Araya, S., Ostendorf, B., Lyle, G., and Lewis, M.: CropPhenology: An R package for extracting crop phenology from time series remotely sensed vegetation index imagery, Ecol. Inform., 46, 45–56, https://doi.org/10.1016/j.ecoinf.2018.05.006, 2018. a, b
Ardö, J.: Comparison between remote sensing and a dynamic vegetation model for estimating terrestrial primary production of Africa, Carbon Balance Manage., 10, 1–15, https://doi.org/10.1186/s13021-015-0018-5, 2015. a, b, c, d, e
Atkinson, P. M., Jeganathan, C., Dash, J., and Atzberger, C.: Inter-comparison of four models for smoothing satellite sensor time-series data to estimate vegetation phenology, Remote Sens. Environ., 123, 400–417, https://doi.org/10.1016/j.rse.2012.04.001, 2012. a
Atzberger, C.: Advances in remote sensing of agriculture: Context description, existing operational monitoring systems and major information needs, Remote Sens., 5, 949–981, 2013. a
Atzberger, C. and Eilers, P. H.: A time series for monitoring vegetation activity and phenology at 10-daily time steps covering large parts of South America, Int. J. Digit. Earth, 4, 365–386, 2011a. a
Atzberger, C. and Eilers, P. H.: A time series for monitoring vegetation activity and phenology at 10-daily time steps covering large parts of South America, Int. J. Digit. Earth, 4, 365–386, 2011b. a
Atzberger, C., Richter, K., Vuolo, F., Darvishzadeh, R., and Schlerf, M.: Why confining to vegetation indices? Exploiting the potential of improved spectral observations using radiative transfer models, in: Remote Sensing for Agriculture, Ecosystems, and Hydrology XIII, Vol. 8174, 263–278, SPIE, https://doi.org/10.1117/12.898479, 2011. a
Atzberger, C., Klisch, A., Mattiuzzi, M., and Vuolo, F.: Phenological Metrics Derived over the European Continent from NDVI3g Data and MODIS Time Series, Remote Sens., 6, 257–284, https://doi.org/10.3390/rs6010257, 2013. a
Atzberger, C., Darvishzadeh, R., Immitzer, M., Schlerf, M., Skidmore, A., and le Maire, G.: Comparative analysis of different retrieval methods for mapping grassland leaf area index using airborne imaging spectroscopy, Int. J. Appl. Earth Obs., 43, 19–31, https://doi.org/10.1016/j.jag.2015.01.009, 2015. a
Azzari, G., Jain, M., and Lobell, D. B.: Towards fine resolution global maps of crop yields: Testing multiple methods and satellites in three countries, Remote Sens. Environ., 202, 129–141, https://doi.org/10.1016/j.rse.2017.04.014, 2017. a
Bach, H. and Mauser, W.: Methods and examples for remote sensing data assimilation in land surface process modeling, IEEE Trans. Geosci. Remote Sens., 41, 1629–1637, https://doi.org/10.1109/TGRS.2003.813270, 2003. a
Badeck, F.-W., Bondeau, A., Böttcher, K., Doktor, D., Lucht, W., and Schaber, J.: Responses of spring phenology to climate change, New Phytol., 162, 295–309, https://doi.org/10.1111/j.1469-8137.2004.01059.x, 2004. a
Baldocchi, D., Falge, E., Gu, L., Olson, R., Hollinger, D., Running, S., Anthoni, P., Bernhofer, C., Davis, K., Evans, R., Fuentes, J., Goldstein, A., Katul, G., Law, B., Lee, X., Malhi, Y., Meyers, T., Munger, W., Oechel, W., Paw U, Pilegaard, K.T.K., Schmid, H.P., Valentini, R., Verma, S., Vesala, T., Wilson, K., and Wofsy, S.: FLUXNET: A new tool to study the temporal and spatial variability of ecosystem-scale carbon dioxide, water vapor, and energy flux densities, Bull. Am. Meteorol. Soc., 82, 2415–2434, 2001. a, b
Baldocchi, D. D.: Assessing the eddy covariance technique for evaluating carbon dioxide exchange rates of ecosystems: Past, present and future, Glob. Change Biol., 9, 479–492, https://doi.org/10.1046/j.1365-2486.2003.00629.x, 2003. a
Balzarolo, M., Boussetta, S., Balsamo, G., Beljaars, A., Maignan, F., Calvet, J.-C., Lafont, S., Barbu, A., Poulter, B., Chevallier, F., Szczypta, C., and Papale, D.: Evaluating the potential of large-scale simulations to predict carbon fluxes of terrestrial ecosystems over a European Eddy Covariance network, Biogeosciences, 11, 2661–2678, https://doi.org/10.5194/bg-11-2661-2014, 2014. a
Baret, F. and Buis, S.: Estimating Canopy Characteristics from Remote Sensing Observations: Review of Methods and Associated Problems, 173–201, Springer Netherlands, Dordrecht, ISBN 978-1-4020-6450-0, https://doi.org/10.1007/978-1-4020-6450-0_7, 2008. a, b
Baret, F., Weiss, M., Troufleau, D., Prevot, L., and Combal, B.: Maximum information exploitation for canopy characterization by remote sensing, Aspect. Appl. Biol., 71–82, https://www.cabdirect.org/cabdirect/abstract/20002402580 (last access: 13 January 2024), 2000. a
Baret, F., Hagolle, O., Geiger, B., Bicheron, P., Miras, B., Huc, M., Berthelot, B., Niño, F., Weiss, M., Samain, O., Roujean, J. L., and Leroy, M.: LAI, fAPAR and fCover CYCLOPES global products derived from VEGETATION: Part 1: Principles of the algorithm, Remote Sens. Environ., 110, 275–286, 2007. a
Baret, F., Weiss, M., Lacaze, R., Camacho, F., Makhmara, H., Pacholcyzk, P., and Smets, B.: GEOV1: LAI and FAPAR essential climate variables and FCOVER global time series capitalizing over existing products, Part 1: Principles of development and production, Remote Sens. Environ., 137, 299–309, https://doi.org/10.1016/j.rse.2013.02.030, 2013. a
Battles, J.: Forest Biomass and Primary Productivity – Hubbard Brook Ecosystem Study, https://hubbardbrook.org/online-book-chapter/forest-biomass-and-primary-productivity (last access: 13 January 2024), 2022. a
Beamish, A., Raynolds, M. K., Epstein, H., Frost, G. V., Macander, M. J., Bergstedt, H., Bartsch, A., Kruse, S., Miles, V., Tanis, C. M., Heim, B., Fuchs, M., Chabrillat, S., Shevtsova, I., Verdonen, M., and Wagner, J.: Recent trends and remaining challenges for optical remote sensing of Arctic tundra vegetation: A review and outlook, Remote Sens. Environ., 246, 111872, https://doi.org/10.1016/J.RSE.2020.111872, 2020. a
Beck, P. S., Atzberger, C., Høgda, K. A., Johansen, B., and Skidmore, A. K.: Improved monitoring of vegetation dynamics at very high latitudes: A new method using MODIS NDVI, Remote Sens. Environ., 100, 321–334, https://doi.org/10.1016/j.rse.2005.10.021, 2006. a, b, c
Beck, P. S., Jönsson, P., Høgda, K. A., Karlsen, S. R., Eklundh, L., and Skidmore, A. K.: A ground-validated NDVI dataset for monitoring vegetation dynamics and mapping phenology in Fennoscandia and the Kola peninsula, Int. J. Remote Sens., 28, 4311–4330, https://doi.org/10.1080/01431160701241936, 2007. a
Beer, C., Reichstein, M., Tomelleri, E., Ciais, P., Jung, M., Carvalhais, N., Rödenbeck, C., Arain, M. A., Baldocchi, D., Bonan, G. B., Bondeau, A., Cescatti, A., Lasslop, G., Lindroth, A., Lomas, M., Luyssaert, S., Margolis, H., Oleson, K. W., Roupsard, O., Veenendaal, E., Viovy, N., Williams, C., Woodward, F. I., and Papale, D.: Terrestrial gross carbon dioxide uptake: global distribution and covariation with climate, Science, 329, 834–838, https://doi.org/10.1126/science.1184984, 2010. a, b
Belda, S., Pipia, L., Morcillo-Pallarés, P., Rivera-Caicedo, J. P., Amin, E., De Grave, C., and Verrelst, J.: DATimeS: A machine learning time series GUI toolbox for gap-filling and vegetation phenology trends detection, Environ. Model. Softw., 127, 104666, https://doi.org/10.1016/j.envsoft.2020.104666, 2020a. a, b, c
Belda, S., Pipia, L., Morcillo-Pallarés, P., and Verrelst, J.: Optimizing Gaussian Process Regression for Image Time Series Gap-Filling and Crop Monitoring, Agronomy, 10, 618, https://doi.org/10.3390/agronomy10050618, 2020b. a
Berger, K., Rivera Caicedo, J. P., Martino, L., Wocher, M., Hank, T., and Verrelst, J.: A Survey of Active Learning for Quantifying Vegetation Traits from Terrestrial Earth Observation Data, Remote Sens., 13, 287, https://doi.org/10.3390/rs13020287, 2021. a
Berger, K., Machwitz, M., Kycko, M., Kefauver, S. C., Van Wittenberghe, S., Gerhards, M., Verrelst, J., Atzberger, C., Van der Tol, C., Damm, A., Rascher, U., Herrmann, I., Paz, V. S., Fahrner, S., Pieruschka, R., Prikaziuk, E., Buchaillot, M. L., Halabuk, A., and Schlerf, M.: Multi-sensor spectral synergies for crop stress detection and monitoring in the optical domain: A review, Remote Sens. Environ., 280, 113198, https://doi.org/10.1016/j.rse.2022.113198, 2022. a, b
Berger, M., Moreno, J., Johannessen, J., Levelt, P., and Hanssen, R.: ESA's sentinel missions in support of Earth system science, Remote Sens. Environ., 120, 84–90, 2012. a
Berni, J. A. J., Zarco-Tejada, P. J., Suarez, L., and Fereres, E.: Thermal and Narrowband Multispectral Remote Sensing for Vegetation Monitoring From an Unmanned Aerial Vehicle, IEEE Trans. Geosci. Remote Sens., 47, 722–738, https://doi.org/10.1109/TGRS.2008.2010457, 2009. a
Berra, E. F. and Gaulton, R.: Remote sensing of temperate and boreal forest phenology: A review of progress, challenges and opportunities in the intercomparison of in-situ and satellite phenological metrics, Forest Ecol. Manag., 480, 118663, https://doi.org/10.1016/j.foreco.2020.118663, 2021. a
Bi, W., He, W., Zhou, Y., Ju, W., Liu, Y., Liu, Y., Zhang, X., Wei, X., and Cheng, N.: A global 0.05 dataset for gross primary production of sunlit and shaded vegetation canopies from 1992 to 2020, Sci. Data, 9, 213, https://doi.org/10.1038/s41597-022-01309-2, 2022. a
Boisvenue, C., Smiley, B. P., White, J. C., Kurz, W. A., and Wulder, M. A.: Integration of Landsat time series and field plots for forest productivity estimates in decision support models, Forest Ecol. Manag., 376, 284–297, https://doi.org/10.1016/j.foreco.2016.06.022, 2016. a, b, c
Bolton, D. K., Gray, J. M., Melaas, E. K., Moon, M., Eklundh, L., and Friedl, M. A.: Continental-scale land surface phenology from harmonized Landsat 8 and Sentinel-2 imagery, Remote Sens. Environ., 240, 111685, https://doi.org/10.1016/J.RSE.2020.111685, 2020. a, b
Bonan, G. B., Levis, S., Sitch, S., Vertenstein, M., and Oleson, K. W.: A dynamic global vegetation model for use with climate models: concepts and description of simulated vegetation dynamics, Glob. Change Biol., 9, 1543–1566, https://doi.org/10.1046/j.1365-2486.2003.00681.x, 2003. a
Borra-Serrano, I., De Swaef, T., Quataert, P., Aper, J., Saleem, A., Saeys, W., Somers, B., Roldán-Ruiz, I., and Lootens, P.: Closing the phenotyping gap: High resolution UAV time series for soybean growth analysis provides objective data from field trials, Remote Sens., 12, 1644, https://doi.org/10.3390/rs12101644, 2020. a
Brede, B., Darvishzadeh, R., Fluit, F., Ganeva, D., García Millán, V., Graf, L., Hermann, I., Karlsen, S.R., Kooistra, L., Koren, G., Kycko, M., Machwitz, M., Rautiainen, M., Rozenstein, O., and Tomelleri, E.: Data and analysis for “Reviews and syntheses: Remotely sensed optical time series for monitoring vegetation productivity”, Zenodo [data set and code], https://doi.org/10.5281/zenodo.10524851, 2024. a
Brinckmann, S., Trentmann, J., and Ahrens, B.: Homogeneity Analysis of the CM SAF Surface Solar Irradiance Dataset Derived from Geostationary Satellite Observations, Remote Sens., 6, 352–378, https://doi.org/10.3390/rs6010352, 2013. a
Brinkmann, K., Dickhoefer, U., Schlecht, E., and Buerkert, A.: Quantification of aboveground rangeland productivity and anthropogenic degradation on the Arabian Peninsula using Landsat imagery and field inventory data, Remote Sens. Environ., 115, 465–474, https://doi.org/10.1016/j.rse.2010.09.016, 2011. a, b
Brunori, E., Farina, R., and Biasi, R.: Sustainable viticulture: The carbon-sink function of the vineyard agro-ecosystem, Agr. Ecosyst. Environ., 223, 10–21, https://doi.org/10.1016/j.agee.2016.02.012, 2016. a
Buitink, J., Swank, A. M., van der Ploeg, M., Smith, N. E., Benninga, H.-J. F., van der Bolt, F., Carranza, C. D. U., Koren, G., van der Velde, R., and Teuling, A. J.: Anatomy of the 2018 agricultural drought in the Netherlands using in situ soil moisture and satellite vegetation indices, Hydrol. Earth Syst. Sci., 24, 6021–6031, https://doi.org/10.5194/hess-24-6021-2020, 2020. a
Bultan, S., Nabel, J. E. M. S., Hartung, K., Ganzenmüller, R., Xu, L., Saatchi, S., and Pongratz, J.: Tracking 21st century anthropogenic and natural carbon fluxes through model-data integration, Nat. Commun., 13, 1–14, https://doi.org/10.1038/s41467-022-32456-0, 2022. a, b
Caballero, G., Pezzola, A., Winschel, C., Sanchez Angonova, P., Casella, A., Orden, L., Salinero-Delgado, M., Reyes-Muñoz, P., Berger, K., Delegido, J., and Verrelst, J.: Synergy of Sentinel-1 and Sentinel-2 Time Series for Cloud-Free Vegetation Water Content Mapping with Multi-Output Gaussian Processes, Remote Sens., 15, 1822, https://doi.org/10.3390/rs15071822, 2023. a, b
Cai, Z., Junttila, S., Holst, J., Jin, H., Ardö, J., Ibrom, A., Peichl, M., Mölder, M., Jönsson, P., Rinne, J., Karamihalaki, M., and Eklundh, L.: Modelling daily gross primary productivity with sentinel-2 data in the nordic region – comparison with data from MODIS, Remote Sens., 13, 1–18, https://doi.org/10.3390/RS13030469, 2021. a, b
Campbell, A. D., Fatoyinbo, T., Charles, S. P., Bourgeau-Chavez, L. L., Goes, J., Gomes, H., Halabisky, M., Holmquist, J., Lohrenz, S., Mitchell, C., Moskal, L. M., Poulter, B., Qiu, H., De Sousa, C. H. R., Sayers, M., Simard, M., Stewart, A. J., Singh, D., Trettin, C., Wu, J., Zhang, X., and Lagomasino, D.: A review of carbon monitoring in wet carbon systems using remote sensing, Environ. Res. Lett., 17, 025009, https://doi.org/10.1088/1748-9326/ac4d4d, 2022. a
Caparros-Santiago, J. A., Rodriguez-Galiano, V., and Dash, J.: Land surface phenology as indicator of global terrestrial ecosystem dynamics: A systematic review, ISPRS J. Photogramm. Remote Sens., 171, 330–347, https://doi.org/10.1016/j.isprsjprs.2020.11.019, 2021. a, b
Carletto, C., Jolliffe, D., and Banerjee, R.: From Tragedy to Renaissance: Improving Agricultural Data for Better Policies, J. Dev. Stud., 51, 133–148, https://doi.org/10.1080/00220388.2014.968140, 2015. a
Cavender-Bares, J., Gamon, J. A., and Townsend, P. A. (Eds.): Remote Sensing of Plant Biodiversity, Springer International Publishing, ISBN 978-3-030-33156-6, https://doi.org/10.1007/978-3-030-33157-3, 2020. a
Ceccato, P., Flasse, S., Tarantola, S., Jacquemoud, S., and Grégoire, J.-M.: Detecting vegetation leaf water content using reflectance in the optical domain, Remote Sens. Environ., 77, 22–33, https://doi.org/10.1016/S0034-4257(01)00191-2, 2001. a
Chen, J., Jönsson, P., Tamura, M., Gu, Z., Matsushita, B., and Eklundh, L.: A simple method for reconstructing a high-quality NDVI time-series data set based on the Savitzky–Golay filter, Remote Sens. Environ., 91, 332–344, 2004. a
Chen, S., Sui, L., Liu, L., and Liu, X.: Effect of the Partitioning of Diffuse and Direct APAR on GPP Estimation, Remote Sens., 14, 57 https://doi.org/10.3390/rs14010057, 2022. a
Cheng, T., Riaño, D., and Ustin, S. L.: Detecting diurnal and seasonal variation in canopy water content of nut tree orchards from airborne imaging spectroscopy data using continuous wavelet analysis, Remote Sens. Environ., 143, 39–53, https://doi.org/10.1016/j.rse.2013.11.018, 2014a. a
Cheng, Y.-B., Zhang, Q., Lyapustin, A. I., Wang, Y., and Middleton, E. M.: Impacts of light use efficiency and fPAR parameterization on gross primary production modeling, Agr. Forest Meteorol., 189, 187–197, 2014b. a
Cherif, E., Feilhauer, H., Berger, K., Dao, P. D., Ewald, M., Hank, T. B., He, Y., Kovach, K. R., Lu, B., Townsend, P. A., and Kattenborn, T.: From spectra to plant functional traits: Transferable multi-trait models from heterogeneous and sparse data, Remote Sens. Environ., 292, 113580, https://doi.org/10.1016/j.rse.2023.113580, 2023. a
Chevrel, M., Courtois, M., and Weill, G.: The SPOT satellite remote sensing mission, Photogramm. Eng. Remote S., 47, 1163–1171, 1981. a
Chopping, M., Schaaf, C. B., Zhao, F., Wang, Z., Nolin, A. W., Moisen, G. G., Martonchik, J. V., and Bull, M.: Forest structure and aboveground biomass in the southwestern United States from MODIS and MISR, Remote Sens. Environ., 115, 2943–2953, https://doi.org/10.1016/j.rse.2010.08.031, 2011. a
Chu, H., Baldocchi, D. D., John, R., Wolf, S., and Reichstein, M.: Fluxes all of the time? A primer on the temporal representativeness of FLUXNET, J. Geophys. Res.-Biogeo., 122, 289–307, https://doi.org/10.1002/2016JG003576, 2017. a, b
Claverie, M., Ju, J., Masek, J. G., Dungan, J. L., Vermote, E. F., Roger, J.-C., Skakun, S. V., and Justice, C.: The Harmonized Landsat and Sentinel-2 surface reflectance data set, Remote Sens. Environ., 219, 145–161, https://doi.org/10.1016/j.rse.2018.09.002, 2018. a
Croft, H., Chen, J. M., and Zhang, Y.: Temporal disparity in leaf chlorophyll content and leaf area index across a growing season in a temperate deciduous forest, Int. J. Appl. Earth Obs. Geoinf., 33, 312–320, https://doi.org/10.1016/j.jag.2014.06.005, 2014. a
Croft, H., Chen, J. M., Froelich, N. J., Chen, B., and Staebler, R. M.: Seasonal controls of canopy chlorophyll content on forest carbon uptake: Implications for GPP modeling, J. Geophys. Res.-Biogeo., 120, 1576–1586, https://doi.org/10.1002/2015JG002980, 2015. a
Croft, H., Chen, J. M., Luo, X., Bartlett, P., Chen, B., and Staebler, R. M.: Leaf chlorophyll content as a proxy for leaf photosynthetic capacity, Glob. Change Biol., 23, 3513–3524, https://doi.org/10.1111/gcb.13599, 2017. a
Croft, H., Chen, J., Wang, R., Mo, G., Luo, S., Luo, X., He, L., Gonsamo, A., Arabian, J., Zhang, Y., Simic-Milas, A., Noland, T.L., He, Y., Homolová, L., Malenovský, Z., Yi, Q., Beringer, J., Amiri, R., Hutley, L., Arellano, P., Stahl, C., and Bonal, D.: The global distribution of leaf chlorophyll content, Remote Sens. Environ., 236, 111479, https://doi.org/10.1016/j.rse.2019.111479, 2020. a, b
Damm, A., Guanter, L., Paul-Limoges, E., Van der Tol, C., Hueni, A., Buchmann, N., Eugster, W., Ammann, C., and Schaepman, M. E.: Far-red sun-induced chlorophyll fluorescence shows ecosystem-specific relationships to gross primary production: An assessment based on observational and modeling approaches, Remote Sens. Environ., 166, 91–105, https://doi.org/10.1016/j.rse.2015.06.004, 2015. a, b
Danner, M., Berger, K., Wocher, M., Mauser, W., and Hank, T.: Efficient RTM-based training of machine learning regression algorithms to quantify biophysical and biochemical traits of agricultural crops, ISPRS J. Photogramm. Remote Sens., 173, 278–296, https://doi.org/10.1016/j.isprsjprs.2021.01.017, 2021. a
Darvishzadeh, R., Skidmore, A., Atzberger, C., and van Wieren, S.: Estimation of vegetation LAI from hyperspectral reflectance data: Effects of soil type and plant architecture, Int. J. Appl. Earth Obs. Geoinf., 10, 358–373, https://doi.org/10.1016/j.jag.2008.02.005, 2008. a
Darvishzadeh, R., Atzberger, C., Skidmore, A., and Schlerf, M.: Mapping grassland leaf area index with airborne hyperspectral imagery: A comparison study of statistical approaches and inversion of radiative transfer models, ISPRS J. Photogramm. Remote Sens., 66, 894–906, https://doi.org/10.1016/j.isprsjprs.2011.09.013, 2011. a
Dash, J. P., Pearse, G. D., and Watt, M. S.: UAV Multispectral Imagery Can Complement Satellite Data for Monitoring Forest Health, Remote Sens., 10, 1216, https://doi.org/10.3390/rs10081216, 2018. a
De Beurs, K. M. and Henebry, G. M.: Land surface phenology, climatic variation, and institutional change: Analyzing agricultural land cover change in Kazakhstan, Remote Sens. Environ., 89, 497–509, 2004. a
Delécolle, R., Maas, S., Guérif, M., and Baret, F.: Remote sensing and crop production models: present trends, ISPRS J. Photogramm., 47, 145–161, https://doi.org/10.1016/0924-2716(92)90030-D, 1992. a, b, c, d
Descals, A., Verger, A., Yin, G., Filella, I., and Peñuelas, J.: Widespread drought‐induced leaf shedding and legacy effects on productivity in European deciduous forests, Remote Sens. Ecol. Conserv., 9, 76–89, https://doi.org/10.1002/rse2.296, 2023. a
De Wit, A., Boogaard, H., Fumagalli, D., Janssen, S., Knapen, R., van Kraalingen, D., Supit, I., van der Wijngaart, R., and van Diepen, K.: 25 years of the WOFOST cropping systems model, Agr. Syst., 168, 154–167, 2019. a
Dong, Y. and Peng, C. Y. J.: Principled missing data methods for researchers, SpringerPlus, 2, 1–17, https://doi.org/10.1186/2193-1801-2-222, 2013. a
Doughty, R., Köhler, P., Frankenberg, C., Magney, T. S., Xiao, X., Qin, Y., Wu, X., and Moore, B.: TROPOMI reveals dry-season increase of solar-induced chlorophyll fluorescence in the Amazon forest, P. Natl. Acad. Sci. USA, 116, 22393–22398, https://doi.org/10.1073/PNAS.1908157116, 2019. a
Drusch, M., Del Bello, U., Carlier, S., Colin, O., Fernandez, V., Gascon, F., Hoersch, B., Isola, C., Laberinti, P., Martimort, P., Meygret, A., Spoto, F., Sy, O., Marchese, F., and Bargellini, P.: Sentinel-2: ESA's Optical High-Resolution Mission for GMES Operational Services, Remote Sens. Environ., 120, 25–36, https://doi.org/10.1016/j.rse.2011.11.026, 2012. a
Duchemin, B. and Courrier, G.: Monitoring Phenological Key Stages and Cycle Duration of Temperate Deciduous Forest Ecosystems with NOAA/AVHRR Data, Remote Sens. Environ., 67, 68–82, https://doi.org/10.1016/S0034-4257(98)00067-4, 1999. a
Dusseux, P., Guyet, T., Pattier, P., Barbier, V., and Nicolas, H.: Monitoring of grassland productivity using Sentinel-2 remote sensing data, Int. J. Appl. Earth Obs. Geoinf., 111, 102843, https://doi.org/10.1016/j.jag.2022.102843, 2022. a, b
Duveiller, G., López-Lozano, R., and Baruth, B.: Enhanced Processing of 1-km Spatial Resolution fAPAR Time Series for Sugarcane Yield Forecasting and Monitoring, Remote Sens., 5, 1091–1116, https://doi.org/10.3390/rs5031091, 2013. a
Eastman, R. J., Sangermano, F., Ghimire, B., Zhu, H., Chen, H., Neeti, N., Cai, Y., Machado, E. A., and Crema, S. C.: Seasonal trend analysis of image time series, Int. J. Remote Sens., 30, 2721–2726, https://doi.org/10.1080/01431160902755338, 2009. a
EEA, E. E. A.: Vegetation productivity, https://www.eea.europa.eu/data-and-maps/indicators/land-productivity-dynamics/assessment (last access: 13 January 2024), 2021. a
Eerens, H., Haesen, D., Rembold, F., Urbano, F., Tote, C., and Bydekerke, L.: Image time series processing for agriculture monitoring, Environ. Model. Softw., 53, 154–162, https://doi.org/10.1016/j.envsoft.2013.10.021, 2014. a, b
Eilers, P. H. C.: A Perfect Smoother, Anal. Chem., 75, 3631–3636, https://doi.org/10.1021/ac034173t, 2003. a
Eitel, J. U., Höfle, B., Vierling, L. A., Abellán, A., Asner, G. P., Deems, J. S., Glennie, C. L., Joerg, P. C., LeWinter, A. L., Magney, T. S., Mandlburger, G., Morton, D. C., and Müller, öand Vierling, K. T.: Beyond 3-D: The new spectrum of lidar applications for earth and ecological sciences, Remote Sens. Environ., 186, 372–392, https://doi.org/10.1016/j.rse.2016.08.018, 2016. a
Elmore, A. J., Guinn, S. M., Minsley, B. J., and Richardson, A. D.: Landscape controls on the timing of spring, autumn, and growing season length in mid-Atlantic forests, Glob. Change Biol., 18, 656–674, 2012. a
Erasmi, S., Klinge, M., Dulamsuren, C., Schneider, F., and Hauck, M.: Modelling the productivity of Siberian larch forests from Landsat NDVI time series in fragmented forest stands of the Mongolian forest-steppe, Environ. Monit. Assess., 193, 1–18, https://doi.org/10.1007/s10661-021-08996-1, 2021. a, b, c
Estevez, J., Berger, K., Vicent, J., Rivera-Caicedo, J. P., Wocher, M., and Verrelst, J.: Top-of-Atmosphere Retrieval of Multiple Crop Traits Using Variational Heteroscedastic Gaussian Processes within a Hybrid Workflow, Remote Sens., 13, 1589, https://doi.org/10.3390/rs13081589, 2021. a
Fang, H., Baret, F., Plummer, S., and Schaepman-Strub, G.: An overview of global leaf area index (LAI): Methods, products, validation, and applications, Rev. Geophys., 57, 739–799, 2019. a
FAO: Forest plantation productivity, Report based on the work of W. J. Libby and C. Palmberg-Lerche, techreport, Forest Resources Development Service, Forest Resources Division, UN Food and Agriculture Organization, https://books.google.nl/books/about/Forest_Plantation_Productivity.html?id=W7o7NQAACAAJ&redir_esc=y (last access: 19 January 2024), 2010. a
FAO: Global Forest Resources Assessment, Tech. Rep., U.N. Food and Agriculture Organization, https://doi.org/10.4060/ca8753en, 2020. a
Feagin, R. A., Forbrich, I., Huff, T. P., Barr, J. G., Ruiz-Plancarte, J., Fuentes, J. D., Najjar, R. G., Vargas, R., Vázquez-Lule, A., Windham-Myers, L., Kroeger, K. D., Ward, E. J., Moore, G. W., Leclerc, M., Krauss, K. W., Stagg, C. L., Alber, M., Knox, S. H., Schäfer, K. V., Bianchi, T. S., Hutchings, J. A., Nahrawi, H., Noormets, A., Mitra, B., Jaimes, A., Hinson, A. L., Bergamaschi, B., King, J. S., and Miao, G.: Tidal Wetland Gross Primary Production Across the Continental United States, 2000–2019, Global Biogeochem. Cy., 34, e2019GB006349, https://doi.org/10.1029/2019GB006349, 2020. a
Fensholt, R., Sandholt, I., Stisen, S., and Tucker, C.: Analysing NDVI for the African continent using the geostationary meteosat second generation SEVIRI sensor, Remote Sens. Environ., 101, 212–229, https://doi.org/10.1016/j.rse.2005.11.013, 2006. a
Fensholt, R., Rasmussen, K., Kaspersen, P., Huber, S., Horion, S., and Swinnen, E.: Assessing land degradation/recovery in the african sahel from long-term earth observation based primary productivity and precipitation relationships, Remote Sens., 5, 664–686, https://doi.org/10.3390/RS5020664, 2013. a
Féret, J. B., François, C., Asner, G. P., Gitelson, A. A., Martin, R. E., Bidel, L. P. R., Ustin, S. L., le Maire, G., and Jacquemoud, S.: PROSPECT-4 and 5: Advances in the leaf optical properties model separating photosynthetic pigments, Remote Sens. Environ., 112, 3030–3043, https://doi.org/10.1016/j.rse.2008.02.012, 2008. a
Féret, J. B., Gitelson, A. A., Noble, S. D., and Jacquemoud, S.: PROSPECT-D: Towards modeling leaf optical properties through a complete lifecycle, Remote Sens. Environ., 193, 204–215, https://doi.org/10.1016/j.rse.2017.03.004, 2017. a
Field, C. B., Behrenfeld, M. J., Randerson, J. T., and Falkowski, P.: Primary Production of the Biosphere: Integrating Terrestrial and Oceanic Components, Science, 281, 237–240, https://doi.org/10.1126/science.281.5374.237, 1998. a
Fiore, N. M., Goulden, M. L., Czimczik, C. I., Pedron, S. A., and Tayo, M. A.: Do recent NDVI trends demonstrate boreal forest decline in Alaska?, Environ. Res. Lett., 15, 095007, https://doi.org/10.1088/1748-9326/AB9C4C, 2020. a, b
Fischer, A., Kergoat, L., and Dedieu, G.: Coupling satellite data with vegetation functional models: Review of different approaches and perspectives suggested by the assimilation strategy, Remote Sens. Rev., 15, 283–303, https://doi.org/10.1080/02757259709532343, 1997. a
Fisher, J. I., Mustard, J. F., and Vadeboncoeur, M. A.: Green leaf phenology at Landsat resolution: Scaling from the field to the satellite, Remote Sens. Environ., 100, 265–279, 2006. a
Frankenberg, C., Fisher, J. B., Worden, J., Badgley, G., Saatchi, S. S., Lee, J.-E., Toon, G. C., Butz, A., Jung, M., Kuze, A., and Yokota, T.: New global observations of the terrestrial carbon cycle from GOSAT: Patterns of plant fluorescence with gross primary productivity, Geophys. Res. Lett., 38, L17706, https://doi.org/10.1029/2011GL048738, 2011. a, b
Friedlingstein, P., O'Sullivan, M., Jones, M. W., Andrew, R. M., Gregor, L., Hauck, J., Le Quéré, C., Luijkx, I. T., Olsen, A., Peters, G. P., Peters, W., Pongratz, J., Schwingshackl, C., Sitch, S., Canadell, J. G., Ciais, P., Jackson, R. B., Alin, S. R., Alkama, R., Arneth, A., Arora, V. K., Bates, N. R., Becker, M., Bellouin, N., Bittig, H. C., Bopp, L., Chevallier, F., Chini, L. P., Cronin, M., Evans, W., Falk, S., Feely, R. A., Gasser, T., Gehlen, M., Gkritzalis, T., Gloege, L., Grassi, G., Gruber, N., Gürses, Ö., Harris, I., Hefner, M., Houghton, R. A., Hurtt, G. C., Iida, Y., Ilyina, T., Jain, A. K., Jersild, A., Kadono, K., Kato, E., Kennedy, D., Klein Goldewijk, K., Knauer, J., Korsbakken, J. I., Landschützer, P., Lefèvre, N., Lindsay, K., Liu, J., Liu, Z., Marland, G., Mayot, N., McGrath, M. J., Metzl, N., Monacci, N. M., Munro, D. R., Nakaoka, S.-I., Niwa, Y., O'Brien, K., Ono, T., Palmer, P. I., Pan, N., Pierrot, D., Pocock, K., Poulter, B., Resplandy, L., Robertson, E., Rödenbeck, C., Rodriguez, C., Rosan, T. M., Schwinger, J., Séférian, R., Shutler, J. D., Skjelvan, I., Steinhoff, T., Sun, Q., Sutton, A. J., Sweeney, C., Takao, S., Tanhua, T., Tans, P. P., Tian, X., Tian, H., Tilbrook, B., Tsujino, H., Tubiello, F., van der Werf, G. R., Walker, A. P., Wanninkhof, R., Whitehead, C., Willstrand Wranne, A., Wright, R., Yuan, W., Yue, C., Yue, X., Zaehle, S., Zeng, J., and Zheng, B.: Global Carbon Budget 2022, Earth Syst. Sci. Data, 14, 4811–4900, https://doi.org/10.5194/essd-14-4811-2022, 2022. a
Gamon, J., Rahman, A., Dungan, J., Schildhauer, M., and Huemmrich, K.: Spectral Network (SpecNet) – What is it and why do we need it?, Remote Sens. Environ., 103, 227–235, https://doi.org/10.1016/j.rse.2006.04.003, 2006. a
Gamon, J. A., Coburn, C., Flanagan, L. B., Huemmrich, K. F., Kiddle, C., Sanchez-Azofeifa, G. A., Thayer, D. R., Vescovo, L., Gianelle, D., Sims, D. A., Rahman, A. F., and Pastorello, G. Z.: SpecNet revisited: bridging flux and remote sensing communities, Can. J. Remote Sens., 36, S376–S390, https://doi.org/10.5589/m10-067, 2010. a
Gao, L., Darvishzadeh, R., Somers, B., Johnson, B. A., Wang, Y., Verrelst, J., Wang, X., and Atzberger, C.: Hyperspectral response of agronomic variables to background optical variability: Results of a numerical experiment, Agr. Forest Meteorol., 326, 109178, https://doi.org/10.1016/j.agrformet.2022.109178, 2022. a
Gao, T., Xu, B., Yang, X., Deng, S., Liu, Y., Jin, Y., Ma, H., Li, J., Yu, H., Zheng, X., and Yu, Q.: Aboveground net primary productivity of vegetation along a climate-related gradient in a Eurasian temperate grassland: spatiotemporal patterns and their relationships with climate factors, Environ. Earth Sci., 76, 56, https://doi.org/10.1007/S12665-016-6158-4, 2017. a
Georganos, S., Abdi, A. M., Tenenbaum, D. E., and Kalogirou, S.: Examining the NDVI-rainfall relationship in the semi-arid Sahel using geographically weighted regression, J. Arid Environ., 146, 64–74, https://doi.org/10.1016/j.jaridenv.2017.06.004, 2017. a
Getachew Mengistu, A., Mengistu Tsidu, G., Koren, G., Kooreman, M. L., Folkert Boersma, K., Tagesson, T., Ardö, J., Nouvellon, Y., and Peters, W.: Sun-induced fluorescence and near-infrared reflectance of vegetation track the seasonal dynamics of gross primary production over Africa, Biogeosciences, 18, 2843–2857, https://doi.org/10.5194/bg-18-2843-2021, 2021. a
Gevaert, C. M., Suomalainen, J., Tang, J., and Kooistra, L.: Generation of Spectral-Temporal Response Surfaces by Combining Multispectral Satellite and Hyperspectral UAV Imagery for Precision Agriculture Applications, IEEE J. Sel. Top. Appl., 8, 3140–3146, https://doi.org/10.1109/JSTARS.2015.2406339, 2015. a
Gitelson, A. A., Verma, S. B., Viña, A., Rundquist, D. C., Keydan, G., Leavitt, B., Arkebauer, T. J., Burba, G. G., and Suyker, A. E.: Novel technique for remote estimation of CO2 flux in maize, Geophys. Res. Lett., 30, 1486, https://doi.org/10.1029/2002GL016543, 2003. a
Gitelson, A. A., Peng, Y., Arkebauer, T. J., and Schepers, J.: Relationships between gross primary production, green LAI, and canopy chlorophyll content in maize: Implications for remote sensing of primary production, Remote Sens. Environ., 144, 65–72, https://doi.org/10.1016/j.rse.2014.01.004, 2014. a
Gitelson, A. A., Peng, Y., Arkebauer, T. J., and Suyker, A. E.: Productivity, absorbed photosynthetically active radiation, and light use efficiency in crops: Implications for remote sensing of crop primary production, J. Plant Physiol., 177, 100–109, https://doi.org/10.1016/j.jplph.2014.12.015, 2015. a
Gobron, N., Pinty, B., Aussedat, O., Chen, J. M., Cohen, W. B., Fensholt, R., Gond, V., Huemmrich, K. F., Lavergne, T., Mélin, F., Privette, J. L., Sandholt, I., Taberner, M., Turner, D. P., Verstraete, M. M., and Widlowski, J.: Evaluation of fraction of absorbed photosynthetically active radiation products for different canopy radiation transfer regimes: Methodology and results using Joint Research Center products derived from SeaWiFS against ground-based estimations, J. Geophys. Res.-Atmos., 111, D13110, https://doi.org/10.1029/2005JD006511, 2006. a
Goetz, S. J., Baccini, A., Laporte, N. T., Johns, T., Walker, W., Kellndorfer, J., Houghton, R. A., and Sun, M.: Mapping and monitoring carbon stocks with satellite observations: a comparison of methods, Carbon Balance Manag., 4, 2, https://doi.org/10.1186/1750-0680-4-2, 2009. a
Gorelick, N., Hancher, M., Dixon, M., Ilyushchenko, S., Thau, D., and Moore, R.: Google Earth Engine: Planetary-scale geospatial analysis for everyone, Remote Sens. Environ., 202, 18–27, https://doi.org/10.1016/j.rse.2017.06.031, 2017. a
Goudriaan, J. and Monteith, J. L.: A Mathematical Function for Crop Growth Based on Light Interception and Leaf Area Expansion, Ann. Bot., 66, 695–701, https://doi.org/10.1093/oxfordjournals.aob.a088084, 1990. a
Graf, L. V., Gorroño, J., Hueni, A., Walter, A., and Aasen, H.: Propagating Sentinel-2 Top-of-Atmosphere Radiometric Uncertainty Into Land Surface Phenology Metrics Using a Monte Carlo Framework, IEEE J. Sel. Top. Appl., 16, 8632–8654, https://doi.org/10.1109/JSTARS.2023.3297713, 2023. a
Grelle, A., Hedwall, P.-O., Strömgren, M., Håkansson, C., and Bergh, J.: From source to sink – recovery of the carbon balance in young forests, Agr. Forest Meteorol., 330, 109290, https://doi.org/10.1016/j.agrformet.2022.109290, 2023. a
Guanter, L., Frankenberg, C., Dudhia, A., Lewis, P. E., Gómez-Dans, J., Kuze, A., Suto, H., and Grainger, R. G.: Retrieval and global assessment of terrestrial chlorophyll fluorescence from GOSAT space measurements, Remote Sens. Environ., 121, 236–251, https://doi.org/10.1016/j.rse.2012.02.006, 2012. a, b
Guo, C., Tang, Y., Lu, J., Zhu, Y., Cao, W., Cheng, T., Zhang, L., and Tian, Y.: Predicting wheat productivity: Integrating time series of vegetation indices into crop modeling via sequential assimilation, Agr. Forest Meteorol., 272/273, 69–80, https://doi.org/10.1016/j.agrformet.2019.01.023, 2019. a
Gutman, G. G.: On the use of long-term global data of land reflectances and vegetation indices derived from the advanced very high resolution radiometer, J. Geophys. Res.-Atmos., 104, 6241–6255, https://doi.org/10.1029/1998JD200106, 1999. a
Haddaway, N. R., Hedlund, K., Jackson, L. E., Kätterer, T., Lugato, E., Thomsen, I. K., Jørgensen, H. B., and Isberg, P.-E.: How does tillage intensity affect soil organic carbon? A systematic review, Environ. Evid., 6, 1–48, https://doi.org/10.1186/s13750-017-0108-9, 2017. a
Hank, T. B., Bach, H., and Mauser, W.: Using a Remote Sensing-Supported Hydro-Agroecological Model for Field-Scale Simulation of Heterogeneous Crop Growth and Yield: Application for Wheat in Central Europe, Remote Sens., 7, 3934–3965, https://doi.org/10.3390/rs70403934, 2015. a
Harmon, M. E., Bond-Lamberty, B., Tang, J., and Vargas, R.: Heterotrophic respiration in disturbed forests: A review with examples from North America, J. Geophys. Res.-Biogeo., 116, G00K04, https://doi.org/10.1029/2010JG001495, 2011. a
He, L. and Mostovoy, G.: Cotton Yield Estimate Using Sentinel-2 Data and an Ecosystem Model over the Southern US, Remote Sens., 11, 2000, https://doi.org/10.3390/rs11172000, 2019. a
He, Y., Piao, S., Li, X., Chen, A., and Qin, D.: Global patterns of vegetation carbon use efficiency and their climate drivers deduced from MODIS satellite data and process-based models, Agr. Forest Meteorol., 256/257, 150–158, https://doi.org/10.1016/j.agrformet.2018.03.009, 2018. a
Helman, D.: Land surface phenology: What do we really “see” from space?, Sci. Total Environ., 618, 665–673, https://doi.org/10.1016/j.scitotenv.2017.07.237, 2018. a
Hilker, T., Gitelson, A., Coops, N. C., Hall, F. G., and Black, T. A.: Tracking plant physiological properties from multi-angular tower-based remote sensing, Oecologia, 165, 865–876, https://doi.org/10.1007/s00442-010-1901-0, 2011. a
Hill, M. J. and Donald, G. E.: Estimating spatio-temporal patterns of agricultural productivity in fragmented landscapes using AVHRR NDVI time series, Remote Sens. Environ., 84, 367–384, https://doi.org/10.1016/S0034-4257(02)00128-1, 2003. a
Houborg, R., F. McCabe, M., Cescatti, A., and A. Gitelson, A.: Leaf chlorophyll constraint on model simulated gross primary productivity in agricultural systems, Int. J. Appl. Earth Obs. Geoinf., 43, 160–176, https://doi.org/10.1016/j.jag.2015.03.016, 2015. a
Huang, S., Tang, L., Hupy, J. P., Wang, Y., and Shao, G.: A commentary review on the use of normalized difference vegetation index (NDVI) in the era of popular remote sensing, J. Forest. Res., 32, 1–6, 2021. a
Huete, A., Didan, K., Miura, T., Rodriguez, E., Gao, X., and Ferreira, L.: Overview of the radiometric and biophysical performance of the MODIS vegetation indices, Remote Sens. Environ., 83, 195–213, https://doi.org/10.1016/S0034-4257(02)00096-2, 2002. a, b, c
Jacquemoud, S., Ustin, S. L., Verdebout, J., Schmuck, G., Andreoli, G., and Hosgood, B.: Estimating leaf biochemistry using the PROSPECT leaf optical properties model, Remote Sens. Environ., 56, 194–202, https://doi.org/10.1016/0034-4257(95)00238-3, 1996. a
Jiang, C. and Ryu, Y.: Multi-scale evaluation of global gross primary productivity and evapotranspiration products derived from Breathing Earth System Simulator (BESS), Remote Sens. Environ., 186, 528–547, https://doi.org/10.1016/j.rse.2016.08.030, 2016. a
Jin, H. and Eklundh, L.: A physically based vegetation index for improved monitoring of plant phenology, Remote Sens. Environ., 152, 512–525, https://doi.org/10.1016/J.RSE.2014.07.010, 2014. a
Johnson, D. M.: An assessment of pre- and within-season remotely sensed variables for forecasting corn and soybean yields in the United States, Remote Sens. Environ., 141, 116–128, https://doi.org/10.1016/j.rse.2013.10.027, 2014. a
Jönsson, P. and Eklundh, L.: TIMESAT – a program for analyzing time-series of satellite sensor data, Comput. Geosci., 30, 833–845, https://doi.org/10.1016/j.cageo.2004.05.006, 2004. a
Jönsson, P. and Eklundh, L.: TIMESAT – a program for analyzing time-series of satellite sensor data, Comput. Geosci., 30, 833–845, https://doi.org/10.1016/j.cageo.2004.05.006, 2004. a, b, c
Jönsson, P., Cai, Z., Melaas, E., Friedl, M. A., and Eklundh, L.: A method for robust estimation of vegetation seasonality from Landsat and Sentinel-2 time series data, Remote Sens., 10, 635, https://doi.org/10.3390/RS10040635, 2018. a
Jung, M., Le Maire, G., Zaehle, S., Luyssaert, S., Vetter, M., Churkina, G., Ciais, P., Viovy, N., and Reichstein, M.: Assessing the ability of three land ecosystem models to simulate gross carbon uptake of forests from boreal to Mediterranean climate in Europe, Biogeosciences, 4, 647–656, https://doi.org/10.5194/bg-4-647-2007, 2007. a
Jung, M., Reichstein, M., Margolis, H. a., Cescatti, A., Richardson, A. D., Arain, M. A., Arneth, A., Bernhofer, C., Bonal, D., Chen, J., Gianelle, D., Gobron, N., Kiely, G., Kutsch, W., Lasslop, G., Law, B. E., Lindroth, A., Merbold, L., Montagnani, L., Moors, E. J., Papale, D., Sottocornola, M., Vaccari, F., and Williams, C.: Global patterns of land-atmosphere fluxes of carbon dioxide, latent heat, and sensible heat derived from eddy covariance, satellite, and meteorological observations, J. Geophys. Res., 116, G00J07, https://doi.org/10.1029/2010JG001566, 2011. a
Jung, M., Schwalm, C., Migliavacca, M., Walther, S., Camps-Valls, G., Koirala, S., Anthoni, P., Besnard, S., Bodesheim, P., Carvalhais, N., Chevallier, F., Gans, F., Goll, D. S., Haverd, V., Köhler, P., Ichii, K., Jain, A. K., Liu, J., Lombardozzi, D., Nabel, J. E. M. S., Nelson, J. A., O'Sullivan, M., Pallandt, M., Papale, D., Peters, W., Pongratz, J., Rödenbeck, C., Sitch, S., Tramontana, G., Walker, A., Weber, U., and Reichstein, M.: Scaling carbon fluxes from eddy covariance sites to globe: synthesis and evaluation of the FLUXCOM approach, Biogeosciences, 17, 1343–1365, https://doi.org/10.5194/bg-17-1343-2020, 2020. a, b, c
Justice, C., Belward, A., Morisette, J., Lewis, P., Privette, J., and Baret, F.: Developments in the “validation” of satellite sensor products for the study of the land surface, Int. J. Remote Sens., 21, 3383–3390, https://doi.org/10.1080/014311600750020000, 2000. a
Kamir, E., Waldner, F., and Hochman, Z.: Estimating wheat yields in Australia using climate records, satellite image time series and machine learning methods, ISPRS J. Photogramm. Remote Sens., 160, 124–135, https://doi.org/10.1016/j.isprsjprs.2019.11.008, 2020. a
Kandasamy, S., Baret, F., Verger, A., Neveux, P., and Weiss, M.: A comparison of methods for smoothing and gap filling time series of remote sensing observations – application to MODIS LAI products, Biogeosciences, 10, 4055–4071, https://doi.org/10.5194/bg-10-4055-2013, 2013. a
Kang, S., Running, S. W., Lim, J.-H., amd Chan-Ryul Park, M. Z., and Loehman, R.: A regional phenology model for detecting onset of greenness in temperate mixed forests, Korea: an application of MODIS leaf area index, Remote Sens. Environ., 86, 232–242, https://doi.org/10.1016/S0034-4257(03)00103-2, 2003. a
Kang, X., Yan, L., Zhang, X., Li, Y., Tian, D., Peng, C., Wu, H., Wang, J., and Zhong, L.: Modeling gross primary production of a typical Coastal Wetland in China using MODIS time series and CO2 Eddy Flux Tower Data, Remote Sens., 10, 708, https://doi.org/10.3390/RS10050708, 2018. a, b
Karkauskaite, P., Tagesson, T., and Fensholt, R.: Evaluation of the Plant Phenology Index (PPI), NDVI and EVI for Start-of-Season Trend Analysis of the Northern Hemisphere Boreal Zone, Remote Sens., 9, 485, https://doi.org/10.3390/rs9050485, 2017. a
Karlsen, S. R., Anderson, H. B., van der Wal, R., and Hansen, B. B.: A new NDVI measure that overcomes data sparsity in cloud-covered regions predicts annual variation in ground-based estimates of high arctic plant productivity, Environ. Res. Lett., 13, 025011, https://doi.org/10.1088/1748-9326/aa9f75, 2018. a
Karlsen, S. R., Stendardi, L., Tømmervik, H., Nilsen, L., Arntzen, I., and Cooper, E. J.: Time-Series of Cloud-Free Sentinel-2 NDVI Data Used in Mapping the Onset of Growth of Central Spitsbergen, Svalbard, Remote Sens., 13, 3031, https://doi.org/10.3390/rs13153031, 2021. a
Kattenborn, T., Leitloff, J., Schiefer, F., and Hinz, S.: Review on Convolutional Neural Networks (CNN) in vegetation remote sensing, ISPRS J. Photogramm. Remote Sens., 173, 24–49, https://doi.org/10.1016/j.isprsjprs.2020.12.010, 2021. a, b
Killough, B.: Overview of the Open Data Cube Initiative, in: IGARSS 2018 – 2018 IEEE International Geoscience and Remote Sensing Symposium, 8629–8632, IEEE, ISBN 978-1-5386-7150-4, https://doi.org/10.1109/IGARSS.2018.8517694, 2018. a
Kimes, D. S., Nelson, R. F., Manry, M. T., and Fung, A. K.: Attributes of neural networks for extracting continuous vegetation variables from optical and radar measurements, Int. J. Remote Sens., 19, 2639–2663, https://doi.org/10.1080/014311698214433, 1998. a
Klisch, A. and Atzberger, C.: Operational Drought Monitoring in Kenya Using MODIS NDVI Time Series, Remote Sens., 8, 267, https://doi.org/10.3390/rs8040267, 2016. a
Kljun, N., Calanca, P., Rotach, M. W., and Schmid, H. P.: A simple two-dimensional parameterisation for Flux Footprint Prediction (FFP), Geosci. Model Dev., 8, 3695–3713, https://doi.org/10.5194/gmd-8-3695-2015, 2015. a
Knauer, K., Gessner, U., Fensholt, R., Forkuor, G., and Kuenzer, C.: Monitoring Agricultural Expansion in Burkina Faso over 14 Years with 30 m Resolution Time Series: The Role of Population Growth and Implications for the Environment, Remote Sens., 9, 132, https://doi.org/10.3390/rs9020132, 2017. a
Knyazikhin, Y., Martonchik, J. V., Myneni, R. B., Diner, D. J., and Running, S. W.: Synergistic algorithm for estimating vegetation canopy leaf area index and fraction of absorbed photosynthetically active radiation from MODIS and MISR data, J. Geophys. Res., 103, 32257, https://doi.org/10.1029/98JD02462, 1998. a
Koetz, B., Baret, F., Poilvé, H., and Hill, J.: Use of coupled canopy structure dynamic and radiative transfer models to estimate biophysical canopy characteristics, Remote Sens. Environ., 95, 115–124, https://doi.org/10.1016/j.rse.2004.11.017, 2005. a
Kogan, F.: Application of vegetation index and brightness temperature for drought detection, Adv. Space Res., 15, 91–100, https://doi.org/10.1016/0273-1177(95)00079-T, 1995. a
Kong, D., McVicar, T. R., Xiao, M., Zhang, Y., Peña-Arancibia, J. L., Filippa, G., Xie, Y., and Gu, X.: phenofit: An R package for extracting vegetation phenology from time series remote sensing, Methods Ecol. Evol., 13, 1508–1527, https://doi.org/10.1111/2041-210X.13870, 2022. a
Körner, C.: Paradigm shift in plant growth control, Curr. Opin. Plant Biol., 25, 107–114, https://doi.org/10.1016/j.pbi.2015.05.003, 2015. a
Koren, G., Van Schaik, E., Araújo, A. C., Boersma, K. F., Gärtner, A., Killaars, L., Kooreman, M. L., Kruijt, B., Van Der Laan-Luijkx, I. T., Von Randow, C., Smith, N. E., and Peters, W.: Widespread reduction in sun-induced fluorescence from the Amazon during the 2015/2016 El Niño, Philos. T. R. Soc. B, 373, 20170408, https://doi.org/10.1098/RSTB.2017.0408, 2018. a
Kovács, D. D., Reyes-Muñoz, P., Salinero-Delgado, M., Mészáros, V. I., Berger, K., and Verrelst, J.: Cloud-Free Global Maps of Essential Vegetation Traits Processed from the TOA Sentinel-3 Catalogue in Google Earth Engine, Remote Sens., 15, 3404, https://doi.org/10.3390/rs15133404, 2023. a, b
Krause, A., Papastefanou, P., Gregor, K., Layritz, L. S., Zang, C. S., Buras, A., Li, X., Xiao, J., and Rammig, A.: Quantifying the impacts of land cover change on gross primary productivity globally, Sci. Rep., 12, 1–10, https://doi.org/10.1038/s41598-022-23120-0, 2022. a
Krinner, G., Viovy, N., de Noblet-Ducoudré, N., Ogée, J., Polcher, J., Friedlingstein, P., Ciais, P., Sitch, S., and Prentice, I. C.: A dynamic global vegetation model for studies of the coupled atmosphere-biosphere system, Global Biogeochem. Cy., 19, GB1015, https://doi.org/10.1029/2003GB002199, 2005. a
Kuenzer, C., Dech, S., and Wagner, W.: Remote Sensing Time Series Revealing Land Surface Dynamics, Remote Sens. Time Ser., 22, eBook ISBN 978-3-319-15967-6, https://doi.org/10.1007/978-3-319-15967-6, 2015. a
Kussul, N., Lavreniuk, M., Skakun, S., and Shelestov, A.: Cropland productivity assessment for Ukraine based on time series of optical satellite images, in: 2017 IEEE International Geoscience and Remote Sensing Symposium (IGARSS), IEEE, 5007–5010, https://doi.org/10.1109/IGARSS.2017.8128127, 2017. a
Landsberg, J. J. and Gower, S. T.: Applications of Physiological Ecology to Forest Management, Elsevier, Academic Press, ISBN 978-0-12-435955-0, https://doi.org/10.1016/B978-0-12-435955-0.X5000-6, 1997. a
Lara, B., Gandini, M., Gantes, P., and Matteucci, S. D.: Regional patterns of ecosystem functional diversity in the Argentina Pampas using MODIS time-series, Ecol. Inform., 43, 65–72, https://doi.org/10.1016/J.ECOINF.2017.11.004, 2018. a
Larcher, W.: Physiological Plant Ecology, Springer, Berlin, Germany, ISBN 978-3-540-43516-7, https://link.springer.com/book/9783540435167 (last access: 13 January 2024), 2003. a
Launay, M. and Guerif, M.: Assimilating remote sensing data into a crop model to improve predictive performance for spatial applications, Agr. Ecosyst. Environ., 111, 321–339, https://doi.org/10.1016/j.agee.2005.06.005, 2005. a
Lausch, A., Heurich, M., Magdon, P., Rocchini, D., Schulz, K., Bumberger, J., and King, D. J.: A Range of Earth Observation Techniques for Assessing Plant Diversity, in: Remote Sensing of Plant Biodiversity, 309–348, Springer, Cham, Switzerland, https://doi.org/10.1007/978-3-030-33157-3_13, 2020. a
Lecerf, R., Ceglar, A., López-Lozano, R., Van Der Velde, M., and Baruth, B.: Assessing the information in crop model and meteorological indicators to forecast crop yield over Europe, Agr. Syst., 168, 191–202, https://doi.org/10.1016/j.agsy.2018.03.002, 2019. a
Lee, J. E., Frankenberg, C., Van der Tol, C., Berry, J. A., Guanter, L., Boyce, C. K., Fisher, J. B., Morrow, E., Worden, J. R., Asefi, S., Badgley, G., and Saatchi, S.: Forest productivity and water stress in Amazonia: Observations from GOSAT chlorophyll fluorescence, Tohoku J. Exp. Med., 230, 20130171, https://doi.org/10.1098/RSPB.2013.0171, 2013. a
Lees, T., Tseng, G., Atzberger, C., Reece, S., and Dadson, S.: Deep Learning for Vegetation Health Forecasting: A Case Study in Kenya, Remote Sens., 14, 698, https://doi.org/10.3390/rs14030698, 2022. a
Leopold, U., Gräler, B., Bredel, H., Torres-Matallana, J. A., Pinheiro, P., Stefas, M., Udelhoven, T., Dries, J., Valentin, B., Gale, L., Mougnaud, P., and Schlerf, M.: The Earth Observation Time Series Analysis Toolbox (EOTSA) - An R package with WPS, Web-Client and Spark integration, EGU General Assembly 2020, Online, 4–8 May 2020, EGU2020-21974, https://doi.org/10.5194/egusphere-egu2020-21974, 2020. a, b
Li, S., Xu, L., Jing, Y., Yin, H., Li, X., and Guan, X.: High-quality vegetation index product generation: A review of NDVI time series reconstruction techniques, Int. J. Appl. Earth Obs., 105, 102640, 2021a. a
Li, X., Xiao, J., Fisher, J. B., and Baldocchi, D. D.: ECOSTRESS estimates gross primary production with fine spatial resolution for different times of day from the International Space Station, Remote Sens. Environ., 258, 112360, https://doi.org/10.1016/j.rse.2021.112360, 2021b. a
Li, Z., Ding, L., and Xu, D.: Exploring the potential role of environmental and multi-source satellite data in crop yield prediction across Northeast China, Sci. Total Environ., 815, https://doi.org/10.1016/j.scitotenv.2021.152880, 2022. a
Liao, Z., Zhou, B., Zhu, J., Jia, H., and Fei, X.: A critical review of methods, principles and progress for estimating the gross primary productivity of terrestrial ecosystems, Front. Environ. Sci., 11, 464, https://doi.org/10.3389/fenvs.2023.1093095, 2023. a, b
Lin, S., Li, J., Liu, Q., Li, L., Zhao, J., and Yu, W.: Evaluating the Effectiveness of Using Vegetation Indices Based on Red-Edge Reflectance from Sentinel-2 to Estimate Gross Primary Productivity, Remote Sens., 11, 1303, https://doi.org/10.3390/rs11111303, 2019. a
Lin, S., Huang, X., Zheng, Y., Zhang, X., and Yuan, W.: An Open Data Approach for Estimating Vegetation Gross Primary Production at Fine Spatial Resolution, Remote Sens., 14, 2651, https://doi.org/10.3390/rs14112651, 2022. a
Liu, D., Cai, W., Xia, J., Dong, W., Zhou, G., Chen, Y., Zhang, H., and Yuan, W.: Global Validation of a Process-Based Model on Vegetation Gross Primary Production Using Eddy Covariance Observations, PLoS One, 9, e110407, https://doi.org/10.1371/journal.pone.0110407, 2014. a
Liu, F., Wang, C., and Wang, X.: Can vegetation index track the interannual variation in gross primary production of temperate deciduous forests?, Ecol. Proc. 10, 1–13, 2021a. a
Liu, J., Chen, J. M., Cihlar, J., and Park, W. M.: A process-based boreal ecosystem productivity simulator using remote sensing inputs, Remote Sens. Environ., 62, 158–175, https://doi.org/10.1016/S0034-4257(97)00089-8, 1997. a
Liu, J., Sun, O. J., Jin, H., Zhou, Z., and Han, X.: Application of two remote sensing GPP algorithms at a semiarid grassland site of North China, J. Plant Ecol., 4, 302–312, https://doi.org/10.1093/JPE/RTR019, 2011. a
Liu, P.: A survey of remote-sensing big data, Front. Environ. Sci., 3, 45, https://doi.org/10.3389/fenvs.2015.00045, 2015. a
Liu, X., Chen, F., Barlage, M., Zhou, G., and Niyogi, D.: Noah-MP-Crop: Introducing dynamic crop growth in the Noah-MP land surface model, J. Geophys. Res.-Atmos., 121, 13953–13972, https://doi.org/10.1002/2016JD025597, 2016. a
Liu, Y., Wang, J., Dong, J., Wang, S., and Ye, H.: Variations of Vegetation Phenology Extracted from Remote Sensing Data over the Tibetan Plateau Hinterland during 2000–2014, J. Meteorol. Res., 34, 786–797, https://doi.org/10.1007/S13351-020-9211-X, 2020. a
Liu, Y., Zhou, R., Ren, H., Zhang, W., Zhang, Z., Zhang, Z., and Wen, Z.: Evaluating the dynamics of grassland net primary productivity in response to climate change in China, Global Ecol. Conserv., 28, e01574, https://doi.org/10.1016/j.gecco.2021.e01574, 2021b. a
Lopresti, M. F., Di Bella, C. M., and Degioanni, A. J.: Relationship between MODIS-NDVI data and wheat yield: A case study in Northern Buenos Aires province, Argentina, Inform. Process. Agr., 2, 73–84, https://doi.org/10.1016/j.inpa.2015.06.001, 2015. a
Lumbierres, M., Méndez, P. F., Bustamante, J., Soriguer, R., and Santamaría, L.: Modeling Biomass Production in Seasonal Wetlands Using MODIS NDVI Land Surface Phenology, Remote Sens., 9, 392, https://doi.org/10.3390/rs9040392, 2017. a
Luo, X., Croft, H., Chen, J. M., He, L., and Keenan, T. F.: Improved estimates of global terrestrial photosynthesis using information on leaf chlorophyll content, Glob. Change Biol., 25, 2499–2514, https://doi.org/10.1111/gcb.14624, 2019. a
Luo, Z., Wang, E., and Sun, O. J.: Soil carbon change and its responses to agricultural practices in Australian agro-ecosystems: A review and synthesis, Geoderma, 155, 211–223, https://doi.org/10.1016/j.geoderma.2009.12.012, 2010. a
Ma, Y., Zhang, Z., Kang, Y., and Özdoğan, M.: Corn yield prediction and uncertainty analysis based on remotely sensed variables using a Bayesian neural network approach, Remote Sens. Environ., 259, 112408, https://doi.org/10.1016/j.rse.2021.112408, 2021. a
Machwitz, M., Gessner, U., Conrad, C., Falk, U., Richters, J., and Dech, S.: Modelling the Gross Primary Productivity of West Africa with the Regional Biomass Model RBM+, using optimized 250 m MODIS FPAR and fractional vegetation cover information, Int. J. Appl. Earth Obs. Geoinf., 43, 177–194, https://doi.org/10.1016/j.jag.2015.04.007, 2015. a
Madani, N., Kimball, J. S., Ballantyne, A. P., Affleck, D. L. R., van Bodegom, P. M., Reich, P. B., Kattge, J., Sala, A., Nazeri, M., Jones, M. O., Zhao, M., and Running, S. W.: Future global productivity will be affected by plant trait response to climate, Sci. Rep., 8, 1–10, https://doi.org/10.1038/s41598-018-21172-9, 2018. a
Malenovskỳ, Z., Homolová, L., Lukeš, P., Buddenbaum, H., Verrelst, J., Alonso, L., Schaepman, M. E., Lauret, N., and Gastellu-Etchegorry, J.-P.: Variability and uncertainty challenges in scaling imaging spectroscopy retrievals and validations from leaves up to vegetation canopies, Surv. Geophys., 40, 631–656, 2019. a
Mancini, M. S., Galli, A., Niccolucci, V., Lin, D., Bastianoni, S., Wackernagel, M., and Marchettini, N.: Ecological Footprint: Refining the carbon Footprint calculation, Ecol. Indic., 61, 390–403, https://doi.org/10.1016/j.ecolind.2015.09.040, 2016. a
Manivasagam, V., Kaplan, G., and Rozenstein, O.: Developing Transformation Functions for VENUS and Sentinel-2 Surface Reflectance over Israel, Remote Sens., 11, 1710, https://doi.org/10.3390/rs11141710, 2019. a
Mariotto, I., Thenkabail, P. S., Huete, A., Slonecker, E. T., and Platonov, A.: Hyperspectral versus multispectral crop-productivity modeling and type discrimination for the HyspIRI mission, Remote Sens. Environ., 139, 291–305, https://doi.org/10.1016/j.rse.2013.08.002, 2013. a
Mayr, M. J., Vanselow, K. A., and Samimi, C.: Fire regimes at the arid fringe: A 16-year remote sensing perspective (2000-2016) on the controls of fire activity in Namibia from spatial predictive models, Ecol. Indic., 91, 324–337, https://doi.org/10.1016/J.ECOLIND.2018.04.022, 2018. a
Medvigy, D., Wofsy, S. C., Munger, J. W., Hollinger, D. Y., and Moorcroft, P. R.: Mechanistic scaling of ecosystem function and dynamics in space and time: Ecosystem Demography model version 2, J. Geophys. Res.-Biogeo., 114, G01002, https://doi.org/10.1029/2008JG000812, 2009. a
Melaas, E. K., Friedl, M. A., and Zhu, Z.: Detecting interannual variation in deciduous broadleaf forest phenology using Landsat TM/ETM+ data, Remote Sens. Environ., 132, 176–185, https://doi.org/10.1016/J.RSE.2013.01.011, 2013. a
Mercier, A., Betbeder, J., Rapinel, S., Jegou, N., Baudry, J., and Hubert-Moy, L.: Evaluation of Sentinel-1 and -2 time series for estimating LAI and biomass of wheat and rapeseed crop types, in: Journal of Applied Remote Sensing, Vol. 14, Issue 2, Vol. 14, 024512, SPIE, https://doi.org/10.1117/1.JRS.14.024512, 2020. a
Meroni, M., Atzberger, C., Vancutsem, C., Gobron, N., Baret, F., Lacaze, R., Eerens, H., and Leo, O.: Evaluation of Agreement Between Space Remote Sensing SPOT-VEGETATION fAPAR Time Series, IEEE Trans. Geosci. Remote Sens., 51, 1951–1962, https://doi.org/10.1109/TGRS.2012.2212447, 2012. a
Merrick, T., Pau, S., Jorge, M. L. S. P., Silva, T. S. F., and Bennartz, R.: Spatiotemporal Patterns and Phenology of Tropical Vegetation Solar-Induced Chlorophyll Fluorescence across Brazilian Biomes Using Satellite Observations, Remote Sens., 11, 1746, https://doi.org/10.3390/rs11151746, 2019. a
Monteith, J. L.: Solar Radiation and Productivity in Tropical Ecosystems, J. Appl. Ecol., 9, 747–766, https://doi.org/10.2307/2401901, 1972. a
Morcillo-Pallarés, P., Rivera-Caicedo, J. P., Belda, S., De Grave, C., Burriel, H., Moreno, J., and Verrelst, J.: Quantifying the robustness of vegetation indices through global sensitivity analysis of homogeneous and forest leaf-canopy radiative transfer models, Remote Sens., 11, 2418, https://doi.org/10.3390/rs11202418, 2019. a
Morisette, J. T., Baret, F., Privette, J. L., Myneni, R. B., Nickeson, J. E., Garrigues, S., Shabanov, N. V., Weiss, M., Fernandes, R. A., Leblanc, S. G., Kalacska, M., Sanchez-Azofeifa, G. A., Chubey, M., Rivard, B., Stenberg, P., Rautiainen, M., Voipio, P., Manninen, T., Pilant, A. N., Lewis, T. E., Iiames, J. S., Colombo, R., Meroni, M., Busetto, L., Cohen, W. B., Turner, D. P., Warner, E. D., Petersen, G. W., Seufert, G., and Cook, R.: Validation of global moderate-resolution LAI products: a framework proposed within the CEOS land product validation subgroup, IEEE Trans. Geosci. Remote Sens., 44, 1804–1817, https://doi.org/10.1109/TGRS.2006.872529, 2006. a
Moulin, S., Bondeau, A., and Delecolle, R.: Combining agricultural crop models and satellite observations: From field to regional scales, Int. J. Remote Sens., 19, 1021–1036, https://doi.org/10.1080/014311698215586, 1998. a, b
Munawar, S. and Udelhoven, T.: Land change syndromes identification in temperate forests of Hindukush Himalaya Karakorum (HHK) mountain ranges, Int. J. Remote Sens., 41, 7735–7756, https://doi.org/10.1080/01431161.2020.1763509, 2020. a
Myneni, R., Hoffman, S., Knyazikhin, Y., Privette, J., Glassy, J., Tian, Y., Wang, Y., Song, X., Zhang, Y., Smith, G., Lotsch, A., Friedl, M., Morisette, J., Votava, P., Nemani, R., and Running, S.: Global products of vegetation leaf area and fraction absorbed PAR from year one of MODIS data, Remote Sens. Environ., 83, 214–231, https://doi.org/10.1016/S0034-4257(02)00074-3, 2002. a
Myneni, R., Knyazikhin, Y., and Park, T.: MCD15A3H MODIS/Terra+Aqua Leaf Area Index/FPAR 4-day L4 Global 500 m SIN Grid V006, Boston University and MODAPS SIPS – NASA, NASA LP DAAC, 2015. a
Myneni, R. B., Los, S. O., and Asrar, G.: Potential gross primary productivity of terrestrial vegetation from 1982-1990, Geophys. Res. Lett., 22, 2617–2620, https://doi.org/10.1029/95GL02562, 1995. a, b
Myneni, R. B., Ramakrishna, R., Nemani, R., and Running, S. W.: Estimation of global leaf area index and absorbed par using radiative transfer models, IEEE Trans. Geosci. Remote Sens., 35, 1380–1393, https://doi.org/10.1109/36.649788, 1997. a, b
NASA: CEOS group on Calibration and Validation, Land product validation subgroup, https://lpvs.gsfc.nasa.gov/Pheno/Pheno_home.html (last access: 13 January 2024), 2023. a
Nguyen, T. H., Jones, S. D., Soto-Berelov, M., Haywood, A., and Hislop, S.: Monitoring aboveground forest biomass dynamics over three decades using Landsat time-series and single-date inventory data, Int. J. Appl. Earth Obs., 84, 101952, https://doi.org/10.1016/J.JAG.2019.101952, 2020. a, b
Norton, A. J., Rayner, P. J., Koffi, E. N., Scholze, M., Silver, J. D., and Wang, Y.-P.: Estimating global gross primary productivity using chlorophyll fluorescence and a data assimilation system with the BETHY-SCOPE model, Biogeosciences, 16, 3069–3093, https://doi.org/10.5194/bg-16-3069-2019, 2019. a
Olsson, P.-O., Heliasz, M., Jin, H., and Eklundh, L.: Mapping the reduction in gross primary productivity in subarctic birch forests due to insect outbreaks, Biogeosciences, 14, 1703–1719, https://doi.org/10.5194/bg-14-1703-2017, 2017. a
ORNL DAAC: Net Primary Productivity, https://daac.ornl.gov/cgi-bin/dataset_lister.pl?p=13 (last access: 13 January 2024), 2023. a
Pacheco-Labrador, J., Perez-Priego, O., El-Madany, T., Julitta, T., Rossini, M., Guan, J., Moreno, G., Carvalhais, N., Martín, M., Gonzalez-Cascon, R., Kolle, O., Reischtein, M., van der Tol, C., Carrara, A., Martini, D., Hammer, T., Moossen, H., and Migliavacca, M.: Multiple-constraint inversion of SCOPE. Evaluating the potential of GPP and SIF for the retrieval of plant functional traits, Remote Sens. Environ., 234, 111362, https://doi.org/10.1016/j.rse.2019.111362, 2019. a
Page, M. J., McKenzie, J. E., Bossuyt, P. M., Boutron, I., Hoffmann, T. C., Mulrow, C. D., Shamseer, L., Tetzlaff, J. M., Akl, E. A., Brennan, S. E., Chou, R., Glanville, J., Grimshaw, J. M., Hróbjartsson, A., Lalu, M. M., Li, T., Loder, E. W., Mayo-Wilson, E., McDonald, S., McGuinness, L. A., Stewart, L. A., Thomas, J., Tricco, A. C., Welch, V. A., Whiting, P., and Moher, D.: The PRISMA 2020 statement: an updated guideline for reporting systematic reviews, BMJ, 372, 71, https://doi.org/10.1136/bmj.n71, 2021. a, b
Park, T., Chen, C., Macias-Fauria, M., Tømmervik, H., Choi, S., Winkler, A., Bhatt, U. S., Walker, D. A., Piao, S., Brovkin, V., Nemani, R. R., and Myneni, R. B.: Changes in timing of seasonal peak photosynthetic activity in northern ecosystems, Glob. Change Biol., 25, 2382–2395, https://doi.org/10.1111/gcb.14638, 2019. a
Pastorello, G., Trotta, C., Canfora, E., Chu, H., Christianson, D., Cheah, Y.-W., Poindexter, C., Chen, J., Elbashandy, A., Humphrey, M., Isaac, P., Polidori, D., Reichstein, M., Ribeca, A., van Ingen, C., Vuichard, N., Zhang, L., Amiro, B., Ammann, C., Arain, M. A., Ardö, J., Arkebauer, T., Arndt, S. K., Arriga, N., Aubinet, M., Aurela, M., Baldocchi, D., Barr, A., Beamesderfer, E., Marchesini, L. B., Bergeron, O., Beringer, J., Bernhofer, C., Berveiller, D., Billesbach, D., Black, T. A., Blanken, P. D., Bohrer, G., Boike, J., Bolstad, P. V., Bonal, D., Bonnefond, J.-M., Bowling, D. R., Bracho, R., Brodeur, J., Brümmer, C., Buchmann, N., Burban, B., Burns, S. P., Buysse, P., Cale, P., Cavagna, M., Cellier, P., Chen, S., Chini, I., Christensen, T. R., Cleverly, J., Collalti, A., Consalvo, C., Cook, B. D., Cook, D., Coursolle, C., Cremonese, E., Curtis, P. S., D'Andrea, E., da Rocha, H., Dai, X., Davis, K. J., Cinti, B. D., Grandcourt, A. d., Ligne, A. D., De Oliveira, R. C., Delpierre, N., Desai, A. R., Di Bella, C. M., Tommasi, P. d., Dolman, H., Domingo, F., Dong, G., Dore, S., Duce, P., Dufrêne, E., Dunn, A., Dušek, J., Eamus, D., Eichelmann, U., ElKhidir, H. A. M., Eugster, W., Ewenz, C. M., Ewers, B., Famulari, D., Fares, S., Feigenwinter, I., Feitz, A., Fensholt, R., Filippa, G., Fischer, M., Frank, J., Galvagno, M., Gharun, M., Gianelle, D., Gielen, B., Gioli, B., Gitelson, A., Goded, I., Goeckede, M., Goldstein, A. H., Gough, C. M., Goulden, M. L., Graf, A., Griebel, A., Gruening, C., Grünwald, T., Hammerle, A., Han, S., Han, X., Hansen, B. U., Hanson, C., Hatakka, J., He, Y., Hehn, M., Heinesch, B., Hinko-Najera, N., Hörtnagl, L., Hutley, L., Ibrom, A., Ikawa, H., Jackowicz-Korczynski, M., Janouš, D., Jans, W., Jassal, R., Jiang, S., Kato, T., Khomik, M., Klatt, J., Knohl, A., Knox, S., Kobayashi, H., Koerber, G., Kolle, O., Kosugi, Y., Kotani, A., Kowalski, A., Kruijt, B., Kurbatova, J., Kutsch, W. L., Kwon, H., Launiainen, S., Laurila, T., Law, B., Leuning, R., Li, Y., Liddell, M., Limousin, J.-M., Lion, M., Liska, A. J., Lohila, A., López-Ballesteros, A., López-Blanco, E., Loubet, B., Loustau, D., Lucas-Moffat, A., Lüers, J., Ma, S., Macfarlane, C., Magliulo, V., Maier, R., Mammarella, I., Manca, G., Marcolla, B., Margolis, H. A., Marras, S., Massman, W., Mastepanov, M., Matamala, R., Matthes, J. H., Mazzenga, F., McCaughey, H., McHugh, I., McMillan, A. M. S., Merbold, L., Meyer, W., Meyers, T., Miller, S. D., Minerbi, S., Moderow, U., Monson, R. K., Montagnani, L., Moore, C. E., Moors, E., Moreaux, V., Moureaux, C., Munger, J. W., Nakai, T., Neirynck, J., Nesic, Z., Nicolini, G., Noormets, A., Northwood, M., Nosetto, M., Nouvellon, Y., Novick, K., Oechel, W., Olesen, J. E., Ourcival, J.-M., Papuga, S. A., Parmentier, F.-J., Paul-Limoges, E., Pavelka, M., Peichl, M., Pendall, E., Phillips, R. P., Pilegaard, K., Pirk, N., Posse, G., Powell, T., Prasse, H., Prober, S. M., Rambal, S., Rannik, Ü., Raz-Yaseef, N., Rebmann, C., Reed, D., Dios, V. R. d., Restrepo-Coupe, N., Reverter, B. R., Roland, M., Sabbatini, S., Sachs, T., Saleska, S. R., Sánchez-Cañete, E. P., Sanchez-Mejia, Z. M., Schmid, H. P., Schmidt, M., Schneider, K., Schrader, F., Schroder, I., Scott, R. L., Sedlák, P., Serrano-Ortíz, P., Shao, C., Shi, P., Shironya, I., Siebicke, L., Šigut, L., Silberstein, R., Sirca, C., Spano, D., Steinbrecher, R., Stevens, R. M., Sturtevant, C., Suyker, A., Tagesson, T., Takanashi, S., Tang, Y., Tapper, N., Thom, J., Tomassucci, M., Tuovinen, J.-P., Urbanski, S., Valentini, R., van der Molen, M., van Gorsel, E., van Huissteden, K., Varlagin, A., Verfaillie, J., Vesala, T., Vincke, C., Vitale, D., Vygodskaya, N., Walker, J. P., Walter-Shea, E., Wang, H., Weber, R., Westermann, S., Wille, C., Wofsy, S., Wohlfahrt, G., Wolf, S., Woodgate, W., Li, Y., Zampedri, R., Zhang, J., Zhou, G., Zona, D., Agarwal, D., Biraud, S., Torn, M., and Papale, D.: The FLUXNET2015 dataset and the ONEFlux processing pipeline for eddy covariance data, Sci. Data, 7, 1–27, https://doi.org/10.1038/s41597-020-0534-3, 2020. a
Pei, Y., Dong, J., Zhang, Y., Yuan, W., Doughty, R., Yang, J., Zhou, D., Zhang, L., and Xiao, X.: Evolution of light use efficiency models: Improvement, uncertainties, and implications, Agr. Forest Meteorol., 317, 108905, https://doi.org/10.1016/j.agrformet.2022.108905, 2022. a, b
Peng, B., Guan, K., Zhou, W., Jiang, C., Frankenberg, C., Sun, Y., He, L., and Köhler, P.: Assessing the benefit of satellite-based Solar-Induced Chlorophyll Fluorescence in crop yield prediction, Int. J. Appl. Earth Obs., 90, 102126, https://doi.org/10.1016/j.jag.2020.102126, 2020. a
Penman, J., Green, C., Olofsson, P., Raison, J., Woodcock, C., Balzter, H., Baltuck, M., and Foody, G. M.: Integration of remote-sensing and ground-based observations for estimation of emissions and removals of greenhouse gases in forests: methods and guidance from the Global Forest Observations Initiative, Tech. rep., U.N. Food and Agriculture Organization, https://nottingham-repository.worktribe.com/output/974817 (last access: 13 January 2024), 2016. a
Perich, G., Turkoglu, M. O., Graf, L. V., Wegner, J. D., Aasen, H., Walter, A., and Liebisch, F.: Pixel-based yield mapping and prediction from Sentinel-2 using spectral indices and neural networks, Field Crops Res., 292, 108824, https://doi.org/10.1016/j.fcr.2023.108824, 2023. a
Pflugmacher, D., Cohen, W. B., Kennedy, R. E., and Yang, Z.: Using Landsat-derived disturbance and recovery history and lidar to map forest biomass dynamics, Remote Sens. Environ., 151, 124–137, https://doi.org/10.1016/J.RSE.2013.05.033, 2014. a
Pinzon, J. E. and Tucker, C. J.: A Non-Stationary 1981–2012 AVHRR NDVI3g Time Series, Remote Sens., 6, 6929–6960, https://doi.org/10.3390/rs6086929, 2014. a
Pipia, L., Muñoz-Marí, J., Amin, E., Belda, S., Camps-Valls, G., and Verrelst, J.: Fusing optical and SAR time series for LAI gap filling with multioutput Gaussian processes, Remote Sens. Environ., 235, 111452, https://doi.org/10.1016/j.rse.2019.111452, 2019. a, b
Pipia, L., Belda, S., Franch, B., and Verrelst, J.: Trends in Satellite Sensors and Image Time Series Processing Methods for Crop Phenology Monitoring, https://www.springerprofessional.de/trends-in-satellite-sensors-and-image-time-series-processing-met/20302486 (last access: 13 January 2024), 2022. a, b
Porcar-Castell, A., Tyystjärvi, E., Atherton, J., Van der Tol, C., Flexas, J., Pfündel, E. E., Moreno, J., Frankenberg, C., and Berry, J. A.: Linking chlorophyll a fluorescence to photosynthesis for remote sensing applications: mechanisms and challenges, J. Exp. Bot., 65, 4065–4095, 2014. a, b
Poulter, B., Currey, B., Calle, L., Shiklomanov, A. N., Amaral, C. H., Brookshire, E. N. J., Campbell, P., Chlus, A., Cawse-Nicholson, K., Huemmrich, F., Miller, C. E., Miner, K., Pierrat, Z., Raiho, A. M., Schimel, D., Serbin, S., Smith, W. K., Stavros, N., Stutz, J., Townsend, P., Thompson, D. R., and Zhang, Z.: Simulating Global Dynamic Surface Reflectances for Imaging Spectroscopy Spaceborne Missions: LPJ-PROSAIL, J. Geophys. Res.-Biogeo., 128, e2022JG006935, https://doi.org/10.1029/2022JG006935, 2023. a
Powell, S. L., Cohen, W. B., Healey, S. P., Kennedy, R. E., Moisen, G. G., Pierce, K. B., and Ohmann, J. L.: Quantification of live aboveground forest biomass dynamics with Landsat time-series and field inventory data: A comparison of empirical modeling approaches, Remote Sens. Environ., 114, 1053–1068, https://doi.org/10.1016/J.RSE.2009.12.018, 2010. a, b
Prescher, A.-K., Grünwald, T., and Bernhofer, C.: Land use regulates carbon budgets in eastern Germany: From NEE to NBP, Agr. Forest Meteorol., 150, 1016–1025, https://doi.org/10.1016/j.agrformet.2010.03.008, 2010. a, b
Quillet, A., Peng, C., and Garneau, M.: Toward dynamic global vegetation models for simulating vegetation–climate interactions and feedbacks: recent developments, limitations, and future challenges, Environ. Rev., 18, 333–353, https://doi.org/10.1139/A10-016, 2010. a
Ramoelo, A., Cho, M. A., Mathieu, R., Madonsela, S., van de Kerchove, R., Kaszta, Z., and Wolff, E.: Monitoring grass nutrients and biomass as indicators of rangeland quality and quantity using random forest modelling and WorldView-2 data, Int. J. Appl. Earth Obs., 43, 43–54, https://doi.org/10.1016/j.jag.2014.12.010, 2015. a
Rankine, C., Sánchez-Azofeifa, G. A., Guzmán, J. A., Espirito-Santo, M. M., and Sharp, I.: Comparing MODIS and near-surface vegetation indexes for monitoring tropical dry forest phenology along a successional gradient using optical phenology towers, Environ. Res. Lett., 12, 105007, https://doi.org/10.1088/1748-9326/aa838c, 2017. a
Rasmussen, K., Fensholt, R., Fog, B., Vang Rasmussen, L., and Yanogo, I.: Explaining NDVI trends in northern Burkina Faso, Geogr. Tidsskr., 114, 17–24, https://doi.org/10.1080/00167223.2014.890522, 2014. a
Rautiainen, M.: Retrieval of leaf area index for a coniferous forest by inverting a forest reflectance model, Remote Sens. Environ., 99, 295–303, https://doi.org/10.1016/j.rse.2005.09.004, 2005. a
Rayner, P. J., Scholze, M., Knorr, W., Kaminski, T., Giering, R., and Widmann, H.: Two decades of terrestrial carbon fluxes from a carbon cycle data assimilation system (CCDAS), Global Biogeochem. Cy., 19, GB2026, https://doi.org/10.1029/2004GB002254, 2005. a
Reed, B. C., Brown, J. F., VanderZee, D., Loveland, T. R., Merchant, J. W., and Ohlen, D. O.: Measuring phenological variability from satellite imagery, J. Veg. Sci., 5, 703–714, https://doi.org/10.2307/3235884, 1994. a
Reichstein, M., Camps-Valls, G., Stevens, B., Jung, M., Denzler, J., Carvalhais, N., and Prabhat: Deep learning and process understanding for data-driven Earth system science, Nature, 566, 195–204, https://doi.org/10.1038/s41586-019-0912-1, 2019. a
Reinermann, S., Gessner, U., Asam, S., Kuenzer, C., and Dech, S.: The Effect of Droughts on Vegetation Condition in Germany: An Analysis Based on Two Decades of Satellite Earth Observation Time Series and Crop Yield Statistics, Remote Sens., 11, 1783, https://doi.org/10.3390/rs11151783, 2019. a
Rembold, F., Meroni, M., Rojas, O., Atzberger, C., Fillol, E., and Ham, F.: Agricultural Drought Monitoring Using Space-Derived Vegetation and Biophysical Products: A Global Perspective, CRC Press, Taylor and Francis Group, ISBN 978-1-4822-1792-6, https://publications.jrc.ec.europa.eu/repository/handle/JRC89364 (last access: 13 January 2024), 2015a. a
Rembold, F., Meroni, M., Urbano, F., Royer, A., Atzberger, C., Lemoine, G., Eerens, H., and Haesen, D.: Remote sensing time series analysis for crop monitoring with the SPIRITS software: new functionalities and use examples, Front. Environ. Sci., 3, https://doi.org/10.3389/fenvs.2015.00046, 2015b. a
Reyes-Muñoz, P., Pipia, L., Salinero-Delgado, M., Belda, S., Berger, K., Estévez, J., Morata, M., Rivera-Caicedo, J. P., and Verrelst, J.: Quantifying Fundamental Vegetation Traits over Europe Using the Sentinel-3 OLCI Catalogue in Google Earth Engine, Remote Sens., 14, 1347, https://doi.org/10.3390/rs14061347, 2022. a
Richter, K., Atzberger, C., Vuolo, F., Weihs, P., and D'Urso, G.: Experimental assessment of the Sentinel-2 band setting for RTM-based LAI retrieval of sugar beet and maize, Can. J. Remote Sens., 35, 230–247, https://doi.org/10.5589/m09-010, 2009. a
Rotllan-Puig, X., Ivits, E., and Cherlet, M.: LPDynR: A new tool to calculate the land productivity dynamics indicator, Ecol. Indic., 133, 108386, https://doi.org/10.1016/j.ecolind.2021.108386, 2021. a
Rouse, W., Haas, R., Well, J., and Deering, D. W.: Monitoring vegetation systems in the Great Plains with ERTS, Presented at the proceedings of the Third ERTS Symposium, 1, 309–317, 1974. a
Roxburgh, S. H., Berry, S. L., Buckley, T. N., Barnes, B., and Roderick, M. L.: What is NPP? Inconsistent accounting of respiratory fluxes in the definition of net primary production, Funct. Ecol., 19, 378–382, https://doi.org/10.1111/j.1365-2435.2005.00983.x, 2005. a
Roy, D. P., Huang, H., Houborg, R., and Martins, V. S.: A global analysis of the temporal availability of PlanetScope high spatial resolution multi-spectral imagery, Remote Sens. Environ., 264, 112586, https://doi.org/10.1016/j.rse.2021.112586, 2021. a
Running, S. W., Thornton, P. E., Nemani, R., and Glassy, J. M.: Global Terrestrial Gross and Net Primary Productivity from the Earth Observing System, in: Methods in Ecosystem Science, 44–57, Springer, New York, NY, ISBN 978-1-4612-1224-9, https://doi.org/10.1007/978-1-4612-1224-9_4, 2000. a
Ryu, Y., Baldocchi, D. D., Kobayashi, H., van Ingen, C., Li, J., Black, T. A., Beringer, J., van Gorsel, E., Knohl, A., Law, B. E., and Roupsard, O.: Integration of MODIS land and atmosphere products with a coupled-process model to estimate gross primary productivity and evapotranspiration from 1 km to global scales, Global Biogeochem. Cy., 25, GB4017, https://doi.org/10.1029/2011GB004053, 2011. a
Ryu, Y., Berry, J. A., and Baldocchi, D. D.: What is global photosynthesis? History, uncertainties and opportunities, Remote Sens. Environ., 223, 95–114, https://doi.org/10.1016/j.rse.2019.01.016, 2019. a, b
Sadeh, Y., Zhu, X., Dunkerley, D., Walker, J. P., Zhang, Y., Rozenstein, O., Manivasagam, V., and Chenu, K.: Fusion of Sentinel-2 and PlanetScope time-series data into daily 3 m surface reflectance and wheat LAI monitoring, Int. J. Appl. Earth Obs., 96, 102260, https://doi.org/10.1016/j.jag.2020.102260, 2021. a
Sagan, V., Maimaitijiang, M., Sidike, P., Maimaitiyiming, M., Erkbol, H., Hartling, S., Peterson, K. T., Peterson, J., Burken, J., and Fritschi, F.: Uav/Satellite Multiscale Data Fusion For Crop Monitoring And Early Stress Detection, International Archives of the Photogrammetry, Remote Sens. Spatial Inform. Sci., XLII-2-W13, 715–722, https://doi.org/10.5194/isprs-archives-XLII-2-W13-715-2019, 2019. a
Salinero-Delgado, M. V. and Verrelst, J.: Monitoring Cropland Phenology on Google Earth Engine Using Gaussian Process Regression, Remote Sens., 14, 146, https://doi.org/10.3390/rs14010146, 2021. a
Schiefer, F., Schmidtlein, S., and Kattenborn, T.: The retrieval of plant functional traits from canopy spectra through RTM-inversions and statistical models are both critically affected by plant phenology, Ecol. Indic., 121, 107062, https://doi.org/10.1016/j.ecolind.2020.107062, 2021. a
Schulze, E. D., Valentini, R., and Bouriaud, O.: The role of net ecosystem productivity and of inventories in climate change research: the need for “net ecosystem productivity with harvest”, NEPH, Forest Ecosyst., 8, 1–8, https://doi.org/10.1186/s40663-021-00294-z, 2021. a
Schwartz, M.: Phenology: An Integrative Environmental Science, Vol. 2, Springer Netherlands, ISBN 978-94-017-8153-4, https://doi.org/10.1007/978-94-007-6925-0, 2013. a
Scurlock, J. M. O. and Olson, R. J.: Terrestrial net primary productivity A brief history and a new worldwide database, Environ. Rev., 10, 91–109, https://doi.org/10.1139/a02-002, 2002. a
Senf, C. and Seidl, R.: Mapping the forest disturbance regimes of Europe, Nat. Sustain., 4, 63–70, https://doi.org/10.1038/s41893-020-00609-, 2021. a
Senf, C., Pflugmacher, D., Heurich, M., and Krueger, T.: A Bayesian hierarchical model for estimating spatial and temporal variation in vegetation phenology from Landsat time series, Remote Sens. Environ., 194, 155–160, https://doi.org/10.1016/j.rse.2017.03.020, 2017. a
Senf, C., Buras, A., Zang, C. S., Rammig, A., and Seidl, R.: Excess forest mortality is consistently linked to drought across Europe, Nat. Commun., 11, 6200, https://doi.org/10.1038/s41467-020-19924-1, 2020. a
Shammi, S. A. and Meng, Q.: Use time series NDVI and EVI to develop dynamic crop growth metrics for yield modeling, Ecol. Indic., 121, 107124, https://doi.org/10.1016/j.ecolind.2020.107124, 2021. a, b
Shi, H., Li, L., Eamus, D., Huete, A., Cleverly, J., Tian, X., Yu, Q., Wang, S., Montagnani, L., Magliulo, V., Rotenberg, E., Pavelka, M., and Carrara, A.: Assessing the ability of MODIS EVI to estimate terrestrial ecosystem gross primary production of multiple land cover types, Ecol. Indic., 72, 153–164, https://doi.org/10.1016/j.ecolind.2016.08.022, 2017. a
Shiklomanov, A. N., Dietze, M. C., Fer, I., Viskari, T., and Serbin, S. P.: Cutting out the middleman: calibrating and validating a dynamic vegetation model (ED2-PROSPECT5) using remotely sensed surface reflectance, Geosci. Model Dev., 14, 2603–2633, https://doi.org/10.5194/gmd-14-2603-2021, 2021. a
Sitch, S., Smith, B., Prentice, I. C., Arneth, A., Bondeau, A., Cramer, W., Kaplan, J. O., Levis, S., Lucht, W., Sykes, M. T., Thonicke, K., and Venevsky, S.: Evaluation of ecosystem dynamics, plant geography and terrestrial carbon cycling in the LPJ dynamic global vegetation model, Glob. Change Biol., 9, 161–185, https://doi.org/10.1046/j.1365-2486.2003.00569.x, 2003. a
Sloat, L., Lin, M., Butler, E., Johnson, D., Holbrook, N., Huybers, P., Lee, J.-E., and Mueller, N.: Evaluating the benefits of chlorophyll fluorescence for in-season crop productivity forecasting, Remote Sens. Environ., 260, 112478, https://doi.org/10.1016/j.rse.2021.112478, 2021. a
Smets, B., Eerens, H., Jacobs, T., and Toté, C.: Product User Manual. Vegetation Condition Index (VCI) and Vegetation Productivity Index (VPI), GIO Global Land Component Lot I “Operation of the Global Land Component”, GMES Initial Operations, GIO-GL Lot 1, GMES Initial Operations, 2015. a
Smith, W. K., Biederman, J. A., Scott, R. L., Moore, D. J., He, M., Kimball, J. S., Yan, D., Hudson, A., Barnes, M. L., MacBean, N., Fox, A. M., and Litvak, M. E.: Chlorophyll Fluorescence Better Captures Seasonal and Interannual Gross Primary Productivity Dynamics Across Dryland Ecosystems of Southwestern North America, Geophys. Res. Lett., 45, 748–757, https://doi.org/10.1002/2017GL075922, 2018. a
Somkuti, P., Bösch, H., Feng, L., Palmer, P. I., Parker, R. J., and Quaife, T.: A new space-borne perspective of crop productivity variations over the US Corn Belt, Agr. Forest Meteorol., 281, 107826, https://doi.org/10.1016/j.agrformet.2019.107826, 2020. a
SpecNet: SpecNet network, https://specnet.info/ (last access: 13 January 2024), 2022. a
Stellmes, M., Röder, A., Udelhoven, T., and Hill, J.: Mapping syndromes of land change in Spain with remote sensing time series, demographic and climatic data, Land Use Policy, 30, 685–702, https://doi.org/10.1016/j.landusepol.2012.05.007, 2013. a
Suijker, W. and Medrano, E. A.: Temporal and spatial aggregation of the normalized difference vegetation index for the prediction of rice yields, in: Remote Sensing for Agriculture, Ecosystems, and Hydrology XX, Vol. 10783, 233–244, SPIE, https://doi.org/10.1117/12.2319189, 2018. a
Tagliabue, G., Panigada, C., Dechant, B., Baret, F., Cogliati, S., Colombo, R., Migliavacca, M., Rademske, P., Schickling, A., Schüttemeyer, D., Verrelst, J., Rascher, U., Ryu, Y., and Rossini, M.: Exploring the spatial relationship between airborne-derived red and far-red sun-induced fluorescence and process-based GPP estimates in a forest ecosystem, Remote Sens. Environ., 231, 111 272, https://doi.org/10.1016/j.rse.2019.111272, 2019. a
Teubner, I. E., Forkel, M., Jung, M., Liu, Y. Y., Miralles, D. G., Parinussa, R., van der Schalie, R., Vreugdenhil, M., Schwalm, C. R., Tramontana, G., Camps-Valls, G., and Dorigo, W. A.: Assessing the relationship between microwave vegetation optical depth and gross primary production, Int. J. Appl. Earth Obs. Geoinf., 65, 79–91, https://doi.org/10.1016/j.jag.2017.10.006, 2018. a
Tian, F., Cai, Z., Jin, H., Hufkens, K., Scheifinger, H., Tagesson, T., Smets, B., Van Hoolst, R., Bonte, K., Ivits, E., Tong, X., Ardö, J., and Eklundh, L.: Calibrating vegetation phenology from Sentinel-2 using eddy covariance, PhenoCam, and PEP725 networks across Europe, Remote Sens. Environ., 260, 112456, https://doi.org/10.1016/J.RSE.2021.112456, 2021. a, b
Tomelleri, E., Belelli Marchesini, L., Yaroslavtsev, A., Asgharinia, S., and Valentini, R.: Toward a Unified TreeTalker Data Curation Process, Forests, 13, 855, https://doi.org/10.3390/f13060855, 2022. a
Toomey, M., Friedl, M. A., Frolking, S., Hufkens, K., Klosterman, S., Sonnentag, O., Baldocchi, D. D., Bernacchi, C. J., Biraud, S. C., Bohrer, G., Brzostek, E., Burns, S. P., Coursolle, C., Hollinger, D. Y., Margolis, H. A., McCaughey, H., Monson, R. K., Munger, J. W., Pallardy, S., Phillips, R. P., Torn, M. S., Wharton, S., Zeri, M., and Richardson, A. D.: Greenness indices from digital cameras predict the timing and seasonal dynamics of canopy-scale photosynthesis, Ecol. Appl., 25, 99–115, https://doi.org/10.1890/14-0005.1, 2015. a
Tucker, C. J.: Red and photographic infrared linear combinations for monitoring vegetation, Remote Sens. Environ., 8, 127–150, https://doi.org/10.1016/0034-4257(79)90013-0, 1979. a
Turner, D. P., Ritts, W. D., Law, B. E., Cohen, W. B., Yang, Z., Hudiburg, T., Campbell, J. L., and Duane, M.: Scaling net ecosystem production and net biome production over a heterogeneous region in the western United States, Biogeosciences, 4, 597–612, https://doi.org/10.5194/bg-4-597-2007, 2007. a
Tüshaus, J., Dubovyk, O., Khamzina, A., and Menz, G.: Comparison of medium spatial resolution ENVISAT-MERIS and terra-MODIS time series for vegetation decline analysis: A case study in central Asia, Remote Sens., 6, 5238–5256, https://doi.org/10.3390/RS6065238, 2014. a
Udelhoven, T.: TimeStats: A Software Tool for the Retrieval of Temporal Patterns From Global Satellite Archives, IEEE J. Sel. Top. Appl. Earth Obs. Remote Sens., 4, 310–317, https://doi.org/10.1109/JSTARS.2010.2051942, 2010. a
Udelhoven, T.: TimeStats: A Software Tool for the Retrieval of Temporal Patterns From Global Satellite Archives, IEEE J. Sel. Top. Appl., 4, 310–317, https://doi.org/10.1109/JSTARS.2010.2051942, 2011. a, b
Urbanski, S., Barford, C., Wofsy, S., Kucharik, C., Pyle, E., Budney, J., McKain, K., Fitzjarrald, D., Czikowsky, M., and Munger, J. W.: Factors controlling CO2 exchange on timescales from hourly to decadal at Harvard Forest, J. Geophys. Res.-Biogeo., 112, G02020, https://doi.org/10.1029/2006JG000293, 2007. a
Ustin, S. L. and Middleton, E. M.: Current and near-term advances in Earth observation for ecological applications, Ecol. Process., 10, 1–57, https://doi.org/10.1186/s13717-020-00255-4, 2021. a
Valentini, R., Marchesini, L. B., Gianelle, D., Sala, G., Yarovslavtsev, A., Vasenev, V. I., and Castaldi, S.: New tree monitoring systems: From industry 4.0 to nature 4.0, Ann. Silvicul. Res., 43, 84–88, https://doi.org/10.12899/asr-1847, 2019. a
Van Den Bergh, F., Wessels, K. J., Miteff, S., Van Zyl, T. L., Gazendam, A. D., and Bachoo, A. K.: HiTempo: a platform for time-series analysis of remote-sensing satellite data in a high-performance computing environment, Int. J. Remote Sens., 33, 4720–4740, https://doi.org/10.1080/01431161.2011.638339, 2012. a, b
van der Linden, S., Rabe, A., Held, M., Jakimow, B., Leitão, P. J., Okujeni, A., Schwieder, M., Suess, S., and Hostert, P.: The EnMAP-box-A toolbox and application programming interface for EnMAP data processing, Remote Sens., 7, 11249–11266, https://doi.org/10.3390/RS70911249, 2015. a, b
Van der Tol, C., Verhoef, W., Timmermans, J., Verhoef, A., and Su, Z.: An integrated model of soil-canopy spectral radiances, photosynthesis, fluorescence, temperature and energy balance, Biogeosciences, 6, 3109–3129, https://doi.org/10.5194/bg-6-3109-2009, 2009. a
Verbesselt, J., Hyndman, R., Newnham, G., and Culvenor, D.: Detecting Trend and Seasonal Changes in Satellite Image Time Series, Remote Sens. Environ., 114, 106–115, https://doi.org/10.1016/j.rse.2009.08.014, 2010. a, b, c
Verdouw, C., Tekinerdogan, B., Beulens, A., and Wolfert, S.: Digital twins in smart farming, Agr. Syst., 189, 103046, https://doi.org/10.1016/j.agsy.2020.103046, 2021. a
Verger, A., Filella, I., Baret, F., and Peñuelas, J.: Vegetation baseline phenology from kilometric global LAI satellite products, Remote Sens. Environ., 178, 1–14, 2016. a
Verhoef, W. and Bach, H.: Remote sensing data assimilation using coupled radiative transfer models, Phys. Chem. Earth Pt. A/B/C, 28, 3–13, https://doi.org/10.1016/S1474-7065(03)00003-2, 2003. a
Verrelst, J., Schaepman, M. E., Koetz, B., and Kneubühler, M.: Angular sensitivity analysis of vegetation indices derived from CHRIS/PROBA data, Remote Sens. Environ., 112, 2341–2353, https://doi.org/10.1016/j.rse.2007.11.001, 2008. a
Verrelst, J., Schaepman, M. E., Malenovskỳ, Z., and Clevers, J. G.: Effects of woody elements on simulated canopy reflectance: Implications for forest chlorophyll content retrieval, Remote Sens. Environ., 114, 647–656, 2010. a
Verrelst, J., Alonso, L., Camps-Valls, G., and Delegido, J.: Retrieval of Vegetation Biophysical Parameters Using Gaussian Process Techniques, IEEE Trans. Geosci. Remote Sens., 50, 1832–1843, https://doi.org/10.1109/TGRS.2011.2168962, 2011. a
Verrelst, J., Muñoz, J., Alonso, L., Delegido, J., Rivera, J. P., Camps-Valls, G., and Moreno, J.: Machine learning regression algorithms for biophysical parameter retrieval: Opportunities for Sentinel-2 and -3, Remote Sens. Environ., 118, 127–139, https://doi.org/10.1016/j.rse.2011.11.002, 2012. a
Verrelst, J., Camps-Valls, G., Muñoz-Marí, J., Rivera, J. P., Veroustraete, F., Clevers, J. G., and Moreno, J.: Optical remote sensing and the retrieval of terrestrial vegetation bio-geophysical properties – A review, ISPRS J. Photogramm. Remote Sens., 108, 273–290, https://doi.org/10.1016/j.isprsjprs.2015.05.005, 2015a. a
Verrelst, J., Rivera, J. P., van der Tol, C., Magnani, F., Mohammed, G., and Moreno, J.: Global sensitivity analysis of the SCOPE model: What drives simulated canopy-leaving sun-induced fluorescence?, Remote Sens. Environ., 166, 8–21, 2015b. a
Verrelst, J., Van der Tol, C., Magnani, F., Sabater, N., Rivera, J. P., Mohammed, G., and Moreno, J.: Evaluating the predictive power of sun-induced chlorophyll fluorescence to estimate net photosynthesis of vegetation canopies: A SCOPE modeling study, Remote Sens. Environ., 176, 139–151, https://doi.org/10.1016/j.rse.2016.01.018, 2016. a
Verrelst, J., Malenovský, Z., Van der Tol, C., Camps-Valls, G., Gastellu-Etchegorry, J.-P., Lewis, P., North, P., and Moreno, J.: Quantifying vegetation biophysical variables from imaging spectroscopy data: a review on retrieval methods, Surv. Geophys., 40, 589–629, 2019a. a, b
Verrelst, J., Vicent, J., Rivera-Caicedo, J. P., Lumbierres, M., Morcillo-Pallarés, P., and Moreno, J.: Global Sensitivity Analysis of Leaf-Canopy-Atmosphere RTMs: Implications for Biophysical Variables Retrieval from Top-of-Atmosphere Radiance Data, Remote Sens., 11, 1923, https://doi.org/10.3390/rs11161923, 2019b. a
Verrelst, J., Rivera-Caicedo, J. P., Reyes-Muñoz, P., Morata, M., Amin, E., Tagliabue, G., Panigada, C., Hank, T., and Berger, K.: Mapping landscape canopy nitrogen content from space using PRISMA data, ISPRS J. Photogramm. Remote Sens., 178, 382–395, https://doi.org/10.1016/j.isprsjprs.2021.06.017, 2021. a
Vuolo, F., Ng, W.-T., and Atzberger, C.: Smoothing and gap-filling of high resolution multi-spectral time series: Example of Landsat data, Int. J. Appl. Earth Obs. Geoinf., 57, 202–213, https://doi.org/10.1016/j.jag.2016.12.012, 2017. a
Wang, C., Beringer, J., Hutley, L. B., Cleverly, J., Li, J., Liu, Q., and Sun, Y.: Phenology Dynamics of Dryland Ecosystems Along the North Australian Tropical Transect Revealed by Satellite Solar-Induced Chlorophyll Fluorescence, Geophys. Res. Lett., 46, 5294–5302, https://doi.org/10.1029/2019GL082716, 2019. a
Wang, J., Delang, C. O., Hou, G., Gao, L., and Lu, X. X.: Net primary production increases in the Yangtze River Basin within the latest two decades, Global Ecol. Conserv., 26, e01497, https://doi.org/10.1016/J.GECCO.2021.E01497, 2021. a, b
Wang, L., Zhu, H., Lin, A., Zou, L., Qin, W., and Du, Q.: Evaluation of the latest MODIS GPP products across multiple biomes using global eddy covariance flux data, Remote Sens., 9, 418, https://doi.org/10.3390/rs9050418, 2017. a
Wang, Y., Braghiere, R. K., Longo, M., Norton, A. J., Köhler, P., Doughty, R., Yin, Y., Bloom, A. A., and Frankenberg, C.: Modeling Global Vegetation Gross Primary Productivity, Transpiration and Hyperspectral Canopy Radiative Transfer Simultaneously Using a Next Generation Land Surface Model–CliMA Land, J. Adv. Model. Earth Syst., 15, e2021MS002964, https://doi.org/10.1029/2021MS002964, 2023. a
Watson, R. T., Noble, I. R., Bolin, B., Ravindranath, N. H., Verardo, D. J., and Dokken, D. J. E.: Land Use, Land-Use Change, and Forestry – IPCC, https://www.ipcc.ch/report/land-use-land-use-change-and-forestry (last access: 13 January 2024), 2000. a
Wessels, K. J., Prince, S. D., Frost, P. E., and van Zyl, D.: Assessing the effects of human-induced land degradation in the former homelands of northern South Africa with a 1 km AVHRR NDVI time-series, Remote Sens. Environ., 91, 47–67, https://doi.org/10.1016/j.rse.2004.02.005, 2004. a
Wild, B., Teubner, I., Moesinger, L., Zotta, R.-M., Forkel, M., van der Schalie, R., Sitch, S., and Dorigo, W.: VODCA2GPP – a new, global, long-term (1988–2020) gross primary production dataset from microwave remote sensing, Earth Syst. Sci. Data, 14, 1063–1085, https://doi.org/10.5194/essd-14-1063-2022, 2022. a
Wilson, A. M. and Jetz, W.: Remotely Sensed High-Resolution Global Cloud Dynamics for Predicting Ecosystem and Biodiversity Distributions, PLoS Biol., 14, e1002415, https://doi.org/10.1371/journal.pbio.1002415, 2016. a
Winkler, K., Fuchs, R., Rounsevell, M., and Herold, M.: Global land use changes are four times greater than previously estimated, Nat. Commun., 12, 2501, https://doi.org/10.1038/s41467-021-22702-2, 2021. a
Wocher, M., Berger, K., Verrelst, J., and Hank, T.: Retrieval of carbon content and biomass from hyperspectral imagery over cultivated areas, ISPRS J. Photogramm. Remote Sens., 193, 104–114, https://doi.org/10.1016/j.isprsjprs.2022.09.003, 2022. a
Wood, D. J. A., Powell, S., Stoy, P. C., Thurman, L. L., and Beever, E. A.: Is the grass always greener? Land surface phenology reveals differences in peak and season-long vegetation productivity responses to climate and management, Ecol. Evol., 11, 11168–11199, https://doi.org/10.1002/ece3.7904, 2021. a
Wu, X., Xiao, Q., Wen, J., You, D., and Hueni, A.: Advances in quantitative remote sensing product validation: Overview and current status, Earth-Sci. Rev., 196, 102875, https://doi.org/10.1016/j.earscirev.2019.102875, 2019. a
Xie, X., Li, A., Jin, H., Tan, J., Wang, C., Lei, G., Zhang, Z., Bian, J., and Nan, X.: Assessment of five satellite-derived LAI datasets for GPP estimations through ecosystem models, Sci. Total Environ., 690, 1120–1130, 2019. a, b
Xu, M., Liu, R., Chen, J. M., Liu, Y., Wolanin, A., Croft, H., He, L., Shang, R., Ju, W., Zhang, Y., He, Y., and Wang, R.: A 21-Year Time Series of Global Leaf Chlorophyll Content Maps From MODIS Imagery, IEEE Trans. Geosci. Remote Sens., 60, 1–13, https://doi.org/10.1109/TGRS.2022.3204185, 2022. a
Yan, H., Fu, Y., Xiao, X., Huang, H. Q., He, H., and Ediger, L.: Modeling gross primary productivity for winter wheat–maize double cropping system using MODIS time series and CO2 eddy flux tower data, Agr. Ecosyst. Environ., 129, 391–400, https://doi.org/10.1016/j.agee.2008.10.017, 2009. a
Yan, K., Park, T., Yan, G., Chen, C., Yang, B., Liu, Z., Nemani, R. R., Knyazikhin, Y., and Myneni, R. B.: Evaluation of MODIS LAI/FPAR product collection 6, Part 1: Consistency and improvements, Remote Sens., 8, 359, 2016. a
Yang, B., Knyazikhin, Y., Mõttus, M., Rautiainen, M., Stenberg, P., Yan, L., Chen, C., Yan, K., Choi, S., Park, T., and Myneni, R. B.: Estimation of leaf area index and its sunlit portion from DSCOVR EPIC data: Theoretical basis, Remote Sens. Environ., 198, 69–84, https://doi.org/10.1016/j.rse.2017.05.033, 2017. a
Yang, P., Prikaziuk, E., Verhoef, W., and Van der Tol, C.: SCOPE 2.0: a model to simulate vegetated land surface fluxes and satellite signals, Geosci. Model Dev., 14, 4697–4712, https://doi.org/10.5194/gmd-14-4697-2021, 2021a. a
Yang, P., Verhoef, W., Prikaziuk, E., and Van der Tol, C.: Improved retrieval of land surface biophysical variables from time series of Sentinel-3 OLCI TOA spectral observations by considering the temporal autocorrelation of surface and atmospheric properties, Remote Sens. Environ., 256, 112328, https://doi.org/10.1016/j.rse.2021.112328, 2021b. a
Yang, S., Yang, J., Shi, S., Song, S., Zhang, Y., Luo, Y., and Du, L.: An exploration of solar-induced chlorophyll fluorescence (SIF) factors simulated by SCOPE for capturing GPP across vegetation types, Ecol. Model., 472, 110079, https://doi.org/10.1016/j.ecolmodel.2022.110079, 2022. a
You, Y., Wang, S., Ma, Y., Wang, X., and Liu, W.: Improved modeling of gross primary productivity of alpine grasslands on the Tibetan Plateau using the Biome-BGC model, Remote Sens., 11, 1287, https://doi.org/10.3390/RS11111287, 2019. a
Younes, N., Joyce, K. E., and Maier, S. W.: All models of satellite-derived phenology are wrong, but some are useful: A case study from northern Australia, Int. J. Appl. Earth Obs., 97, 102285, https://doi.org/10.1016/j.jag.2020.102285, 2021. a
Zeng, L., Wardlow, B. D., Xiang, D., Hu, S., and Li, D.: A review of vegetation phenological metrics extraction using time-series, multispectral satellite data, Remote Sens. Environ., 237, 111511, https://doi.org/10.1016/j.rse.2019.111511, 2020. a, b, c, d, e, f, g
Zhang, M.: Modeling net primary productivity of wetland with a satellite-based light use efficiency model, Geocarto Int., https://doi.org/10.1080/10106049.2021.1886343, 2021. a
Zhang, M., Yuan, N., Lin, H., Liu, Y., and Zhang, H.: Quantitative estimation of the factors impacting spatiotemporal variation in NPP in the Dongting Lake wetlands using Landsat time series data for the last two decades, Ecol. Indic., 135, 108544, https://doi.org/10.1016/J.ECOLIND.2022.108544, 2022a. a
Zhang, Q., Cheng, Y.-B., Lyapustin, A. I., Wang, Y., Zhang, X., Suyker, A., Verma, S., Shuai, Y., and Middleton, E. M.: Estimation of crop gross primary production (GPP): II. Do scaled MODIS vegetation indices improve performance?, Agr. Forest Meteorol. 200, 1–8, 2015. a
Zhang, X. and Zhang, Q.: Monitoring interannual variation in global crop yield using long-term AVHRR and MODIS observations, ISPRS J. Photogramm. Remote Sens., 114, 191–205, https://doi.org/10.1016/j.isprsjprs.2016.02.010, 2016. a
Zhang, X., Friedl, M. A., Schaaf, C. B., Strahler, A. H., Hodges, J. C., Gao, F., Reed, B. C., and Huete, A.: Monitoring vegetation phenology using MODIS, Remote Sens. Environ., 84, 471–475, 2003. a
Zhang, Y., Piao, S., Sun, Y., Rogers, B. M., Li, X., Lian, X., Liu, Z., Chen, A., and Peñuelas, J.: Future reversal of warming-enhanced vegetation productivity in the Northern Hemisphere, Nat. Clim. Change, 12, 581–586, https://doi.org/10.1038/s41558-022-01374-w, 2022b. a
Zhao, M., Heinsch, F. A., Nemani, R. R., and Running, S. W.: Improvements of the MODIS terrestrial gross and net primary production global data set, Remote Sens. Environ., 95, 164–176, 2005. a
Zhu, Z., Piao, S., Myneni, R. B., Huang, M., Zeng, Z., Canadell, J. G., Ciais, P., Sitch, S., Friedlingstein, P., Arneth, A., Cao, C., Cheng, L., Kato, E., Koven, C., Li, Y., Lian, X., Liu, Y., Liu, R., Mao, J., Pan, Y., Peng, S., Peñuelas, J., Poulter, B., Pugh, T. A. M., Stocker, B. D., Viovy, N., Wang, X., Wang, Y., Xiao, Z., Yang, H., Zaehle, S., and Zeng, N.: Greening of the Earth and its drivers, Nat. Clim. Change, 6, 791–795, https://doi.org/10.1038/nclimate3004, 2016. a
- Abstract
- Introduction
- Sensor platforms for vegetation productivity monitoring
- Time series processing methods for vegetation productivity monitoring
- Validation of RS-based primary productivity estimates
- Systematic literature review on time-series-based applications for vegetation productivity
- Challenges and outlook
- Conclusions
- Appendix A
- Code and data availability
- Author contributions
- Competing interests
- Disclaimer
- Acknowledgements
- Financial support
- Review statement
- References