the Creative Commons Attribution 4.0 License.
the Creative Commons Attribution 4.0 License.
 | 30 Jan 2024
Evaluation of five models for constructing forest NPP–age relationships in China based on 3121 field survey samples
Peng Li
Jing M. Chen
Mingzhu Xu
Xudong Lin
Guirui Yu
Nianpeng He
Li Xu
Forest net primary productivity (NPP), representing the net carbon gain from the atmosphere, varies significantly with forest age. Reliable forest NPP–age relationships are essential for forest carbon cycle modeling and prediction. These relationships can be derived from forest inventory or field survey data, but it is unclear which model is the most effective in simulating forest NPP variation with age. Here, we aim to establish NPP–age relationships for China's forests based on 3121 field survey samples. Five models, including the semi-empirical mathematical (SEM) function, the second-degree polynomial (SDP) function, the logarithmic (L) function, the Michaelis–Menten (M) function, and the Γ function, were compared against field data. Results of the comparison showed that the SEM and Γ functions performed much better than the other three models, but due to the limited field survey samples at old ages, the Γ function showed a sharp decrease in NPP (decreased to almost zero) at old ages when building some forest NPP–age curves, while SEM could capture the variations in forest NPP at old ages reasonably well. Considering the overall performance with currently available forest field survey samples, SEM was regarded as the optimal NPP–age model. The finalized forest NPP–age curves for five forest types in six regions of China can facilitate forest carbon cycle modeling and future projection by using the process-based Integrated Terrestrial Ecosystem Carbon (InTEC) model in China and may also be useful for other regions.
- Article
(3822 KB) - Full-text XML
- BibTeX
- EndNote


Forests play a critical role in sequestering atmospheric carbon dioxide (Hicke et al., 2007; Liu et al., 2012b; Eggleston et al., 2006; Pan et al., 2011) and mitigating climate change (Friedlingstein, 2020). Forest net primary productivity (NPP), which represents the net carbon gain from the atmosphere in the form of biomass accumulation (Fang et al., 2001b; Chapin et al., 2006), constitutes a key component of the terrestrial carbon cycle (Alexandrov et al., 1999; Hasenauer et al., 2004; Zha et al., 2013; Zhao and Zhou, 2005). It varies significantly with forest age (Bond-Lamberty et al., 2004; Wang et al., 2007, 2011), generally featured by an initial increase at young ages, a maximum at a middle age, and then a gradual decline at old ages (Yu et al., 2017; He et al., 2012). The increase in forest NPP at young ages is mainly driven by a fast increase in leaf area (Ryan et al., 1997; Yu et al., 2014), while the decline in NPP at old ages is primarily driven by the decrease in both gross primary productivity (GPP) and autotrophic respiration (Ra) as forests age, with GPP declining faster than Ra (Drake et al., 2011; Ryan et al., 1997, 2004; Ryan and Waring, 1992; Tang et al., 2014). These forest NPP–age variations have been integrated into process-based models such as the Integrated Terrestrial Ecosystem Carbon (InTEC) model (W. Chen et al., 2000; J. Chen et al., 2003; Wang et al., 2011; Zhang et al., 2012) for modeling the forest carbon cycle and building forest NPP–age curves as model inputs and are therefore essential for facilitating forest carbon cycle modeling (Luyssaert et al., 2008; Chen et al., 2000; Zhang et al., 2012; Shang et al., 2023).
Forest NPP–age curves differ considerably for different regions and forest types due to their varied compositions and diverse growth environments (Yu et al., 2017; He et al., 2012). In Europe (Zaehle et al., 2006), Canada (Chen et al., 2003), and America (Guo et al., 1955; He et al., 2012), forest NPP–age curves have been established for different forest types or regions. However, these curves cannot be directly used for China's forest carbon modeling because of regional differences in environmental conditions. The NPP–age curves produced in previous studies have very different and sometimes inconsistent shapes, making it difficult to analyze the influence of environmental conditions on the curves of different forest types. To address these issues, some studies have tried to build forest NPP–age curves in China. Yu et al. (2017) established forest NPP–age curves for 12 major forest types in Heilongjiang Province using forest inventory data and yield tables. Wang et al. (2018) derived forest NPP–age curves for nine pure forest types with different site indices within Heilongjiang Province using yield tables, biomass equations, and forest inventory data. Zheng et al. (2019) built two forest NPP–age curves separately for coniferous and broad-leaved forests in Zhejiang Province using forest inventory data, but these curves are limited to the provincial level (currently only available in Heilongjiang and Zhejiang provinces) and cannot represent the diverse growth status of China's forests. Wang et al. (2011) constructed five forest NPP–age curves for five representative forest ecosystems in China, but the NPP data used to build these curves were obtained from the simulations of the Boreal Ecosystem Productivity Simulator (BEPS) model (Chen et al., 2012; Ju et al., 2006; Liu et al., 2002, 1999), not forest inventory data or field survey data. Furthermore, these curves did not consider the significant differences in forest and climate conditions between the north and south of China and were insufficient to differentiate the north–south variations in China (Dai et al., 2011). Therefore, it is essential to develop forest NPP–age curves for the entire China while taking into account the differences in regions and forest types.
There were some models that could be used to simulate the forest NPP–age curves (Chen et al., 2003; Yu et al., 2017; He et al., 2012; Peper et al., 2001; Semenzato et al., 2011; Dalgleish et al., 2015; Tang et al., 2014). The semi-empirical mathematical (SEM) function was first developed for simulating NPP–age relationships in Canada (Chen et al., 2003), America (He et al., 2012), and China (Wang et al., 2011; Yu et al., 2017; Wang et al., 2018; Zheng et al., 2019). The second-degree polynomial (SDP) function, logarithmic (L) function, Michaelis–Menten (M) function, and Γ function were used to build the NPP–age relationships for the boreal and temporal forests (Tang et al., 2014). The L function was mainly used to construct the relationship among diameter at breast height (DBH), forest height, and forest age (Peper et al., 2001; Semenzato et al., 2011; Dalgleish et al., 2015), and it was also used to model NPP–age relationships (Tang et al., 2014) as forest NPP is related to DBH and forest height. The M function is a common mathematical model used to describe enzyme reaction kinetics (Do et al., 2022) and was also found to be suitable for relating carbon fluxes to forest age (Tang et al., 2014). The Γ function was demonstrated to have better performance than the SDP function, L function, and M function in building the NPP–age relationships for the boreal and temporal forests (Tang et al., 2014). Different models showed diverse performance in tracking forest NPP–age curves for different forest types and regions. To facilitate the forest carbon modeling, it is crucial to compare these models in building forest NPP–age curves across diverse forest types and regions in China.
There are two objectives of this study: (1) to build forest NPP–age relationships for the entire China considering differences in regions and forest types based on forest field survey data and remote sensing data and (2) to compare five models and determine the optimal model for building forest NPP–age relationships across China. The built forest NPP–age curves from the optimal model for different forest types and regions in China would be served as inputs of a process-based model to facilitate China's forest carbon cycle modeling and future projection.
2.1 Study area
China is selected as the study area, and its forests consist of five forest cover types: evergreen broad-leaved forests (EBFs), evergreen needle-leaved forests (ENFs), deciduous broad-leaved forests (DBFs), deciduous needle-leaved forests (DNFs), and mixed forests (MFs). The five forest types were separated in the building of forest NPP–age curves with consideration for their different physiological and ecological characteristics (Wang et al., 2011). Except for forest cover types, climatic differences in different regions of China can also affect the forest NPP–age relationships (Li and Zhou, 2015; Song et al., 2018), so regions also need to be divided when building the forest NPP–age curves. According to China's geographical division (Fang et al., 2001a), the study area was divided into six regions (Fig. 1): northeast China (NE), north China (N), northwest China (NW), east China (E), southwest China (SW), and south China (S). Significant differences in forest types can be observed among different regions. Region NE (including Heilongjiang, Jilin, and Liaoning provinces) is a typical boreal forest and the most significant natural forest area in China. Region N (including Beijing and Tianjin as well as Hebei, Shanxi, and Inner Mongolia provinces) accounts for 14 % of China's total forest area and is mainly composed of DBF and ENF. Region NW (including Gansu, Ningxia, Qinghai, Shanxi, and Xinjiang provinces) only accounts for 2.57 % of the total forest area in China. Region E (including Shanghai and Jiangsu, Zhejiang, Anhui, Fujian, Jiangxi, Shandong, and Taiwan provinces) accounts for 14 % of China's total forest area, and its forests show significant zonal characteristics. Region SW (including Yunnan, Sichuan, Xizang, Guizhou, and Chongqing provinces) is the second-largest natural forest area in China, accounting for 26 % of China's total forest area and 43 % of China's forest stock (Liu et al., 2021). Region S (including Henan, Hubei, Hunan, Guangdong, Guangxi, and Hainan provinces) accounts for 20 % of the total forest area in China with a large proportion of planted forests.
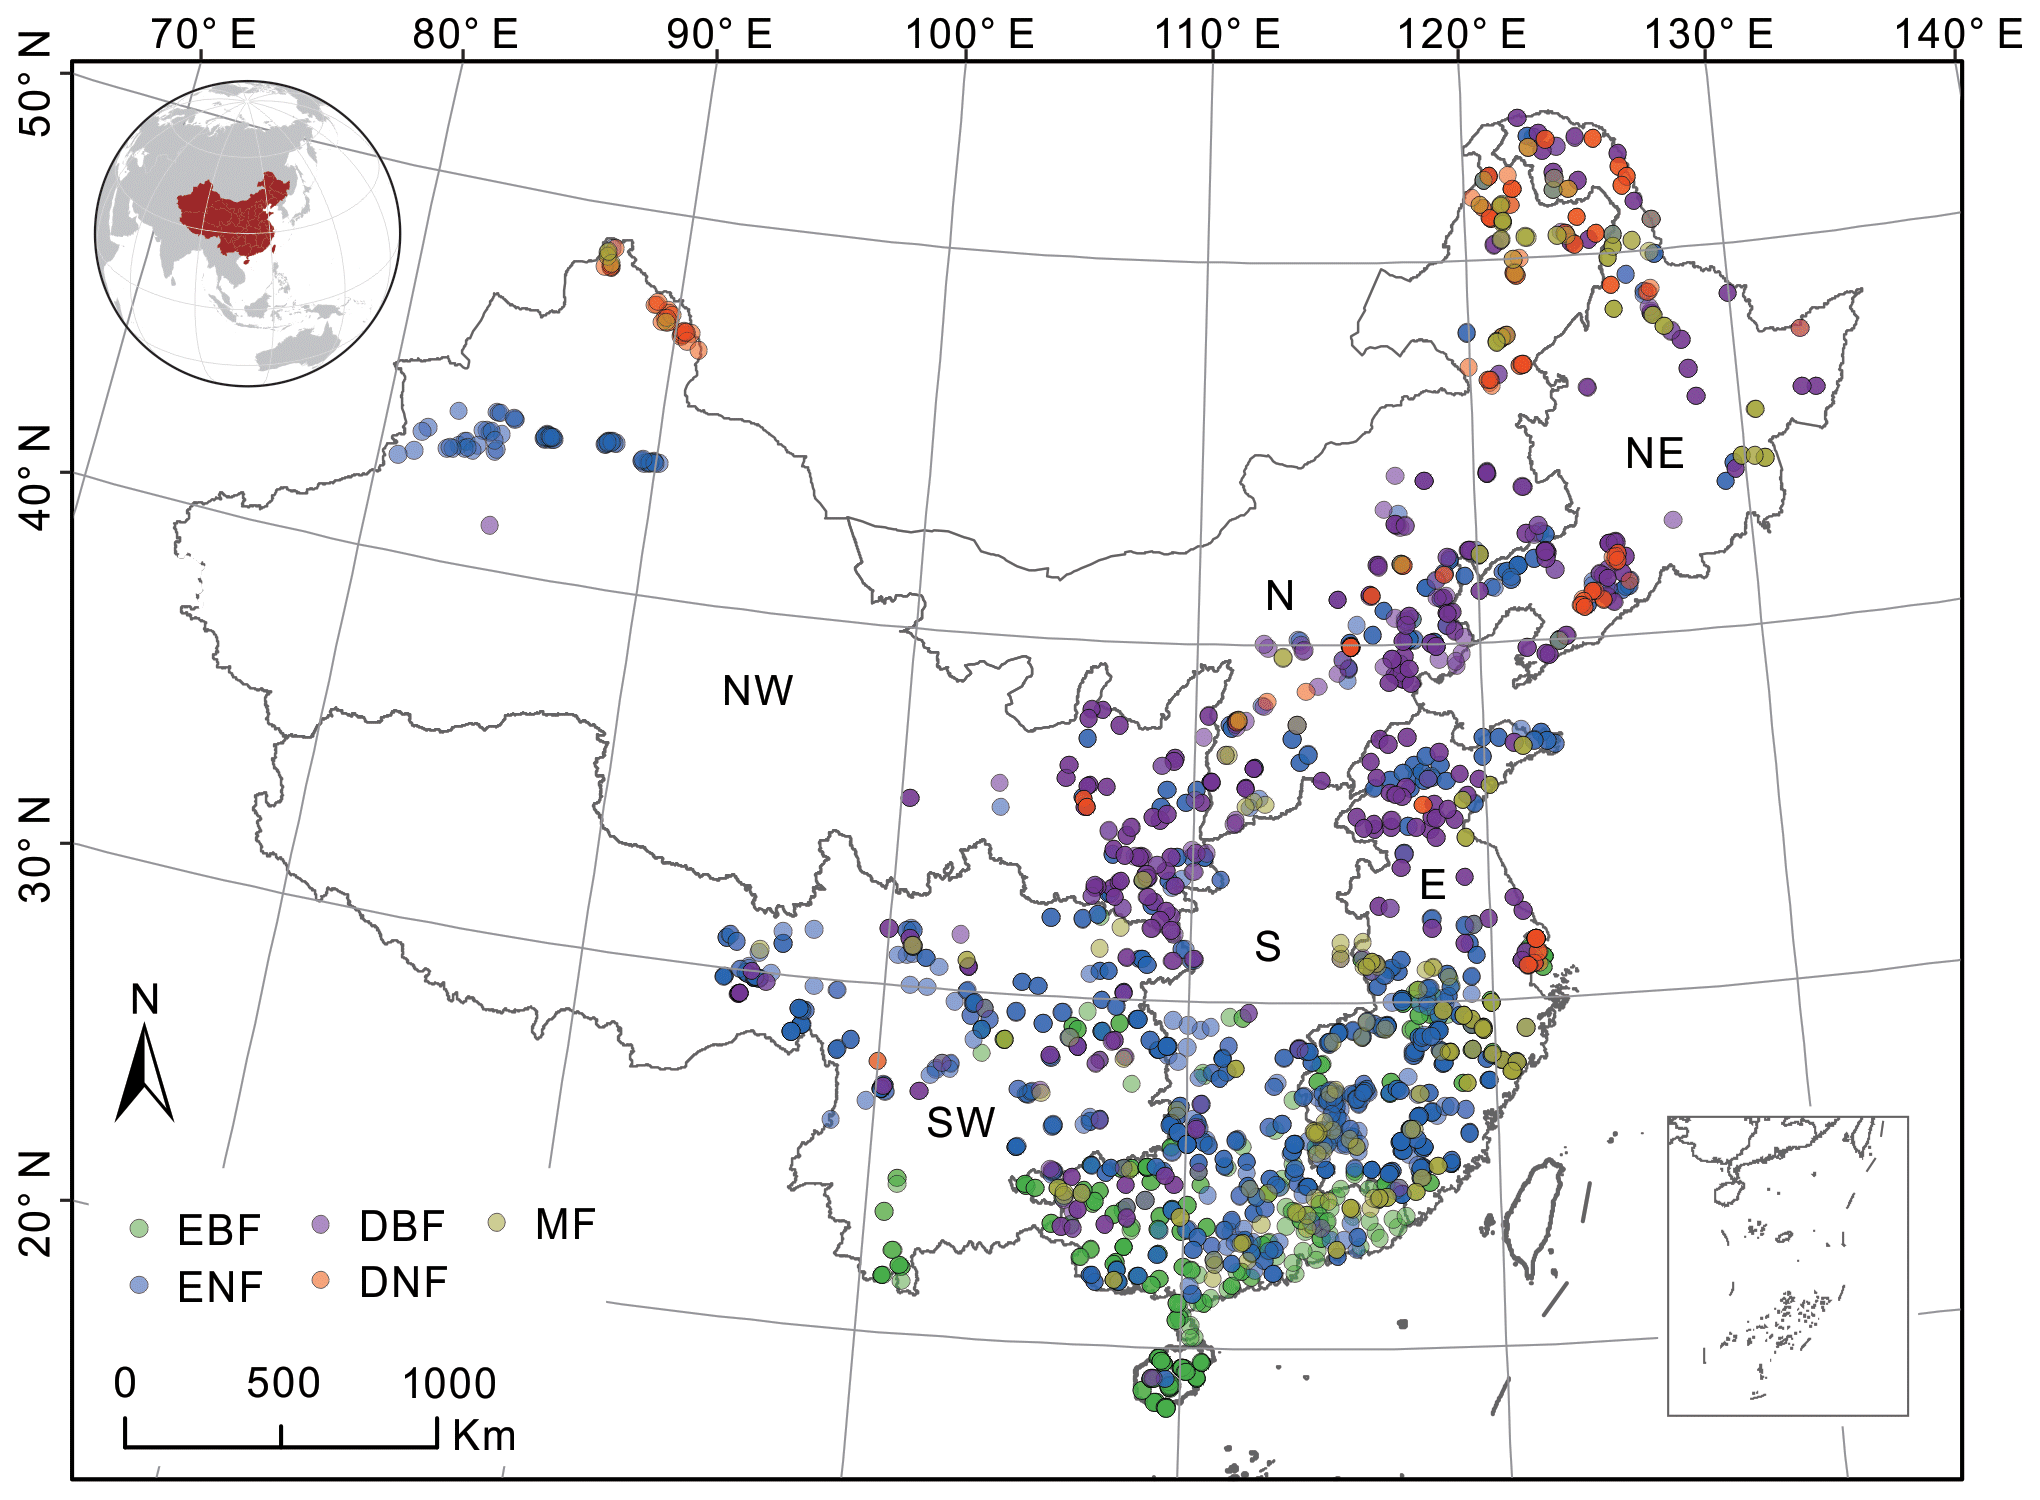
Figure 1Distribution of forest field survey sites and their forest cover types (different colors indicate different types) within the six regions of China. Northeast China: NE, north China: N, northwest China: NW, east China: E, south China: S, southwest China: SW, evergreen broad-leaved forest: EBF, evergreen needle-leaved forest: ENF, deciduous broad-leaved forest: DBF, deciduous needle-leaved forest: DNF, mixed forest: MF.
2.2 Data
The forest field survey data (Fang et al., 2018) and the GLOBMAP version 3 leaf area index (LAI) product (Liu et al., 2012a) were used to build forest NPP–age curves for different regions and forest types.
The forest field survey data include 3121 sampling sites across China (Fig. 1), except for Taiwan, Hong Kong special administrative region (SAR), and Macao SAR (Fang et al., 2018). It includes 585 EBF sites, 1340 ENF sites, 745 DBF sites, 196 DNF sites, and 255 MF sites. These sites were selected according to their representativeness of the forest types in a given area, and they were sampled using the method outlined by the Intergovernmental Panel on Climate Change (IPCC) (Tang et al., 2018). This dataset records the site location, survey time (from 2009 to 2013), forest cover type, stand age, forest aboveground biomass, forest underground biomass, and so on. These attributes were first used to calculate the forest field NPP and then build the forest NPP–age curves.
The GLOBMAP version 3 LAI product (Liu et al., 2012a) was mainly used in the calculation of forest foliage biomass as part of NPP. It provides consistent long-term global LAI data at 500 m spatial resolution from 1981 to 2022 on a geographical grid by fusion of the Moderate Resolution Imaging Spectroradiometer (MODIS) and Advanced Very High Resolution Radiometer (AVHRR) data. According to the site location and survey time, the annual maximum LAI within the survey year for the field survey sample was used to calculate the turnovers of foliage and turnovers of fine roots in the soil.
3.1 Calculating forest field NPP
Forest field NPP was not directly provided by the forest field survey data. As 33 %–50 % of forest NPP is allocated to foliage and fine roots each year (Gower et al., 1997), the forest field NPP was calculated from forest field survey data considering four components (Chen et al., 2002; He et al., 2012): total biomass increase (sum of the stem, branch, and coarse-root biomass), mortality, turnovers of foliage, and turnovers of fine roots in the soil (Chen et al., 2002; He et al., 2012; Xia et al., 2019).
where Bc is the annual increment of total living biomass including stems, branches, and coarse roots; M is the mortality per year that includes standing dead trees and fallen dead trees; Ll is the turnover of leaves per year; and Lfr is the turnover of fine roots per year in the soil. Mortality (M) is ignored in this study due to a lack of observations at the ground plots and its average small proportion of NPP except for extreme conditions (see Sect. 5.2 for a detailed discussion).
The annual increment of total living biomass was calculated from the annual biomass change (B) and the ratio of biomass to carbon (c) (White et al., 2000; Xia et al., 2019). The c was set to 0.5 following previous studies (Van Tuyl et al., 2005; Fang et al., 2001a; Pan et al., 2011).
The calculation of the leaf renewal rate (Ll) is related to leaf area index (LAI), specific leaf area (SLA), leaf turnover rate (tl), and carbon content (c):
The amount of fine-root regeneration is closely related to the amount of leaf regeneration, and hence the proportions of NPP allocated to fine root and leaf are related:
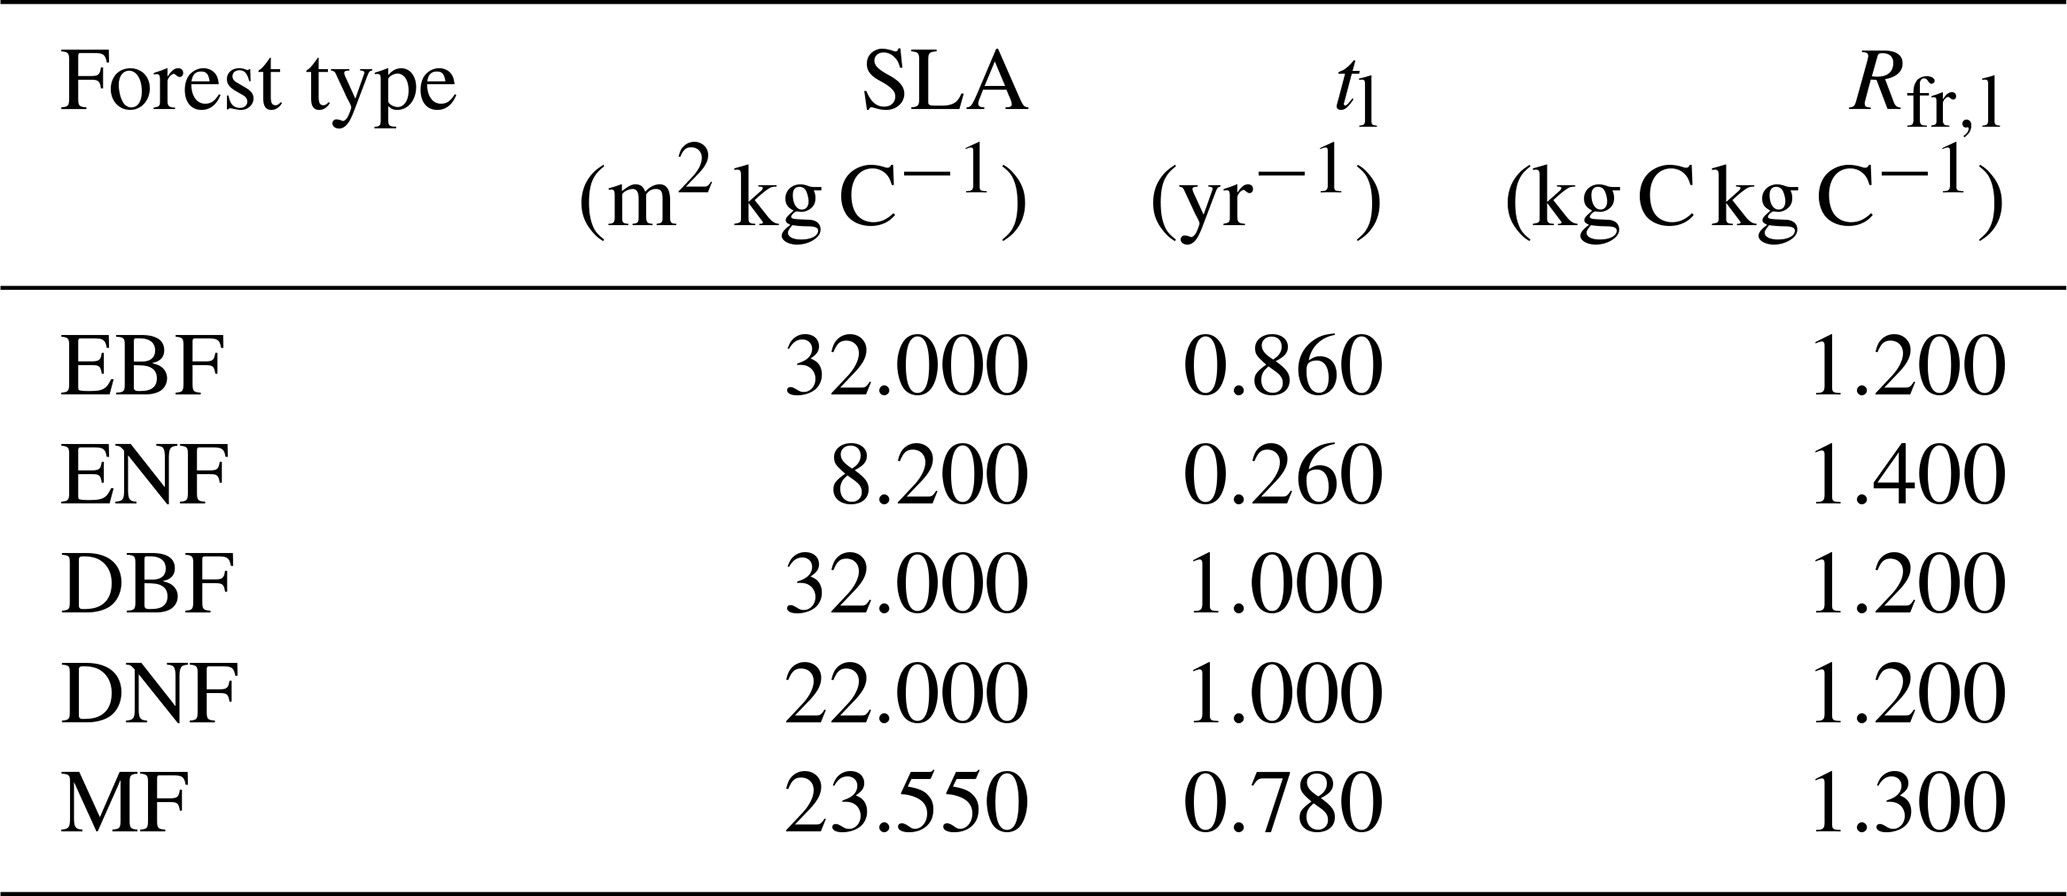
where Rfr,l represents the ratio of carbon allocated to new fine roots to carbon in new leaves. Table 1 provides detailed values for the coefficients of SLA, tl, and Rfr,l for different forest types (White et al., 2000). The coefficients of MF were calculated as the average value of the other four forest cover types.
Table 1The input parameters in the calculation of NPP for different forest types. SLA is the specific leaf area, tl is the foliage turnover ratio, and Rfr,l is the ratio of NPP to fine roots and leaves. Evergreen broad-leaved forest: EBF, evergreen needle-leaved forest: ENF, deciduous broad-leaved forest: DBF, deciduous needle-leaved forest: DNF, mixed forest: MF.
3.2 Building forest NPP–age relationships
Five models, including the SEM function, SDP function, L function, M function, and Γ function, were used to build the NPP–age relationships among the five forest cover types and six regions in China.
The SEM function (Chen et al., 2003; He et al., 2012) is as follows:
where a, b, c, and d are empirical coefficients to be determined from data, and NPP(i) is NPP at the age of i.
The SDP function (Tang et al., 2014) is as follows:
where a, b, and c are empirical coefficients.
The L function (Peper et al., 2001; Semenzato et al., 2011; Dalgleish et al., 2015) is as follows:
where a and b are empirical coefficients.
The M function (Tang et al., 2014; Do et al., 2022) is as follows:
where a and b are empirical coefficients.
The Γ function (Tang et al., 2014) is as follows:
where k0, k1, and k2 are empirical coefficients.
To reduce the influence of noises or outliers in building forest NPP–age curves, the forest field NPPs were averaged within different age bins (e.g., 3, 5, 10, or 20 years). The age bins were divided according to the number of samples in each age bin, and if there were not enough samples for some ages, larger age bins would be used. The R2 and RMSE were used to determine the optimal model for building forest NPP–age curves in China, and the model with the highest R2 and smallest RMSE would be regarded as optimal.
3.3 Determination of 10 forest NPP–age curves
Figure 2 shows the statistics of forest field survey samples according to the three age groups in China. The age group of 0–50 years had the most samples in all forest cover types and regions. Regions NE and N mainly contained DBF (highest number), ENF, DNF, and MF sites. Region NW was dominated by the samples of DBF (highest number) and ENF. Region SW had the most samples of ENF and identical samples of EBF, DBF, and MF. Region S mainly had the samples of ENF (highest number), EBF, and DBF. The samples of EBF and ENF were dominant in region E. The age group of 51–100 years had fewer samples than the group of 0–50 years. EBF samples were mainly located in region E and region SW. The samples of ENF were identical for all six regions. The samples of DNF, DBF, and MF were dominant in the north (NE, N, and NW) regions, and a few samples of DBF and MF were located in the south (SW, S, and E) regions. The age group of > 100 years had the lowest number of samples. The sample of ENF was dominant in the NW and S regions. The sample of EBF was dominant in regions E and S, and the sample of DNF was dominant in region NW.
Taking into account the survey sample and stand age distribution patterns, 10 forest NPP–age curves were derived across the entire China. The samples of EBF were sufficient to separate three forest NPP–age curves for the northern (NE, N, and NW) regions, SW region, and S and E regions. The samples of ENF, BDF, and MF were sufficient to build two separate forest NPP–age curves for the northern (NE, N, and NW) and southern (SW, S, and E) regions. The samples of DNF were rare and mainly located in the northern (NE, N, and NW) regions, and there was only one forest growth curve for DNF in the entire China.
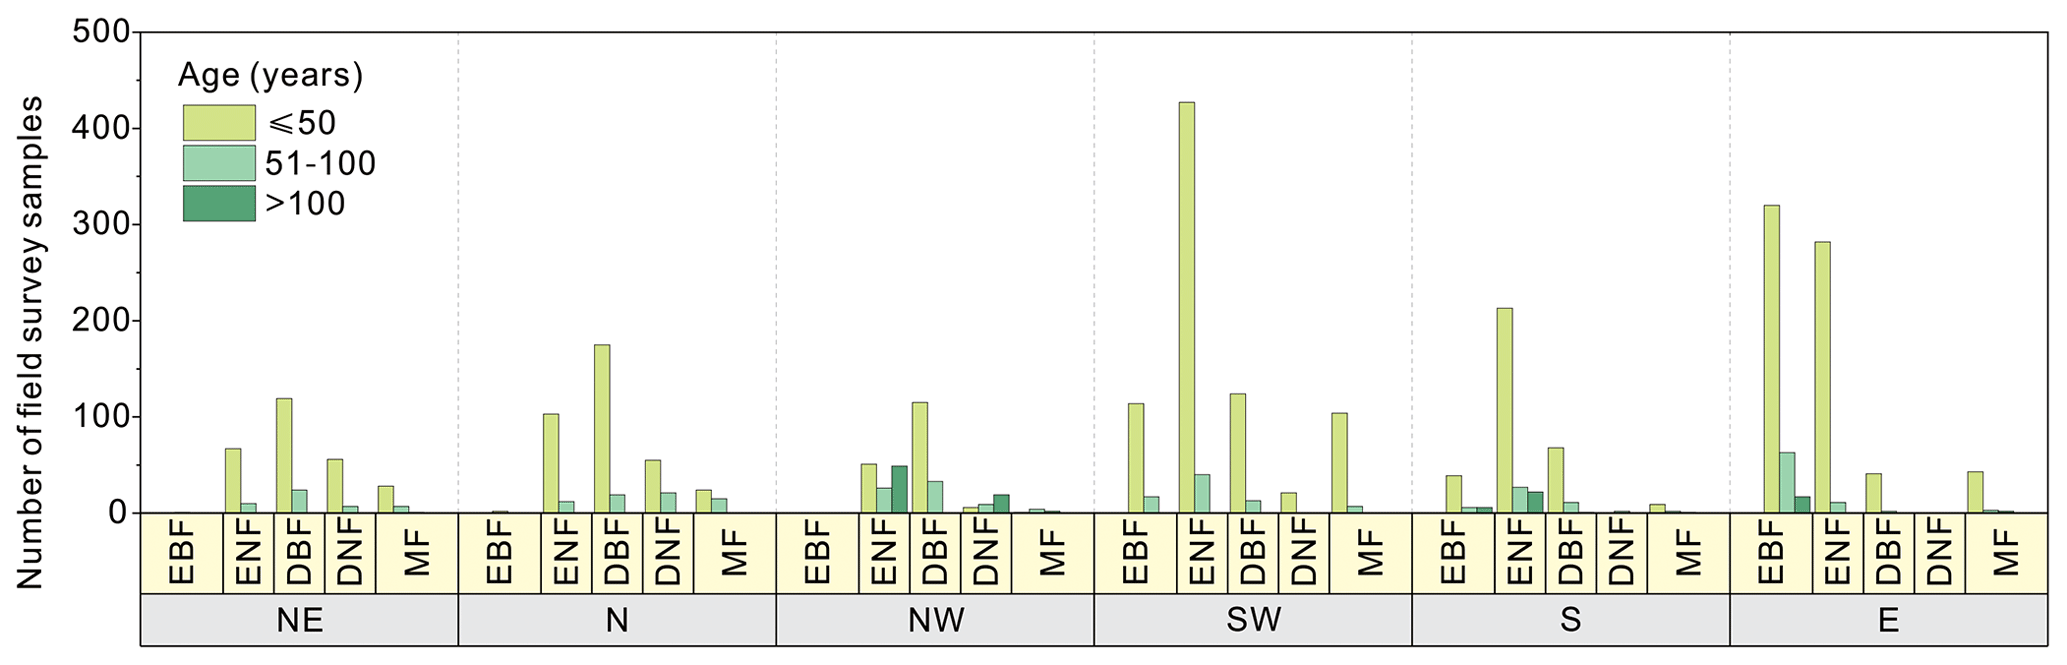
Figure 2The statistics of forest field survey samples according to age groups, regions, and forest cover types in China. The first horizontal coordinate (yellow) indicates the region, the second horizontal coordinate (blue) indicates the forest cover type, the bar indicates the number of samples, and the bar color indicates the age group (purple is for 0 to 50 years, green is for 51 to 100 years, and orange is for > 100 years). Northeast China: NE, north China: N, northwest China: NW, southwest China: SW, south China: S, east China: E, evergreen broad-leaved forest: EBF, evergreen needle-leaved forest: ENF, deciduous broad-leaved forest: DBF, deciduous needle-leaved forest: DNF, mixed forest: MF.
3.4 Uncertainty analysis
The uncertainty of an NPP–age curve mainly comes from the calculation of forest field NPP, whose uncertainty was calculated from its four components (Yu et al., 2017) in Eq. (1). It was represented as the sum of the variances of four independently calculated values based on forest age group:
where is the uncertainty of the NPP–age curve; is the uncertainty in the biomass measurements; is the uncertainty in the mortality estimation; and and are the uncertainties in the estimates of the turnovers of leaves and fine roots, respectively. Since Ll and Lfr were correlated, their errors were estimated as follows:
where is the standard deviation of the leaf renewal rate; is the standard deviation of the fine-root renewal rate; and is the covariance between Ll and Lfr, which was simplified as (He et al., 2012).
4.1 Characterization of forest NPP–age curves
Figure 3 shows the comparison of the five models in building the NPP–age curves for various forest types and regions in China based on the averaged forest field NPP, and the three components of forest field NPP for each curve are shown in Fig. 4. The annual increment of total living biomass constitutes the predominant share of NPP, markedly surpassing the sum of other components in NPP. Despite their relatively minor proportions, the turnover rates of foliage and the fine roots in the soil are essential components of NPP (He et al., 2012). Across various forest types, the annual increment of total living biomass rises in early forest development, peaks mid-term, and later declines, generally consistent with the trajectory of NPP with age. There are also exceptions for some curves with slightly increasing trends in some NPP components at old ages. This might be explained by the following reasons: first, this study did not separate the overstory and understory LAI, and the presence and growth of understory LAI can influence the trends of the NPP components at old ages; second, due to the limited forest field survey samples, we merged samples over large regions to build the forest growth curves for some forest cover types in China, and this can also be a reason for not showing a declining trend. Lastly, in mixed forests, the growth of different forests is asynchronous, leading to the absence of a declining trend in old ages.
4.2 Comparison of five models in building forest NPP–age curves
Figure 5 shows the quantitative comparison of the five functions in building forest NPP–age curves across varied forest cover types and regions in China. The SEM function and Γ function performed prominently in all 10 curves, perfectly capturing the NPP variations with forest age. The SEM function had the highest R2 and lowest RMSE for three curves of EBF (NE, N, and NW), EBF (S and E), and ENF (CHN) and had the lowest RMSE but comparable R2 for five curves including ENF (NE, N, and NW), ENF (SW, S, and E), DBF (NE, N, and NW), MF (NE, N, and NW), and MF (SW, S, E). The Γ function had the highest R2 and lowest RMSE for two curves of EBF (SW) and DBF (SW, S, and E). The NPP–age variations were not well captured by the SDP function, L function, and M function: the declining trend in forest NPP at old ages was not captured by the L and M functions, and five curves constructed by the SDP function exhibited unreasonable declines in NPP for older forest ages (with NPP sharply decreasing to zero before reaching 200 years). Even though the SDP function achieved a relatively high R2 (< 0.05 lower than the highest R2) in building two curves of EBF (SW) and DBF (SW, S, and E), it had 13 %–88 % larger RMSEs than the lowest RMSE. The M function also reached a relatively high R2 (< 0.05 lower than the highest R2) in building four curves of EBF (S and E), ENF (NE, N, and NW), DBF (NE, N, and NW), and MF (NE, N, and NW), but it had 29 %–124 % larger RMSEs than the lowest RMSE.
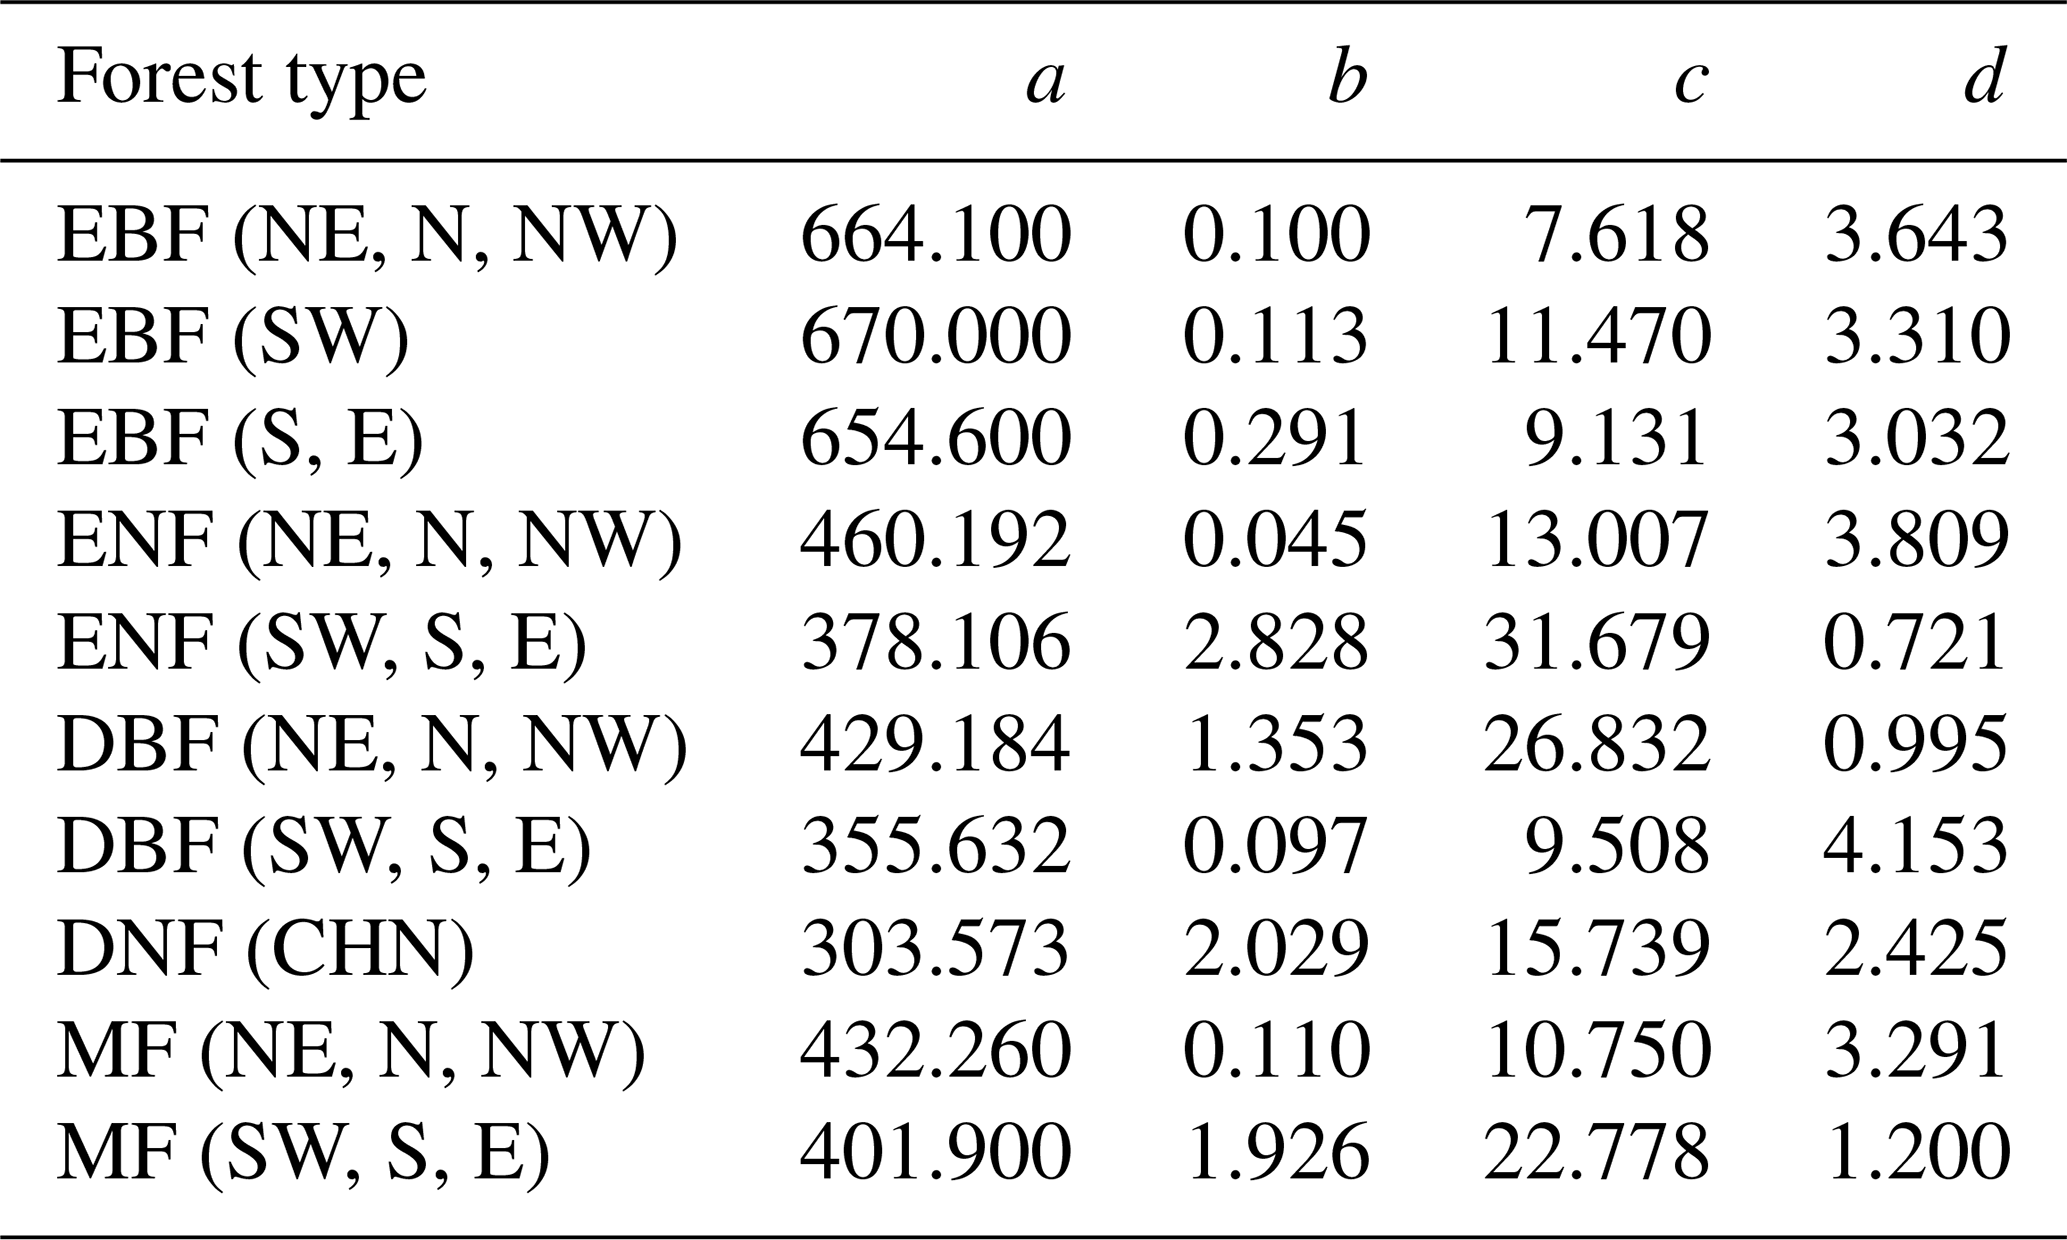
To further evaluate the performances of the SEM function and the Γ function, we extended the forest age to 300 years and normalized the built NPP–age curves by dividing each curve by its maximum NPP value (Fig. 6). The most significant differences between the normalized NPP–age curves simulated using these two functions appear in the extended old ages. The curves built from the SEM function exhibit stable forest NPP at old ages, while those from the Γ function display a distinct and continuous decrease in NPP as the forests become very old. For the two curves of EBF (SW) and DBF (SW, S, and E) where the Γ function had the highest R2 and lowest RMSE, the forest NPP decreased to almost zero when the stand age reached 300 years. The forest NPP in the curves of ENF (SW, S, and E), MF (SW, S, and E), DBF (NE, N, and NW), and DNF (CHN) built by the Γ function also decreased sharply at the age of 300 years and decreased to almost zero at the ages of 400–500 years. These forest growth patterns contradict the results of previous studies, which indicated that forest NPP is usually reduced to about half (Mund et al., 2002; Ryan et al., 2004) or one-third (Luyssaert et al., 2008; Wang et al., 2011) of its maximum value. The curves from the Γ function suggest that forests would stop growth completely at old ages and act as carbon sources. However, studies have demonstrated that old forests still act as carbon sinks, despite the controversial magnitude of the forest carbon sink ranging from 1.0 to 3.2 Mg C ha−1 yr−1 (Gundersen et al., 2021; Luyssaert et al., 2008). Ecologically, we would expect old forests to maintain stable conditions through self-renewal processes, such as the generation of new trees after the mortality of old trees (Harmon et al., 1990). The SEM function that produces stable NPP at old ages is therefore more reasonable in capturing the forest NPP–age variations at old ages and was determined as the optimal forest model for building the forest NPP–age curves in China (the model coefficients of the 10 built curves are provided in Table 2).
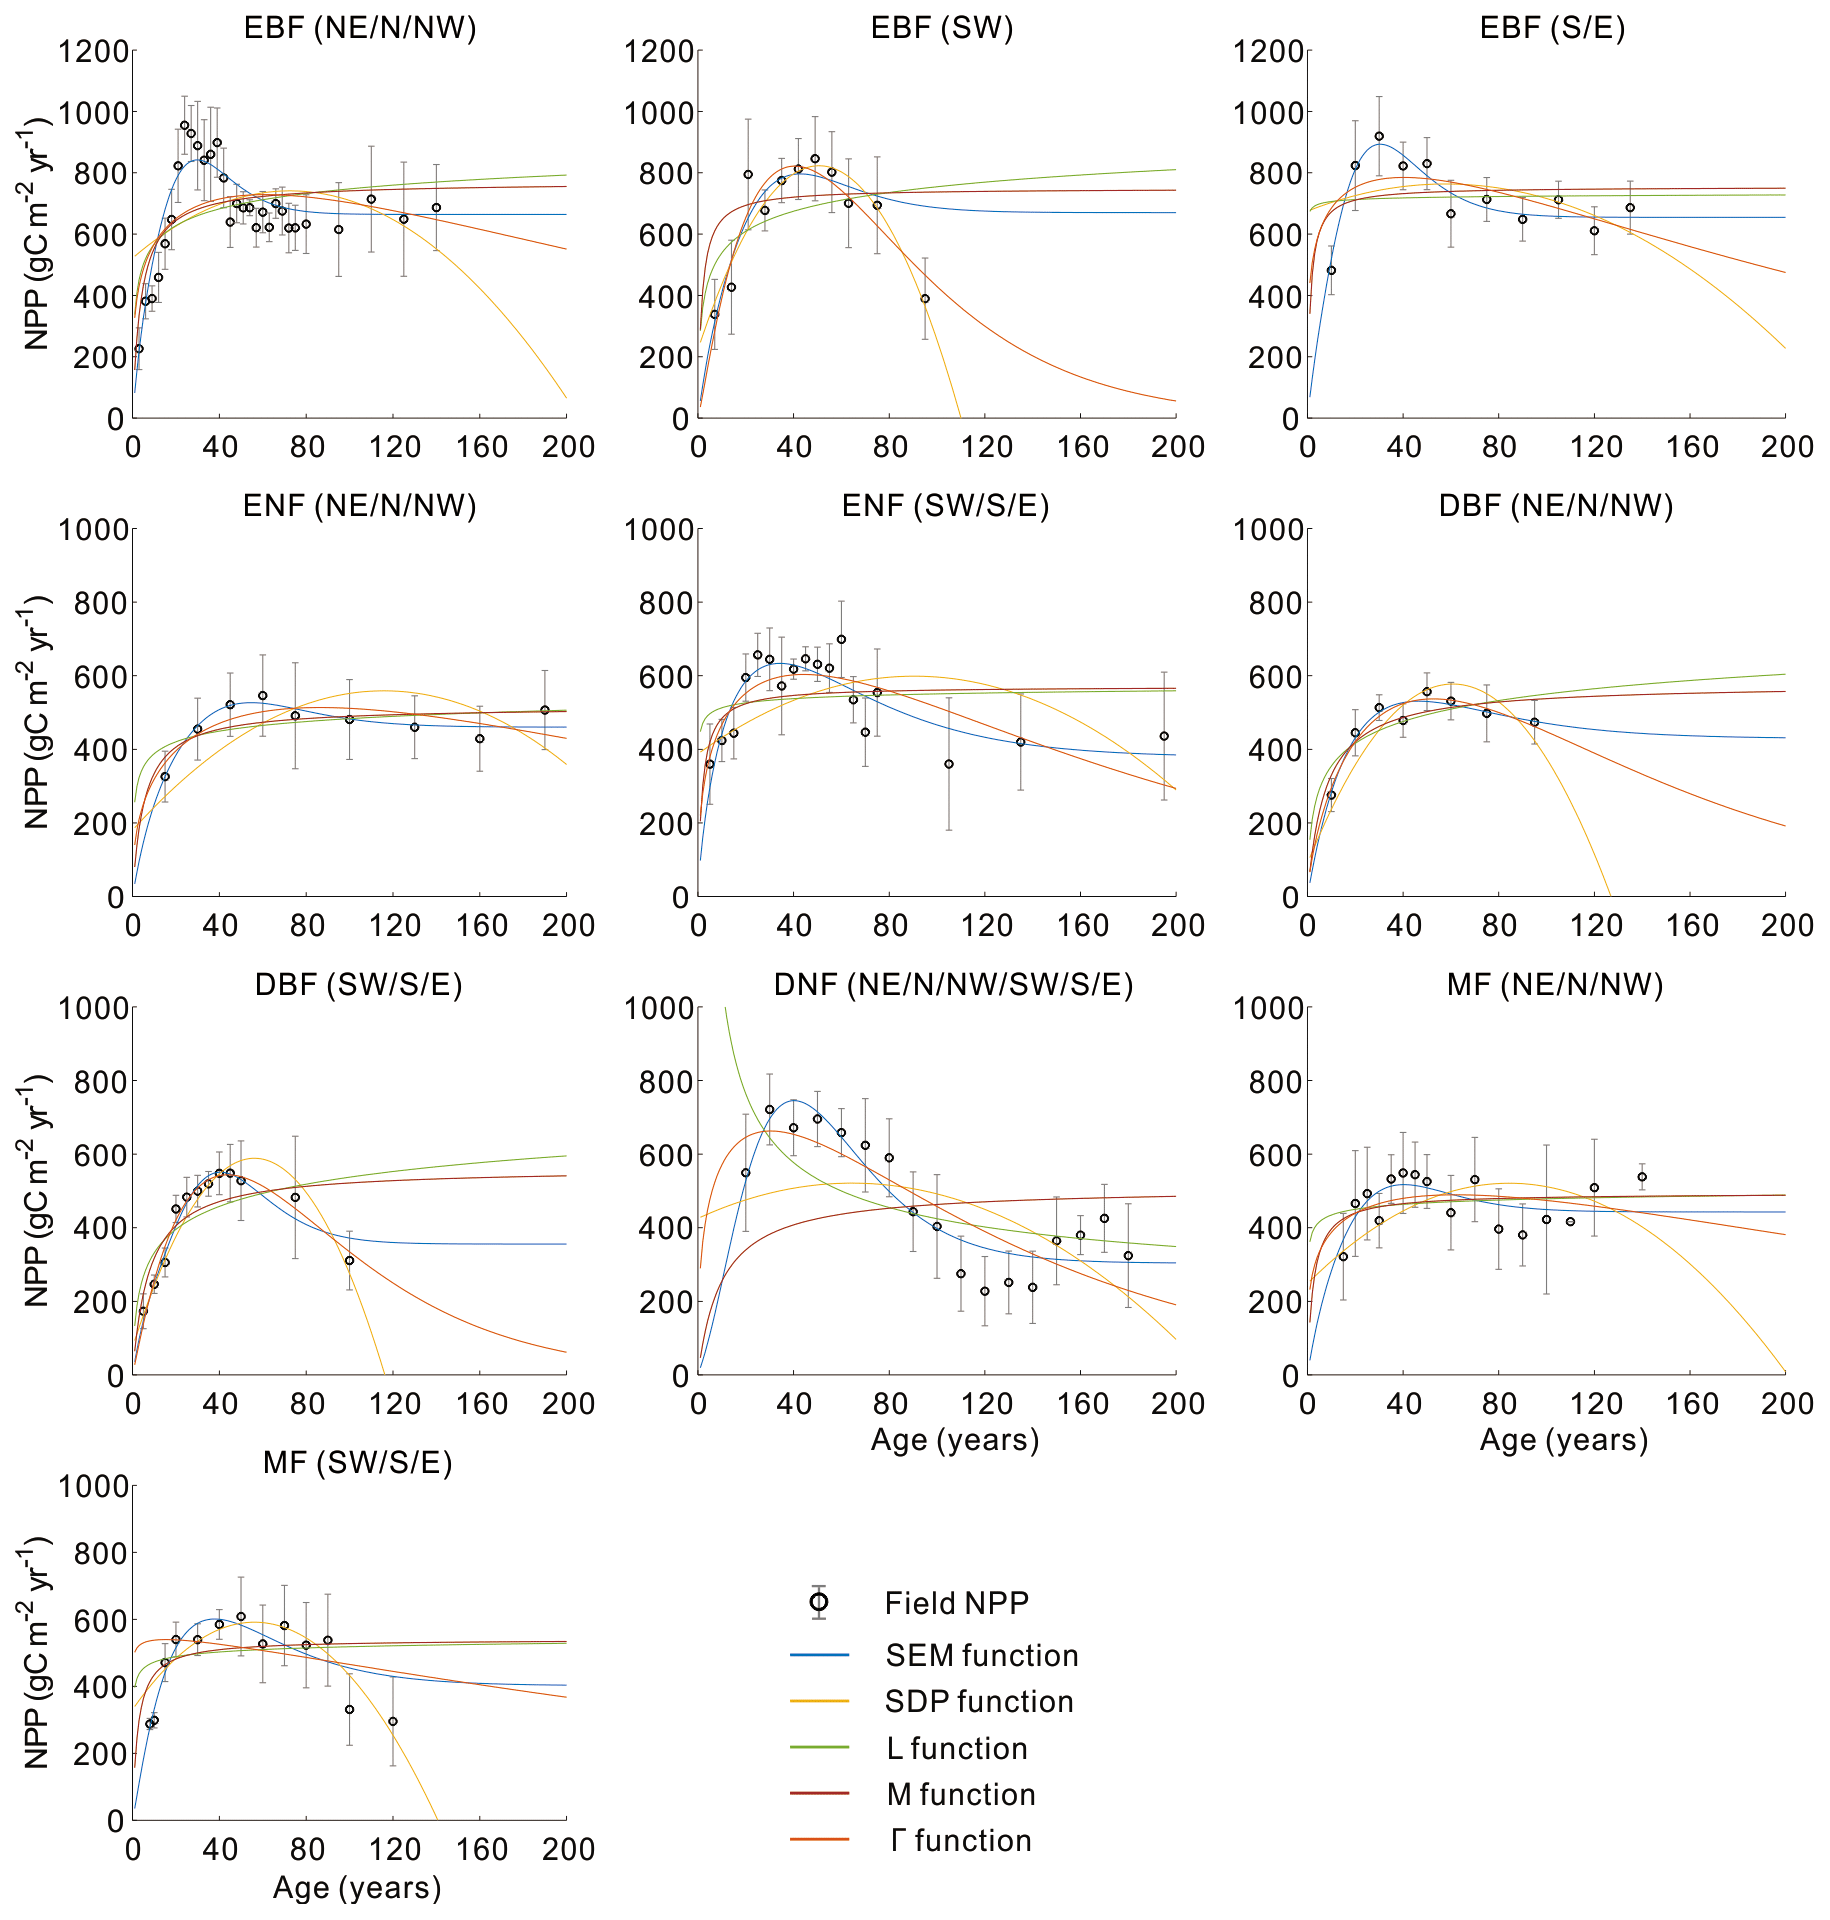
Figure 3Comparison of five models in building the forest NPP–age curves for different forest cover types and regions in China. In each panel, regions are shown at the top. The empty black dots with error bars represent the average NPP and its 1 standard deviation. The five colored lines indicate the curve fitting from the five functions. Northeast China: NE, north China: N, northwest China: NW, east China: E, south China: S, southwest China: SW, evergreen broad-leaved forest: EBF, evergreen needle-leaved forest: ENF, deciduous broad-leaved forest: DBF, deciduous needle-leaved forest: DNF, mixed forest: MF.
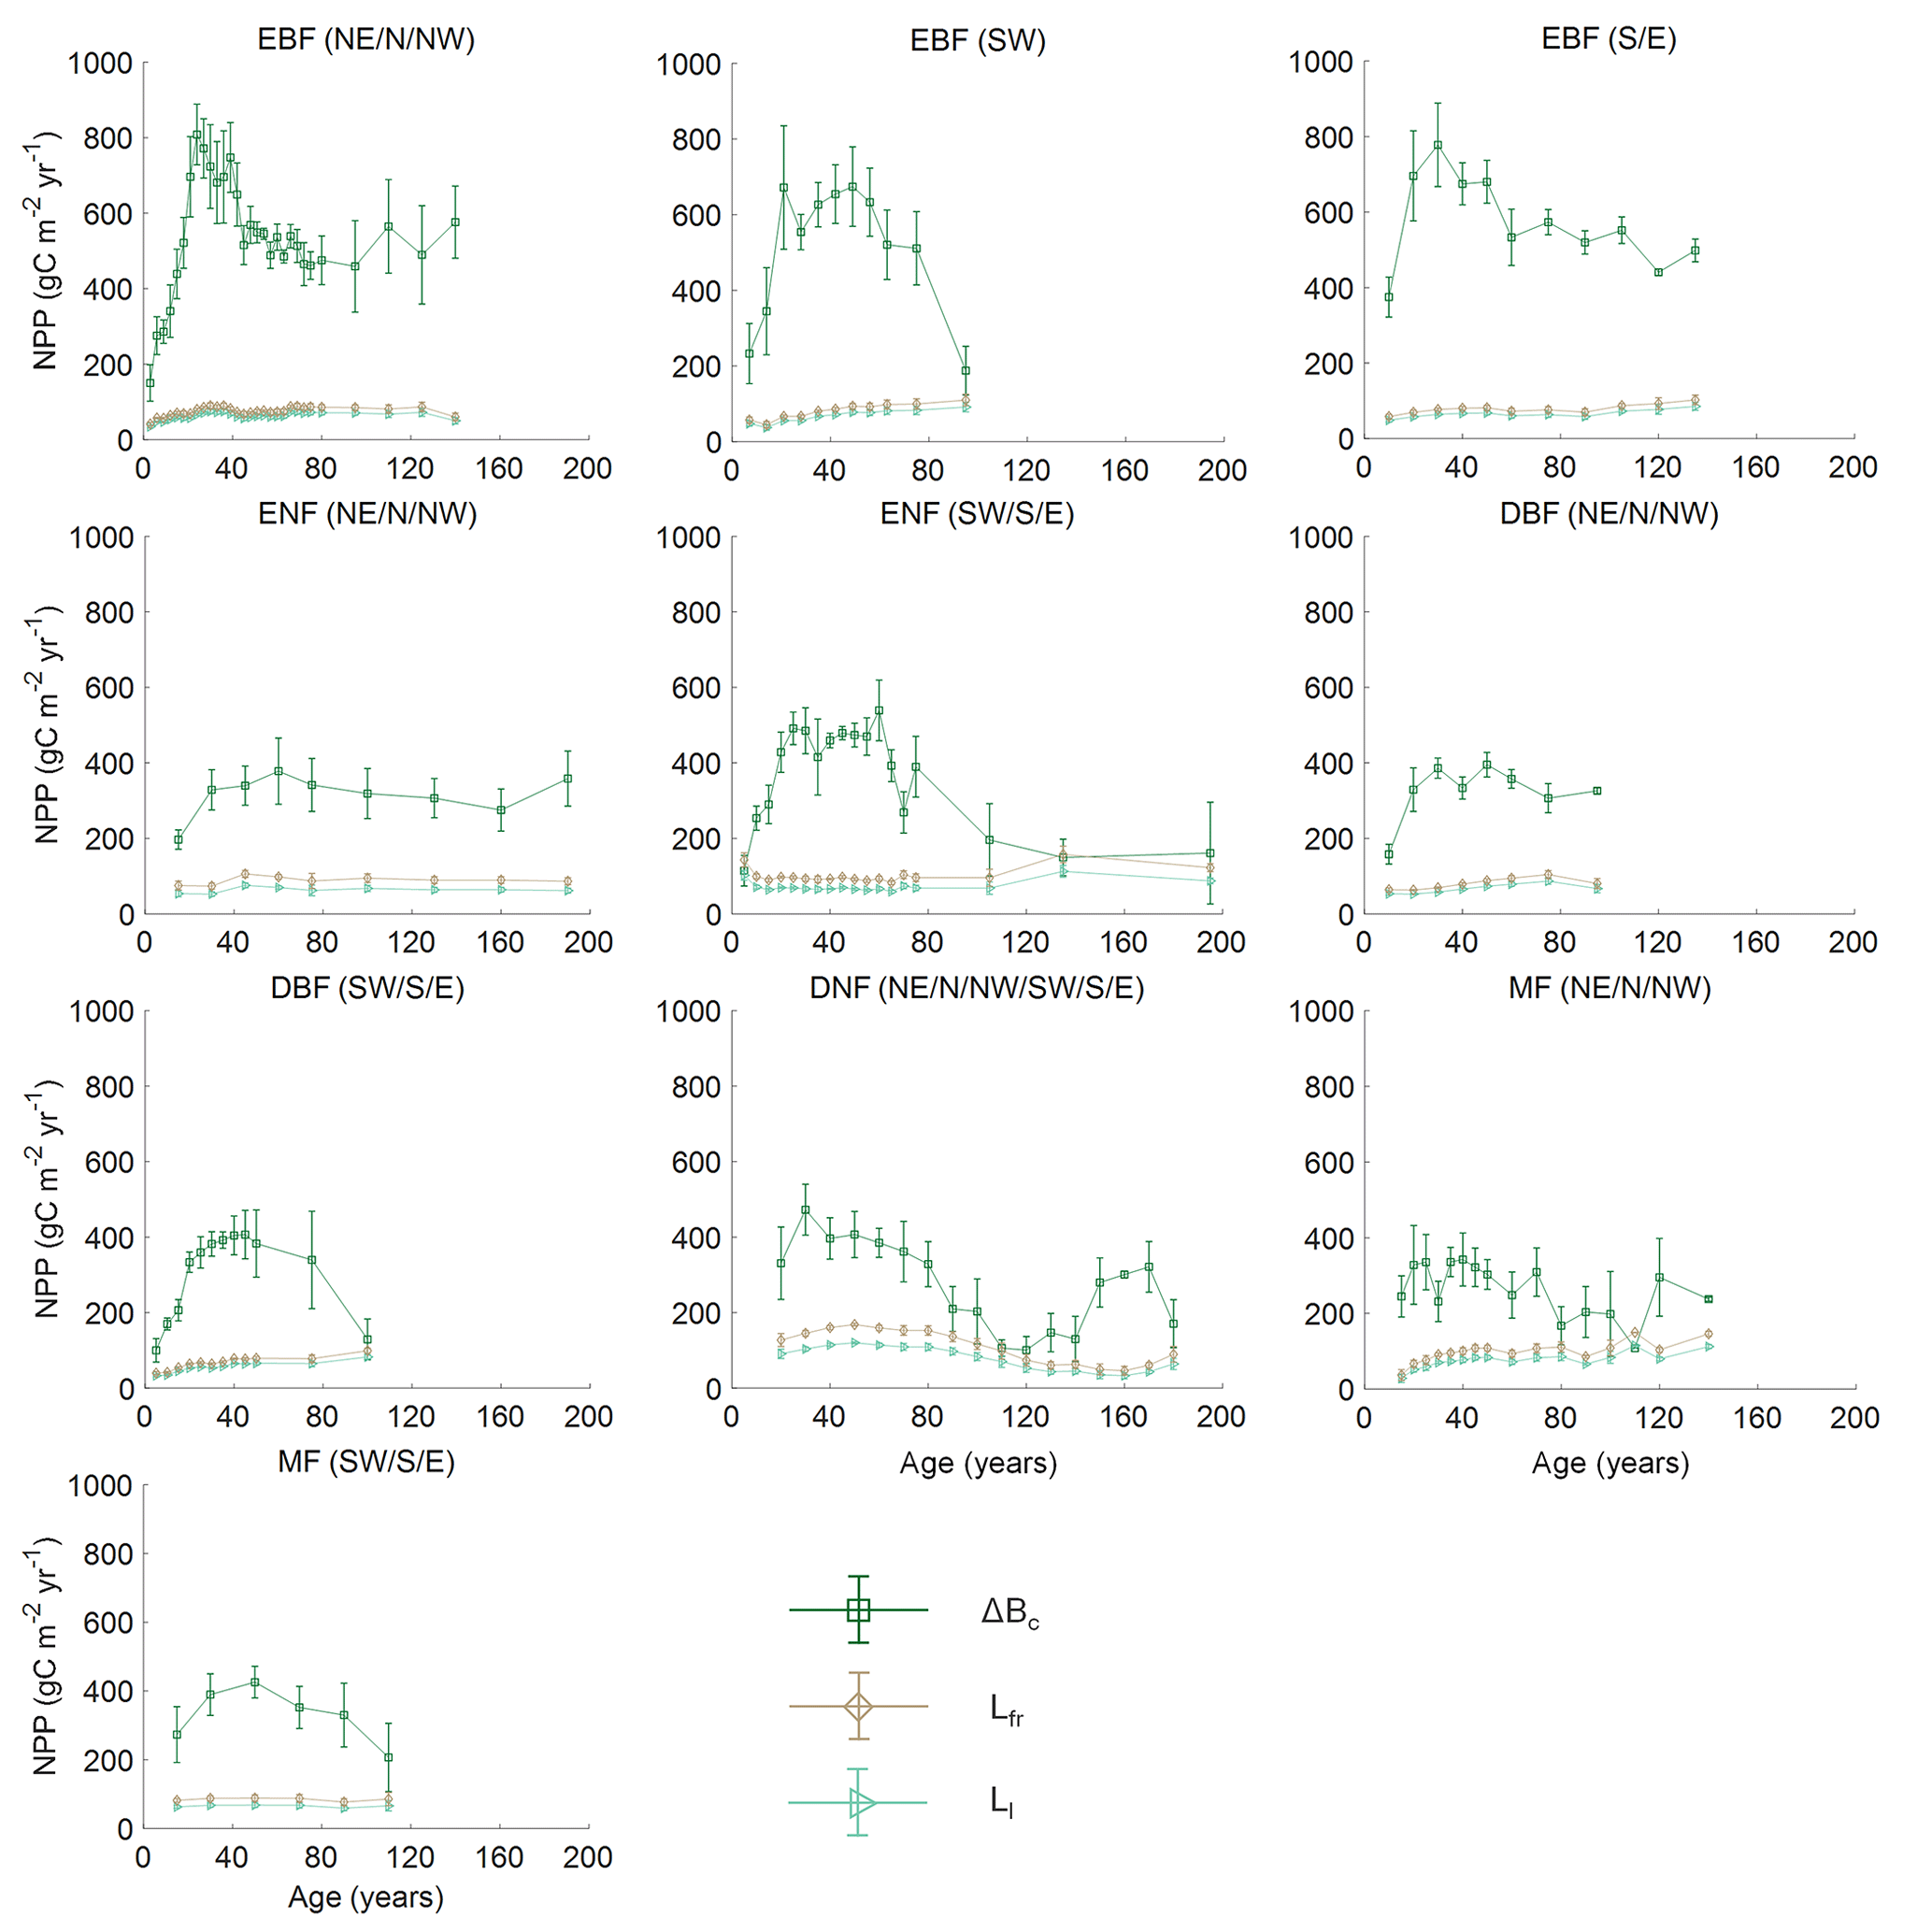
Figure 4Distribution of the three components of NPP for different forest cover types and regions in China. Empty points with error bars represent the components of NPP along with 1 standard deviation. Bc is the annual increment of total living biomass including stems, branches, and coarse roots; Ll is the turnover of leaves per year; and Lfr is the turnover of fine roots per year in the soil. Northeast China: NE, north China: N, northwest China: NW, east China: E, south China: S, southwest China: SW, evergreen broad-leaved forest: EBF, evergreen needle-leaved forest: ENF, deciduous broad-leaved forest: DBF, deciduous needle-leaved forest: DNF, mixed forest: MF.
Table 2The coefficients of the built forest NPP–age curves by the SEM function in China (the unit of NPP calculated from the coefficients a–d is gC m−2 yr−1). The model coefficients: a–d, northeast China: NE, north China: N, northwest China: NW, east China: E, south China: S, southwest China: SW, evergreen broad-leaved forest: EBF, evergreen needle-leaved forest: ENF, deciduous broad-leaved forest: DBF, deciduous needle-leaved forest: DNF, mixed forest: MF.
4.3 Comparison to the forest NPP–age curves built previously in China
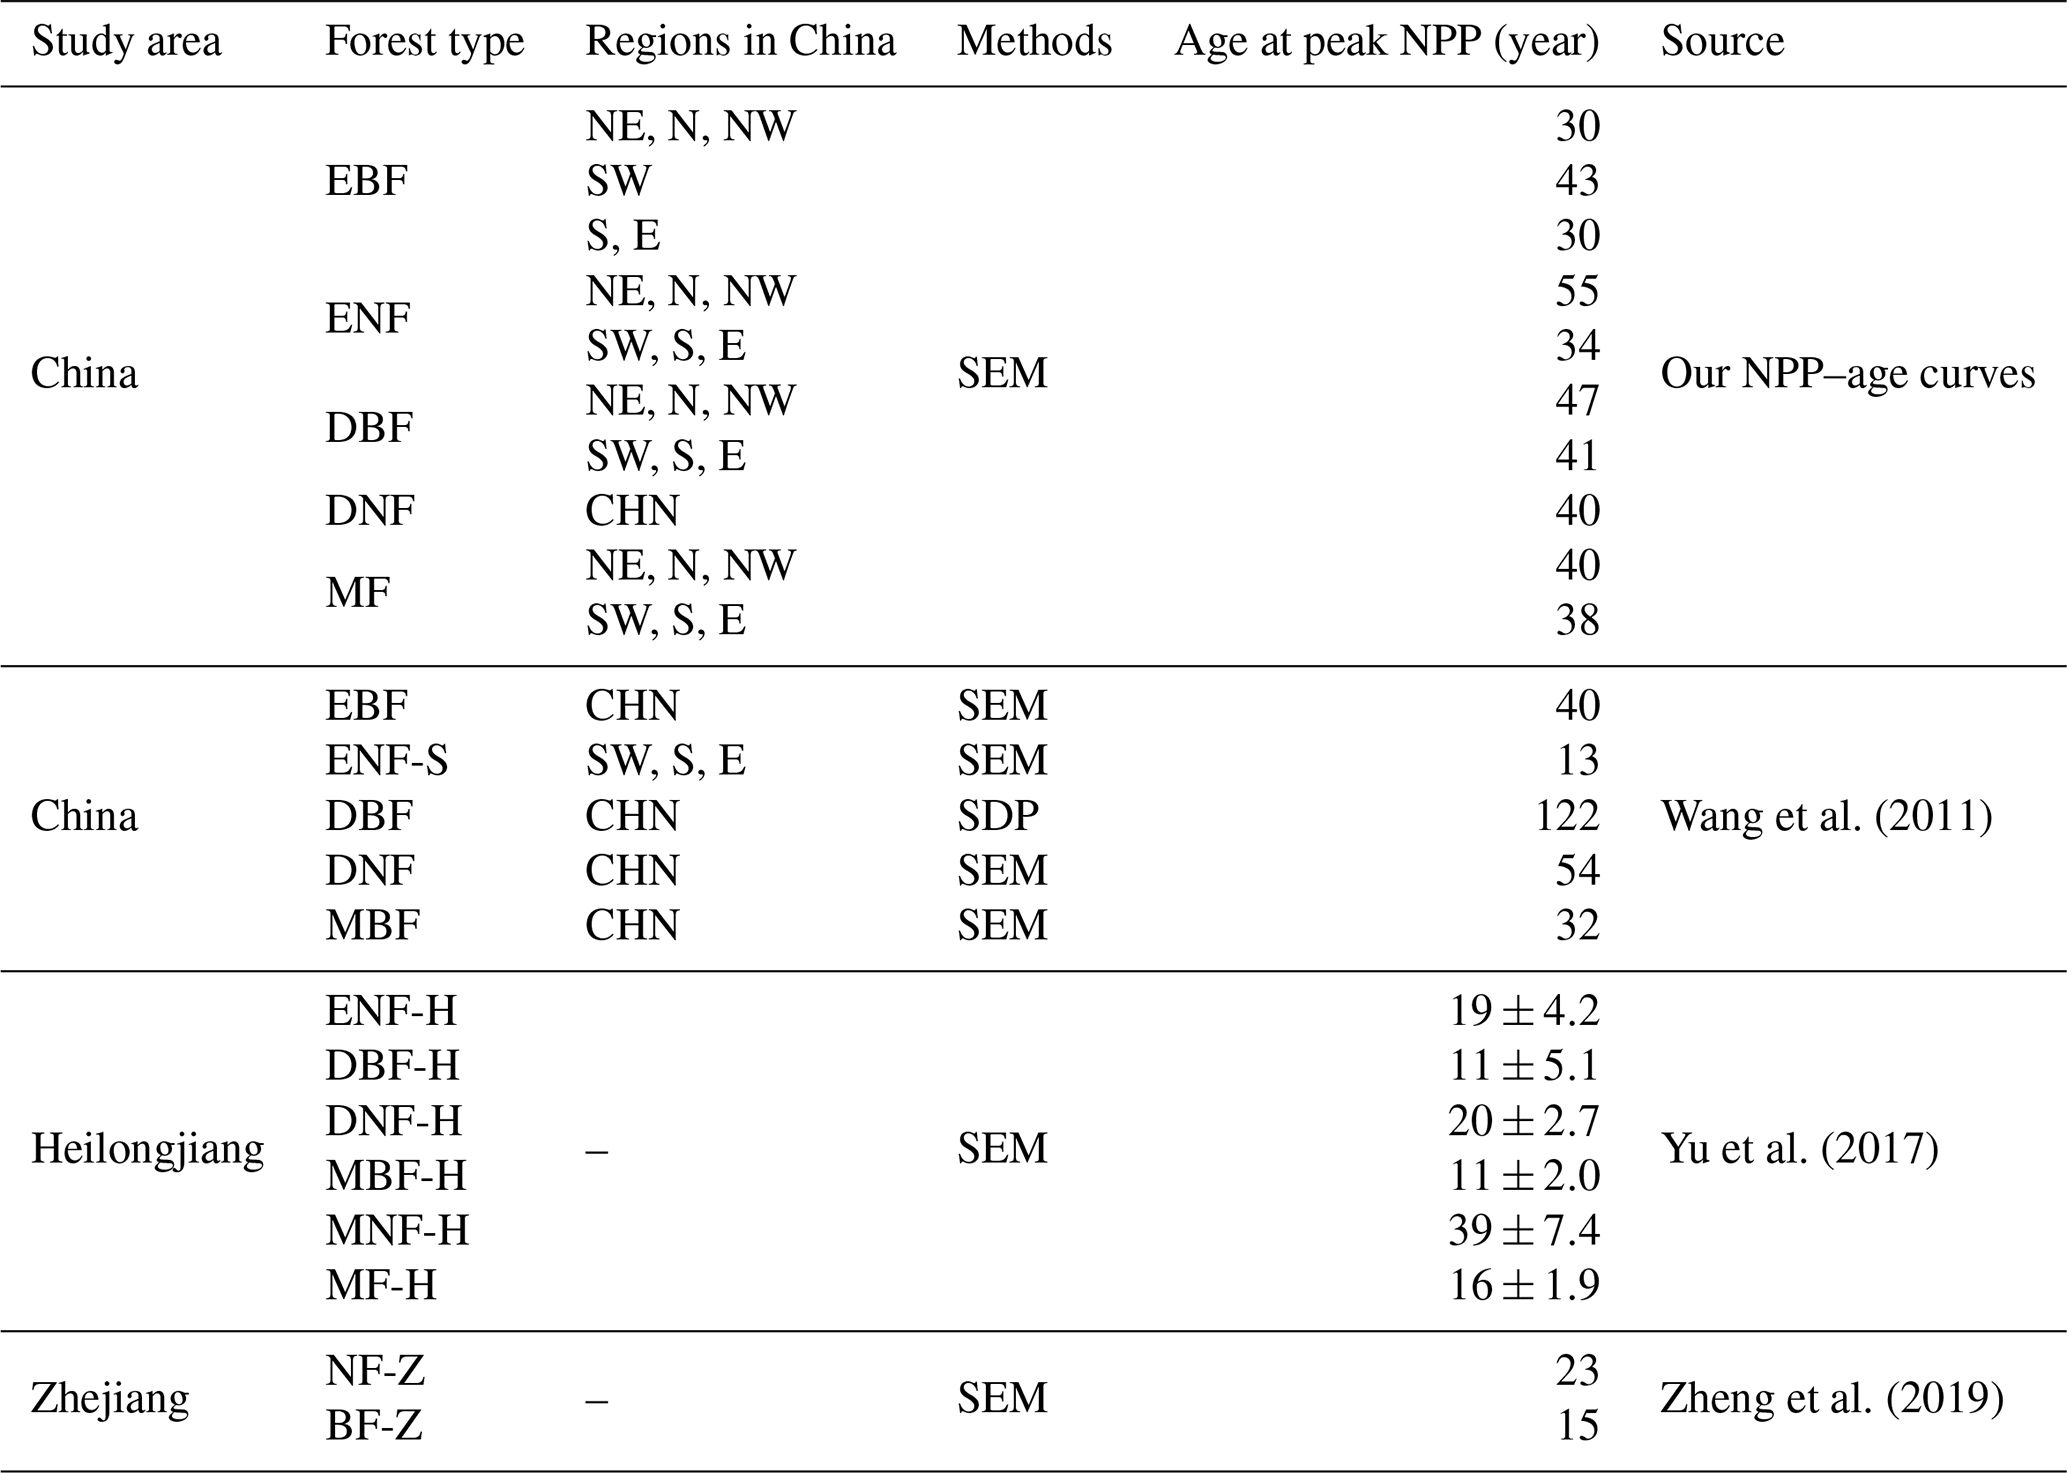
The forest NPP–age curve could be depicted by a key characteristic: the age at which forest NPP peaks (shortened as peak NPP age). The 10 forest NPP–age curves built by the SEM function in this study were compared to the forest NPP–age curves built previously in China using this characteristic (Table 3). Climate factors have a significant influence on the peak NPP age (Zhang et al., 2017). The NPP–age curves of forests in southern regions, characterized by higher temperatures, generally exhibit an earlier age of peak NPP compared to forests in the northern regions with lower temperatures.
EBF achieves its highest NPP at 30 years in the NE, N, NW, S, and E regions, while this peak occurs at 42 years in region SW, similar to the previously reported average peak age of 40 years for EBF in China (Wang et al., 2011). The peak NPP for ENF is achieved at 55 years in the northern regions, while it occurs at 34 years in the southern regions, aligned with previous reports where the peak age in the northern regions is 21 years later compared to the southern regions (Xu et al., 2010). But in the southern regions, our peak NPP age of 34 years was significantly different from the 13 years reported by Wang et al. (2011). However, their fitting points showed a significant bimodal distribution around 13 and 53 years. Considering this bimodal distribution, the average peak NPP age could be 33 years, which is more closely aligned with our findings.
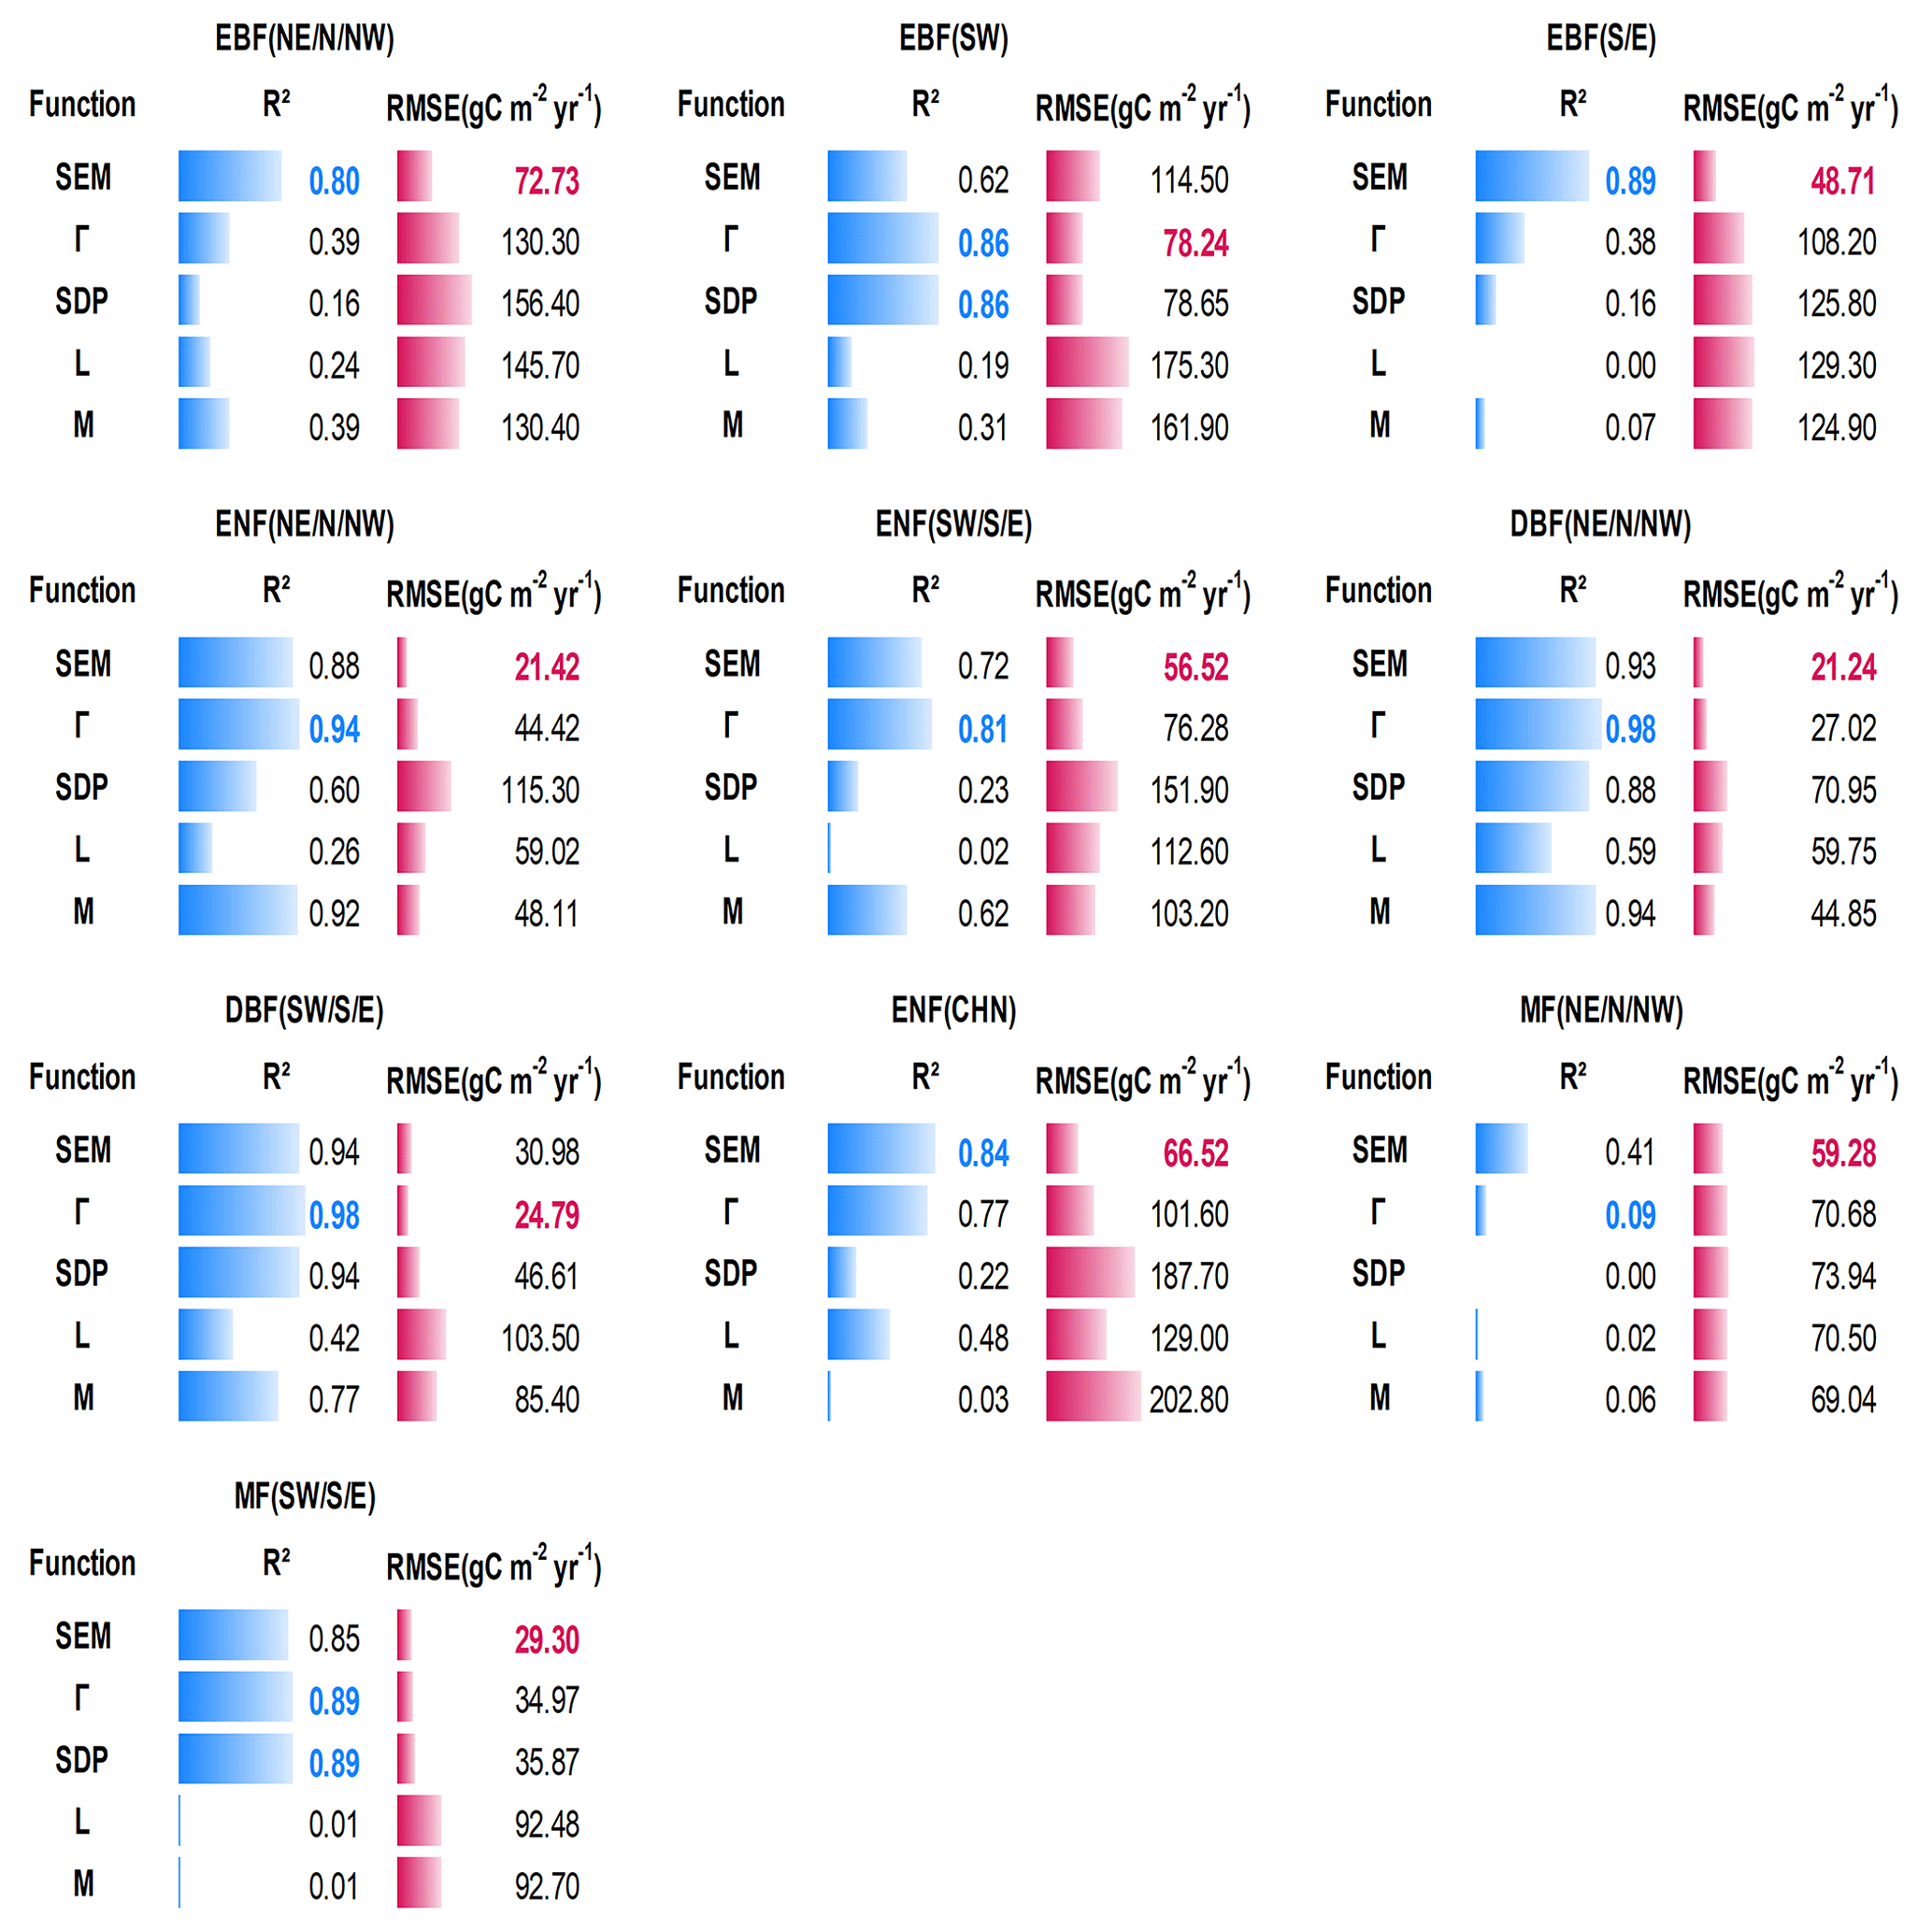
Figure 5Quantitative descriptions of the five models in building the forest NPP–age curves for different forest cover types and regions in China. The highest R2 is labeled in green, and the lowest RMSE is labeled in red. Northeast China: NE, north China: N, northwest China: NW, east China: E, south China: S, southwest China: SW, evergreen broad-leaved forest: EBF, evergreen needle-leaved forest: ENF, deciduous broad-leaved forest: DBF, deciduous needle-leaved forest: DNF, mixed forest: MF.
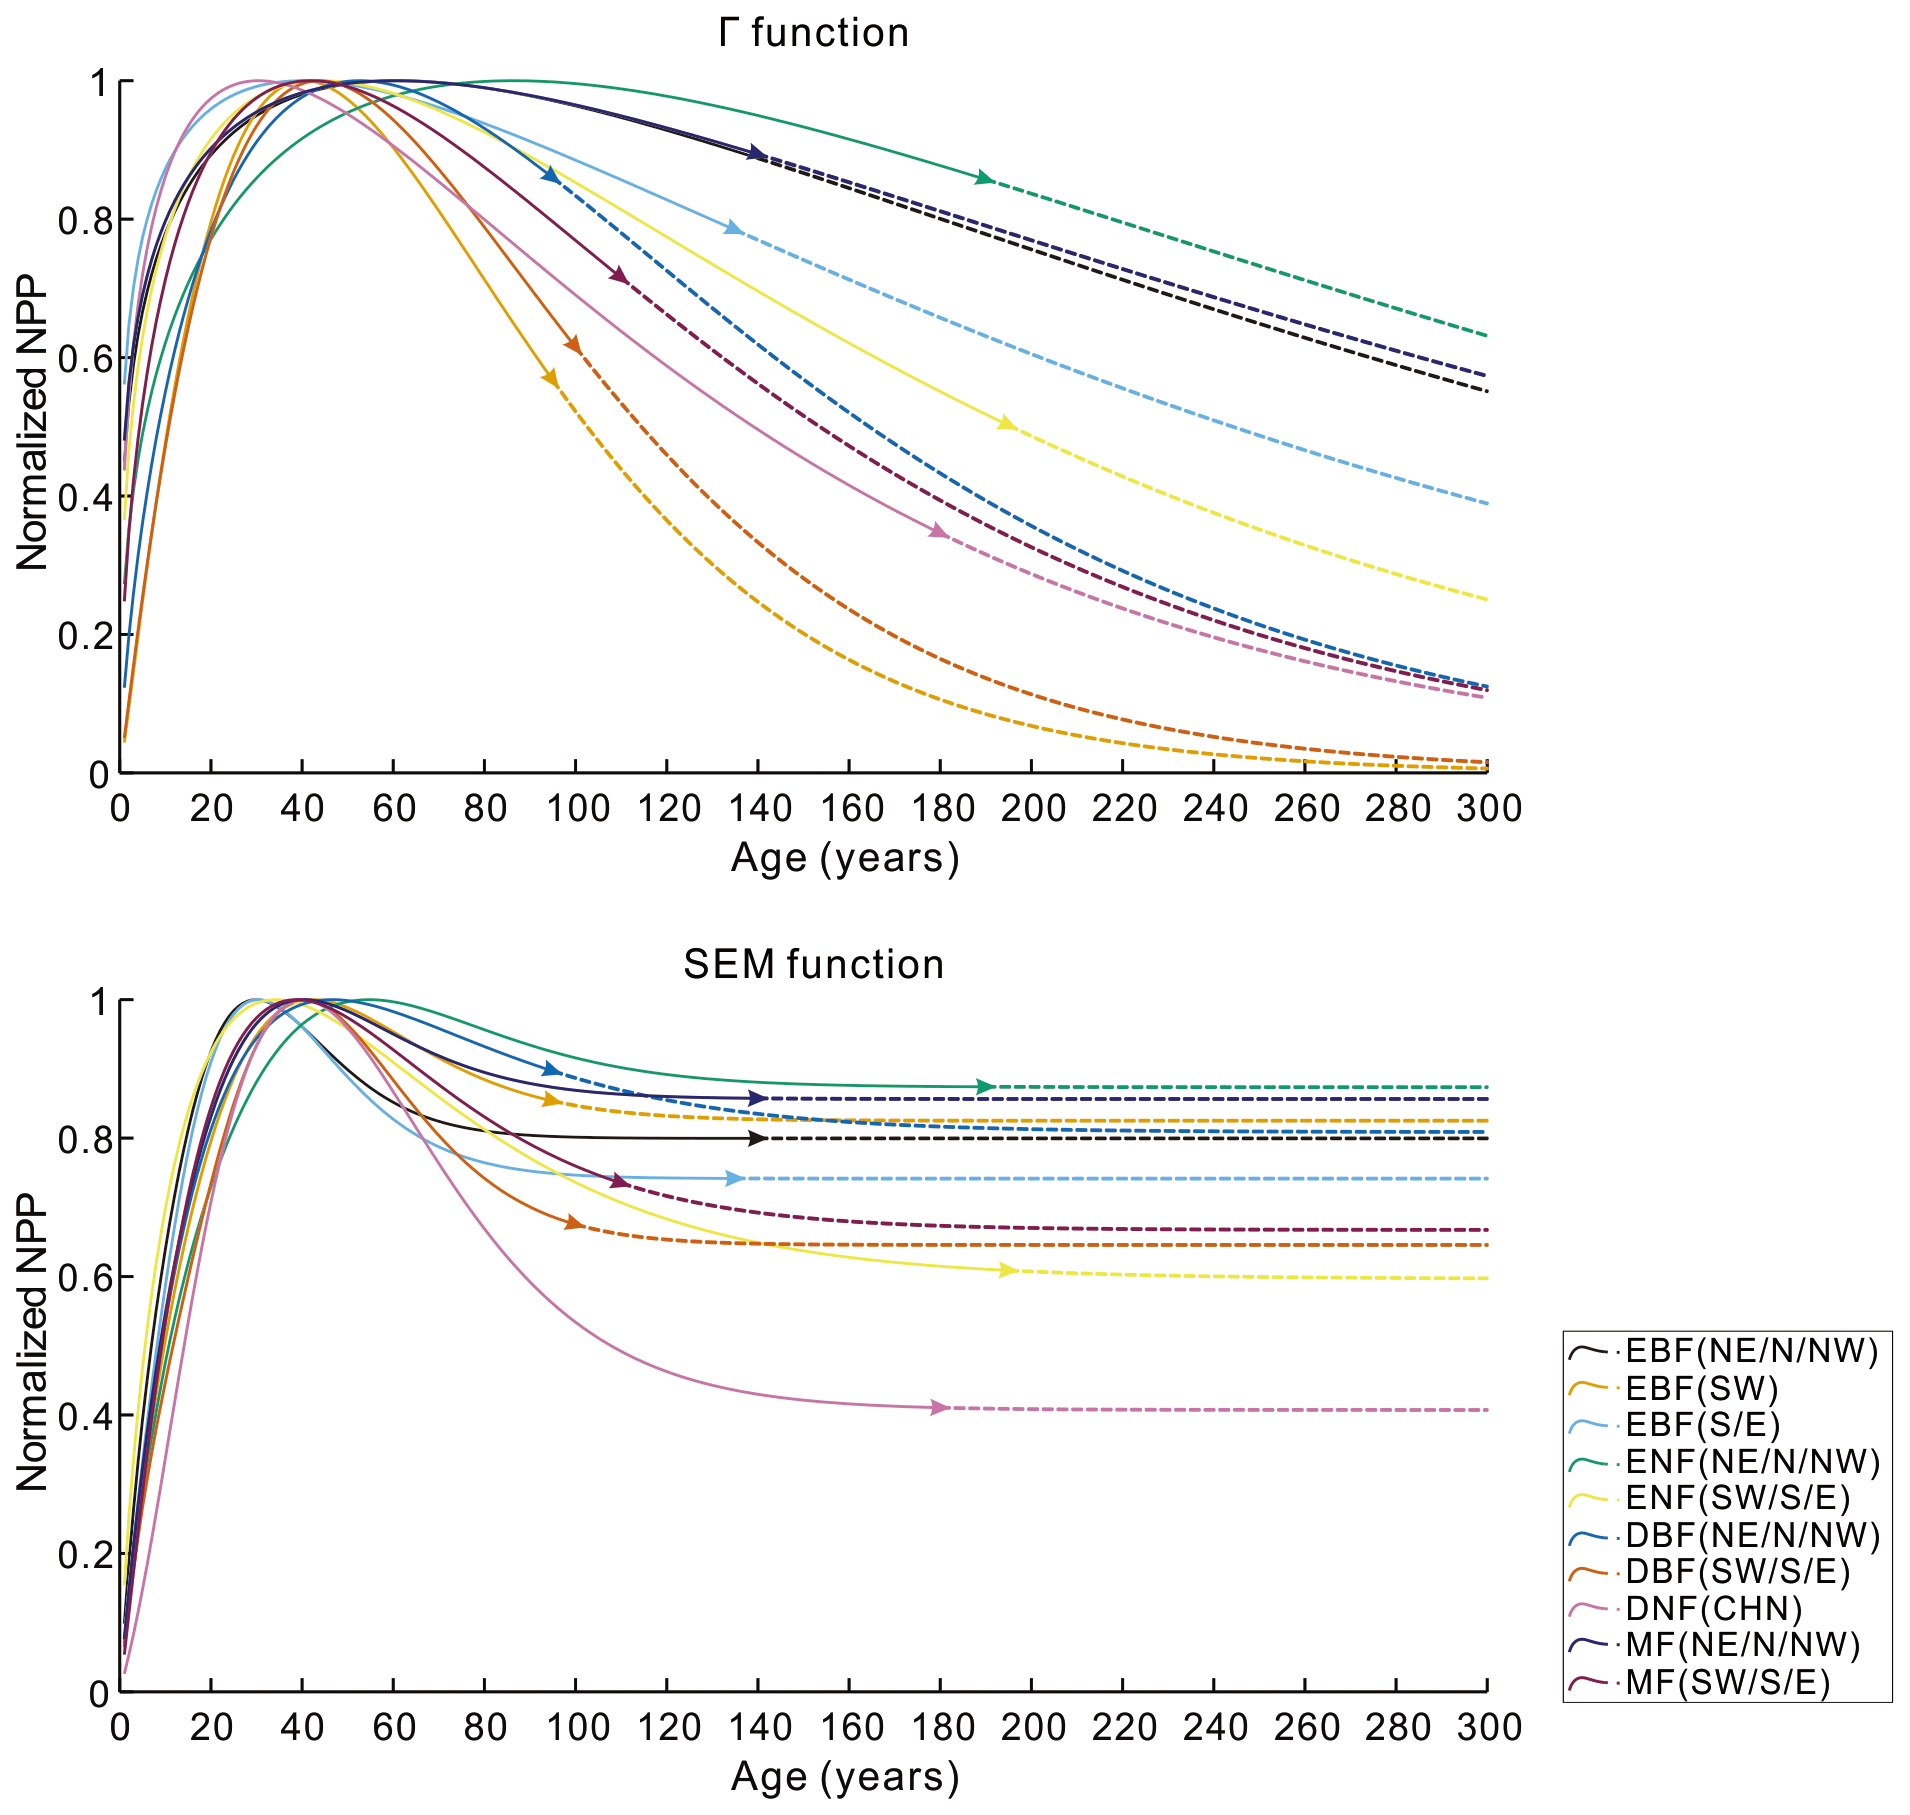
Figure 6The normalized NPP–age curves built from the SEM function and the Γ function with the forest age extended to 300 years. The solid lines are for the age period with field data (the triangle in each line indicates the largest age with the field data), and the dashed lines are for the age period without field data. Northeast China: NE, north China: N, northwest China: NW, east China: E, south China: S, southwest China: SW, evergreen broad-leaved forest: EBF, evergreen needle-leaved forest: ENF, deciduous broad-leaved forest: DBF, deciduous needle-leaved forest: DNF, mixed forest: MF.
DBF, predominantly located in the northern regions, peaks in NPP at the age of 47, slightly later than the southern regions where the peak is observed at 41 years. These two values were much smaller than the 122 years reported by Wang et al. (2011), where the NPP–age curve for DBF was built by the SDP function instead of the SEM function. This large difference for DBF was also noticed by He et al. (2012), and our results were consistent with the peak NPP age of 27±16.5 for BDFs in America (He et al., 2012).
DNF, of which 60.2 % are located in the northern regions, reaches peak NPP at the age of 40 years, congruent with the peak growth age derived from the same region by other researchers using the logistic stand growth model with National Forest Inventory (NFI) data (Xu et al., 2010). Our peak age differed by 14 years from the 54 years reported by Wang et al. (2011). However, their fitting points demonstrated that the peak NPP spanned ages from 20 to 70 years (Wang et al., 2011), with an average of 45 years, which aligns more closely with our peak NPP age.
MF reached the peak NPP at the age of 40 in the northern regions and 39 years in the southern regions, presenting a deviation of less than 8 years compared to Wang et al. (2011) and a consistent peak NPP reported in Heilongjiang province by Yu et al. (2017). The peak NPP age of our national NPP–age curve shows substantial differences from the peak NPP ages identified by Yu et al. (2017) and Zheng et al. (2019) in their respective studies on the Heilongjiang and Zhejiang provinces. This could be attributed to significant variations in forest growth patterns nationwide compared to these specific provinces, arising from various factors including but not limited to forest species, climatic conditions, and soil types (Dai et al., 2011; Zhao and Zhou, 2006; Ji et al., 2020; Xiaoyun et al., 2018).
Table 3Comparison of the forest NPP–age curves built previously in China at the peak NPP age. Northeast China: NE; north China: N; northwest China: NW; east China: E; south China: S; southwest China: SW; evergreen broad-leaved forest: EBF; evergreen needle-leaved forest: ENF; deciduous broad-leaved forest: DBF; deciduous needle-leaved forest: DNF; mixed forest: MF; ENF in the tropics and subtropics: ENF-S; mixed broad-leaved forest: MBF; ENF in Heilongjiang province, including Pinus sylvestris and Pinus koraiensis: ENF-H; DBF in Heilongjiang province, including Quercus mongolica, planted Populus, Populus davidiana, Betula davuria, Tilia, and Betula platyphylla: DBF-H; Larix gmelinii in Heilongjiang province: DNF-H; mixed broad-leaved forest in Heilongjiang province: MBF-H; mixed needle-leaved forest in Heilongjiang province: MNF-H; mixed forest in Heilongjiang province: MF-H; needle-leaved forest in Zhejiang province: NF-Z; broad-leaved forest in Zhejiang province: BF-Z.
In this study, we derived 10 forest NPP–age curves for 6 regions and 5 forest cover types in China based on 3121 forest field samples (Fang et al., 2018) and 5 tested mathematical models including the SEM function, SDP function, L function, M function, and Γ function for simulating the curves. The SEM function and Γ function performed prominently in fitting all 10 curves, nearly perfectly capturing NPP variations with forest age, while for the SDP function, L function, and M function, the NPP–age variations were not well captured. The declining trend in forest NPP at old ages was not captured by the L function and M function, while the SDP function exhibited a sharp decline in NPP to zero before reaching 200 years in five forest NPP–age curves. These results were consistent with the study that compared NPP–age relationships in boreal and temporal forests constructed using the SDP function, L function, M function, and Γ function (Tang et al., 2014). Further analysis using the normalized NPP–age curves with forest age extended to 300 years suggested that the Γ function tends to force NPP to be zero at old ages for some forest NPP–age curves due to the limited old-aged forest field survey samples. Considering the overall performance with currently available field survey samples, the SEM function was regarded as optimal for building forest NPP–age curves in China.
5.1 The mechanism of NPP–age variations
Forest NPP exhibits a rapid increase at young ages, reaching a peak at middle ages, and subsequently declining at old ages (Chen et al., 2003; Yu et al., 2017; He et al., 2012). The increase in forest NPP at young ages is mainly driven by a fast increase in leaf area (Ryan et al., 1997; Yu et al., 2014), when the forest stand is relatively open with low competition for light, water, and nutrients (Gower et al., 1996; Yan et al., 2006). Previous studies have attributed the decline in NPP in aging forests primarily to the reduction in gross primary productivity (GPP) as the forest ages, while autotrophic respiration (Ra) increases with age (Kira and Shidei, 1967; Odum, 1969). However, recent studies have challenged this classical view, revealing that the age-driven decline in NPP is primarily driven by the decrease in both GPP and Ra as forests age, with GPP declining at a faster rate than Ra (Drake et al., 2011; Ryan et al., 1997, 2004; Ryan and Waring, 1992; Tang et al., 2014). This decline in forest NPP at old ages can be attributed to nutrient limitation and ecosystem succession (Camenzind et al., 2018; Fisher et al., 2012; Gao et al., 2018; Gough et al., 2008). As forest age increases, soil nutrients are often depleted to some extent. Trees respond by intensified competition for these nutrients by growing more fine roots to absorb them (Ryan et al., 1997; Tang et al., 2011). This increased competition can lead to nutrient deficiency and decreased NPP. However, old forests can maintain stable growth conditions through self-renewal and continue to accumulate carbon with a magnitude of carbon sinks ranging from 1.0 to 3.2 Mg C ha−1 yr−1 (Gundersen et al., 2021; Luyssaert et al., 2008).
Generally, forest NPP in southern China tends to reach its peak earlier than that in northern China (Yu et al., 2017; Wang et al., 2018; Zheng et al., 2019). This pattern can be attributed to China's wide latitudinal range, resulting in significant variations in temperature and precipitation. Higher temperatures and precipitation contribute to an earlier peak of forest NPP in southern China (Litton et al., 2007; Sillett et al., 2010). Moreover, microscale factors, such as increased hydraulic resistance of tall trees, diminished nutrient supply, and the contraction of leaf area due to crown abrasion, may also contribute to the decline in NPP at younger ages (Ryan et al., 1997).
5.2 Limitations and future modifications
There were also some limitations in this study. First, considering the sample numbers, distributions, and age groups, only 10 forest NPP–age curves were derived across the entire China. Except for DNF, the differences in forest NPP–age curves between the southern and northern regions of China (Dai et al., 2011) were considered for all forest cover types. For EBF, its samples were sufficient to separate two forest NPP–age curves in southern China: one is for region SW, and the other is for regions S and E. The constructed forest NPP–age curve may not be universally applicable to all areas within the region or specific forest types. For future modifications, it is advisable to incorporate additional samples and develop separate NPP–age curves tailored to smaller regions.
Second, mortality is ignored in this study due to a lack of observations at the ground plots and its average small proportion of NPP except for extreme conditions. According to He et al. (2012), mortality considered in NPP calculations typically includes standing dead trees and downed dead wood, which, in the United States, accounted for an average of 3.7 % of NPP across 18 forest type groups (Shang et al., 2023). Similarly, in China, mortality varies among different tree species and regions. For example, in northeast China, 17 major tree species experience a drought-induced mortality rate of 0.49 % (Ma et al., 2023). In Fujian Province, according to the eighth and ninth NFI data, the average loss rate of forest stock volume due to mortality was 2.5 % and 3.49 % of the total stock volume, respectively. When converting stock volume into NPP, these proportions attributed from mortality can be even smaller (Zhang et al., 2019) because the calculation of NPP includes additional components such as foliage turnover and fine-root turnover in the soil. Nonetheless, in specific environmental conditions such as droughts, fires, and pest infestations (Shang et al., 2022), the mortality rate of certain tree species can increase significantly, sometimes comprising a substantial proportion of the aboveground NPP (Xu et al., 2012; Ding et al., 2023). Despite this, when constructing the NPP–age curve, these extreme mortality rates were not taken into account, as we mainly focused on the average state across a larger region. Considering the small contribution of mortality to overall NPP and the paucity of ground plot data, mortality was overlooked in this study. Future research efforts could focus on collecting mortality data to enhance the building of the NPP–age curves and consider the use of NPP–age curves under extreme conditions to simulate variations in forest carbon sequestration during extreme events.
Third, the turnovers of leaves and fine roots, which were also two important components of the field NPP, were calculated based on the assumption that fine-root production is linearly correlated with the production of leaves (Litton et al., 2007; He et al., 2012). This assumption was supported by the correlation between new fine-root carbon and new leaf carbon indicated by the field measurements (Burkes et al., 2003; DesRochers and Lieffers, 2001). It should be noted that fine-root production could also be affected by other factors such as soil texture, moisture, and climate (Zerihun and Montagu, 2004), which might be calculated from other carbon allocation methods in future modifications (White et al., 2000).
Fourth, the old-aged forest field survey samples were limited for some forest cover types and regions, resulting in a sharp decrease in forest NPP at old ages for some forest NPP–age curves built by the Γ function. This phenomenon does not deny that the Γ function can simulate the relationship between NPP and forest age well in the range of forest age with field survey samples. With more old-aged forest field survey samples collected, the Γ function could also be a good choice for building the forest NPP–age curves and serves as the model inputs to facilitate forest carbon cycle modeling with a process-based model.
Last, the site condition was not considered in the building of the forest NPP–age curves. It has been shown that the site condition can impact the forest NPP–age variations, and better site conditions can result in faster growth of NPP at young ages, greater peak NPP, and steeper decline in NPP at old ages (Yu et al., 2017; Wang et al., 2018). However, the lack of site condition data impeded our ability to build separate forest NPP–age curves according to the site conditions. Regardless of these limitations, this study still provides valuable insights into forest NPP–age variations, and collecting more comprehensive data in the future can further enhance the construction of forest NPP–age curves.
In this study, we investigated the relationship between forest NPP and age in China by using 3121 forest field survey samples and remote sensing data. A total of 10 forest NPP–age curves were derived for the entire China's forests based on the spatial distributions of forest cover type, biomass, and age of the field survey data. Five models, including the SEM function, SDP function, L function, M function, and Γ function, were compared to determine the optimal model for building the forest NPP–age curves in China. The comparison against the survey data showed that the SEM function and the Γ function performed much better than the other three models, and through extending forest ages to 300 years, we found that the SEM function was more applicable than the Γ function in capturing the forest NPP–age variations at old ages. Considering the overall performance with currently available field survey samples, the SEM function was regarded as optimal for building forest NPP–age curves in China. The built forest NPP–age curves offer an independent and comprehensive source of information for forest growth estimation and can facilitate forest carbon cycle modeling and future projection in China and elsewhere.
The codes for building the forest NPP–age relationships are available upon request from the corresponding authors.
The coefficients of the built forest NPP–age relationships are available in Table 2.
Conceptualization: RS and JMC; methodology: PL, RS, and JMC; validation: PL; formal analysis: PL, MX, and XL; writing (original draft): PL and RS; writing (review and editing): RS, JMC, and MX; funding acquisition: RS and MX; data curation: GY, NH, and LX.
The contact author has declared that none of the authors has any competing interests.
Publisher’s note: Copernicus Publications remains neutral with regard to jurisdictional claims made in the text, published maps, institutional affiliations, or any other geographical representation in this paper. While Copernicus Publications makes every effort to include appropriate place names, the final responsibility lies with the authors.
Thanks to the two reviewers for their valuable comments and suggestions, as well as to the editors for their assistance with the manuscript.
This research was funded by the Fujian Forestry Science and Technology Key Project (grant no. 2022FKJ03), the National Natural Science Foundation of China (grant nos. 42101367 and 42201360), the Natural Science Foundation of Fujian Province (grant no. 2021J05041), and the Open Fund Project of the Academy of Carbon Neutrality of Fujian Normal University (grant no. TZH2022-02).
This paper was edited by David Medvigy and reviewed by two anonymous referees.
Alexandrov, G. A., Oikawa, T., and Esser, G.: Estimating terrestrial NPP: what the data say and how they may be interpreted?, Ecol. Modell., 117, 361–369, https://doi.org/10.1016/S0304-3800(99)00019-8, 1999.
Bond-Lamberty, B., Wang, C., and Gower, S. T.: Net primary production and net ecosystem production of a boreal black spruce wildfire chronosequence, Glob. Change Biol., 10, 473–487, https://doi.org/10.1111/j.1529-8817.2003.0742.x, 2004.
Burkes, E. C., Will, R. E., Barron-Gafford, G. A., Teskey, R. O., and Shiver, B.: Biomass partitioning and growth efficiency of intensively managed Pinus taeda and Pinus elliottii stands of different planting densities, Forest Sci., 49, 224–234, 2003.
Camenzind, T., Hättenschwiler, S., Treseder, K. K., Lehmann, A., and Rillig, M. C.: Nutrient limitation of soil microbial processes in tropical forests, Ecol. Monogr., 88, 4–21, https://doi.org/10.1002/ecm.1279, 2018.
Chapin, F. S., III, Woodwell, G. M., Randerson, J. T., Rastetter, E. B., Lovett, G. M., Baldocchi, D. D., Clark, D. A., Harmon, M. E., and Schimel, D. S.: Reconciling carbon-cycle concepts, terminology, and methods, Ecosystems, 9, 1041–1050, https://doi.org/10.1007/s10021-005-0105-7, 2006.
Chen, J. M., Ju, W., Cihlar, J., Price, D., Liu, J., Chen, W., Pan, J., Black, A., and Barr, A.: Spatial distribution of carbon sources and sinks in Canada's forests, Tellus B, 55, 622–641, https://doi.org/10.3402/tellusb.v55i2.16711, 2003.
Chen, J. M., Mo, G., Pisek, J., Liu, J., Deng, F., Ishizawa, M., and Chan, D.: Effects of foliage clumping on the estimation of global terrestrial gross primary productivity, Global Biogeochem. Cy., 26, GB1019, https://doi.org/10.1029/2010GB003996, 2012.
Chen, W., Chen, J., and Cihlar, J.: An integrated terrestrial ecosystem carbon-budget model based on changes in disturbance, climate, and atmospheric chemistry, Ecol. Modell., 135, 55–79, https://doi.org/10.1016/S0304-3800(00)00371-9, 2000.
Chen, W., Chen, J. M., Price, D. T., and Cihlar, J.: Effects of stand age on net primary productivity of boreal black spruce forests in Ontario, Canada, Can. J. Forest Res., 32, 833–842, https://doi.org/10.1139/x01-165, 2002.
Dai, L., Wang, Y., Su, D., Zhou, L., Yu, D., Lewis, B. J., and Qi, L.: Major forest types and the evolution of sustainable forestry in China, Environ. Manag., 48, 1066–1078, https://doi.org/10.1007/s00267-011-9706-4, 2011.
Dalgleish, S. A., Van Etten, E. J. B., Stock, W. D., and Knuckey, C.: Fuel dynamics and vegetation recovery after fire in a semiarid Australian shrubland, Int. J. Wildl. Fire, 24, 613–623, https://doi.org/10.1071/WF14128, 2015.
DesRochers, A. and Lieffers, V. J.: Root biomass of regenerating aspen (Populus tremuloides) stands of different densities in Alberta, Can. J. Forest Res., 31, 1012–1018, https://doi.org/10.1139/x01-037, 2001.
Ding, Z., Ji, B., Yao, H., Cheng, X., Yu, S., Sun, X., Liu, S., Xu, L., Zhou, Y., and Shi, Y.: An Analysis of the Factors Affecting Forest Mortality and Research on Forecasting Models in Southern China: A Case Study in Zhejiang Province, Forests, 14, 2199, https://doi.org/10.3390/f14112199, 2023.
Do, H. T. T., Zimmer, H. C., Vanclay, J. K., Grant, J. C., Trinh, B. N., Nguyen, H. H., and Nichols, J. D.: Site form classification – a practical tool for guiding site-specific tropical forest landscape restoration and management, Forestry, 95, 261–273, https://doi.org/10.1093/forestry/cpab046, 2022.
Drake, J. E., Davis, S. C., Raetz, L. M., and Delucia, E. H.: Mechanisms of age-related changes in forest production: The influence of physiological and successional changes, Glob. Change Biol., 17, 1522–1535, https://doi.org/10.1111/j.1365-2486.2010.02342.x, 2011.
Eggleston, S., Buendia, L., Miwa, K., Ngara, T., and Tanabe, K.: 2006 IPCC Guidelines for National Greenhouse Gas Inventories, V.4. Agriculture, Forestry and Other Land Use, Institute for Global Environmental Strategies (IGES), ISBN 4-88788-032-4, 2006.
Fang, J., Yu, G., Liu, L., Hu, S., and Stuart Chapin, F.: Climate change, human impacts, and carbon sequestration in China, P. Natl. Acad. Sci. USA, 115, 4015–4020, https://doi.org/10.1073/pnas.1700304115, 2018.
Fang, J., Chen, A., Peng, C., Zhao, S., and Ci, L.: Changes in forest biomass carbon storage in China between 1949 and 1998, Science, 292, 2320–2322, https://doi.org/10.1126/science.1058629, 2001a.
Fang, J., Ke, J., Tang, Z., and Chen, A.: Implications and estimations of four terrestrial productivity parameters, Acta Phytoecol. Sin., 25, 414–419, https://europepmc.org/article/cba/540929, 2001b.
Fisher, J. B., Badgley, G., and Blyth, E.: Global nutrient limitation in terrestrial vegetation, Global Biogeochem. Cy., 26, GB3007, https://doi.org/10.1029/2011GB004252, 2012.
Friedlingstein, P., O'Sullivan, M., Jones, M. W., Andrew, R. M., Hauck, J., Olsen, A., Peters, G. P., Peters, W., Pongratz, J., Sitch, S., Le Quéré, C., Canadell, J. G., Ciais, P., Jackson, R. B., Alin, S., Aragão, L. E. O. C., Arneth, A., Arora, V., Bates, N. R., Becker, M., Benoit-Cattin, A., Bittig, H. C., Bopp, L., Bultan, S., Chandra, N., Chevallier, F., Chini, L. P., Evans, W., Florentie, L., Forster, P. M., Gasser, T., Gehlen, M., Gilfillan, D., Gkritzalis, T., Gregor, L., Gruber, N., Harris, I., Hartung, K., Haverd, V., Houghton, R. A., Ilyina, T., Jain, A. K., Joetzjer, E., Kadono, K., Kato, E., Kitidis, V., Korsbakken, J. I., Landschützer, P., Lefèvre, N., Lenton, A., Lienert, S., Liu, Z., Lombardozzi, D., Marland, G., Metzl, N., Munro, D. R., Nabel, J. E. M. S., Nakaoka, S.-I., Niwa, Y., O'Brien, K., Ono, T., Palmer, P. I., Pierrot, D., Poulter, B., Resplandy, L., Robertson, E., Rödenbeck, C., Schwinger, J., Séférian, R., Skjelvan, I., Smith, A. J. P., Sutton, A. J., Tanhua, T., Tans, P. P., Tian, H., Tilbrook, B., van der Werf, G., Vuichard, N., Walker, A. P., Wanninkhof, R., Watson, A. J., Willis, D., Wiltshire, A. J., Yuan, W., Yue, X., and Zaehle, S.: Global Carbon Budget 2020, Earth Syst. Sci. Data, 12, 3269–3340, https://doi.org/10.5194/essd-12-3269-2020, 2020.
Gao, B., Taylor, A. R., Searle, E. B., Kumar, P., Ma, Z., Hume, A. M., and Chen, H. Y. H.: Carbon storage declines in old boreal forests irrespective of succession pathway, Ecosystems, 21, 1168–1182, https://doi.org/10.1007/s10021-017-0210-4, 2018.
Gough, C. M., Vogel, C. S., Schmid, H. P., and Curtis, P. S.: Controls on annual forest carbon storage: lessons from the past and predictions for the future, Bioscience, 58, 609–622, https://doi.org/10.1641/B580708, 2008.
Gower, S. T., McMurtrie, R. E., and Murty, D.: Aboveground net primary production decline with stand age: potential causes, Trend. Ecol. Evol., 11, 378–382, https://doi.org/10.1016/0169-5347(96)10042-2, 1996.
Gower, S. T., Vogel, J. G., Norman, J. M., Kucharik, C. J., and Steele, S. J.: Carbon distribution and aboveground net primary production in aspen, jack pine, and black spruce stands in Saskatchewan and Manitoba, Canada, J. Geophys. Res.-Atmos., 102, 29029–29041, https://doi.org/10.1029/97JD02317, 1997.
Gundersen, P., Thybring, E. E., Nord-Larsen, T., Vesterdal, L., Nadelhoffer, K. J., and Johannsen, V. K.: Old-growth forest carbon sinks overestimated, Nature, 591, E21–E23, https://doi.org/10.1038/s41586-021-03266-z, 2021.
Guo, L., An, N., and Wang, K.: Journal of Geophysical Research, Nature, 175, 238, https://doi.org/10.1038/175238c0, 1955.
Harmon, M. E., Ferrell, W. K., and Franklin, J. F.: Effects on carbon storage of conversion of old-growth forests to young forests, Science, 247, 699–702, https://doi.org/10.1126/science.247.4943.699, 1990.
Hasenauer, S.: the significance of remote sensing in the good practice guidance for land use, land-use change and forestry as specified by the kyoto protocol, Diploma Thesis, https://publik.tuwien.ac.at/files/PubDat_119760.pdf (last access: 25 October 2023), 2004.
He, L., Chen, J. M., Pan, Y., Birdsey, R., and Kattge, J.: Relationships between net primary productivity and forest stand age in U.S. forests, Global Biogeochem. Cy., 26, 1–19, https://doi.org/10.1029/2010GB003942, 2012.
Hicke, J. A., Jenkins, J. C., and Ducey, O. M.: Spatial patterns of forest characteristics in the western United States derived from inventories, Ecol. Appl., 17, 2387–2402, https://doi.org/10.1890/06-1951.1, 2007.
Kira, T. and Shidei, T.: Primary production and turnover of organic matter in different forest ecosystems of the western Pacific, Japn. J. Ecol., 17, 70–87, https://doi.org/10.18960/seitai.17.2_70, 1967.
Ji, Y., Zhou, G., Luo, T., Dan, Y., Zhou, L., and Lv, X.: Variation of net primary productivity and its drivers in China's forests during 2000–2018, Forest Ecosyst., 7, 1–11, https://doi.org/10.1186/s40663-020-00229-0, 2020.
Ju, W., Chen, J. M., Black, T. A., Barr, A. G., Liu, J., and Chen, B.: Modelling multi-year coupled carbon and water fluxes in a boreal aspen forest, Agr. Forest Meteorol., 140, 136–151, https://doi.org/10.1016/j.agrformet.2006.08.008, 2006.
Li, Z. and Zhou, T.: Optimization of forest age-dependent light-use efficiency and its implications on climate-vegetation interactions in China, Int. Arch. Photogramm. Remote Sens. Spat. Inf. Sci. – ISPRS Arch. 40, 449–454, https://doi.org/10.5194/isprsarchives-XL-7-W3-449-2015, 2015.
Litton, C. M., Raich, J. W., and Ryan, M. G.: Carbon allocation in forest ecosystems, Glob. Change Biol., 13, 2089–2109, https://doi.org/10.1111/j.1365-2486.2007.01420.x, 2007.
Liu, H., Gong, P., Wang, J., Wang, X., Ning, G., and Xu, B.: Production of global daily seamless data cubes and quantification of global land cover change from 1985 to 2020 – iMap World 1.0, Remote Sens. Environ., 258, 112364, https://doi.org/10.1016/j.rse.2021.112364, 2021.
Liu, J., Chen, J. M., Cihlar, J., and Chen, W.: Net primary productivity distribution in the boreas region from a process model using satellite and surface data, J. Geophys. Res.-Atmos., 104, 27735–27754, https://doi.org/10.1029/1999JD900768, 1999.
Liu, J., Chen, J. M., Cihlar, J., and Chen, W.: Net primary productivity mapped for Canada at 1-km resolution, Glob. Ecol. Biogeogr., 11, 115–129, https://doi.org/10.1046/j.1466-822X.2002.00278.x, 2002.
Liu, Y., Liu, R., and Chen, J. M.: Retrospective retrieval of long-term consistent global leaf area index (1981–2011) from combined AVHRR and MODIS data, J. Geophys. Res.-Biogeo., 117, 1–14, https://doi.org/10.1029/2012JG002084, 2012a.
Liu Y., Yu G., Wang Q., and Zhang Y.: Huge carbon sequestration potential in global forests, J. Resour. Ecol., 3, 193–201, https://doi.org/10.5814/j.issn.1674-764x.2012.03.001, 2012b.
Luyssaert, S., Inglima, I., Jung, M., Richardson, A. D., Reichstein, M., Papale, D., Piao, S. L., Schulze, E.-D., Wingate, L., Matteucci, G., Aragao, L., Aubinet, M., Beer, C., Bernhofer, C., Black, K. G., Bonal, D., Bonnefond, J.-M., Chambers, J., Ciais, P., Cook, B., Davis, K. J., Dolman, A. J., Gielen, B., Goulden, M., Grace, J., Granier, A., Grelle, A., Griffis, T., Grünwald, T., Guidolotti, G., Hanson, P. J., Harding, R., Hollinger, D.Y., Hutyra, L. R., Kolari, P., Kruijt, B., Kutsch, W., Lagergren, F., Laurila, T., Law, B. E., Le maire, G., Lindroth, A., Loustau, D., Malhi, Y., Mateus, J., Migliavacca, M., Misson, L., Montagnani, L., Moncrieff, J., Moors, E., Munger, J. W., Nikinmaa, E., Ollinger, S. V, Pita, G., Rebmann, C., Roupsard, O., Saigusa, N., Sanz, M. J., Seufert, G., Sierra, C., Smith, M.-L., Tang, J., Valentini, R., Vesala, T., and Janssens, I. A.: CO2 balance of boreal, temperate, and tropical forests derived from a global database, Glob. Change Biol. 13, 2509–2537, https://doi.org/10.1111/j.1365-2486.2007.01439.x, 2007.
Ma, T., Liang, Y., Li, Z., Liu, Z., Liu, B., Wu, M. M., Lau, M. K., and Fang, Y.: Age-related patterns and climatic driving factors of drought-induced forest mortality in Northeast China, Agr. Forest Meteorol., 332, 109360, https://doi.org/10.1016/j.agrformet.2023.109360, 2023.
Mund, M., Kummetz, E., Hein, M., Bauer, G. A., and Schulze, E.-D.: Growth and carbon stocks of a spruce forest chronosequence in central Europe, Forest Ecol. Manag. 171, 275–296, https://doi.org/10.1016/S0378-1127(01)00788-5, 2002.
Odum, E. P.: The strategy of ecosystem development, Science, 164, 262–270, https://doi.org/10.1126/science.164.3877.262, 1969.
Pan, Y., Birdsey, R. A., Fang, J., Houghton, R., Kauppi, P. E., Kurz, W. A., Phillips, O. L., Shvidenko, A., Lewis, S. L., Canadell, J. G., Ciais, P., Jackson, R. B., Pacala, S. W., McGuire, A. D., Piao, S., Rautiainen, A., Sitch, S., and Hayes, D.: A large and persistent carbon sink in the world's forests, Science, 333, 988–993, https://doi.org/10.1126/science.1201609, 2011.
Peper, P. J., McPherson, G. E., and Mori, S. M.: Predictive equations for dimensions and leaf area of coastal southern California street trees, J. Arboricul., 27, 169–180, https://doi.org/10.48044/jauf.2001.019, 2001.
Ryan, M. G. and Waring, R. H.: Maintenance respiration and stand development in a subalpine Lodgepole pine forest, Ecology, 73, 2100–2108, https://doi.org/10.2307/1941458, 1992.
Ryan, M. G., Binkley, D., and Fownes, J. H.: Age-Related Decline in Forest Productivity: Pattern and Process, Adv. Ecol. Res., 27, 213–262, https://doi.org/10.1016/S0065-2504(08)60009-4, 1997.
Ryan, M. G., Binkley, D., Fownes, J. H., Giardina, C. P., and Senock, R. S.: An experimental test of the causes of forest growth decline with stand age, Ecol. Monogr., 74, 393–414, https://doi.org/10.1890/03-4037, 2004.
Salas-Eljatib, C.: An approach to quantify climate–productivity relationships: an example from a widespread nothofagus forest, Ecol. Appl., 31, 1–14, https://doi.org/10.1002/eap.2285, 2021.
Semenzato, P., Cattaneo, D., and Dainese, M.: Growth prediction for five tree species in an Italian urban forest, Urban For. Urban Gree., 10, 169–176, https://doi.org/10.1016/j.ufug.2011.05.001, 2011.
Shang, R., Zhu, Z., Zhang, J., Qiu, S., Yang, Z., Li, T., and Yang, X.: Near-real-time monitoring of land disturbance with harmonized Landsats 7–8 and Sentinel-2 data, Remote Sens. Environ., 278, 113073, https://doi.org/10.1016/j.rse.2022.113073, 2022.
Shang, R., Chen, J. M., Xu, M., Lin, X., Li, P., Yu, G., He, N., Xu, L., Gong, P., Liu, L., Liu, H., and Jiao, W.: China's current forest age structure will lead to weakened carbon sinks in the near future, Innov., 4, 100515, https://doi.org/10.1016/j.xinn.2023.100515, 2023.
Sillett, S. C., Van Pelt, R., Koch, G. W., Ambrose, A. R., Carroll, A. L., Antoine, M. E., and Mifsud, B. M.: Increasing wood production through old age in tall trees, For. Ecol. Manage., 259, 976–994, https://doi.org/10.1016/j.foreco.2009.12.003, 2010.
Song, X., Zeng, X., and Tian, D.: Allocation of forest net primary production varies by forest age and air temperature, Ecol. Evol., 8, 12163–12172, https://doi.org/10.1002/ece3.4675, 2018.
Tang, J., Luyssaert, S., Richardson, A. D., Kutsch, W., and Janssens, I. A.: Steeper declines in forest photosynthesis than respiration explain age-driven decreases in forest growth, P. Natl. Acad. Sci. USA, 111, 8856–8860, https://doi.org/10.1073/pnas.1320761111, 2014.
Tang, X., Wang, Y. P., Zhou, G., Zhang, D., Liu, S., Liu, S., Zhang, Q., Liu, J., and Yan, J.: Different patterns of ecosystem carbon accumulation between a young and an old-growth subtropical forest in Southern China, Plant Ecol., 212, 1385–1395, https://doi.org/10.1007/s11258-011-9914-2, 2011.
Tang, X., Zhao, X., Bai, Y., Tang, Z., Wang, W., Zhao, Y., Wan, H., Xie, Z., Shi, X., Wu, B., Wang, G., Yan, J., Ma, K., Du, S., Li, S., Han, S., Ma, Y., Hu, H., He, N., Yang, Y., Han, W., He, H., Yu, G., Fang, J., and Zhou, G.: Carbon pools in China's terrestrial ecosystems: new estimates based on an intensive field survey, P. Natl. Acad. Sci. USA, 115, 4021–4026, https://doi.org/10.1073/pnas.1700291115, 2018.
Van Tuyl, S., Law, B. E., Turner, D. P., and Gitelman, A. I.: Variability in net primary production and carbon storage in biomass across Oregon forests – an assessment integrating data from forest inventories, intensive sites, and remote sensing, Forest Ecol. Manag., 209, 273–291, https://doi.org/10.1016/j.foreco.2005.02.002, 2005.
Wang, B., Li, M., Fan, W., Yu, Y., and Chen, J. M.: Relationship between net primary productivity and forest stand age under different site conditions and its implications for regional carbon cycle study, Forests, 9, f9010005, https://doi.org/10.3390/f9010005, 2018.
Wang, S., Chen, J. M., Ju, W. M., Feng, X., Chen, M., Chen, P., and Yu, G.: Carbon sinks and sources in China's forests during 1901–2001, J. Environ. Manag., 85, 524–537, https://doi.org/10.1016/j.jenvman.2006.09.019, 2007.
Wang, S., Zhou, L., Chen, J., Ju, W., Feng, X., and Wu, W.: Relationships between net primary productivity and stand age for several forest types and their influence on China's carbon balance, J. Environ. Manag., 92, 1651–1662, https://doi.org/10.1016/j.jenvman.2011.01.024, 2011.
White, M. A., Thornton, P. E., Running, S. W., and Nemani, R. R.: Parameterization and sensitivity analysis of the BIOME–BGC terrestrial ecosystem model: net primary production controls, Earth Interact., 4, 1–85, https://doi.org/10.1175/1087-3562(2000)004<0003:pasaot>2.0.co;2, 2000.
Xia, J., Yuan, W., Lienert, S., Joos, F., Ciais, P., Viovy, N., Wang, Y., Wang, X., Zhang, H., Chen, Y., and Tian, X.: Global patterns in net primary production allocation regulated by environmental conditions and forest stand age: a model-data comparison, J. Geophys. Res.-Biogeo., 124, 2039–2059, https://doi.org/10.1029/2018JG004777, 2019.
Xiaoyun, Z., Minghang, G., and Tibin, Z.: Joint control of net primary productivity by climate and soil nitrogen in the forests of eastern China, Forests, 9, f9060322, https://doi.org/10.3390/f9060322, 2018.
Xu, B., Guo, Z. Di, Piao, S. L., and Fang, J. Y.: Biomass carbon stocks in China's forests between 2000 and 2050: A prediction based on forest biomass-age relationships, Sci. China Life Sci., 53, 776–783, https://doi.org/10.1007/s11427-010-4030-4, 2010.
Xu, C. Y., Turnbull, M. H., Tissue, D. T., Lewis, J. D., Carson, R., Schuster, W. S. F., Whitehead, D., Walcroft, A. S., Li, J., and Griffin, K. L.: Age-related decline of stand biomass accumulation is primarily due to mortality and not to reduction in NPP associated with individual tree physiology, tree growth or stand structure in a Quercus-dominated forest, J. Ecol., 100, 428–440, https://doi.org/10.1111/j.1365-2745.2011.01933.x, 2012.
Yan, E. R., Wang, X. H., and Huang, J. J.: Shifts in plant nutrient use strategies under secondary forest succession, Plant Soil, 289, 187–197, https://doi.org/10.1007/s11104-006-9128-x, 2006.
Yu, G., Chen, Z., Piao, S., Peng, C., Ciais, P., Wang, Q., Lia, X., and Zhu, X.: High carbon dioxide uptake by subtropical forest ecosystems in the East Asian monsoon region, P. Natl. Acad. Sci. USA, 111, 4910–4915, https://doi.org/10.1073/pnas.1317065111, 2014.
Yu, Y., Chen, J. M., Yang, X., Fan, W., Li, M., and He, L.: Influence of site index on the relationship between forest net primary productivity and stand age, PLoS One, 12, 1–20, https://doi.org/10.1371/journal.pone.0177084, 2017.
Zaehle, S., Sitch, S., Prentice, I. C., Liski, J., Cramer, W., Erhard, M., Hickler, T., and Smith, B.: The importance of age-related decline in forest NPP for modeling regional carbon balances, Ecol. Appl., 16, 1555–1574, https://doi.org/10.1890/1051-0761(2006)016[1555:TIOADI]2.0.CO;2, 2006.
Zerihun, A. and Montagu, K. D.: Belowground to aboveground biomass ratio and vertical root distribution responses of mature pinus radiata stands to phosphorus fertilization at planting, Can. J. Forest Res., 34, 1883–1894, https://doi.org/10.1139/X04-069, 2004.
Zha, T. S., Barr, A. G., Bernier, P. Y., Lavigne, M. B., Trofymow, J. A., Amiro, B. D., Arain, M. A., Bhatti, J. S., Black, T. A., and Margolis, H. A.: Gross and aboveground net primary production at Canadian forest carbon flux sites, Agr. Forest Meteorol., 174/175, 54–64, https://doi.org/10.1016/j.agrformet.2013.02.004, 2013.
Zhang, F., Chen, J. M., Pan, Y., Birdsey, R. A., Shen, S., Ju, W., and He, L.: Attributing carbon changes in conterminous U.S. forests to disturbance and non-disturbance factors from 1901 to 2010, J. Geophys. Res.-Biogeo., 117, 1–18, https://doi.org/10.1029/2011JG001930, 2012.
Zhang, X., Zhang, X., Han, H., Shi, Z., and Yang, X.: Biomass accumulation and carbon sequestration in an age-sequence of Mongolian pine plantations in Horqin sandy land, China, Forests, 10, 1–18, https://doi.org/10.3390/f10020197, 2019.
Zhang, Y., Yao, Y., Wang, X., Liu, Y., and Piao, S.: Mapping spatial distribution of forest age in China, Earth Sp. Sci., 4, 108–116, https://doi.org/10.1002/2016EA000177, 2017.
Zhao, M. and Zhou, G. S.: Estimation of biomass and net primary productivity of major planted forests in China based on forest inventory data, Forest Ecol. Manag., 207, 295–313, https://doi.org/10.1016/j.foreco.2004.10.049, 2005.
Zhao, M. and Zhou, G. S.: Estimating net primary productivity of Chinese pine forests based on forest inventory data, Forestry, 79, 231–239, https://doi.org/10.1093/forestry/cpl002, 2006.
Zheng, J., Mao, F., Du, H., Li, X., Zhou, G., Dong, L., Zhang, M., Han, N., Liu, T., and Xing, L.: Spatiotemporal simulation of net ecosystem productivity and its response to climate change in subtropical forests, Forests, 10, f10080708, https://doi.org/10.3390/f10080708, 2019.