the Creative Commons Attribution 4.0 License.
the Creative Commons Attribution 4.0 License.
 | 19 Feb 2024
Understanding the effects of revegetated shrubs on fluxes of energy, water, and gross primary productivity in a desert steppe ecosystem using the STEMMUS–SCOPE model
Enting Tang
Yunfei Wang
Zengjing Song
Danyang Yu
Hongyue Wu
Chenglong Qiao
Christiaan van der Tol
Zhongbo Su
Revegetation is one of the most effective ways to combat desertification and soil erosion in semiarid and arid regions. However, the impact of the perturbation of revegetation on ecohydrological processes, particularly its effects on the interplay between hydrological processes and vegetation growth under water stress, requires further investigation. This study evaluated the effects of revegetation on the energy, water, and carbon fluxes in a desert steppe in Yanchi County, Ningxia Province, northwest China, by simulating two vegetated scenarios (shrub–grassland ecosystem and grassland ecosystem) using the STEMMUS–SCOPE (Simultaneous Transfer of Energy, Mass and Momentum in Unsaturated Soil–Soil Canopy Observation of Photosynthesis and Energy fluxes) model. The model was validated by field observations from May to September of 2016–2019. The evaluation of revegetation effects relied on comparing simulated fluxes between two vegetated scenarios in 2016 and 2019. In both scenarios, turbulent energy was dominated by latent heat flux, which was stronger in the shrub–grassland ecosystem (+7 %). A higher leaf area index and root water uptake of C3 shrubs (Caragana intermedia) resulted in increased carbon fixation (+83 %) and transpiration (+72 %) of the shrub–grassland ecosystem compared to the C3 grassland ecosystem. Accompanied by a marked increase in root water uptake (+123 %), revegetation intensified water consumption beyond the levels of received precipitation. These results highlight the critical importance of considering both energy and water budgets in water-limited ecosystems during ecological restoration to avert soil water depletion.
Please read the corrigendum first before continuing.
-
Notice on corrigendum
The requested paper has a corresponding corrigendum published. Please read the corrigendum first before downloading the article.
-
Article
(5003 KB)
- Corrigendum
-
Supplement
(2839 KB)
-
The requested paper has a corresponding corrigendum published. Please read the corrigendum first before downloading the article.
- Article
(5003 KB) - Full-text XML
- Corrigendum
-
Supplement
(2839 KB) - BibTeX
- EndNote


Global efforts in revegetation have been made to combat climate change and desertification. For example, satellite data reveal that revegetation programs in China contributed about 10.5 % of the increased global greening during 2000–2017 (Chen et al., 2019). This large-scale revegetation program (“Grain for Green”) was initiated to improve the ecosystem service of degraded desert steppe in northern China that had occurred since the 1990s (Liu et al., 2021). On the one hand, it has proven effective in controlling soil erosion and enhancing carbon sequestration (Liu et al., 2021; Zhang et al., 2018). On the other hand, the conflict between the water deficit and the development of the shrub community has become an increasing concern, particularly in arid and semiarid lands where ecosystems are fragile and suffering intense water stress (D'Odorico et al., 2012; Tian et al., 2017; Huxman et al., 2005; Zhang et al., 2018). For example, the revegetation in China's Loess Plateau has increased net primary productivity and evapotranspiration, but the ecosystem is approaching sustainable water resource limits (Feng et al., 2016). Specifically, field studies have reported that the revegetation leads to the depletion of soil moisture (Liu and Shao, 2015; Jia et al., 2017), formation of a dry soil layer (Fu et al., 2012; Jia et al., 2017; Jian et al., 2015; Gao et al., 2023), and the reallocation of energy partitioning along with changes in vegetation distribution and canopy structure (Chen et al., 2015). Therefore, implementing revegetation programs but ignoring their long-term effects on energy, water, and carbon balance may act contrarily to ecologically sustainable development. Quantitative assessment of energy, water, and carbon fluxes is essential for evaluating the impact of revegetation, including the determination of water resource limits and optimal plant coverage for revegetation (Fu et al., 2012; Feng et al., 2016). However, the lack of long-term observations makes it difficult to reproduce the energy, water, and carbon cycles of the ecosystems before and after revegetation practice. To overcome this challenge, process-based land surface models (LSMs) can provide a better understanding of the energy–water–carbon flows of ecosystems (Du et al., 2021; Gong et al., 2016).
The past few decades have seen the rapid development of LSMs for dryland ecosystems based on the soil–vegetation–atmosphere transfer continuum (Tague et al., 2004; Ivanov et al., 2008; Fatichi et al., 2016; Niu et al., 2020). It is widely believed that the dominant constraint of vegetation development in semiarid regions is soil water availability, which manifests itself in regulating photosynthesis, evapotranspiration, and root distribution (Camargo and Kemanian, 2016; Fan et al., 2017). In this context, accurate soil water modeling in LSMs is critical for the overall model performance in predicting energy, water and carbon fluxes. However, some existing deficiencies in the soil water modeling include the following: (i) computing the soil water content with a simple “bucket” approximation (e.g., RHESSys and Biome-BGC); (ii) defining maximum root water uptake capacity with empirical constants (e.g., CLM and tRIBS+VEGGIE) or using a direct function based on soil water availability (Zeng et al., 1998; Tague et al., 2004; Zhang et al., 2013; Fisher et al., 2014; Newman et al., 2006). The bucket model may overlook the soil water movement through different layers due to the model's simple representation of the vertical soil profile and rooting structure (Romano et al., 2011; Du et al., 2021). Moreover, the decoupling between soil states and vegetation traits or simplified process representation, such as constraining the vegetation growth using a constant water stress factor, might lead to biased simulation in aboveground fluxes (Bayat et al., 2019).
Given the critical role of water availability in semiarid ecosystems, we need mechanistic insight into ecohydrological processes, particularly the water movement across various soil layers and its influence on photosynthesis. Here, we advance the understanding of ecohydrological processes in a semiarid desert steppe ecosystem by applying a process-based model STEMMUS–SCOPE. STEMMUS stands for Simultaneous Transfer of Energy, Mass and Momentum in Unsaturated Soil, while SCOPE stands for Soil Canopy Observation of Photosynthesis and Energy fluxes. The coupled STEMMUS–SCOPE model can simulate the profile of dynamic root length density for estimating root water uptake (RWU) and the hydraulic resistance from soil to root, stem, and leaf (Y. Wang et al., 2021; Zeng et al., 2011a, 2009b). Thanks to the inclusion of the plant hydraulic connection between soil and leaf, the coupled model realizes the influence of soil moisture variation on photosynthetic and stomatal behaviors, which facilitates the investigation of water stress effects on vegetation functioning.
To explore the intricate interactions between vegetation and changing land surface conditions, we specifically investigated and answered the following questions: (i) can the mechanistic model STEMMUS–SCOPE reliably represent the fluxes of energy, water, and gross primary productivity before and after revegetation? (ii) Which fluxes are most affected by revegetation, and how do they respond to water availability? (iii) Will the revegetated shrubs lead to soil water depletion? Answering these questions, we present the following work in this study. First, the contributions and leaf area index of shrubs and grasses were defined (Sect. 2.3.1 and 2.3.2), and they were further used to construct two vegetated scenarios (grassland ecosystem and shrub–grassland ecosystem) (Sect. 2.3.3). Secondly, the sensitivity of 10 critical parameters was analyzed using the Morris method (Sects. 2.4.1 and 3.1). Thirdly, STEMMUS–SCOPE was calibrated and validated with observations over May–July in 2018 and May–September in 2016, 2017, and 2019 (Sect. 3.2). Finally, the simulated fluxes from the two scenarios were compared and their differences were analyzed (Sect. 3.3).
2.1 Study site
The study area (37∘49′46′′ N, 107∘29′37′′ E) is located in the village of Yangzhaizi of Yanchi County, Ningxia Province, which is a typical agricultural–pastoral ecotone with a mid-temperate semiarid continental climate (Fig. 1). The mean annual air temperature (1958–2017) is 8.34 ∘C. The mean annual precipitation is 296.99 mm, and about 80 % of the rain falls between June and September (Jia et al., 2018). Since the 1990s, a policy prohibiting grazing and a revegetation program have been implemented in the study area to combat desertification.
The study site is a 30 m × 30 m fenced plot characterized by revegetated shrubs and natural grassland. The shrub strips were planted at an interval of 6–7 m, and the average distance between two neighboring shrubs in each strip was less than 1 m (Fig. S2 in the Supplement). Between and below the canopy of shrubs, sparse grasses grow, and a soil moisture sensor (SM150, Delta-T, UK), soil temperature sensor (107-L, CSI, USA), and heat flux plate (HFP01, Hukseflux, NL) were installed at 10 cm soil depth under the grasses. The eddy covariance (EC) flux tower has an open path CO2 H2O analyzer (LI-7500, LI-COR Inc., USA) and a 3D ultrasonic anemometer (WindMaster Pro, Gill, UK), a tipping-bucket rain gauge (TE525MM-L, Texas Electronics, USA), a net radiometer (CNR4, Kipp & Zonen, NL), and a temperature and relative humidity probe (HMP45C, CSI, USA), and it is surrounded by Caragana intermedia perennial shrubs and native herbaceous plants (Fig. 1). The active growing season of the shrubs and grasses lasts from May to September. The predominant soil texture is characterized as eolian sandy soil.
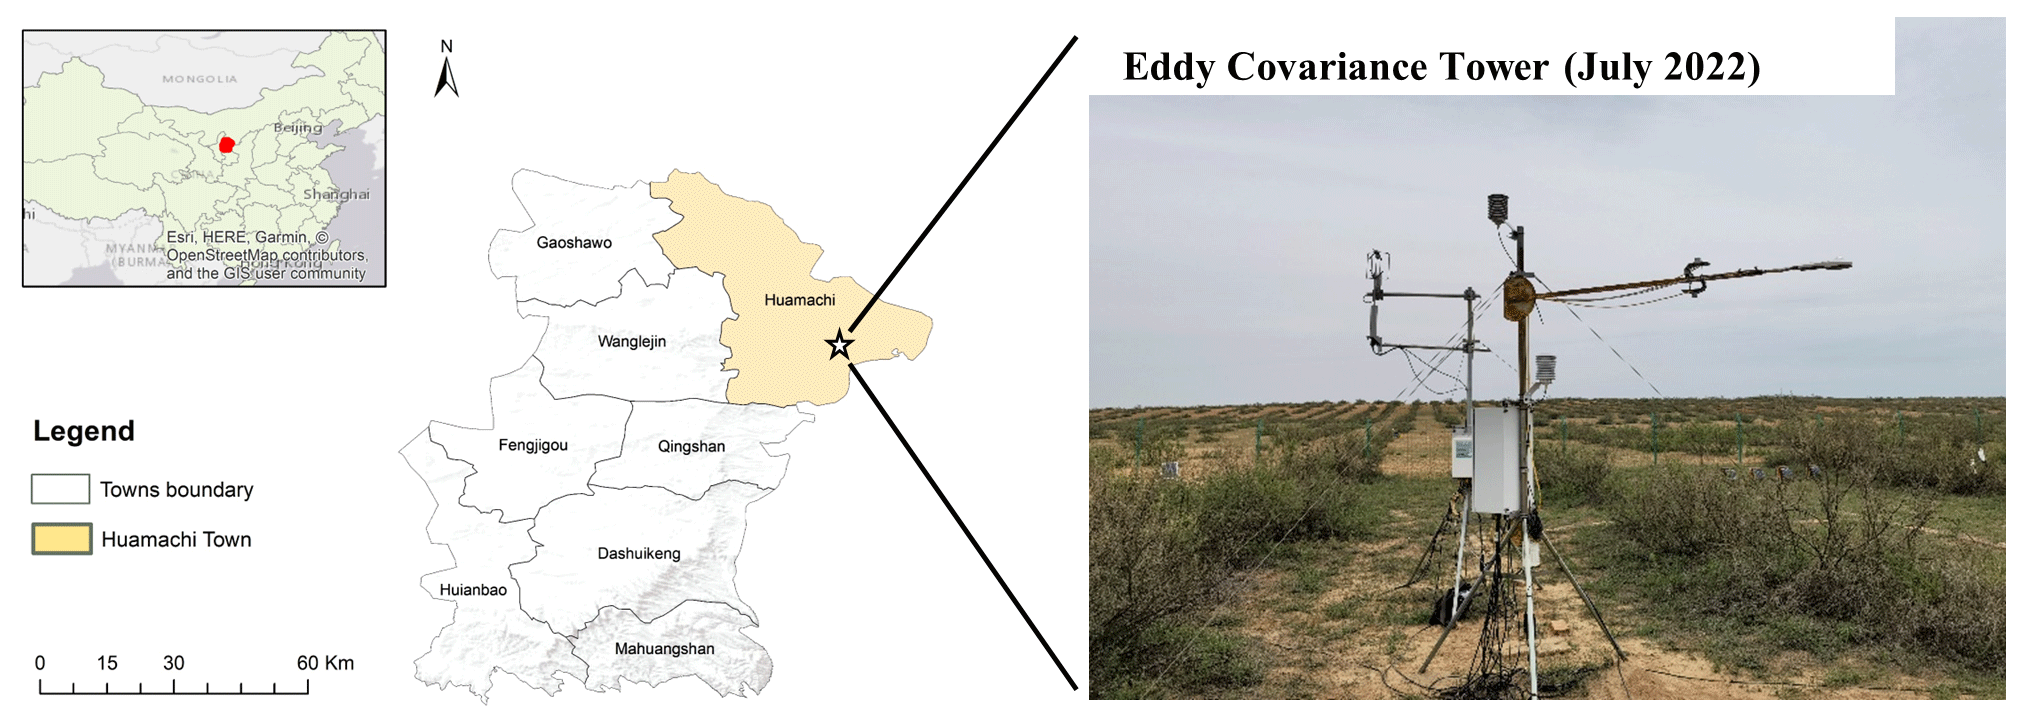
Figure 1Overview of the study site. The red area is Yanchi County in China (map source: © OpenStreetMap contributors 2021; distributed under the Open Data Commons Open Database License (ODbL) v1.0). The white star denotes the field station located in the village of Yangzhaizi in Yanchi County, Ningxia Province.
2.2 STEMMUS–SCOPE model
Only the major modules in STEMMUS–SCOPE used in this study are described in Eqs. (S1)–(S26) in the Supplement. The original descriptions of model components and other applications are elaborated by Bayat et al. (2019), Van der Tol et al. (2009), Y. Wang et al. (2021), Yang et al. (2021), and Zeng et al. (2011a, b). STEMMUS–SCOPE is employed to simulate the energy, water, and carbon fluxes for the two ecosystems, representing the scenarios before and after revegetation. The following assumptions are made for modeling: (i) a land unit is structured as a vertical continuum, which consists of shrub or grass and the soil column; (ii) as the groundwater is more than 6 m below the surface in the study area (Du et al., 2021), the boundary condition at the bottom of the soil column (i.e., 5 m depth) is set as gravity drainage; and (iii) the soil texture is vertically homogeneous. In this context, the model runs at a half-hourly time step, with the input of meteorological forcings and soil hydraulic and plant trait parameters (Table S1 in the Supplement). Model outputs are compared to data from the EC tower, which include net radiation, latent heat flux, sensible heat flux, and gross primary productivity. Additionally, ground measurements of soil moisture, soil temperature, and corrected surface soil heat flux (using Eq. S9) are used for validation.
2.3 Simulation scenario design
2.3.1 Land cover classification
Two vegetation cover types both contribute to the EC observations and must be reflected in the model parametrization. Therefore, a classification map is needed to derive the fractional vegetation cover for more accurate modeling. The supervised classification method in ERDAS 2020 was used to determine the fractional cover of shrubs, grasses, and bare soil based on an image taken by an unoccupied aerial vehicle (UAV; Fig. S2).
STEMMUS–SCOPE considers the soil–root–canopy continuum and quantifies the amount of energy received and water evaporated from its canopy and soil based on the leaf area index and leaf inclination (e.g., with four temperature variables: sunlit/shaded leaf temperatures, sunlit/shaded soil surface temperatures). Here, we assume that the 40 % coverage of bare soil is distributed in each simulated soil–root–canopy continuum (i.e., either shrub or grass), making the approximated contribution of 58.33 % for shrubland and 41.67 % for grassland (Table S3).
2.3.2 Reconstructed LAI
The leaf area index (LAI) is a critical variable in calculating the gross primary productivity (GPP) and latent heat flux (LE) in STEMMUS–SCOPE. The MODIS 4 d LAI data (LAIMODIS) during 2016–2019 were extracted from the Google Earth Engine platform. Further, we applied the Harmonic ANalysis of Time Series (HANTS) algorithm in MATLAB to smooth the outliers (Sect. S2 in the Supplement).
The study site is a 30 m × 30 m plot with two species, while LAIMODIS can only provide an overall LAI with 500 m spatial resolution. To achieve the simulated flux partitioning from two land cover types, we simulated a shrub grid and grass grid with the LAI of shrubs (LAIshrub) and LAI of grassland (LAIgrass), respectively (Fig. 3c). With only two field measurements in 2022, LAIshrub was corrected by multiplying smoothed LAIMODIS by 2.33 (Table S5). LAIgrass was estimated by assuming it was of that of the shrubs and by disaggregation of LAIMODIS with the following conditions:
- i.
.
- ii.
.
- iii.
LAIbaresoil=0.
- iv.
LAIshrub(i) ≈ 4 LAIgrass(i) (Dan et al., 2020).
- v.
LAIgrass(i) should follow the temporal pattern of LAIMODIS(i), and it is ∼0.5 m2 m−2 (Yang et al., 2019; Dan, 2020).
Here fshrub, fgrass, and fbaresoil are the fractional cover of shrubs, grasses, and bare soil, respectively. With the above constraints, LAIgrass shown in Fig. 2 was generated by the HANTS algorithm (Table S4 and Fig. S3).
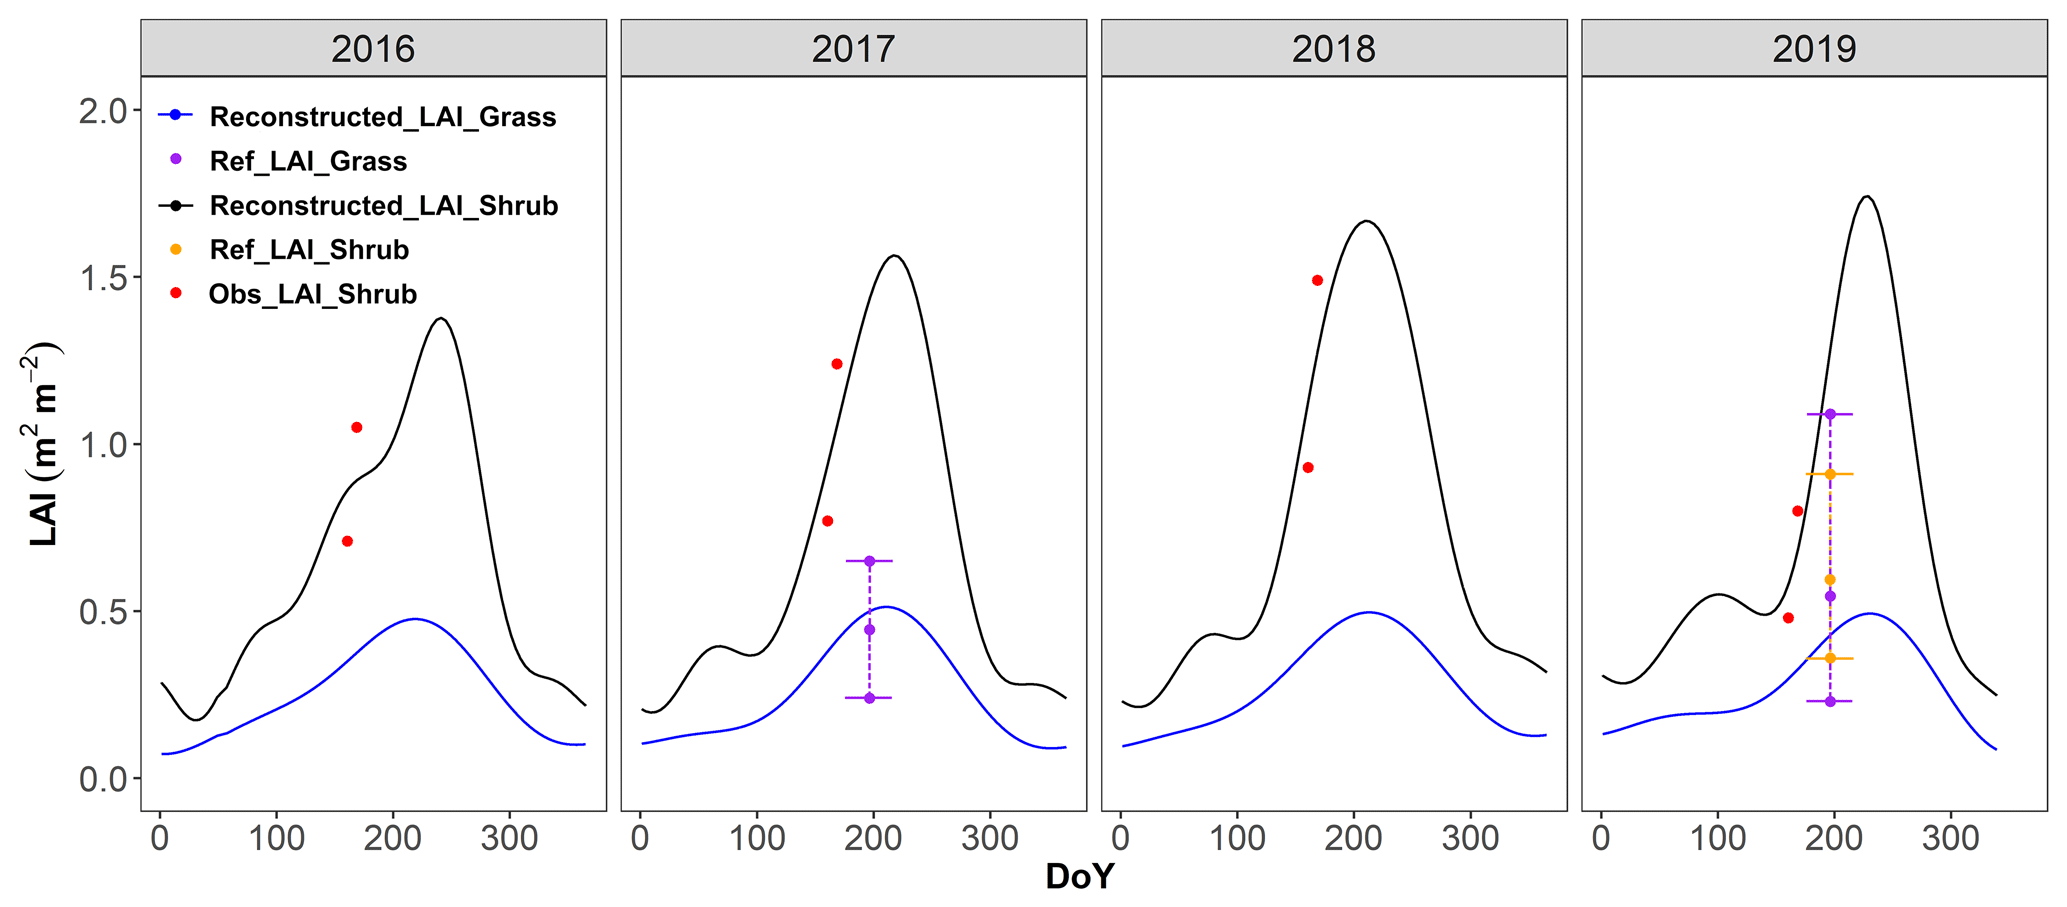
Figure 2Reconstructed LAI of shrubland and grassland from 2016 to 2019. The red dots (Obs_LAI_Shrub) are the observed LAI of shrubs that were calculated based on the correlation derived from the observations in 2022 (Table S5). The purple dots and dashed lines (Ref_LAI_Grass) represent the ranges of reference LAI that were measured for the nearby grasslands (Yang et al., 2019; Dan, 2020). The yellow dots and dashed lines (Ref_LAI_Shrub) represent the ranges of reference LAI that were measured for the nearby shrublands (Dan, 2020).
2.3.3 Scenario design
Two sets of canopy parametrization schemes (Table S1) together with the reconstructed LAI were used to simulate the fluxes of the shrub grid and grass grid, respectively (Fig. 3c). We assumed the shrubland and grassland had the same meteorological environment; likewise, the same initial conditions of soil temperature and soil water content were assigned to the two land cover types (Table S2). To accurately depict the fluxes of mixed surfaces containing both shrubs and grasses, the simulated fluxes from the shrubland and grassland simulations were partitioned based on their respective contributions, as demonstrated in Fig. 3b. For instance, the total evaporation, transpiration, and gross primary productivity (GPP) were the sum weighted by their contributions. As an example,
Cshrub is the contribution of shrubland to the overall flux, and its value is 58.33 %, while the contribution of grassland is 41.67 % (Table S3). The same partitioning method as that of GPP was applied to net radiation, latent heat flux, and sensible heat flux, in which the latent heat was converted into evaporation flux using the evaporation heat at 20 ∘C.
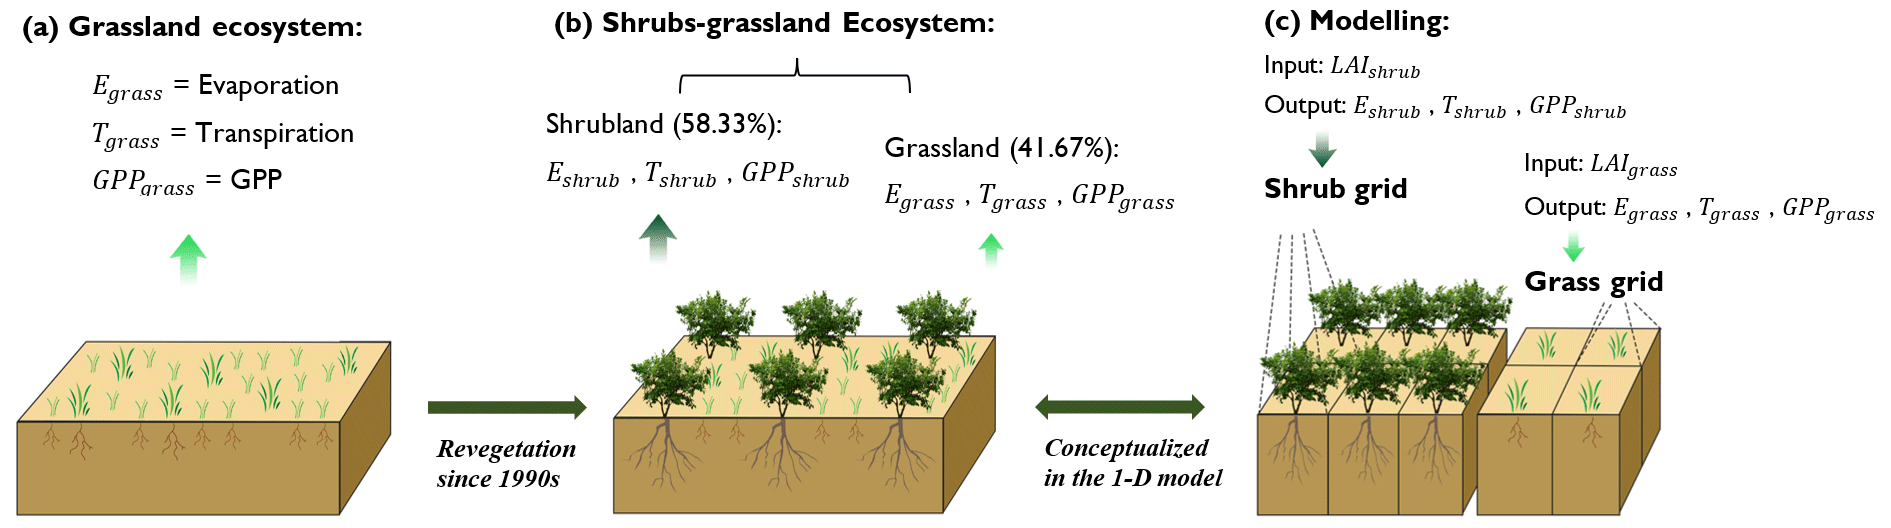
Figure 3Conceptual diagram of (a) native grassland scenario before revegetation (hereafter is denoted as grassland ecosystem), (b) realistic scenario with mixed shrubs and grasses (hereafter is denoted as shrub–grassland ecosystem) and (c) conceptualization in the model. The bare-soil evaporation is implicitly included in Eshrub and Egrass, where E is the evaporation.
2.4 Model calibration and validation
2.4.1 Sensitivity analysis
Morris global sensitivity analysis was applied to evaluate the sensitivity of model simulations to the variation in input parameters. The Morris method can give a qualitative ranking of parameters at a relatively low computational cost (Herman et al., 2013). The most influential parameters for the STEMMUS model and SCOPE model identified by other studies in the literature are as follows: maximum carboxylation rate (Vcmax), Ball–Berry stomatal conductance parameter (m), leaf inclination (LIDFa), residual soil water content (θr), van Genuchten parameters (n and α), saturated hydraulic conductivity (Ksat), maximum rooting depth (Rdepth), fitted extinction coefficient (β), and root density (RD) (J. Wang et al., 2021; Verrelst et al., 2015; Jackson et al., 1997). Note that the sensitivity analysis was only performed for parameters of the shrubland simulation and that the range of soil parameters was set for the specific sandy soil (Table 1).
The Morris analysis was achieved using the SALib package in Python, and its workflow is explained in Sect. S3 in the Supplement (Herman and Usher, 2017). Besides, a set of 220 parameter trajectories generated a set of 220 fluxes, which were compared with the observed fluxes from May to July in 2018. Performance metrics, including the coefficient of determination (R2), root mean square error (RMSE), and an objective function, were calculated for each trajectory. The objective function is calculated as below:
where , , and are the average values of observed soil water content (SWC), LE, and GPP throughout the investigation period, respectively (Groenendijk et al., 2011). The optimal trajectory for shrubland is identified by the lowest RMSEnormalized and the highest R2.
Table 1Range of critical parameters for sensitivity analysis.
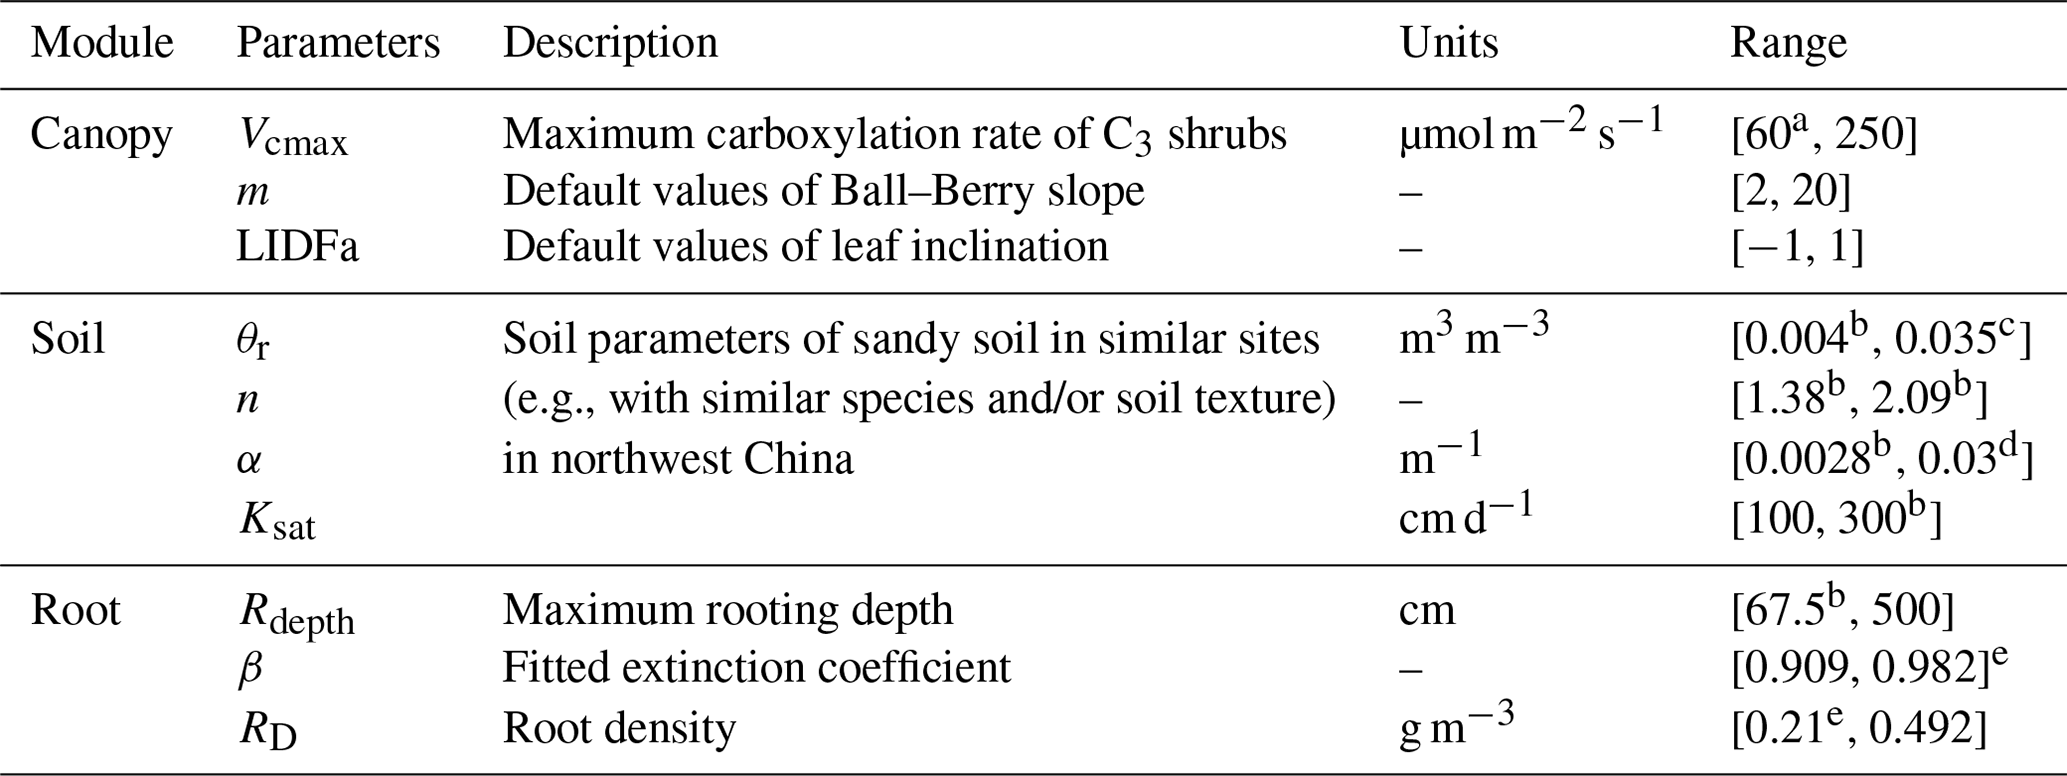
a Wang et al. (2017). b Gong et al. (2016). c Montzka et al. (2017). d Wei et al. (2019). e Jackson et al. (1997).
2.4.2 Performance metrics
RMSE and R2 were used to evaluate the quality of the model predictions.
where xs is the simulated value, xo is the corresponding observed value and the mean of the observed values, and n is the number of data records.
3.1 Model sensitivity
Soil hydraulic parameters exert the strongest influence on simulated fluxes, with key parameters identified for each flux (Fig. S5): (i) LIDFa for net radiation (Rn), (ii) α and n for ground heat flux (G), (iii) m for latent heat flux (LE) and sensible heat flux (H), (iv) Vcmax for GPP, and (v) α and n for soil water content (SWC). Maximum rooting depth (Rdepth) and root density (RD) also have notable impacts on SWC and G simulations. Consistent with the STEMMUS–SCOPE model calculations, Rdepth and RD primarily govern root distribution, thereby affecting root water uptake across various soil layers and ultimately impacting SWC. The parameter trajectory achieving the lowest RMSEnormalized includes Vcmax at 123, m at 6.8, LIDFa at −0.33, α at 0.005, n at 1.71, θr at 0.014 m3 m−3, and Ksat at 100 cm d−1. The optimal trajectory was adapted for the grassland scenario with adjustments to root parameters as detailed in Table S1.
3.2 Model performance
Data collected from May to July 2018 were used to calibrate the model (Figs. S6–S8). Compared with the simulations considering only one land cover type, the model performance was better in capturing the dynamic and magnitude of energy and carbon fluxes when considering the mixed land cover types (Fig. S8).
Data collected during May–September in 2016 and 2019 and May–July in 2017 were used to validate the model simulations. The simulated energy fluxes showed satisfactory agreement with the observed values, with the R2 values all above 0.67 and with the RMSE ranging from 19.64 to 66.90 W m−2 (Fig. 4a–d). The simulated turbulent flux (i.e., LE + H) followed the trend of the measured values well (R2=0.86; RMSE = 59.16 W m−2).
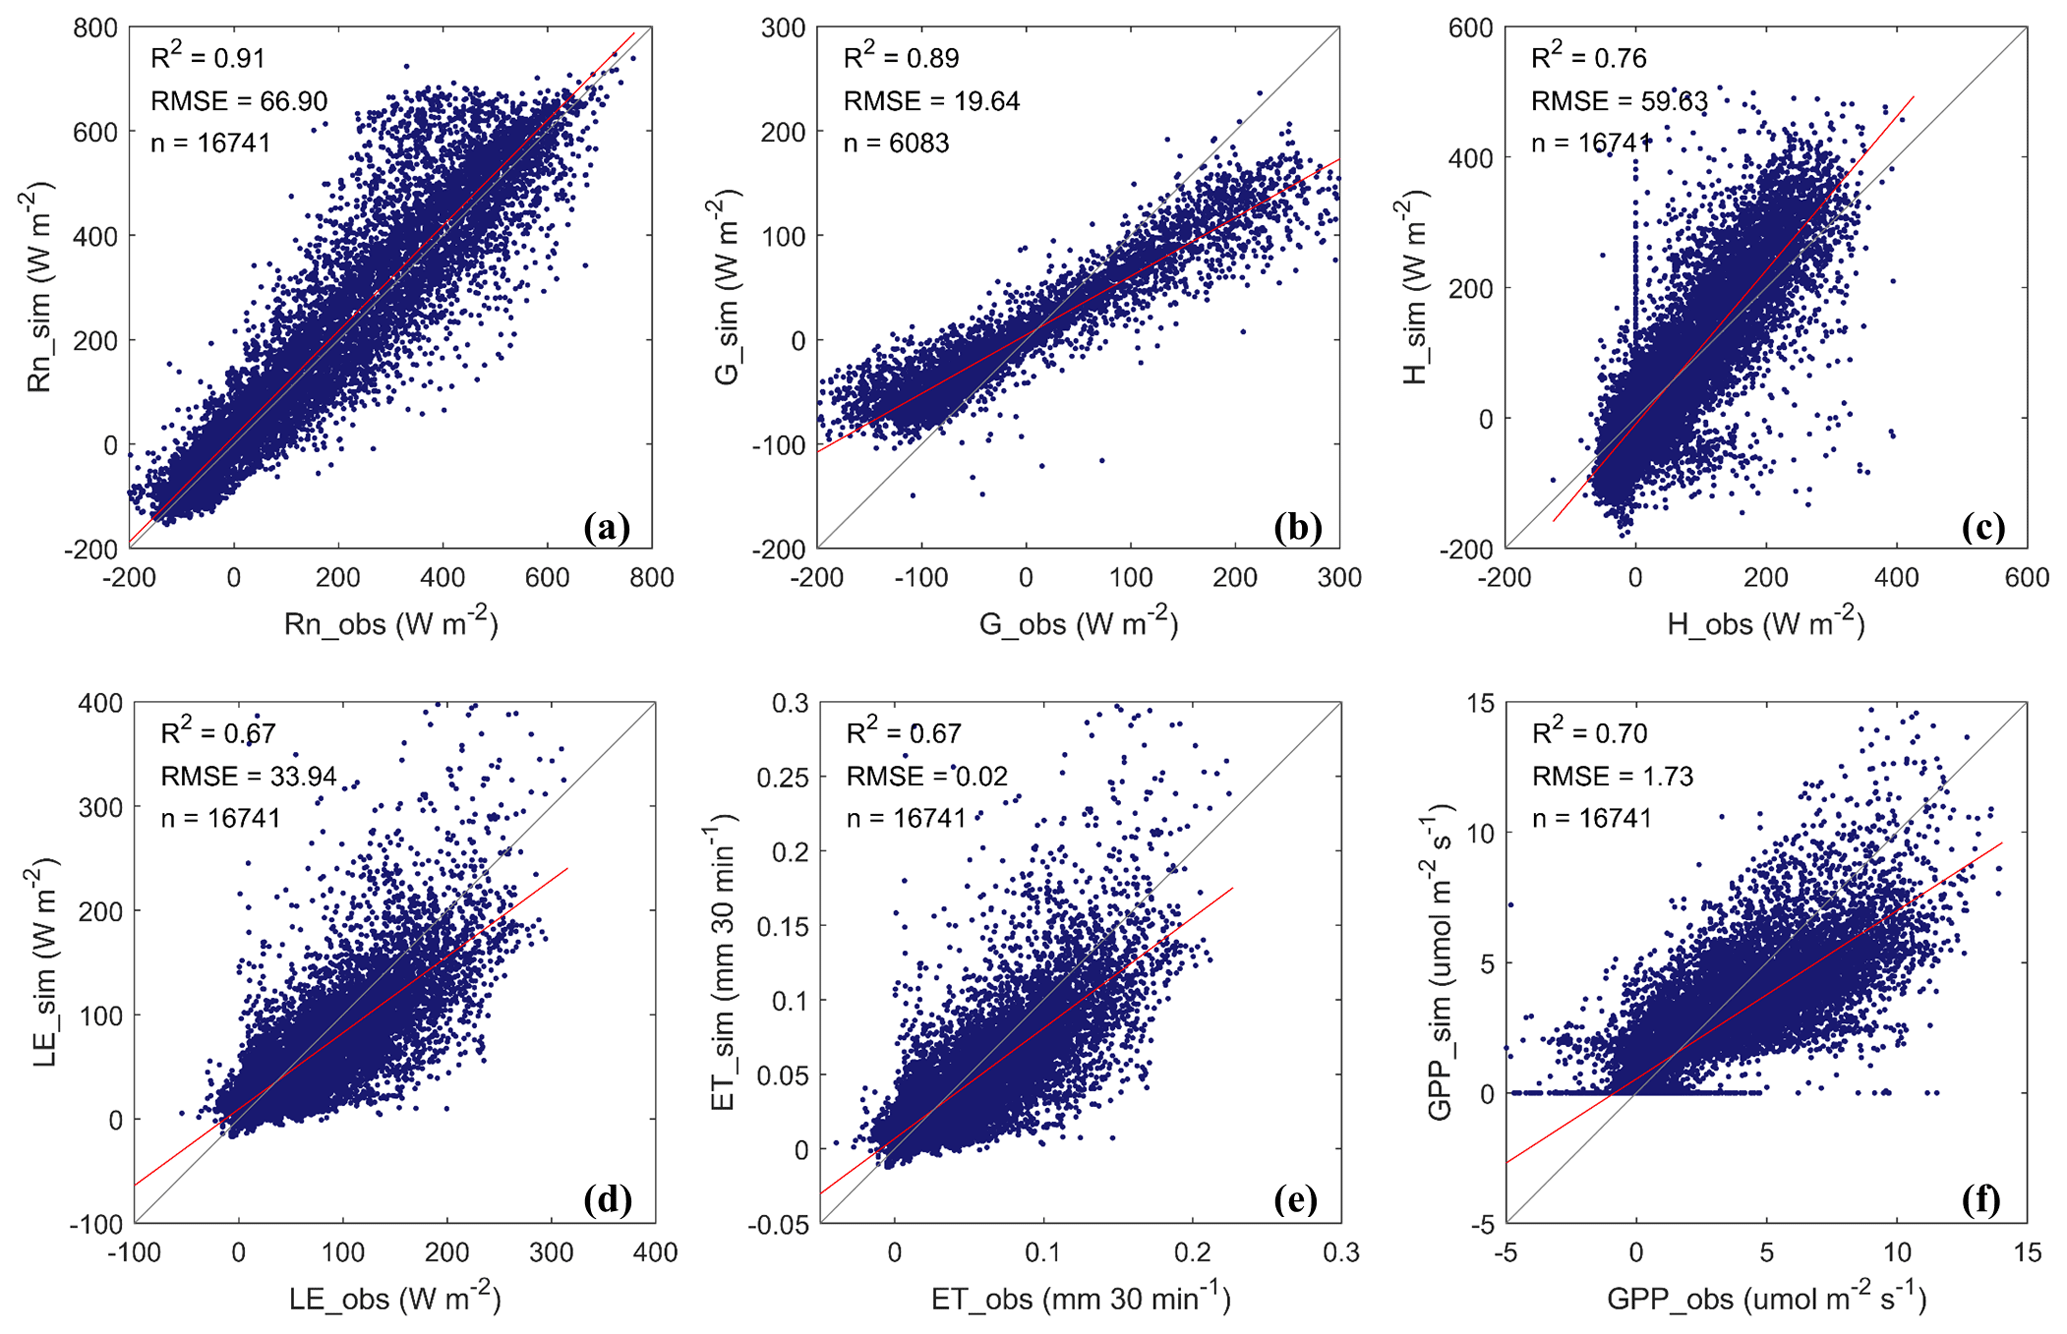
Figure 4Comparing the observed (obs) and simulated (sim) half-hourly values of (a) net radiation (Rn), (b) ground heat flux (G, where only 6083 data points in the year 2019 comprised the valid measurements for comparison), (c) sensible heat flux (H), (d) latent heat flux (LE), (e) evapotranspiration (ET), and (f) gross primary productivity (GPP). The performance statistics are summarized in Table S6.
The simulated soil water content (SWC) and soil temperature (Ts) were primarily validated by the observed data from the grassland ecosystem (Fig. 5) as the sensors were installed under the grassland. The model can capture the SWC dynamics in response to each rainfall event (Fig. 5a: R2=0.84; RMSE = 0.01 m3 m−3). In addition, the diurnal patterns were also captured though their amplitudes were not as significant as those of observations. The simulated Ts at 10 cm depth also displayed an apparent diurnal pattern and was comparable with the observed Ts (Fig. 5b: R2 = 0.85; RMSE = 2.74 ∘C).
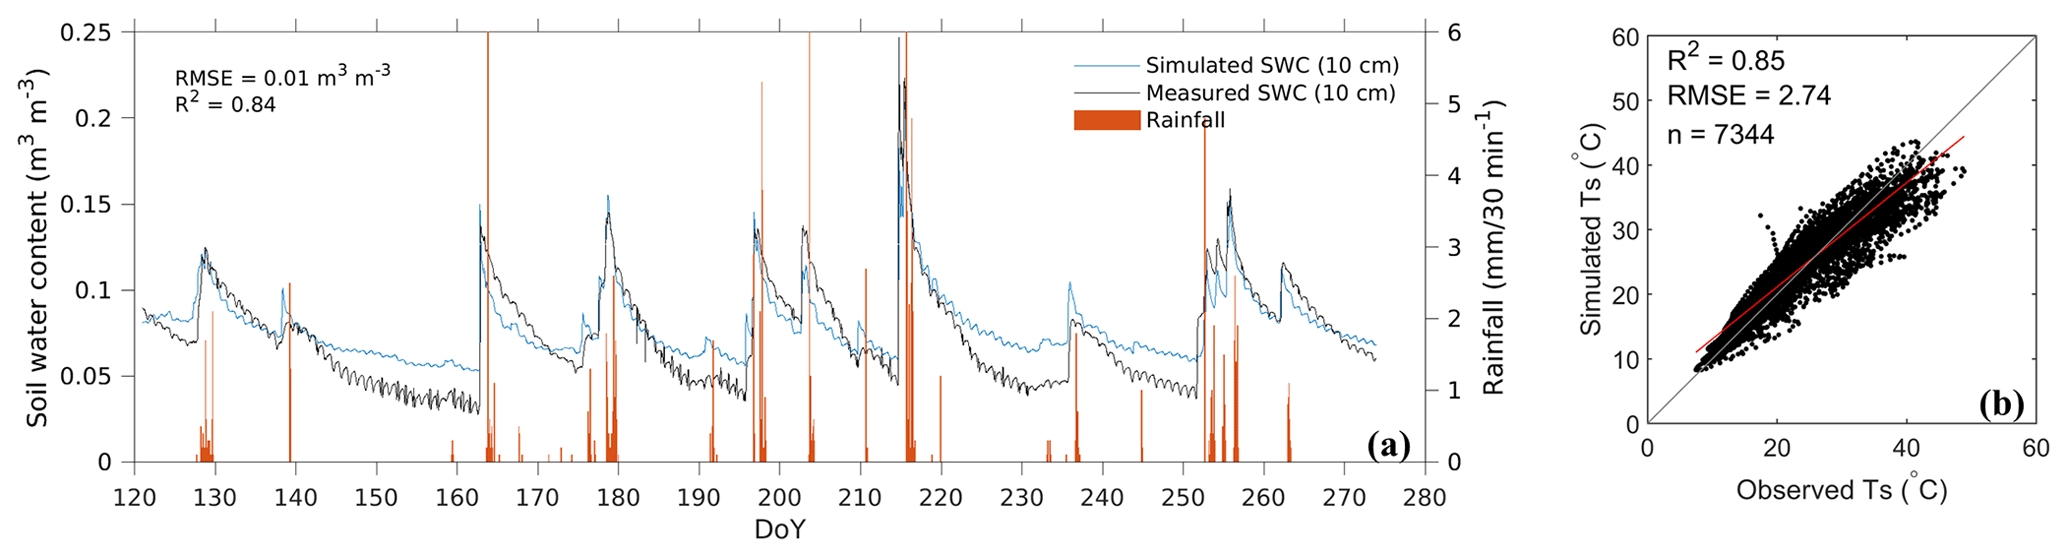
Figure 5Model-simulated and measured half-hourly soil water content (SWC) and soil temperature (Ts) during May–September in 2019: (a) temporal dynamics of SWC and (b) a scatterplot of the simulated and the observed Ts.
3.3 Comparison between two scenarios
The averaged values of simulated fluxes during May–September in 2016 and 2019 were used to understand the diurnal and daily variations in energy fluxes. Flux differences between the shrub–grassland and grassland ecosystems were determined by subtraction, with mean values and seasonal totals presented as the mean (± standard deviations) in Tables S7–S9.
3.3.1 Diurnal variations in energy fluxes
The envelope of net radiation (Rn) ranged from −91.61 to 505.69 W m−2 (Fig. S9a). The shrub–grassland ecosystem was likely to receive more radiance because of the denser canopies of shrubs, reflected by the larger LAI in the model. However, differences in diurnal Rn between the two ecosystems were very small and mainly occurred at midday (i.e., 10:00–15:00 UTC+8), with an averaged difference of 23.23±4.33 W m−2. During nighttime hours (17:00–07:00 UTC+8), the Rn was nearly identical for the two ecosystems, showing negative values (∼ −40 W m−2) due to outgoing longwave radiation from soil and leaves.
The sensible heat flux (H) followed a similar pattern to Rn but with a larger difference between the two ecosystems. H reached a peak at ∼ 262 (200) W m−2 in May in the shrub–grassland (grassland) ecosystem (Fig. S9b). During the nighttime, H was below zero, indicating a heat transfer from the atmosphere to the ground due to the lower surface temperature of soil and canopy. The H of the shrub–grassland ecosystem appeared to be larger than that of the grassland ecosystem, whereas the seasonal partitioning was similar (∼ 37 %) for both ecosystems. Latent heat flux (LE) had its maximum diurnal peak at 156 W m−2 in August for both ecosystems (Fig. S9c). LE steadily increased from June to August and dropped in September, which was in line with the plants' growing stages and rainfall pattern.
During May–September, the ground heat flux (G) peaked at ∼ 11:00, with the averaged values of 133.10±6.03 W m−2 (161.57±7.72 W m−2) for the shrub–grassland (grassland) ecosystem (Fig. S9d). More heat is transported through the surface and soil in the grassland ecosystem because less vegetation coverage induces more energy exchange in the soil. Throughout the growing seasons, more energy was stored in the soil under the grassland ecosystem (13.51 W m−2) than under that of the shrub–grassland ecosystem (9.85 W m−2).
3.3.2 Daily variations in water fluxes
We compared daily variations in soil water content (SWC), evaporation, and transpiration between the grassland ecosystem and shrub–grassland ecosystem. Additionally, we assessed the impact of rainfall on these water fluxes by comparing them in 2016 and 2019. The study categorized 2016 (seasonal rainfall of 218.1 mm) as a dry year and 2019 (292.4 mm) as a normal year, using the mean annual precipitation (296.99 mm) as a baseline.
Water fluxes: SWC and RWU
Generally, SWC decreased in every soil layer after planting shrubs (Fig. 6a and b). Significant reductions in SWC (18 % and 9 % in 2016 and 2019, respectively) occurred between 50 and 100 cm depth, where most of the fine roots of shrubs are concentrated (Jia et al., 2012; Zhu and Wang, 2020). Out of the root zone (i.e., below the 269 cm depth), the changes in SWC became less variable. It is likely that the root water uptake of grasses (shrubs) increased from the surface layer and then decreased to zero at 35 cm (280 cm) depth. Moreover, the model successfully captured hydraulic redistribution, as indicated by negative RWU values in the relatively shallow root zone (Kennedy et al., 2019; Y. Wang et al., 2021). The negative RWU values resulted from the higher root water potential (in absolute values) compared to the soil water potential when the surface was too dry in the study area. When comparing the changes in RWU, the substitution of shrubs reduced RWU at the 13–33 cm depth while it increased it at the 1–11 and 35–280 cm depth (Fig. 6c).
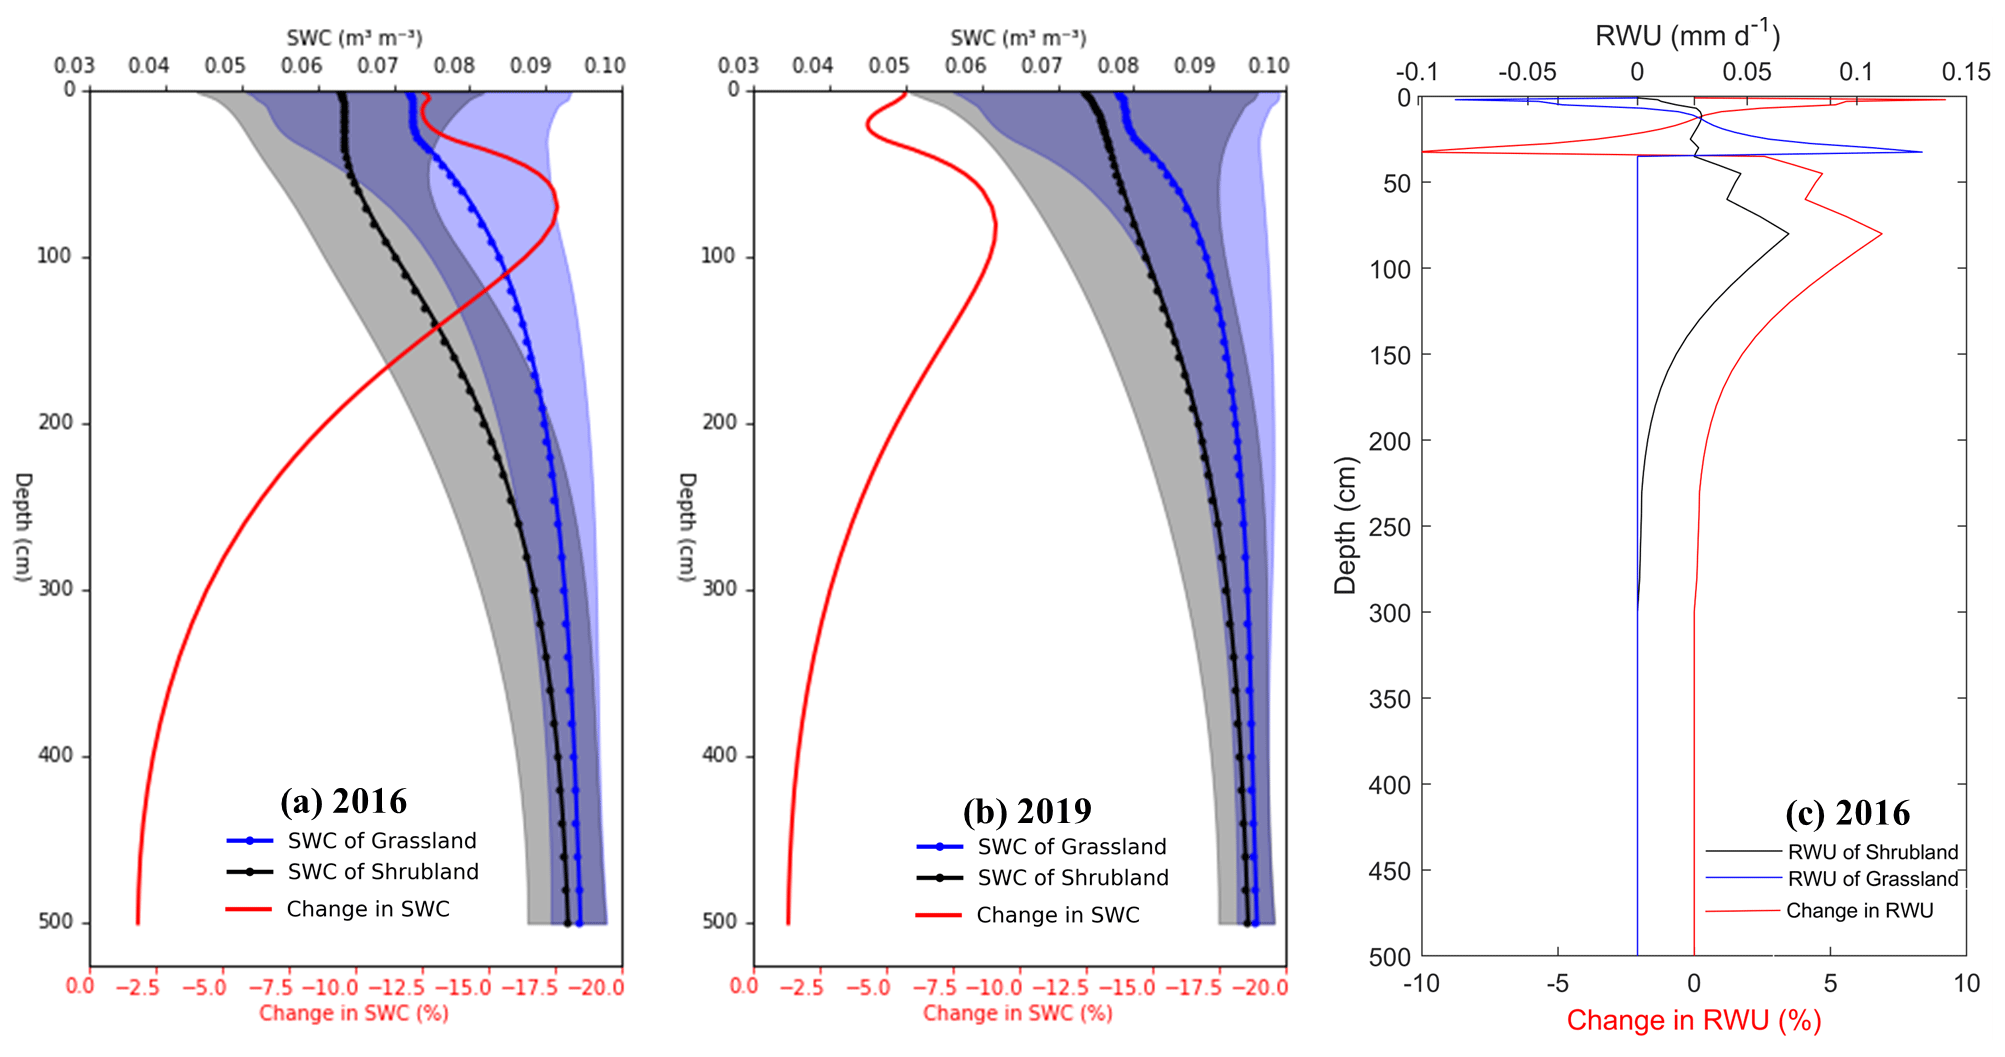
Figure 6Profile of the changes in soil water content (SWC) and root water uptake (RWU) after planting shrubs, which is calculated using averaged values under the shrubland scenario (black line) minus averaged values under the grassland scenario (blue line) over May to September (a) in 2016, (b) in 2019, and (c) for RWU in 2016 (RWU for 2019 has similar pattern). Note that the comparison was carried out between the grassland ecosystem and shrubland ecosystem instead of the shrub–grassland ecosystem.
SWC at 10 cm soil depth (hereafter denoted the surface SWC) under grassland peaked at ∼ 0.15 m3 m−3 in July and August, followed by the most frequent rainfall events of the year (Fig. 7a, b). The surface SWC under both land cover types showed rapid responses to rainfall, with sharp increases observed within just a few hours (Fig. 7a, b). At 100 cm soil depth (Fig. 7c, d), SWC was less influenced by water exchange between the soil and atmosphere (i.e., evaporation and precipitation) (Zeng et al., 2009a; Yang and Fu, 2017; Zeng et al., 2009b).
SWC under the shrubland was generally lower than under the grassland. Moreover, the average SWC difference at 100 cm depth was more pronounced, at 0.014 (0.008) m3 m−3, compared to at the surface SWC with the values of 0.009 (0.004) m3 m−3 in 2016 (2019) (Table S7). These contrasts indicate that the revegetation decreased SWC and had a more significant effect on SWC in deep soil layers. Particularly, in the dry year of 2016, the differences in SWC between the two land cover types were more prominent and the shrubs drew more soil water than in 2019 (Fig. 7a, c against b, d). This reflects the fact that shrubs can tap into deeper soil water reserves through their developed root systems when experiencing drought (Wang et al., 2018; Zhu and Wang, 2020; Y. Zhang et al., 2020).
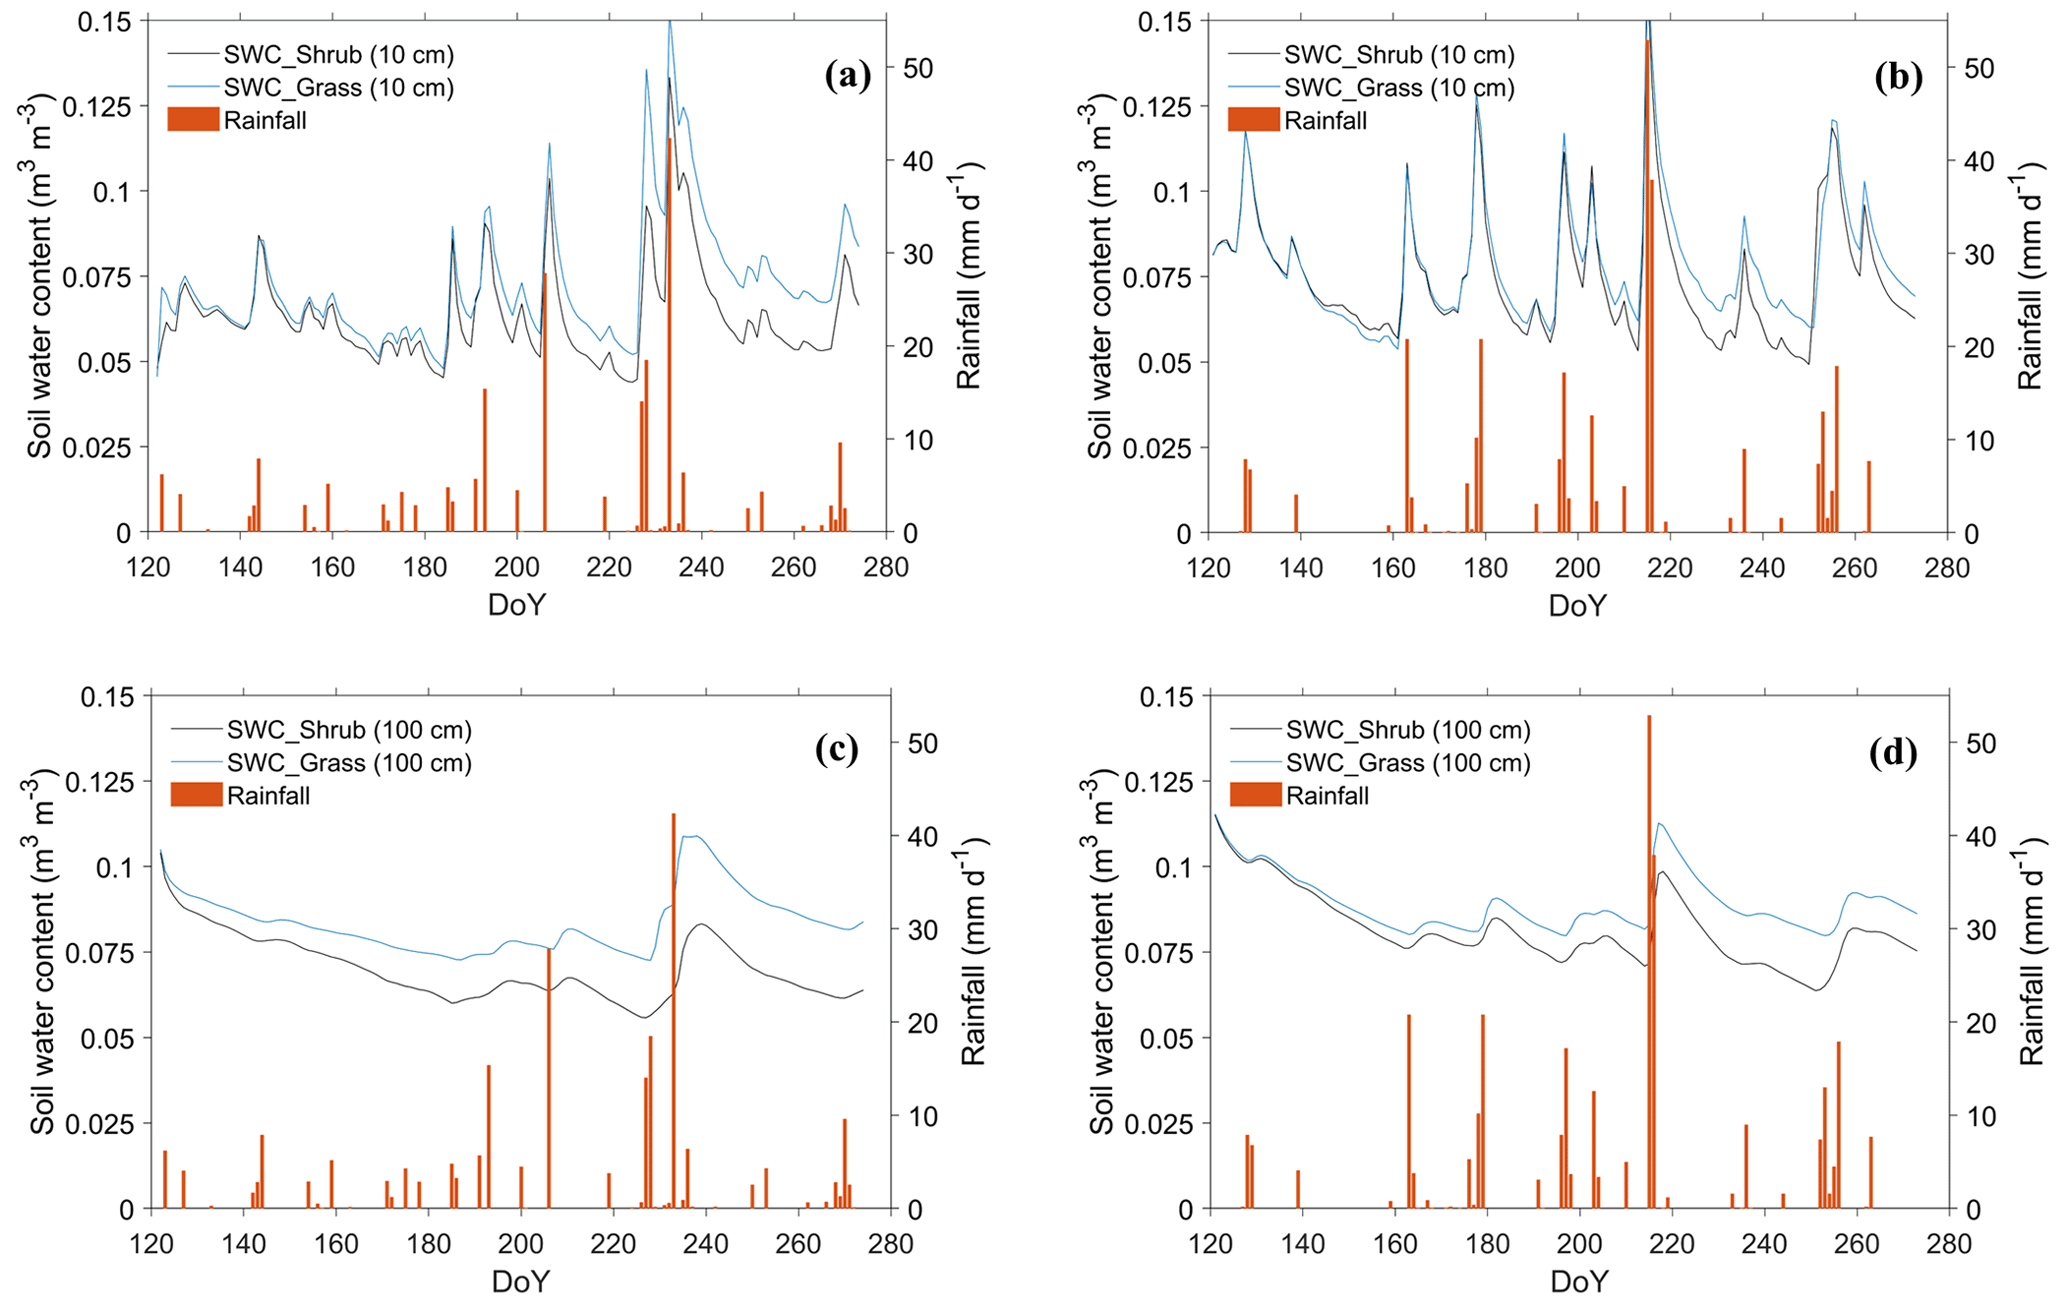
Figure 7Daily variation in simulated SWC under two land cover types (a) at 10 cm depth in 2016, (b) at 10 cm depth in 2019, (c) at 100 cm depth in 2016, and (d) at 100 cm depth in 2019 during May–September. In the legend, “Shrub” and “Grass” denote the grid modeling for shrub and grass, respectively.
Water fluxes: evaporation, transpiration, and ET
As shown in Fig. 8, the evaporation and transpiration were boosted along with the rainfall pulses, and their large day-to-day variation was noted. The seasonal evaporation of the shrub–grassland ecosystem was reduced by 21 % (15 %) compared to that of the grassland ecosystem over the growing season in 2016 (2019) (Table S8). In contrast, the seasonal transpiration of the shrub–grassland ecosystem was increased by 69 % (75 %) compared to that of the grassland ecosystem in 2016 (2019). Over the growing season in 2016 (2019), transpiration accounted for 48 % (41 %) of evapotranspiration (ET) from the shrub–grassland ecosystem, compared to 30 % (25 %) from the grassland ecosystem. The seasonal ET of the shrub–grassland ecosystem was 6 % (8 %) higher than that of the grassland ecosystem in 2016 (2019). In conclusion, the revegetated shrub reduced the evaporation but increased the transpiration, leading to a net increase in total ET at the ecosystem scale.
As rainfall increased by 74.3 mm in 2019, the seasonal ET increased by 59.50 mm (20.88 mm) in the shrub–grassland (grassland) ecosystem. However, the contributions of evaporation (∼ 73 %) and transpiration (∼ 27 %) to total ET remained stable for the grassland ecosystem in between the two years. Besides, a slight variation was observed in SWC at 10 and 100 cm soil depth under grassland between the two years (Table S7). It seems possible that the water consumption of grassland was relatively stable regardless of changes in precipitation amount (see discussion in Sect. 4.3).
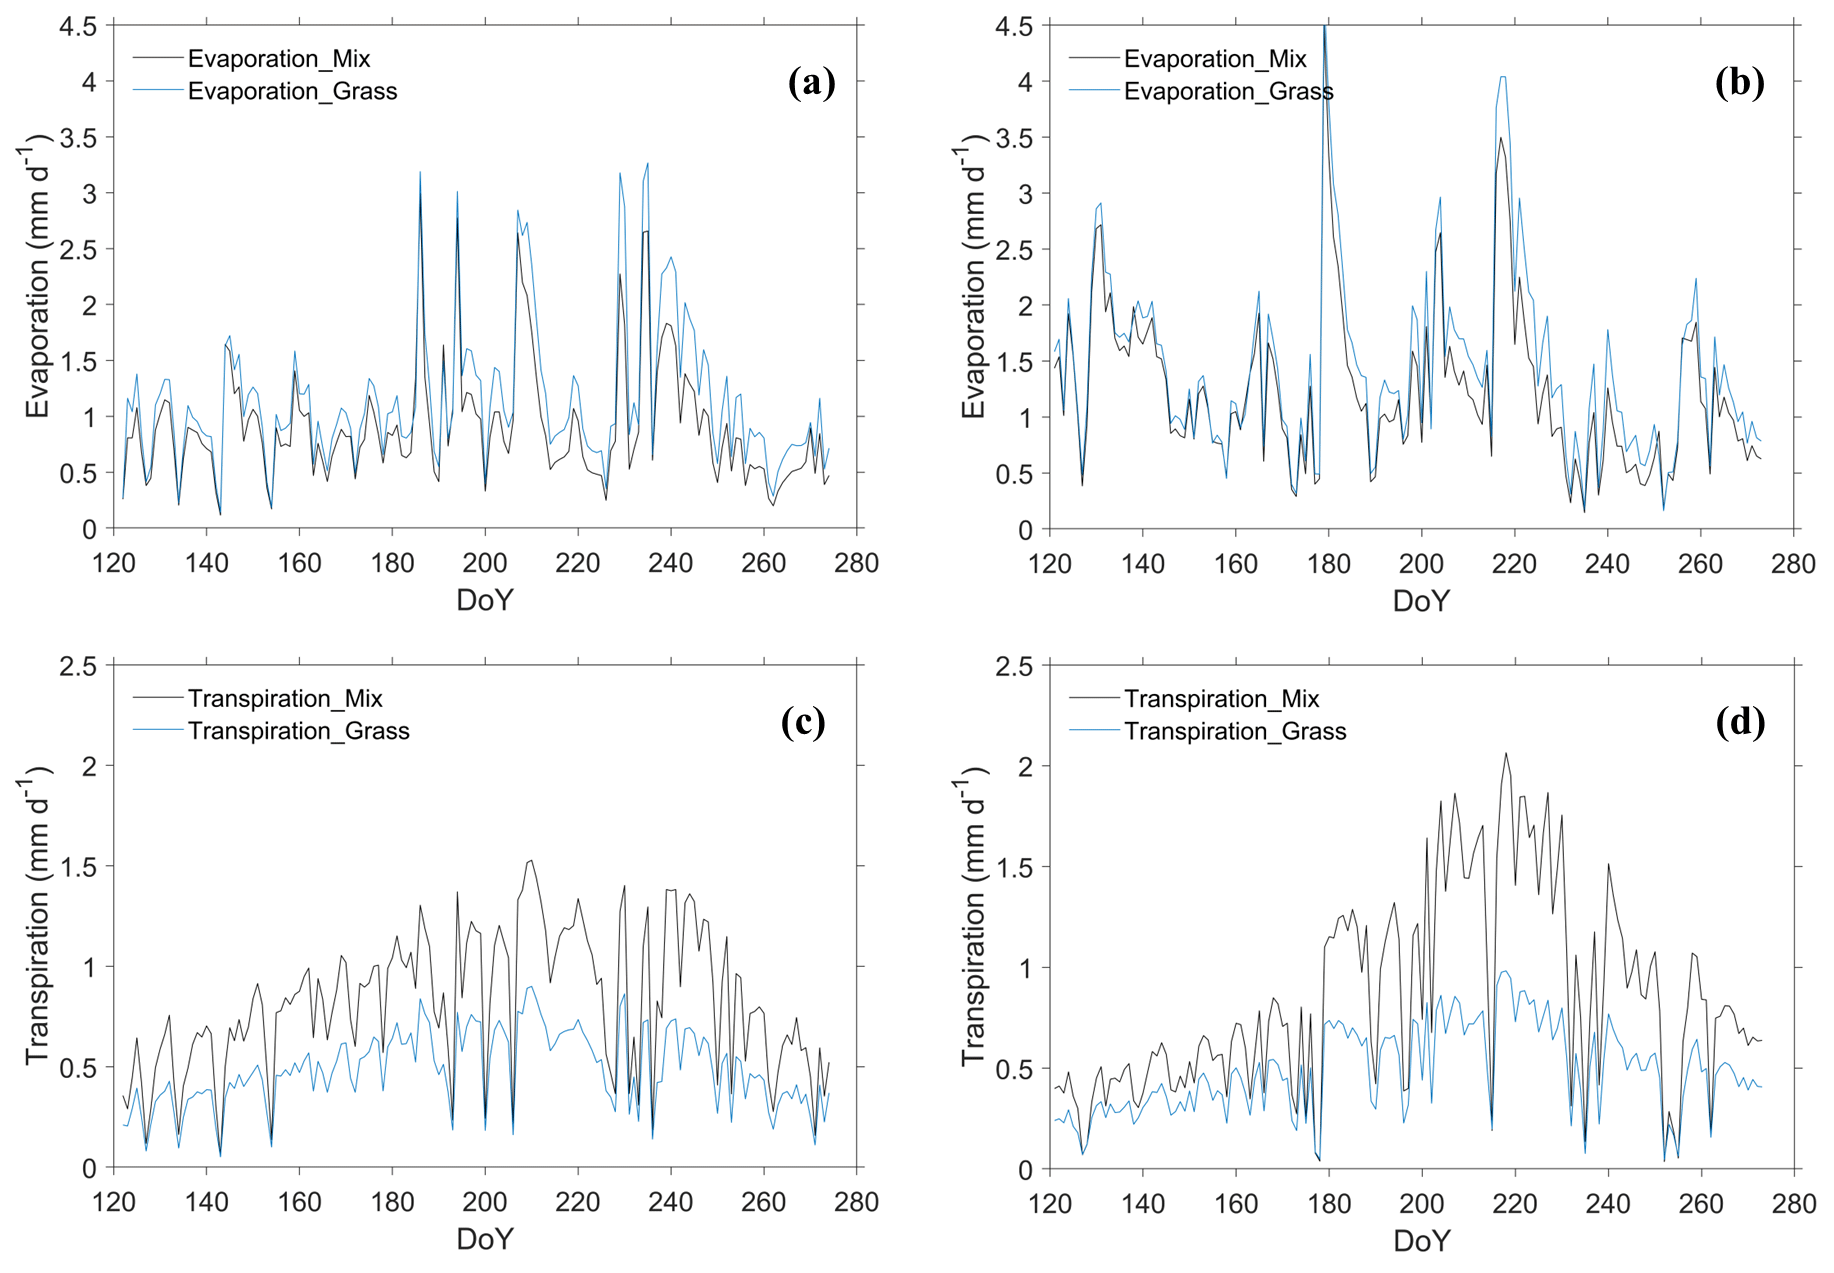
Figure 8Daily variation in simulated evaporation of the shrub–grassland ecosystem (Mix) and grassland ecosystem (Grass) during May–September for (a) the year 2016 and (b) the year 2019. Daily variation in simulated transpiration for the same periods is labeled as (c) transpiration in 2016 and (d) transpiration in 2019.
3.3.3 Diurnal and daily variations GPP
The gross primary productivity (GPP) of both ecosystems displayed evident diurnal patterns (Fig. S10a). During the daytime, GPP was positive, indicating that the plants were taking up carbon. The plants halted their photosynthesis at nighttime with zero value of GPP. The magnitude of the diurnal variations was the largest in August, during which GPP peaked at 7.36 and 3.63 µmol m−2 s−1 during the midday period (10:00–14:00) in shrub–grassland and grassland ecosystems, respectively. GPP was consistently higher in the shrub–grassland ecosystem, particularly in July and August.
The daily GPP of the shrub–grassland ecosystem tended to be more sensitive to the rainfall with more significant fluctuations, represented by the apparent increase in the DOY 207, 229, and 234 in the year 2016 and DOY 180, 199, and 217 in the year 2019 (Fig. 9). Moreover, the shrub–grassland ecosystem assimilated 76 % (89 %) more carbon than the grassland ecosystem over the growing season in 2016 (2019) (Table S9). In 2019, the seasonal GPP of the shrub–grassland ecosystem (grassland ecosystem) increased by 15 % (7 %) compared to that in 2016. In the presence of more rainfall, the shrubs suffered less water stress, directly promoting the carboxylation rate for greater photosynthesis (Eq. S18).
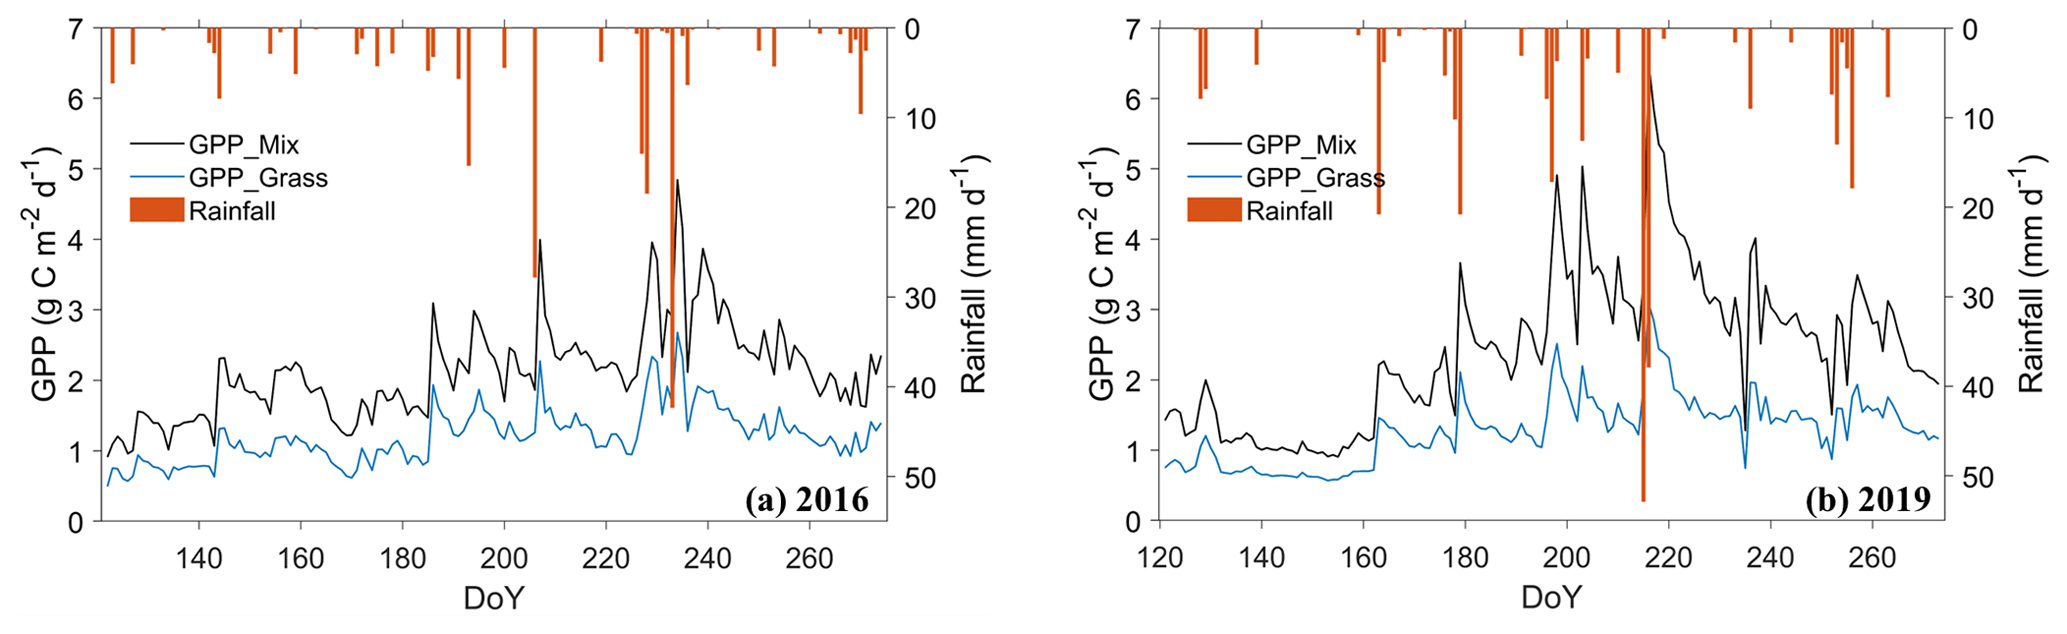
Figure 9Daily variation in simulated gross primary productivity (GPP) of two ecosystems during May–September in (a) 2016 and (b) 2019.
3.3.4 Changes caused by revegetation
Overall, our results show that revegetation increased Rn, LE, and H by 5 %, 7 %, and 14 %, respectively, while decreasing G by 27 %. The soil water content in the soil column was reduced by 8 %, and the root water uptake increased sharply by 123 %. The revegetation decreased the evaporation by 18 %; meanwhile, the transpiration increased by 72 %. As for carbon flux, the revegetated shrubs increased GPP by 83 % (Fig. 10).
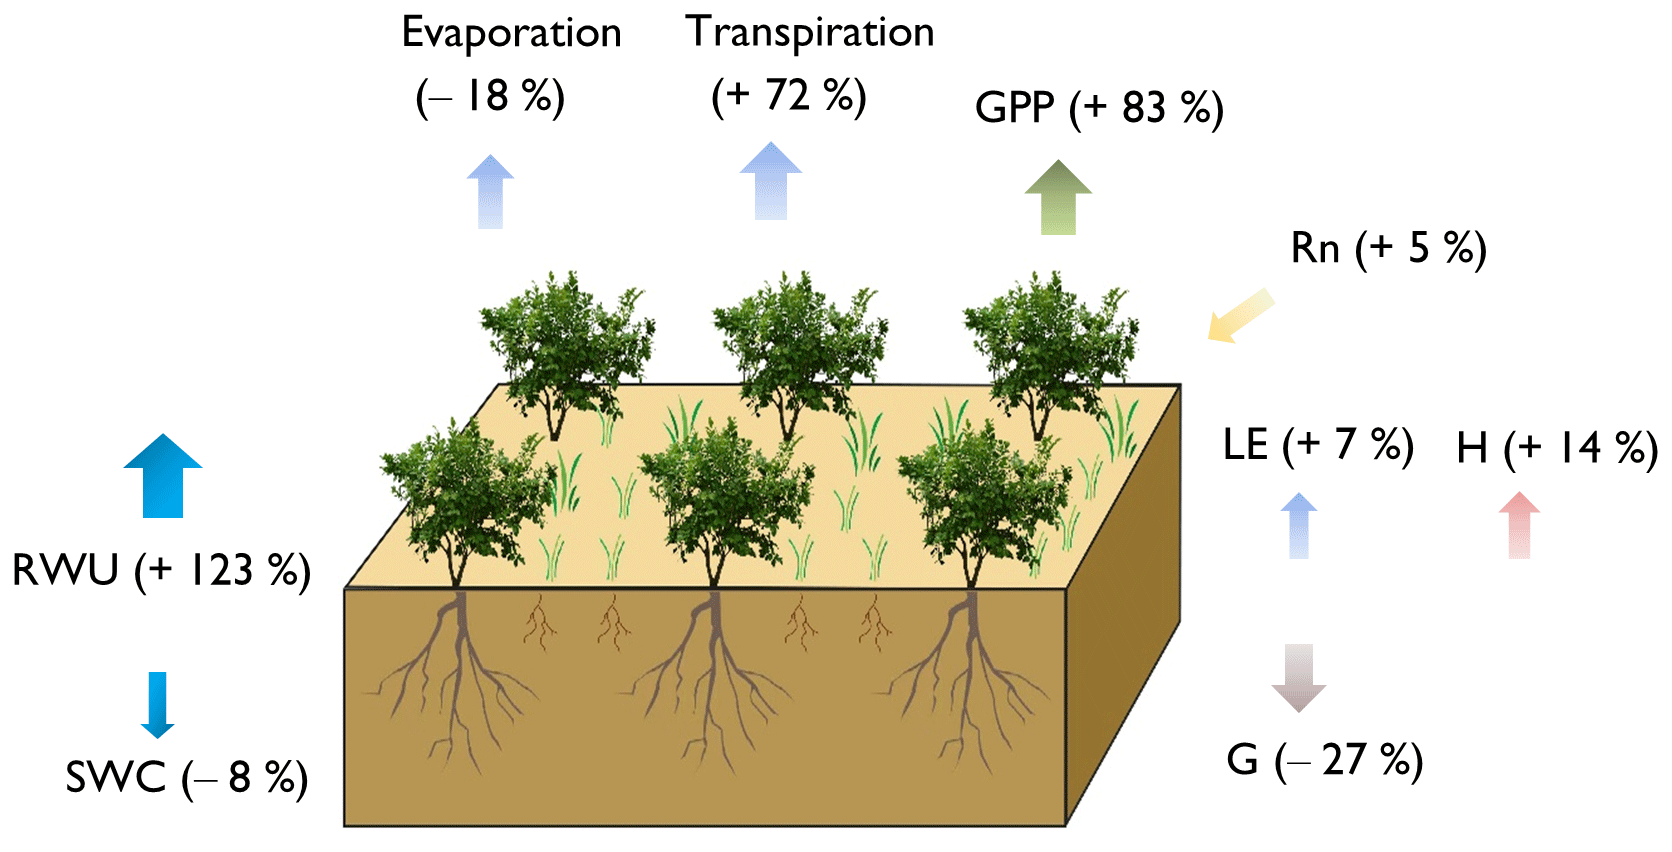
Figure 10The changes in the energy, water, and carbon fluxes caused by the revegetation, illustrated by the difference in averaged fluxes between the shrub–grassland ecosystem and grassland ecosystem. The arrows indicate the direction of the fluxes, and the “−” symbol represents a decrease, while the “+” symbol represents an increase based on the grassland scenario.
4.1 Evaluation of model performance and uncertainties
As summarized in Table S6, the model simulations showed a good match with the observed fluxes, but still, there are some deviations. Firstly, these deviations primarily stem from the model inputs and the scenario design. For instance, (i) the estimated parameters (e.g., rooting depth and Vcmax) and reconstructed LAI for shrubland and grassland were critical for LE and GPP modeling. (ii) Concerning the scenario design, the contributions from shrubland and grassland that were estimated from only one UAV photograph might not be representative over the investigation period because vegetation coverage is highly dependent on precipitation supply in the study area. The contributions from shrubland and grassland implicitly included the fraction of bare soil. The model then simulates evaporation from the soil beneath sunlit or shaded leaves and upscales it into a canopy/grid by multiplying LAI, rather than directly calculating evaporation from the bare soil. However, this approach may lead to an underestimation of soil evaporation, as a separate simulation of bare soil was not conducted in this study. To overcome this, the model will be further developed to allow parallel computations of bare soil and low and high vegetation. (iii) Direct comparison between simulated SWC and observed SWC under the grassland scenario leads to bias because the observed SWC is the average of shrub, grass, and bare-soil values. However, SWC is a state variable, and it is not reasonable to aggregate/average it from shrub, grass, and bare-soil simulation in the current modeling scheme. Nonetheless, the comparison between simulated SWC and the observed value for either shrubland (R2=0.79 and 0.82 in 2018 and 2019, respectively) or grassland (R2=0.88 and 0.84 in 2018 and 2019, respectively) proves the credibility of model simulations. (iv) The quality of gap-filled forcing data and in situ measurements is the basis for a valid comparison between simulations and observations. Although we applied a pre-assessment and filtering strategy to the energy fluxes with available data (Eq. S10), the energy closure issue results in uncertainty in comparing the H and values, especially in the years 2016 and 2017 without soil heat flux for quality control on energy fluxes.
As for the model itself, it is a one-dimensional vertical model that does not consider the lateral flow, which is assumed reasonably to be negligible in this flat study area. Nevertheless, at another site in Yanchi County with similar land cover types, Gong et al. (2016) found that the absence of horizontal exchanges of water, vapor, and heat advection in the model led to an underestimation of energy fluxes. However, there is always a trade-off between model complexity and effectiveness. For our focus on understanding the impact of revegetation on energy, water, and carbon fluxes, the neglect of lateral flow in the STEMMUS–SCOPE model will not affect our conclusions.
Validation performances of LE and GPP (R2=0.67 and 0.70) were reasonable. Most of the discrepancies are represented as the overestimate of LE during large and continuous rainfall events. For instance, in 2016, the model generated outliers during DOY 228–240 along with 69.56 mm rainfall within this period; likewise, the same was also reflected in 2017 and 2019 (Fig. S11). The overestimation of the energy-limited evaporation rate, driven by the skin temperature, is the main reason for the overestimation of LE. The causes of the outliers might be attributed to two factors: first, the use of a fixed time step (i.e., 30 min) in running STEMMUS–SCOPE was temporally too coarse to achieve a precise numerical solution. Alternatively, the measurements of LE during rainfall events were less reliable.
During the dry period without rainfall, the model tended to underestimate LE and GPP. As shown in Fig. S12, GPP simulations were notably low during water-stressed periods, where the water stress factor (WSF) approached zero. Several factors partially contribute to the underestimations in LE and GPP. Aboveground, GPP is positively influenced by WSF, which in turn regulates Vcmax (Eq. S18). This affects both stomatal conductance and LE, making errors from approximated LAI (Sect. 2.3.2) and Vcmax potentially significant. Belowground, observations from other studies suggest that shrubs could adapt their RWU strategies, tapping into deep soil or using lateral roots. Unfortunately, the STEMMUS–SCOPE model lacks the flexibility to simulate these dynamic RWU strategies; it relies on the initial SWC profile and root parameters to simulate root growth and RWU. In the STEMMUS–SCOPE model, the initial SWC profile not only determines the pattern of soil water storage in the soil column but also indicates the pattern of RWU. However, we lack observations of SWC in deeper layers and root distributions. To mitigate the uncertainties caused by critical parameters, we carried out a sensitivity analysis to identify their influences and provide reference values. Our findings underline the importance of an accurate LAI, Vcmax, and Ball–Berry stomatal conductance parameter and accurate multi-layer soil moisture observations for improving LE and GPP simulations.
4.2 Effects of anthropogenic revegetation on ecosystem processes
4.2.1 On energy fluxes
The difference (4.66±12.21 W m−2) in net radiation (Rn) is insignificant between the two ecosystems (Fig. S9a) because the same meteorological forcings (mainly referring to downward shortwave and longwave radiation) were used for modeling. The averaged midday (i.e., 11:00) ground heat flux (G) accounted for 31 % (39 %) of Rn in the shrub–grassland (grassland) ecosystem (Fig. S9). The observed importance of G was also reported in other semiarid and arid ecosystems with a dry soil surface and low vegetation coverage (Jia et al., 2016; Heusinkveld et al., 2004; Purdy et al., 2016; Kurc and Small, 2004).
The Bowen ratio (i.e., ) over two growing seasons was 71 % (67 %) for shrub–grassland (grassland) ecosystems, indicating that turbulent energy was dominated by LE in this semiarid region. The transition from LE to H dominance occurred from ∼ 08:00 to ∼ 16:00, during which the relatively high air temperature significantly affected H. Compared to the grassland ecosystem, the revegetated shrubs increased the H and LE. Similar findings have also been reported for a semiarid watershed in southeastern Arizona (Flerchinger et al., 1998), three semiarid ecosystems (cheatgrass, sagebrush, and lodgepole pine) in the Snake River basin (Valayamkunnath et al., 2018), and a shrub–steppe ecosystem in Yanchi County (Gong et al., 2016). The consensus was that LE is positively correlated to LAI, vegetation coverage, and water availability. H is positively correlated to the surface temperature.
4.2.2 On gross primary productivity
Despite the underestimation of simulated GPP, the diurnal and monthly variations were in line with observations or simulations in other semiarid shrub–grassland ecosystems in China (Jia et al., 2018; Du et al., 2021; Ma et al., 2020). It has commonly been concluded that revegetation enhances carbon assimilation at the ecosystem level. Such an enhancement in this study (i.e., the difference in GPP between the two ecosystems) was more pronounced in 2019, which received more precipitation (Table S9). Besides, the significant carbon uptake in both ecosystems was noticed after each rainfall event (Fig. 9). This rainfall dependency of the carbon flux is a representative characteristic in semiarid regions, where the water and carbon cycles are tightly coupled (Silva et al., 2017; Brümmer et al., 2008; Hastings et al., 2005; Eamus et al., 2013). Many studies have reported that shrublands are a stronger net carbon sink than C3 grasslands (Eamus et al., 2013; L. Zhang et al., 2020; Hastings et al., 2005; Petrie et al., 2015).
Interestingly, the GPP of the grassland ecosystem reached a plateau at ∼ 10:00 and then dropped at midday, particularly in July (Fig. S10a). The likely cause for this is the midday depression phenomenon whereby the high radiation and high surface temperature of leaves induce the saturation of photosynthesis, which is followed by a decline in stomatal conductance (Chen et al., 2014; S. Wang et al., 2019; Deans et al., 2020). The simulations show the midday depression is less evident in the shrubs (Fig. S10), which is also evidenced by a field study on the transpiration characteristics of Caragana intermedia in the Mu Us Desert (Zang et al., 2009).
4.2.3 On water fluxes
The simulated and observed SWC values at 10 cm soil depth agreed well during the calibration (R2=0.88; RMSE = 0.01 m3 m−3) and validation stage (R2=0.84; RMSE = 0.01 m3 m−3). Rather than the daily values of SWC, the instantaneous values at half-hourly time steps were captured by the STEMMUS–SCOPE model, illustrating the timely SWC responses to rainfall events. This can facilitate the future investigation of the responses of plants (e.g., stomatal conductance and leaf water potential) to water deficits (Liu and Shao, 2015; Fang et al., 2011). The rapid uptake of surface SWC that is replenished by rainwater aligns with observations from Caragana intermedia plantations on the northeast Tibetan Plateau (Zhu and Wang, 2020).
Furthermore, our simulations indicated that SWC decreased within the 0–500 cm profile after revegetation. The most significant decrease in SWC occurred at soil depths of 35–280 cm, corresponding to the evident increase in RWU. Both phenomena were strongly associated with the root distribution and rooting depth of the shrubs. The shrubs extracted more soil water than grasses, especially water from the deep soil. Moreover, such extraction was more intense in the drought year. Similarly, simulations from the SHAW model suggested that SWC under Caragana korshinskii decreased within a 1.0–4.0 m profile and that SWC was depleted from deeper soil with the development of dry soil layers below 1.0 m (Liu and Shao, 2015). Our findings are also supported by field investigations on the root water uptake patterns of shrubs in the semiarid steppe of northern China, using stable isotope technique or installing the sensors in multiple soil layers (Wang et al., 2018; Zhu and Wang, 2020; Y. Zhang et al., 2020; Jia et al., 2012; J. Wang et al., 2019; Jian et al., 2015). These experiments have illustrated that the shrubs with a deep-rooted system, such as Caragana species, can flexibly switch their water source to deeper soil layers when the soil water in the shallow layers is depleted.
The seasonal evapotranspiration (ET) of the shrub–grassland ecosystem was higher than that of the grassland ecosystem, although the evaporation of the shrub–grassland ecosystem was lower (Fig. 8 and Table S8). The revegetated shrubs increased the LAI, directly diminishing the energy that reached the soil surface and thus decreasing evaporation. In this sense, revegetation increased the ecosystem ET mainly with the increasing transpiration (i.e., root water uptake). Our conclusions are qualitatively consistent with other studies in the same study area (Du et al., 2021; Dan et al., 2020), a shrub-encroached steppe ecosystem in Inner Mongolia (Wang et al., 2018), and a modeling study on the water–energy balance of shrubland interspace in Yanchi County (Gong et al., 2016).
An interesting finding is that the shrub–grassland ecosystem presented a higher ratio of transpiration to evapotranspiration () in the dry year of 2016 (48 %) than that in the normal year of 2019 (41 %) (Table S8). This observation implies that the surplus rainwater in the wetter year was not absorbed effectively by roots but was evaporated or recharged deep soils (>300 cm) (Kurc and Small, 2007, 2004; Gao et al., 2023). Similarly, Chen et al. (2014) found that concentrated rainfall events did not induce a significant increase in the transpiration of two revegetation species unless the rainwater could infiltrate the deep soils. At a semiarid site vegetated by apple trees in China's Loess Plateau, Gao et al. (2023) also observed a higher ratio during the extremely dry years as compared to extremely wet years; they also noted that the relationship between and annual precipitation could be complex (either independent or negatively correlated) and may be influenced by soil characteristics. The intricate interplay between and annual precipitation of thick and dry loess soil profiles in the context of climate change presents a challenging topic.
4.3 Will the revegetated shrubs lead to soil water depletion?
For the grassland ecosystem, the ET partitioning, SWC at 10 and 100 cm depth, and GPP remained relatively stable between the two years. Planting shrubs, however, decreased SWC and increased the water loss, leading us to a hypothesize that the water consumption in the shrub–grassland ecosystem might have reached its limit. To examine this assumption, we further compared the cumulative rainfall and ET, shown in Fig. 11.
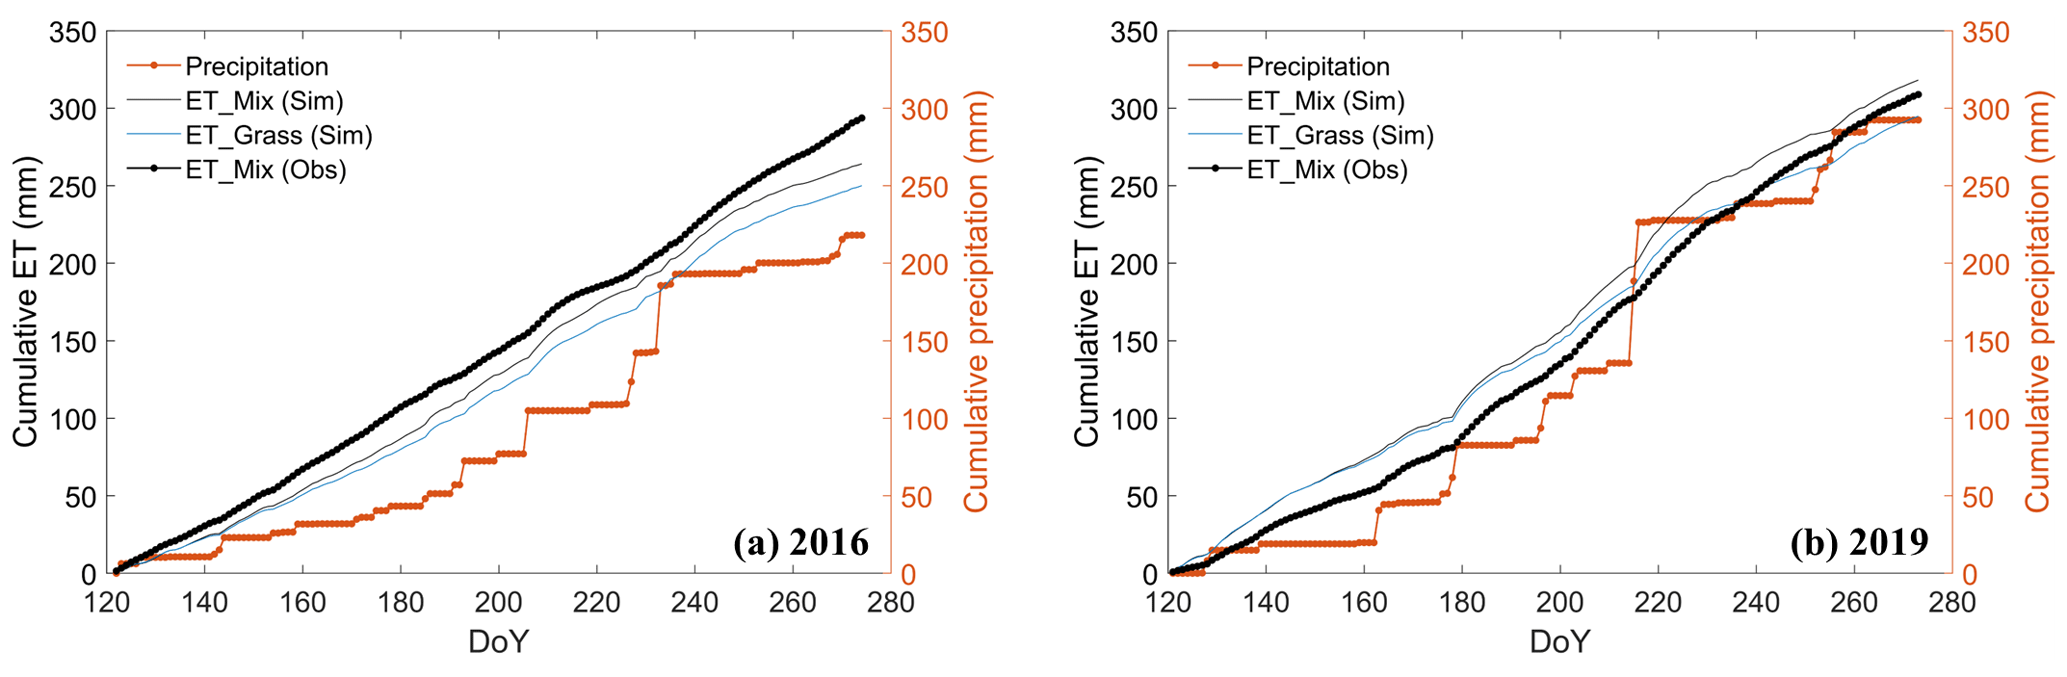
Figure 11Comparison of cumulative precipitation and cumulative evapotranspiration (ET) of the two ecosystems over the growing season in the years (a) 2016 (dry) and (b) 2019 (normal), where “ET_Mix (Sim)” and “ET_Grass (Sim)” are the simulated ET for the shrub–grassland and grassland ecosystem, respectively, and “ET_Mix (Obs)” is the observed ET (i.e., LE) from the EC tower.
The year 2016 witnessed an excess of 46 mm (76 mm) in cumulative simulated (observed) ET over the cumulative precipitation at the end of the growing season (Fig. 11a). This observation points to an additional water source needed for ET, which can only be attributed to water transpired from deeper soil layers. In the wetter year of 2019 (Fig. 11b), the rainwater replenishment seems enough to sustain the growth of grasses but still not enough for the shrub–grassland ecosystem. Cumulative simulated (observed) ET of shrub–grassland exceeded the precipitation by 26 mm (16 mm) in 2019. In comparison, the greater excess of ET over precipitation in 2016 provides evidence that drought conditions could result in a more significant depletion of water from deeper soil layers. Such excessive water consumption could lead to soil desiccation as reported in other semiarid regions with revegetation practices in China's Loess Plateau (see Table S1 in the Supplement of Zhang et al., 2018). Nonetheless, our conclusions regarding water consumption exceeding the ecosystem water supply are tentative, as they are based on simulations spanning only two growing seasons. Corroborating this, the whole-year data in 2019 indicate that received rainfall (358.10 mm) was less than that of the ET from shrubland (400.15 mm) while being comparable to that from grassland (353.17 mm) (Dan, 2020). Long-term scenario simulations are necessary to ascertain the environmental threshold of exploitable water resources in the study area.
To understand the effects of revegetation on ecohydrological processes of a desert steppe in northwestern China, we simulated the energy, water, and carbon fluxes during May–September in 2016 (dry) and 2019 (normal), for a shrub–grassland scenario and a grassland scenario, respectively. Simulations for two land cover types were driven by respective LAI time series and plant trait parameters in the STEMMUS–SCOPE model. Simulated fluxes based on half-hourly time steps agreed well with the measured trends. In particular, the model can simulate the soil water content accurately and capture its diurnal and daily dynamics. Comparing the two scenarios, the revegetation practices in the study area (i) increased both the latent and sensible heat fluxes while decreasing the ground heat flux, with the latent heat flux dominating the energy partitioning; (ii) promoted gross primary productivity, which was highly responsive to rainfall availability; (iii) decreased soil water content at 0–500 cm soil depth (especially 35–280 cm) via root water uptake, which was more pronounced during the drier year; and (iv) aggravated the water consumption of the ecosystem with a decrease in soil water and remarkable increase in root water uptake and transpiration. Moreover, revegetated shrubs appear to have the potential to disrupt the water balance, manifested by greater evapotranspiration than received precipitation in the two growing seasons. Future revegetation practices should consider the sustainable limits of ecosystems to avoid soil water depletion, which risks triggering the imbalance of the tightly coupled energy, water, and carbon cycles in arid and semiarid regions.
The input data, source code, and output data of STEMMUS–SCOPE are available on Zenodo at https://doi.org/10.5281/zenodo.10095916 (Tang et al., 2023).
The supplement related to this article is available online at: https://doi.org/10.5194/bg-21-893-2024-supplement.
ET, ZSu, and YZ designed and performed the study. ET ran the simulations, analyzed the data, and prepared the original draft. LD, HW, and CQ provided the field data. YW, ZSo, DY, and CvdT provided technical help in simulations and data analysis. All authors reviewed and edited the manuscript.
The contact author has declared that none of the authors has any competing interests.
Publisher’s note: Copernicus Publications remains neutral with regard to jurisdictional claims made in the text, published maps, institutional affiliations, or any other geographical representation in this paper. While Copernicus Publications makes every effort to include appropriate place names, the final responsibility lies with the authors.
We thank the National Natural Science Foundation of China (grant nos. 41971033, 41967027, and 42105119); the Fundamental Research Funds for the Central Universities, CHD (grant no. 300102298307); and Ningxia Province's Natural Science Foundation (grant no. 2022AAC02011) for data support.
This research has been funded by the Dutch Research Council (NWO) KIC, WUNDER project (grant no. KICH1. LWV02.20.004); the Netherlands eScience Center, EcoExtreML project (grant no. 27020G07); and Water JPI, iAqueduct project (project no. ENWWW.2018.5). In addition, this study was supported in part by the ESA ELBARA II/ELBARA III loan agreement EOP-SM/2895/TC-tc and the ESA MOST Dragon IV program.
This paper was edited by Akihiko Ito and reviewed by two anonymous referees.
Bayat, B., van der Tol, C., Yang, P., and Verhoef, W.: Extending the SCOPE model to combine optical reflectance and soil moisture observations for remote sensing of ecosystem functioning under water stress conditions, Remote Sens. Environ., 221, 286–301, https://doi.org/10.1016/J.RSE.2018.11.021, 2019.
Brümmer, C., Falk, U., Papen, H., Szarzynski, J., Wassmann, R., and Brüggemann, N.: Diurnal, seasonal, and interannual variation in carbon dioxide and energy exchange in shrub savanna in Burkina Faso (West Africa), J. Geophys. Res.-Biogeo., 113, G02030, https://doi.org/10.1029/2007JG000583, 2008.
Camargo, G. G. T. and Kemanian, A. R.: Six crop models differ in their simulation of water uptake, Agr. Forest Meteorol., 220, 116–129, https://doi.org/10.1016/j.agrformet.2016.01.013, 2016.
Chen, C., Park, T., Wang, X., Piao, S., Xu, B., Chaturvedi, R. K., Fuchs, R., Brovkin, V., Ciais, P., Fensholt, R., Tømmervik, H., Bala, G., Zhu, Z., Nemani, R. R., and Myneni, R. B.: China and India lead in greening of the world through land-use management, Nat. Sustain., 2, 122–129, https://doi.org/10.1038/s41893-019-0220-7, 2019.
Chen, L., Zhang, Z., Zeppel, M., Liu, C., Guo, J., Zhu, J., Zhang, X., Zhang, J., and Zha, T.: Response of transpiration to rain pulses for two tree species in a semiarid plantation, Int. J. Biometeorol., 58, 1569–1581, https://doi.org/10.1007/S00484-013-0761-9, 2014.
Chen, L., Wang, L., Ma, Y., and Liu, P.: Overview of Ecohydrological Models and Systems at the Watershed Scale, IEEE Syst. J., 9, 1091–1099, https://doi.org/10.1109/JSYST.2013.2296979, 2015.
Dan, Y.: Effects of Planted Shrub Encroachment on Evapotranspiration in Desert Steppe – A Case Study in Yanchi County, Ningxia Hui Autonomous Region, Ningxia University, https://d.wanfangdata.com.cn/thesis/Y3766339 (last access: 15 February 2024), 2020 (in Chinese).
Dan, Y., Du, L., Wang, L., Ma, L., Qiao, C., Wu, H., and Meng, C.: Effects of planted shrub encroachment on evapotranspiration and its components in desert steppe: A case study in Yanchi county, Ningxia Hui Autonomous Region, Shengtai Xuebao/Acta Ecol. Sin., 40, 5638–5648, https://www.ecologica.cn/html/2020/16/stxb201910032066.htm (last access: 15 February 2024), 2020.
Deans, R. M., Brodribb, T. J., Busch, F. A., and Farquhar, G. D.: Optimization can provide the fundamental link between leaf photosynthesis, gas exchange and water relations, Nat. Plants, 6, 1116–1125, https://doi.org/10.1038/S41477-020-00760-6, 2020.
D'Odorico, P., Okin, G. S., and Bestelmeyer, B. T.: A synthetic review of feedbacks and drivers of shrub encroachment in arid grasslands, Ecohydrology, 5, 520–530, https://doi.org/10.1002/eco.259, 2012.
Du, L., Zeng, Y., Ma, L., Qiao, C., Wu, H., Su, Z., and Bao, G.: Effects of anthropogenic revegetation on the water and carbon cycles of a desert steppe ecosystem, Agr. Forest Meteorol., 300, 108339, https://doi.org/10.1016/j.agrformet.2021.108339, 2021.
Eamus, D., Cleverly, J., Boulain, N., Grant, N., Faux, R., and Villalobos-Vega, R.: Carbon and water fluxes in an arid-zone Acacia savanna woodland: An analyses of seasonal patterns and responses to rainfall events, Agr. Forest Meteorol., 182–183, 225–238, https://doi.org/10.1016/J.AGRFORMET.2013.04.020, 2013.
Fan, Y., Miguez-Macho, G., Jobbágy, E. G., Jackson, R. B., and Otero-Casal, C.: Hydrologic regulation of plant rooting depth, P. Natl. Acad. Sci. USA, 114, 10572–10577, https://doi.org/10.1073/PNAS.1712381114, 2017.
Fang, X. W., Turner, N. C., Li, F. M., Li, W. J., and Guo, X. S.: Caragana korshinskii seedlings maintain positive photosynthesis during short-term, severe drought stress, Photosynthetica, 49, 603–609, https://doi.org/10.1007/S11099-011-0067-2, 2011.
Fatichi, S., Pappas, C., and Ivanov, V. Y.: Modeling plant–water interactions: an ecohydrological overview from the cell to the global scale, WIREs Water, 3, 327–368, https://doi.org/10.1002/wat2.1125, 2016.
Feng, X., Fu, B., Piao, S., Wang, S., Ciais, P., Zeng, Z., Lü, Y., Zeng, Y., Li, Y., Jiang, X., and Wu, B.: Revegetation in China's Loess Plateau is approaching sustainable water resource limits, Nat. Clim. Change, 611, 1019–1022, https://doi.org/10.1038/nclimate3092, 2016.
Fisher, J. B., Huntzinger, D. N., Schwalm, C. R., and Sitch, S.: Modeling the Terrestrial Biosphere, Annu. Rev., https://doi.org/10.1146/annurev-environ-012913-093456, 39, 91–123, 2014.
Flerchinger, G. N., Kustas, W. P., and Mark, W.: Simulating Surface Energy Fluxes and Radiometric Surface Temperatures for Two Arid Vegetation Communities Using the SHAW Model, J. Appl. Meteorol., 37, 449–460, https://doi.org/10.1175/1520-0450(1998)037<0449:SSEFAR>2.0.CO;2, 1998.
Fu, W., Huang, M., Gallichand, J., and Shao, M.: Optimization of plant coverage in relation to water balance in the Loess Plateau of China, Geoderma, 173–174, 134–144, https://doi.org/10.1016/J.GEODERMA.2011.12.016, 2012.
Gao, X., Wan, H., Zeng, Y., Shao, X., Hu, W., Brocca, L., Yang, M., Wu, P., and Zhao, X.: Disentangling the Impact of Event- and Annual-Scale Precipitation Extremes on Critical-Zone Hydrology in Semiarid Loess Vegetated by Apple Trees, Water Resour. Res., 59, e2022WR033042, https://doi.org/10.1029/2022WR033042, 2023.
Gong, J., Jia, X., Zha, T., Wang, B., Kellomäki, S., and Peltola, H.: Modeling the effects of plant-interspace heterogeneity on water-energy balances in a semiarid ecosystem, Agr. Forest Meteorol., 221, 189–206, https://doi.org/10.1016/J.AGRFORMET.2016.01.144, 2016.
Groenendijk, M., Dolman, A. J., van der Molen, M. K., Leuning, R., Arneth, A., Delpierre, N., Gash, J. H. C., Lindroth, A., Richardson, A. D., Verbeeck, H., and Wohlfahrt, G.: Assessing parameter variability in a photosynthesis model within and between plant functional types using global Fluxnet eddy covariance data, Agr. Forest Meteorol., 151, 22–38, https://doi.org/10.1016/J.AGRFORMET.2010.08.013, 2011.
Hastings, S. J., Oechel, W. C., and Muhlia-Melo, A.: Diurnal, seasonal and annual variation in the net ecosystem CO2 exchange of a desert shrub community (Sarcocaulescent) in Baja California, Mexico, Glob. Change Biol., 11, 927–939, https://doi.org/10.1111/J.1365-2486.2005.00951.X, 2005.
Herman, J. and Usher, W.: SALib: An open-source Python library for Sensitivity Analysis, J. Open Source Softw., 2, 97, https://doi.org/10.21105/JOSS.00097, 2017.
Herman, J. D., Kollat, J. B., Reed, P. M., and Wagener, T.: Technical Note: Method of Morris effectively reduces the computational demands of global sensitivity analysis for distributed watershed models, Hydrol. Earth Syst. Sci., 17, 2893–2903, https://doi.org/10.5194/hess-17-2893-2013, 2013.
Heusinkveld, B. G., Jacobs, A. F. G., Holtslag, A. A. M., and Berkowicz, S. M.: Surface energy balance closure in an arid region: role of soil heat flux, Agr. Forest Meteorol., 122, 21–37, https://doi.org/10.1016/J.AGRFORMET.2003.09.005, 2004.
Huxman, T. E., Wilcox, B. P., Breshears, D. D., Scott, R. L., Snyder, K. A., Small, E. E., Hultine, K., Pockman, W. T., and Jackson, R. B.: ECOHYDROLOGICAL IMPLICATIONS OF WOODY PLANT ENCROACHMENT, Ecology, 86, 308–319, https://doi.org/10.1890/03-0583, 2005.
Ivanov, V. Y., Bras, R. L., and Vivoni, E. R.: Vegetation-hydrology dynamics in complex terrain of semiarid areas: 1. A mechanistic approach to modeling dynamic feedbacks, Water Resour. Res., 44, 3429, https://doi.org/10.1029/2006WR005588, 2008.
Jackson, R. B., Mooney, H. A., and Schulze, E. D.: A global budget for fine root biomass, surface area, and nutrient contents, P. Natl. Acad. Sci. USA, 94, 7362–7366, https://doi.org/10.1073/PNAS.94.14.7362, 1997.
Jia, X., Zha, T. S., Gong, J. N., Wu, B., Zhang, Y. Q., Qin, S. G., Chen, G. P., Feng, W., Kellomäki, S., and Peltola, H.: Energy partitioning over a semi-arid shrubland in northern China, Hydrol. Process., 30, 972–985, https://doi.org/10.1002/HYP.10685, 2016.
Jia, X., Shao, M., Zhu, Y., and Luo, Y.: Soil moisture decline due to afforestation across the Loess Plateau, China, J. Hydrol., 546, 113–122, https://doi.org/10.1016/J.JHYDROL.2017.01.011, 2017.
Jia, X., Zha, T., Gong, J., Zhang, Y., Wu, B., Qin, S., and Peltola, H.: Multi-scale dynamics and environmental controls on net ecosystem CO2 exchange over a temperate semiarid shrubland, Agr. Forest Meteorol., 259, 250–259, https://doi.org/10.1016/J.AGRFORMET.2018.05.009, 2018.
Jia, Z., Zhu, Y., and Liu, L.: Different Water Use Strategies of Juvenile and Adult Caragana intermedia Plantations in the Gonghe Basin, Tibet Plateau, PLoS One, 7, e45902, https://doi.org/10.1371/JOURNAL.PONE.0045902, 2012.
Jian, S., Zhao, C., Fang, S., and Yu, K.: Effects of different vegetation restoration on soil water storage and water balance in the Chinese Loess Plateau, Agr. Forest Meteorol., 206, 85–96, https://doi.org/10.1016/J.AGRFORMET.2015.03.009, 2015.
Kennedy, D., Swenson, S., Oleson, K. W., Lawrence, D. M., Fisher, R., Lola da Costa, A. C., and Gentine, P.: Implementing Plant Hydraulics in the Community Land Model, Version 5, J. Adv. Model. Earth Sy., 11, 485–513, https://doi.org/10.1029/2018MS001500, 2019.
Kurc, S. A. and Small, E. E.: Dynamics of evapotranspiration in semiarid grassland and shrubland ecosystems during the summer monsoon season, central New Mexico, Water Resour. Res., 40, 9305, https://doi.org/10.1029/2004WR003068, 2004.
Kurc, S. A. and Small, E. E.: Soil moisture variations and ecosystem-scale fluxes of water and carbon in semiarid grassland and shrubland, Water Resour. Res., 43, 6416, https://doi.org/10.1029/2006WR005011, 2007.
Liu, B. and Shao, M.: Modeling soil–water dynamics and soil–water carrying capacity for vegetation on the Loess Plateau, China, Agr. Water Manage., 159, 176–184, https://doi.org/10.1016/J.AGWAT.2015.06.019, 2015.
Liu, M., Jia, Y., Zhao, J., Shen, Y., Pei, H., Zhang, H., and Li, Y.: Revegetation projects significantly improved ecosystem service values in the agro-pastoral ecotone of northern China in recent 20 years, Sci. Total Environ., 788, 147756, https://doi.org/10.1016/J.SCITOTENV.2021.147756, 2021.
Ma, J., Liu, R., Li, C., Fan, L., Xu, G., and Li, Y.: Herbaceous layer determines the relationship between soil respiration and photosynthesis in a shrub-dominated desert plant community, Plant Soil, 449, 193–207, https://doi.org/10.1007/s11104-020-04484-6, 2020.
Montzka, C., Herbst, M., Weihermüller, L., Verhoef, A., and Vereecken, H.: A global data set of soil hydraulic properties and sub-grid variability of soil water retention and hydraulic conductivity curves, Earth Syst. Sci. Data, 9, 529–543, https://doi.org/10.5194/essd-9-529-2017, 2017.
Newman, B. D., Wilcox, B. P., Archer, S. R., Breshears, D. D., Dahm, C. N., Duffy, C. J., McDowell, N. G., Phillips, F. M., Scanlon, B. R., and Vivoni, E. R.: Ecohydrology of water-limited environments: A scientific vision, Water Resour. Res., 42, W06302, https://doi.org/10.1029/2005WR004141, 2006.
Niu, G., Fang, Y., Chang, L., Jin, J., Yuan, H., and Zeng, X.: Enhancing the Noah-MP Ecosystem Response to Droughts With an Explicit Representation of Plant Water Storage Supplied by Dynamic Root Water Uptake, J. Adv. Model. Earth Sy., 12, e2020MS002062, https://doi.org/10.1029/2020MS002062, 2020.
Petrie, M. D., Collins, S. L., Swann, A. M., Ford, P. L., and Litvak, M. E.: Grassland to shrubland state transitions enhance carbon sequestration in the northern Chihuahuan Desert, Glob. Change Biol., 21, 1226–1235, https://doi.org/10.1111/GCB.12743, 2015.
Purdy, A. J., Fisher, J. B., Goulden, M. L., and Famiglietti, J. S.: Ground heat flux: An analytical review of 6 models evaluated at 88 sites and globally, J. Geophys. Res.-Biogeo., 121, 3045–3059, https://doi.org/10.1002/2016JG003591, 2016.
Romano, N., Palladino, M., and Chirico, G. B.: Parameterization of a bucket model for soil-vegetation-atmosphere modeling under seasonal climatic regimes, Hydrol. Earth Syst. Sci., 15, 3877–3893, https://doi.org/10.5194/hess-15-3877-2011, 2011.
Silva, P. F., Lima, J. R. D. S., Antonino, A. C. D., Souza, R., de Souza, E. S., Silva, J. R. I., and Alves, E. M.: Seasonal patterns of carbon dioxide, water and energy fluxes over the Caatinga and grassland in the semi-arid region of Brazil, J. Arid Environ., 147, 71–82, https://doi.org/10.1016/J.JARIDENV.2017.09.003, 2017.
Tague, C., McMichael, C., Hope, A., Choate, J., and Clark, R.: Application of the RHESSys model to a California semiarid shrubland watershed, J. Am. Water Resour. As., 40, 575–589, https://doi.org/10.1111/j.1752-1688.2004.tb04444.x, 2004.
Tang, E., Zeng, Y., Wang, Y., Song, Z., Yu, D., Wu, H., Qiao, C., van der Tol, C., Du, L., and Su, Z.: Understanding the Effects of Revegetated Shrubs on Fluxes of Energy, Water and Gross Primary Productivity in a Desert Steppe Ecosystem Using STEMMUS-SCOPE Model, Zenodo [model], https://doi.org/10.5281/zenodo.10095916, 2023.
Tian, F., Feng, X., Zhang, L., Fu, B., Wang, S., Lv, Y., and Wang, P.: Effects of revegetation on soil moisture under different precipitation gradients in the Loess Plateau, China, Hydrol. Res., 48, 1378–1390, https://doi.org/10.2166/NH.2016.022, 2017.
van der Tol, C., Verhoef, W., Timmermans, J., Verhoef, A., and Su, Z.: An integrated model of soil-canopy spectral radiances, photosynthesis, fluorescence, temperature and energy balance, Biogeosciences, 6, 3109–3129, https://doi.org/10.5194/bg-6-3109-2009, 2009.
Valayamkunnath, P., Sridhar, V., Zhao, W., and Allen, R. G.: Intercomparison of surface energy fluxes, soil moisture, and evapotranspiration from eddy covariance, large-aperture scintillometer, and modeling across three ecosystems in a semiarid climate, Agr. Forest Meteorol., 248, 22–47, https://doi.org/10.1016/J.AGRFORMET.2017.08.025, 2018.
Verrelst, J., Rivera, J. P., van der Tol, C., Magnani, F., Mohammed, G., and Moreno, J.: Global sensitivity analysis of the SCOPE model: What drives simulated canopy-leaving sun-induced fluorescence?, Remote Sens. Environ., 166, 8–21, https://doi.org/10.1016/J.RSE.2015.06.002, 2015.
Wang, H., Harrison, S. P., Prentice, I. C., Yang, Y., Bai, F., Togashi, H. F., Wang, M., Zhou, S., and Ni, J.: The China Plant Trait Database, PANGAEA, https://doi.org/10.1594/PANGAEA.871819, 2017.
Wang, J., Fu, B., Lu, N., Wang, S., and Zhang, L.: Water use characteristics of native and exotic shrub species in the semi-arid Loess Plateau using an isotope technique, Agr. Ecosyst. Environ., 276, 55–63, https://doi.org/10.1016/J.AGEE.2019.02.015, 2019.
Wang, J., Gao, X., Zhao, X., Wan, H., Zeng, Y., Yu, L., Robinson, B., Zhou, Y., Siddique, K. H. M., and Wu, P.: Soil hydrothermal modeling in a dry alpine agricultural zone: The effect of soil airflow, Geoderma, 402, 115354, https://doi.org/10.1016/J.GEODERMA.2021.115354, 2021.
Wang, P., Li, X. Y., Wang, L., Wu, X., Hu, X., Fan, Y., and Tong, Y.: Divergent evapotranspiration partition dynamics between shrubs and grasses in a shrub-encroached steppe ecosystem, New Phytol., 219, 1325–1337, https://doi.org/10.1111/NPH.15237, 2018.
Wang, S., Garcia, M., Bauer-Gottwein, P., Jakobsen, J., Zarco-Tejada, P. J., Bandini, F., Paz, V. S., and Ibrom, A.: High spatial resolution monitoring land surface energy, water and CO2 fluxes from an Unmanned Aerial System, Remote Sens. Environ., 229, 14–31, https://doi.org/10.1016/J.RSE.2019.03.040, 2019.
Wang, Y., Zeng, Y., Yu, L., Yang, P., Van der Tol, C., Yu, Q., Lü, X., Cai, H., and Su, Z.: Integrated modeling of canopy photosynthesis, fluorescence, and the transfer of energy, mass, and momentum in the soil–plant–atmosphere continuum (STEMMUS–SCOPE v1.0.0), Geosci. Model Dev., 14, 1379–1407, https://doi.org/10.5194/gmd-14-1379-2021, 2021.
Wei, Y., Wang, Y., Han, J., Cai, M., Zhu, K., and Wang, Q.: Analysis of water retention characteristics of oil-polluted earthy materials with different textures based on van Genuchten model, J. Soils Sediments, 19, 373–380, https://doi.org/10.1007/S11368-018-2026-Z, 2019.
Yang, P., Prikaziuk, E., Verhoef, W., and van der Tol, C.: SCOPE 2.0: a model to simulate vegetated land surface fluxes and satellite signals, Geosci. Model Dev., 14, 4697–4712, https://doi.org/10.5194/gmd-14-4697-2021, 2021.
Yang, W., Wang, Y., He, C., Tan, X., and Han, Z.: Soil Water Content and Temperature Dynamics under Grassland Degradation: A Multi-Depth Continuous Measurement from the Agricultural Pastoral Ecotone in Northwest China, Sustainability, 11, 4188, https://doi.org/10.3390/SU11154188, 2019.
Yang, Y. and Fu, B.: Soil water migration in the unsaturated zone of semiarid region in China from isotope evidence, Hydrol. Earth Syst. Sci., 21, 1757–1767, https://doi.org/10.5194/hess-21-1757-2017, 2017.
Zang, C., Yang, J., Yuan, J., Liu, X., and Song, B.: Transpiration Characteristics Of Individual Shrubs Of Caragana Intermedia In Mu Us Sandy Land Of North-central China, Chinese J. Plant Ecol., 33, 719, https://doi.org/10.3773/J.ISSN.1005-264X.2009.04.010, 2009.
Zeng, X., Dai, Y.-J., Dickinson, R. E., and Shaikh, M.: The role of root distribution for climate simulation over land, Geophys. Res. Lett., 25, 4533–4536, https://doi.org/10.1029/1998GL900216, 1998.
Zeng, Y., Su, Z., Wan, L., Yang, Z., Zhang, T., Tian, H., Shi, X., Wang, X., and Cao, W.: Diurnal pattern of the drying front in desert and its application for determining the effective infiltration, Hydrol. Earth Syst. Sci., 13, 703–714, https://doi.org/10.5194/hess-13-703-2009, 2009a.
Zeng, Y., Wan, L., Su, Z., Saito, H., Huang, K., and Wang, X.: Diurnal soil water dynamics in the shallow vadose zone (field site of China University of Geosciences, China), Environ. Geol., 58, 11–23, https://doi.org/10.1007/s00254-008-1485-8, 2009b.
Zeng, Y., Su, Z., Wan, L., and Wen, J.: A simulation analysis of the advective effect on evaporation using a two-phase heat and mass flow model, Water Resour. Res., 47, W10529, https://doi.org/10.1029/2011WR010701, 2011a.
Zeng, Y., Su, Z., Wan, L., and Wen, J.: Numerical analysis of air-water-heat flow in unsaturated soil: Is it necessary to consider airflow in land surface models?, J. Geophys. Res.-Atmos., 116, D20107, https://doi.org/10.1029/2011JD015835, 2011b.
Zhang, C., Li, C., Luo, G., and Chen, X.: Modeling plant structure and its impacts on carbon and water cycles of the Central Asian arid ecosystem in the context of climate change, Ecol. Model., 267, 158–179, https://doi.org/10.1016/J.ECOLMODEL.2013.06.008, 2013.
Zhang, L., Xiao, J., Zheng, Y., Li, S., and Zhou, Y.: Increased carbon uptake and water use efficiency in global semi-arid ecosystems, Environ. Res. Lett., 15, 034022, https://doi.org/10.1088/1748-9326/AB68EC, 2020.
Zhang, S., Yang, D., Yang, Y., Piao, S., Yang, H., Lei, H., and Fu, B.: Excessive Afforestation and Soil Drying on China's Loess Plateau, J. Geophys. Res.-Biogeo., 123, 923–935, https://doi.org/10.1002/2017JG004038, 2018.
Zhang, Y., Zhang, M., Qu, D., Duan, W., Wang, J., Su, P., and Guo, R.: Water Use Strategies of Dominant Species (Caragana korshinskii and Reaumuria soongorica) in Natural Shrubs Based on Stable Isotopes in the Loess Hill, China, Water, 12, 1923, https://doi.org/10.3390/W12071923, 2020.
Zhu, Y. and Wang, G.: Rainwater Use Process of Caragana intermedia in Semi-Arid Zone, Tibetan Plateau, Front. Earth Sci., 8, 231, https://doi.org/10.3389/FEART.2020.00231, 2020.
The requested paper has a corresponding corrigendum published. Please read the corrigendum first before downloading the article.
- Article
(5003 KB) - Full-text XML
- Corrigendum
-
Supplement
(2839 KB) - BibTeX
- EndNote