the Creative Commons Attribution 4.0 License.
the Creative Commons Attribution 4.0 License.
 | 27 Mar 2025
Precipitation–fire functional interactions control biomass stocks and carbon exchanges across the world's largest savanna
David T. Milodowski
T. Luke Smallman
Kyle G. Dexter
Gabi C. Hegerl
Iain M. McNicol
Michael O'Sullivan
Carla M. Roesch
Casey M. Ryan
Stephen Sitch
Aude Valade
Southern African woodlands (SAW) are the world's largest savanna, covering ∼ 3 M km2, but their carbon balance and its interactions with climate and disturbance are poorly understood. Here we address three issues that hinder regional efforts to address international climate agreements: producing a state-of-the-art C budget of the SAW region; diagnosing C cycle functional variation and interactions with climate and fire across SAW; and evaluating SAW C cycle representation in land surface models (LSMs). Using 1506 independent 0.5° pixel model calibrations, each constrained with local Earth observation time series of woody carbon stocks (Cwood) and leaf area, we produce a regional SAW C analysis (2006–2017). The regional net biome production is neutral, i.e. −0.08 Mg C ha−1 yr−1 (95 % uncertainty interval −1.67/1.66), with fire emissions contributing ∼ 0.88 Mg C ha−1 yr−1 (95 % uncertainty interval 0.36–2.51). Fire-related mortality driving fluxes from the total Cwood to dead organic matter likely exceeds both fire-related emissions from Cwood into the atmosphere and non-fire Cwood mortality. The emergent spatial variation in biogenic fluxes and C pools is strongly correlated with mean annual precipitation and burned area. However, there are multiple, potentially confounding, causal pathways through which variation in environmental drivers impacts the spatial distribution of C stocks and fluxes, which is mediated by spatial variations in functional parameters like allocation, wood lifespan, and fire resilience. More Cwood in wetter areas is caused by positive precipitation effects on net primary production and on parameters for wood lifespan but is damped by a negative effect with rising precipitation increasing fire-related mortality. Compared to this analysis, LSMs showed marked differences in spatial distributions and magnitudes of C stocks and fire emissions. The current generation of LSMs represents savanna as a single plant functional type, missing important spatial functional variations identified here. Patterns of biomass and C cycling across the region are the outcome of climate controls on production and vegetation–fire interactions which determine residence times, which is linked to spatial variations in key ecosystem functional characteristics.
- Article
(3026 KB) - Full-text XML
-
Supplement
(12181 KB) - BibTeX
- EndNote


Tropical savannas, dominated by trees and grasses, cover 40 % of the vegetated tropics (Pennington et al., 2018), including 2.3–3.1 M km2 in southern Africa (Ribeiro et al., 2020; Ryan et al., 2016). Savanna C stocks and net C fluxes are substantial in the global carbon cycle (Sitch et al., 2015) but with major geographical variations. Spatially there is a strong coupling between precipitation and tree cover across African savanna, particularly where annual precipitation is < 800 mm (Sankaran et al., 2005). The presence of substantial, dry fuel loads means that disturbance from fire is common during the dry season (Andela et al., 2017). Fire influences decadal C sinks through combustion-related emissions (van der Werf et al., 2017) and disturbance impacts on both vegetation growth rates (Yin et al., 2020) and tree mortality (Levick et al., 2015). Overall, the interactions of climate and disturbance, particularly from fire, generate dynamic conditions for C stocks and fluxes across tropical savannas and woodlands (Archibald et al., 2013; Lehmann et al., 2014), which are poorly mapped and understood.
Southern African woodlands (SAW) are the dominant land cover in the dry tropics of southern Africa (Campbell, 1996) and form the world's largest savanna (Mistry, 2014; Ryan et al., 2016), covering much of Tanzania, Mozambique, Zambia, Zimbabwe, Malawi, Angola, and the southern Democratic Republic of Congo (DRC). The woodlands of this region are phylogenetically distinct from other tropical savannas (Dexter et al., 2015) and have biogeochemical and fire patterns (Alvarado et al., 2020) that are linked to unique functional traits (Osborne et al., 2018). These woodlands have long been subjected to, and thus are highly adapted to, disturbance by people, fire (generally set by people), and herbivores (Chidumayo, 2002; Chidumayo, 2004). Overall, the woodland C cycle is often non-steady-state, and anthropogenic change is strengthening this tendency (Ryan et al., 2016). Fire impacts on the C cycle and vegetation C stocks are linked to wet seasons moist enough for biological production to generate fuel load and dry seasons intense enough to dry fuel for destructive fires. Wetter areas of the SAW region may have biomass stimulated by rising production but limited by rising mortality from fire.
A complete ecosystem C cycle analysis for the SAW region that spans climatic gradients and resolves process interactions between climate, fire, and the ecological functioning of C cycling does not currently exist. There are knowledge gaps in both biosphere–atmosphere exchanges and internal ecosystem processing of C. Deriving dynamics of C requires quantification and linkage of relevant processes controlling the biosphere–atmosphere exchange of C, its allocation or transfer to different C pools, and the turnover of these pools. Eddy flux data are scarce and short-term in this region (Merbold et al., 2009). As a result, the net biome exchange (NBE) of CO2 and its components (e.g. gross primary production GPP, ecosystem respiration Reco, and fire emissions EFire) remains poorly quantified (Ciais et al., 2011; Ernst et al., 2024). Internal C processes, particularly mortality or turnover of key pools (linked to mean residence time MRT), are critical for determination of the C balance but are poorly quantified (Friend et al., 2014; Smallman et al., 2021). The MRT is the ratio of C pool size to the total losses from that pool per unit time. In savanna, MRT is sensitive to external factors like burning and internal ecosystem properties. External factors like burning are likely to shorten residence times, but vegetation may adapt to burning with increased tissue resilience to fire. Plant tissue (wood or foliage) lifespans may vary spatially, for instance with climate.
These C cycle knowledge gaps hinder national efforts to manage savanna carbon stores and meet international actions like the Paris Agreement of the UNFCCC. Also, these gaps weaken model projections of trajectories of C for this region under climate change. Simulation models typically represent tropical woodlands across the globe using a single plant functional type (PFT), with PFT-specific parameters which may lead to biased outcomes (Bloom et al., 2016). The functional differences within the savanna biome (Lehmann et al., 2014; Moncrieff et al., 2014) mean that region-specific carbon cycle estimates linked to locally valid functional characteristics are required. Even within the SAW region, we expect to find biological variation and gradients in functional characteristics (Osborne et al., 2018). Understanding this variation and the links to the environment can underpin more robust knowledge. This knowledge can improve representation and therefore forecasts from land surface models, e.g. those used to study trends in the land carbon cycle, such as the Trends and Drivers of Regional Scale Terrestrial Sources and Sinks of Carbon Dioxide (Trendy) experiment (Sitch et al., 2015).
Insights into SAW C cycling are accumulating through intensive studies and extensive observations. Researchers have developed robust methods for woodland inventory and landscape sampling (SEOSAW partnership, 2021). Chronosequence studies have documented the biomass recovery rates of these ecosystems post disturbance (Chidumayo, 2004; Chidumayo, 2013; Kalaba et al., 2013; Gonçalves et al., 2017) to provide insights into annual to decadal dynamics. Earth observations (EOs) of vegetation greening (changes in leaf area index LAI) have been found to be reliable against in situ data on canopy phenology (Ryan et al., 2014, 2017) and hence can map the potential for photosynthesis in time and space. Radar remote sensing has been identified as an effective tool for mapping biomass and its changes over these landscapes (Ryan et al., 2012; Mitchard et al., 2009). These actions have developed the first regional analyses for biomass in space and time (McNicol et al., 2018; McNicol et al., 2023). Long-term observations from satellites track the burned area across these landscapes (Chuvieco et al., 2019). These multiple new analyses of the SAW region provide an opportunity to generate a more robust assessment of the C cycle from local to regional scales. Mechanistic models calibrated with these data can provide a complete, constrained, and probabilistic quantification of the carbon cycle and its processes.
In the present study, we combine new spatial data products with a model–data fusion system (Carbon Data Model Framework – CARDAMOM; Bloom and Williams, 2015) to create the most comprehensive diagnostic analysis to date of the CO2–C cycle of the SAW region in southern Africa. We use this analysis to address questions about key processes controlling the dynamics of major C pools and their variation with climate and fire disturbance across the region for 2006–2017. We further characterize net CO2 exchanges resulting from different driving factors and variations in plant processes, including allocation and mortality. Net ecosystem exchange (NEE = Reco − GPP; the sink has a negative sign) is purely biogenic, i.e. with biological processes driven by atmospheric conditions. Net biome production (NBP) includes human-driven emissions from prescribed factors such as fire and land use removals (NBP = NEE − fire emissions − biomass removals by external factors; the sink has a positive sign). Specifically, this study generates a full C cycle analysis and asks the following research questions (RQs):
-
How do fluxes and resulting net exchanges of CO2 vary across the SAW region and co-vary with climate, fire, and functional characteristics?
-
How do carbon stocks and their longevity co-vary with climate, fire, and functional characteristics?
-
How does data-constrained analysis of ecosystem C cycling compare to Trendy land surface model estimates for the region?
For RQ1 we hypothesize that biogenic fluxes (GPP, Reco) will be determined by a positive relationship with precipitation, the dominant control on biological metabolism in SAW (Campbell, 1996). We hypothesize that NBP across SAW will be determined by a negative relationship with burned area through EFire. For RQ2 we hypothesize that C stocks in total coarse wood C (Cwood) will be positively correlated with, and their distribution determined by, precipitation. However, we hypothesize that there will be mediating effects from variations in functional characteristics such as wood lifespan and fire resilience, as evidenced by broad-scale gradients in these ecosystem functional characteristics. For RQ3 we hypothesize that comparisons of land surface models from Trendy with CARDAMOM analyses will be more consistent for biosphere–atmosphere fluxes than for stock estimates because of the challenge of calibrating modelled stocks to observations (Fawcett et al., 2022).
The novelty of this research is threefold. The regional C budget produced here is the state of the art due to its consistency with locally calibrated estimates of woody biomass dynamics from Earth observations. Causal inference approaches disentangle emergent spatial patterns in C dynamics and ecosystem functional characteristics, providing new biogeographic understanding of ecological functioning and diversity. The spatially detailed model calibration builds an emergent map of processes and C cycle variations that allows resolution within biome patterns, enhancing assessment of land surface models (LSMs).
Multiple EO products of C stocks and LAI, together with a soil C map, are combined into a pixel-by-pixel regional analysis through assimilation with an intermediate-complexity biophysical ecosystem model (Bloom and Williams, 2015) that is calibrated over the area of interest (Fig. 1) with local climate, fire, and forest clearance forcing data. The result is a rigorous, probabilistic C cycle assessment including GPP, NBP, allocation to tissues, pool sizes, ecosystem processes, fire emissions, fire mortality, and non-fire mortality. Calibrated parameters and C cycle assessments are produced independently for each of the 1506 model pixels at 0.5° spatial and monthly temporal resolution for a 12-year period (2006–2017 inclusive) with uncertainty intervals. The study domain comprises all of Tanzania, Mozambique, Zambia, Zimbabwe, Malawi, Angola, and the southern DRC and covers 4.5 M km2, including miombo woodland and a mix of other woodland and savanna types and land uses (SEOSAW partnership, 2021; Godlee et al., 2021). Statistical analysis then relates the spatially independent, data-consistent analytical outputs of each pixel to climate, fire or human disturbance, and outputs of LSMs to address the research questions.
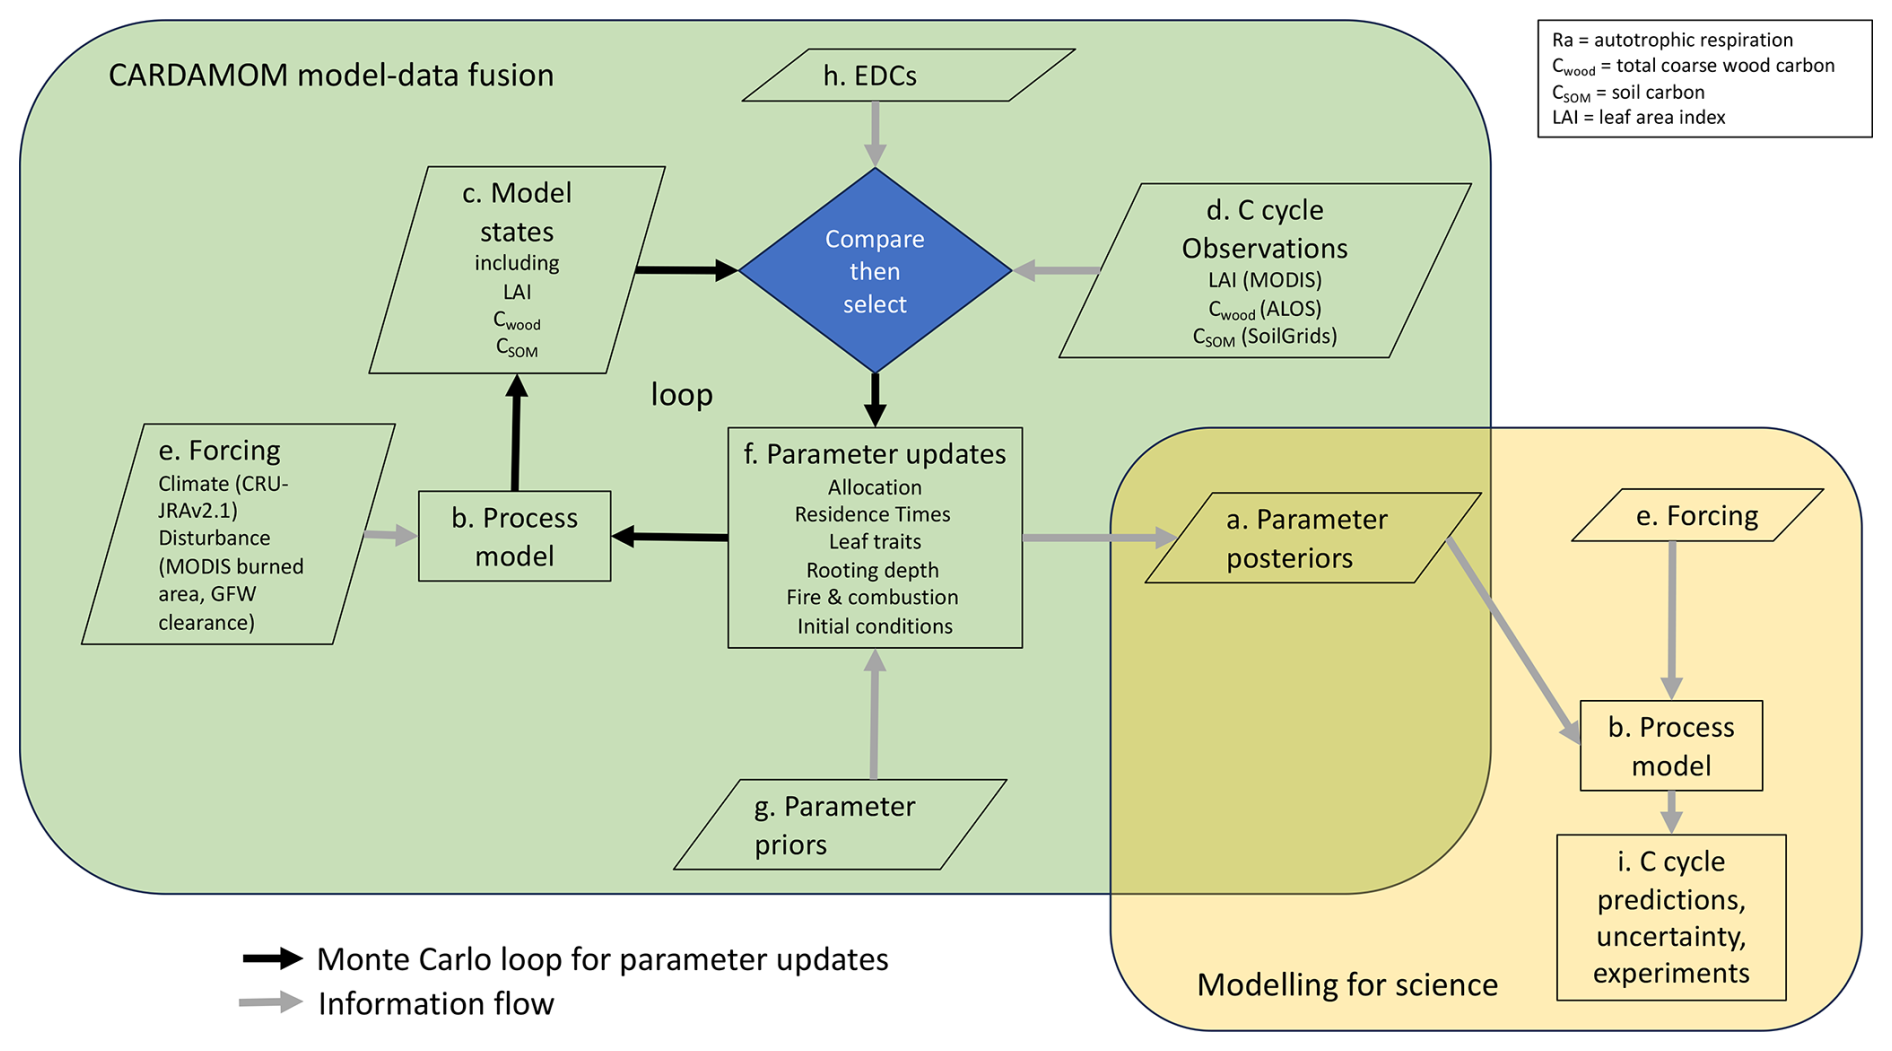
Figure 1Schematic of the Carbon Data Model Framework (CARDAMOM) methodology (green box) and modelling process (yellow box). CARDAMOM generates parameter estimates with uncertainty (a) for a process model (b). Independent estimates are made for each location (pixel) in the analysis. Parameter estimates are constrained to ensure that specific model state variable predictions (c) match independent observations for those variables at that location (d). Model predictions are made using local forcing data on climate and disturbance (e). The model has 32 parameters (f) that govern biological processes and fire impacts and includes seven initial conditions, with priors provided for each (g). A Monte Carlo process explores the parameter space defined by the priors, comparing model estimates (c) with observations (d) and using ecological and dynamical constraints (EDCs, h) to inform the selection (accept/reject) of parameter combinations. Once parameter posterior ensembles are generated for each pixel (a), a separate modelling process uses these parameters to generate ensemble C cycle estimates for each pixel (i) using the model (b) and specified forcing (e).
2.1 Environmental data
2.1.1 Biomass, LAI time series, and soil C data for calibration
The 25 m resolution L-band radar data from ALOS-PALSAR were used to estimate above-ground woody carbon (AGC) based on a calibration with field estimates (McNicol et al., 2018). We used a scalar linking above- and below-ground wood C stocks (Cwood= 1.42 × AGC; Ryan et al., 2011) to prepare four annual 0.5° maps of Cwood for the 4-year period 2007–2010 based on higher-resolution data from McNicol et al. (2018). Uncertainty in the biomass observations (2.5 tC ha−1) was estimated based on a local characterization of bias in retrieved biomass (McNicol et al., 2018).
MODIS EO (Myneni et al., 2021) product number MCD15A2H.061 provided 8 d composite information on LAI (2006–2017) aggregated to months. Prior information on soil carbon stocks to a depth of 1.0 m was taken from the SoilGrids2 database (250 m resolution), a machine-learning-based interpolation of field inventories (Hengl et al., 2017). All data were aggregated to the 0.5° model spatial grid resolution. LAI and soil carbon estimates were provided with corresponding uncertainty estimates from their respective products. The assimilation makes uses of LAI data available for all months of the analysis (n= 144), biomass data for 4 of the 12 years (n= 4), and soil C data as a single value applied to its initial status (n= 1).
2.1.2 Disturbance and burned-area observations for driving analyses
MODIS product number MCD64A1.061 provided monthly, 500×500 m burned-area data (Giglio et al., 2018). Tree cover loss is imposed as a fractional removal of biomass derived from the 30 m resolution Global Forest Watch data on disturbed areas (Hansen et al., 2013). Both datasets were aggregated to the model 0.5° spatial grid and monthly resolution. Land use change or vegetation transition was not included in the dynamics of the modelled ecosystem.
2.1.3 Woody-biomass chronosequences for model validation
Chronosequence data provided estimates of the accumulation rate of woody biomass for two areas in the SAW region. At N'hambita, Mozambique, we generated estimates of biomass from 28 plots each of 0.125 ha, with the age since abandonment ranging from 2 to 30 years (Williams et al., 2008). In Kilwa District, Tanzania, we used estimates from 55 plots each of 0.2 ha, with an age since abandonment of 2–47 years (McNicol et al., 2015).
2.1.4 Meteorological and soil physics data for model forcing and soil parameters
CARDAMOM meteorological drivers were extracted from the CRU-JRAv2.1 dataset, a 6-hourly 0.5° dataset of precipitation using the Japanese Reanalysis product (see Harris, 2019), and aggregated to monthly resolutions (Fig. S1 in the Supplement). Soil sand or clay fractions required to estimate soil hydraulic properties for input into the ecosystem model in CARDAMOM are extracted from the SoilGrids2 dataset.
2.2 Modelling the carbon cycle
2.2.1 Terrestrial ecosystem model
An intermediate-complexity ecosystem model, DALEC (Williams et al., 2005), simulated carbon stored in both live biomass (labile, foliar, fine roots, and total coarse wood, which includes stems, branches, and coarse roots) and dead organic matter (a litter pool and a soil organic matter (SOM) pool that includes coarse wood debris). See Fig. 3 for the model structure. The model simulates C flows (allocation and turnover or mortality) between pools and with the atmosphere (photosynthesis and respiration) and requires 25 parameters and seven initial conditions (Table 1). Processes are sensitive to climate drivers, and pools are sensitive to disturbance drivers (fire and other biomass removal). Photosynthetic uptake (GPP) is estimated by the Aggregated Canopy Model (ACM2) (Smallman and Williams, 2019) as a function of temperature, solar radiation, atmospheric CO2, precipitation, and LAI (LAI is simulated by DALEC). Water supply to the canopy is generated by a coupled water cycle model which estimates ecosystem water stock and accessibility as a function of precipitation, soil texture, and wood and root C stocks. Autotrophic respiration (Ra) is estimated as a fixed fraction of GPP. Net primary production (NPP = GPP − Ra) is allocated to live pools using fixed fractions. Heterotrophic respiration of litter and soil carbon (Rh) is estimated as a function of carbon stock, a turnover rate, and a temperature coefficient. Ecosystem respiration (Reco) is the sum of Ra and Rh. Canopy phenology is simulated by a model with pixel-specific fixed times each year for budburst and leaf senescence. Bud burst leads to allocation of C from the labile to foliar pools. Leaf senescence initiates turnover of C from the foliar pool. There is no explicit separation of tree and grass components in the model.
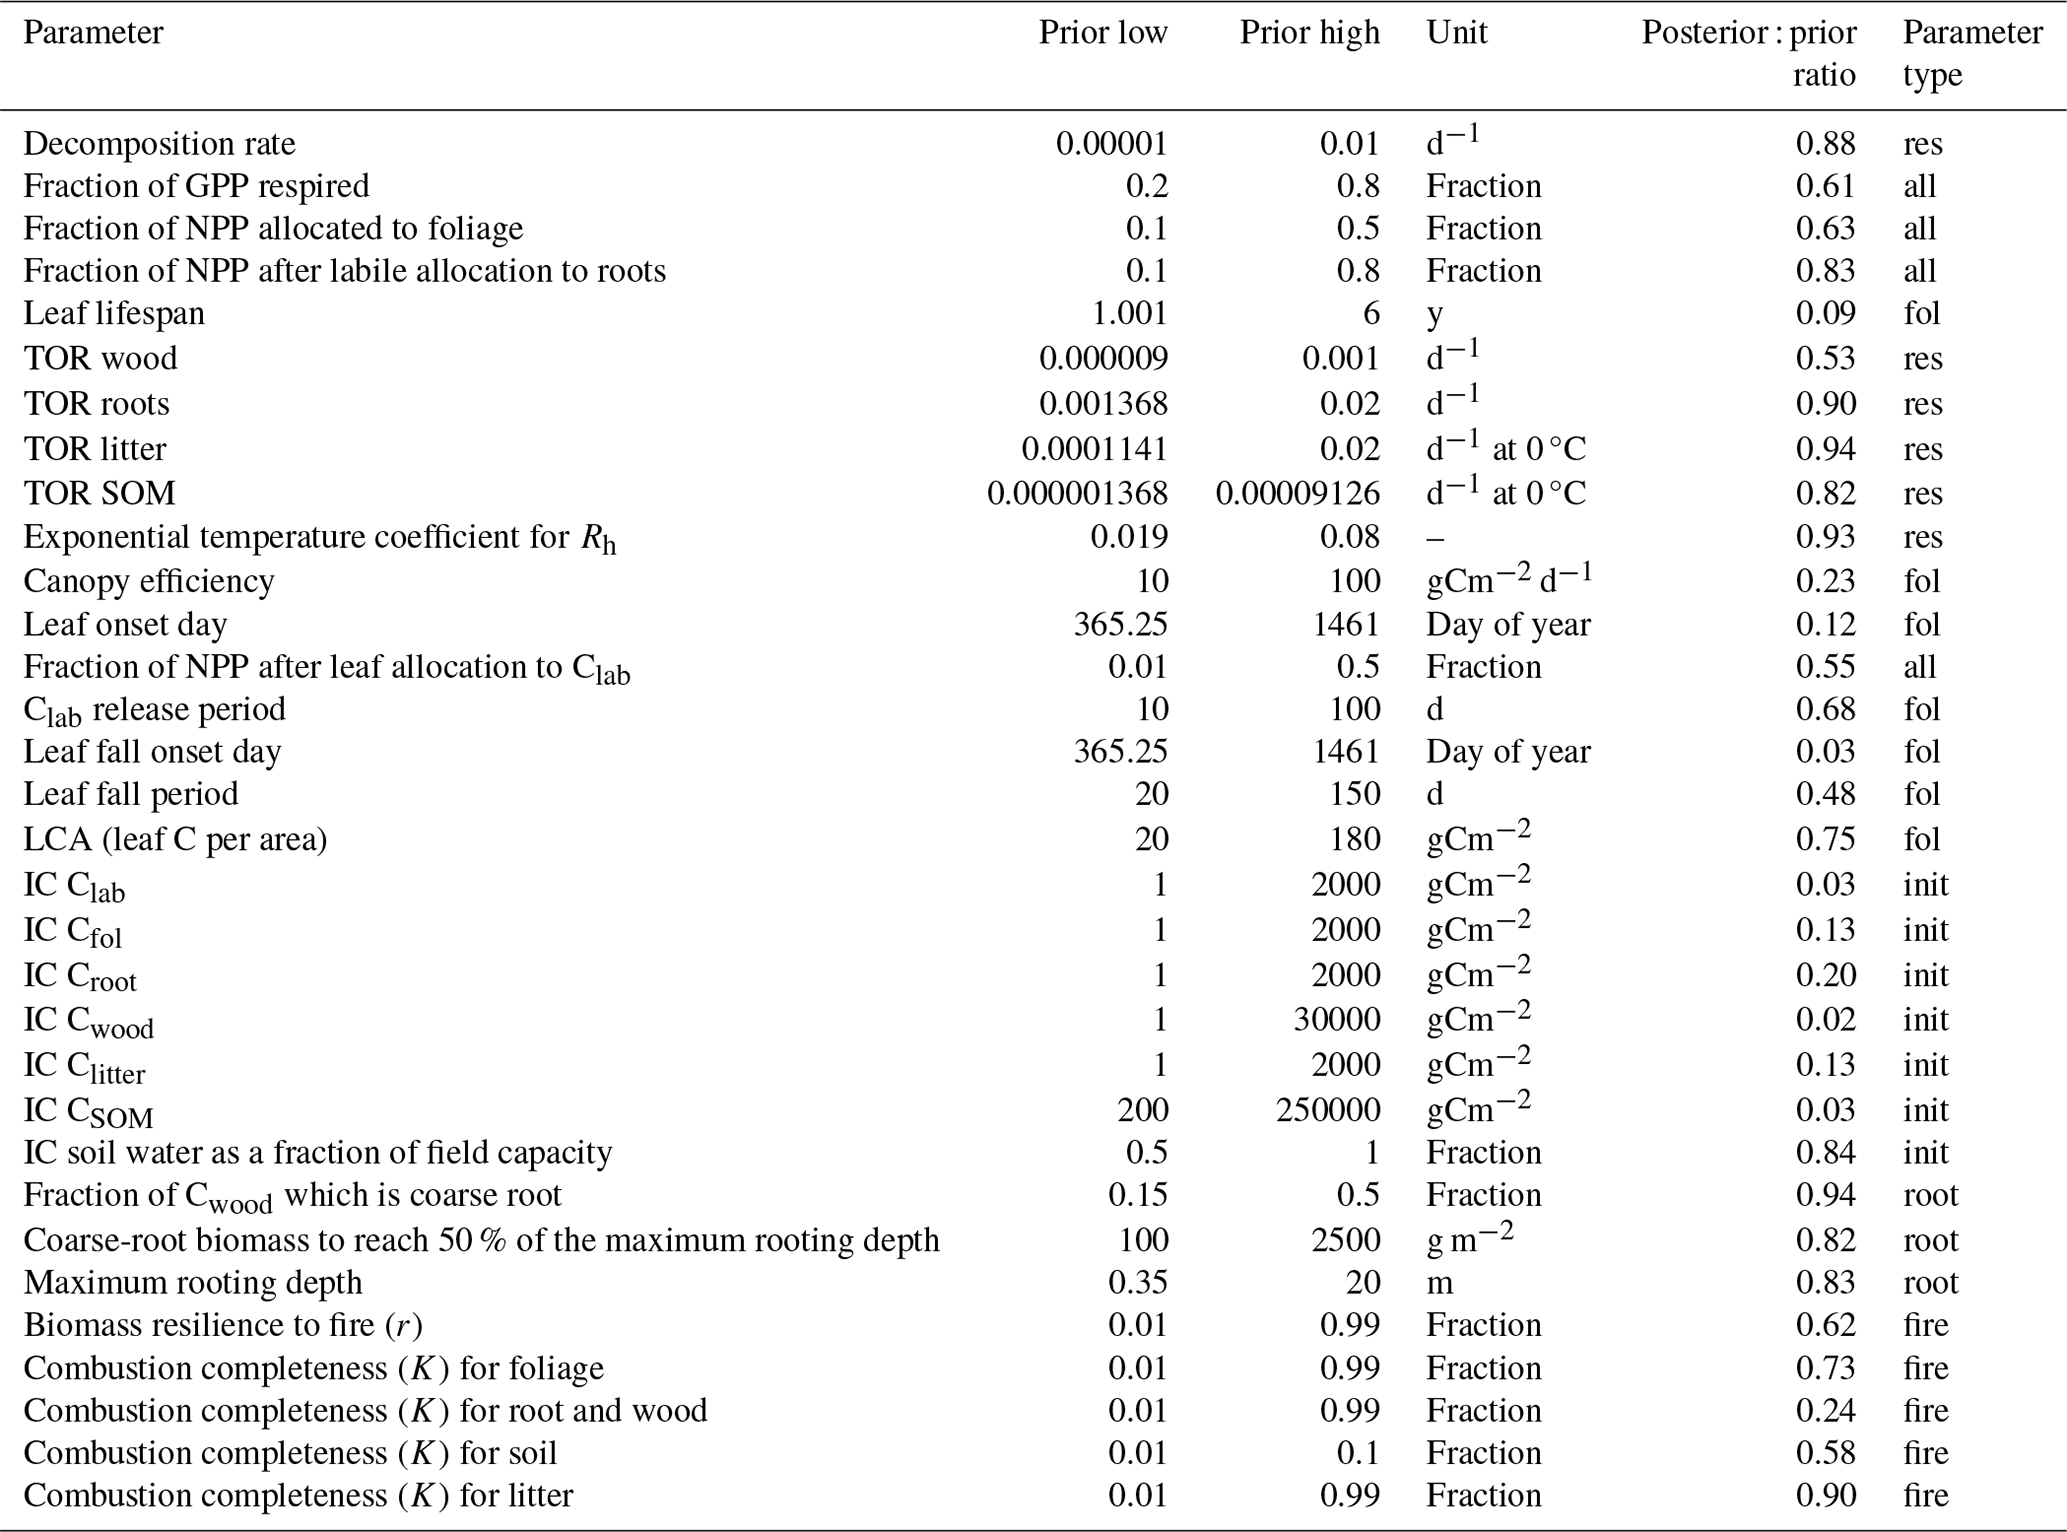
Table 1Parameters for the DALEC model, showing their prior and posterior values for a selected location, the units, and the ratio of the posterior 95 % uncertainty interval in the prior range. Parameters are categorized according to their role in C dynamics as follows: allocation (all), residence times (res), foliar traits (fol), rooting depth (root), fire and combustion (fire), and initial conditions (init). TOR is the turnover rate. IC is the initial condition. Clab is the labile C pool that supports leaf flushing.
Fire emissions are determined from the fraction of each pixel burned following Exbrayat et al. (2018).
For each model pixel, fire C emissions from pool x (Ex) are a function of the pixel burned-area fraction (B), a combustion completeness parameter for pool x (Kx), and the C stock size of pool x (Fig. 3). Kx is calibrated by CARDAMOM (Table 1). Combustion completeness is assumed to vary across the pools in each pixel, reflecting differences in the structure, location, and form of each pool. These parameters also vary spatially across the pixels. Of the non-combusted vegetation pools in the burned fraction, fire-driven mortality moves a fraction of C to the SOM pool:
For each pixel, the fire-driven mortality of tissue x (Mx,fire) is the non-combusted component of the fire-impacted pool x, which is further modified by a vegetation resilience parameter r also calibrated by CARDAMOM (Table 1). Resilience is assumed to be a holistic property of vegetation rather than a tissue-specific property, reflecting the vegetation's evolutionary history in response to fire.
The SOM pool is assumed to include coarse woody debris (CWD), and simulated fire emissions from the SOM pool therefore include the contribution from CWD. A fraction of the litter pool is converted into SOM because of fire. For biomass removals linked to land use, C losses are determined by the fraction of each pixel deforested as identified by Global Forest Watch (GFW) forcing data, with all foliage C transferred to litter pools and 80 % of above-ground wood biomass removed from the ecosystem (i.e. human extraction). Other pools are not deemed affected by this disturbance.
2.2.2 Calibration using model–data fusion
CARDAMOM is a model–data fusion framework (MDF) which combines local observations, their uncertainties, and ecological knowledge of the terrestrial C cycle to calibrate DALEC parameters probabilistically. CARDAMOM uses a Bayesian approach within an adaptive-proposal Markov chain Monte Carlo (AP-MCMC) algorithm to retrieve ensembles of local parameters for each 0.5° pixel, consistent with local observations, uncertainties, climate and disturbance forcing, and ecological theory embedded in DALEC's structure (Bloom et al., 2016).
All DALEC parameters have a specified prior range to guide calibration (Table 1). Specific prior estimates (i.e. mean + uncertainty) are provided based on literature studies for (i) the fraction of GPP allocated to Ra (Ra: GPP = 0.46±0.12; Waring et al., 1998; Collalti and Prentice, 2019) and (ii) the canopy photosynthetic efficiency (C; Kattge et al., 2011). CARDAMOM imposes ecological realism, or common sense, on parameter retrievals using ecological and dynamic constraints (EDCs). EDCs set the likelihood of a given parameter proposal to 0 if none of the conditions defined by the EDCs is met. The EDCs are intended to prevent three kinds of ecologically inconsistent parameter proposals: (1) unrealistic combinations, e.g. to ensure that turnover of fine roots is faster than for wood (in the absence of disturbance); (2) maintenance of emergent ecosystem ratios within observed ranges, e.g. the fine-root : foliar ratio; and (3) prevention of inappropriate carbon stock dynamics such as exponential carbon stock changes on short timescales outside disturbance or fire. Fire-related parameters (for combustion and mortality) are constrained by per-pixel observations of biomass and/or LAI change that coincide with burning in the forcing data. The resultant DALEC parameter uncertainty encompasses the combined uncertainties of the observational constraints, parameter priors, prior ranges, and plausible ecological parameter spaces as defined by the EDCs.
2.2.3 Validation against independent regional products
Once calibrated probabilistically at each pixel, DALEC is run using the same forcing data to generate local ensembles of C cycle estimates (Fig. 1). The first stage of validation tests the calibration process by evaluating the simulated LAI, Cwood, and soil C against the assimilated data for these variables to test for an unbiased estimate and spatial coherence (random error across pixels) for each variable. The second test stage evaluates the CARDAMOM analyses against other regional products. For NBE the reanalyses are compared against OCO2 v10 MIP estimates (Byrne et al., 2023); for GPP against the combined estimates from FluxCOM (Jung et al., 2020), Copernicus (Fuster et al., 2020), and FluxSatv2 (Joiner and Yoshida, 2021); and for fire emissions against the combined estimates of GFEDv4.1s (van der Werf et al., 2017) and GFAS (Kaiser et al., 2012). The third stage of validation uses two SAW locations with chronosequence data. The local 0.5° DALEC calibration from the analysis was used in an experiment, with 90 % of woody biomass removed in the model, and regrowth followed over decades using historical climate data and burned-area data.
2.3 Trendy model analysis
Eighteen process-based LSMs were applied in the Trendy project that supported the Global Carbon Budget 2022 (GCB2022) assessment (Sitch et al., 2015; Friedlingstein et al., 2022). LSMs are applied in a set of factorial simulations using forcing datasets of observed global CO2 content, observation-based merged climate forcing from CRUJRA, and historical land use and land cover change (LULCC) (Friedlingstein et al., 2022). For the Trendy experiments, LSMs are typically applied at 0.5° resolution over the period 1700 to 2021. A subset of LSMs includes prognostic fire models (Table S1 in the Supplement). We analysed the simulation results from the S3 simulation, where all three drivers vary, for the period 2006–2017.
To compare data-constrained estimates of the terrestrial C cycle for the region against the Trendy ensemble, we assess the agreement between domain-aggregated estimates for key C stocks and fluxes and their seasonality. We also provide an indication of the spatio-temporal consistency of each LSM with our CARDAMOM benchmark based on the fraction of pixels (in space and time) for which each LSM estimate falls within the CARDAMOM 95 % uncertainty intervals (UIs). The outputs of the analysis are also evaluated against the mean of the Trendy ensemble for the region and individual models using spatial statistics and temporal analysis of seasonal dynamics of net exchanges (NBP) and their component processes (Ra, Rh, and EFire).
2.4 Spatial carbon cycle variability and determinants
The simulated C dynamics reflect the responses of the ecosystem model within a multi-variate driver and data space. In an individual 0.5° pixel, the model structure and retrieved parameter values determine the temporal C cycle response to the environmental drivers. However, across the model domain, parameters are retrieved independently for each pixel, generating an emergent map of functional variation over SAW. This approach is an alternative modelling paradigm to the approach used by LSMs for which a single set of model parameters is used to represent a particular plant functional type. The biogeographic gradients in the C stocks and fluxes across the SAW determined by our analysis therefore represent the combination of effects and interactions between the spatial variability in environmental drivers and the spatial variability in ecological functions, as characterized by the retrieved variations in model parameters.
To understand and explore the spatial sensitivity of the C cycle and ecological processes to environmental factors, we used a causal analysis approach similar to previous empirical studies that have synthesized multiple observation streams in order to understand biogeographic gradients and their relationship with environmental drivers (e.g. Lehmann et al., 2014). Like these observation-based studies, our retrieved biogeographic gradients are not determined by a prior spatial model. However, the model–data fusion approach provides some key benefits, notably (i) synthesizing multiple observation streams (and uncertainties) at the pixel level into an ecologically coherent and internally consistent representation of C stocks and fluxes (Smallman et al., 2022) and (ii) explicitly partitioning the C dynamics along particular process pathways such as production, allocation, and mortality, thus providing more detailed insights into the functional variation across the SAW region.
We applied Wright's path approach (Runge et al., 2015; Wright, 1921, 1934) to estimate linear direct causal effects that link the temporally averaged, ensemble-median C diagnostics to environmental drivers across SAW. Wright's method only applies in the linear case. Here, the direct causal effect of a variable Xi on a variable Xj is essentially quantified as the slope of the linear regression of Xi on Xj, where any source of confoundment is removed prior to the regression. Environmental drivers that we considered in the causal analysis include observed meteorological variables (e.g. precipitation, abbreviated as PPTN) and modelled quantities (e.g. GPP), which were selected to resolve their causal effects on C fluxes and stocks and to avoid confoundment. To account for the influences of climate on fire activity and productivity limitations on fuel availability, we also included burned area, which was causally linked to fire-related fluxes driving mortality, combustion-related emissions, and post-combustion transfers between pools. To compare linear direct causal effects across variables, variables were standardized prior to the analysis. The total causal effect of Xi on Xj was then estimated as the sum of the products of all possible causal pathways from Xi to Xj (Wright, 1934; Runge et al., 2015). Causal analysis was focused on NBP and the dynamics of the live pools in order to align with data availability (e.g. LAI and biomass observations) and thus rich information for calibration and inference of causation using links to disturbance and climate data. Note that, when we refer to causal effects in this work, these are standardized linear direct causal effects. For more details, see the Supplement.
3.1 Calibration and validation
The calibration process constrained model parameters to differing degrees (Table 1). The strongest constraints were for initial conditions for C pools; foliar parameters related to leaf lifespan, leaf flush, and leaf fall; combustion completeness for wood; and canopy efficiency (productive capacity). The weakest constraints were for residence times for litter, roots, and SOM; rooting depth parameters; and most fire or combustion parameters. The variation in constraints is consistent with the proximity of the parameters to the assimilated data, and thus parameters connected to LAI and Cwood are constrained best.
The calibrated model outputs explained much of the observed spatio-temporal variation in MODIS LAI (r= 0.93) and ALOS biomass (r= 0.99) and the spatial variation in soil C (r= 0.97) (Fig. S2). The normalized root mean square errors were for LAI = 0.17, biomass = 0.06, and soil C = 0.04. The calibration bias was 6 % or less in all the cases (regression slopes LAI = 0.94, biomass = 1.01, and soil C = 1.01).
For NBE, OCO2 inversions suggest a near-neutral exchange with uncertainty spanning zero (Fig. S3), which is consistent with CARDAMOM estimates: 0.0 (95 % UI −1.67/1.66) MgC ha−1 yr−1. CARDAMOM's median regional GPP estimate was 15.95 (UI 13.02–18.68) Mg C ha−1 yr−1, within the range of estimates from the EO-oriented GPP products when scaled to the SAW region (Fig. S3). CARDAMOM's median fire emissions were largely within the range of fire emission products (Fig. S3), though its uncertainties were much higher than the products' range.
At the locations in Mozambique and Tanzania, recovery of Cwood in the model was consistent with the data (Fig. 2). The uncertainty in the model accumulation rate (95 % uncertainty intervals) was similar in magnitude to the spread of biomass across the field inventories. Differences in burned area in the model simulations, rather than climate, explain the higher steady-state Cwood stock at the Tanzanian site.
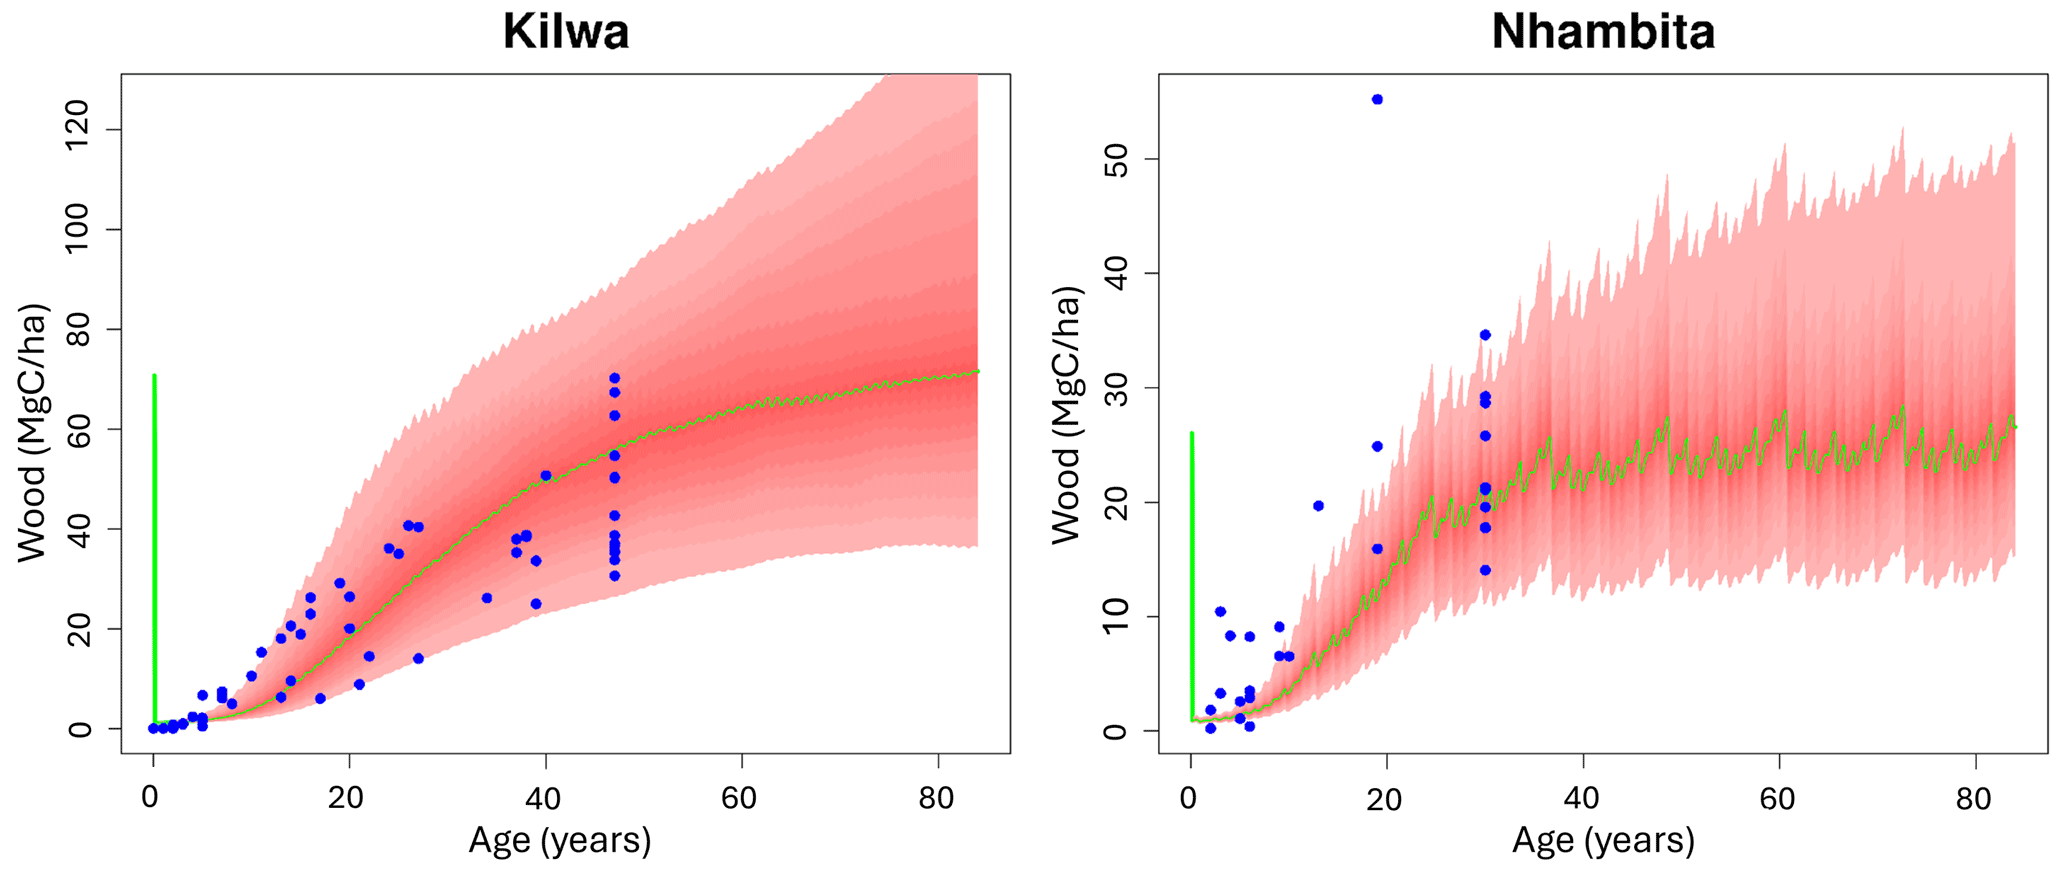
Figure 2Independent test of wood biomass regrowth post disturbance at two locations in southern African woodlands (left panel Tanzania and right panel Mozambique; note the different scales). For both locations the DALEC model was calibrated at a quasi steady state using local EO data over the period 2006–2017 and local data on meteorology and burned area; 90 % of the wood steady-state biomass was then removed (initial vertical green line at age = 0), and the modelled woody biomass accumulation (the green line shows the median and the shaded interval shows the 95 % UI) is plotted against multiple independent chronosequence estimates based on data from fallow fields (blue dot).
3.2 The carbon cycle of the SAW region
CARDAMOM estimated that 49 % of the regional GPP is respired (Fig. 3), and the remaining NPP is allocated between foliage (median fraction = 0.18), a labile pool (0.13), fine roots (0.26), and Cwood (0.37). Each ensemble member allocation sums to 1, but the ensemble median fractions sum to < 1 (0.94) at the regional scale because posterior distributions of allocation in the analysis are not normal.
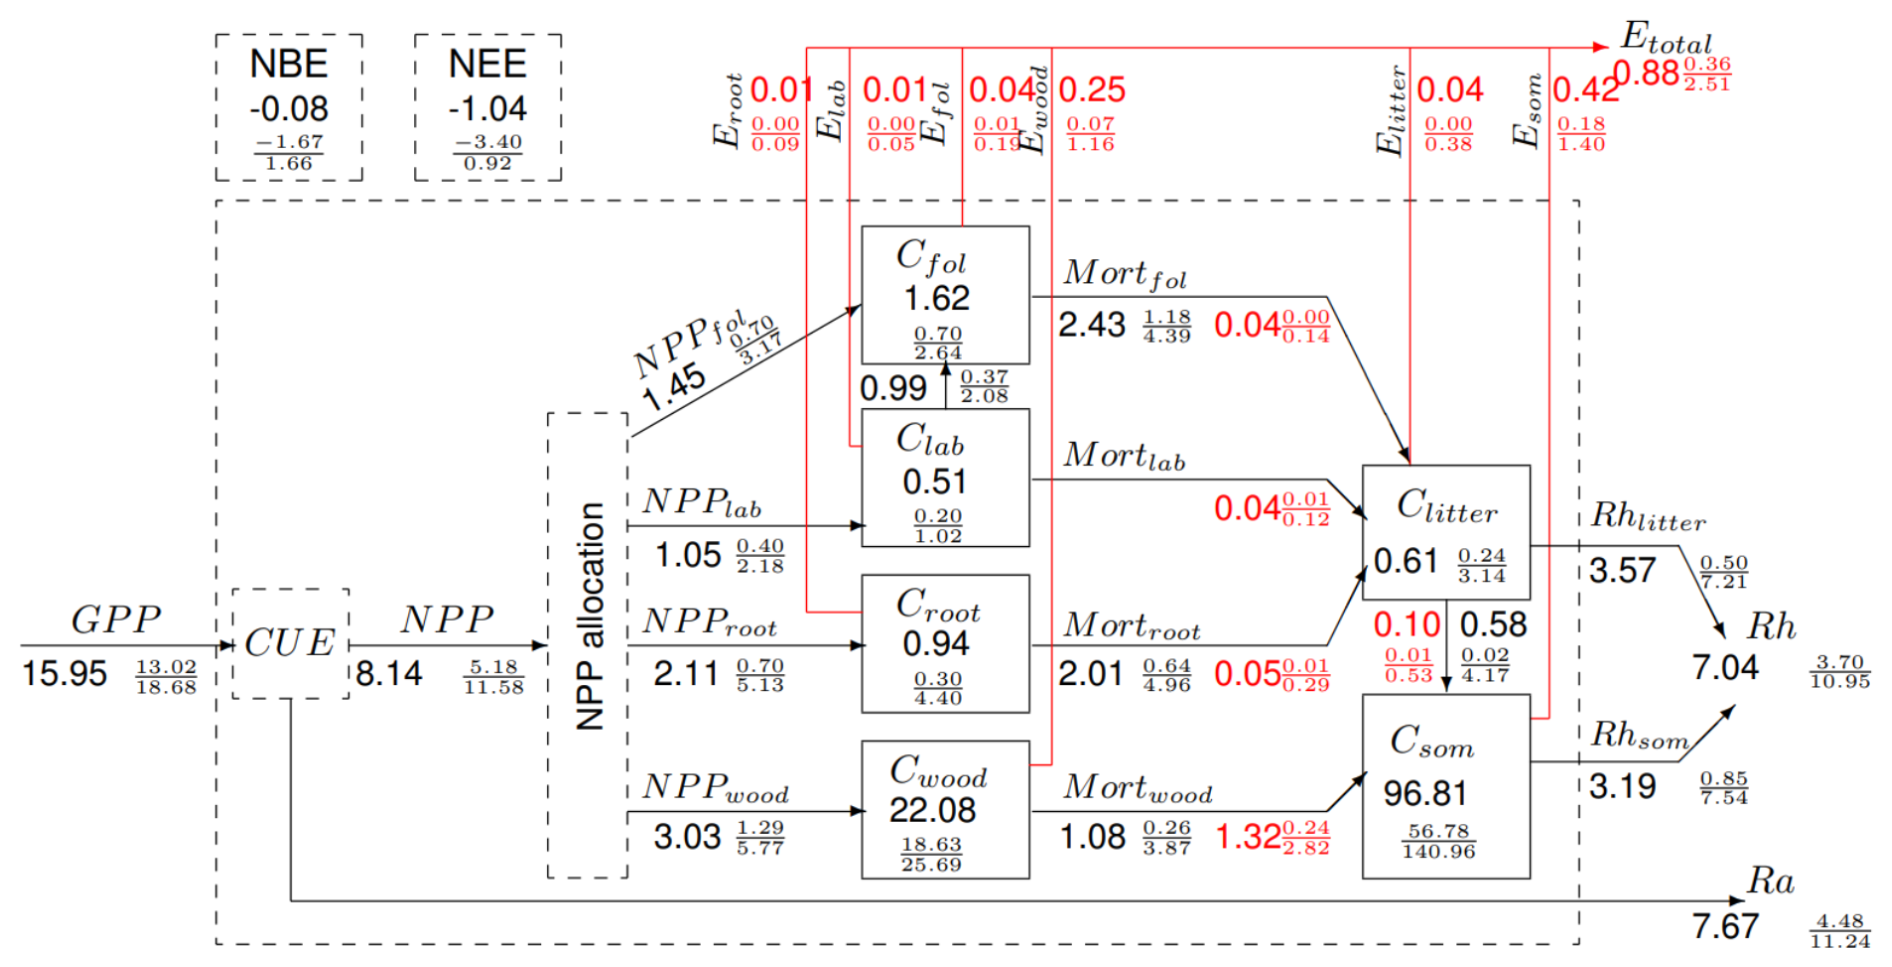
Figure 3The C budget of the SAW region based on the CARDAMOM analysis at 0.5×0.5° with a monthly time step between 2006 and 2017. The numbers show estimates of fluxes (alongside arrows) and stocks (in boxes) using the mean value of all the pixel medians in the SAW region (MgC ha−1: stocks; MgC ha−1 yr−1: fluxes). The 95 % uncertainty intervals are shown in a fractional form with the 2.5th and 97.5th percentiles as the numerator and denominator. Black fluxes are biogenic, including net primary production (NPP), mortality (Mort), autotrophic respiration (Ra), and heterotrophic respiration (Rh). NEE = GPP. NBE = NEE + Etotal. Red disturbance fluxes are dominated by fire-driven emissions (E) and fire-driven components of plant tissue mortality or loss of litter to SOM (indicated in the red figures). Note that not all pools are in a steady state and that the SOM pool includes coarse woody debris. The analysis produced non-normal distributions, so the budget closure in the summary is not exact, which explains why NEE ≠ Rh+Ra − GPP. Individual ensembles have full budget closure.
The MRTs of the pools are sub-annual for foliage, labile, fine roots, and litter. The MRT for wood is 8 years (95 % UI 4–20 years), and for CSOM it is 28 years (UI 11–90 years) (Fig. S4). Disturbance fluxes are 100-fold larger from fire rather than clearance (Fig. S1). On average, 23 % of the region's area is burned annually; this is mostly set by people. Burning losses from Cwood are transferred to the atmosphere (∼ 16 % of the total disturbance flux) or to dead organic matter (∼ 84 %). Losses from the Cwood pool are largest through fire disturbance (∼ 59 % of the total mortality flux), and the remaining non-fire losses encapsulate pests, diseases, herbivory, plant aging, and degradation not detected by estimates of tree cover loss (Fig. 3), but uncertainties are large. For other pools, both live and dead, non-disturbance flux magnitudes exceed disturbance fluxes. The regional C balance is approximately neutral (mean NBP −0.08 (−1.67/1.66) Mg C ha−1 yr−1). However, in the absence of fire disturbance (i.e. NEE), the region is a potential sink of 1.04 Mg C ha−1 yr−1.
NBP is a function of changes to total plant biomass (sum of all live C pools, Cveg) and to dead organic matter (litter plus soil organic matter C, CDOM), which are dominated by the two largest pools, Cwood and CSOM. The analysis of changes to Cveg (ΔCveg) is constrained by the assimilation of multiple biomass maps 2007–2010 (Fig. 4), with the largest losses in the east (Tanzania and northern Mozambique) and through western Zambia and southern Angola. There are areas of positive ΔCveg in the southern DRC, northern Angola, eastern Zambia, western Zimbabwe, and southern Mozambique. The distribution of ΔCveg is unimodal and evenly distributed between regions of increasing and decreasing Cveg, resulting in a regionally neutral stock change for ΔCveg of 0.0 () Mg C ha−1 yr−1. The analysis of ΔCDOM is not directly constrained by observations. ΔCDOM is also unimodal, with a relatively even split between areas accumulating and losing C from the soil. Uncertainties in ΔCDOM are approximately 4 times higher than in ΔCveg (note the different scales in the panels of Fig. 4).
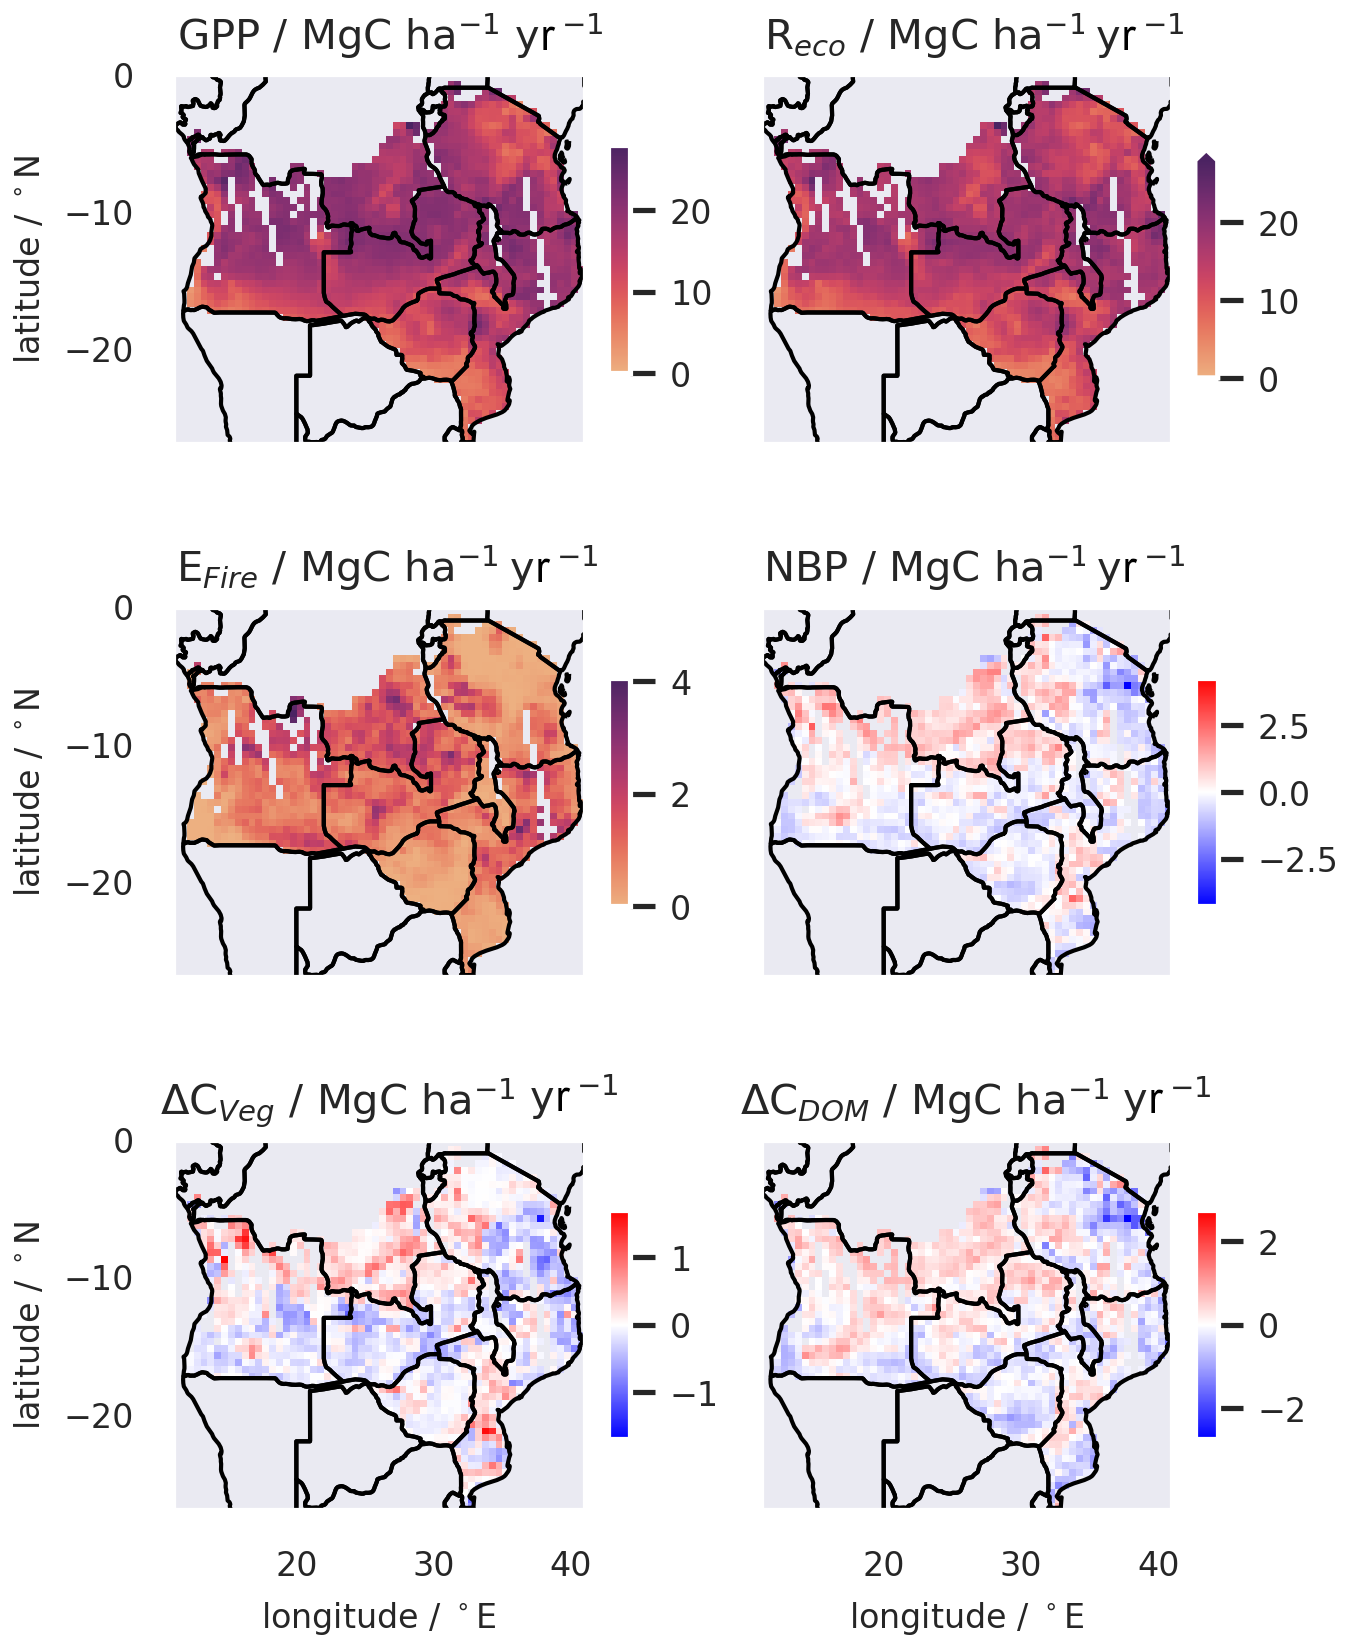
Figure 4Spatial mapping of median gross fluxes, NBP, and temporally averaged rates of changes in the live pools (Cveg= Cwood+ Croots+ Cfoliage+ Clabile) and dead organic matter (CDOM= CSOM+ Clitter) C stocks across the SAW region at 0.5° resolution for 2006–2017, as determined by diagnostic analysis. The gaps in the maps relate to areas without biomass observations due to gaps in the ALOS-PALSAR data. GPP is gross primary production. Reco is ecosystem respiration. EFire is fire emissions. NBP = GPP − Reco − EFire − biomass removals by management (the latter are a relatively small flux compared to the others).
3.3 Environmental controls on carbon fluxes (RQ1)
The median GPP distribution across the SAW region (Fig. 4) is skewed unimodal, with a peak at 20 MgC ha−1 yr−1 and a tail of lower GPP (Fig. S5). Reco is similarly skewed and strongly spatially correlated (r= 0.95) with GPP, with a peak in its frequency distribution at 17 MgC ha−1 yr−1. EFire is non-normal and dominated by low emissions (< 1 MgC ha−1 yr−1) but with a tail of higher emissions up to 4 MgC ha−1 yr−1. The distribution of pixel-level median NBP peaks just below the source–sink boundary and spans −2–+3 MgC ha−1 yr−1. There is a clear spatial structure in the fluxes, with higher GPP, Reco, fire emissions, and NBP concentrated in certain areas (Fig. 4) and correlated with forcings (Fig. S6).
The causal networks constructed to assess the controls on the spatial distribution of C fluxes identify the importance of precipitation, fire, and their interactions (Figs. 5 and S7–S9). Precipitation is the dominant factor determining the rates of C cycling across the SAW, driving both the productivity and mortality fluxes, with compensating effects on the overall C balance. Precipitation dominates the distribution of GPP, with a standardized effect of 0.94 () (95 % uncertainty interval). Radiation is positively linked to GPP (0.20; 0.16/0.24), while vapour pressure deficit (VPD) (−0.13; ) and temperature are negatively linked (). Precipitation is the dominant environmental driver of NPP (total standardized effect: 0.86; ), mediated by an environmental effect on carbon use efficiency (CUE). Precipitation is also associated with the largest total standardized causal effects on the mortality fluxes driven by fire (0.34; ) and on non-fire mortality (0.55; ). The total causal effect of precipitation on gross fire mortality fluxes includes contributions of causal pathways linked to the standing Cveg stocks as well as influences on the fire-driven turnover of C (Figs. S7–S9). Fire is a key source of C losses in SAW. Burned area increases along the precipitation gradient (0.43; ) and with increasing VPD (0.34; ). Burned area drives the fire mortality flux from the Cveg pool (0.31; ), with a significant mediating effect from the increasing resistance of C stocks to fire in fire-prone areas described by spatial patterns in parameters (see Fig. S7).
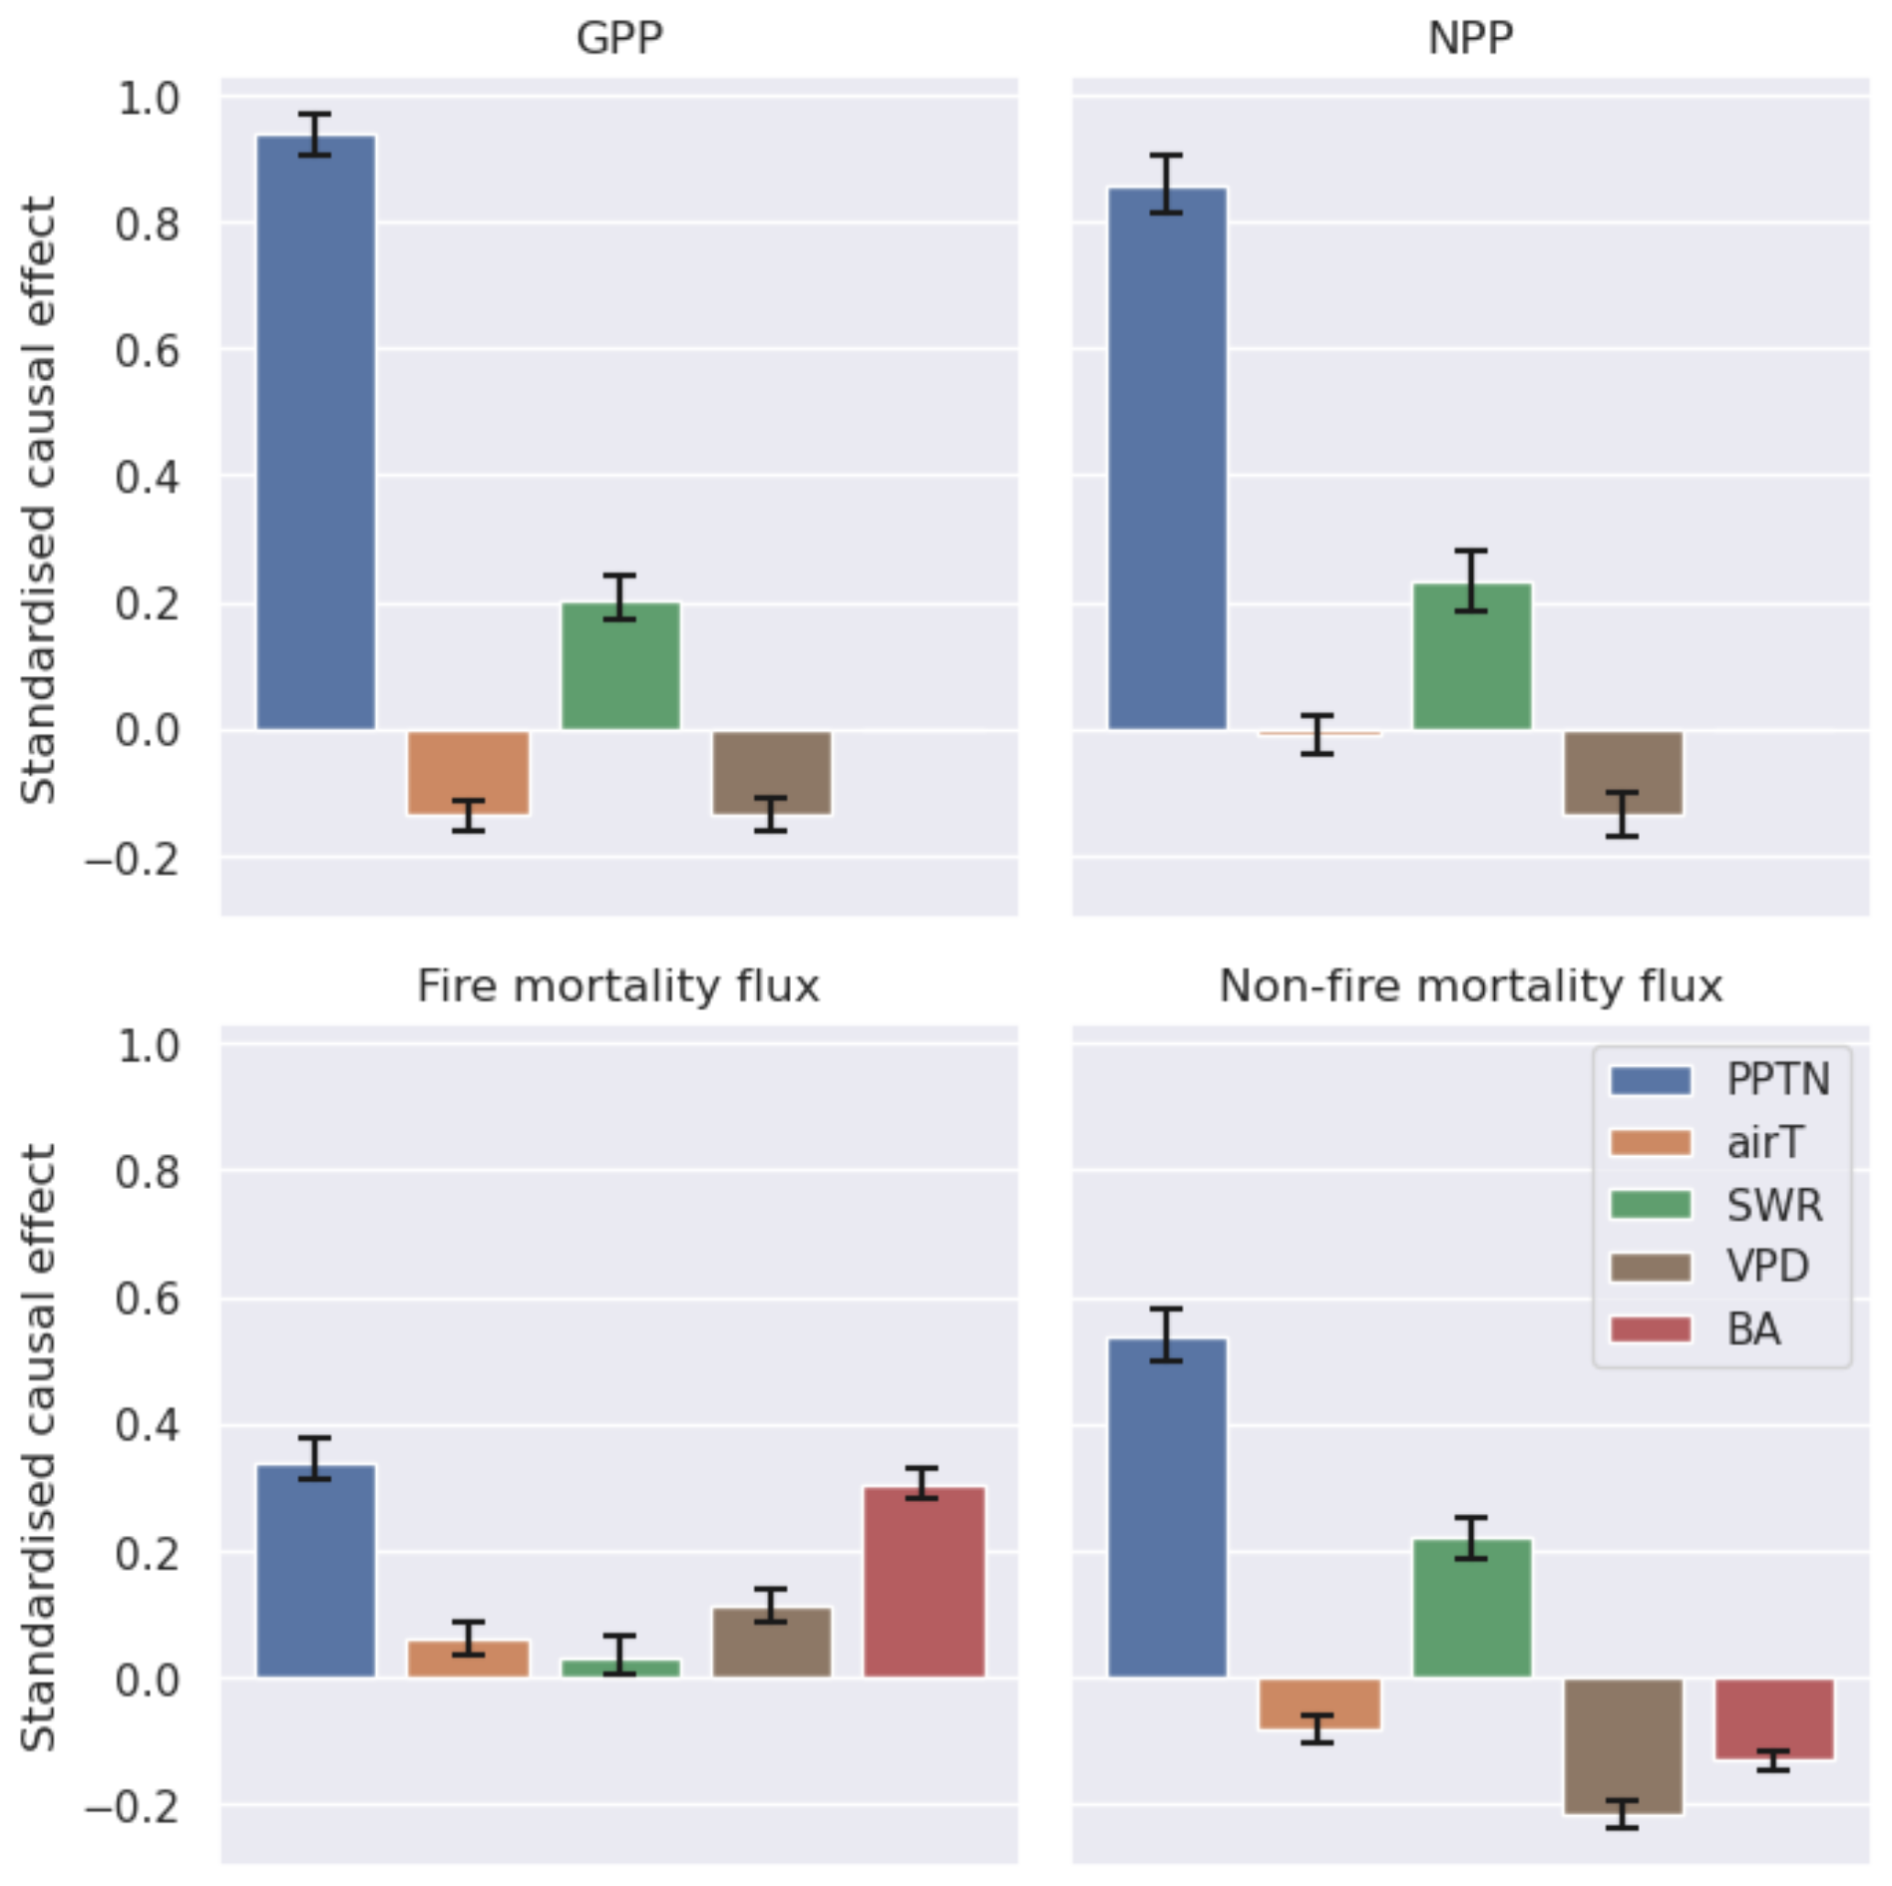
Figure 5A summary of the causal effect analysis of spatial patterns in the pixel-median estimates of key fluxes of C across the SAW region (with error bars for 95 % bootstrapped UIs). Fluxes include GPP, allocation to biomass (NPP), and mortality caused by fire and non-fire factors. For each flux the standardized causal effects of different climate drivers (mean annual precipitation PPTN, air temperature airT, short-wave radiation SWR, and vapour pressure deficit VPD) and fire (via burned area BA) are compared. Note that the causal analysis did not include a causal link between BA, GPP, and NPP.
3.4 Environmental controls on stocks and MRT (RQ2)
C stocks in SAW are primarily in dead organic matter pools (CDOM) with a mean of 98 MgC ha−1 (95 % uncertainty interval, 57–142), 99 % of which is CSOM to a depth of 1.0 m. The mean Cveg is 26 MgC ha−1 (22–30), with 87 % in Cwood. The mean ratio CDOM : Cveg is 4.0 (95 % UI 2.1–12.5). Distributions of C stocks in live and dead pools are unimodal (Fig. S10). The spatial patterns of C stocks are similar to the distributions of biogenic fluxes (Fig. 6).
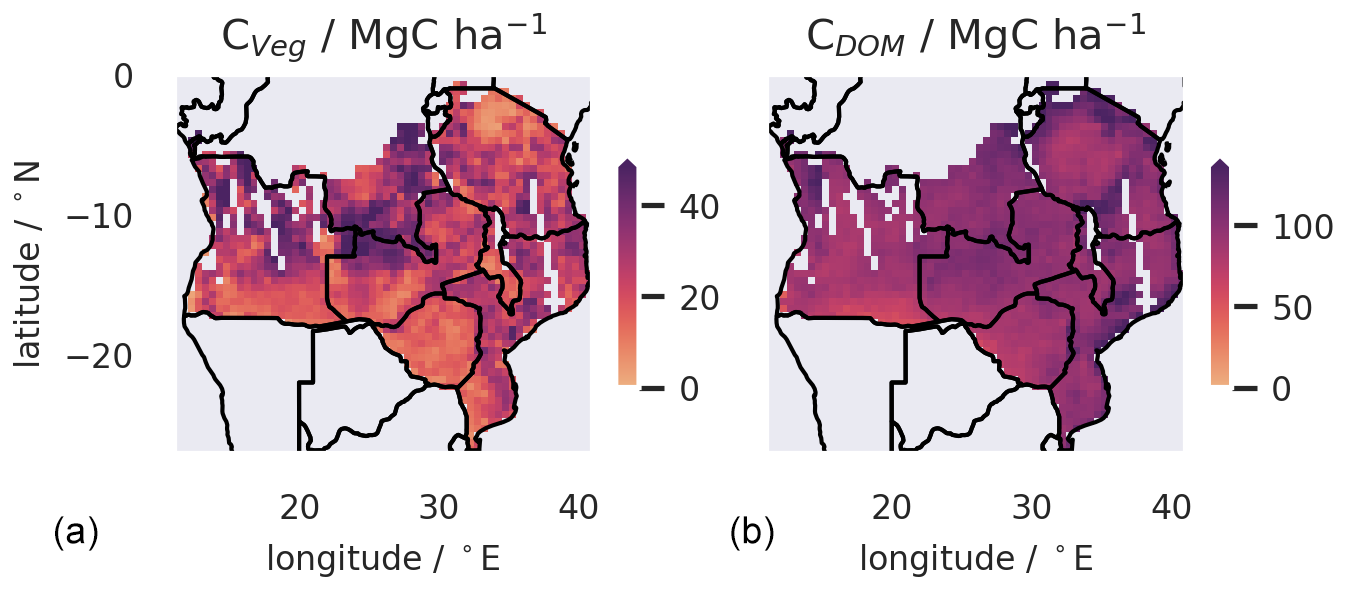
Figure 6Spatial mapping of live C stocks, which are dominated by Cwood (a) and dead organic C (b) across the SAW region at 0.5° resolution, for 2006–2017 as determined by diagnostic analysis. Gaps in the maps relate to areas without biomass mapping due to gaps in the ALOS-PALSAR data.
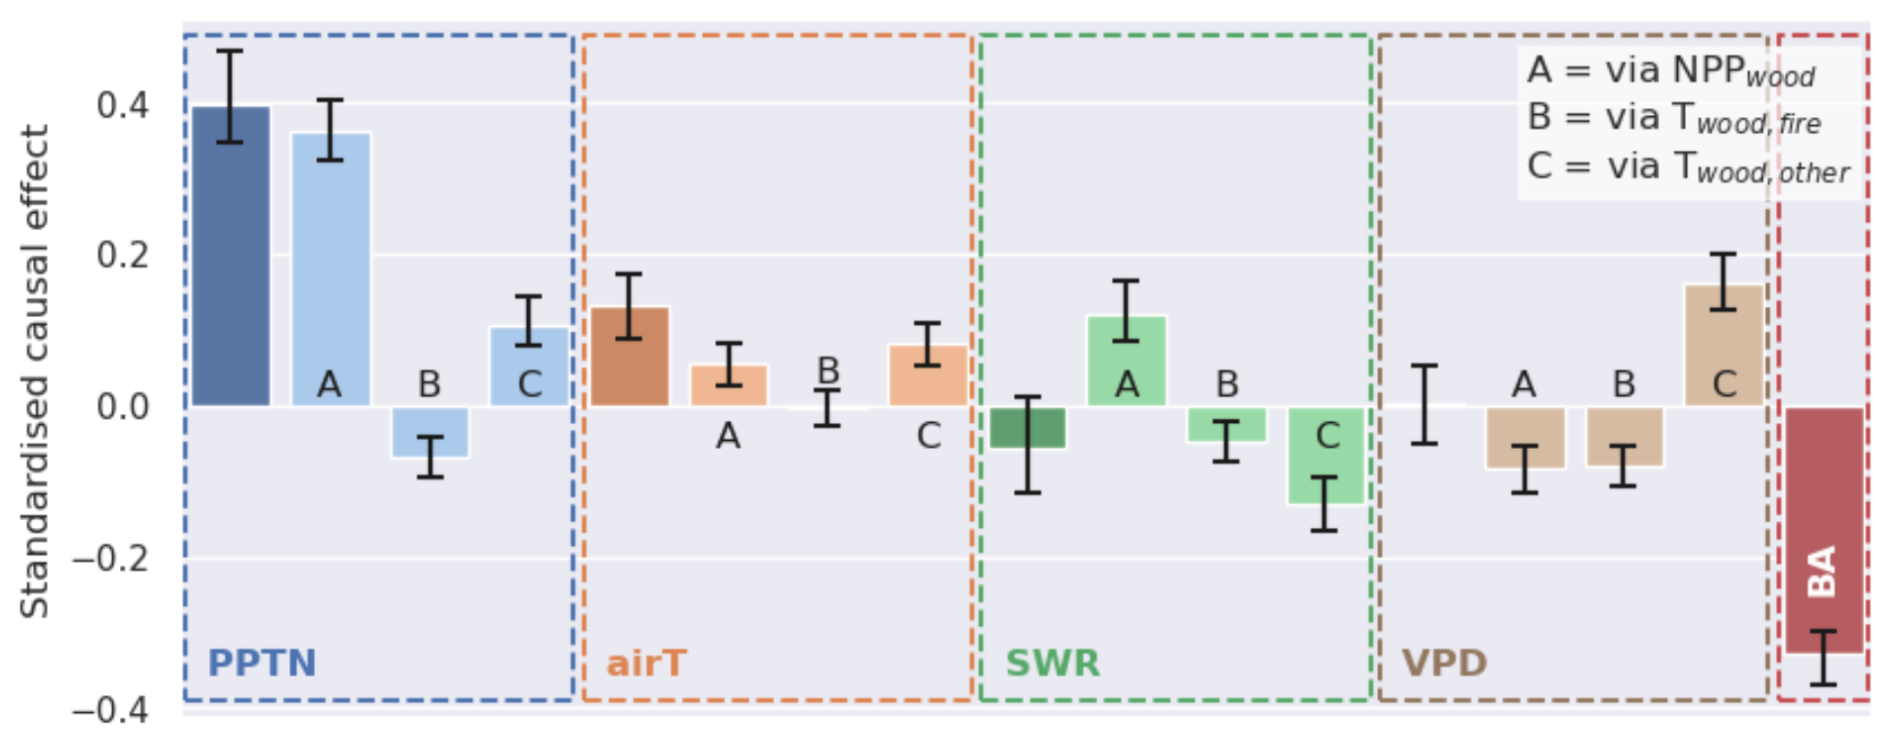
Figure 7Summary of the causal effects from climate factors on spatial patterns in the pixel-median estimates of total coarse-wood C (Cwood) across the SAW region (with error bars for 95 % bootstrapped UIs). For PPTN, airT, SWR, and VPD, the total standardized causal effect is shown in the leftmost columns of the four panels. The three columns (A–C) show how the total effect for each factor is the outcome of three aggregated causal pathways: climate effects operating through (A) changes to the net primary production of wood, (B) fire-driven turnover, and (C) non-fire turnover. The total direct effect of fire (through BA) is also shown for reference.
The spatial distribution of C stocks depends on C assimilated via NPP and the rate of C turnover (T) (Figs. 7 and S7). The spatial distribution of Cwood is positively impacted by NPPwood (standardized effect 0.65; ) and negatively impacted by turnover rates (Twood,fire: −0.60; ; Twood,other: −0.54; ). Causal analysis (Fig. S7) across the spatial dataset indicates that precipitation (PPTN) impacts Cwood along three mediating pathways: (a) positively via primary production (total effect of PPTN mediated by NPPwood= 0.36; ), (b) negatively via fire mortality rates (total effect of PPTN mediated by ; ), and (c) positively via non-fire mortality rates (total effect of PPTN mediated by 0.11; ). The analysis revealed clear emergent spatial variations in key functional characteristics across the SAW region (Fig. 8) controlling each of these pathways, i.e. the fraction of NPP allocated to wood (a), the fire resistance of ecosystems determined as biomass resilience to fire × (1 – combustion completeness for wood) (b) (Table 1), and the non-fire median turnover rate of Cwood (c).
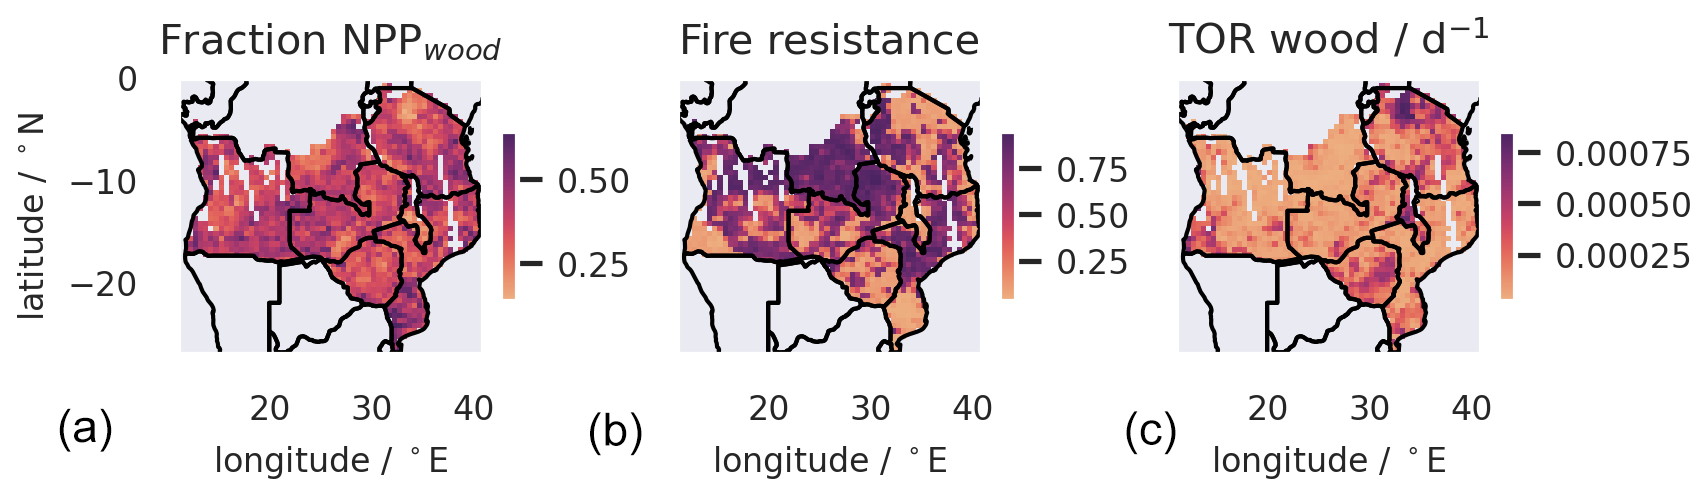
Figure 8Spatial variations in three key ecosystem functional characteristics across southern African woodlands retrieved from the analysis. These three characteristics connect to the three pathways (Fig. S7) that are hypothesized to link spatial variation in environmental drivers (Fig. S1) to Cwood (Fig. 6). Panel (a) operates via variation in woody productivity, which is a function of the fraction of the total NPP allocated to wood. Panel (b) operates through Cwood turnover driven by fire, which is linked to spatial variation in ecosystem fire resistance characteristics: r (1−Kwood). Panel (c) is linked to variation in the non-fire turnover rate (TORwood), which has inferred spatial variations.
The productivity pathway (path a) is the dominant control on the distribution of Cwood across the SAW (total standardized effect of PPTN on Cwood= 0.40; ). The impacts on Cwood of turnover driven by fire and non-fire processes are comparable, but they are opposing and spatially variable (Fig. 8). In higher-precipitation areas the link between relative fire mortality and burned area is weakened by a strong compensating effect of higher fire resistance of vegetation (Fig. S7). The total standardized impact of fire (burned area) on Cwood is negative (−0.33; ). The impacts of other meteorological drivers (VPD, short-wave radiation, and air temperature) on Cwood are relatively weaker. Overall, fire emissions represent a major loss from the Cwood pool (Fig. 3), with burned area driving fire-related turnover rates (total causal effect: 0.55; ) and hence MRT. We conclude that representation of SAW by a single PFT approach misses important spatial functional variations in residence times and fire resistance.
The turnover of the fine-root and foliage C pools is dominated by the phenological turnover associated with seasonal growth and senescence directly tied to the seasonality of rainfall (Figs. S8–S9). This turnover is linked to the temporally averaged meteorological drivers, although with relatively weak standardized effects. Generally, the turnover rates (1MRT) of both pools are negatively impacted by the annual PPTN and VPD, while annual temperature and short-wave radiation (SWR) have a positive effect, although there is no clear dominant term. There is a correlation between PPTN and SWR (Pearson's ). A higher MRT for roots and foliage in wetter areas suggests extended phenology both above and below the ground and identifies a further important functional variation within SAW that a single PFT approach misses.
3.5 Comparison of observation-constrained analysis of C cycling with land surface model estimates for the SAW region (RQ3)
The seasonal cycles of GPP from CARDAMOM have similar amplitudes and phases to the Trendy ensemble mean, but individual Trendy models had larger variations in amplitude and phase often outside the CARDAMOM uncertainty interval (Fig. S11). For GPP, 13 of the 18 Trendy models had regional mean annual estimates within the 95 % UI of CARDAMOM estimates. The median annual GPP of the Trendy ensemble (15.8 MgC ha−1 yr−1) was 2 % less than the median CARDAMOM estimate (16.0 MgC ha−1 yr−1) and comparable to the mean estimate for GPP of the independent observation-based products for the region (15.7 MgC ha−1 yr−1) (Fig. S3). CARDAMOM NBP amplitude was larger than all but three of the Trendy models, some of which had virtually no amplitude. These differences were linked to each major component of emissions (Fig. S12).
The spatial overlap of GPP between the Trendy ensemble and CARDAMOM 95 % UI was not complete, ranging from 10 % to 48 % (Table S2; Figs. S13–S14) and typically lower during each wet season. For net biome production, the mean estimates of all Trendy models were close to neutral over the region, consistent with the CARDAMOM NBP. However, there were significant differences in amplitude and spatial distribution (Table S1, Fig. S14). The consistency of the spatio-temporal estimates of NBP for each LSM with the CARDAMOM 95 % UI ranged from 29 % to 68 % (Table S2, Figs. S15–S16).
Estimates of Cveg varied markedly between the Trendy LSMs (15–66 MgC ha−1) for the SAW region. Only 3 out of 18 Trendy models had regional mean Cveg estimates within the 95 % UI of the CARDAMOM–DALEC estimates (Table S1). The spatial distribution in Cveg stocks varied markedly between LSMs (Figs. S17–S18), with the spatio-temporal consistency between individual LSMs and the CARDAMOM 95 % UI varying from 5 % to 35 % (Table S2), suggesting significant spatial biases. Considering the net change in the live vegetation pools, ΔCveg, for which the CARDAMOM estimate is more closely constrained by the assimilated data than NBP, the spatially coherent discord between the Trendy LSMs and the CARDAMOM benchmark becomes more apparent (Figs. 9 and S18).
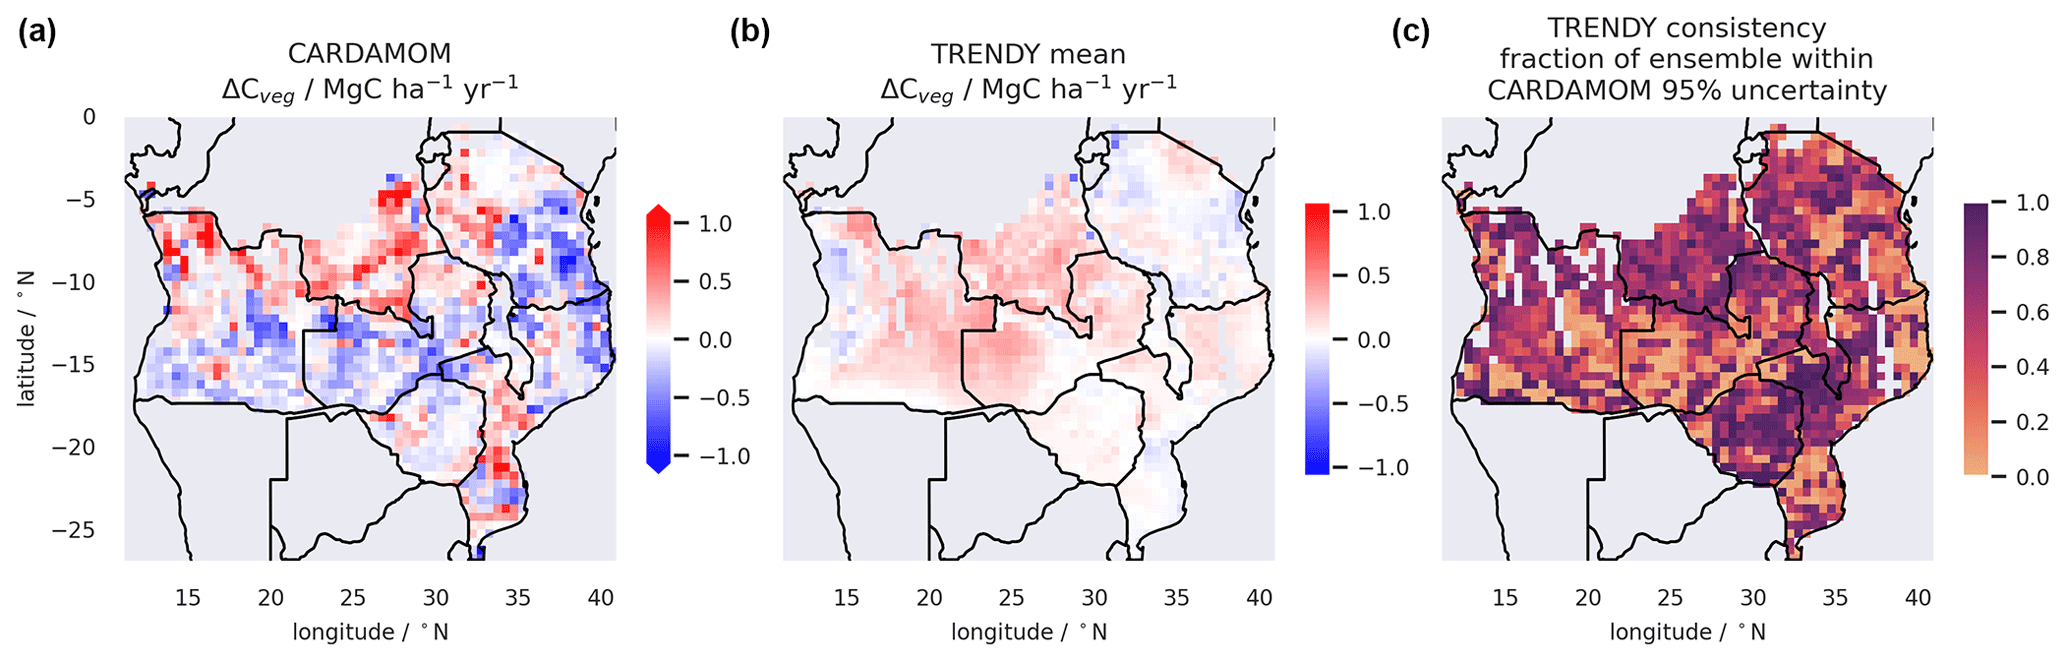
Figure 9A comparison the data-constrained estimate of annual mean change in vegetation C stocks (Cveg) from the CARDAMOM analysis (panel a) with the mean estimate from the Trendy LSM ensemble (panel b). Panel (c) shows the consistency of Trendy data by mapping the fraction of the 18 ensemble members with estimates within the 95 % uncertainty interval of the CARDAMOM analysis. Data cover the SAW region and the period 2006–2017.
4.1 Identification of carbon sinks and sources in the SAW region
The analysis reveals a balance between sources and sinks in this region from 2006 to 2017 (Fig. 4) that is dependent on the spatial gradients in productivity driven by precipitation and mortality, an important component of which is driven by fire (Figs. 6 and 7). Changes in Cveg across the SAW have previously been linked to varying patterns of land use and wood fuel harvesting and recovery of some woodlands with reduced human pressures in other areas (McNicol et al., 2018). The explicit land use flux modelled by CARDAMOM is dependent on changes in tree cover detected by satellites, which indicated a small areal extent of land use change (LUC) forcing. Comparatively small disturbances typically associated with degradation processes, e.g. wood fuel harvesting, while potentially widespread (Bailis et al., 2015), are challenging to detect (Milodowski et al., 2017) and are maybe missed by the satellite products used in this analysis. Within the CARDAMOM diagnostic analysis, C fluxes driven either by fire not detected in burned-area data or non-fire degradation not detected by GFW are implicitly represented within the non-fire mortality flux, which contributes strongly to the spatial distribution of ΔCveg. Development and assimilation of longer time series of wood biomass with low bias, alongside robust time series estimates of degradation, extent, and intensity, would help to refine the understanding of how anthropogenic activities impact the strength of the terrestrial C sink.
4.2 What are the environmental controls on exchanges of C throughout the region?
The analysis supported the hypothesis that precipitation has the dominant control on GPP across the region (causal effect PPTN − GPP: 0.94; 95 % UI: ). This strong spatial relationship was the result of (i) directly modelled links between soil moisture and stomatal conductance and (ii) correlations between LAI observational data (assimilated by CARDAMOM) and patterns of precipitation. Wetter areas were thus associated with moister soils and higher LAI, both stimulating higher GPP, and were indicative of water availability being the principal limiting factor on GPP, which is consistent with (limited) eddy covariance data across sub-Saharan Africa (Merbold et al., 2009).
We expected that productivity would positively impact burned area (BA) through fuel load. Our results were supportive to an extent (direct standardized causal effect of NPP on BA: 0.30; ) (Fig. S7), but burned area was also positively related to VPD (direct causal effect of VPD on BA: 0.38; ), indicating that climate-dependent fuel moisture limitation may be as important as fuel load. Our results are consistent with assessments that identified the SAW region straddling the transition between a fire regime limited by fuel build-up and one limited by fuel moisture (Archibald et al., 2009a; Alvarado et al., 2020; Archibald et al., 2009b).
We hypothesized that NBP across SAW would be negatively impacted by the burned-area fraction. The analysis supported this hypothesis: burned area was a strong driver of C losses. Without the contribution of fire emissions, the analysis indicated that the approximately C-neutral SAW would have likely been a C sink. However, burned area did not drive the spatial distribution of either ΔCveg or NBP due to concurrent spatial gradients in NPP driven by precipitation (Fig. 5) and mediating impacts across the SAW environmental gradient arising from functional variations, including changes linked to wood lifespan and effective fire resistance (Fig. 8). As a result, despite constituting a major driver of C losses, burned-area fraction is actually positively correlated in space with NBP across the region (Pearson's r= 0.28). The emergent picture from the diagnostic analysis is that the carbon balance of the SAW region is determined by the interplay between precipitation-driven gradients of productivity and losses driven by a combination of fire emissions and Rh, and these fluxes are mediated by spatial variations in plant function linked to climate gradients. The finding of function–climate gradients here matches plot-level analysis along precipitation gradients in western Africa (Zhang-Zheng et al., 2024).
Fire-driven fluxes (e.g. within Mortwood) are uncertain in the analysis (Fig. 3) because the posterior parameter estimates for fire-related parameters (r,K) are relatively poorly constrained by observations (Table 1). For instance, Kwood is constrained only by local temporal interactions of observed burned area and biomass dynamics. r, a vegetation characteristic, is constrained by observations of burned area, biomass, and LAI. Thus, equifinality between r and Kwood is reduced due to their differential constraint from independent observations. The next step in enhancing the analysis would be to assimilate further independent observations of fire impacts (e.g. radiative power). The coarse spatial resolution of our analysis (0.5°) is unable to resolve the fine-scale heterogeneities in the landscape. Grass litter is critical fuel for fires in the region (Archibald et al., 2009b), but our analysis does not separate tree and grass foliage and litter pools. Our diagnostics indicated that the fire resistance of vegetation increased with burned area but secondarily also in wetter areas. These emergent responses could be explained by direct plant-level adaptation to fire (e.g. thicker bark) or community-level feedbacks where fire is excluded due to increasing tree canopy cover excluding grass (Ryan and Williams, 2011; Ramo et al., 2021).
4.3 Controls on wood and soil C stocks
We hypothesized that C stocks in soils and biomass would be spatially correlated and their distribution determined by precipitation. Our analysis was supportive, with both stocks positively and most strongly driven by precipitation (total causal effect: 0.40; ), despite the mediating impact of precipitation on burned area. Our analysis suggests that larger Cwood stocks in wetter regions are sustained by a combination of higher NPP and slower relative rates of turnover. Our hypothesis that Cwood MRT is inversely related to burned area is supported by the causal analysis (Fig. S7). Fire-related mortality from Cwood to CSOM likely exceeds fire-related emissions from Cwood into the atmosphere and natural rates of Cwood mortality fluxes into CSOM (Fig. 3). Without fire disturbance, the MRT of Cwood could more than double from 8 to 20 years, and this would imply a similar proportional increase in steady-state wood biomass from a mean of 22 to 55 MgC ha−1, a credible estimate based on fire exclusion experiments in SAW (Ryan and Williams, 2011). Our conclusions regarding the dynamics of CSOM are necessarily weaker. We lack robust constraint on CSOM dynamics, either through repeat mappings or through chronosequence studies. Chronosequence data from part of the SAW suggest little change in soil C stocks after decades of post-disturbance recovery.
We found support for our hypothesis that spatial variations in ecosystem functional characteristics influence the distribution of biomass across SAW. The analysis revealed emergent regional gradients in ecosystem functional characteristics related to woody allocation, wood lifespan, and fire resilience (Fig. 8). Analysis showed strong causal effects from climate and disturbance drivers on patterns of functional variation (Fig. S7). Thus, wetter areas of the SAW tend to have live vegetation stocks with reduced vulnerability to fire, longer wood lifespans in the absence of fire, and a lower proportional allocation of NPP to wood. There are also important functional variations in the dynamics of leaf and fine-root pools linked to climate and strong phenological patterns across SAW (Ryan et al., 2017), with impacts on production patterns.
4.4 Evaluation of land surface models
Our analysis supported the hypothesis that GPP and Reco fluxes from the Trendy models agree more closely with CARDAMOM analyses than do Trendy models' estimates of C stocks (Table S1). Nevertheless, while the domain aggregate estimates for GPP were comparable between the Trendy mean and CARDAMOM analyses, this obscures substantial variation among models (Tables S1 and S2), which showed strong spatially structured variability inconsistent with CARDAMOM estimates (Figs. S15 and S18) (Teckentrup et al., 2021). The apparent discrepancies highlight the challenges faced by the current generation of LSMs when estimating the sensitivity of GPP to soil moisture variation in water-limited environments (Paschalis et al., 2020; MacBean et al., 2021). There was greater disagreement between the Trendy ensemble and the CARDAMOM estimate regarding Cveg stock (Tables S1 and S2), and there were marked differences in their estimates of the spatial distribution of Cveg (Fig. S13). On average, the Trendy Cveg across the SAW was larger than CARDAMOM estimates (Table S1), in line with Trendy results over Australian savanna compared with satellite estimates (Teckentrup et al., 2021), although this bias was not consistent across the ensemble of LSMs.
Both the Trendy models and CARDAMOM analyses suggest that the region was close to a neutral NBP. However, the Trendy models had lower seasonal variation in NBP than CARDAMOM. These differences were more related to inconsistencies in C emissions from respiration and fire rather than foliar phenology and GPP (Fig. S12). The low amplitude of NBP in the Trendy models results from a strong temporal coupling in GPP and Reco. CARDAMOM analyses have large seasonal amplitudes arising from seasonal divergence due to litter production occurring at the end of the wet season, leading to dry-season decomposition coupled with dry season fires. The DALEC model lacks a soil moisture control on Rh, whereas most of the Trendy models do include this relation. This structural difference may explain temporal differences in Rh (Fig. S12), particularly as the assimilated data have no direct constraint on Rh.
4.5 Conclusions
Our analysis reveals that the carbon dynamics of SAW are determined by the interplay between precipitation and fire, mediated by substantial spatial variations in plant functional characteristics. Spatial analyses from model–data fusion provided insights into SAW C dynamic variation in response to the regional gradients in climate and disturbance. Precipitation is the dominant control on both GPP and C residence times. GPP variations are controlled directly by precipitation through soil moisture limitation on primary production and indirectly through functional variations in phenology (LAI). Precipitation gradients impact C residence times indirectly through correlated variations in related functional characteristics. For instance, precipitation is linked to patterns of effective fire resistance in vegetation and variations in the lifespan of Cwood when fire is absent (Fig. 8). Consequently, the spatial distribution of C stocks across SAW is significantly determined by the precipitation gradient through multiple interacting pathways.
The full C cycle analysis of the region is the current state of the art due to its direct incorporation of repeat biomass maps that are locally calibrated and validated. The analysis suggests that Cwood mortality driven by fire can be attributed to the major loss term from Cwood, albeit with large uncertainties (Fig. 3). The fire-driven fall in the Cwood residence time across the precipitation gradient linked to rising burned area and fire mortality (Fig. 5) acts to damp positive feedbacks between increasing GPP and Cwood. If fire effects are removed, our analysis suggests a ∼ 3-fold increase in Cwood (Bond et al., 2005). Much larger uncertainties remain in the analysis of soil C due to sparsity of data compared to above-ground biomass.
This analysis has mapped variation in functional characteristics, challenging the use of a single PFT for this region. CARDAMOM suggests substantial variations in functional characteristics across the SAW, e.g. for wood, foliar and fine-root lifespans and allocation, and fire resistance. These variations likely explain why LSM estimates are inconsistent with the data-constrained estimates from this study. Individual LSMs deviated inconsistently from CARDAMOM estimates, with individual components of the C cycle varying in space and between models. Cveg stocks and fire emissions were the source of the largest discrepancy, alongside the temporal distribution of fluxes.
The C budgets here can also support more robust and observationally consistent national reporting in the region for the Paris Agreement of the UNFCCC. The detailed resolution of the outputs, with locally valid functional characteristics, can enhance national CO2 emission factors for fire disturbance, for instance. Working closely with national agencies, approaches such as those demonstrated could deliver Tier-3 estimates of national C budgets to support countries worldwide.
The data and model code that support the findings of this study are available in a resource at https://doi.org/10.7488/ds/7776 (Williams et al., 2024).
The supplement related to this article is available online at https://doi.org/10.5194/bg-22-1597-2025-supplement.
MW, DTM, and TLS conceived the analysis with support from CMRy, KGD, and SS. DTM and TLS developed the model code and undertook the analysis with support from CMRo, GGH, IMM, MOS, and AV. DTM, TLS, and MW produced the visualizations. MW supervised the research and wrote the manuscript with input from all the authors. MW, CMRy, KGD, and SS acquired funding for the work.
The contact author has declared that none of the authors has any competing interests.
Publisher’s note: Copernicus Publications remains neutral with regard to jurisdictional claims made in the text, published maps, institutional affiliations, or any other geographical representation in this paper. While Copernicus Publications makes every effort to include appropriate place names, the final responsibility lies with the authors.
We thank Ben Poulter and Anthony Walker for their comments on the manuscript. We recognize the UKRI grants to SEOSAW (no. NE/P008755/1), SECO (no. NE/T01279X/1), and NCEO. Carla M. Roesch and Gabi C. Hegerl also thank the European Union's Horizon 2020 research and innovation programme under Marie Sklodowska-Curie grant agreement no. 860100 (iMIRACLI). We acknowledge and thank the broader CARDAMOM developer team. We thank the data providers from the Trendy LSM teams, the MODIS teams, and the SoilGrids community. Casey M. Ryan and Iain M. McNicol would like to thank JAXA for support through EO-RA3 grant no. ER3A2N035.
This research was funded in whole, or in part, by NERC (grant nos. NE/P008755/1 and NE/T01279X/1) and UK NCEO.
This paper was edited by Xi Yang and reviewed by two anonymous referees.
Alvarado, S. T., Andela, N., Silva, T. S., and Archibald, S.: Thresholds of fire response to moisture and fuel load differ between tropical savannas and grasslands across continents, Global Ecol. Biogeogr., 29, 331–344, 2020.
Andela, N., Morton, D. C., Giglio, L., Chen, Y., van der Werf, G. R., Kasibhatla, P. S., DeFries, R. S., Collatz, G. J., Hantson, S., Kloster, S., Bachelet, D., Forrest, M., Lasslop, G., Li, F., Mangeon, S., Melton, J. R., Yue, C., and Randerson, J. T.: A human-driven decline in global burned area, Science, 356, 1356–1362, https://doi.org/10.1126/science.aal4108, 2017.
Archibald, S. A., Kirton, A., van der Merwe, M. R., Scholes, R. J., Williams, C. A., and Hanan, N.: Drivers of inter-annual variability in Net Ecosystem Exchange in a semi-arid savanna ecosystem, South Africa, Biogeosciences, 6, 251–266, https://doi.org/10.5194/bg-6-251-2009, 2009a.
Archibald, S., Roy, D. P., Van Wilgen, B. W., and Scholes, R. J.: What limits fire? An examination of drivers of burnt area in Southern Africa, Glob. Change Biol., 15, 613–630, https://doi.org/10.1111/j.1365-2486.2008.01754.x, 2009b.
Archibald, S., Lehmann, C. E. R., Gómez-Dans, J. L., and Bradstock, R. A.: Defining pyromes and global syndromes of fire regimes, P. Natl. Acad. Sci. USA, 110, 6442–6447, https://doi.org/10.1073/pnas.1211466110, 2013.
Bailis, R., Drigo, R., Ghilardi, A., and Masera, O.: The carbon footprint of traditional woodfuels, Nat. Clim. Change, 5, 266–272, 2015.
Bloom, A. A. and Williams, M.: Constraining ecosystem carbon dynamics in a data-limited world: integrating ecological ”common sense” in a model–data fusion framework, Biogeosciences, 12, 1299–1315, https://doi.org/10.5194/bg-12-1299-2015, 2015.
Bloom, A. B., Exbrayat, J.-F., Velde, I. R. v. d., Feng, L., and Williams, M.: The decadal state of the terrestrial carbon cycle: global retrievals of terrestrial carbon allocation, pools and residence times, P. Natl. Acad. Sci. USA, 113, 1285–1290, 2016.
Bond, W. J., Woodward, F. I., and Midgley, G. F.: The global distribution of ecosystems in a world without fire, New Phytol., 165, 525–538, https://doi.org/10.1111/j.1469-8137.2004.01252.x, 2005.
Byrne, B., Baker, D. F., Basu, S., Bertolacci, M., Bowman, K. W., Carroll, D., Chatterjee, A., Chevallier, F., Ciais, P., Cressie, N., Crisp, D., Crowell, S., Deng, F., Deng, Z., Deutscher, N. M., Dubey, M. K., Feng, S., García, O. E., Griffith, D. W. T., Herkommer, B., Hu, L., Jacobson, A. R., Janardanan, R., Jeong, S., Johnson, M. S., Jones, D. B. A., Kivi, R., Liu, J., Liu, Z., Maksyutov, S., Miller, J. B., Miller, S. M., Morino, I., Notholt, J., Oda, T., O'Dell, C. W., Oh, Y.-S., Ohyama, H., Patra, P. K., Peiro, H., Petri, C., Philip, S., Pollard, D. F., Poulter, B., Remaud, M., Schuh, A., Sha, M. K., Shiomi, K., Strong, K., Sweeney, C., Té, Y., Tian, H., Velazco, V. A., Vrekoussis, M., Warneke, T., Worden, J. R., Wunch, D., Yao, Y., Yun, J., Zammit-Mangion, A., and Zeng, N.: National CO2 budgets (2015–2020) inferred from atmospheric CO2 observations in support of the global stocktake, Earth Syst. Sci. Data, 15, 963–1004, https://doi.org/10.5194/essd-15-963-2023, 2023.
Campbell, B. M.: The Miombo in transition : woodlands and welfare in Africa, Center for International Forestry Research, Bogor, Indonesia, ISBN 979-8764-07-2, 1996.
Chidumayo, E.: Changes in miombo woodland structure under different land tenure and use systems in central Zambia, J. Biogeogr., 29, 1619–1626, 2002.
Chidumayo, E.: Forest degradation and recovery in a miombo woodland landscape in Zambia: 22 years of observations on permanent sample plots, Forest Ecol. Manag., 291, 154–161, 2013.
Chidumayo, E. N.: Development of Brachystegia-Julbernardia woodland after clear-felling in central Zambia: Evidence for high resilience, Appl. Veg. Sci., 7, 237–242, 2004.
Chuvieco, E., Mouillot, F., Van der Werf, G. R., San Miguel, J., Tanase, M., Koutsias, N., García, M., Yebra, M., Padilla, M., and Gitas, I.: Historical background and current developments for mapping burned area from satellite Earth observation, Remote Sens. Environ., 225, 45–64, 2019.
Ciais, P., Bombelli, A., Williams, M., Piao, S. L., Chave, J., Ryan, C. M., Henry, M., Brender, P., and Valentini, R.: The Carbon balance of Africa: Synthesis of Recent Research Studies, Philos. T. R. Soc. A., 369, 2038–2057, 2011.
Collalti, A. and Prentice, I.: Is NPP proportional to GPP? Waring's hypothesis 20 years on, Tree Physiol., 39, 1473–1483, 2019.
Dexter, K., Smart, B., Baldauf, C., Baker, T., Balinga, M., Brienen, R., Fauset, S., Feldpausch, T., Silva, L., and Muledi, J. I.: Floristics and biogeography of vegetation in seasonally dry tropical regions, Int. Forest. Rev., 17, 10–32, 2015.
Ernst, Y., Archibald, S., Balzter, H., Chevallier, F., Ciais, P., Fischer, C. G., Gaubert, B., Higginbottom, T., Higgins, S., Lawal, S., Lacroix, F., Lauerwald, R., Lourenco, M., Martens, C., Mengistu, A. G., Merbold, L., Mitchard, E., Moyo, M., Nguyen, H., O'Sullivan, M., Rodríguez-Veiga, P., Rosan, T., Rosentreter, J., Ryan, C., Scheiter, S., Sitch, S., Stevens, N., Tagesson, T., Tian, H., Wang, M., Woon, J. S., Zheng, B., Zhou, Y., and Scholes, R. J.: The African Regional Greenhouse Gases Budget (2010–2019), Global Biogeochem. Cy., 38, e2023GB008016, https://doi.org/10.1029/2023GB008016, 2024.
Exbrayat, J. F., Smallman, T. L., Bloom, A. A., Hutley, L. B., and Williams, M.: Inverse determination of the influence of fire on vegetation carbon turnover in the pantropics, Global Biogeochem. Cy., 32, 1776–1789, 2018.
Fawcett, D., Cunliffe, A. M., Sitch, S., O'sullivan, M., Anderson, K., Brazier, R. E., Hill, T. C., Anthoni, P., Arneth, A., and Arora, V. K.: Assessing model predictions of carbon dynamics in global drylands, Frontiers in Environmental Science, 10, 790200, https://doi.org/10.3389/fenvs.2022.790200, 2022.
Friedlingstein, P., O'Sullivan, M., Jones, M. W., Andrew, R. M., Gregor, L., Hauck, J., Le Quéré, C., Luijkx, I. T., Olsen, A., Peters, G. P., Peters, W., Pongratz, J., Schwingshackl, C., Sitch, S., Canadell, J. G., Ciais, P., Jackson, R. B., Alin, S. R., Alkama, R., Arneth, A., Arora, V. K., Bates, N. R., Becker, M., Bellouin, N., Bittig, H. C., Bopp, L., Chevallier, F., Chini, L. P., Cronin, M., Evans, W., Falk, S., Feely, R. A., Gasser, T., Gehlen, M., Gkritzalis, T., Gloege, L., Grassi, G., Gruber, N., Gürses, Ö., Harris, I., Hefner, M., Houghton, R. A., Hurtt, G. C., Iida, Y., Ilyina, T., Jain, A. K., Jersild, A., Kadono, K., Kato, E., Kennedy, D., Klein Goldewijk, K., Knauer, J., Korsbakken, J. I., Landschützer, P., Lefèvre, N., Lindsay, K., Liu, J., Liu, Z., Marland, G., Mayot, N., McGrath, M. J., Metzl, N., Monacci, N. M., Munro, D. R., Nakaoka, S.-I., Niwa, Y., O'Brien, K., Ono, T., Palmer, P. I., Pan, N., Pierrot, D., Pocock, K., Poulter, B., Resplandy, L., Robertson, E., Rödenbeck, C., Rodriguez, C., Rosan, T. M., Schwinger, J., Séférian, R., Shutler, J. D., Skjelvan, I., Steinhoff, T., Sun, Q., Sutton, A. J., Sweeney, C., Takao, S., Tanhua, T., Tans, P. P., Tian, X., Tian, H., Tilbrook, B., Tsujino, H., Tubiello, F., van der Werf, G. R., Walker, A. P., Wanninkhof, R., Whitehead, C., Willstrand Wranne, A., Wright, R., Yuan, W., Yue, C., Yue, X., Zaehle, S., Zeng, J., and Zheng, B.: Global Carbon Budget 2022, Earth Syst. Sci. Data, 14, 4811–4900, https://doi.org/10.5194/essd-14-4811-2022, 2022.
Friend, A. D., Lucht, W., Rademacher, T. T., Keribin, R., Betts, R., Cadule, P., Ciais, P., Clark, D. B., Dankers, R., and Falloon, P. D.: Carbon residence time dominates uncertainty in terrestrial vegetation responses to future climate and atmospheric CO2, P. Natl. Acad. Sci. USA, 111, 3280–3285, 2014.
Fuster, B., Sánchez-Zapero, J., Camacho, F., García-Santos, V., Verger, A., Lacaze, R., Weiss, M., Baret, F., and Smets, B.: Quality assessment of PROBA-V LAI, fAPAR and fCOVER collection 300 m products of copernicus global land service, Remote Sensing, 12, 1017, https://doi.org/10.3390/rs12061017, 2020.
Giglio, L., Boschetti, L., Roy, D. P., Humber, M. L., and Justice, C. O.: The Collection 6 MODIS burned area mapping algorithm and product, Remote Sens. Environ., 217, 72–85, https://doi.org/10.1016/j.rse.2018.08.005, 2018.
Godlee, J. L., Ryan, C. M., Bauman, D., Bowers, S. J., Carreiras, J. M., Chisingui, A. V., Cromsigt, J. P., Druce, D. J., Finckh, M., and Gonçalves, F. M.: Structural diversity and tree density drives variation in the biodiversity–ecosystem function relationship of woodlands and savannas, New Phytol., 232, 579–594, 2021.
Gonçalves, F. M., Revermann, R., Gomes, A. L., Aidar, M. P., Finckh, M., and Juergens, N.: Tree species diversity and composition of Miombo woodlands in South-Central Angola: A chronosequence of forest recovery after shifting cultivation, International Journal of Forestry Research, 2017, 6202093, https://doi.org/10.1155/2017/6202093, 2017.
Hansen, M. C., Potapov, P. V., Moore, R., Hancher, M., Turubanova, S. A., Tyukavina, A., Thau, D., Stehman, S. V., Goetz, S. J., Loveland, T. R., Kommareddy, A., Egorov, A., Chini, L., Justice, C. O., and Townshend, J. R. G.: High-Resolution Global Maps of 21st-Century Forest Cover Change, Science, 342, 850–853, https://doi.org/10.1126/science.1244693, 2013.
Harris, I. C.: CRU JRA v1.1: A forcings dataset of gridded land surface blend of Climatic Research Unit (CRU) and Japanese reanalysis (JRA) data, January 1901–December 2017, Centre for Environmental Data Analysis [data set], https://doi.org/10.5285/13f3635174794bb98cf8ac4b0ee8f4ed, 2019.
Hengl, T., Mendes de Jesus, J., Heuvelink, G. B., Ruiperez Gonzalez, M., Kilibarda, M., Blagotić, A., Shangguan, W., Wright, M. N., Geng, X., and Bauer-Marschallinger, B.: SoilGrids250m: Global gridded soil information based on machine learning, PLoS one, 12, e0169748, https://doi.org/10.1371/journal.pone.0169748, 2017.
Joiner, J. and Yoshida, Y.: Global MODIS and FLUXNET-derived Daily Gross Primary Production, V2, ORNL DAAC [data set], https://doi.org/10.3334/ORNLDAAC/1835, 2021.
Jung, M., Schwalm, C., Migliavacca, M., Walther, S., Camps-Valls, G., Koirala, S., Anthoni, P., Besnard, S., Bodesheim, P., Carvalhais, N., Chevallier, F., Gans, F., Goll, D. S., Haverd, V., Köhler, P., Ichii, K., Jain, A. K., Liu, J., Lombardozzi, D., Nabel, J. E. M. S., Nelson, J. A., O'Sullivan, M., Pallandt, M., Papale, D., Peters, W., Pongratz, J., Rödenbeck, C., Sitch, S., Tramontana, G., Walker, A., Weber, U., and Reichstein, M.: Scaling carbon fluxes from eddy covariance sites to globe: synthesis and evaluation of the FLUXCOM approach, Biogeosciences, 17, 1343–1365, https://doi.org/10.5194/bg-17-1343-2020, 2020.
Kaiser, J. W., Heil, A., Andreae, M. O., Benedetti, A., Chubarova, N., Jones, L., Morcrette, J.-J., Razinger, M., Schultz, M. G., Suttie, M., and van der Werf, G. R.: Biomass burning emissions estimated with a global fire assimilation system based on observed fire radiative power, Biogeosciences, 9, 527–554, https://doi.org/10.5194/bg-9-527-2012, 2012.
Kalaba, F. K., Quinn, C. H., Dougill, A. J., and Vinya, R.: Floristic composition, species diversity and carbon storage in charcoal and agriculture fallows and management implications in Miombo woodlands of Zambia, Forest Ecol. Manag., 304, 99–109, 2013.
Kattge, J., Diaz, S., Lavorel, S., Prentice, I., Leadley, P., Bönisch, G., Garnier, E., Westoby, M., Reich, P. B., and Wright, I.: TRY – a global database of plant traits, Glob. Change Biol., 17, 2905–2935, 2011.
Lehmann, C. E. R., Anderson, T. M., Sankaran, M., Higgins, S. I., Archibald, S., Hoffmann, W. A., Hanan, N. P., Williams, R. J., Fensham, R. J., Felfili, J., Hutley, L. B., Ratnam, J., San Jose, J., Montes, R., Franklin, D., Russell-Smith, J., Ryan, C. M., Durigan, G., Hiernaux, P., Haidar, R., Bowman, D. M. J. S., and Bond, W. J.: Savanna Vegetation-Fire-Climate Relationships Differ Among Continents, Science, 343, 548–552, https://doi.org/10.1126/science.1247355, 2014.
Levick, S. R., Baldeck, C. A., and Asner, G. P.: Demographic legacies of fire history in an African savanna, Funct. Ecol., 29, 131–139, https://doi.org/10.1111/1365-2435.12306, 2015.
MacBean, N., Scott, R. L., Biederman, J. A., Peylin, P., Kolb, T., Litvak, M. E., Krishnan, P., Meyers, T. P., Arora, V. K., Bastrikov, V., Goll, D., Lombardozzi, D. L., Nabel, J. E. M. S., Pongratz, J., Sitch, S., Walker, A. P., Zaehle, S., and Moore, D. J. P.: Dynamic global vegetation models underestimate net CO2 flux mean and inter-annual variability in dryland ecosystems, Environ. Res. Lett., 16, 094023, https://doi.org/10.1088/1748-9326/ac1a38, 2021.
McNicol, I. M., Ryan, C. M., and Williams, M.: How resilient are African woodlands to disturbance from shifting cultivation?, Ecol. Appl., 25, 2320–2336, https://doi.org/10.1890/14-2165.1.sm, 2015.
McNicol, I. M., Ryan, C. M., and Mitchard, E. T.: Carbon losses from deforestation and widespread degradation offset by extensive growth in African woodlands, Nat. Commun., 9, 1–11, 2018.
McNicol, I. M., Keane, A., Burgess, N. D., Bowers, S. J., Mitchard, E. T., and Ryan, C. M.: Protected areas reduce deforestation and degradation and enhance woody growth across African woodlands, Commun. Earth Environ., 4, 392, https://doi.org/10.1038/s43247-023-01053-4, 2023.
Merbold, L., Ardö, J., Arneth, A., Scholes, R. J., Nouvellon, Y., de Grandcourt, A., Archibald, S., Bonnefond, J. M., Boulain, N., Brueggemann, N., Bruemmer, C., Cappelaere, B., Ceschia, E., El-Khidir, H. A. M., El-Tahir, B. A., Falk, U., Lloyd, J., Kergoat, L., Le Dantec, V., Mougin, E., Muchinda, M., Mukelabai, M. M., Ramier, D., Roupsard, O., Timouk, F., Veenendaal, E. M., and Kutsch, W. L.: Precipitation as driver of carbon fluxes in 11 African ecosystems, Biogeosciences, 6, 1027–1041, https://doi.org/10.5194/bg-6-1027-2009, 2009.
Milodowski, D., Mitchard, E., and Williams, M.: Forest loss maps from regional satellite monitoring systematically underestimate deforestation in two rapidly changing parts of the Amazon, Environ. Res. Lett., 12, 094003, https://doi.org/10.1088/1748-9326/aa7e1e, 2017.
Mistry, J.: World Savannas, Routledge, Abingdon, UK, ISBN 9780582356597, 2014.
Mitchard, E. T. A., Saatchi, S. S., Woodhouse, I. H., Nangendo, G., Ribeiro, N. S., Williams, M., Ryan, C. M., Lewis, S. L., Feldpausch, T. R., and Meir, P.: Using satellite radar backscatter to predict above-ground woody biomass: A consistent relationship across four different African landscapes, Geophys. Res. Lett., 36, L23401, https://doi.org/10.1029/2009GL040692, 2009.
Moncrieff, G. R., Scheiter, S., Bond, W. J., and Higgins, S. I.: Increasing atmospheric CO2 overrides the historical legacy of multiple stable biome states in Africa, New Phytol., 201, 908–915, https://doi.org/10.1111/nph.12551, 2014.
Myneni, R., Knyazikhin, Y., and Park, T.: MODIS/Terra+Aqua Leaf Area Index/FPAR 8-Day L4 Global 500m SIN Grid V061, NASA [data set], https://doi.org/10.5067/MODIS/MCD15A2H.061, 2021.
Osborne, C. P., Charles-Dominique, T., Stevens, N., Bond, W. J., Midgley, G., and Lehmann, C. E. R.: Human impacts in African savannas are mediated by plant functional traits, New Phytol., 220, 10–24, https://doi.org/10.1111/nph.15236, 2018.
Paschalis, A., Fatichi, S., Zscheischler, J., Ciais, P., Bahn, M., Boysen, L., Chang, J., De Kauwe, M., Estiarte, M., Goll, D., Hanson, P. J., Harper, A. B., Hou, E., Kigel, J., Knapp, A. K., Larsen, K. S., Li, W., Lienert, S., Luo, Y., Meir, P., Nabel, J. E. M. S., Ogaya, R., Parolari, A. J., Peng, C., Peñuelas, J., Pongratz, J., Rambal, S., Schmidt, I. K., Shi, H., Sternberg, M., Tian, H., Tschumi, E., Ukkola, A., Vicca, S., Viovy, N., Wang, Y.-P., Wang, Z., Williams, K., Wu, D., and Zhu, Q.: Rainfall manipulation experiments as simulated by terrestrial biosphere models: Where do we stand?, Glob. Change Biol., 26, 3336–3355, https://doi.org/10.1111/gcb.15024, 2020.
Pennington, R. T., Lehmann, C. E., and Rowland, L. M.: Tropical savannas and dry forests, Curr. Biol., 28, R541–R545, 2018.
Ramo, R., Roteta, E., Bistinas, I., Van Wees, D., Bastarrika, A., Chuvieco, E., and Van der Werf, G. R.: African burned area and fire carbon emissions are strongly impacted by small fires undetected by coarse resolution satellite data, P. Natl. Acad. Sci. USA, 118, e2011160118, https://doi.org/10.1073/pnas.2011160118, 2021.
Ribeiro, N. S., Katerere, Y., Chirwa, P. W., and Grundy, I. M.: Miombo woodlands in a changing environment: Securing the resilience and sustainability of people and woodlands, Springer Nature, ISBN 978-3-030-50104-4, 2020.
Runge, J., Petoukhov, V., Donges, J. F., Hlinka, J., Jajcay, N., Vejmelka, M., Hartman, D., Marwan, N., Paluš, M., and Kurths, J.: Identifying causal gateways and mediators in complex spatio-temporal systems, Nat. Commun., 6, 8502, https://doi.org/10.1038/ncomms9502, 2015.
Ryan, C. and Williams, M.: How does fire intensity and frequency affect miombo woodland tree populations and biomass?, Ecol. Appl., 21, 48–60, 2011.
Ryan, C. M., Williams, M., and Grace, J.: Above and Below Ground Carbon Stocks in a Miombo Woodland Landscape of Mozambique, Biotropica, 43, 423–432, 2011.
Ryan, C. M., Hill, T. C., Woollen, E., Ghee, C., Mitchard, E. T. A., Cassells, G., Grace, J., Woodhouse, I. H., and Williams, M.: Quantifying small-scale deforestation and forest degradation in African woodlands using radar imagery, Glob. Change Biol., 18, 243–257, 2012.
Ryan, C. M., Williams, M., Hill, T. C., Grace, J., and Woodhouse, I. H.: Assessing the phenology of southern tropical Africa: A comparison of hemispherical photography, scatterometry, and optical/NIR remote sensing, IEEE T. Geosci. Remote, 52, 519–528, https://doi.org/10.1109/TGRS.2013.2242081, 2014.
Ryan, C. M., Pritchard, R., McNicol, I., Owen, M., Fisher, J. A., and Lehmann, C.: Ecosystem services from southern African woodlands and their future under global change, Philos. T. Royal Soc. B, 371, 20150312, https://doi.org/10.1098/rstb.2015.0312, 2016.
Ryan, C. M., Williams, M., Grace, J., Woollen, E., and Lehmann, C. E. R.: Pre-rain green-up is ubiquitous across southern tropical Africa: implications for temporal niche separation and model representation, New Phytol., 213, 625–633, https://doi.org/10.1111/nph.14262, 2017.
Sankaran, M., Hanan, N. P., Scholes, R. J., Ratnam, J., Augustine, D. J., Cade, B. S., Gignoux, J., Higgins, S. I., Le Roux, X., Ludwig, F., Ardo, J., Banyikwa, F., Bronn, A., Bucini, G., Caylor, K. K., Coughenour, M. B., Diouf, A., Ekaya, W., Feral, C. J., February, E. C., Frost, P. G. H., Hiernaux, P., Hrabar, H., Metzger, K. L., Prins, H. H. T., Ringrose, S., Sea, W., Tews, J., Worden, J., and Zambatis, N.: Determinants of woody cover in African savannas, Nature, 438, 846–849, 2005.
SEOSAW partnership: A network to understand the changing socio-ecology of the southern African woodlands (SEOSAW): Challenges, benefits, and methods, Plants, People, Planet, 3, 249–267, 2021.
Sitch, S., Friedlingstein, P., Gruber, N., Jones, S. D., Murray-Tortarolo, G., Ahlström, A., Doney, S. C., Graven, H., Heinze, C., Huntingford, C., Levis, S., Levy, P. E., Lomas, M., Poulter, B., Viovy, N., Zaehle, S., Zeng, N., Arneth, A., Bonan, G., Bopp, L., Canadell, J. G., Chevallier, F., Ciais, P., Ellis, R., Gloor, M., Peylin, P., Piao, S. L., Le Quéré, C., Smith, B., Zhu, Z., and Myneni, R.: Recent trends and drivers of regional sources and sinks of carbon dioxide, Biogeosciences, 12, 653–679, https://doi.org/10.5194/bg-12-653-2015, 2015.
Smallman, T. L. and Williams, M.: Description and validation of an intermediate complexity model for ecosystem photosynthesis and evapotranspiration: ACM-GPP-ETv1, Geosci. Model Dev., 12, 2227–2253, https://doi.org/10.5194/gmd-12-2227-2019, 2019.
Smallman, T. L., Milodowski, D. T., Neto, E. S., Koren, G., Ometto, J., and Williams, M.: Parameter uncertainty dominates C-cycle forecast errors over most of Brazil for the 21st century, Earth Syst. Dynam., 12, 1191–1237, https://doi.org/10.5194/esd-12-1191-2021, 2021.
Smallman, T. L., Milodowski, D. T., and Williams, M.: From Ecosystem Observation to Environmental Decision-Making: Model-Data Fusion as an Operational Tool, Frontiers in Forests and Global Change, 4, 818661, https://doi.org/10.3389/ffgc.2021.818661, 2022.
Teckentrup, L., De Kauwe, M. G., Pitman, A. J., Goll, D. S., Haverd, V., Jain, A. K., Joetzjer, E., Kato, E., Lienert, S., Lombardozzi, D., McGuire, P. C., Melton, J. R., Nabel, J. E. M. S., Pongratz, J., Sitch, S., Walker, A. P., and Zaehle, S.: Assessing the representation of the Australian carbon cycle in global vegetation models, Biogeosciences, 18, 5639–5668, https://doi.org/10.5194/bg-18-5639-2021, 2021.
van der Werf, G. R., Randerson, J. T., Giglio, L., van Leeuwen, T. T., Chen, Y., Rogers, B. M., Mu, M., van Marle, M. J. E., Morton, D. C., Collatz, G. J., Yokelson, R. J., and Kasibhatla, P. S.: Global fire emissions estimates during 1997–2016, Earth Syst. Sci. Data, 9, 697–720, https://doi.org/10.5194/essd-9-697-2017, 2017.
Waring, R. H., Landsberg, J. J., and Williams, M.: Net primary production of forests: a constant fraction of gross primary production?, Tree Physiol., 18, 129–134, 1998.
Williams, M., Schwarz, P., Law, B. E., Irvine, J., and Kurpius, M. R.: An improved analysis of forest carbon dynamics using data assimilation, Glob. Change Biol., 11, 89–105, 2005.
Williams, M., Ryan, C. M., Rees, R. M., Sambane, E., Fernando, J., and Grace, J.: Carbon sequestration and biodiversity of re-growing miombo woodlands in Mozambique, Forest Ecol. Manag., 254, 145–155, 2008.
Williams, M., Milodowski, D. T., and Smallman, T. L.: Systemic Carbon Cycle Analyses for the Southern African Woodlands ecoregion from 2006–2017, 2006–2017, University of Edinburgh, School of GeoSciences, Global Change Institute [data set], https://doi.org/10.7488/ds/7776, 2024.
Wright, S.: Correlation and causation, J. Agric. Res., 20, 557, https://books.google.co.ao/books?id=lNNdIV_qpwIC&printsec=frontcover&hl=pt-PT&source=gbs_ge_summary_r&cad=0#v=onepage&q&f=false (last access: 12 March 2025), 1921.
Wright, S.: The method of path coefficients, The annals of mathematical statistics, 5, 161–215, 1934.
Yin, Y., Bloom, A. A., Worden, J., Saatchi, S., Yang, Y., Williams, M., Liu, J., Jiang, Z., Worden, H., Bowman, K., Frankenberg, C., and Schimel, D.: Fire decline in dry tropical ecosystems enhances decadal land carbon sink, Nat. Commun., 11, 1900, https://doi.org/10.1038/s41467-020-15852-2, 2020.
Zhang-Zheng, H., Adu-Bredu, S., Duah-Gyamfi, A., Moore, S., Addo-Danso, S. D., Amissah, L., Valentini, R., Djagbletey, G., Anim-Adjei, K., Quansah, J., Sarpong, B., Owusu-Afriyie, K., Gvozdevaite, A., Tang, M., Ruiz-Jaen, M. C., Ibrahim, F., Girardin, C. A. J., Rifai, S., Dahlsjö, C. A. L., Riutta, T., Deng, X., Sun, Y., Prentice, I. C., Oliveras Menor, I., and Malhi, Y.: Contrasting carbon cycle along tropical forest aridity gradients in West Africa and Amazonia, Nat. Commun., 15, 3158, https://doi.org/10.1038/s41467-024-47202-x, 2024.