the Creative Commons Attribution 4.0 License.
the Creative Commons Attribution 4.0 License.
 | 01 Jul 2025
Fungi present distinguishable isotopic signals in their lipids when grown on glycolytic versus tricarboxylic acid cycle intermediates
Stanislav Jabinski
Vítězslav Kučera
Marek Kopáček
Jan Jansa
Microbial activity in soils controls both the size and turnover rates of large carbon (C) inventories stored in the subsurface, having important consequences for partitioning of C between terrestrial and atmospheric reservoirs as well as recycling of mineral nutrients such as nitrogen or phosphorus (often bound to the C) that support plant growth. Fungi are major decomposers of soil organic matter (SOM); however, uncertainty about the identity of predominant C substrates that fuel their respiration confound models of fungal production and SOM turnover. To further define the signals of microbial heterotrophic activity, we applied a dual hydrogen (H) and C stable isotope probing (SIP) approach to pure fungal cultures representing the phyla Ascomycota, Basidiomycota, and Zygomycota growing on monomeric (glucose, succinate) or complex substrates (tannic acid, β-cyclodextrin). Our findings demonstrate that the investigated species incorporated only minor quantities of inorganic C (provided as bicarbonate) into their membrane lipids, amounting to < 3 % of lipid-C, with no consistent patterns observed between species or growth substrates. The net incorporation of water-derived H (i.e., aw) into lipids also did not differ significantly between incubations with monomeric versus complex substrates; however, growth on succinate elicited significantly higher aw values than glucose or β-cyclodextrin. This finding suggests that 2H-SIP assays have the potential to distinguish between microbial communities supported predominantly by substrates that are catabolized by the tricarboxylic acid cycle versus glycolytic pathway. Furthermore, the average aw value of heterotrophic fungal incubations 0.69 ± 0.03 (SEM) is consistent with that observed for bacterial heterotrophs and may be applied for upscaling lipid-based estimates of fungal production in environmental assays.
- Article
(1234 KB) - Full-text XML
-
Supplement
(674 KB) - BibTeX
- EndNote


Soil organic matter (SOM) is the major reservoir of carbon (1580 × 1015 g C) in the biosphere, and active microbial populations act to redistribute this C to other reactive reservoirs, such as the atmosphere (Carlson et al., 2001; Grinhut et al., 2007). Major uncertainties in modeling C and climate dynamics stem from insufficient knowledge on the controls of SOM degradation and transformation (Ciais et al., 2014; Lindahl and Tunlid, 2015). Saprotrophic soil fungi are one of the major decomposers in soils, are known to degrade naturally occurring complex molecules such as lignin (Kirk and Farrell, 1987; Fioretto et al., 2005; Baldrian et al., 2011), cellulose (Šnajdr et al., 2011), and humic substances (Grinhut et al., 2007) but are also reported to compete for accessible plant photosynthate excreted by roots (De Boer et al., 2005; Högberg et al., 2001; Smith and Read, 2008). Despite the unique and important fungal niche in biogeochemical cycles, their contributions to SOM cycling remains poorly constrained (Frey, 2019; Grinhut et al., 2007). Furthermore, heterotrophic organisms feeding on organic substrates to gain energy and build biomass are also known to fix a variable quantity of inorganic C (IC) in order to replenish intermediates in the tricarboxylic acid (TCA) cycle (Kornberg, 1965). It has been suggested that 2 %–8 % of the biomass C in heterotrophs originates from IC incorporated through anaplerotic carboxylation reactions (Romanenko, 1964; Roslev et al., 2004; Braun et al., 2021). Awareness of these processes has existed for decades (Kornberg, 1965; Sorotkin, 1966). Yet, the relevance and metabolic controls on heterotrophic IC fixation remain poorly understood, partly due to the lack of reliable estimates for most organisms and habitats (Braun et al., 2021).
Advanced analytical techniques now allow microbial taxa to be linked to specific processes in environmental studies by measuring incorporation of stable isotopes into biomarkers (Boschker et al., 1998; Dumont and Murrell, 2005; Kreuzer-Martin, 2007), such as fungal and bacterial membrane lipid fatty acids (Treonis et al., 2004; Willers et al., 2015) or other biomarkers (Boschker and Middelbourg, 2002). Previous studies have demonstrated that variability in the composition of microbial lipids is similar to that of environmental water (Hoefs, 2018; Kopf et al., 2015), and stable isotope probing (SIP) assays applying enrichments in 2H2O have proven to be a useful tracer of microbial activity in a diverse range of environments (Canarini et al., 2024; Caro et al., 2023; Fischer et al., 2013; Kellermann et al., 2012; Wegener et al., 2016; Warren, 2022; Wu et al., 2018). It is important to distinguish these 2H-labeling applications from parallel investigations aimed at determining the kinetic and equilibrium isotope fractionations resulting from biosynthetic incorporation of water hydrogen (water-H) into individual compounds (i.e., ε; see Hayes, 2004). While ε values can be indicative of underlying metabolic processes or environmental change (Osborn et al., 2011; Sachse et al., 2012; Zhang et al., 2009), the large range of ε that has been reported for fatty acids of aerobic, heterotrophic bacteria (−330 > ε > +360 ‰; see review by Pilecky et al. (2025)) arises, in part, because water-H is not the only source of H for biomolecules, complicating the interpretation of such values observed in natural systems. In contrast, the water-H incorporation factor (or water-H assimilation efficiency; aw) accounts for variability in the proportion of H derived from water as well as fractionation during biosynthesis (see Zhang et al., 2009; Kopf et al., 2015; see Methods), and has been valuable for SIP approaches to (i) estimate microbial production rates in natural systems (e.g., Wegener et al., 2012; Caro et al., 2023) and (ii) establish characteristic growth patterns of microbial populations that can access a large diversity of substrates, such as methanogens (Wu et al., 2020).
To fully exploit the potential of SIP experiments, a dual-SIP approach was developed to track total microbial production by adding heavy water (2H2O) together with 13C-labeled IC, enabling simultaneous estimates of total and autotrophic metabolism, respectively (Wegener et al., 2012; Wu et al., 2020). Recently, Jabinski et al. (2024) validated an innovation of the dual-SIP assay by using rapid pyrolysis of fungal biomass to determine the stable C and H isotopic composition of fungal lipids and demonstrated that water-H and IC assimilation signatures could successfully be used to differentiate fungal ecotypes growing on glucose or glutamic acid as the C source. The aim of the current study was to further assess the controls on water-H and IC incorporation into lipids and expand our knowledge for interpreting environmental signals by applying the dual-SIP assay on a broader range of pure fungal cultures and growth substrates, including labile monomers versus more complex, high-molecular-weight molecules. We hypothesized that (i) the incorporation of IC and water-H into the fungal fatty acid biomarker C18:2 will be similar for fungal species growing on the same substrate and (ii) that IC and water-H incorporation will distinguish between growth on labile versus more complex C substrates.
2.1 Cultivation and harvesting
Fungal pure cultures of two Basidiomycota (Paxillus involutus (PI, strain SB-22); Phanerodontia chrysosporium (PC, strain CCM8074)), two Zygomycota (Mortierella sp. (MO, strain RK-38); Umbelopsis sp. (UM, strain RK-43)), and two Ascomycota (Penicillium janczewskii (PJ, strain BCCO20_0265); Paecilomyces lilacinus (PL, strain DP-23)) were incubated in 500 mL Schott bottles at 25 °C in the dark. Liquid mineral media (50 mL) was adapted after Bukovská et al. (2018) with the vitamins left out and was inoculated with approximately 106 spores, or, for Basidiomycota, a hyphal block < 0.5 cm3 recovered from a previous culture using the same cultivation medium solidified with agar (1.5 %).
The growth medium contained per liter: 4 g organic C in various forms (C6H12O6 glucose; C4H6O4 succinic acid; C42H70O35 β-Cyclodextrin or C76H52O46 tannic acid), 0.01 g FeSO4 ⋅ 7H2O, 2 g KH2PO4, 0.5 g MgSO4 ⋅ 7H2O, 0.1 g NaCl, 0.1 g CaCl, 2.5 g (NH4)2SO4, 0.45 g NaHCO3, and 1 mL of a mixed solution (per liter: 0.5 g H3BO3, 0.04 g CuSO4 ⋅ 5H2O, 0.1 g KI, 0.4 g MnSO4 ⋅ 5H2O, 0.2 g NaMoO4 ⋅ 2H2O, 0.4 g ZnSO4 ⋅ 7H2O). The pH of the medium was adjusted to 4.5 before inoculation. Dual-SIP experiments were performed using 13C-bicarbonate (13C-DIC, NaH13CO3) and deuterated water (2H2O). Each fungal strain was grown in triplicate with non-labeled substrates (Treatment I), with δ2H of the medium water adjusted to 100 ‰ and AT13C = 10 % of 13C-DIC (Treatment II), 200 ‰ δ2H and 10 % 13C-DIC (Treatment III), and 400 ‰ δ2H and 10 % 13C-DIC (Treatment IV). The concentration of the bicarbonate in the cultivation medium was 0.1 g L−1. The Schott bottles were closed with a rubber stopper in order to prevent the labeled 13C-DIC from outgassing, and ample headspace was provided to maintain oxic conditions throughout the growth experiment. Fungal growth was monitored via the accumulation of CO2 in the headspace, and we aimed to harvest when CO2 levels reached 10 %; however, without preliminary knowledge of the fungal growth dynamics, some cultivations exceeded this level more quickly than they could be harvested.
To harvest the fungal biomass, mycelia were separated from the growth medium via vacuum filtration through 5 µm Isopore polycarbonate filters (47 mm diam, Merck catalog number TMTP04700) and the cultivation medium was collected into a sterile 50 mL tube. Thereafter, the mycelium was washed with ample MilliQ water, transferred to pre-weighed, sterile 50 mL tubes; the fresh weight of the biomass was recorded, and the samples were frozen at −80 °C until lyophilization. A subsample of the cultivation medium was also frozen at −80 °C and the rest was used to determine pH post-incubation. After lyophilization, the dry weight of each sample was determined and stored at −20 °C until further analysis.
2.2 Measurements
2.2.1 Headspace CO2 concentration and isotope composition
Samples of headspace (0.3 mL) were collected weekly from each bottle into helium flushed 12 mL exetainer vials (Exetainer, Labco Limited, UK) and analyzed for their CO2 concentration and isotopic ratio using GasBench II equipped with a single cryo-trap connected to a Delta V Advantage isotopic ratio mass spectrometer (IRMS) via Conflo IV (Thermo Scientific, Bremen, Germany). Ambient air (with its CO2 concentration previously measured using a LiCor 850 gas analyzer) was used as a standard for CO2 concentration measurements, whereas a laboratory cylinder with 0.1 % CO2 in helium was used as a standard for isotopic composition (δ13C = −2.86 ‰). The analytical precision was below 1 ‰. Data were analyzed and exported using Isodat 3.0 software.
2.2.2 Medium water (2H2O)
Liquid samples were transferred into 1.5 mL glass vials (32 × 11.6 mm, Fischer Scientific) and then measured using a Triple Liquid Water Isotope Analyzer (Los Gatos Research), which is based on the principle of high-resolution laser absorption spectroscopy. Samples were dispensed into the instrument using an autosampler (PAL3 LSI, ABB company) and a 1.2 µL syringe (Hamilton). Samples were measured and evaluated against prepared laboratory standards of known isotopic composition. The isotopic ratios of these laboratory standards were verified by measuring against international standards (VSMOW2, SLAP2) made by the IAEA. For quality control purposes, the measurements of the samples were also interspersed with periodic measurements of the prepared verification samples with known isotopic composition. The final isotopic composition (δ2H) was determined using LIMS software. Analytical precision of δ2H was < 1.5 ‰.
Water sampled from incubations with tannic acid could not be measured using the laser, as described above, due to its high organic carbon content and was rather measured via a GasBench II device (Thermo Scientific, Bremen, Germany; Application Note: 30049). Medium water samples (200 µL) were added with a platinum catalyst to 12 mL exetainer vials (Exetainer, Labco Limited, UK). The headspace was flushed with 1 % H2 in He at approximately 100 mL min−1 for 6 min. After an equilibration time of over 40 min, the samples were measured by purging the exetainer using a double-holed needle with helium into a 250 µL sample loop. The sample was then injected and separated via a Carboxen PLOT 1010 (0.53 mm ID; Supelco, Bellefonte, USA) held at 90 °C with a flow rate of ∼ 2.2 mL min−1 and then introduced into the MAT253 Plus IRMS via a Conflo IV interface. Each sample was injected three times per analysis. The isotopic composition was determined using Isodat 3.0 software against the corresponding H2 working gas (−239 ‰ for δ2H), and the values were corrected and normalized using international standards VSMOW2 (0 ‰ for δ2H), SLAP2 (−427.5 ‰ for δ2H), USGS53 (+40.2 ‰ for δ2H), and GFLES-2 (159.9 ‰ for δ2H). The analytical precision was around 1 ‰.
2.2.3 Carbon (δ13C) substrate analysis
Substrates (∼ 100 µg) were weighed into tin capsules (8 mm × 5 mm, Sercon, Crewe, UK) and placed in a helium-flushed carousel autosampler, then introduced into an Elemental Analyzer IsoLink device (EA IsoLink CNSOH, Thermo Scientific, Bremen, Germany) equipped with a CHN/NC/N EA combustion/reduction reactor (Sercon, Crewe, UK) heated to 1020 °C. A pulse of oxygen was introduced into the reactor simultaneously with the sample. The sample gases were quantified via a thermal conductivity detector (TCD) and then introduced into a MAT 253 Plus isotope ratio mass spectrometer (IRMS; Thermo Scientific; Bremen, Germany) via the open split of a Conflo IV interface, with helium as the carrier gas. The isotopic composition was determined using Isodat 3.0 software against the corresponding CO2 working gas (−4.191 ‰ for δ13C), and the values were corrected for linearity and normalized to the VPDB scale using international reference material IAEA-600 (−27.771 ‰ for δ13C). The analytical precision was < 0.04 ‰.
2.2.4 Pyrolysis GC for lipid analysis
The pyrolysis unit Shimadzu 3030D (Shimadzu, Kyoto, Japan/Frontier Laboratories, Fukushima, Japan) was installed on top of the GC Trace1310 gas chromatograph SSL injector (Thermo Scientific, Bremen, Germany), and the GC was equipped with an SLB-IL60 column (non-bonded; 1,12-Di(tripropylphosphonium)dodecane bis(trifluoromethanesulfonyl)imide phase, 30 m, 0.25 mm ID, 0.2 µ m film thickness, Supelco, Bellefonte, USA). The furnace temperature was 650 °C and the interface temperature was 370 °C. The injector temperature was 360 °C and the GC oven was held at 80 °C for 1 min, then ramped to 175 °C at 15 °C min−1, then ramped to 195 °C at 2 °C min−1, then ramped to 300 °C at 10 °C min−1, and finally held at 300 °C for 7 min. Helium was used as the carrier gas, with a constant flow of 1.5 mL min−1, a split ratio of 40, and a split flow of 26.7 mL min−1. The column flow was split via a multichannel device to acquire MS and isotopic data simultaneously from one injection. The GCMS (ISQ QD; Thermo Scientific, Bremen, Germany) ion source was set to electron impact ionization mode (EI) at 70 eV and a scan range of 50–500 with a scan time of 0.2 s−1. Scanning started after 8 min to avoid the solvent peak in the MS. The transfer line temperature was set to 300 °C and the ion source was set to 250 °C.
The samples (lyophilized biomass, 0.1–1.3 mg) were weighed into an ultra-clean stainless steel Eco-Cup LF (Frontier Laboratories, Fukushima, Japan), which were burned with a torch before usage to remove contaminants. Immediately prior to sample injection, 30 µL of trimethylsulfonium hydroxide (TMSH) was added on the sample to increase the volatilization by transforming the fatty acids into fatty acid methyl esters (FAMEs) and improve measurement sensitivity. Identification of FAMEs was performed using fragmentation patterns and the NIST 14 library.
Stable C and H isotope compositions of FAMEs from aliquots of the same biomass were separately determined by splitting the flow from the GC column to a GC-IsoLink II reactor, coupled to a MAT253 Plus IRMS via a Conflo IV interface. Values are expressed in standard delta notation (δ13C and δ2H). MS information was simultaneously acquired by use of the multi-channel device described above. For conversion of FAMEs and ergosterol to CO2, the combustion reactor (nickel oxide tube with CuO, NiO, and Pt wires) was set to 1000 °C. For conversion of FAMEs and ergosterol to H2, the pyrolysis reactor (aluminum tube) was set to 1420 °C. The FAMEs were identified by their retention times and fragmentation patterns. The isotopic composition was determined using Isodat 3.0 software against the corresponding CO2 or H2 working gas (−4.191 ‰ for δ13C, −239.5 ‰ for δ2H). Isotope corrections for instrument drifts, linearity, and normalization to the VPDB or VSMOW scales were performed according to the response of USGS70 (−30.53 ‰ for δ13C, −183.9 ‰ for δ2H) and USGS72 (−1.54 ‰ for δ13C, 348.3 ‰ for δ2H) reference standards. The analytical precision was < 0.5 ‰ and < 10 ‰ for δ13C and δ2H, respectively.
2.3 Calculations
Carbon use efficiency (CUE) for the growth experiments was calculated by normalizing the quantity of C in biomass by that plus C that accumulated as CO2 (CUE = biomass-C(CO2-C + biomass-C)). The δ13C values of fungal biomarker C18:2 was determined as standard delta values (‰). The IC incorporation into the biomarker (% IC) was calculated based on the following equation.
Equation (1): inorganic carbon (% IC) assimilation was calculated as the difference in the 13C atom fraction of the lipids harvested at the end of the labeling experiment (13Flipid) compared to the lipids harvested at the end of the natural abundance treatment (13Flipid, control), relative to the difference between the mixed weighted average 13C atom fraction of dissolved inorganic C (13FDIC; see Text S1 in the Supplement) and the 13F of the substrate. F was calculated as , where R is re-calculated from the δ13C ratios reported by Isodat Software following measurement by IRMS (δ13C = (modified after Boschker and Middelburg, 2002; Wegener et al., 2012).
The water H assimilation efficiency (aw) for fungal biomarker C18:2 was approximated from the regressions of the hydrogen isotope composition of individual fatty acids 2Ffa and that of medium water (2Fwater), according to Kopf et al. (2015), after Zhang et al. (2009). Briefly, the hydrogen isotopic compositions of microbial fatty acids produced by an organism generally follow the isotopic composition of environmental water and are related to the mole fraction of H contributed from water in the cultivation medium (fw) and the net hydrogen isotope fractionation between fatty acids and water (), where . Whereas aw can be determined experimentally, the latter terms cannot be independently determined for heterotrophic growth (Kopf et al., 2015). The traditional isotope effects and εC18:2/water and αC18:2/water were calculated after Hayes (2004), where and 1000 ‰.
Notably, calculation of % IC and aw considers relative increases in or composition and thus does not require a correction for the methyl group added during derivatization of the fatty acid. The εC18:2/water values determined in this study were not corrected for the additional methyl group and contribute inaccuracy to the reported values, as further discussed below.
3.1 Fungal growth and CO2 production
All fungal species were pure cultures, which were incubated in a mineral medium with either glucose, succinate, β-cyclodextrin, or tannic acid serving as the sole organic C source. Growth was monitored by the evolution of CO2 into the headspace, which ranged from 0.36 % (no respiration of substrate) to a maximum of 35 %, after incubation times ranging from 5 to 160 d (Fig. 1). The pH of the media in all incubations ranged from 2 to 5.5 at the time of harvest, with a general trend of decreasing pH with increasing CO2; however, the trend was opposite when succinate was the carbon source, with pH increasing from 4 to 5.5. For samples that produced sufficient biomass, the dry biomass of harvested fungal hyphae extended up to 250 mg, and at least 30 µg dry biomass was used to analyze fungal membrane fatty acids by Pyr-GC-IRMS. Only the Ascomycota species PL and PJ grew sufficiently on each tested substrate to produce enough biomass for stable isotope analysis. Incubations of Zygomycota species with glucose or succinate also yielded sufficient dry biomass, and only UM was able to grow on β-cyclodextrin. Zygomycota species produced neither CO2 nor biomass when incubated with tannic acid. The Basidiomycota typically exhibited the slowest growth, and both species (PI and PC) only produced enough biomass when grown on glucose. The headspace CO2 levels in Basidiomycota incubations with succinate increased to a maximum of ∼ 2 %, but only PI yielded sufficient biomass for analysis. PC grew sufficiently on β-cyclodextrin, with CO2 levels increasing to a maximum of 3 %, while CO2 remained < 0.6 % in PI incubations.
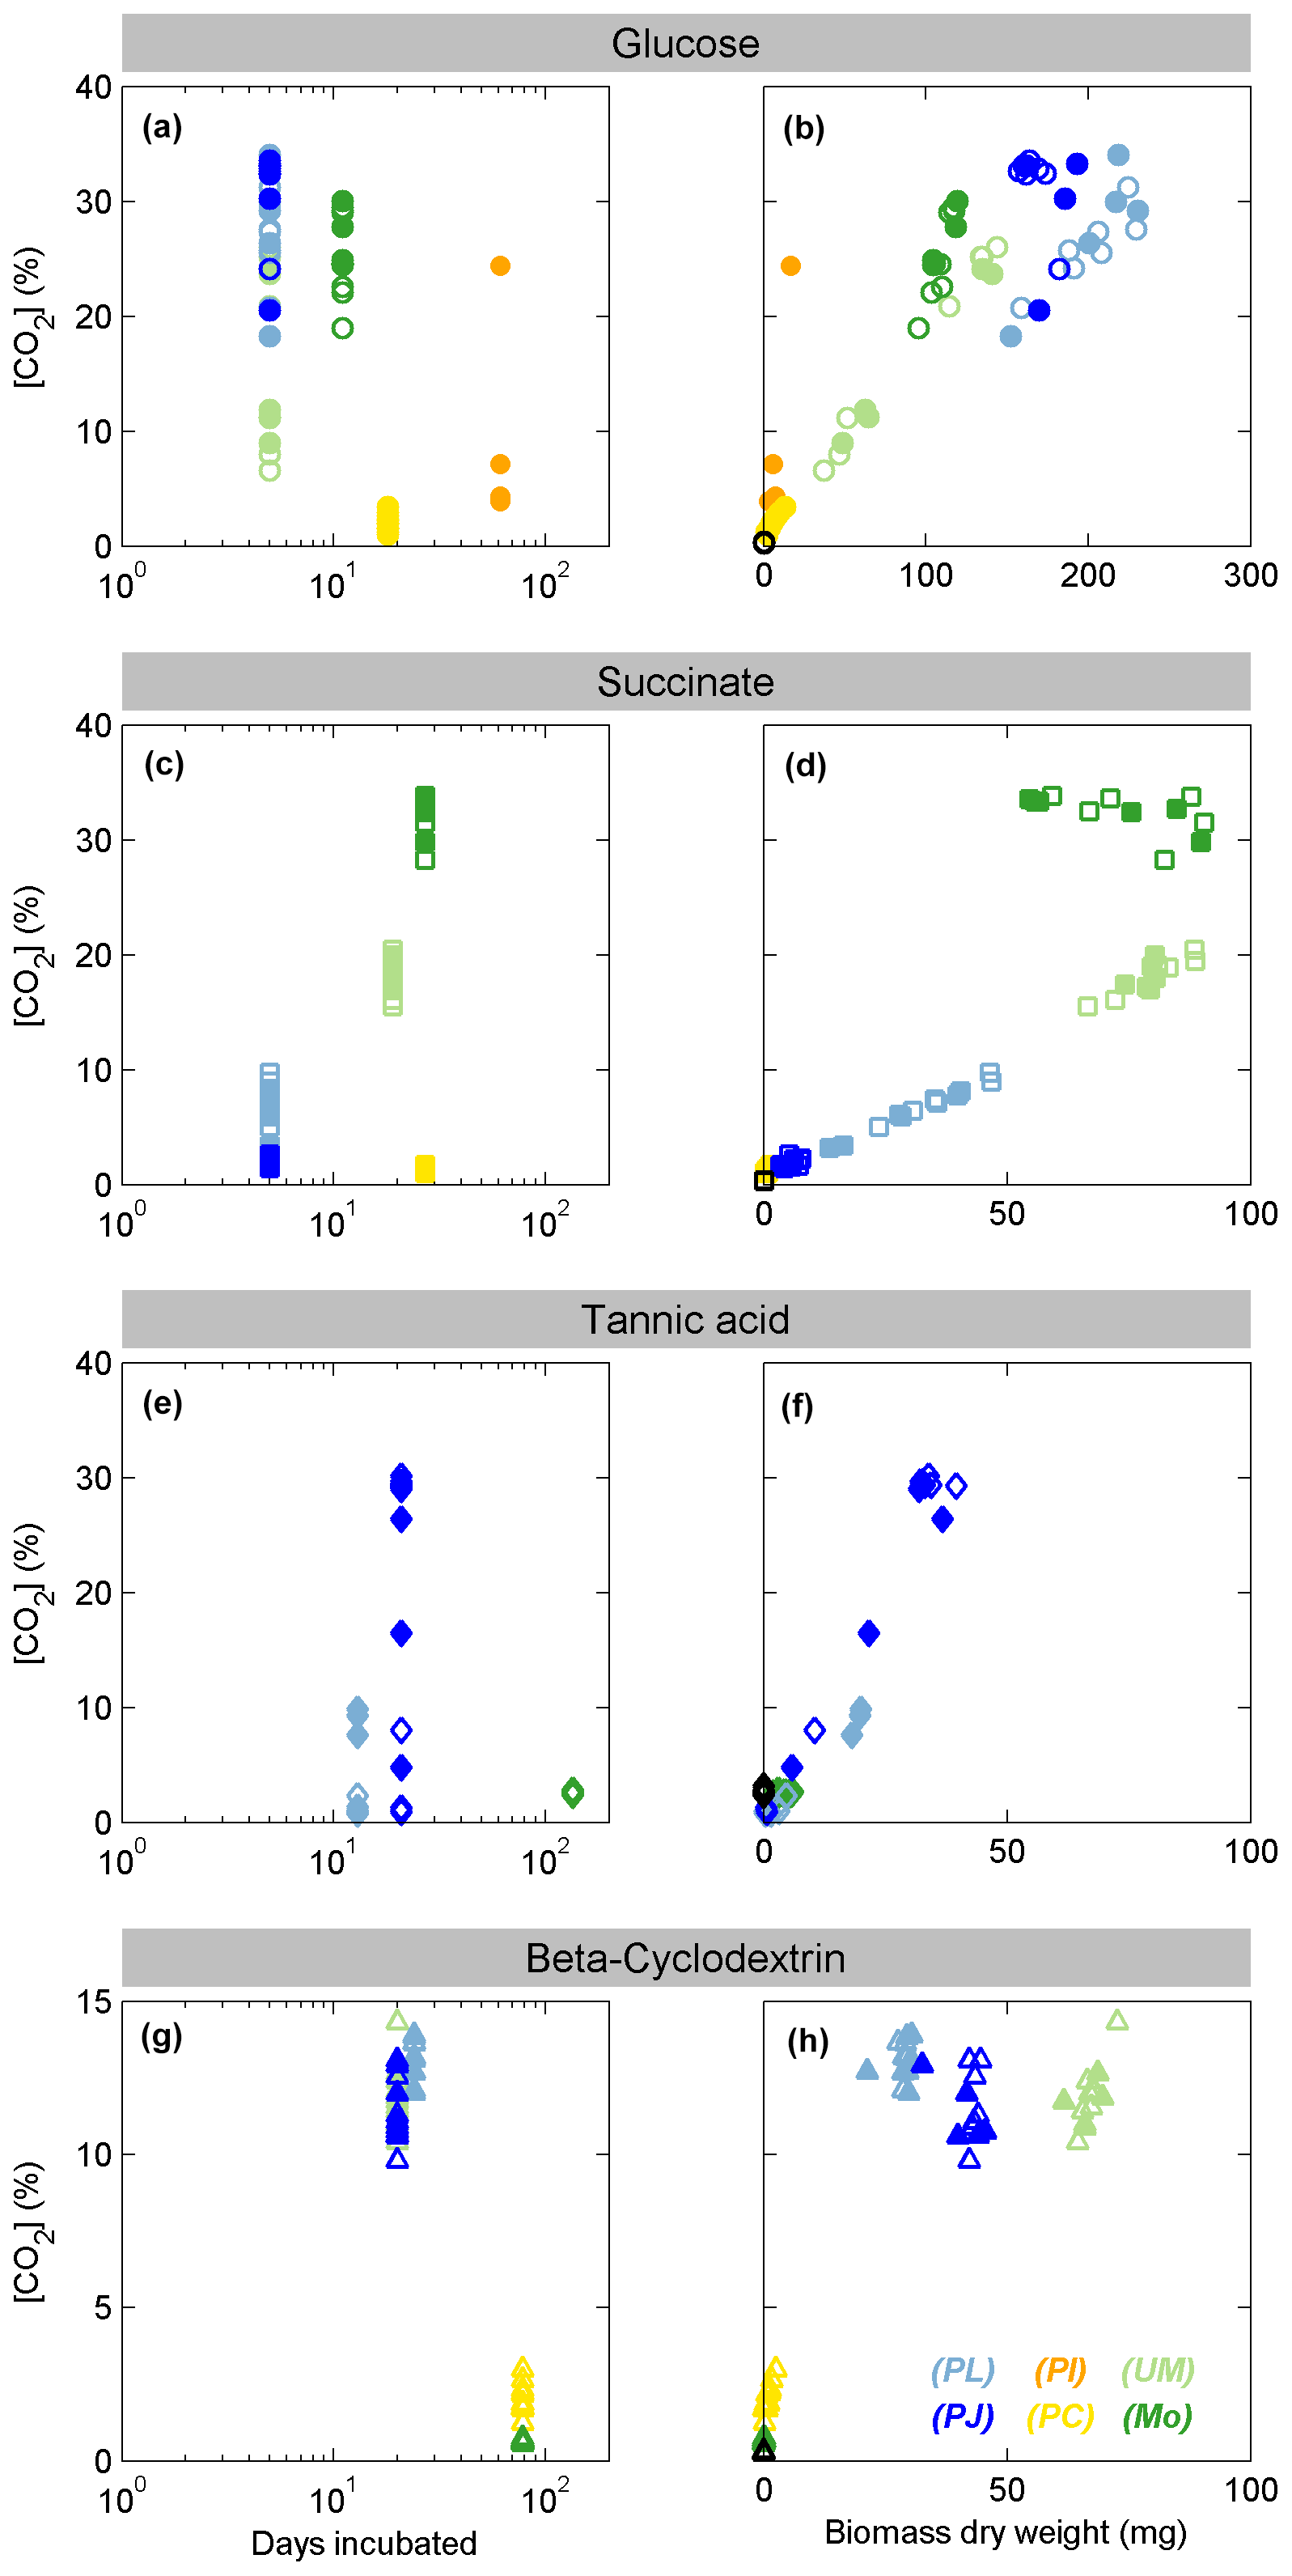
Figure 1Growth of fungal species on each substrate as indicated by production of CO2 versus days of incubation (left panels) or dry biomass (right panels). Filled symbols indicate samples for which the C18:2 biomarker was measured by Pyr-GC-IRMS. Colors represent the Ascomycota species Penicillium janczewskii (PJ, dark blue) and Paecilomyces lilacinus (PL, light blue), Zygomycota Mortierella sp. (MO, dark green) and Umbelopsis sp (UM, light green), and Basidiomycota species Phanerodontia chrysosporium (PC, orange) and Paxillus involutus (PI, yellow). The symbols denote incubations with glucose (a, b; circles), succinate (c, d; squares), tannic acid (e, f; diamonds), and β-cyclodextrin (g, h; triangles).
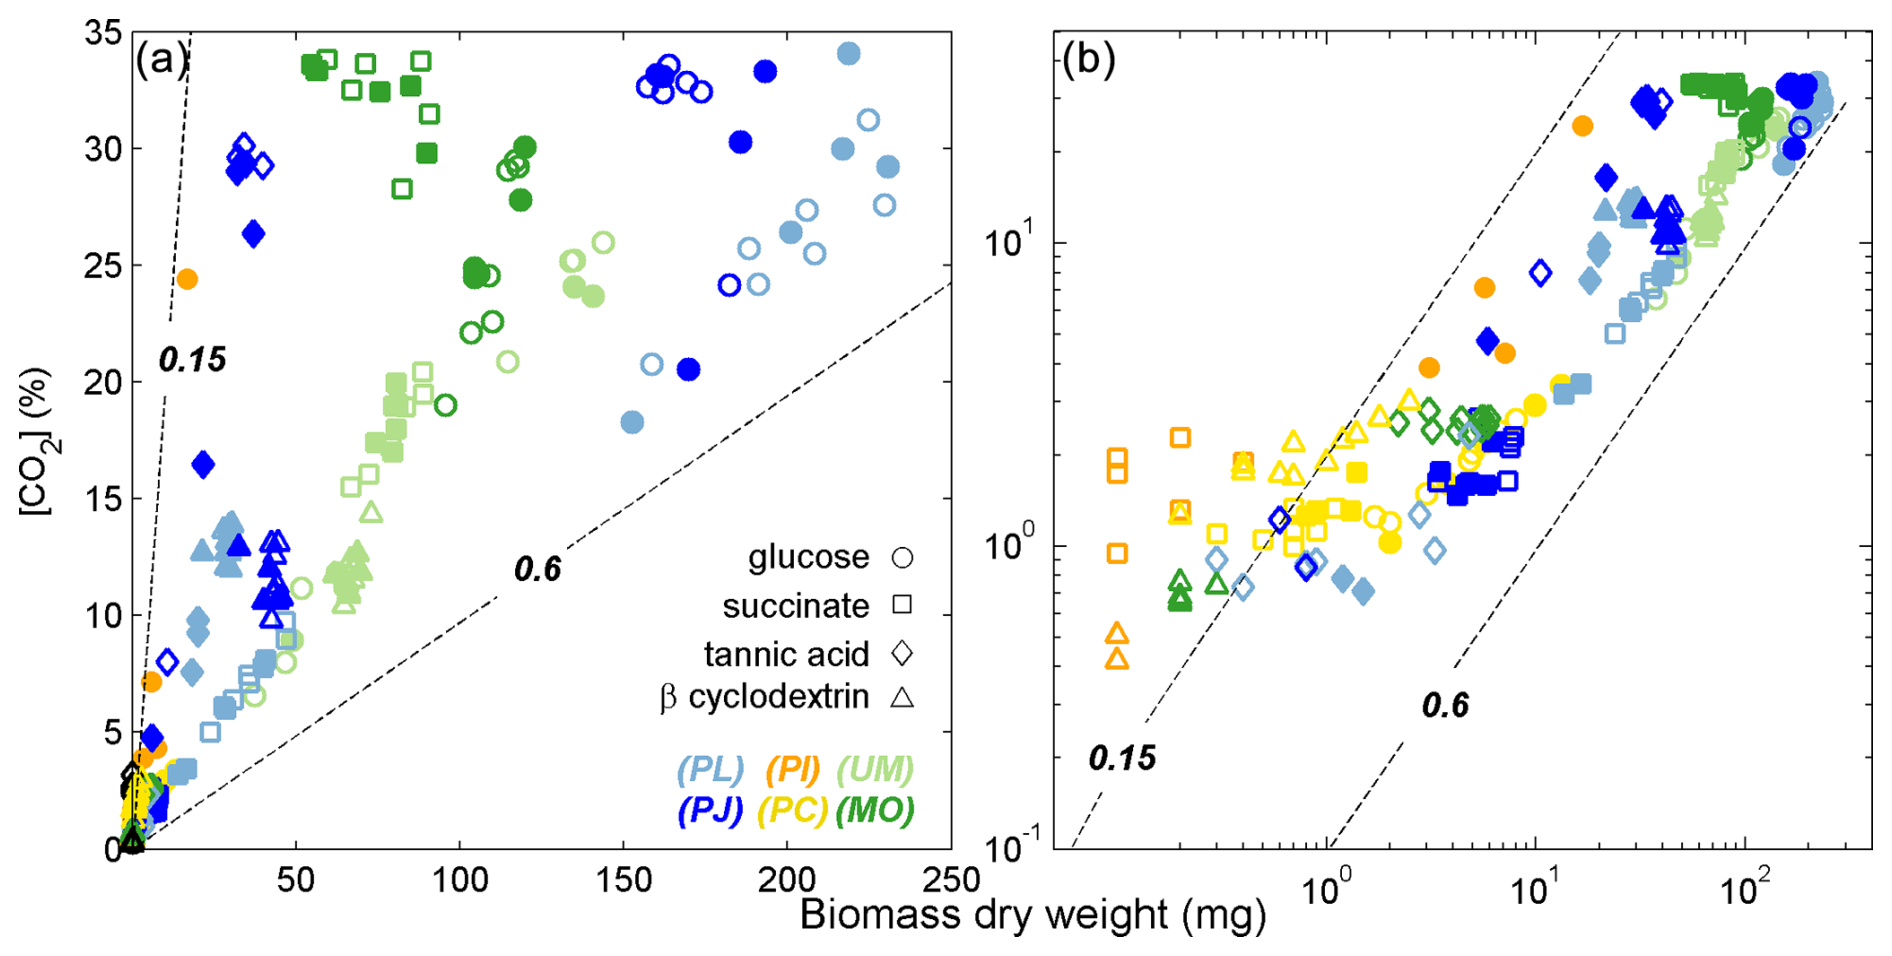
Figure 2Accumulation of biomass and headspace CO2 for fungal species from three phyla growing on monomers or complex substrates. Panel (b) includes the same data as panel (a) on a log–log scale to depict the trends of fungi exhibiting minimal growth. Lines indicate CUE trajectories of 0.15 or 0.6 and were calculated assuming that fungal biomass was 44 % C (). Colors and symbols are as in Fig. 1. Filled symbols indicate samples that were analyzed by Pyr-GC-IRMS.
The growth substrates induced a wide range in CUE values, ranging from 0.1 to 0.6 (Fig. 2). Higher CUE values were typically observed for Ascomycota and Zygomycota species growing on glucose and lower values for their growth on succinate and tannic acid. CUE estimated for Basidomycota species was always low (< 0.15). The CUE range for growth on glucose (0.1–0.6), β-cyclodextrin (0.1–0.6), and succinate (0.2–0.5) were larger than observed for tannic acid (0.15–0.3).
3.2 Stable isotopic composition of fungal lipids
Fungal respiration of the different (unlabeled) growth substrates led to decreasing δ13C-CO2 values as fungal biomass was produced, which followed a hyperbolic trend expected for the mixing of CO2 from two different sources (Text S1; see Kendall and Caldwell, 1998 in the Supplement). The atom % 13C in control incubations with no fungal inoculum was measured at the latest time of harvest of inoculated incubations and stayed below 0.4 %, except for incubations with tannic acid, where it ranged between 2 % and 3 %; the δ13C values of the substrates were glucose = −26.5 ‰; succinate = −28.3 ‰, tannic acid = −27.4 ‰, and β-cyclodextrin = −10.6 ‰. The mixing relationship was modeled using all CO2 data, across all incubations, and integrated to approximate the mixed weighted average 13F value of IC for each incubation (see Text S1, Fig. S2 in the Supplement), which was finally applied in the denominator of Eq. (1) to estimate the fraction of lipid-C derived from IC. For incubations that produced sufficient fungal biomass for stable C isotopic analysis, the weighted average δ13C values of IC that were applied in Eq. (1) ranged from 200 to 1400 ‰ (i.e., ∼ 1.3 to 2.6 AT % 13C) and were largely dependent on how much of the substrate was respired to CO2.
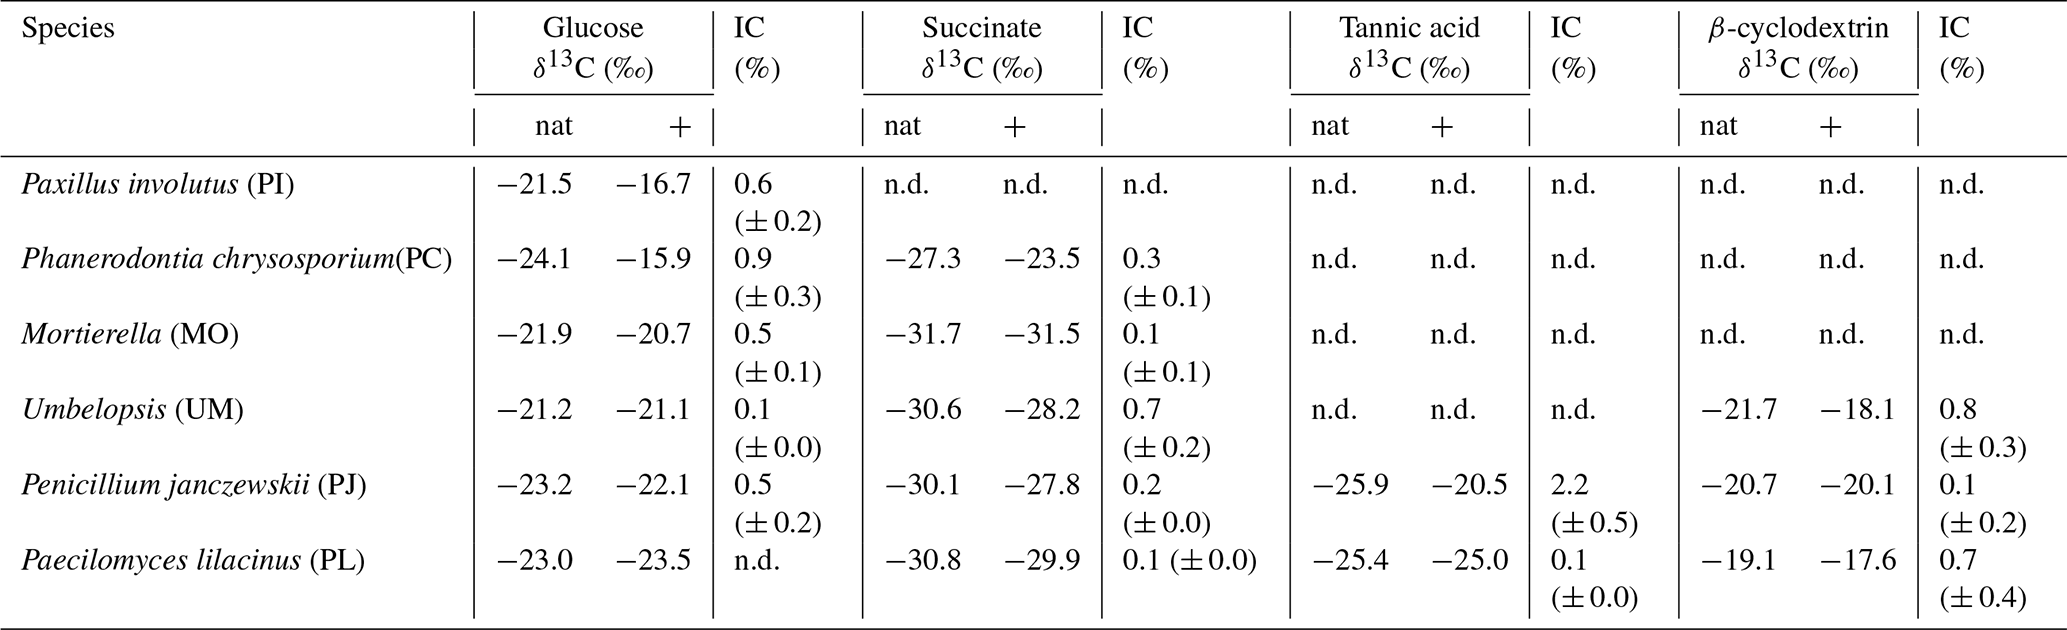
Table 1δ13C values of fungal biomarker C18:2 harvested from incubations with non-labeled substrates (nat) and those amended with 13C-labeled bicarbonate. Incorporation of inorganic C (% IC) was calculated based on Eq. (1). Errors represent the standard deviation of replicate incubations. Not all fungal species grew sufficiently on all substrates and thus % IC could not be determined (n.d.).
3.3 Carbon isotopes
The δ13C values of fungal biomarker fatty acid C18:2 (Table 1) produced under natural cultivation conditions with glucose (i.e., non-labeled; AT %DIC ∼ 1 %) ranged from −24.1 ‰ to −21.2 ‰ across all strains (n=6 species). As expected, C18:2 harvested from the labeled incubations exhibited slightly higher δ13C values (up to +11 ‰; PC grown on glucose) than the corresponding experiment amended with natural bicarbonate, likely owing to the incorporation of labeled IC into the C18:2 fatty acid.
The estimated incorporation of IC into C18:2 (% IC) typically extended up to 1 %; only PJ grown on tannic acid exhibited higher % IC values, which extended up to 2.2 % (Table 1, Fig. 3). There were no general trends observed in % IC with other measured or estimated parameters, including CUE; however, for the two species that were able to grow on tannic acid, % IC was positively correlated with the quantity of CO2 and biomass produced during the incubation (R2 > 0.85, n=5, p < 0.01).
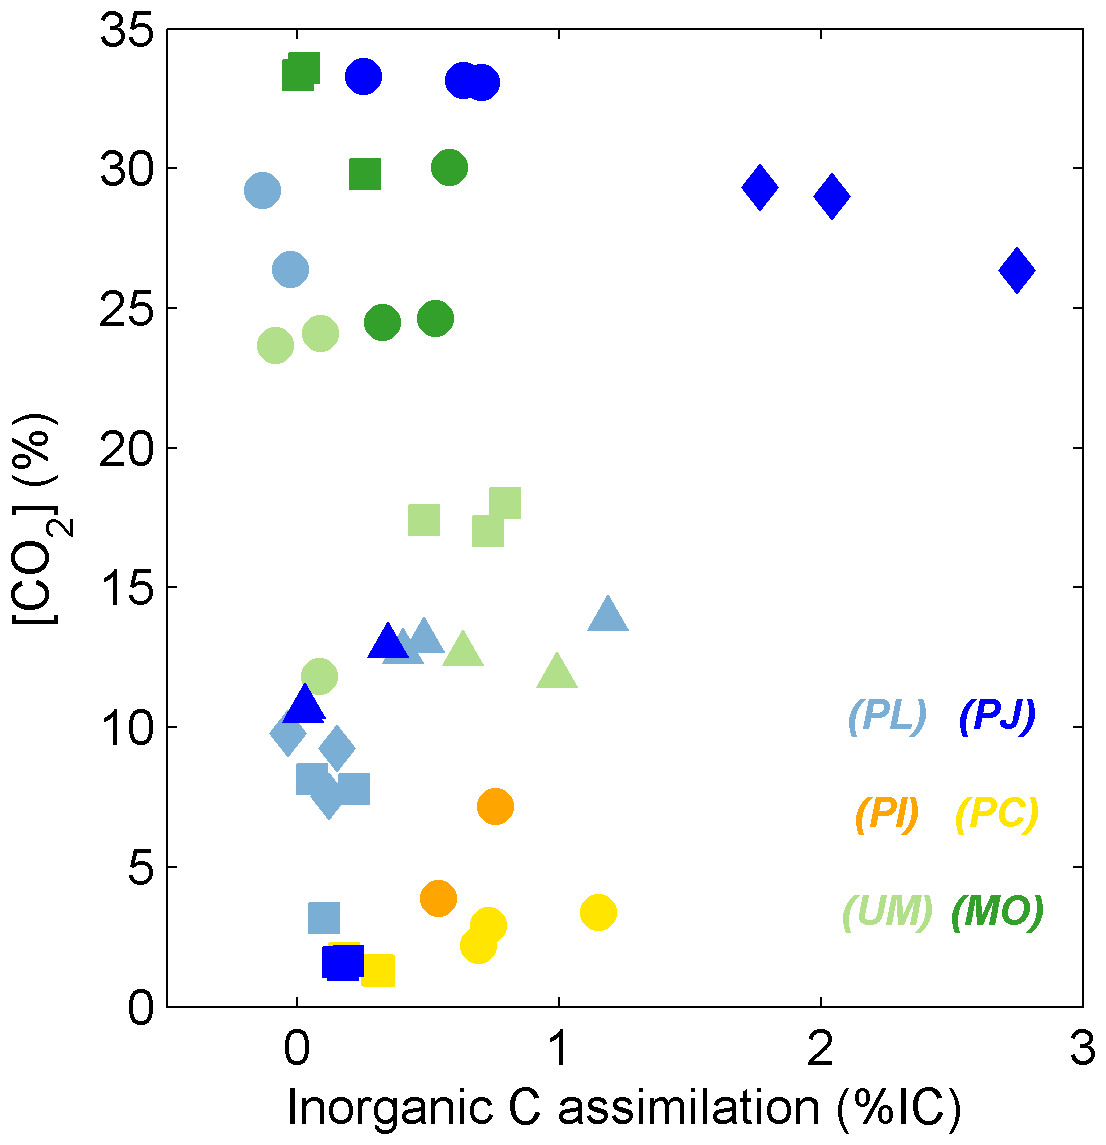
Figure 3% IC values for fungal species respiring glucose (circles), succinate (squares), tannic acid (diamonds), and β-cyclodextrin (triangles). Colors represent individual fungal isolates as described in Fig. 1.
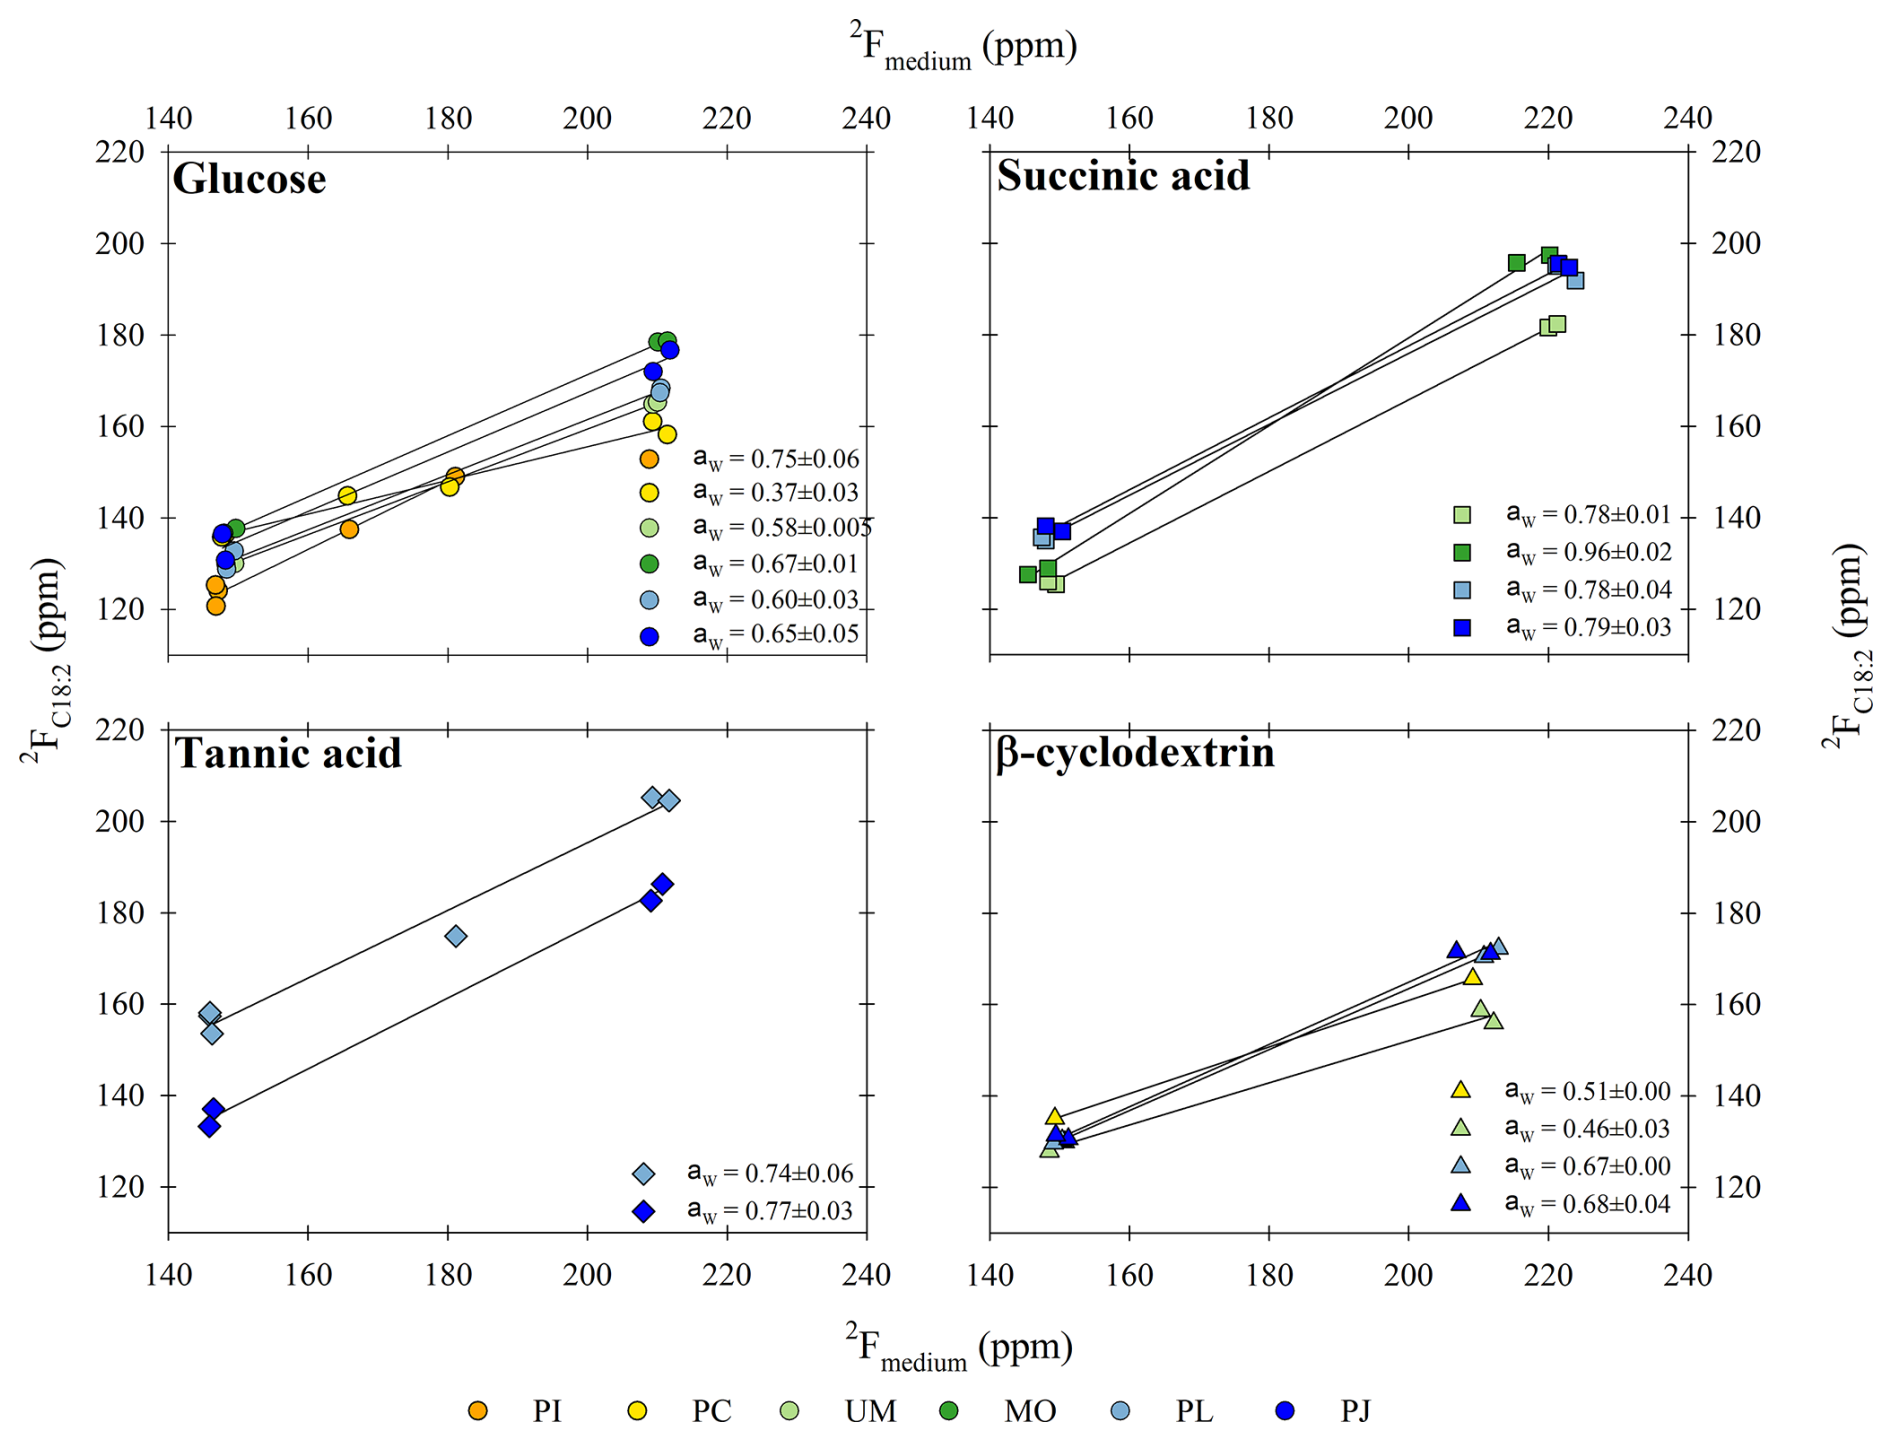
Figure 4The water hydrogen assimilation factor (aw values) estimated as the slope of the fractional abundance (2F) in lipids (y axis) versus medium water (x axis). Data are shown for fungal biomarker C18:2 produced during growth on the different substrates (glucose, succinic acid, tannic acid, and β-cyclodextrin) and harvested from the different fungal isolates (Paxillus involutus (PI), Phanerodontia chrysosporium (PC), Mortierella sp. (MO), Umbelopsis sp. (UM), Penicillium janczewskii (PJ), and Paecilomyces lilacinus (PL)). R2 values for all slopes were > 0.97.
3.3.1 Water assimilation factor (aw)
The “net” contribution of water hydrogen to lipid H is reported as the water hydrogen assimilation factor aw (Kopf et al., 2015, 2016) and was estimated based on the slope of the linear regression line between H isotopic composition of lipid versus growth medium water (Fig. 4), which ranged from natural MilliQ (δ2H = −45 ‰ ± 10 ‰) to the labeled treatments (65 ‰ ± 4 ‰; 166 ‰ ± 10 ‰; 368 ‰ ± 27 ‰). The aw values for the fungal biomarker C18:2 grown on glucose ranged from 0.37 ± 0.03 to 0.75 ± 0.06, with an average value of 0.60 ± 0.05 (n=6 species; ± SEM). When grown on succinic acid, the aw values for C18:2 harvested from individual species ranged from 0.78 ± 0.01 to 0.96 ± 0.02, with an average value of 0.83 ± 0.04 (n=4 species; ± SEM). When grown on tannic acid, the aw values for C18:2 harvested from individual species ranged from 0.74 ± 0.06 to 0.77 ± 0.03, and when grown on β-cyclodextrin the aw values for C18:2 ranged from 0.46 ± 0.03 to 0.68 ± 0.04, with an average value of 0.58 ± 0.06 (n=4 species; ± SEM). The average aw values for C18:2 for all substrates and species was 0.67 ± 0.04 (± SEM).
3.3.2 H isotope fractionation factors αC18:2/water and εC18:2/water
The range of traditionally reported isotope effects αC18:2/water and εC18:2/water (Sessions and Hayes, 2005) for all natural and 2H-labeled fungal growth experiments was 0.73 to 1.08 and −265 to +83 ‰, respectively (Table S1 in the Supplement). PL growth on tannic acid exhibited the highest values (0.97 to 1.08 and −35 to +83 ‰, respectively; Fig. 5, Table S1), while for all other growth experiments, αC18:2/water and εC18:2/water remained < 0.94 and −65 ‰, respectively. Considering only the growth experiments performed without label addition, the average (± SD) εC18:2/water values were not significantly different for fungi growing on glucose (−115 ± 34 ‰, n = 13), succinate (−111 ± 35 ‰, n = 8), or β-cyclodextrin (−133 ± 7 ‰, n = 6), but growth on tannic acid elicited significantly higher values (+12 ± 81 ‰, n = 5; p < 0.01, two-tailed homoscedastic t test). Within-species comparisons revealed that both Zygomycota species (Mortierella and Umbelopsis) exhibited significantly more negative εC18:2/water values when grown on succinate (−127 ± 6 and −155 ± 8 ‰, n = 2) versus glucose (−78 ± 3 and −127 ± 5 ‰, respectively, n = 2; p < 0.05). The only other significant differences in εC18:2/water values were observed for growth of the Ascomycota species P. lilanicus, for which growth on tannic acid (+71 ± 18 ‰, n = 3) yielded higher values than on glucose (−122 ± 15 ‰, n = 2), succinate (−84 ± 6 ‰, n = 2), and β-cyclodextrin (−132 ± 2 ‰, n = 2; all p < 0.01); the εC18:2/water values for growth on succinate and β-cyclodextrin were also significantly different (p < 0.01).
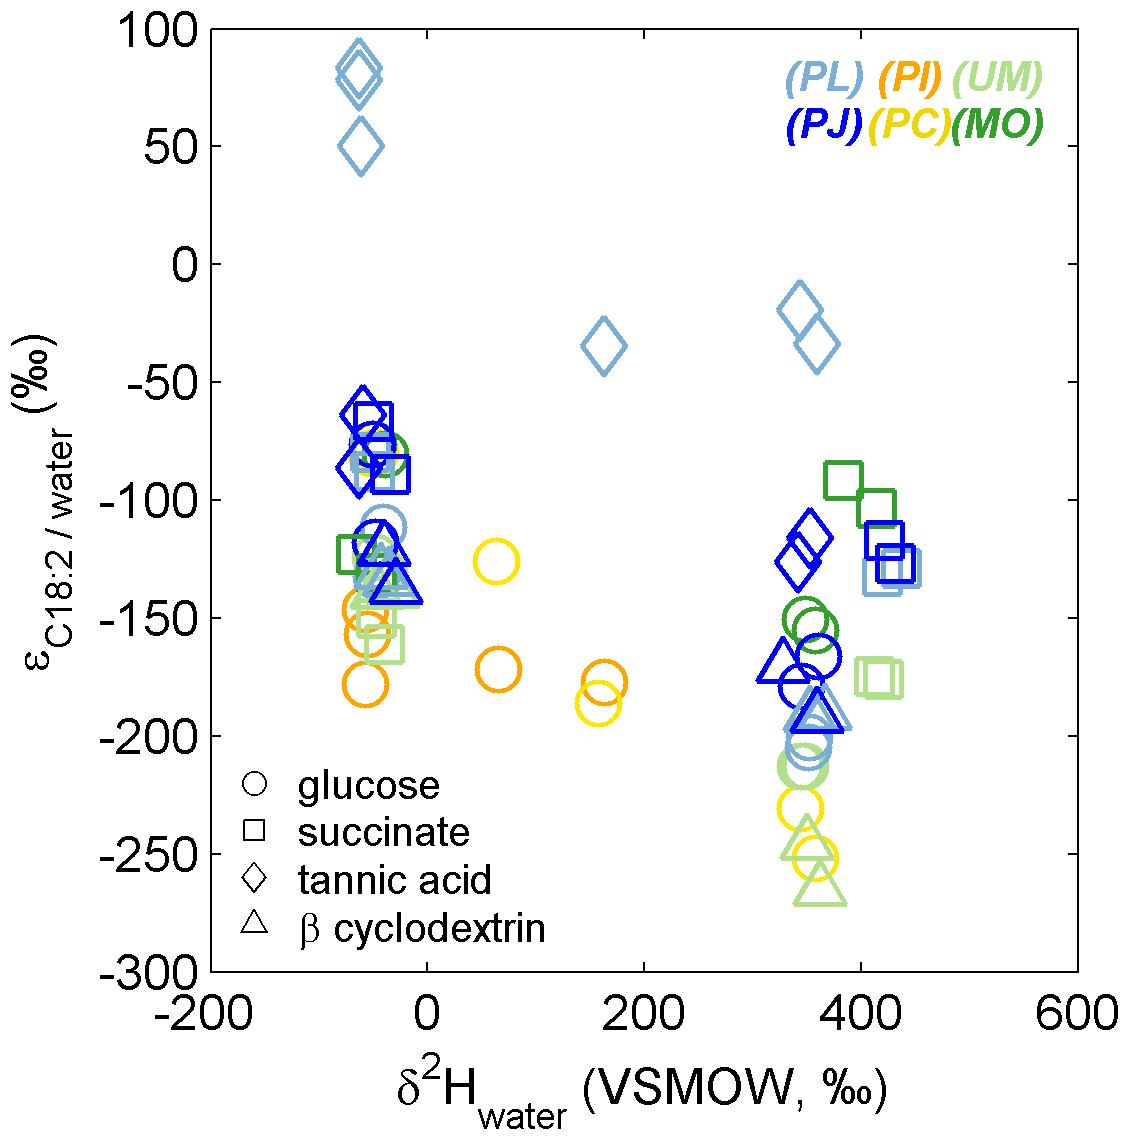
Figure 5The apparent isotope effect (εC18:2/water) for fungi grown in medium having variable δ2Hwater composition. The colors and symbols are as in Fig. 1. For each species–substrate pair, the large range and/or decrease in εC18:2/water in 2H-enriched medium are expected, given the additional contributions of substrate-H and metabolic water-H to lipid-H during biosynthesis.
4.1 Fungal growth dynamics
Collectively, the fungal incubation experiments included six species representing three different phyla growing on one of four substrates, and exhibited a large range in the relative quantity of CO2 (0.2 %–34 % ) and biomass produced (0–230 mg dry weight; Fig. 1), with CUE ranging from 0.15 to 0.6 (Fig. 2). While atmospheric, oxic conditions likely prevailed during most of the incubation period, it is probable that some incubations turned anoxic when CO2 levels exceeded 21 %, which occurred in incubations of Ascomycota and Zygomycota growing on glucose, Ascomycota growing on tannic acid, and Zygomycota growing on succinate. The accumulation of CO2 was a necessary consequence of performing the incubations in closed bottles, which was required to prevent the escape of 13C-labeled IC and also to prevent microbial contaminations. Nevertheless, such alteration between oxic and anoxic conditions is common in natural environments, and the measured IC assimilation into fungal lipids was consistently low (< 3 %; Fig. 3), regardless of the implied anoxia. Furthermore, the observed variability in CUE, % IC, and aw between growth experiments was not correlated with large increases in headspace CO2.
4.2 Fungal IC assimilation into lipids
A fundamental process in nature and the basis for ecological food webs is the fixation of IC via photosynthesis and/or chemosynthesis by autotrophic organisms. The IC assimilation by heterotrophic organisms also plays an important role in ensuring the provision of energy and in replenishing intermediates in the TCA cycle that have been released for biosynthesis (Kornberg, 1965). Therefore, IC assimilation is a proxy for both anabolic processes and the catabolic status of the cell, influenced by assimilation, biosynthesis, anaplerotic reactions, and redox-balancing reactions (Braun et al., 2021; Erb, 2011). Previous estimates of the by-fixation of IC (% IC) via anaplerotic pathways into heterotrophic biomass varied between 1 % and 8 % (Dijkhuizen and Harder, 1985; Feisthauer et al., 2008; Romanenko, 1964; Roslev et al., 2004), whereas for fungi it was previously reported to amount to roughly 1 % (Sorokin, 1961; Schinner and Concin, 1981; Schinner et al., 1982) and was recently shown to vary between 2 % and 12 % for Ascomycota when grown on glucose or glutamic acid (Jabinski et al., 2024). Our results, focusing on a specific fatty acid biomarker, demonstrate a low range in % IC for all different substrates and species tested in this study (0 %–3 %), with the Ascomycota (0 %–2 %) assimilating relatively less IC than previously reported species (4.6 % ± 1.6 %; Jabinski et al., 2024). The highest observed incorporation was 2.2 ± 0.5 % by Penicillium janczewskii (PJ, n = 3) when grown for 21 d on tannic acid (Table 1; Fig. 3). Only the other Ascomycota species, Paecilomyces lilacinus (PL), grew sufficiently on tannic acid (up to 10 % CO2 and 20 mg dry weight after 13 d; % IC = 0.14 ± 0.02 %, n=3; Figs. 1 and 3), suggesting that increased assimilation of IC by PJ may have occurred during the extra week of incubation and promoted higher biomass production. The high CO2 levels also suggest that the incubations of PJ with tannic acid may have turned anoxic, which may also explain the higher IC incorporation in these incubations. Overall, heterotrophic IC assimilation does not appear to be a hallmark of any of the variety of fungal taxa or catabolic pathways probed in this study.
4.3 Water hydrogen incorporation into fungal lipid biomarker C18:2
As demonstrated previously, the regression slope between hydrogen isotopic composition of water medium and microbial lipids (i.e., aw) varies with the type of metabolism (Zhang et al., 2009; Valentine, 2009; Wijker et al., 2019; Jabinski et al., 2024), and importantly for heterotrophs, a non-negligible proportion of hydrogen may derive from sources other than ambient water. For fatty acid biosynthesis, H incorporation is suggested to be a function of transporters and electron acceptors (NADPH and NADH), with contributions accounting for around half of all lipid hydrogen (Maloney et al., 2024). The remaining part comprises equal contributions of H obtained directly from environmental water or acetyl-CoA (Valentine, 2009; Zhang et al., 2009; Caro et al., 2023). The consensus from previous studies that investigated the lipids of heterotrophic bacteria is that microbial heterotrophs exhibit aw values ranging from 0 to 1, with a mean of 0.71 ± 0.17 (e.g., Caro et al., 2023), though some organisms have exhibited aw values exceeding 1 (Dirghangi and Pagani, 2013; Jabinski et al., 2024). Jabinski et al. (2024) demonstrated that five species of heterotrophic Ascomycota exhibit similar aw values (0.62 ± 0.04) for the fungal biomarker C18:2 during growth on glucose. Zhang et al. (2009) reported similar aw values for E. coli grown on glucose (0.63 ± 0.03). In the current study, aw values for the fungal biomarker C18:2 during growth on glucose (0.60 ± 0.05) were agreeable with Jabinski et al. (2024) but were more variable, likely owing to the broader phylogenetic coverage of the current study.
The large variability in εC18:2/water estimates (Fig. 5; Table S1) can be partly attributed to the large range in δ2H of medium water, which contributes H together with the substrate and metabolic water to determine δ2HC18:2, even though the net isotope effect (αC18:2/water) may be consistent for a specific species–substrate pair (Session and Hayes, 2005; Kopf et al., 2015). In other words, εC18:2/water values do not account for the admixture of H sources that also affect δ2HC18:2 of heterotrophic fungi. More robust differences were observed in aw values both between and within the different phyla and substrates tested.
4.3.1 Trends across fungal phyla
For incubations in which the Zygomycota isolates produced enough biomass to determine aw (i.e., glucose, succinate, β-cyclodextrin; n=5; Fig. 4), we observed a highly significant inverse correlation with CUE (R2 = 0.87, p < 0.01; Fig. 6), suggesting coupling of aw with growth efficiency. Presumably, the proportion of substrate-derived H incorporated into lipids increases with more efficient incorporation of substrate C into biomass. Ascomycota exhibited the most consistent aw values among phyla when grown on each of the four different substrates (0.63 ± 0.03 (glucose); 0.78 ± 0.01 (succinate); 0.76 ± 0.02 (tannic acid); 0.67 ± 0.01 (β-cyclodextrin)) but also the largest variability in CUE (0.08–0.59; Fig. 2). CUE and aw exhibited a similar trend as observed for Zygomycota isolates but were not significantly correlated across incubations of Ascomycota, Basidiomycota only produced sufficient biomass when fed substrates that activated the glycolytic pathway (glucose or β-cyclodextrin; CUE < 0.3) yet showed high variability in aw between species (0.37 ± 0.03 < aw < 0.75 ± 0.06; Fig. 4), which was beyond the more confined range of aw values determined for isolates belonging to Zygomycota and Ascomycota.
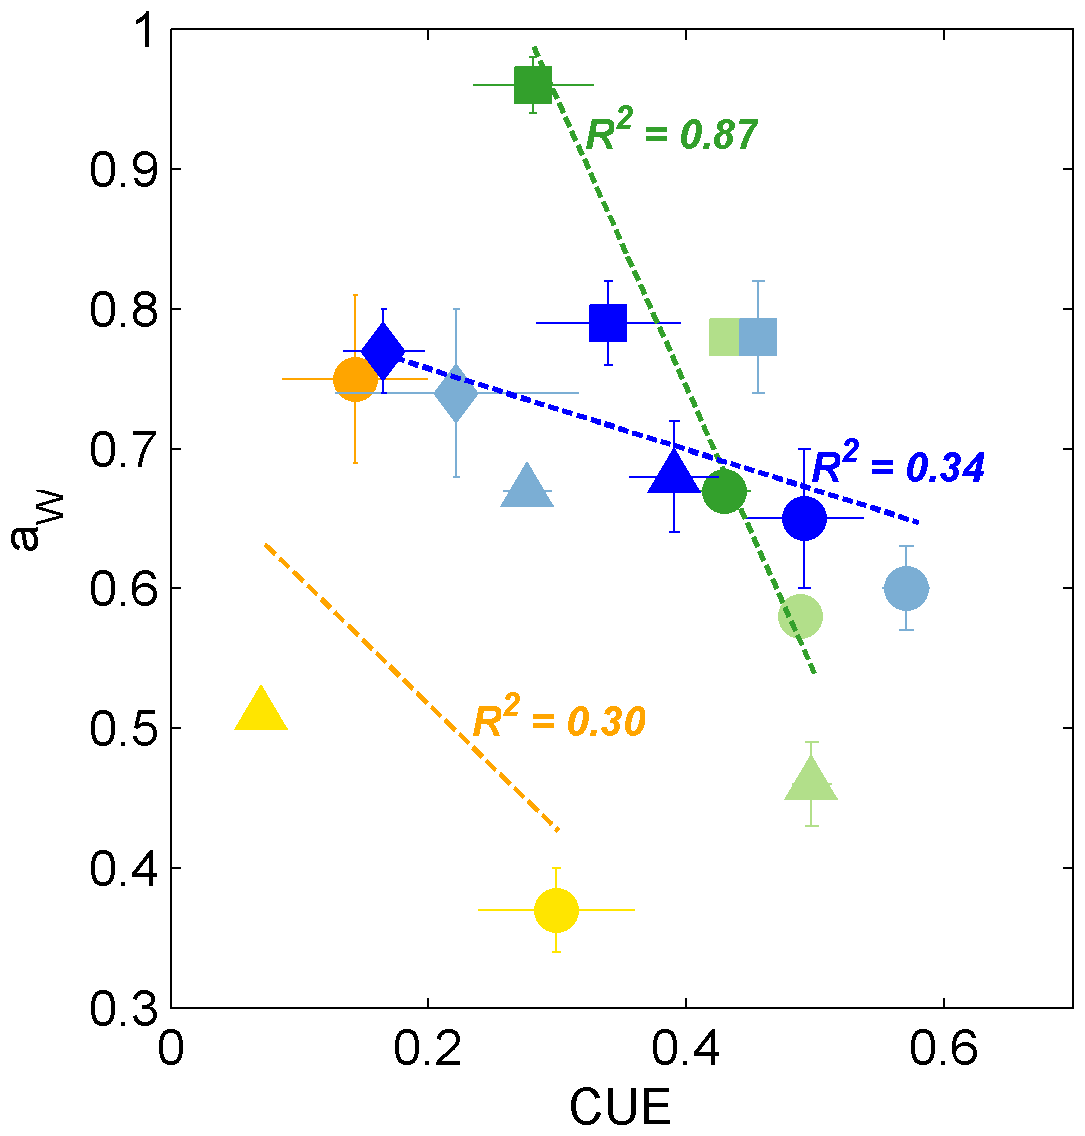
Figure 6Biplot of CUE and aw values for fungi growing on glucose (circles), succinate (squares), tannic acid (diamonds), and β-cyclodextrin (triangles). The colors are as in Fig. 1, representing the phyla Ascomycota (blue shades, n=8), Zygomycota (green shades, n=5), and Basidiomycota (yellow and orange symbols, n=3). The dashed lines and R2 values indicate the linear regression for the corresponding phylum across all substrates that yielded sufficient biomass. Only the regression for Zygomycota was significant (p < 0.01).
4.3.2 Trends across C substrates
Across all incubations, the similar aw values determined for growth on glucose (0.60 ± 0.05) versus β-cyclodextrin (0.58 ± 0.06), of which the latter consists of seven glucopyranose units (C6H12O6), suggest that the catabolism of glucose subunits via glycolysis overprints signals of water-H incorporation that may occur during degradation of the β-cyclodextrin oligomer. Alternatively to glycolysis, succinate yielded significantly higher aw values (0.83 ± 0.05), which were in the same range as reported for C. oxalaticus when grown on succinate (aw 0.80 ± 0.05; Zhang et al., 2009) and were more similar to that reported previously for fungal growth on glutamic acid (0.90 ± 0.07; Jabinski et al., 2024). Considering all fungal incubations, a one-way analysis of variance (ANOVA; Holm–Sidak method; SigmaPlot v11) confirmed the significant difference in aw values between growth on glucose and glutamic acid (p < 0.001), glutamic acid and β-cyclodextrin (p < 0.001), succinate and glucose (p < 0.003), and succinate and β-cyclodextrin (p < 0.005). It also confirmed that there was no significant difference between the other substrate combinations (p > 0.05).
Glutamic acid and succinate are thought to be introduced into the TCA cycle through coupled metabolites, where succinate is a direct metabolite of the TCA cycle and glutamic acid is converted to α-ketoglutarate by transamination before entering the TCA cycle, which is only two steps from succinate (Cooper and Kuhara, 2014). Also, being acids, these substrates may have a greater capacity than saccharides to exchange H with ambient water at experimental pH (typically 2 < pH < 5.2), especially glutamic acid, which also comprises an amino moiety. Tannic acid (0.76 ± 0.02) yielded no significant differences (p > 0.05) from the other substrates and is reported to be degraded to different subunits including gallic acid and glucose (Banerjee and Mahapatra, 2012; Lekha and Lonsane, 1997, and references within). Aromatic degradation pathways employed by fungi generate intermediates that go through the β-ketoadipate pathway (Mäkelä et al., 2015) before entering the TCA cycle as a succinyl-CoA metabolite (Lekha and Lonsane, 1997). The aw values induced by degradation of tannic acid suggest that it integrates both the lower aw signature of glycolysis the and higher aw signature of the TCA cycle (Fig. 7).
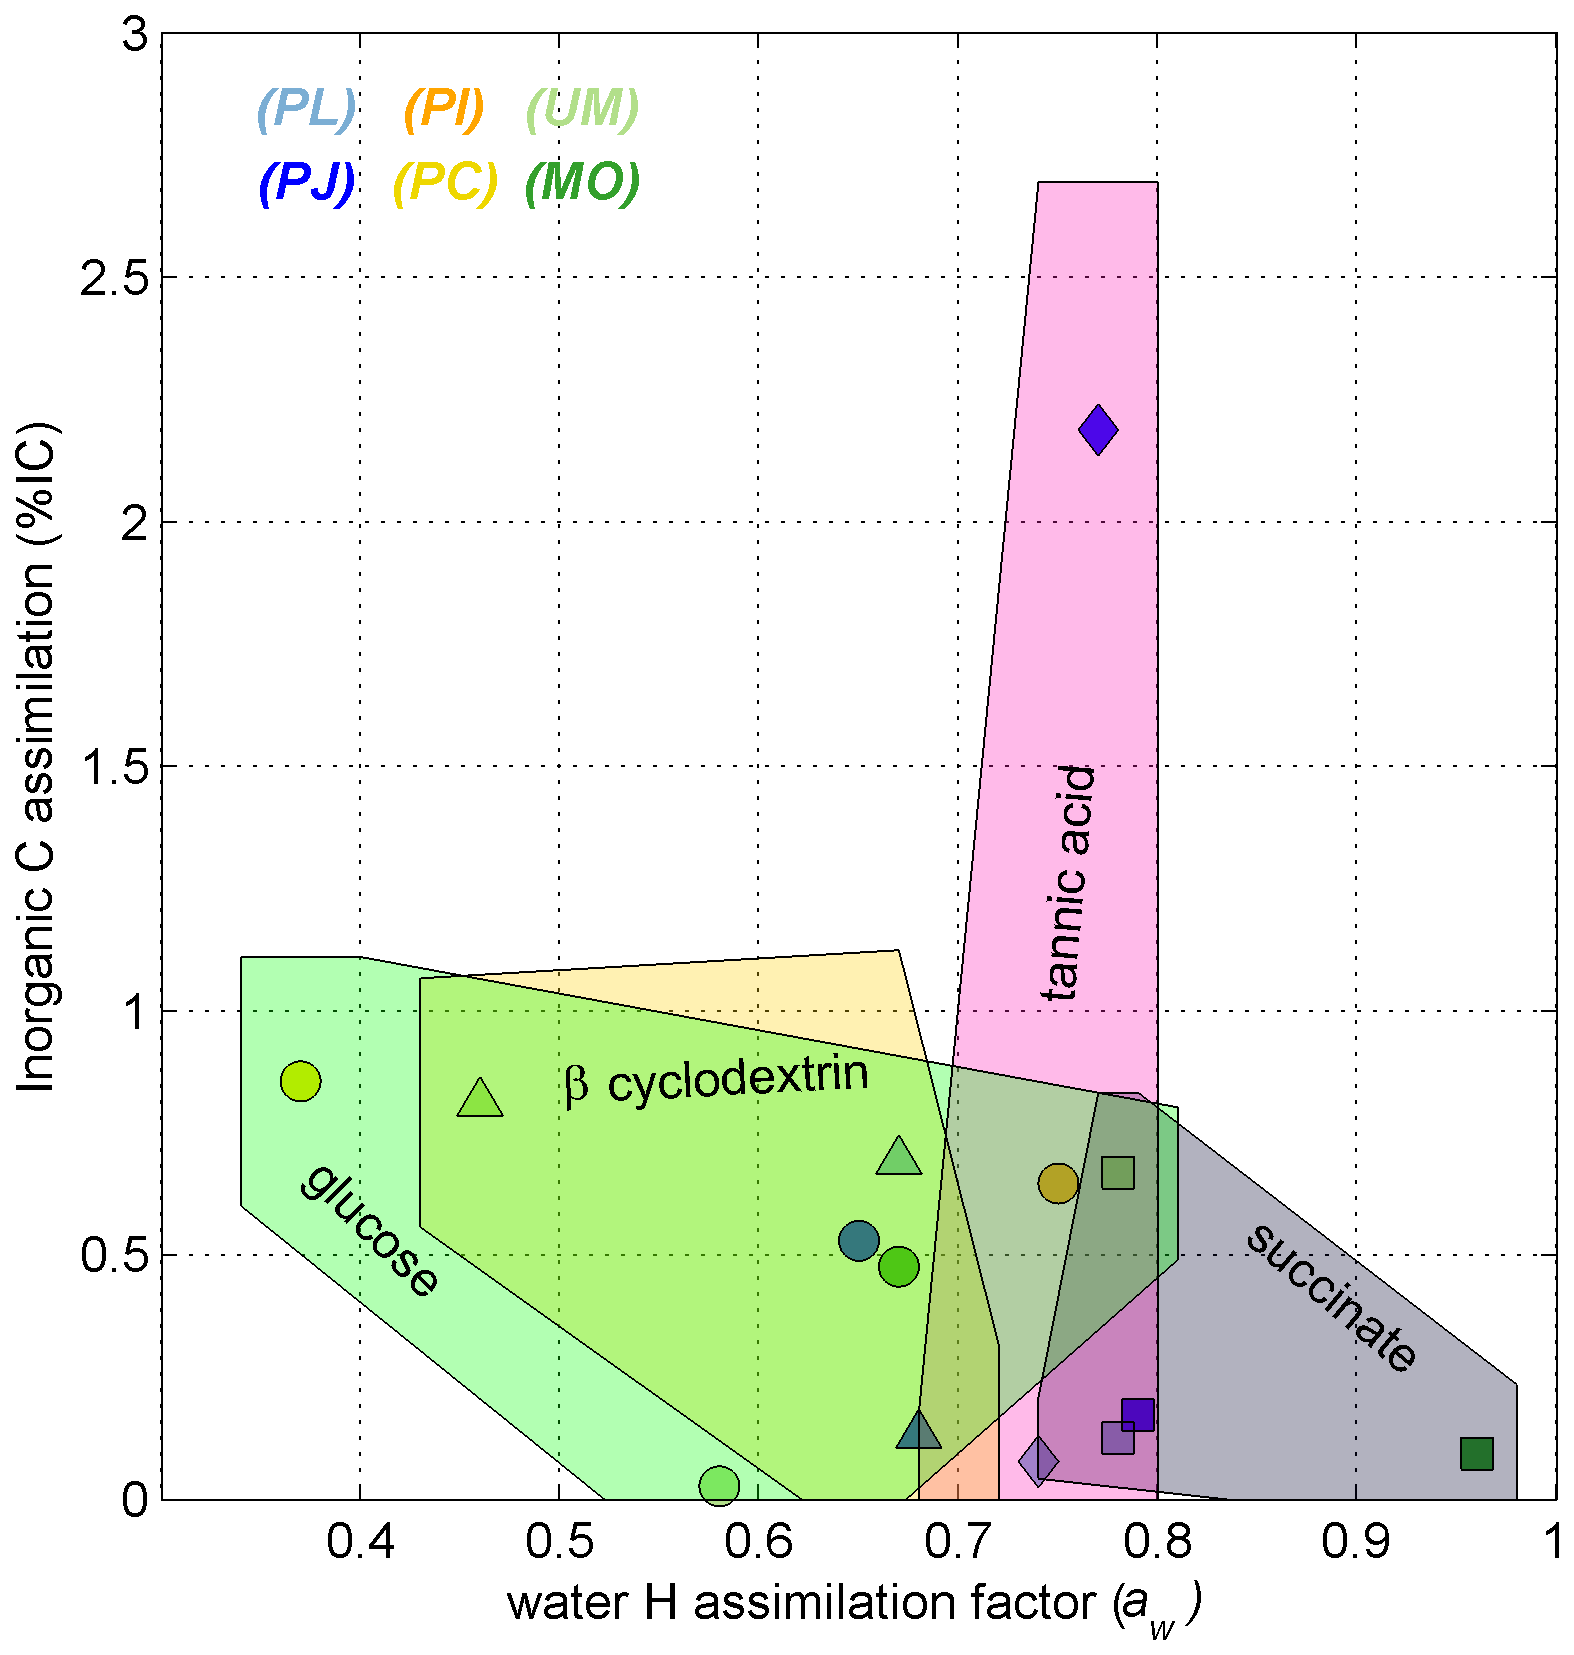
Figure 7Scatterplot of % IC and aw values for C18:2 harvested from incubations of Ascomycota (blue symbols), Basidiomycota (yellow and orange symbols), and Zygomycota (green symbols). The shaded polygons span the range of % IC and aw values (± propagated error) for fungal growth on glucose (circles, green shape), succinate (squares, gray shape), tannic acid (diamonds, pink shape), and β-cyclodextrin (triangles, yellow shape). Each data point represents one species–substrate pair determined for n > 4 growth experiments.
Together, our incubation experiments suggest that aw values determined for the fungal biomarker C18:2 could not distinguish between fungal growth on relatively labile monomers (i.e., glucose and succinate; requiring as few as 5 d of cultivation) versus larger, less-labile substrates (i.e., β-cyclodextrin and tannic acid; requiring 20 to 183 d of cultivation). However, aw values of fungal lipid biomarkers may be indicative of fungi employing primarily glycolytic or TCA pathways. Environmental assays that quantify fungal lipid production via the incorporation of ambient water-H (i.e., the lipid-SIP approach) may upscale to total production estimates by applying our calculated mean aw value of 0.69 ± 0.03 (n=27; ± (SEM)), which is consistent with the aw value of 0.71 recommended for soil microbial communities (Caro et al., 2023). For 2H-SIP investigation of fungal ecotypes supplied with TCA metabolites, such as mycorrhiza, the aw value of C18:2 may extend up to 0.83 ± 0.05. Similar approaches could be applied to environmental samples, such that the aw values of phospholipids containing C18:2 fatty acids could inform the distribution of predominant metabolic ecotypes across a soil profile.
Comparisons of net fractionation factors (i.e., ; Table S1) estimated in the current study with previous reports are most relevant for those derived from our natural abundance incubations. However, we note that these estimates were determined for a fewer number of replicates (n = 2 or 3) and represent the distinct value relative to our laboratory water (δ2H = −49 ‰), which differs from labeled treatments (Table S1) and likely natural systems having a significantly different . Fungal isolates that could successfully grow on tannic acid exhibited the highest values, which is likely manifested by NADPH production and turnover (e.g., Wijker et al., 2019). Both the Zygomycota isolates investigated in the current study (Mortierella and Umbelopsis) exhibited relatively strong fractionation of during growth on succinate (
,< −123 ‰), in contrast with the trends observed for Ascomycota isolates and previous reports of heterotrophic bacteria (e.g., Zhang et al., 2009), where values are typically higher for succinate relative to other C substrates. Together, the relatively strong fractionation (i.e., low ) and high water isotope incorporation efficiency (aw) suggest these Zygomycota isolates employ an alternative catabolic pathway for succinate, resulting in minor incorporation of succinate-derived H into C18:2.
4.4 Dual-SIP approach
Dual-SIP experiments with 2H2O and 13C-dissolved IC previously highlighted the potential to track microbial activity and distinguish heterotopic vs. autotrophic metabolic modes within environmental settings and pure cultures (Kellerman et al., 2012, 2016; Wegener et al., 2012; Huguet et al., 2017; Wu et al., 2018, 2020). This approach was also previously applied to investigate fungal pure cultures (Jabinski et al., 2024), in which the plot of assimilation of IC versus water-H into the fungal biomarker C18:2 could distinguish five Ascomycota species growing on glucose or glutamic acid, with aw values explaining most of the variability. While calculated IC:aw values are useful to distinguish autotrophic from heterotrophic growth (see Wegener et al., 2016), all calculated values in this study remained near zero, with % IC ranging up to 3 % and aw values ranging from 0.37 to 0.96 (Fig. 4). This pure culture study therefore suggests that fungal assimilation of IC is low and less insightful than the more distinguishable aw values for identifying the relative contributions of fungal phylotypes or ecotypes in environmental assays.
The purpose of this work was to apply the dual-SIP assay on pure fungal cultures to define the effect of different organic C substrates on the incorporation of water-H and IC into their membrane lipids. Although heterotrophic CO2 fixation by microbes may extend up to 8 % of biomass C, the IC assimilation into the fungal biomarker C18:2 harvested from six species representing Ascomycota, Basidiomycota, and Zygomycota did not vary consistently between species or substrate, and remained below 3 %. Our findings suggest that the fungal catabolic pathways activated by the variety of substrates tested in this study cannot fully account for the higher levels of heterotrophic CO2 incorporation reported in natural systems. However, Penicillium janczewskii, the species that was most successful at respiring tannic acid, also exhibited the highest % IC value of all incubations (Figs. 3 and 7), suggesting that fungal degradation of similarly complex substrates may rely in part on the assimilation of IC (e.g., via anaplerotic reactions). The use of SIP to estimate % IC of heterotrophs required (i) a closed system to prevent loss of labeled 13C to the atmosphere and (ii) a high labeled dose to contend with the accumulation of CO2 respired from growth substrate. These conditions intensified upon decreases in pH during the growth experiments, thereby shifting the speciation of IC toward CO2, which may have further, yet unknown, consequences for anaplerotic incorporation of the IC. Future applications for determining % IC for microbial heterotrophs should consider repeated spiking or continuous cultivation practices to better stabilize pH and δ13CDIC. Likewise, it would be worth considering isotopic analyses of other potential bioindicator compounds (e.g., sterols, peptides, aminosugars) to see whether incorporation of the IC into such other compounds would render higher levels than fatty acids.
In contrast to % IC, we conclude that substrates that activated the glycolysis pathway yielded significantly lower aw values than those catabolized as TCA intermediates. The relatively high values harvested from fungi grown on tannic acid may further help to distinguish fungal ecotypes growing on complex aromatic-containing substrates in natural systems. The expanded aw dataset reported in this study suggests that the accuracy of fungal production estimated by 2H-lipid SIP experiments can be improved by applying the average aw value of 0.69 for saprotrophic fungi or up to 0.83 for mycorrhizal fungi. Furthermore, determination of aw values in environmental 2H-SIP assays may be useful to identify the relative contributions of fungal ecotypes that rely on C substrates fueling glycolysis (e.g., leaf litter) versus those that are fed primarily by TCA intermediates (e.g., root or microbial exudates). Lastly, to our knowledge, the two Zygomycota strains investigated in this study provide the first evidence of a potential correlation between aw and CUE (Fig. 6), encouraging further exploration of the link between these two parameters, both of which are coupled to microbial central metabolic pathways.
The data presented in the figures and tables are available in supplementary material (Table S1) and will be made available on the Fractome Database (https://fractome.caltech.edu/, Sessions, 2025).
The supplement related to this article is available online at https://doi.org/10.5194/bg-22-3127-2025-supplement.
SJ: conceptualization, data curation, formal analysis, investigation, methodology, software, validation, visualization, writing – original draft, writing – review and editing. VK: investigation, methodology, resources, writing – review and editing. MK, formal analysis, methodology, resources, validation. JJ: conceptualization, formal analysis, methodology, resources, validation, writing – review and editing. TBM: conceptualization, data curation, formal analysis, funding acquisition, investigation, methodology, project administration, resources, software, supervision, validation, visualization, writing – original draft, writing – review and editing.
The contact author has declared that none of the authors has any competing interests.
Publisher's note: Copernicus Publications remains neutral with regard to jurisdictional claims made in the text, published maps, institutional affiliations, or any other geographical representation in this paper. While Copernicus Publications makes every effort to include appropriate place names, the final responsibility lies with the authors.
We thank Ljubov Poláková for the support of the stable isotope measurements and laboratory protocols; the Collection of Microscopic Fungi of the Institute of Soil Biology BC CAS for providing the fungal species Penicillium janczewskii strain BCCO20_0265; and the Institute of Institute of Microbiology CAS for providing the fungal species Paxillus involutus strain SB-22, Phanerodontia chrysosporium strain CCM8074, Mortierella strain RK-38, Umbelopsis strain RK-43, and Paecilomyces lilacinus strain DP-23. Nemiah Ladd and an anonymous reviewer are acknowledged for their time and thoughtful contributions to improve this article.
This research has been supported by the Czech Science Foundation (grant no. 20-223805), the Czech Ministry of Youth, Education, and Sport (grant no. LM2015075), and the European Regional Development Fund, European Observation Network for Territorial Development and Cohesion (grant no. CZ.02.1.01/0.0/0.0/16_013/0001782).
This paper was edited by Steven Bouillon and reviewed by Nemiah Ladd and one anonymous referee.
Baldrian, P., Voříšková, J., Dobiášová, P., Merhautová, V., Lisá, L., and Valášková, V.: Production of extracellular enzymes and degradation of biopolymers by saprotrophic microfungi from the upper layers of forest soil, Plant Soil, 338, 111–125, https://doi.org/10.1007/s11104-010-0324-3, 2011.
Banerjee, D. and Mahapatra, S.: Fungal tannase: a journey from strain isolation to enzyme applications, Dyn. Biochem. Process. Biotechnol. Mol. Biol., 6, 49–60, 2012.
Boer, W. D., Folman, L. B., Summerbell, R. C., and Boddy, L.: Living in a fungal world: impact of fungi on soil bacterial niche development, FEMS Microbiol. Rev., 29, 795–811, 2005.
Boschker, H. T. S. and Middelburg, J. J.: Stable isotopes and biomarkers in microbial ecology, FEMS Microbiol. Ecol., 40, 85–95, https://doi.org/10.1111/j.1574-6941.2002.tb00940.x, 2002.
Boschker, H. T. S., Nold, S. C., Wellsbury, P., Bos, D., De Graaf, W., Pel, R., Parkes, R. J., and Cappenberg, T. E.: Direct linking of microbial populations to specific biogeochemical processes by 13C-labelling of biomarkers, Nature, 392, 801–805, 1998.
Braun, A., Spona-Friedl, M., Avramov, M., Elsner, M., Baltar, F., Reinthaler, T., Herndl, G. J., and Griebler, C.: Reviews and syntheses: Heterotrophic fixation of inorganic carbon – significant but invisible flux in environmental carbon cycling, Biogeosciences, 18, 3689–3700, https://doi.org/10.5194/bg-18-3689-2021, 2021.
Bukovská, P., Bonkowski, M., Konvalinková, T., Beskid, O., Hujslová, M., and Püschel, D.: Utilization of organic nitrogen by arbuscular mycorrhizal fungi-is there a specific role for protists and ammonia oxidizers?, Mycorrhiza, 28, 269–83, https://doi.org/10.1007/s00572-018-0825-0, 2018.
Canarini, A., Fuchslueger, L., Schnecker, J., Metze, D., Nelson, D. B., Kahmen, A., Watzka, M., Pötsch, E. M., Schaumberger, A., Bahn, M., and Richter, A.: Soil fungi remain active and invest in storage compounds during drought independent of future climate conditions, Nat. Commun., 15, 10410, https://doi.org/10.1038/s41467-024-54537-y, 2024.
Carlson C. A., Bates N. R., Hansell, D. A., and Steinberg, D. K.: Carbon Cycle, in: Encyclopedia of Ocean Science, 2nd edition, edited by: Steele, J., Thorpe, S., and Turekian, K., Academic Press, ISBN 9780123744739, 477–486, 2001.
Caro, T. A., McFarlin, J., Jech, S., Fierer, N., and Kopf, S:. Hydrogen stable isotope probing of lipids demonstrates slow rates of microbial growth in soil, P. Natl. Acad. Sci. USA, 120, e2211625120, https://doi.org/10.1073/pnas.2211625120, 2023.
Ciais, P., Dolman, A. J., Bombelli, A., Duren, R., Peregon, A., Rayner, P. J., Miller, C., Gobron, N., Kinderman, G., Marland, G., Gruber, N., Chevallier, F., Andres, R. J., Balsamo, G., Bopp, L., Bréon, F.-M., Broquet, G., Dargaville, R., Battin, T. J., Borges, A., Bovensmann, H., Buchwitz, M., Butler, J., Canadell, J. G., Cook, R. B., DeFries, R., Engelen, R., Gurney, K. R., Heinze, C., Heimann, M., Held, A., Henry, M., Law, B., Luyssaert, S., Miller, J., Moriyama, T., Moulin, C., Myneni, R. B., Nussli, C., Obersteiner, M., Ojima, D., Pan, Y., Paris, J.-D., Piao, S. L., Poulter, B., Plummer, S., Quegan, S., Raymond, P., Reichstein, M., Rivier, L., Sabine, C., Schimel, D., Tarasova, O., Valentini, R., Wang, R., van der Werf, G., Wickland, D., Williams, M., and Zehner, C.: Current systematic carbon-cycle observations and the need for implementing a policy-relevant carbon observing system, Biogeosciences, 11, 3547–3602, https://doi.org/10.5194/bg-11-3547-2014, 2014.
Cooper, A. J. L. and Kuhara, T.: α-Ketoglutaramate: an overlooked metabolite of glutamine and a biomarker for hepatic encephalopathy and inborn errors of the urea cycle, Metab. Brain Dis., 29, 991–1006, https://doi.org/10.1007/s11011-013-9444-9, 2014.
Dijkhuizen, L. and Harder, W.: Microbial metabolism of carbon dioxide, in: Comprehensive Biotechnology: the principles, applications, and regulations of biotechnology in industry, agriculture, and medicine, edited by: Dalton, H., editor-in-chief: Moo-Young, M., Vol. 1, Pergamon Press, Oxford, 409–423, 1985.
Dirghangi, S. S. and Pagani, M.: Hydrogen isotope fractionation during lipid biosynthesis by Tetrahymena thermophila, Org. Geochem., 64, 105–111, 2013.
Dumont, M. G. and Murrell, J. C.: Stable isotope probing—linking microbial identity to function, Nat. Rev. Microbiol., 3, 499–504, 2005.
Erb, T. J.: Carboxylases in natural and synthetic microbial pathways, Appl. Environ. Microb., 77, 8466–8477, https://doi.org/10.1128/AEM.05702-11, 2011.
Feisthauer, S., Wick, L. Y., Kästner, M., Kaschabek, S. R., Schlömann, M., and Richnow, H. H.: Differences of heterotrophic 13CO2 assimilation by Pseudomonas knackmussii strain B13 and Rhodococcus opacus 1CP and potential impact on biomarker stable isotope probing, Environ. Microbiol., 10, 1641–1651, 2008.
Fioretto, A., Di Nardo, C., Papa, S., and Fuggi, A.: Lignin and cellulose degradation and nitrogen dynamics during decomposition of three leaf litter species in a Mediterranean ecosystem, Soil Biol. Biochem., 37, 1083–1091, https://doi.org/10.1016/j.soilbio.2004.11.007, 2005.
Fischer, C. R., Bowen, B. P., Pan, C., Northen, T. R., and Banfield, J. F.: Stable-isotope probing reveals that hydrogen isotope fractionation in proteins and lipids in a microbial community are different and species-specific, ACS Chem. Biol., 8, 1755–1763, 2013.
Frey, S. D.: Mycorrhizal fungi as mediators of soil organic matter dynamics, Annu. Rev. Ecol. Evol. S., 50, 237–259, https://doi.org/10.1146/annurev-ecolsys-110617-062331, 2019.
Grinhut, T., Hadar, Y., and Chen, Y.: Degradation and transformation of humic substances by saprotrophic fungi: processes and mechanisms, Fungal Biol. Rev., 21, 179–189, 2007.
Hayes, J. M.: An introduction to isotopic calculations, Woods Hole Oceanographic Institution, Woods Hole, MA, 2543, 2004.
Hoefs, J.: Stable isotope geochemistry, Springer International Publishing AG, Vol. 285, 2018.
Högberg, P., Nordgren, A., Buchmann, N., Taylor, A. F. S., Ekblad, A., Högberg, M. N., Nyberg, G., Ottosson-Löfvenius, M., and Read, D. J.: Large-scale forest girdling shows that current photosynthesis drives soil respiration, Nature, 411, 789–792, 2001.
Huguet, A., Meador, T. B., Laggoun-Défarge, F., Könneke, M., Wu, W., Derenne, S., and Hinrichs, K.-U.: Production rates of bacterial tetraether lipids and fatty acids in peatland under varying oxygen concentrations, Geochim. Cosmochim. Ac., 203, 103–116, https://doi.org/10.1016/j.gca.2017.01.012, 2017.
Jabinski, S., Rangel, W. d. M., Kopáček, M., Jílková, V., Jansa, J., and Meador, T. B.: Constraining activity and growth substrate of fungal decomposers via assimilation patterns of inorganic carbon and water into lipid biomarkers, Appl. Environ. Microb., 90, e02065-23, https://doi.org/10.1128/aem.02065-23, 2024.
Kellermann, M. Y., Wegener, G., Elvert, M., Yoshinaga, M. Y., Lin, Y.-S., Holler, T., et al.: Autotrophy as a predominant mode of carbon fixation in anaerobic methane-oxidizing micro bial communities, P. Natl. Acad. Sci. USA, 109, 19321–19326, https://doi.org/10.1073/pnas.1208795109, 2012.
Kellermann, M. Y., Yoshinaga, M. Y., Wegener, G., Krukenberg, V., and Hinrichs, K.-U.: Tracing the production and fate of individual archaeal intact polar lipids using stable isotope probing, Org. Geochem., 95, 13–20, https://doi.org/10.1016/j.orggeochem.2016.02.004, 2016.
Kendall, C. and Caldwell, E. A.: Fundamentals of isotope geochemistry, in: Isotope tracers in catchment hydrology, Elsevier, 51–86, 1998.
Kirk, T. K. and Farrell, R. L.: Enzymatic “combustion”: the microbial degradation of lignin, Annu. Rev. Microbiol., 41, 465–501, https://doi.org/10.1146/annurev.mi.41.100187.002341, 1987.
Kopf, S. H., McGlynn, S. E., Green-Saxena, A., Guan, Y., Newman, D. K., and Orphan, V. J.: Heavy water and 15N labelling with NanoSIMS analysis reveals growth rate-dependent metabolic heterogeneity in chemostats, Environ. Microbiol., 17, 2542–2556, https://doi.org/10.1111/1462-2920.12752, 2015.
Kopf, S. H., Sessions, A. L., Cowley, E. S., Reyes, C., Van Sambeek, L., Hu, Y., Orphan, V. J., Kato, R., and Newman, D. K.: Trace incorporation of heavy water reveals slow and heterogeneous pathogen growth rates in cystic fibrosis sputum, P. Natl. Acad. Sci. USA, 113, E110–E116, 2016.
Kornberg, H. L.: Anaplerotic sequences in microbial metabolism, Angew. Chem. Int. Edit., 4, 558–565, https://doi.org/10.1002/anie.196505581, 1965.
Kreuzer-Martin, H. W.: Stable isotope probing: linking functional activity to specific members of microbial communities, Soil Sci. Soc. Am. J., 71, 611–619, 2007.
Lekha, P. K. and Lonsane, B. K.: Production and application of tannin acyl hydrolase: state of the art, Adv. Appl. Microbiol., 44, 215–260, 1997.
Lindahl, B. D. and Tunlid, A.: Ectomycorrhizal fungi–potential organic matter decomposers, yet not saprotrophs, New Phytol., 205, 1443–1447, https://doi.org/10.1111/nph.13201, 2015.
Maloney, A. E., Kopf, S. H., Zhang, Z., McFarlin, J., Nelson, D. B., Masterson, A. L., and Zhang, X.: Large enrichments in fatty acid ratios distinguish respiration from aerobic fermentation in yeast Saccharomyces cerevisiae, P. Natl. Acad. Sci. USA, 121, e2310771121, https://doi.org/10.1073/pnas.231077112, 2024.
Mäkelä, M. R., Marinović, M., Nousiainen, P., Liwanag, A. J., Benoit, I., Sipilä, J., Hatakka, A. de Vries, R. P., and Hilden, K. S.: Aromatic metabolism of filamentous fungi in relation to the presence of aromatic compounds in plant biomass, Adv. Appl. Microbiol., 91, 63–137, 2015.
Osburn, M. R., Sessions, A. L., Pepe-Ranney, C., and Spear, J. R.: Hydrogen-isotopic variability in fatty acids from Yellowstone National Park hot spring microbial communities, Geochim. Cosmochim. Ac., 75, 4830–4845, 2011.
Pilecky, M., Meador, T. B., and Wassenaar, L. I.: Advancements in Compound-Specific Hydrogen Stable-Isotope Analysis of Fatty and Amino Acids, TrAC-Trend. Anal. Chem., 186, 118194, https://doi.org/10.1016/j.trac.2025.118194, 2025.
Romanenko, V. I.: Heterotrophic assimilation of CO2 by bacterial flora of water, Mikrobiologiia, 33, 679–683, 1964.
Roslev, P., Larsen, M. B., Jørgensen, D., and Hesselsoe, M.: Use of heterotrophic CO2 assimilation as a measure of metabolic activity in planktonic and sessile bacteria, J. Microbiol. Meth., 59, 381–393, https://doi.org/10.1016/j.mimet.2004.08.002, 2004.
Sachse, D., Billault, I., Bowen, G. J., Chikaraishi, Y., Dawson, T. E., Feakins, S. J., Freeman, K. H., Magill, C. R., McInerney, F.A., van der Meer, M. T. J., Polissar, P., Robins, R. J., Sachs, J. P., Schmidt, H.-L., Sessions, A. L., White, J. W. C., West, J. B., and Kahmen, A.: Molecular paleohydrology: interpreting the hydrogen-isotopic composition of lipid biomarkers from photosynthesizing organisms, Annu. Rev. Earth Pl. Sc., 40, 221–249, 2012.
Schinner, F. and Concin, R.: Carbon dioxide fixation by wood-rotting fungi, Eur. J. Forest Pathol., 11, 120–123, https://doi.org/10.1111/j.1439-0329.1981.tb00077.x, 1981.
Schinner, F., Concin, R., and Binder, H.: Heterotrophic CO2-fixation by fungi in dependence on the concentration of the carbon source, Phyton, 22, 81–85, 1982.
Sessions, A. L.: Caltech Fractome Database, California Institute Of Technology [data set], https://fractome.caltech.edu/, last access: 6 June 2025.
Sessions, A. L. and Hayes, J. M.: Calculation of hydrogen isotopic fractionations in biogeochemical systems, Geochim. Cosmochim. Ac. 69, 593–597, 2005.
Smith, S. E. and Read, D.: Mineral nutrition, toxic element accumulation and water relations of arbuscular mycorrhizal plants, 3rd edn., in: Mycorrhizal symbiosis. third ed. London: Academic Press, 2008, 145–190, https://doi.org/10.1016/B978-012370526-6.50007-6, 2008.
Šnajdr, J., Cajthaml, T., Valášková, V., Merhautová, V., Petránková, M., Spetz, P., Leppännen, K., and Baldrian, P.: Transformation of Quercus petraea litter: successive changes in litter chemistry are reflected in differential enzyme activity and changes in the microbial community composition, FEMS Microbiol. Ecol., 75, 291–303, https://doi.org/10.1111/j.1574-6941.2010.00999.x, 2011.
Sorokin, Y. I.: Heterotrophic carbon dioxide assimilation by microorganisms, Zhurnal Obshchei Biologii, 22, 265–272, 1961.
Sorokin, J. I.: On the carbon dioxide uptake during the cell synthesis by microorganisms, Z. Allg. Mikrobiol., 6, 69–73, https://doi.org/10.1002/jobm.3630060107, 1966.
Treonis, A. M., Ostle, N. J., Stott, A. W., Primrose, R., Grayston, S. J., and Ineson, P.: Identification of groups of metabolically-active rhizosphere microorganisms by stable isotope probing of PLFAs, Soil Biol. Biochem., 36, 533–537, 2004.
Valentine, D. L.: Isotopic remembrance of metabolism past, P. Natl. Acad. Sci. USA, 106, 12565–12566, https://doi.org/10.1073/pnas.0906428106, 2009.
Warren, C. R.: D2O labelling reveals synthesis of small, water-soluble metabolites in soil, Soil Biol. Biochem., 165, 108543, https://doi.org/10.1016/j.soilbio.2021.108543, 2022.
Wegener, G., Bausch, M., Holler, T., Thang, N. M., Prieto Mollar, X., Kellermann, M. Y., Hinrichs K.-U., and Boetius, A.: Assessing sub-seafloor microbial activity by combined stable isotope probing with deuterated water and 13C-bicarbonate, Environ. Microbiol., 14, 1517–1527, https://doi.org/10.1111/j.1462-2920.2012.02739.x, 2012.
Wegener, G., Kellermann, M. Y., and Elvert, M.: Tracking activity and function of microorganisms by stable isotope probing of membrane lipids, Curr. Opin. Biotech., 41, 43–52, https://doi.org/10.1016/j.copbio.2016.04.022, 2016.
Wijker, R. S., Sessions, A. L., Fuhrer, T., and Phan, M.: variation in microbial lipids is controlled by NADPH metabolism, P. Natl. Acad. Sci. USA, 116, 12173–12182, https://doi.org/10.1073/pnas.1818372116, 2019.
Willers, C., Jansen van Rensburg, P. J., and Claassens, S.: Phospholipid fatty acid profiling of microbial communities–a review of interpretations and recent applications, J. Appl. Microbiol., 119, 1207–1218, 2015.
Wu, W., Meador, T., and Hinrichs, K.-U.: Production and turnover of microbial organic matter in surface intertidal sediments, Org. Geochem., 121, 104–113, https://doi.org/10.1016/j.orggeochem.2018.04.006, 2018.
Wu, W., Meador, T. B., Könneke, M., Elvert, M., Wegener, G., and Hinrichs, K. U.: Substrate-dependent incorporation of carbon and hydrogen for lipid biosynthesis by Methanosarcina barkeri, Env. Microbiol. Rep., 12, 555567, https://doi.org/10.1111/1758-2229.12876, 2020.
Zhang, X., Gillespie, A. L., and Sessions, A. L.: Large D/H variations in bacterial lipids reflect central metabolic pathways, P. Natl. Acad. Sci. USA, 106, 12580–12586, https://doi.org/10.1073/pnas.0903030106, 2009.