the Creative Commons Attribution 4.0 License.
the Creative Commons Attribution 4.0 License.
 | 10 Jul 2025
Spatiotemporal variations in surface marine carbonate system properties across the western Mediterranean Sea using volunteer observing ship data
David Curbelo-Hernández
David González-Santana
Aridane G. González
J. Magdalena Santana-Casiano
Melchor González-Dávila
Surface physical and marine carbonate system (MCS) properties were assessed along the western boundary of the Mediterranean Sea. An unprecedented high-resolution observation-based dataset spanning 5 years (2019–2024) was built through automatic underway monitoring by a volunteer observing ship (VOS). The MCS dynamics were strongly modulated by physical–biological coupling dependent on the upper-layer circulation and mesoscale features. The variations in CO2 fugacity (fCO2,sw) were mainly driven by sea surface temperature (SST) changes. On a seasonal scale, SST explained 51 %–71 % of the increase in fCO2,sw from February to September, while total alkalinity (AT) and sea surface salinity (SSS) explained < 20 %. The processes controlling total inorganic carbon (CT) partially offset this increment and explain ∼ 23 %–37 % of the fCO2,sw seasonal change. On an interannual scale, the SST trends (0.26–0.43 °C yr−1) have accelerated by 78 %–88 % in comparison with previous decades. The ongoing surface warming contributed ∼ 76 %–92 % to increasing fCO2,sw (4.18 to 5.53 µatm yr−1) and, consequently, decreasing pH (−0.005 to −0.007 units per year) in the surface waters. The seasonal amplitude of SST, which is becoming larger due to progressively warmer summers, was the primary driver of the observed slope of interannual trends. The evaluation of the air–sea CO2 exchange shows the area across the Alboran Sea (14 000 km2) and the eastern Iberian margin (40 000 km2) acting as an atmospheric CO2 sink of −1.57 ± 0.49 mol m−2 yr−1 (−0.97 ± 0.30 Tg CO2 yr−1) and −0.70 ± 0.54 mol m−2 yr−1 (−1.22 ± 0.95 Tg CO2 yr−1), respectively. Considering the spatial variability of CO2 fluxes across the study area, a reduction of approximately 40 %–80 % in the net annual CO2 sink has been estimated since 2019, which is attributed to the persistent strengthening of the source status during summer and the weakening of the sink status during spring and autumn.
- Article
(7816 KB) - Full-text XML
-
Supplement
(2709 KB) - BibTeX
- EndNote


Semi-enclosed and marginal seas play a relevant role in the global biogeochemical cycles and are highly vulnerable to climate change (IPCC, 2023). These regions encompass extensive coastal and continental shelf and slope areas occupied by multiple diverse ecosystems under anthropogenic pressure. Although these regions present enhanced biogeochemical activity and intensified air–sea CO2 exchange rates compared to the open ocean (Borges et al., 2005; Cai et al., 2006; Frankignoulle and Borges, 2001; Shadwick et al., 2010), its poor monitoring and assessment have historically excluded them from global studies and models and underestimated them in the Global Carbon Budget (Friedlingstein et al., 2023).
The Mediterranean Sea is a dynamic semi-enclosed system potentially vulnerable to natural and anthropogenic forcing (e.g. Álvarez et al., 2014; Tanhua et al., 2013). The particular oceanography of the Mediterranean Sea, collectively described in several works (e.g. Nielsen, 1912; Robinson et al., 2001; Millot and Taupier-Letage, 2005; Bergamasco and Malanotte-Rizzoli, 2010; Schroeder et al., 2012), has rendered it a “miniature ocean” considered a “laboratory basin” for evaluating physicochemical perturbations that can be extrapolated to larger scales in the global ocean (e.g. Robinson and Golnaraghi, 1994; Bergamasco and Malanotte-Rizzoli, 2010). These perturbations have accelerated since the second half of the 20th century, with temperature and salinity increasing at unprecedented rates of 0.04 °C and 0.015 per decade, respectively (Borghini et al., 2014), impacting the marine carbonate system (MCS). However, the availability of high-quality observation-based data and research in this basin is low due to spatial and temporal limitations in the monitoring and sampling techniques (Millero et al., 1979; Rivaro et al., 2010).
The MCS dynamics have been evaluated in the north-western Mediterranean basin (Bégovic and Copin-Montégut, 2002; Copin-Montégut and Bégovic, 2002; Copin-Montégut et al., 2004; Coppola et al., 2020; Hood and Merlivat, 2001; Mémery et al., 2002; Merlivat et al., 2018; Touratier and Goyet, 2009; Ulses et al., 2023), mainly at the time series DYFAMED (43.42° N, 7.87° E; Marty, 2002) and BOUSSOLE sites (43.37° N, 7.90° E; Antoine et al., 2006, 2008a, b). These investigations have shown that the seasonal cycle of the surface CO2 is primarily governed by thermal fluctuations and the behaviour of the area as a relatively weak sink for atmospheric CO2 on an annual scale. Long-term changes estimated by Merlivat et al. (2018) reported increases in the surface CO2 fugacity (fCO2,sw) and pH of ∼ 40 µatm and ∼ 0.04 units, respectively, since the 1990s. The interannual trends given for fCO2,sw (2.3 ± 0.23 µatm yr−1; Merlivat et al., 2018) and pH (0.002–0.003 units per year; Yao et al., 2016) were in agreement with those encountered in the north-eastern Atlantic at the ESTOC site (2.1 ± 0.1 µatm yr−1 and 0.002 ± 0.0001 units per year, respectively; González-Dávila and Santana-Casiano, 2023). Long-term variations in the MCS within the north-western Mediterranean occur at rates exceeding those anticipated from chemical equilibrium with atmospheric CO2, which has been attributed to the intense deep-convection processes in this area (Copin-Montégut, 1993; D'Ortenzio et al., 2008; Cossarini et al., 2021) and the substantial input of anthropogenic carbon from the North Atlantic (Merlivat et al., 2018; Palmiéri et al., 2015; Schneider et al., 2010; Ulses et al., 2023). Based on a high-resolution regional model, Palmiéri et al. (2015) estimated that ∼ 25 % of the anthropogenic carbon storage in the Mediterranean Sea comes from the Atlantic. The water exchange processes in the Strait of Gibraltar become the western boundary of the Mediterranean Sea in a crucial region for MCS variability, which significantly modulates the basin-wide anthropogenic carbon inventory and ocean acidification trends in the Mediterranean basin and could significantly affect the general circulation and composition of seawaters in the North Atlantic. Additionally, this region is subject to variability related to (1) the intense deep-water convection in the adjacent north-western area of the Mediterranean Sea and (2) the unique circulation patterns shaped to the irregular coastlines and islands, which form quasi-permanent eddies and other (sub-)mesoscale features (Alberola et al., 1995; Bosse et al., 2021, 2016; Bourg and Molcard, 2021).
This research focuses on the surface spatiotemporal variations of the MCS and air–sea CO2 fluxes on the western boundary of the Mediterranean Sea. High-resolution and reliable data were obtained through autonomous underway monitoring of the ocean surface from February 2019 to February 2024 by a volunteer observing ship (VOS). This systematic strategy represents a powerful tool for analysing the distribution and changes in physical and MCS properties in highly different areas such as coastal transitional zones, where the availability of data has historically been scarce. The cruise track (Fig. 1) followed the southern and eastern geographically rugged coastline of the Iberian Peninsula and allowed characterization of the Alboran Sea (∼ 2–5.1° W) that was separate from the eastern coastal shelf area between the Cape of Gata (Almería) and Barcelona (∼ 36.5–41.3° N). The changes observed in the MCS on seasonal and interannual timescales (even considering the limitations of 5 years of data), the mechanisms controlling their variations, and the changes in the air–sea CO2 exchange have been addressed in this study.
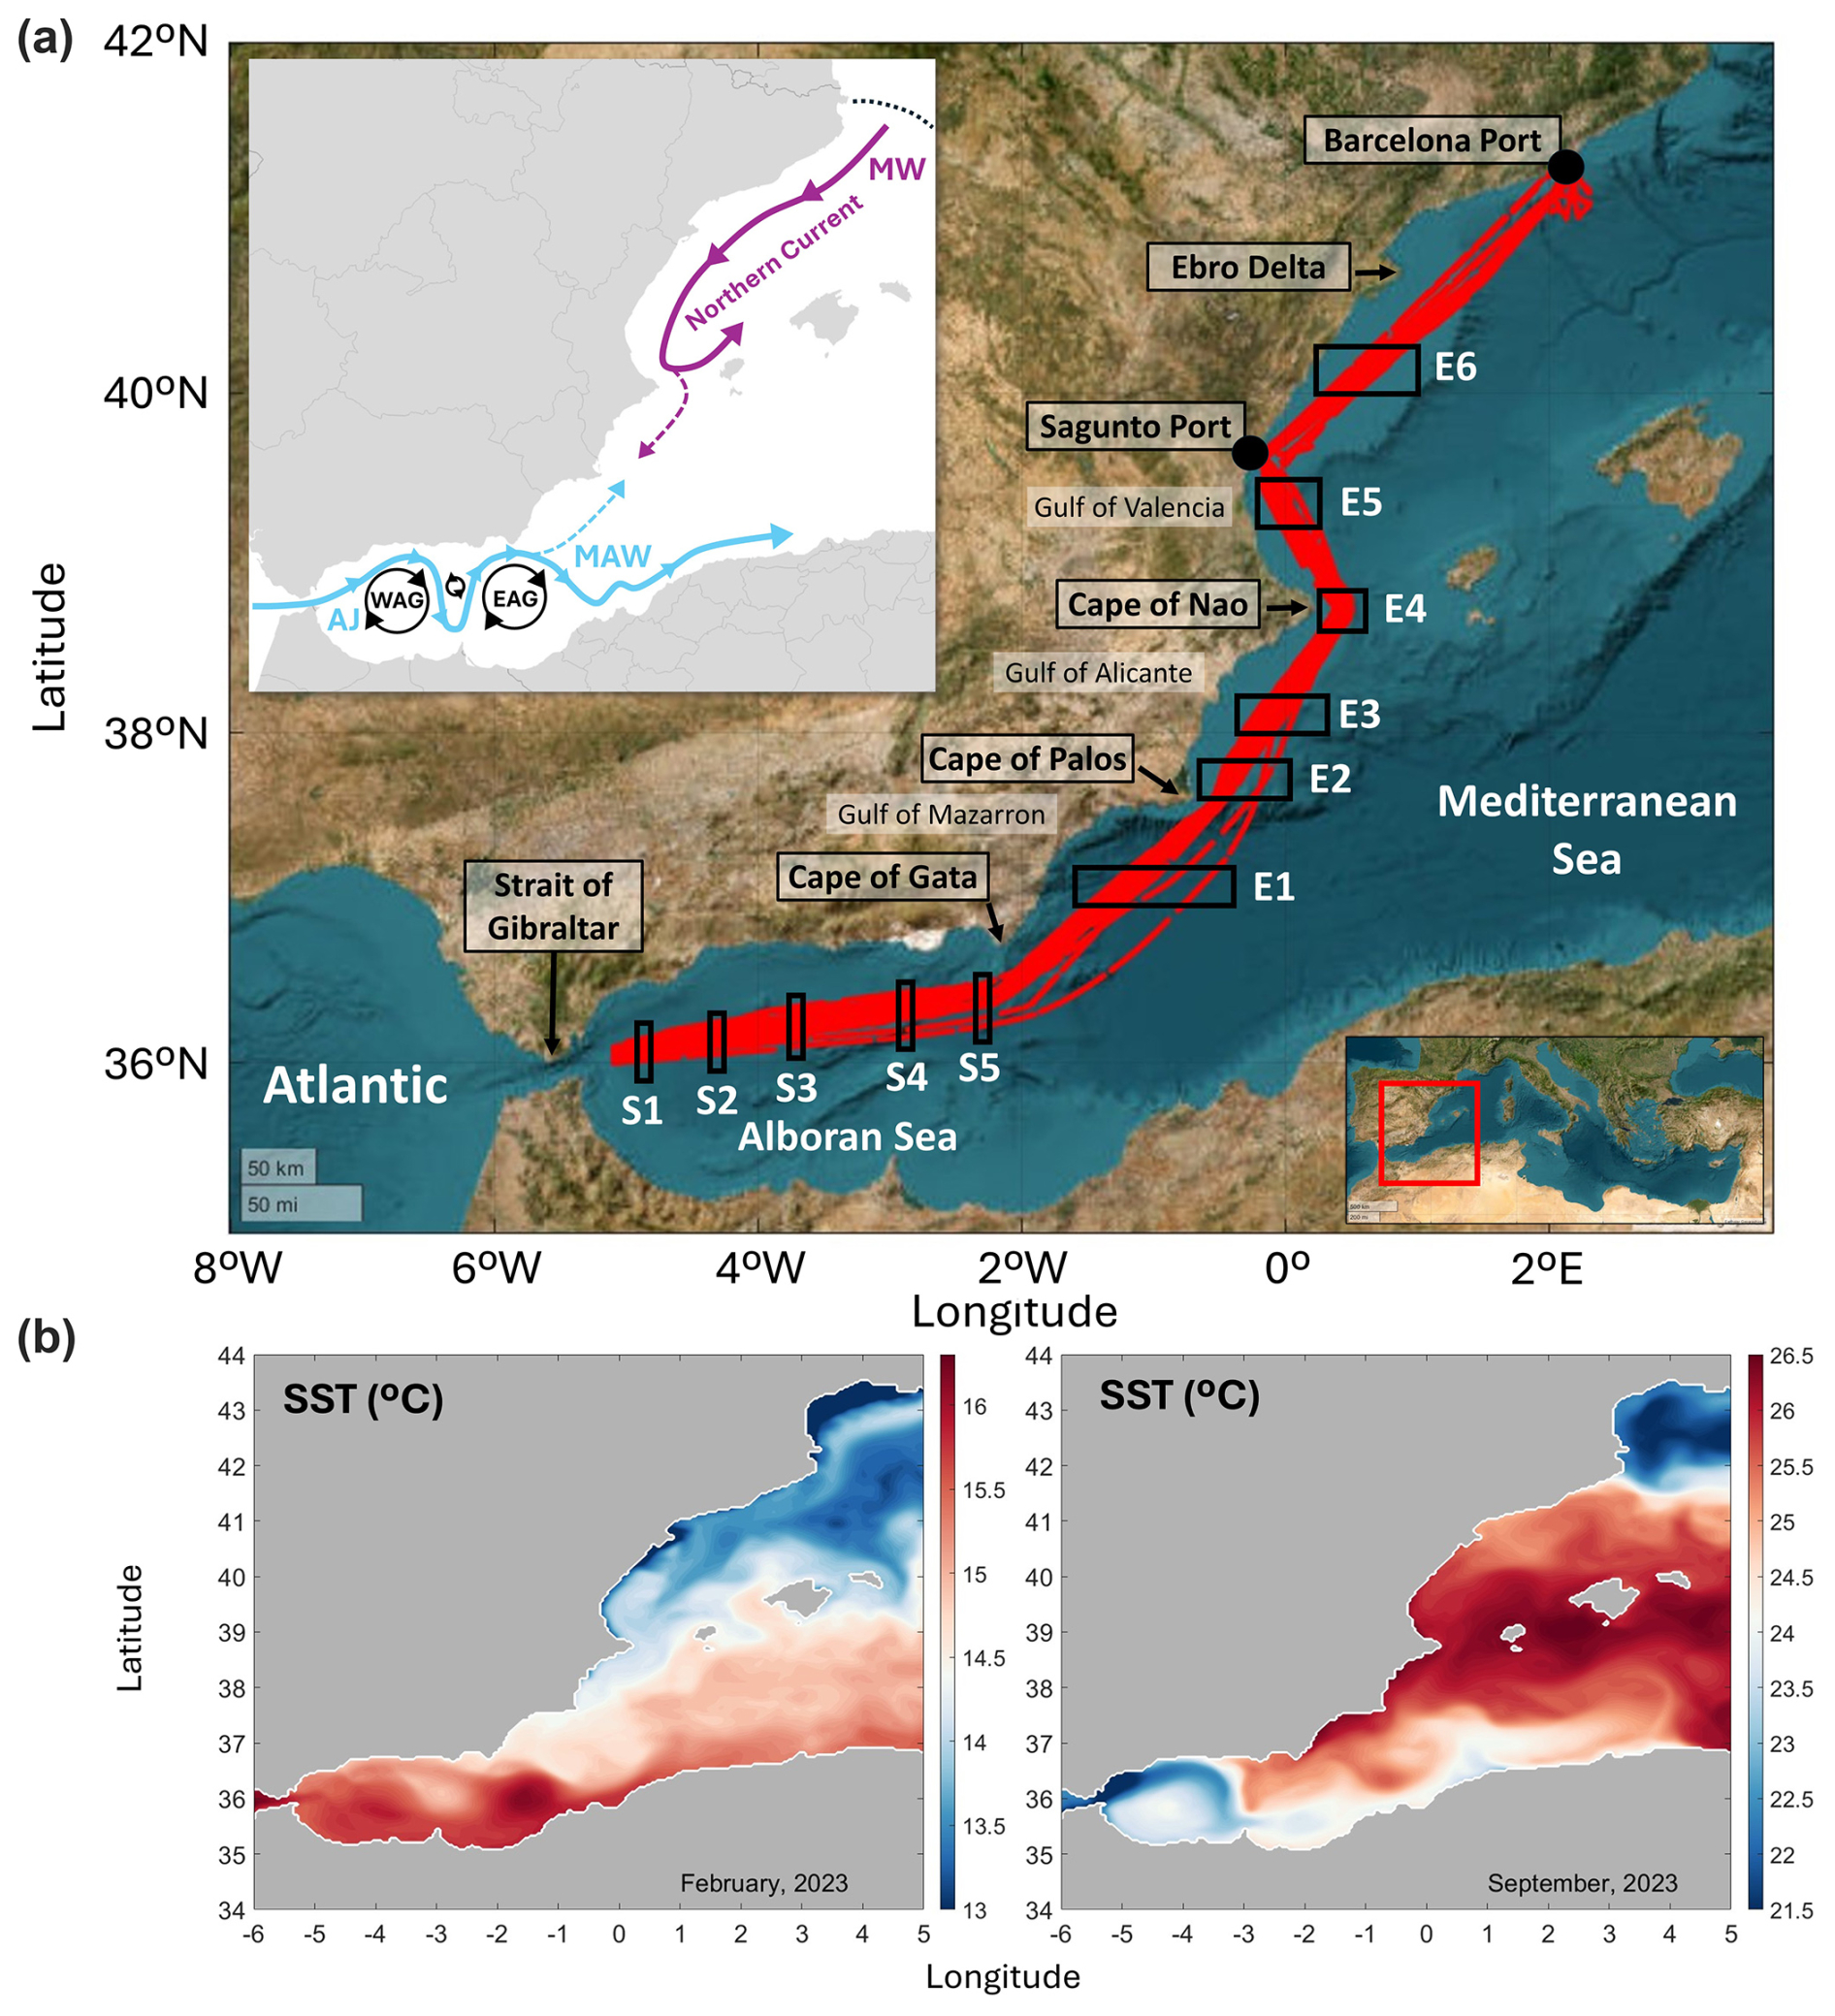
Figure 1(a) Map of the western boundary of the Mediterranean Sea with the ES-SOOP-CanOA tracks between February 2019 and February 2024 (red) and the locations of the stations of interest along the southern (S1–S5) and eastern (E1–E6) sections. The main capes and gulf along the geographically rugged Iberian coastline are shown. The schematic diagram summarizes the classical circulation patterns: in the Alboran Sea (blue), the Atlantic Jet (AJ) surrounds the Western Anticyclonic Gyre and Eastern Anticyclonic Gyre (WAG and EAG, respectively) and forms Modified Atlantic Water (MAW), while along the eastern Iberian margin (purple) the Mediterranean Water (MW) is transported from the north-western Mediterranean basin along the path of the Northern Current. The northward spreading of MAW during summer and southward spreading of MW during winter are depicted with the dashed arrows. The thermal front that formed in the axis of the Pyrenees during summer is depicted with a black dashed line. (b) SST maps built with reanalysis monthly data (0.042° × 0.042°) for February and September 2023 from the Med MFC physical multiyear product (Escudier et al., 2020, 2021; Nigam et al., 2021) available at the Copernicus Marine Data Store (https://data.marine.copernicus.eu/products; last access: 15 May 2025).
2.1 Study area
The western boundary of the Mediterranean Sea encompasses the Alboran Sea, land-loaded by the southern Iberian Peninsula coast, the northern African coast, and the coastal transitional area along the eastern Iberian margin (Fig. 1a). The classical surface circulation pattern in the Alboran Sea (e.g. Bormans and Garrett, 1989; Peliz et al., 2013; Sánchez-Garrido et al., 2013; Sánchez-Garrido and Nadal, 2022; Speich et al., 1996; Whitehead and Miller, 1979), together with the Atlantic Jet (AJ) following a wavelike path of the quasi-permanent Western Anticyclonic Gyre (WAG) and Eastern Anticyclonic Gyre (EAG) and constituting the Modified Atlantic Water (MAW; Lopez-García et al., 1994; Viúdez et al., 1998), drives west–east variations in physical and biogeochemical terms. The intensity and direction of the AJ, depending primarily on sea level pressure and local wind fluctuations, vary on different timescales and govern the circulation patterns in the Alboran Sea, influencing the biogeochemistry (Sánchez-Garrido and Nadal, 2022; Solé et al., 2016). On a seasonal scale, the AJ oscillates between the two main circulation modes (García Lafuente et al., 2002; Macías et al., 2008, 2016; Vargas-Yáez et al., 2002), which is detectable by reanalysis-data-based SST signals (Fig. 1b): a high-intensity AJ flowing north-eastward during spring and summer and a lower-intensity AJ flowing with a more south-easterly direction during autumn and winter. The stronger AJ during the warm months feeds the classical two-gyre configuration in the Alboran Sea, while the weak AJ only allows the existence of the WAG (Renault et al., 2012). The AJ forms a filament flowing from the Iberian coastal upwelling in the north-western Alboran Sea and surrounding the eastern edge of the WAG, which is most frequently present during summer (Gómez-jakobsen et al., 2019; Millot, 1999). The westernmost part of the Alboran Sea is affected by the shallow position of the Atlantic–Meridional Interface (AMI) layer (Bray et al., 1995; Lacombe and Richez, 1982), which promotes the injection of deep water into the surface (Echevarría et al., 2002; Gómez-jakobsen et al., 2019; Minas et al., 1991).
The eastern Iberian margin is influenced by the path of the Northern Current transporting Mediterranean Water (MW; Pinot et al., 1995), which originates around the Gulf of Lion, where the forcing of the north-easterly winds is frequently strong and flows southward along the eastern coastline of the Iberian Peninsula (Conan and Millot, 1995; Millot, 1999; Sammari et al., 1995). The seasonality of the Northern Current (Millot, 1999) infers meridional variations in the thermal signals between cold and warm months (Fig. 1b). The enhanced wind forcing during winter intensifies the Northern Current, which fits the Iberian continental slope and recirculates offshore of the Cape of Nao (Millot, 1999), while a low-intensity branch progresses southward of the Cape of Nao and reaches the eastern Alboran Sea. During summer, the weakening of the wind forcing forms a surface thermal front in the axis of the Pyrenees that was detectable on the reanalysis-based SST map (Fig. 1b). This front changes the path of the Northern Current further away from the Iberian coast (Lopez-García et al., 1994), which allows the MAW to reach its northernmost spreading. The interaction of the Northern Current with the variety of mesoscale features (mainly meanders and eddies) and the variations in stratification within the annual cycle introduced spatiotemporal differences into the biogeochemical properties (Bosse et al., 2021; Millot, 1999). Additionally, although terrestrial and riverine inputs have a less pronounced impact on biogeochemistry compared to the eastern Mediterranean basin (Cossarini et al., 2015), they can act as a source of local variability. Most significant in this area is the Ebro River runoff, which peaks in March–May due to the combined action of precipitation during winter and snowmelt in the upper river basins during spring (Zambrano-Bigiarini et al., 2010). It feeds the coastal area around the Ebro Delta with fresh and cool waters (see the minimum SST compared to the adjacent waters in February; Fig. 1b).
2.2 Data collection
A high-spatiotemporal-resolution dataset spanning 5 years was constructed based on weekly physicochemical observations of the surface western boundary of the Mediterranean Sea between February 2019 and February 2024. Data were collected automatically by the VOS MV JONA SOPHIE (IMO: 9144718, called RENATE P before November 2021), a container ship managed in Spain by Nisa Maritima, which links the Canary Islands with Barcelona. This VOS line was designed and is maintained by the QUIMA research group at IOCAG-ULPGC, and it has operated within the framework of the Integrated Carbon Observation System (ICOS; https://www.icos-cp.eu/; last assess: 15 May 2025) as a Ship of Opportunity (SOOP) Ocean Station (station ID: ES-SOOP-CanOA) since 2021 (upgraded to an ICOS Class-1 Ocean Station in May 2024). Therefore, the measurement equipment and underway data collection techniques verify the ICOS high-quality requirements and methodological recommendations.
The ES-SOOP-CanOA station allows monitoring of a coastal transitional zone transect across the western Mediterranean Sea (Fig. 1), together with a north-eastern Atlantic subtropical area (Curbelo-Hernández et al., 2021a) and the Strait of Gibraltar (Curbelo-Hernández et al., 2021b). In the Alboran Sea, the vessel advanced eastward and longitudinally crossed the WAG through its northern part and followed the northern path of the EAG. The irregular south-eastern and eastern coastlines of the Iberian Peninsula caused local differences in the oceanographic features and variances in the distance to land of the vessel track.
The system operates fully unattended in underway mode, with biweekly (the time required to complete a round trip) routine maintenance at the port of Las Palmas de Gran Canaria (28.13° N, 15.42° W). Data are automatically transferred to a server when the vessel docks at each of the ports along the usual route (Las Palmas de Gran Canaria, Santa Cruz de Tenerife, Arrecife, Sagunto, and Barcelona). A total of 92 routes were completed in the Mediterranean Sea (Fig. 1).
2.3 Monitoring routines
The autonomous underway monitoring of CO2 in the surface ocean (water intake placed at 5 m depth) and low atmosphere (air intake placed at 8 m above sea level) and the data collection routines followed the recommendations described by Pierrot et al. (2009) to ensure comparable and high-quality datasets. An automated underway CO2 molar fraction (xCO2, ppm) measurement system, developed by Craig Nail and commercialized by General Oceanics, was installed in the engine room of the vessel and described by Curbelo-Hernández et al. (2021a, b).
The xCO2 measurement system combines an air and seawater equilibrator placed inside the wet box, with a non-dispersive infrared analyser for gas detection placed inside the dry box. The analyser used for xCO2 detection was built by LICOR® (initially the LI-6262 model and, after October 2019, the LI-7000 model). The nominal accuracy of the LICOR infrared gas analyser given by the manufacturer is 1 % for CO2 concentrations within the range 0–3000 ppm. The system performs, in-loop at 3 min intervals, 5 measurements of atmospheric xCO2 (xCO2,atm) and 80 measurements of surface seawater xCO2 (xCO2,sw). The xCO2,atm data were consistent with daily xCO2,atm records from the Izaña Atmospheric Research Center (IZO) site located in Tenerife, Canary Islands, Spain (28.3090° N, 16.499° W, located 2372.9 m above sea level; https://gml.noaa.gov/dv/site/site.php?code=IZO, last access: 14 May 2025), which is operated by the Spanish Meteorological Agency (AEMET) and forms part of several major international atmospheric monitoring networks (Fig. S1). Daily xCO2,atm data from IZO are available through the National Ocean and Atmospheric Administration (NOAA) Global Monitoring Laboratory (GML) dataset (https://gml.noaa.gov/data/dataset.php?item=izo-co2-flask; last access: 14 May 2025). From 2019 to 2024, xCO2,atm measurements from the ES-SOOP-CanOA station were, on average, 1.14 ppm higher than those recorded at IZO (Fig. S1), which may be due to the fact that air sampling at IZO is conducted at approximately 2400 m above sea level in a remote location far from major urban or industrial areas and above the atmospheric inversion layer, which shields the station from surface level pollution. In contrast, the ES-SOOP-CanOA measurements are conducted in the lower atmosphere, near the sea surface, and closer to greenhouse gas emission sources (particularly when the vessel operates near the coast in the Mediterranean basin).
The LICOR® analyser is automatically calibrated on departure and arrival at each port and periodically every 3 h using four standard gases. Additionally, the system is zeroed and spanned (with standard gases 1 and 4, respectively) every 12 h to properly interpolate the standard values and correct for instrument drift. The four standard gases, with an accuracy of ± 0.02 ppm, were provided by the NOAA and are traceable to the World Meteorological Organization (WMO). They were in the order 0, 250, 400, and 550 ppm until January 2021, when the gas bottles for standards 2 to 4 were exchanged for a new set with concentrations in the order 300, 500, and 800 ppm as provided by the ICOS central analytical laboratories.
The sea surface temperature (SST, °C) was monitored using a SBE38 thermometer placed at the primary seawater intake in the engine room, with a reported instrument error of ± 0.01 °C. The high sensitivity of xCO2 to temperature fluctuations required monitoring of temperature at different locations across the system. A SBE45 thermosalinograph and a Hart Scientific HT1523 handheld thermometer, with reported instrument errors of ± 0.01 °C, were used to monitor the seawater temperature at the entrance of the wet box and inside the equilibrator, respectively. The measured SST was analysed in conjunction with SST monthly reanalysis data (0.042° × 0.042° spanning 24 years from 1 January 2000 to 1 March 2024) from the Med MFC physical multiyear product (Escudier et al., 2020, 2021; Nigam et al., 2021) available at the Copernicus Marine Data Store (https://data.marine.copernicus.eu/products; last access: 15 May 2025). The SST reanalysis data were interpolated to the coordinates of the ES-SOOP-CanOA data to perform direct comparison of their dynamics.
The sea surface salinity (SSS) was measured by the SBE45 thermosalinograph, whose instrumental error is of the order of ± 0.005. Lastly, pressure is measured within ± 0.0002 atm at the deck box transducer close to the air intake (used as atmospheric pressure), in the wet box inside the equilibrator at the time of equilibration, and in the dry box to be used by the LICOR analyser to correct the analogue signal for any pressure effects.
Discrete surface seawater samples were collected manually with in situ records of SST and SSS during three round trips in February 2020, March 2021, and October 2023 (a total of 102 were collected in the Mediterranean Sea). The discrete sampling was performed along the vessel track from the seawater supply line every 1–2 h in borosilicate glass bottles, overfilled, and preserved with 100 µL of saturated HgCl2. Samples were kept in the dark and analysed just after arriving at port, in a period of less than 2 weeks, for total alkalinity (AT, µmol kg−1).
The ongoing observational dataset exhibits a gap of 1 year between September 2021 and September 2022 due to the temporary cessation of the measurement system for vessel maintenance in dry dock. During this period, the measurement system was sent for calibration and maintenance to General Oceanics, Miami, USA. There are also several gaps of less than 1 month related to different technical issues with the measurement equipment that were addressed during the routine maintenance visits to the vessel (i.e. problems with the pump and seawater intake and with the LICOR analyser, depletion of gas bottle supplies, and electrical issues in the engine room). Resolution of certain technical issues encountered during 2020 was delayed due to the constraints imposed by COVID-19.
2.4 Calculation procedures
2.4.1 CO2 system variables
Data processing for fCO2 calculations
The present investigation followed the data collection methodology, quality control, and calculation procedures as published in the updated version of the DOE method manual for ocean CO2 analysis (Dickson et al., 2007). The correction of the measured xCO2 and calculation of the fugacity of CO2 (fCO2) in surface seawater (fCO2,sw) and the atmosphere (fCO2,atm) followed the procedure described by Pierrot et al. (2009). This procedure avoids significant uncertainties in the determination of fCO2 arising from differences in pressure and temperature conditions between sampling (atmospheric pressure and SST) and equilibration (pressure and seawater temperature inside the equilibrator once equilibration is reached). By calibrating the instrument with standard gases ranging from 0 to 800 ppm (which encompasses the measurement range of 300 to 600 ppm) and actively minimizing temperature and pressure drift through continuous monitoring (see Sect. 2.3 for the standard gas, temperature, and pressure accuracies), the system achieved the target accuracies of ± 0.2 µatm for fCO2,atm and ± 2 µatm for fCO2,sw (Pierrot et al., 2009). The full set of standard gases was linearly interpolated to the time of the observations to generate the calibration curve used for xCO2 correction before calculating fCO2.
The raw output data were initially filtered by removing data affected by the automatic sampler, such as samples measured at low water rates (< 2.0 L min−1) and/or samples in which the difference in temperature between the seawater intake and the equilibrator was higher than 1.5 °C. The outliers, assumed to be elements of more than 3 local standard deviations from the local mean over a window length of 50 elements, were also removed from the dataset. The xCO2-measured values in the low atmosphere after each calibration were averaged and interpolated at the time of each xCO2 observation in seawater by applying a piece-wise polynomial-based smoothing spline.
AT determination and reconstruction
Discrete seawater samples were analysed for AT using a VINDTA 3C and following the procedure detailed by Mintrop et al. (2000). The VINDTA 3C was calibrated through the titration of certified reference materials (CRMs, provided by Andrew G. Dickson at Scripps Institution of Oceanography), giving values with an accuracy of ± 1.5 µmol kg−1.
An empirical salinity-based relationship was developed to reconstruct AT specifically for the monitored transect. The AT–SSS linear relationship (Eq. 1), derived from 46 discrete samples, is statistically significant at the 99 % level of confidence (p value < 0.01) and presents a high degree of correlation (r2=0.99) and a root mean square error (RMSE) of ± 5.6 µmol kg−1.
Although the reconstruction of AT from its linear relationship with SSS does not account for biological processes that cannot be traced with salinity (Wolf-Gladrow et al., 2007) or the input of dissolved carbonate minerals and bicarbonate–carbonate species from river runoff, sediments, and water mixing, it has been widely used. It provides useful general approximations in regions with stable conditions and limited influence from these processes. The strong correlation of the AT–SSS linear relationship and its consistency with those proposed for various regions of the Mediterranean Sea (Schneider et al., 2007; Copin-Montégut and Bégovic, 2002; Jiang et al., 2014; Cossarini et al., 2015) indicate a dominant control of salinity-driven processes over AT variability. In the western Mediterranean, these processes primarily include the conservative effects of evaporation–precipitation balance and the inflow of cooler, less saline Atlantic waters (Jiang et al., 2014). River runoff also causes local changes in SSS, but its role as a salinity-independent source of AT variability is minimal compared to the eastern Mediterranean basin (Jiang et al., 2014; Cossarini et al., 2015). With respect to biogeochemical processes, they cause negligible changes in salinity and induce small direct changes in AT.
To account for minor variations in AT that are independent of salinity, a non-conservative term (ε) was included in the linear model (Eq. 1), representing the residuals (the difference between measured AT values and those predicted from SSS) and capturing variability not explained by salinity alone. AT was calculated at the times of the SSS observations (Curbelo-Hernández et al., 2021a, b, 2023) using Eq. (1). A Monte Carlo simulation was employed to propagate the uncertainties from both the linear model parameters (slope and intercept) and the ε term: 10 000 simulations were conducted for each SSS observation by generating random realizations of the regression parameters from normal distributions centred at their best-fit values with standard deviations equal to their respective standard errors. Similarly, random realizations of ε were performed from a normal distribution characterized by the mean and standard deviation of ε. This yielded a full probability distribution of estimated AT values for each observed SSS, from which the ensemble mean, standard deviation, and 95 % confidence intervals were computed. The propagated uncertainty in AT estimates, considering the errors in AT determination and SSS measurements (Sect. 2.3) and the linear model uncertainty, was approximately ± 5.7 µmol kg−1. This error in AT estimation falls within the accepted uncertainty range of ± 10 µmol kg−1 for AT when used as an input variable alongside fCO2,sw (when its uncertainty is up to ± 2 µatm) for the calculation of other MCS variables aligning with the criteria for the “weather goal” level of measurement quality (Steinhoff and Skjelvan, 2020). This new AT–SSS relationship is applicable for estimating AT in surface seawaters within the western Mediterranean Sea that are predominantly influenced by conservative processes and where non-salinity factors such as biological activity and fluvial inputs are limited. This includes waters with salinities in the range of 36 to 38.5.
pH and CT calculation
The pH and CT were calculated at the times of the underway observations using the CO2SYS program developed by Lewis and Wallace (1998) and run with the MATLAB software (van Heuven et al., 2011; Orr et al., 2018; Sharp et al., 2023). The fCO2,sw and AT were used as input CO2 system variables. The set of constants used for the computations includes the carbonic acid (H2CO3) dissociation constants of Lueker et al. (2000), the sulfuric acid (HSO4) dissociation constant of Dickson (1990), the hydrofluoric acid (HF) dissociation constant of Pérez and Fraga (1987), and the total boron concentration ([B]T) determined by Lee et al. (2010). The effect of temperature on pH was removed by computation at a constant temperature of 19 °C, which is the mean temperature within the observational period (referred to as pH19). Further data adjustments and statistical procedures are detailed in Appendix A.
2.4.2 Thermal and non-thermal fCO2,sw
The relative influence of the thermal and non-thermal processes on the variation of fCO2,sw has been addressed. The non-thermal processes mainly include the biological and carbonate pumps, circulation patterns, and air–sea gas exchange (De Carlo et al., 2013). The collectively known methodology presented by Takahashi et al. (2002) with the experimentally determined temperature effects on pCO2 for isochemical seawater of 0.0423 °C−1 (Takahashi et al., 1993) was used. This procedure was previously applied to ES-SOOP-CanOA data and detailed by Curbelo-Hernández et al. (2021a, b). An alternative procedure recently introduced by Fassbender et al. (2022), detailed by Rodgers et al. (2023), and modified from the Takahashi et al. (2002, 1993) framework was also applied in this investigation. This updated method addresses the slight variations in the thermal sensitivity of fCO2,sw due to background chemistry (Wanninkhof et al., 1999, 2022), which introduce a slight difference between the observed seasonal cycle of fCO2,sw and the calculated seasonal cycle through the sum of its thermal and non-thermal components. The Takahashi et al. (2002) and Fassbender et al. (2022) procedures are referred to hereinafter as T'02 and F'22, respectively.
The new approach in F'22 for the thermal component of fCO2,sw (fCO2, T FASS) was computed from the annual means (denoted with the subscript “AM”) of SSS, AT, and CT at in situ temperature (Eq. 2) using the CO2SYS program (Lewis and Wallace, 1998) for MATLAB (van Heuven et al., 2011; Orr et al., 2018; Sharp et al., 2023). Then, the thermally driven change in fCO2,sw (fCO2, T anom) can be calculated as the difference between the thermal component of fCO2,sw (fCO2, T FASS) and the annual mean of fCO2,sw (Eq. 3).
The new approach in F'22 for the non-thermal component (fCO2, NT FASS) is given by the difference between fCO2,sw at the times of the observations and fCO2, T anom (Eq. 4). The difference between fCO2, NT FASS and the annual mean of fCO2,sw provides the change in fCO2,sw that is explained by non-thermal processes (fCO2, NT anom) (Eq. 5).
Considering the seasonal amplitudes of fCO2,T and fCO2,NT (dfCO2,T and dfCO2,NT), the relative importance of thermal and non-thermal processes was expressed by the ratio (dfCO2,T dfCO2,NT), with values greater than 1 indicating that the temperature effect governs the fCO2,sw variations.
2.4.3 Factors controlling the seasonal amplitude of fCO2,sw
The changes in the surface fCO2,sw result from the combined variation in the physical and biochemical seawater properties. The seasonal variability of the surface fCO2,sw was addressed by attending to the partial contributions of SST, SSS, CT, and AT (e.g. Takahashi et al., 2014). The influence of each driver was quantified by assuming linearity and employing a first-order Taylor series deconvolution (Sarmiento and Gruber, 2006) given in Eq. (6) and previously used for pCO2 (Doney et al., 2009; Lovenduski et al., 2007; Takahashi et al., 1993; Turi et al., 2014) and pH (Fröb et al., 2019; García-Ibáñez et al., 2016; Pérez et al., 2021; Takahashi et al., 1993; Curbelo-Hernández et al., 2024a).
Seasonal changes in each driver (SST, SSS, CT, and AT) in Eq. (7) were assumed as their differences per month elapsed between the times of the year in which fCO2,sw was at its minimum and maximum (seasonal amplitudes). Seasonal amplitudes were calculated between monthly means (based on observations and computed data) for February and September (when the minimum and maximum fCO2,sw values were observed). An error propagation based on standard deviations for February and September was performed to calculate the error of the seasonal change.
Due to the high relevance of the evaporation and precipitation processes in the Mediterranean Sea and in order to avoid the influence of freshwater fluxes, the most recent equation (Eq. 7) given by Pérez et al. (2021) with salinity-normalized CT and AT (NCT and NAT) was used. The normalization was performed to a reference salinity (SSS0) of 37.4 (NCT= SSS0 × SSS; NAT= ((AT−728.3) SSS) × SSS0+728.3, following Friis et al., 2003), which is the average SSS for the entire monitored area.
It is important to note that the changes in NAT and NCT are linked to biogeochemical processes which have different influences: the processes involved in the organic carbon pump contribute to strongly changing the NCT that weakly affects the NAT, while those involved in the carbonate pump affect the NAT twice as much as NCT. The positive values of and indicate an increase in fCO2,sw from February to September, while the negative values do the opposite.
2.4.4 Air–sea CO2 fluxes
The air–sea CO2 fluxes (FCO2) were determined using the bulk formula in Eq. (8):
where K0 is the solubility of CO2 in seawater, K660 is the gas transfer velocity, and ΔfCO2 represents the difference between fCO2,sw and fCO2,atm. A conversion factor of 0.24 was used to express FCO2 values (mmol m−2 d−1). K0 was calculated using the equation and coefficients given by Weiss (1974) and measured the SST and SSS which fall within the valid application limits. Considering the fitting error from the original parameterization of K0 ( mol L−1 atm−1; Weiss, 1974) and the instrumental errors of the SST and SSS measurements (Sect. 2.3), the uncertainty associated with the solubility estimation had a negligible impact on the calculation of FCO2. K660 was calculated through its quadratic dependency on wind speed (Eq. 9) using the parameterization given by Wanninkhof (2014):
where w is the wind speed and Sc is the Schmidt number (kinematic viscosity of seawater, divided by the gas diffusion coefficient). ERA5 hourly wind speed reanalysis data at 10 m above sea level and with a spatial resolution of 0.25° × 0.25° (Hersbach et al., 2023) were used to calculate K660. ERA5 for the global climate and weather is available at the Copernicus Climate Data Store (https://cds.climate.copernicus.eu/; last access: 15 May 2025). The uncertainty in K660 reported by Wanninkhof (2014) when using wind speeds ranging between 3 and 15 m s−1 is ± 20 %. The error in the determination of fCO2,sw and fCO2,atm (Sect. 2.4.1) propagates into the calculation of ΔfCO2 and constitutes an additional source of uncertainty. The statistical procedure used to quantify the uncertainty in FCO2 arising from the uncertainty in ΔfCO2 is described in Appendix B. The mean absolute error in FCO2 due to the propagated uncertainty of ΔfCO2 (± 2.01 µatm) was ± 0.14 mmol m−2 d−1, which in relative terms is ± 0.05 %. Negative FCO2 values indicate that the ocean acts as an atmospheric CO2 sink, while the positive values indicate that it acts as a source.
A total of 157 984 data for surface ocean xCO2 were collected during the study period (34 015 data during 2019, 28 590 data during 2020, 33 288 data during 2021, 19 102 data during 2022, 39 738 data during 2023, and 3251 data during January and February 2024). This exceeds the total number of data points available in the historical record for the western Mediterranean (34.8–43.1° N, 5.5° W–4.7° E) since 1999 (146 094 data) that are available in SOCAT v2024 (Bakker et al., 2016, 2024). The total number of data points in this region included in the SOCAT v2024 database since 2019 is 44 520.
Due to differences in the spatial distribution of the observations, two subregions (referred to as sections) were identified along the vessel track (Fig. 1): the longitudinally distributed southern section (hereinafter S section), encompassing the Alboran Sea (∼ 2–5.1° W), and the latitudinally distributed eastern section (hereinafter E section), following the eastern coastline of the Iberian Peninsula (∼ 36.5–41.3° N). The spatiotemporal distribution of fCO2,sw and the total number of data points available in each dataset for sections S and E are shown in Fig. S2. In the S section, fCO2,sw values from the ES-SOOP-CanOA station are consistent with those in SOCAT v2024, although the limited number of cruises covering this section in SOCAT v2024 makes a direct comparison difficult and prevents robust characterization of spatial and seasonal variability patterns. In the E section, some differences between the two datasets are observed (i.e. during spring–summer 2021, fCO2,sw was higher in SOCAT v2024 than in the ES-SOOP-CanOA dataset). These differences are mainly explained by the distinct sampling trajectories in SOCAT v2024, with some routes extending further eastward, including coastal areas around the Balearic Islands.
The spatial distribution of the average values allowed us to identify heterogeneity in the annual cycle of each variable along both sections (Figs. 2 and S3). The standard deviation of the spatially averaged variables is presented in Table S2. A strong west–east increasing gradient in SST was observed in summer through the S section (∼ 5.5 °C), which led to an increment in fCO2,sw of ∼ 57.5 µatm and a depletion in pH of ∼ 0.040 units eastward across the Alboran Sea. Despite the approximately constant SST through the S section during the rest of the year (less than 1.5 °C difference between the westernmost and easternmost parts), an eastward decrease in fCO2,sw of less than 18 µatm accompanied by an increase in pH of less than 0.030 units was observed between October and March.
The latitudinal gradient of SST through the E section was weaker throughout the year, keeping the fCO2,sw and pH spatially stable. The maximum change in SST occurs during winter, in which a northward decrease of less than 2 °C explained the minimum seasonal average temperatures and fCO2,sw through the cruise track (14–15 °C and 350–360 µatm, respectively). This contrasts with the maximum average temperatures and fCO2,sw encountered during summer (25.0–26.5 °C and 450–470 µatm, respectively). These results indicated that the maximum amplitude of the seasonal cycle of SST, fCO2,sw, and pH occurs along the eastern coastline of the Iberian Peninsula and especially over the continental shelf between Valencia and Barcelona (northernmost part of the E section), while the minimum seasonal amplitude occurs near the Strait of Gibraltar (westernmost part of the S section).
The spatial variations in CT were significant throughout the year along both sections (Fig. 2). CT increases eastward in the order 20–45 µmol kg−1 along the S section throughout the year. This increment accelerated along the E section from the Cape of Gata to the Cape of Nao and became approximately stable from the Cape of Nao to the port of Barcelona. The spatial distribution of CT was greatly influenced by the progressive salinification observed along the S section. The SSS increased during the entire annual cycle from 36.3–36.5 around the eastern part of the Strait of Gibraltar to 37.7–38.1 around the Cape of Nao (Fig. S3). Removing the effect of salinity, NCT (Fig. S3) presents a weaker spatial variation through the vessel track that is mainly led by biological and mixing processes.
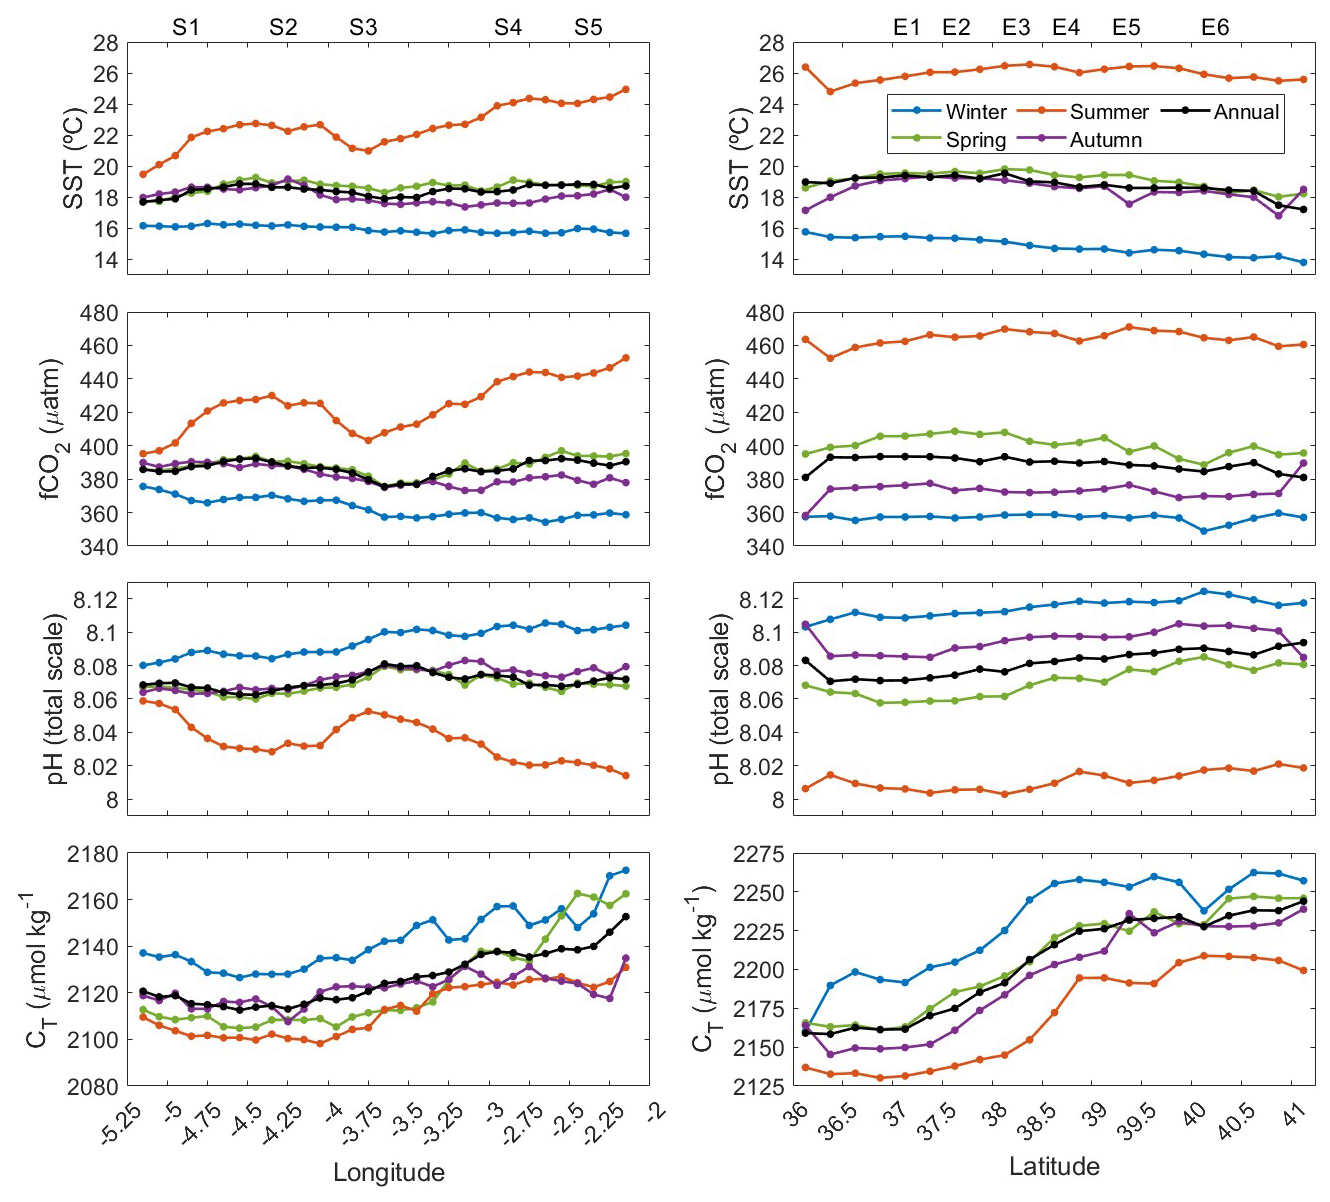
Figure 2Spatial distribution of the average SST, fCO2,sw, pH, and CT calculated on seasonal and annual bases every 0.1° in longitude along the S section (left panels) and every 0.25° in latitude along the E section (right panels). The 3-month periods January–March, April–June, July–September, and October–December were considered to be winter, spring, summer, and autumn, respectively. Note the different scales used for CT due to significant variations in the S and E sections. The standard deviations are provided in Table S1 and indicate the range of variability in the study period.
The surface physicochemical properties show heterogeneities during some seasons of the year in several key locations along the sections (Figs. 2 and S3). The heterogeneities in the temporal evolution of the SST, SSS, and CO2 system variables were assessed by the strategic selection of five stations along the S section (stations S1–S5) and six stations along the E section (stations E1–E6), which are depicted geographically in Fig. 1. S1 (4.95 ± 0.05° W) occupied the easternmost part of the Strait of Gibraltar, S2–S4 (4.35 ± 0.05° W, 3.85 ± 0.05° W, and 2.95 ± 0.05° W) were located in the central Alboran Sea, and S5 (2.45 ± 0.05° W) was located south of the Cape of Gata. The stations along the E section include E1 (37.1 ± 0.2° N) in the Gulf of Mazarron, E2 (37.6 ± 0.2° N) to the east of the Cape of Palos, E3 (38.2 ± 0.2° N) in the Gulf of Alicante, E4 (38.7 ± 0.2° N) to the east of the Cape of Nao, E5 (39.3 ± 0.2° N) in the Gulf of Valencia over the continental slope, and E6 (40.2 ± 0.2° N) near the Ebro estuary over the continental shelf.
The temporal variations of each variable at S1–S5 and E1–E6 are depicted in Figs. 3, 4, S4, S5, and S6. The seasonal amplitudes and interannual trends are summarized in Table 1. The seasonal amplitude of SST (minimum values in February–March around 14–17 °C and maximum values in August–September around 20–26 °C) increased eastward through the S section, with however a local decrease at S2 (Figs. 3 and S4, Table 1). The seasonal changes were larger through the E section (∼ 14 to ∼ 28 °C) and show weaker spatial variations (Figs. 4 and S5, Table 1). The SSS (Fig. S6) does not exhibit a seasonal cycle that is correlated well with the harmonic function in Eq. (A1) (r2 < 0.5; Table S2). The lower and spatially more stable SSS values were observed along the S section during the entire period (around 36.0–37.5), with an increase with latitude through the E section (around 36.7–38.1).
Table 1Seasonal amplitudes and interannual trends of SST, SSS, fCO2,sw, pH, pH19, CT, and NCT. The seasonal changes were calculated as the amplitude of Eq. (A1) fitted to the weekly average data at each station. The error of the seasonal amplitudes was assumed to be the result of the standard error of the estimate given by the harmonic function multiplied by 2. The interannual changes were based on linear regressions and are given for each station and for the entire S and E sections (considering the total amount of average data at S1–S5 and E1–E6, respectively) during the cold and warm seasons. The interannual trends of SST during 2000–2019 (based on monthly reanalysis data from the Med MFC physical multiyear product (Escudier et al., 2020; 2021; Nigam et al., 2021) detailed in Sect. 4.2) were included for comparison. The trends were obtained from the linear regressions of the seasonally detrended weekly average data and include their standard error of the estimate. denotes that the trends are statistically significant at the 99 % level of confidence, at the 95 % level of confidence, and * at the 90 % level of confidence.
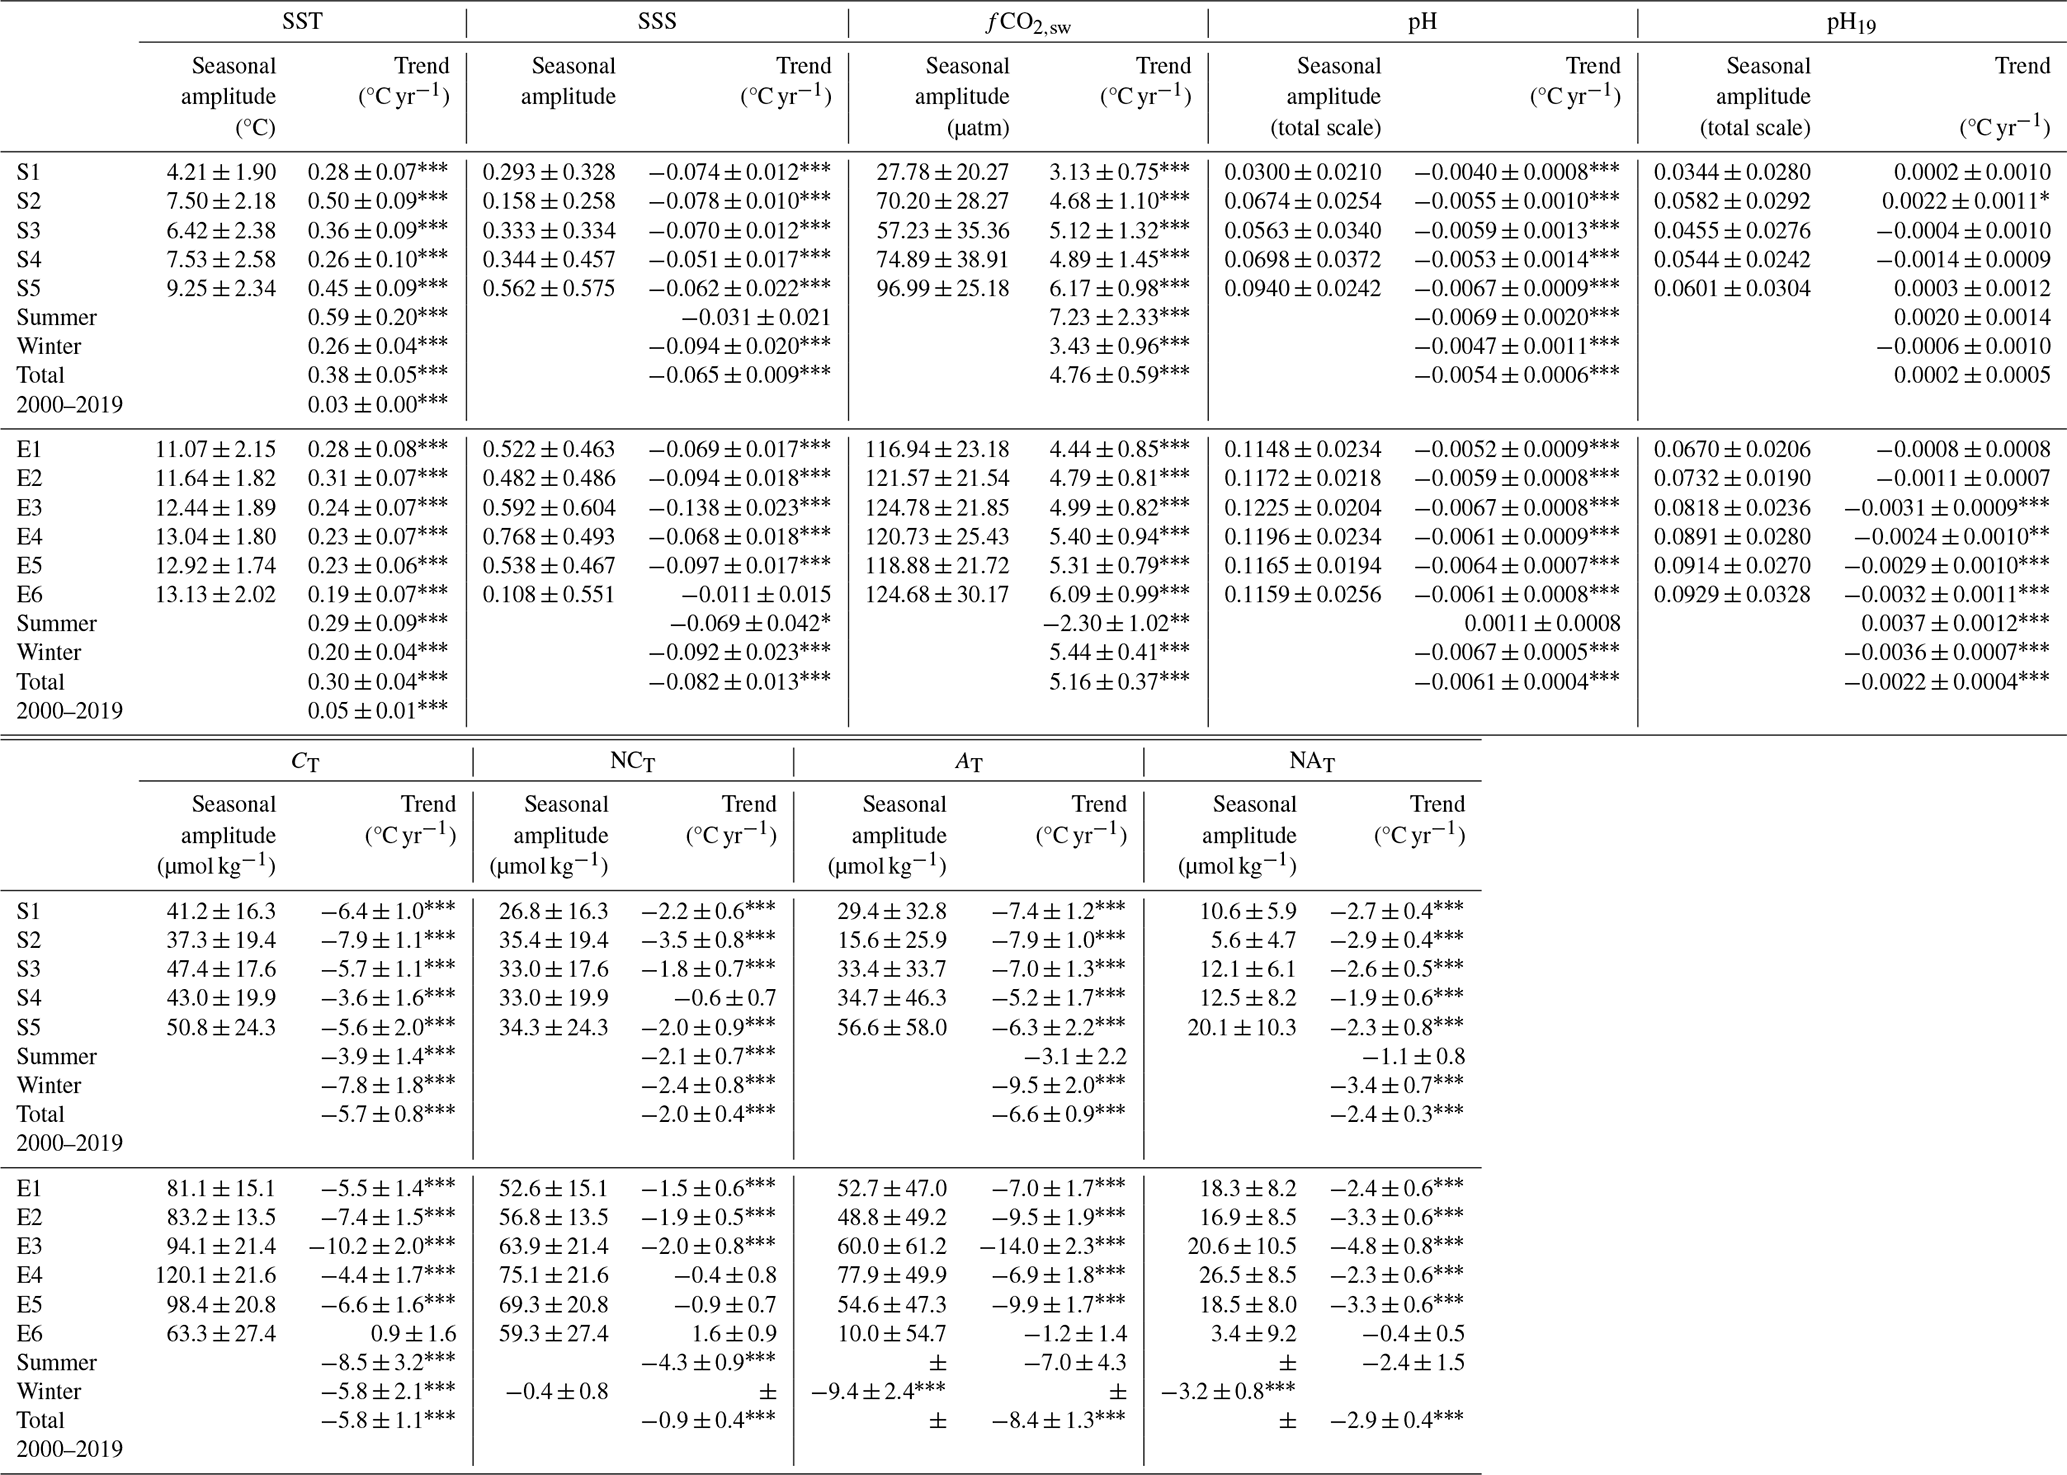
The seasonal amplitudes of fCO2,sw (from ∼ 340 to ∼ 460 µatm in the S section and from ∼ 340 to ∼ 470 µatm in the E section) and pH (from ∼ 8.00 to ∼ 8.12 units in the S section and from ∼ 8.00 to ∼ 7.98 to ∼ 8.13 units in the E section) were strongly linked to those of SST. They exhibit a west–east increment through the S section, with the exception of S2 (Figs. 3 and S4, Table 1), and remain approximately constant through the E section (Figs. 4 and S5, Table 1). These spatial heterogeneities in the seasonal cycles were found to be caused by the different rise in SST during late summer along each section, as minimal spatial differences were observed during the rest of the year.
CT (Fig. S6) decreased seasonally from January–February to September–October (from ∼ 2180 to ∼ 2085 µmol kg−1 in the S section and from ∼ 2260 to ∼ 2105 µmol kg−1 in the E section), in phase with the enhancement of biological production. The seasonal amplitude of CT increased eastward through the S section and northward through the E section, following the salinification gradient (Fig. S6, Table 1). Once the effect of salinity is removed, the seasonal cycle of NCT shows minimal differences in the S section between the western and easternmost parts, while in the E section the NCT and its seasonal amplitude increased northward (Fig. S6, Table 1). The enhanced adjustment (correlation) of NCT with Eq. (A1) (0.47 < r2 < 0.61 in the S section and 0.70 < r2 < 0.88 in the E section) compared to CT (0.28 < r2 < 0.56 in the S section and 0.45 < r2 < 0.73 in the E section) emphasizes the relevance of the processes varying the salinity. The lower correlations encountered through the S section show the higher impact of occasional processes (i.e. changes in the evaporation, precipitation, river runoff, and mesoscale features), locally modifying the surface carbon system in this area and introducing spatial heterogeneities into their seasonal cycles.
4.1 Spatial characterization of the CO2 system and its seasonality
4.1.1 The Alboran Sea
The seasonal variability of the AJ (García Lafuente et al., 2002; Macías et al., 2008, 2016; Vargas-Yáez et al., 2002) modified the SST signature in the S section, thus influencing the fCO2,sw and pH. The maximum intensity of the AJ during summer (Peliz et al., 2013; Renault et al., 2012) caused a more intense warming and salinification of MAW while advancing into the Mediterranean Sea and mixing with the fraction of MW which surrounds the Cape of Gata and recirculates westward (Millot, 1999; Sánchez-Garrido et al., 2013). It explained the eastward increase in fCO2,sw and the decrease in pH at this time of the year (Fig. 2; Sect. 3.1).
The relatively low SST and fCO2,sw around S1 (20.68 ± 2.20 °C and 401.68 ± 27.13 µatm) and S3 (21.15 ± 2.11 °C and 407.30 ± 26.20 µatm) were mainly due to the highest intensity of the wind-induced upwelling along the northern coast of the western Alboran Sea during the warm season. This cooled the surface and enhanced the biological drawdown (e.g. Bolado-Penagos et al., 2020; Folkard et al., 1997; Gómez-Jakobsen et al., 2019; Peliz et al., 2009; Richez and Kergomard, 1990; Stanichny et al., 2005) while favouring the formation of the cold and nutrient-rich filament separating the WAG and EAG (Gómez-Jakobsen et al., 2019; Millot, 1999). Differences in the influence and strength of this filament may have contributed to the observed heterogeneities in SST, fCO2,sw, and pH at S1 during the warm season (Fig. 3), which in turn accounts for the reduction in the model's fitting performance. Additionally, the shallowest position of the AMI during late winter (de la Paz et al., 2009; Echevarría et al., 2002; Gómez-Jakobsen et al., 2019; Minas et al., 1991) fed the surface with CO2-rich waters from deeper areas of the Mediterranean Sea (de la Paz et al., 2009; Echevarría et al., 2002; Gómez-Jakobsen et al., 2019; Minas et al., 1991), elevating fCO2,sw around S1. The increase in CT and NCT during summer around S3 (Figs. 2 and S3), which contributed to reducing their seasonal amplitudes in this area (Fig. S6, Table 1), suggests that the upwelled waters transported by the filament at this time of the year were not remineralized enough to compensate for the SST-driven decrease in fCO2,sw. As a consequence, the western and eastern edges of the WAG presented the shortest seasonal amplitudes along the S section for SST, fCO2,sw, and pH (Fig. 3, Table 1).
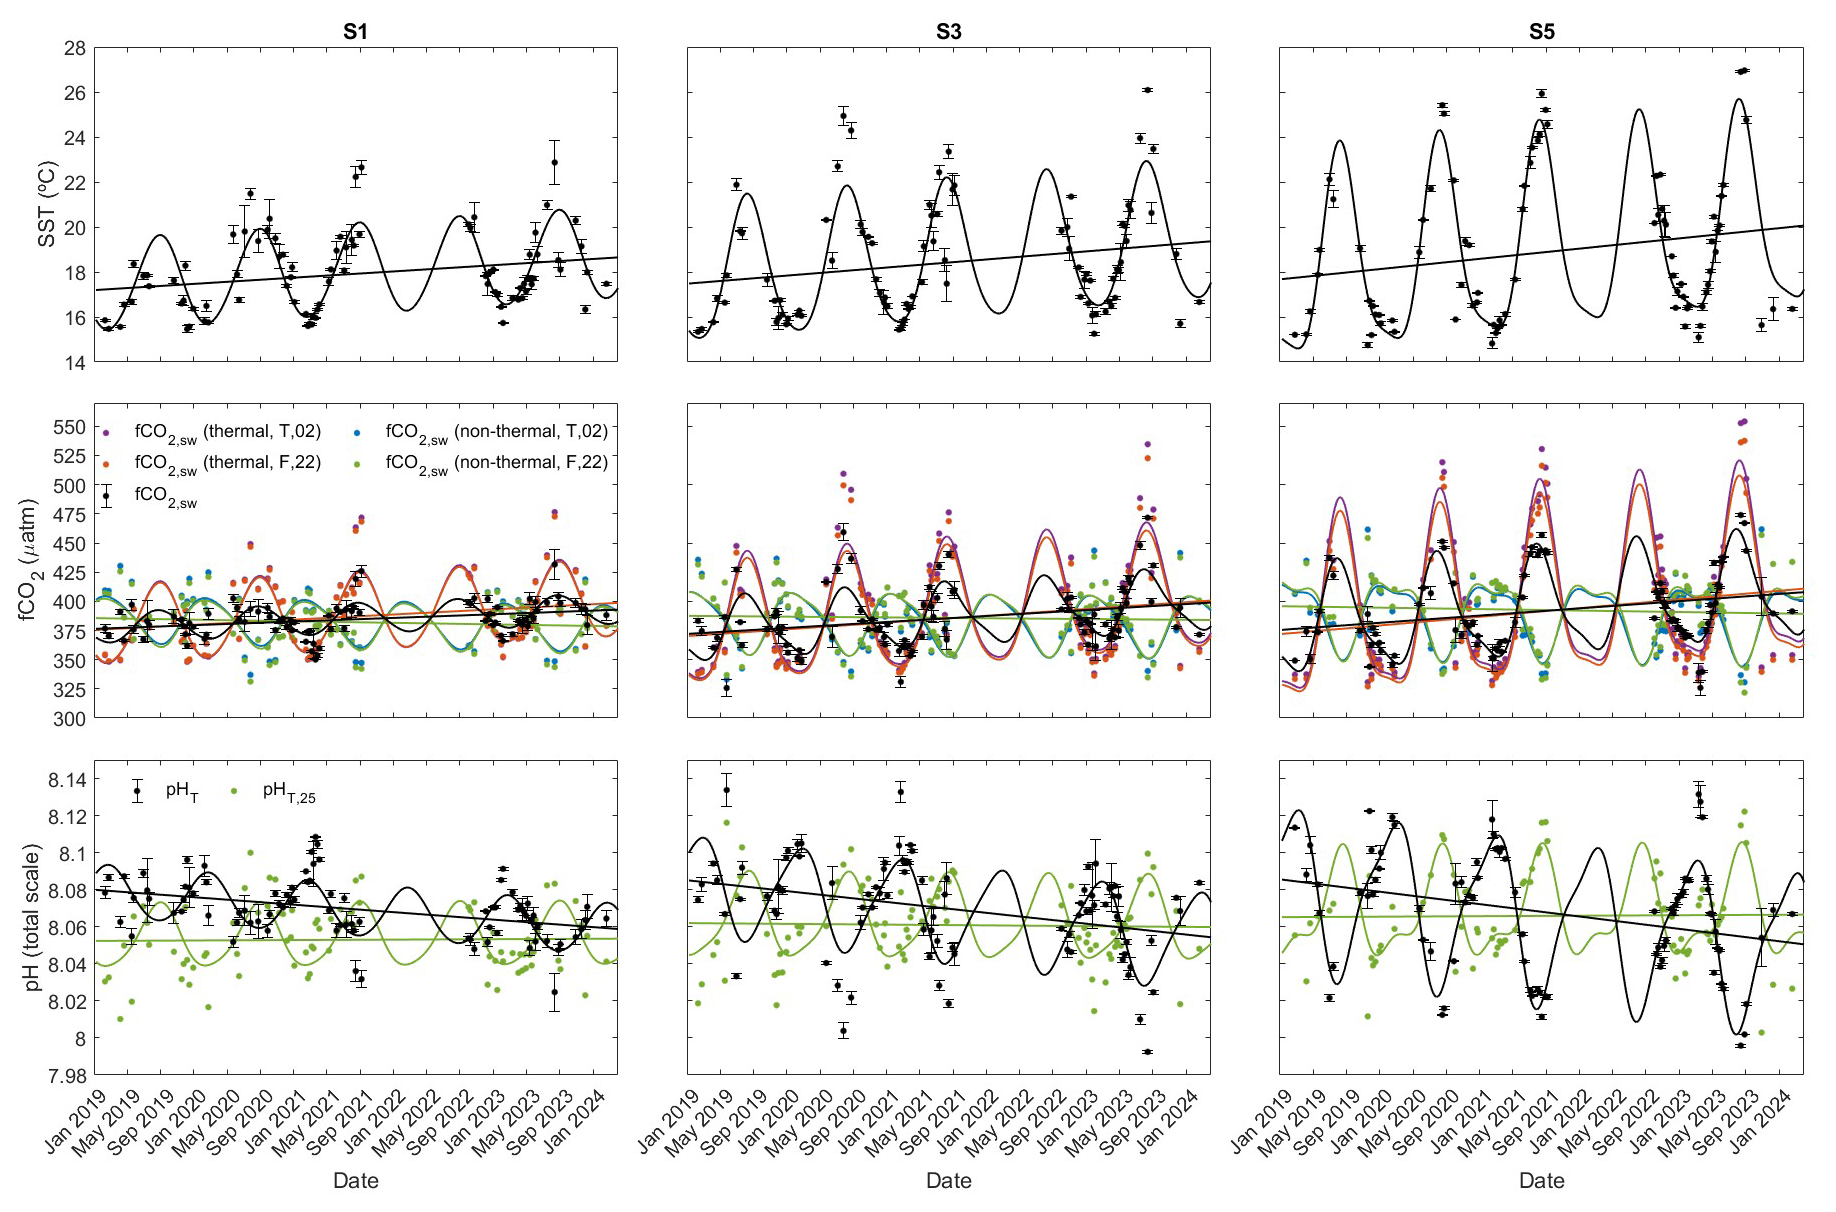
Figure 3Time series of SST, fCO2,sw, and pH at S1, S3, and S5 along the eastern Iberian margin within the 5 years of observations. The weekly average data were fitted to the harmonic Eq. (A1). The thermal and non-thermal terms of the average fCO2,sw calculated by following the procedures of Takahashi et al. (2002) (T'02), Fassbender et al. (2022) (F'22), and pH19 are depicted. The coefficients a–f, standard errors of the estimate, and r2 as given by Eq. (A1) are presented in Table S1.
Conversely, the increase in SST and fCO2,sw during summer around S2 (22.63 ± 2.05 °C and 429.98 ± 24.86 µatm), S4 (23.89 ± 2.03 °C and 438.25 ± 25.22 µatm), and S5 (24.05 ± 1.61 °C and 441.67 ± 16.22 µatm) contributed to extending their seasonal amplitudes in these zones (Figs. 2 and 3; Table 1). This suggests that, during the warm season, the increase in fCO2,sw led by the surface warming near the core of the gyres was not compensated by the biological drawdown occurring at this time of the year (which caused weak decrements in CT and NCT at S2; Figs. 2 and S3).
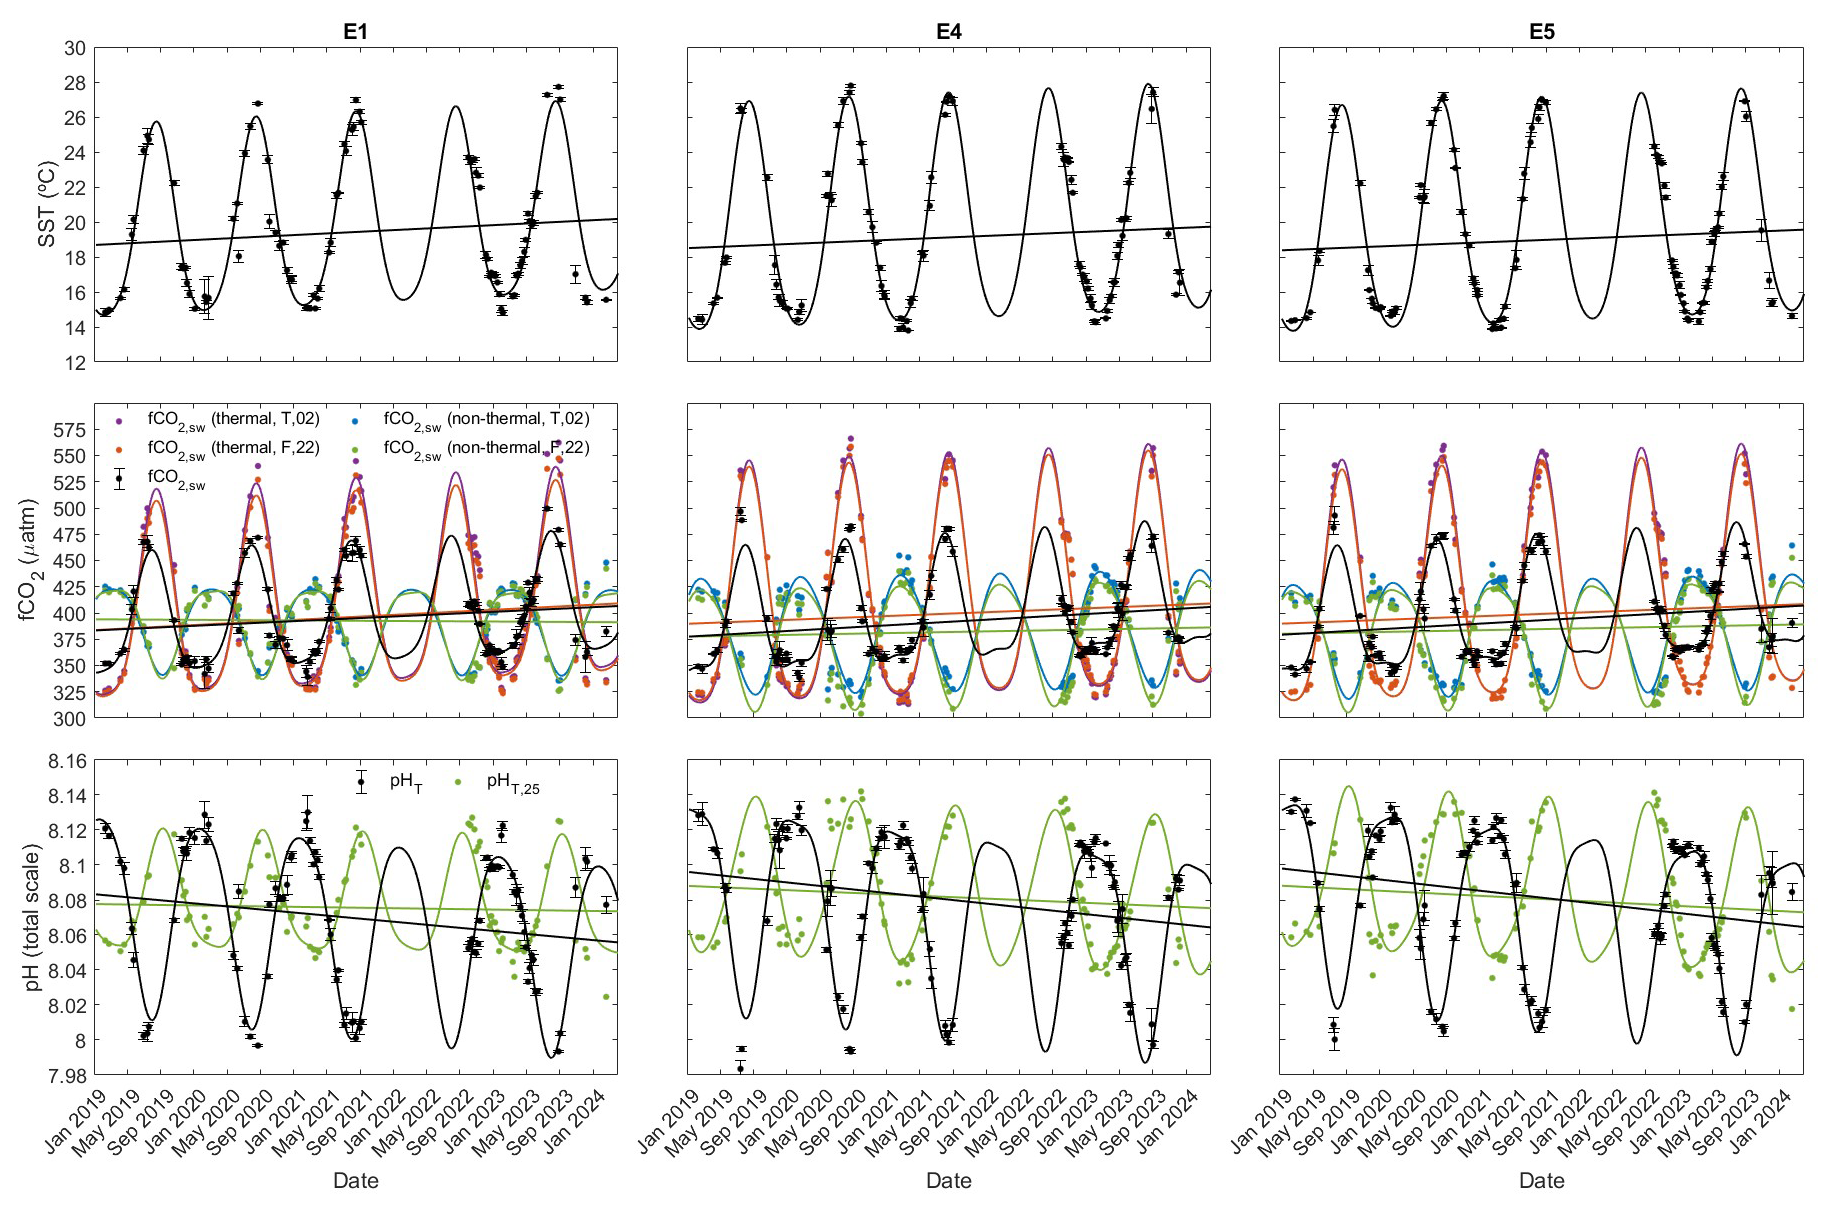
Figure 4Time series of SST, fCO2,sw, and pH at E1, E4, and E5 in the Alboran Sea within the 5 years of observations. The weekly average data were fitted to the harmonic Eq. (A1). The thermal and non-thermal terms of the average fCO2,sw calculated by following the procedures of Takahashi et al. (2002) (T'02), Fassbender et al. (2022) (F'22), and pH19 are depicted. The coefficients a–f, standard errors of the estimate, and r2 as given by Eq. (A1) are presented in Table S1.
4.1.2 The eastern Iberian margin
The eastern coastal transitional area of the Iberian Peninsula was subject to variability related to changes in the intensity, morphology, and path of the Northern Current (Fig. 1b). The SST decreased in the northernmost part of the E section from Sagunto to Barcelona throughout the year (north of S5; Fig. 2). The cooling of this area intensified during the cold season due to the mixing of warm waters in the wind-shielded area north of the Cape of Nao, with cool and salty MW transported by the Northern Current. However, it weakened during the warm season due to the northward spreading of MAW favoured by the formation of the thermal front in the axis of the Pyrenees, changing the path of the Northern Current (López-García et al., 1994). In the southernmost part of the section, the enhanced northward spreading of MAW and less wind stress during summer drive the warming observed from the Cape of Gata (at S5) to the Cape of Nao (at E4), while a low-intensity branch of the Northern Current transporting MW and progressing southward of the Cape of Nao weakly cool the area during winter (López-García et al., 1994; López-Jurado et al., 1995).
The local decrease in SST and fCO2,sw observed during the warm seasons at E4 traced the offshore recirculation of the Northern Current at the Cape of Nao (Millot, 1999) and separated the E section into its northernmost and southernmost areas. This division was also evident based on the CT and NCT signatures (Figs. 2 and S6): the northernmost part of the section received remineralized MW transported by the Northern Current, which elevates CT and NCT, while the southernmost part was supplied with recent MAW with relatively low CT and NCT. Additionally, Ulses et al. (2023) recently suggested that the convective area in the Gulf of Lion acts as a source of natural and anthropogenic carbon for the intermediate waters of the western Mediterranean, which can enter the surface through vertical mixing and account for the observed high amount of CT and NCT.
Although the spatial heterogeneities and the northward cooling during the cold season (Fig. 1) increased the seasonal changes in SST, the seasonal amplitudes of fCO2,sw were approximately constant within E1–E6 (Figs. 3 and S5; Table 1). The location of station E5, away from the influence of the Northern Current during the warm months, explained its locally lower seasonal amplitudes compared to the adjacent waters in the northernmost part of the E section. Nevertheless, these heterogeneities were minimal and did not cause differences in the seasonal amplitude of pH (Table 1).
In the cases of CT and NCT (Fig. S6, Table 1), the enhancement in the mixing of MAW with MW during winter increased the seasonality northward from E1 to E4. In the northernmost part, the seasonal variations in CT and NCT became shorter due to their increment during the cold season. This was caused by the combined action of the enhanced arrival of remineralized MW at this time of the year and the mesoscale structures locally favouring injections of CO2-rich deeper waters into the surface (Bosse et al., 2021; Millot, 1999). The Ebro River runoff peaks in late winter and spring (Zambrano-Bigiarini et al., 2010) can also act as a source of variability around E5–E6.
4.2 Warming and interannual trends of MCS variables
The monitoring of the surface western Mediterranean basin allowed the identification of interannual trends for physical and MCS properties (Tables 1 and 2). The SST increased at rates of 0.38 ± 0.05 °C yr−1 in the S section and 0.30 ± 0.04 °C yr−1 in the E section. The rate of increase in SST that intensified locally at S2 (0.50 ± 0.09 °C yr−1) may be due to the transport and accumulation of surface waters towards the core of the WAG. Its variability, migration, and progressive collapse can also account for the rapid warming of the area (Sánchez-Garrido et al., 2013; Viúdez et al., 1998; Vélez-Belchí et al., 2005).
The SST trends based on ES-SOOP-CanOA data were of the same order of magnitude as those derived from reanalysis data for the period 2019–2024 but were 1 order of magnitude higher than the reanalysis-based trends for 2000–2019, indicating a reinforcement of sea surface warming by approximately 80 %–90 % (Table 1). The ES-SOOP-CanOA data-based interannual SST trends were found to be reinforced during summer by 55.2 % in the S section and by 32.4 % in the E section compared to winter. The Northern Current cooling the northernmost part of the E section decelerated the warming in comparison to the S section. The ES-SOOP-CanOA data-based trends reported cumulative increases in SST from 2019 to 2024 of 1.91 ± 0.26 °C in the Alboran Sea (S section) and 1.52 ± 0.22 °C along the eastern Iberian margin (E section). These cumulative increments were 48.3 % and 34.94 % higher than those estimated for the global surface ocean from 1850–1900 to 2001–2020 (0.99 ± 0.12 °C; IPCC, 2023). This aligns with projections from climate models for both terrestrial and marine environments at the middle latitudes, particularly within the Mediterranean region, which is a consequence of human-induced global warming detailed by Hoegh-Guldberg et al. (2018) in the AR6 Synthesis Report (IPCC, 2023).
The warming contributes to modifying the MCS dynamics, mainly accelerating the increase in fCO2,sw and the acidification. The interannual trends of fCO2,sw and pH (Table 1) were more than twice (except for the trends at S1) those reported for the north-western Mediterranean at the DYFAMED site based on the difference between the average observation-based data for the periods 1995–1997 and 2013-2015 (2.30 ± 0.23 µatm yr−1 and −0.0022 ± 0.0002 units per year; Merlivat et al., 2018) and for the north-eastern Atlantic at the ESTOC site based on in situ measurements since 1995 (2.1 ± 0.1 µatm yr−1 and 0.002 ± 0.0001 units per year, respectively; González-Dávila and Santana-Casiano, 2023). The interannual rates accelerated eastward along the S section and northward along the E section (Table 1). The stronger trends at S3 compared to adjacent waters (S2 and S4) may be due to the transport of CO2-rich waters from the southern Iberian coast through the filament. The trends in the S section were conducted by the larger rates of change encountered during the warm season compared to the cold season. The opposite occurred in the E section, where an intense increase in fCO2,sw accompanied by a drawdown in pH occurred during winter, and the trends were reversed during summer (Table 1).
These spatial differences between the cold and warm seasons were mainly linked to variations in the biological production, remineralization, and mixing and were independent of the surface ocean warming. Hence, they were required to be assessed together with the NCT trends for better understanding. The NCT decreases interannually throughout the region (Table 2). The rapid depletion in the S section during winter in comparison to summer could be due to, first, an interannual weakening in remineralization processes and/or inputs of CO2-rich water to the area during the cold months and, second, an interannual strengthening of the biological uptake during the warm months. However, these variations were insufficient to compensate for the increase in fCO2,sw and subsequent decrease in pH induced by warming during the cold months, and even more so during the warm months. Conversely, in the E section, the variations in lateral and vertical advection as well as primary driven variations in the (sub-)mesoscale structures (Alberola et al., 1995; Bosse et al., 2021; 2016; Bourg and Molcard, 2021) were of high relevance and introduced differences into the annual cycle of NCT. The interannual variations during winter were minimal (Table 1, Fig. S6), likely due to non-significant changes in remineralization and the dissolved CO2 concentration of waters transported into the area. The decrease in NCT intensified during summer (Table 1, Fig. S6), which was likely caused by the enhancement in biological production together with the weakening lateral advection (this may be related to a reinforcement in the front formed in the axis of the Pyrenees due to the increasingly higher SST of the MAW).
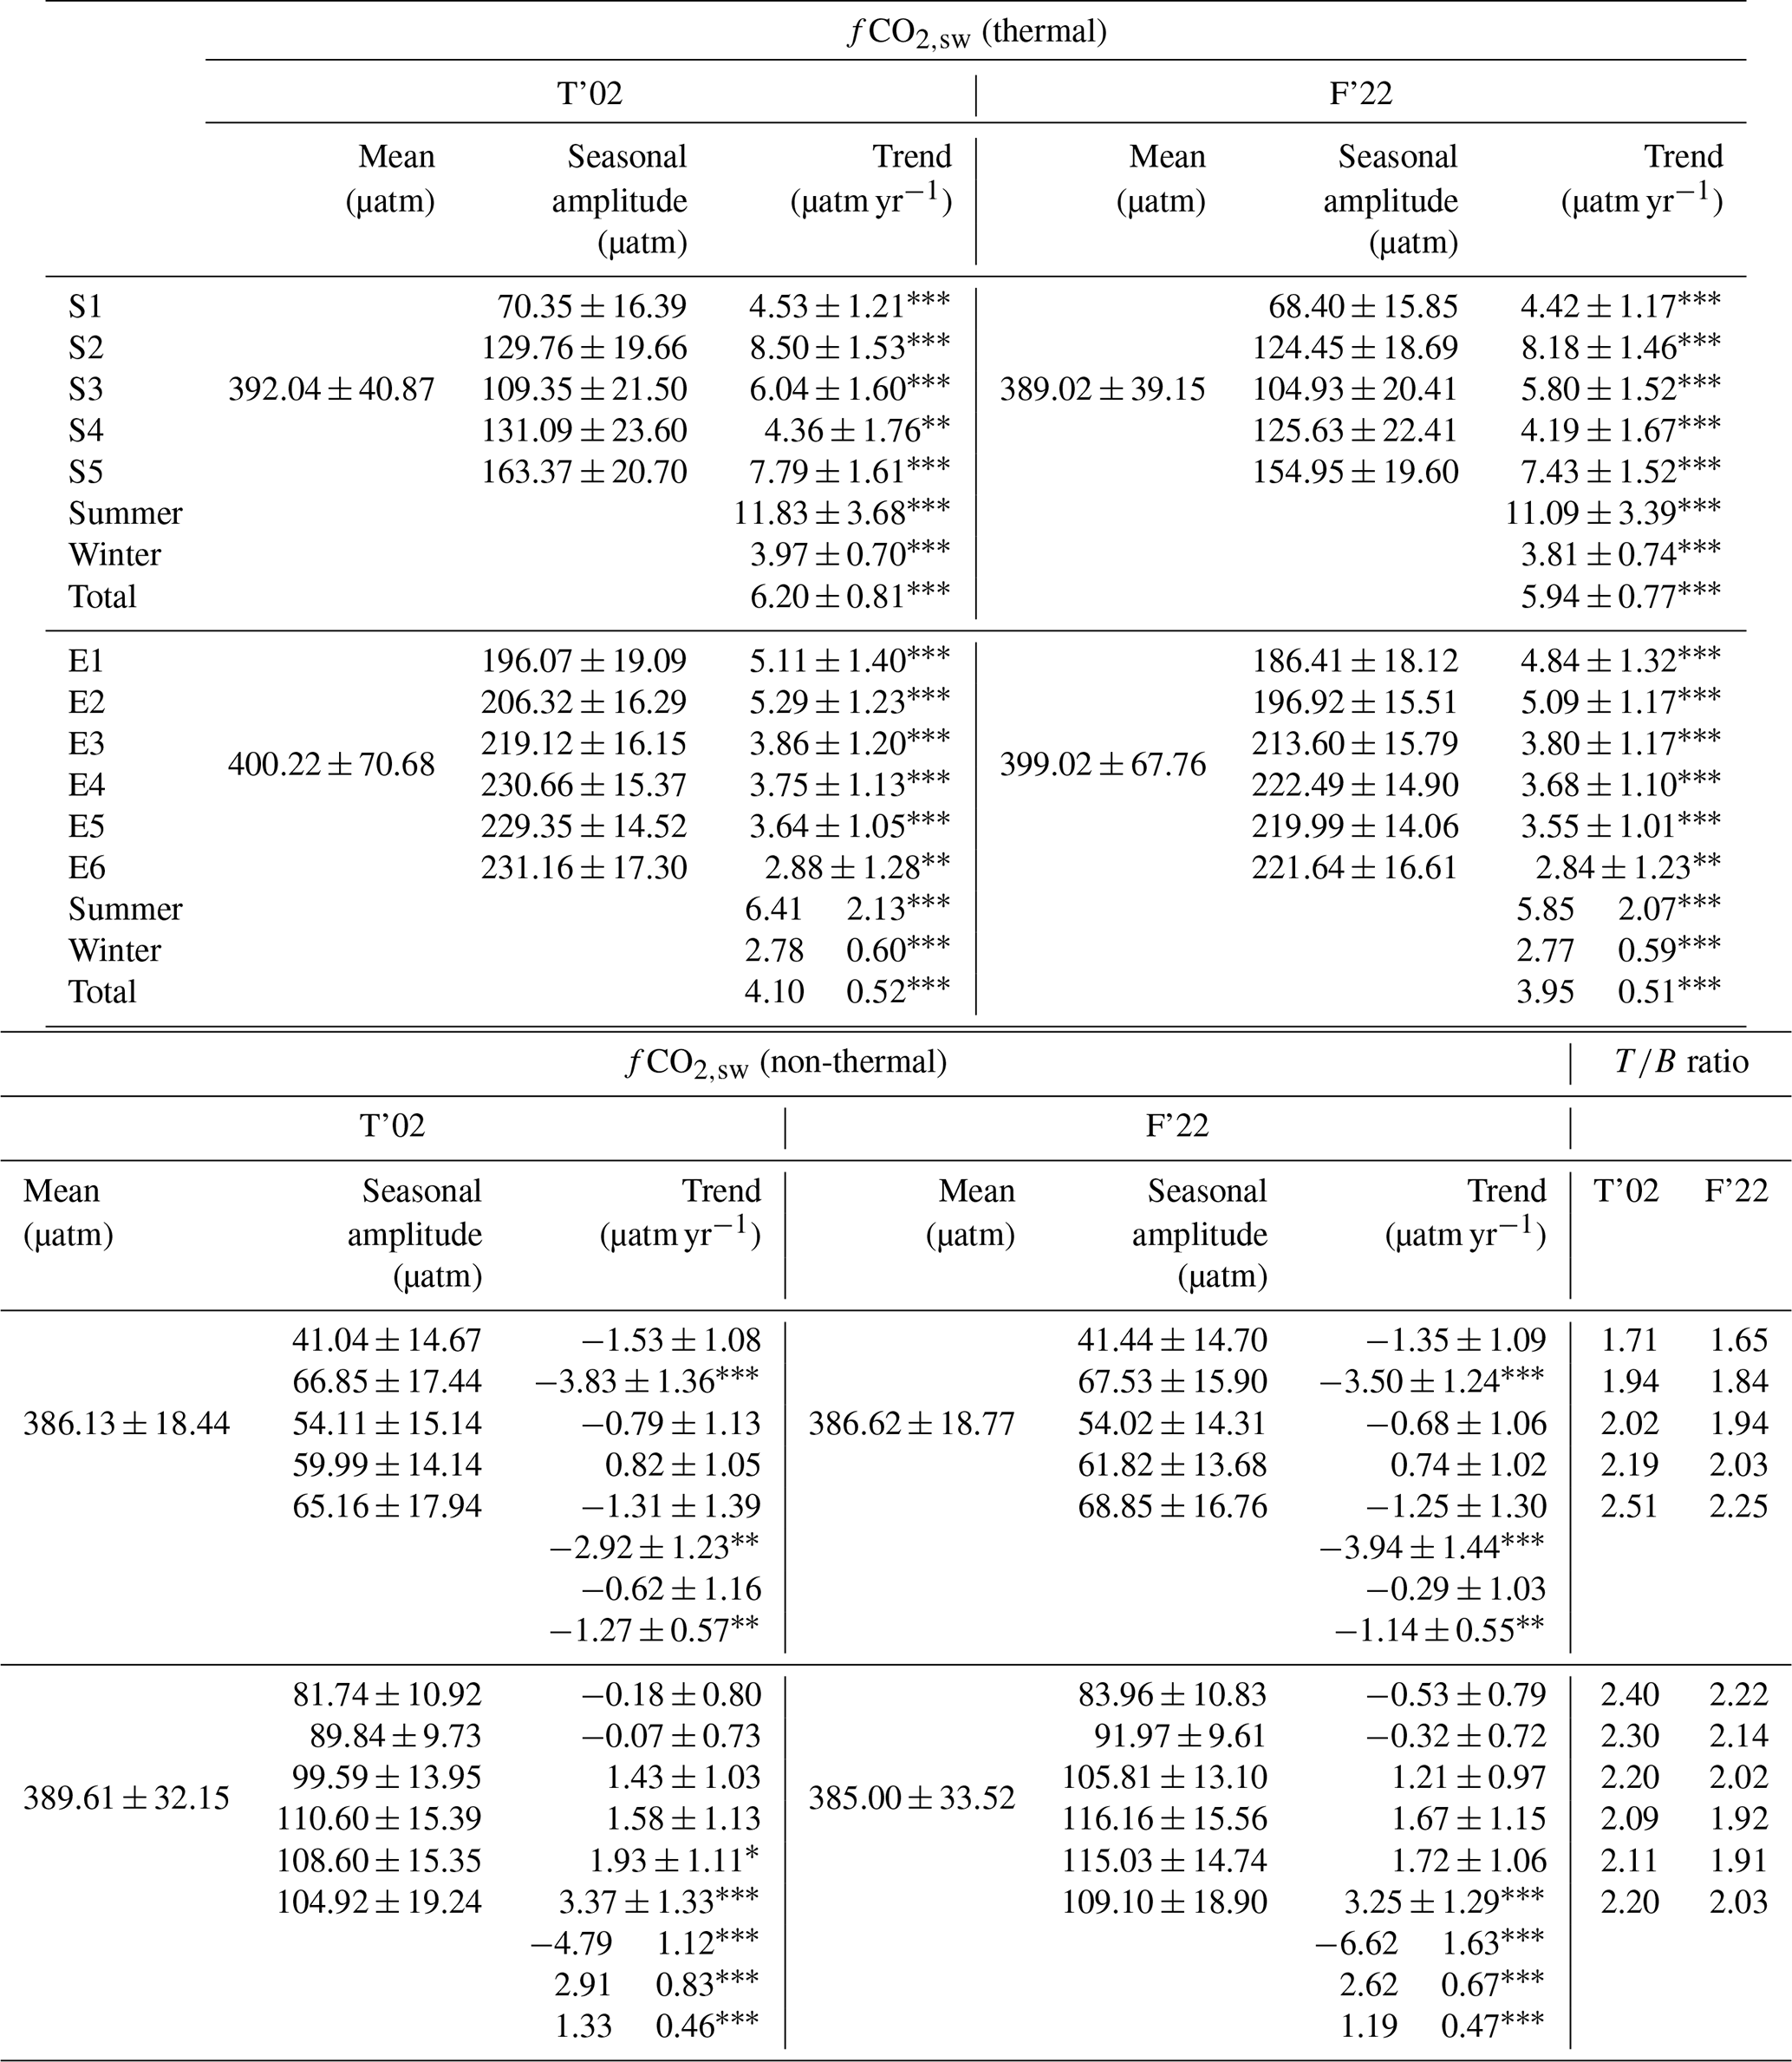
Table 2Means, seasonal amplitudes, and interannual rates of change of the thermal and non-thermal components of fCO2,sw (fCO2,T and fCO2,NT, respectively) calculated by following Takahashi et al. (2002) and Fassbender et al. (2022) (T'02 and F'22, respectively). The seasonal changes were calculated as the amplitude of Eq. (A1) fitted to the weekly average data at each station. The error of the seasonal amplitudes was assumed to be twice the standard error of the estimate given by the harmonic function. The trends were obtained by the linear regressions of the seasonally detrended weekly average data and include their standard error of the estimate. indicates that the trends are statistically significant at the 99 % level of confidence. is at the 95 % level of confidence and * at the 90 % level of confidence.
Once the effects of temperature were removed, the interannual pH19 trends became negligible and were not statistically significant in the S section (< −0.001 units per year and p values > 0.1). This suggests that warming is directly driving the acidification (and indirectly the rising fCO2,sw), while the progressively enhanced biological productivity partially compensates for the expected fall in pH. In the E section, pH19 was reduced by 63 % (−0.002 ± 0.001 units per year and p values < 0.01) in comparison to the pH trends, which explains why the increase in SST is contributing more than half of the acidification due to the atmospheric fCO2 increase only. The negative pH19 trends were reinforced in the E section by 47 % during the cold season due to the enhancement in remineralization. The pH19 trends reverted to being positive during the warm season due to the important role of biological production in actively decreasing fCO2,sw and increasing pH at this time of the year.
However, despite the high statistical confidence in the trends and the consistency found with the reanalysis products, the acceleration in the surface warming and the consequent observed changes in fCO2,sw and pH may be linked to isolated extreme events such as marine heat waves and are not necessarily indicative of prolonged behaviours over time. The globally increased frequency and magnitude in marine heat waves in phase with warming (Oliver et al., 2018; Hoegh-Guldberg et al., 2018; Frölicher et al., 2018; Smale et al., 2019) could provide feedback and hence continue to expedite the surface ocean warming. The influence of these extreme events is especially relevant in semi-enclosed seas as the Mediterranean, recognized as one of the most affected marine areas in the yearly Copernicus Ocean State Reports (OSR; EU Copernicus Marine Service; https://marine.copernicus.eu/access-data/ocean-state-report; last access: 15 May 2025) since 2016 (OSR1–OSR7).
4.3 The relative contributions of thermal and non-thermal processes to the surface fCO2,sw
The temporal evolution of fCO2,sw due to thermal and non-thermal effects (fCO2,T and fCO2,NT, respectively) showed a high degree of agreement between the T'02 and F'22 methodologies (Figs. 3 and 4). The average fCO2,T and fCO2,NT values differed by less than 5 µatm between the two methodologies. The consistency with the widely employed T'02 engenders confidence in the validity and reliability of the most updated F'22 method.
The seasonal variations in fCO2,sw were close to 2 times as high in the E section as in the S section (Table 1). The thermally driven seasonal changes (dfCO2,T) were found to be approximately double those independent of temperature (dfCO2,NT) throughout the region (Table 2). The ratios demonstrated the control of thermal processes on the seasonality of fCO2,sw throughout the region (Table 2). The ratios in the westernmost part of the S section (ranging between 1 and 2) were consistent with previous studies on the Strait of Gibraltar (Curbelo-Hernández et al., 2021b; de la Paz et al., 2009). The ratios increased eastward as the AJ advanced in the Alboran Sea and were caused by the intense increase in dfCO2,T compared to dfCO2,NT. They exceeded 2 in S4–S5 and E1–E6, which demonstrated the larger control of SST on fCO2,sw in areas less influenced by the input of surface Atlantic Water.
The interannual trends show the control of thermal processes on the increase in fCO2,sw during 2019–2024 (Figs. 3 and 4; Table 2). The strong and statistically significant interannual fCO2,T trends show the important role of warming in elevating fCO2,sw. The weak and non-significant fCO2,NT trends suggest that spatiotemporal variations in the biological processes, circulation patterns, and air–sea gas exchange introduced local differences into the distribution of fCO2,sw. It is difficult to assess the impact of the non-thermal processes on an interannual scale at each of the stations. The interannual trends of fCO2,T and fCO2,NT for the entire S and E sections (Table 2) were statistically significant at more than the 95 % level of confidence, and their coupling described, with a difference of less than 0.3 µatm yr−1 (< 1 %), the interannual rates of fCO2,sw during 2019–2024 (Table 1; Sect. 4.2).
The thermal processes govern the changes in fCO2,sw on an interannual scale, with contributions ranging between ∼ 76 %–92 % in the S section and ∼ 73 %–83 % in the E section. The contributions for fCO2,NT were between ∼ 8 %–25 % and ∼ 17 %–27 %, respectively. The decrease in fCO2,NT compensated by ∼ 6 %–30 % the increase in fCO2,sw at S1–S5 and E1–E2, while its increase contributed ∼ 24 %–53 % to raising fCO2,sw at E3–E6. The negative fCO2,NT trends in the S section were related to progressive enhancement in the biological uptake (mainly during spring/summer) not compensated by remineralization and/or vertical–lateral advection of remineralized waters (mainly during autumn and winter) in areas influenced by recent MAW. Conversely, the interannual increase in fCO2,NT in the E section suggests that the supply of cool and remineralized MW along the path of the high-intensity Northern Current surpasses the biological drawdown of surface CO2 and accelerates the increase in fCO2,sw on an interannual scale.
4.4 Mechanism controlling the seasonal cycle of fCO2,sw
To infer the causes of variations in the seasonal cycle of fCO2,sw in the study period, the seasonal rates of change in fCO2,sw (, hereinafter dfCO2) were decomposed into their individual components (, hereinafter dfCO) as described in Sect. 2.4.3 (Eqs. 6 and 7). The results of the solved Eq. (7) for each year at S1–S5 and E1–E6 are depicted in Fig. 5. The uncertainty associated with the difference between the monthly means for each term and year was obtained through error propagation considering their individual standard errors and is presented in Table S3. The dfCO2 resulted from the cumulative sum of the individual terms in Eq. (7) (indicated with the subscript “sum”) matching the dfCO2 calculated directly from observations between both seasons (indicated with the subscript “obs”), which instills confidence in the methodology (Fig. 5).
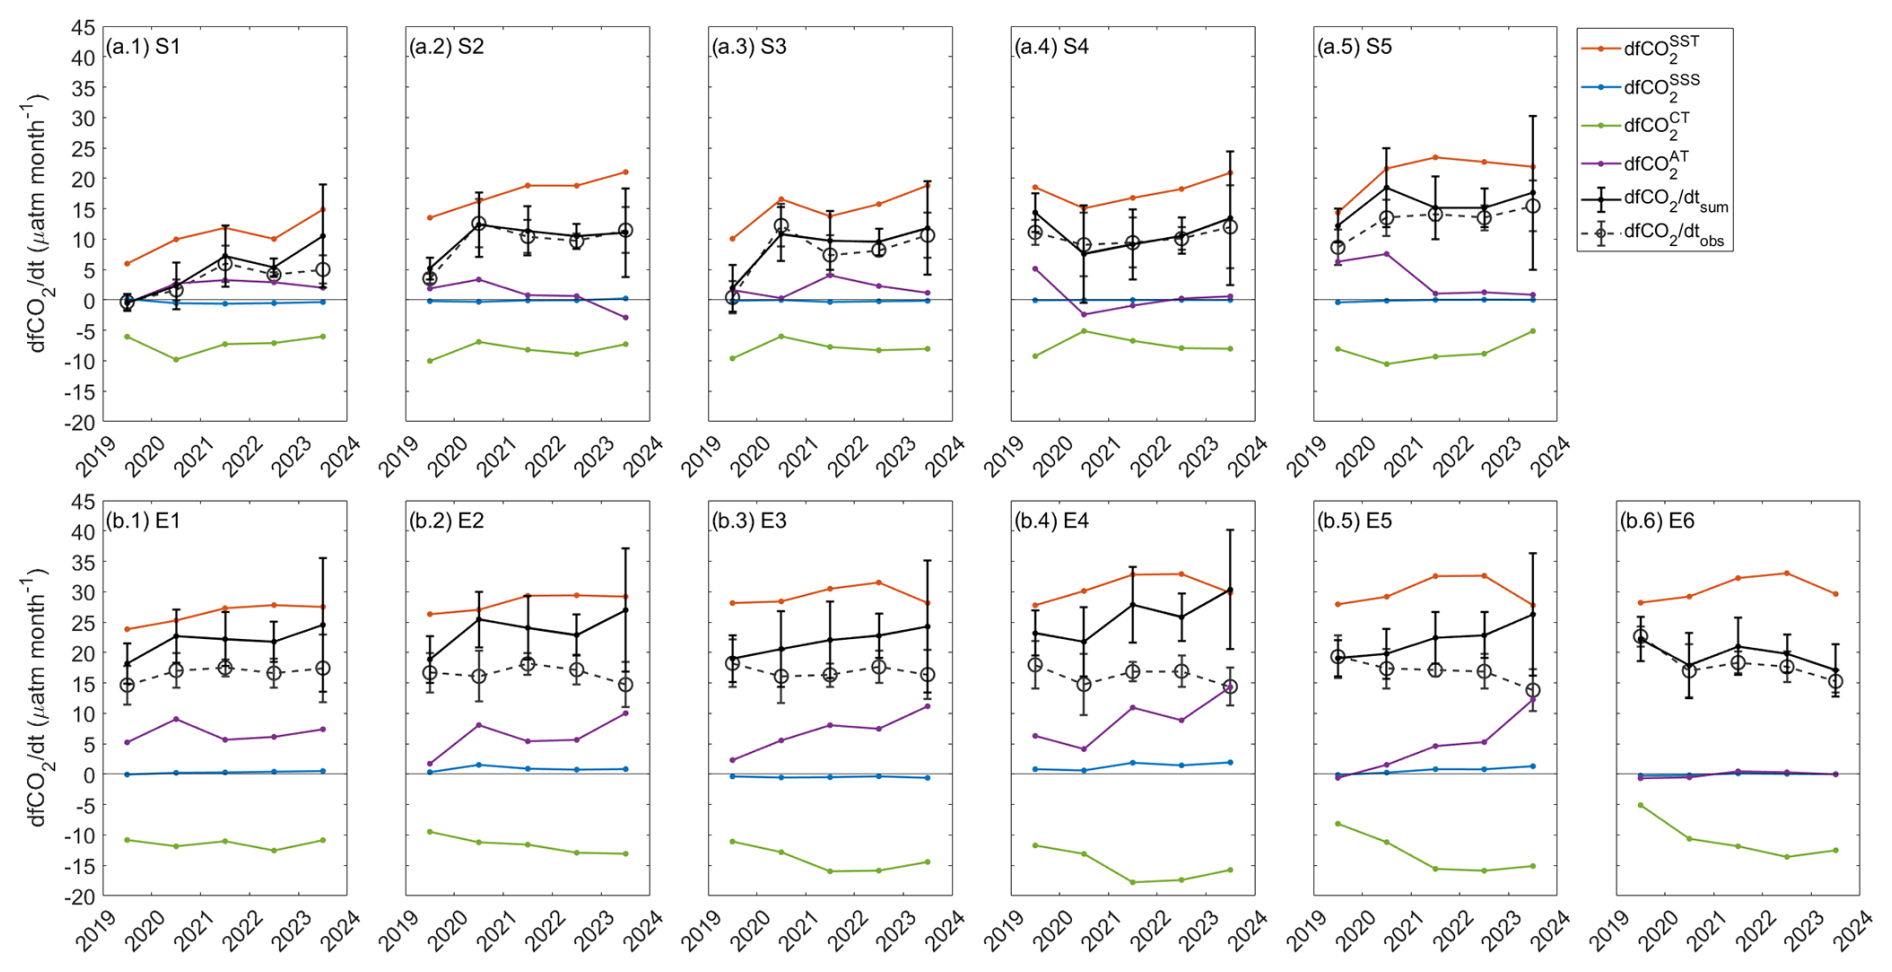
Figure 5Temporal evolution of the seasonal rates of fCO2,sw explained by each of their drivers within the 5 years of observations. The differences between the monthly average data for February and September (where the minimum and maximum SST and fCO2,sw were encountered) were considered to compute the seasonal trends. The standard deviation of the monthly average data was considered in the calculation of the seasonal changes and inferred errors in the computation of fCO2,sw that are summarized in Table S3. The cumulative fCO2,sw changes ( resulting from the distinct drivers were consistent with the observed seasonal fCO2,sw trends (), thereby instilling confidence in the methodology.
The SST was identified as the main driver of dfCO2 throughout the stations, accounting on average for 51 %–71 % of its values over the study period. At some stations and in specific years, this contribution occasionally decreased to ∼ 45 % or increased to ∼ 83 %. In the S section (Fig. 5a), dfCO increased westward as MAW was warmed in the Alboran Sea, while the incursion of the filament cooled the surface locally and decreased dfCO at S3. In the E section (Fig. 5b), dfCO increased northward and reached its maximum north of the Cape of Nao (at E4–E6), particularly during 2021–2022 (32.0–32.5 µatm month−1), due to the greater influence of warmed MW.
AT described on average < 18 % of the dfCO2 in the entire region, occasionally increasing up to 22 %. As fCO2,sw changes inversely with AT, the weakly negative dfCO found for some years along the S section shows fluctuations in the periods of increment and decrement for AT that are likely related to changes in the mixing processes. The AT contribution becomes negligible at E6 (< 2 % throughout the study period) due to the minimal seasonal amplitude of AT and NAT (Fig. S6). The approximately constant AT and NAT levels throughout the year may be due to the bicarbonate and carbonate content from the Ebro River runoff being neutralized by that in MW and MAW, which spread into the area during winter and summer, respectively. dfCO has tended to decrease since 2020–2021 in S1–S3, S5, and E1 due to the progressive weakening of the NAT depletion from February to September. The opposite occurred north of the Cape of Palos, where the seasonal cycle of NAT reaches its maximum amplitude (20–28 µmol kg−1 at E3 and E4). The interannual dealkalinization in the S and E sections (Table 1) acts as a source of heterogeneities: the interannual negative NAT trends during the cold months (p values < 0.01) were stronger than during the warm months (p values > 0.1) and were consistent in both sections. The spatial differences in the summer trends (weaker in the S section compared to the E section) account for an enhanced reduction in the seasonal amplitude of NAT in the S section.
The dfCO values were minimal in both the S and E sections (< 0.6 and < 1.9 µatm per month, respectively) and show the weak impact of SSS on dfCO2 (< 3.5 %). The entrance of MAW and its mixing with the saltier MW in the Alboran Sea do not allow us to identify a seasonal pattern in SSS (Fig. S6), thus explaining the negligible contribution of SSS in the S section (∼ 2.0 % at S1, which fell to < 0.7 % at S2–S5). The larger seasonal amplitudes of SSS at E2–E5 (Fig. S6) led to a relatively major influence of SSS (∼ 1.0 %–2.3 % during most of the years). The low seasonal amplitude of SSS and AT at E6, likely related to an approximately constant influence of the Northern Current at this location throughout the annual cycle, caused a negligible variation in dfCO2 (< 0.4 %).
The depletion in CT, mainly driven by the increased biological production from February to September, had a significant inverse impact on dfCO2 (23 %–37 %). In 2019, at stations S1–S3 (and in 2020 only at S1), the inverse contribution of CT reached 39 %–47 %. This suggests that the influence of the CT cycle on dfCO2 in the westernmost Alboran Sea increasingly resembles that observed in the rest of the Mediterranean. These findings indicate that the seasonal drawdown of CT offsets between one-fourth and one-half of the expected increase in dfCO2 driven by SST and is slightly prompted by AT. In the S section (Fig. 5a), the lower increase observed from 2019 to 2023 in dfCO (4–6 µatm per month) compared with dfCO (6–9 µatm per month) demonstrated that fluctuations in CT were increasingly insufficient for counterbalancing the warming-driven increase in dfCO2, even at S2–S4, where the biological production was enhanced and the dfCO hence reinforced after 2020. In the westernmost part of the S section, the influence of CT offsetting dfCO2 was at its maximum during 2019–2020 at S1 (> 84 %), S2 (67.3 %), and S3 (86.1 %) and diminished towards 2023 (37.1 %, 38.3 %, and 45.1 %, respectively). In the easternmost part, this compensation was around 33 %–44 % at S4–S5 throughout the period (as at S2 and S3 since 2020), except for 2023 at S5, in which dfCO weakened and offset only 22.8 %. In the E section (Fig. 5b), the progressive strength in the processes depleting CT throughout the period at E1–E4 and since 2020 at E5–E6 compensated the dfCO by 33 %–46 %, which changes inversely to dfCO. The lowest compensations found in 2019 at E5 (28.8 %) and E6 (18.4 %) were likely related to possible injections of remineralized waters along the Northern Current path that offset the biological uptake of CT and the elevated dfCO.
4.5 Air–sea CO2 exchange across the western boundary of the Mediterranean Sea
The continuous observation of MCS variables enabled the calculation of FCO2 at an unprecedentedly high spatiotemporal resolution in the western Mediterranean Sea. The FCO2 was found to be governed by fluctuations in ΔfCO2 (Fig. 6) that were mainly controlled by the broader variability of fCO2,sw (325–500 µatm) compared to fCO2,atm (390–425 µatm). The SST fluctuations play a relevant role by primarily controlling fCO2,sw (Sect. 4.3) and modulating the solubility of CO2 at the air–sea interface. The entire monitored area was undersaturated for CO2 with respect to the low atmosphere between late October and June (ΔfCO ± 8.97 µatm), acting as an atmospheric CO2 sink (−2.56 ± 0.55 mmol m−2 d−1) which peaks in winter (−4.53 ± 0.44 and −3.29 ± 0.31 mmol m−2 d−1 in the S and E sections, respectively). During summer, the area was supersaturated for CO2 (ΔfCO2= 36.43 ± 0.35 µatm) and acted as a source that was about 3 times more intense along the E section (1.70 ± 0.43 mmol m−2 d−1) compared to the S section (0.57 ± 0.35 mmol m−2 d−1).
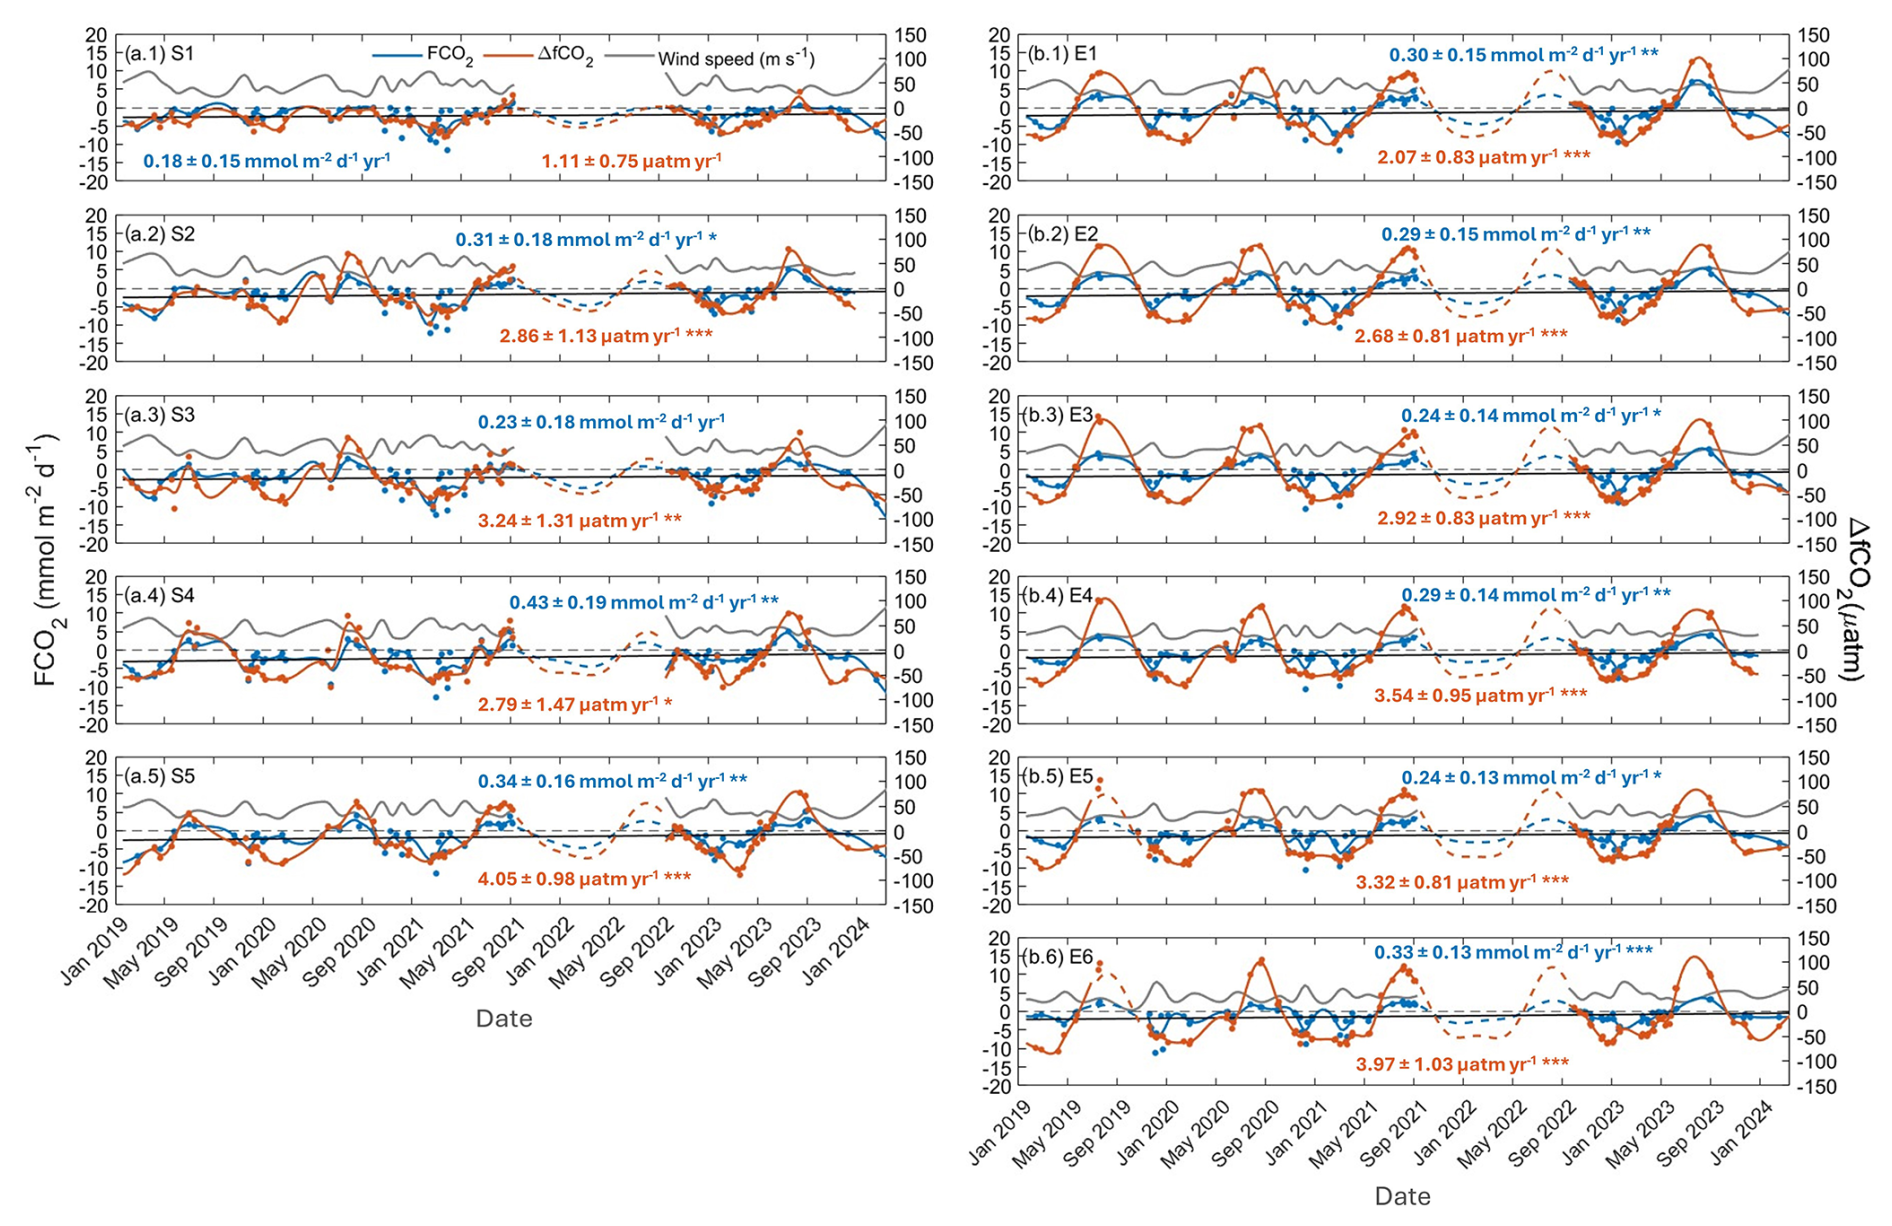
Figure 6Temporal variations of FCO2 (blue; left axis), ΔfCO2 (orange; right axis), and wind speed (gray; left axis) at (a) S1–S5 and (b) E1–E6. A piece-wise polynomial-based smoothing spline was applied to the weekly average data (represented by dots). Gaps were covered by the harmonic fitting (Eq. A1; dashed line). The black lines represent the interannual increase in FCO2. The seasonally detrended interannual rates of change in FCO2 and ΔfCO2 are shown in each panel. indicates that the trends are statistically significant at the 99 % level of confidence, at the 95 % level of confidence, and * at the 90 % level of confidence. The wind speed does not show statistically significant interannual trends (p values > 0.1).
The spatial differences in SST during the warm months introduced heterogeneities into the seasonal outgassing in both sections: the higher SST during summer in the E section reduced the solubility and contributed to a greater increase in fCO2,sw with respect to fCO2,atm (ΔfCO2=49.83 ± 0.32 µatm) compared to the cooler S section (ΔfCO2=16.35 ± 0.14 µatm). The seasonality in the formation of the CO2 sink and source in the Alboran Sea was consistent with previous studies of the Strait of Gibraltar (Curbelo-Hernández et al., 2021b; de la Paz et al., 2011, 2009) and the north-western African coastal transitional area in the north-eastern Atlantic (Curbelo-Hernández et al., 2021a; Padin et al., 2010) and agreed with the seasonal pattern that is characteristic of tropical and subtropical regions (Bates et al., 2014; Takahashi et al., 2002). The warming during summer at S1 was insufficient to lead to supersaturated conditions (ΔfCO ± 0.26 µatm) and thus acted as a CO2 sink throughout the year (−2.83 ± 1.77 mmol m−2 d−1 during the cold months and −0.52 ± 0.02 mmol m−2 d−1 during the warm months), which coincided with the behaviour observed in the Strait of Gibraltar during 2019 (Curbelo-Hernández et al., 2021b). The sink and source status during the cold and warm months encountered in the eastern Iberian margin agrees with FCO2 evaluations based on observations in the Mediterranean basin through its north-western (Wimart-Rousseau et al., 2023, 2021, 2020) and eastern parts (Sisma-Ventura et al., 2017) and confirms previous estimations based on satellite data and models (D'Ortenzio et al., 2008; Taillandier et al., 2012).
The variations in FCO2 during the period of study were addressed by averaging the data across seasons and years at each of the selected stations (Fig. 7). The same procedure was applied to ΔfCO2 and wind speed (Figs. S7 and S8). The evolution of the seasonal in-gassing and outgassing was evaluated by computing interannual trends for the average FCO2 and ΔfCO2 (Fig. 7). The interannual FCO2 trends showed the progressive strength of the summer source in the S section, which was accelerated at S2 in response to the enhanced warming around the WAG (detailed in Sect. 4.2) and at S4–E1 due to their exposure to increasing wind forcing (Figs. S7 and S8). This was caused by the increase in fCO2,sw during the warm months that was not offset by biological drawdown, which elevated ΔfCO2. By contrast, the localization of E2–E6 over the eastern Iberian continental shelf and slope allowed the relevant biological uptake at this time of the year to compensate for the influx of CO2-rich water. It introduced heterogeneities in ΔfCO2 between years which do not allow us to identify statistically significant trends.
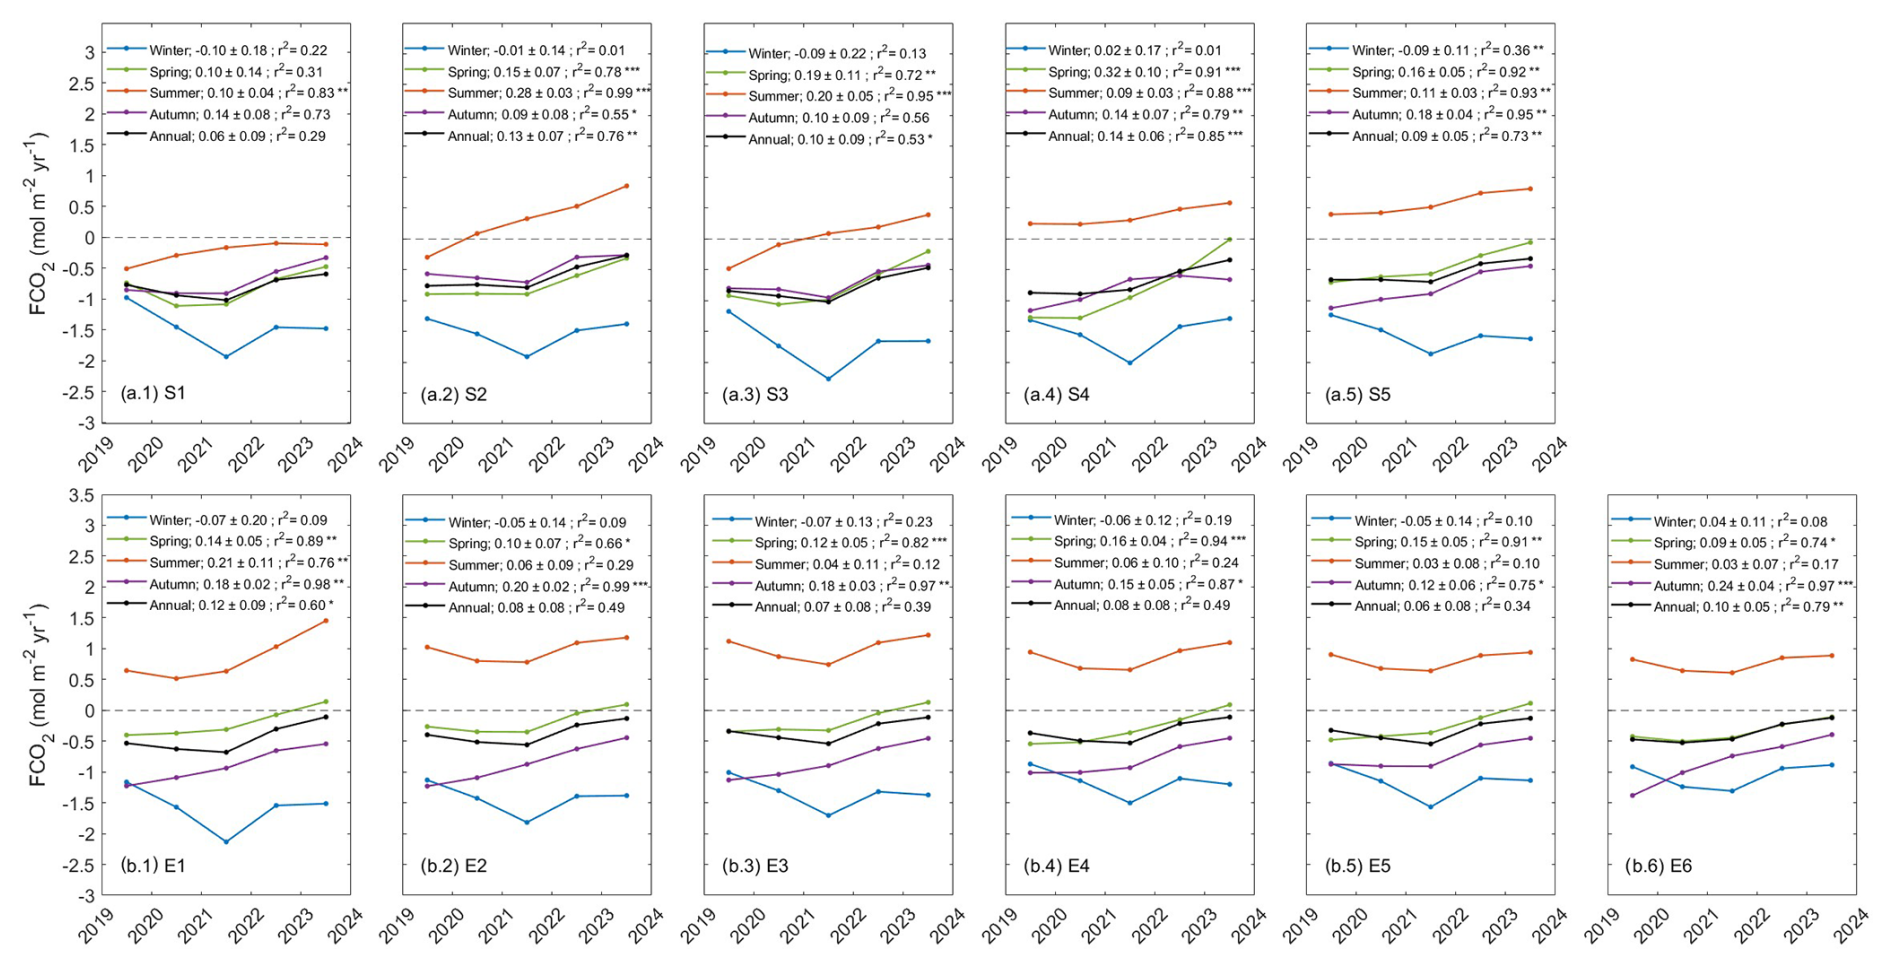
Figure 7Temporal evolution of the average FCO2 calculated on seasonal and annual bases for each year (2019–2023) at S1–S5 and E1–E6. The same representation for ΔfCO2 and wind speed is available in Figs. S5 and S6. The 3-month periods January–March, April–June, July–September, and October–December were considered to be winter, spring, summer, and autumn, respectively. The legend includes the interannual trends for FCO2 (mol m−2 yr−1 yr−1) based on linear regression of the seasonal and annual means. denotes that the trends are statistically significant at the 99 % level of confidence, at the 95 % level of confidence, and * at the 90 % level of confidence. The standard deviations are presented in Table S4.
During spring and autumn, the increase in ΔfCO2, mainly driven by warming and accompanied by the decreasing wind stress (Figs. S7 and S8), led to the positive interannual FCO2 trends at S2–S5 and E1–E6 (Fig. 7). They show the weakening of the in-gassing during autumn and the achievement of a near-equilibrium state with the atmosphere during spring by the end of the study period. The FCO2 reverted to being weakly positive during the spring of 2023 in the E section, which prolonged the seasonal source period's relevant impact on the net annual FCO2. During winter, the increasing wind forcing compensated for the reduction in the in-gassing expected by the rise in ΔfCO2 (Figs. S7 and S8). However, the variability in the wind speed and other processes involved in the non-thermal change in fCO2,sw between the years does not allow identification of statistically significant rates of change in the CO2 sink status. In particular, the relatively high wind speed during the winter of 2021 may have contributed to accelerated horizontal transports, increasing fCO2,sw and hence ΔfCO2 (Figs. S7 and S8).
The predominantly negative FCO2 trends during most of the year led to net annual CO2 sink behaviour. The positive FCO2 trends during summer, spring, and autumn have forced the annual average CO2 invasion to decrease by 44 %–65 % at S2–S5 (ranging from −0.66 ± 0.06 and −0.84 ± 0.04 mol m−2 during 2019 to −0.27 ± 0.09 and −0.47 ± 0.09 mol m−2 during 2023) and by 60 %–80 % at E1–E6 (ranging from −0.32 ± 0.09 and −0.53 ± 0.09 mol m−2 during 2019 to −0.11 ± 0.10 and −0.13 ± 0.09 mol m−2 during 2023). The unique hydrodynamics of the Strait of Gibraltar strongly influenced the air–sea CO2 exchange at S1: the in-gassing during summer partially compensated for the reduction in the annual influx and resulted in a lower increase in FCO2 (23 %) from 2019 (−0.77 ± 0.02 mol m−2 yr−1) to 2023 (−0.60 ± 0.06 mol m−2 yr−1).
Considering the annual average FCO2 for the S and E sections, the net in-gassing has decreased at rates of 0.11 ± 0.02 mol m−2 yr−1 yr−1 (p value < 0.01) in the Alboran Sea and 0.08 ± 0.02 mol m−2 yr−1 yr−1 (p value < 0.01) in the eastern Iberian margin. This contrasts with the strength of the CO2 sink across the western Mediterranean basin recently reported by Zarghamipour et al. (2024) for 1984–2019 based on a combination of observational data and model simulations (0.007 ± 0.001 mol m−2 yr−1 yr−1). Additionally, Zarghamipour et al. (2024) noted the reduction in the annual net CO2 source behaviour of the central Mediterranean basin at an estimated rate of 0.003 ± 0.001 mol m−2 yr−1 yr−1. The findings suggest that the accelerated increase in fCO2,sw induced by the rapid warming, together with the progressive reduction in solubility, is reversing the interannual FCO2 trends compared to previous decades, which may be causing the study area to resemble the central and eastern Mediterranean basins in terms of air–sea CO2 exchange. The reduction in the net annual invasion was consistent with previous estimations in such coastal and shelf environments across the eastern tropical and subtropical South Atlantic during 2002–2018 (between 0.03 ± 0.01 and 0.09 ± 0.02 mol m−2 yr−1 yr−1; Ford et al., 2022) and toward mid-latitudes over the Scotian Shelf (with the average FCO2 ranging from −1.7 mol m−2 yr−1 yr−1 in 2002 to −0.02 mol m−2 yr−1 yr−1 in 2006; Sisma-Ventura et al., 2017). The continuation of this decreasing rate for net annual in-gassing would imply the reversion of the study area to net annual CO2 source behaviour before 2030.
The net CO2 invasion was calculated by integrating the annual cycle of FCO2 during 2019–2023. The net FCO2 in the Alboran Sea was −1.57 ± 0.49 mol m−2 yr−1, which represented a strength in the CO2 sink in comparison with the adjacent surface areas across the Strait of Gibraltar (between −0.82 and −1.01 mol m−2 yr−1 during 2019–2021; Curbelo-Hernández et al., 2021b) and the eastern Iberian upwelling (−1.33 mol m−2 yr−1; Chen et al., 2013). The net FCO2 along the eastern Iberian margin was −0.70 ± 0.54 mol m−2 yr−1, which falls within the range of that modelled for the deep-convection area around the Bay of Marseille (north-western Mediterranean basin) during 2012–2013 (−0.5 mol m−2 yr−1; Ulses et al., 2023) and estimated based on observations during 2017–2018 (between −0.26 and −0.81 mol m−2 yr−1; Wimart-Rousseau et al., 2020). However, this was contrary to the net outgassing across the eastern Mediterranean basin (0.85 ± 0.27 mol m−2 yr−1 during 2009–2015; Sisma-Ventura et al., 2017). The net CO2 sinks for the monitored area across the Alboran Sea (14 000 km2) and the eastern Iberian margin (40 000 km2) were −0.97 ± 0.30 Tg CO2 yr−1 (−0.26 ± 0.08 Tg C yr−1) and −1.22 ± 0.95 Tg CO2 yr−1 (−0.33 ± 0.25 Tg C yr−1). These findings greatly contributed to the assessment of the air–sea CO2 exchange in the Mediterranean basin and the global coastal and shelf areas.
The 5 years of automatically underway observations at the ES-SOOP-CanOA ocean station provided a high-spatiotemporal-resolution dataset which includes the surface physical and MCS properties across the western margin of the Mediterranean Sea. It allowed characterization, with an improved degree of certainty, of mechanisms involved in the MCS dynamics in the Alboran Sea and eastern Iberian coastal transitional area on seasonal and interannual timescales.
The variations in fCO2,sw were found to be strongly controlled by temperature fluctuations. On a seasonal scale, the thermally driven variations intensified as the AJ advanced eastward in the Alboran Sea and MAW was formed, moving northward along the eastern Iberian margin and mixing with MW. In the Alboran Sea, the high intensity of the AJ during summer warms the surface layer towards the core of the WAG and EAG, driving larger seasonal changes in SST, fCO2,sw, and pH that increased during the study period. The eastern Iberian margin was meridionally separated at the Cape of Nao by the path of the Northern Current: the northernmost part, fed with cool, salty, and remineralized MW during the cold season and influenced by the northward spreading of MAW during the warm season, shows the largest seasonal amplitudes for SST, fCO2,sw, and pH compared to the southernmost part, which is supplied with recent MAW during most of the year and by a weak and relatively warm branch of the Northern Current during winter. Driver analysis has shown that 51 %–71 % of the increase in fCO2,sw from February to September within the entire monitored area was explained by SST and < 20 % by AT and SSS, while the processes controlling CT offset this increment, contributing 23 %–37 %.
The changes in the seasonal cycles were driven primarily by the increasing contribution of temperature (due to the larger seasonal amplitude of SST), and secondarily by the decreasing contribution of CT (due to the decreasing remineralization/production ratio). On an interannual scale, the SST increased at rates ranging between 0.26 and 0.43 °C yr−1 and drove a rapid increase in fCO2,sw within 4.18 and 5.53 µatm yr−1 and a decrease in pH within −0.0049 and −0.0065 units per year. The ∼ 76 %–92 % of the interannual increase in fCO2,sw was described by warming. In the Alboran Sea, and extending northwards to the Cape of Palos, non-thermal processes, which are primarily biological drawdowns during spring blooms, compensated for up to one-third of the expected increase in fCO2,sw due to warming. The opposite occurred north of the Cape of Palos, where non-thermal processes, mainly the inflow of CO2-rich MW during the cold season, accounted for the increase in fCO2,sw.
The assessment of the air–sea CO2 exchange shows the western boundary of the Mediterranean basin to be undersaturated and acting as a significant sink of atmospheric CO2 during most of the year, while the presented supersaturated conditions led to a CO2 source status during the warm months. The entire monitored area acted as a net annual CO2 sink that is weakening at statistically significant rates ranging between 0.06 and 0.13 mol m−2 yr−1 yr−1 (40 %–80 % since 2019). These trends would cause the area to shift towards becoming a net annual CO2 source before 2030 if the current climate conditions persist. The weakening in the net annual CO2 sink was driven by the ongoing strength of the summer outgassing (mainly in the Alboran Sea) and the weakening in the autumn and spring in-gassing (throughout the region). Integrating the annual cycle of FCO2 during the entire study period, the net CO2 in-gassing values calculated for the Alboran Sea and eastern Iberian margin were −1.57 ± 0.49 and −0.70 ± 0.54 mol m−2 yr−1.
This study highlights the need for systematic observation strategies to characterize the physicochemical properties of seawater in the Mediterranean, an effort that has been required by the scientific community for the last few decades. It demonstrates the effectiveness of SOOP/VOS in monitoring surface physical and biogeochemical variables, especially in highly variable and anthropogenically pressured areas such as coastal and semi-enclosed seas. The findings enhance our understanding of MSC dynamics in a key coastal transitional area of the western Mediterranean, which has high environmental and socioeconomic importance and implications for the regional climate. Likewise, they contribute to a more accurate understanding of the role of coastal areas in the context of global change at both the basin and global scales. Despite the relatively short study period, this research captured shifts likely driven by isolated events caused by climate change, offering insights into future ocean conditions.
The temporal evolution of the physicochemical data was analysed by weekly averaging (the time required by the vessel to complete a trip) at different locations along the vessel track. The average values (y) were fitted to Eq. (A1) as a function of time (yearly fraction). This equation updates the one used by Curbelo-Hernández et al. (2021a, b) to study seasonal cycles through the addition of the b(year-2019) term, which provides the interannual rate of change of each seasonally detrended variable between 2019 and 2024. The coefficients a–f and the standard errors of the estimate given by Eq. (A1) for the variables considered are available in Table S1.
The errors in the weekly averages were determined by dividing the standard deviation by the square root of the number of data points used to calculate the means . The coefficient b in Eq. (A1) represented the interannual variation rates for each variable, which coincided with the slope derived from linear regressions of the detrended average values over time. The standard errors of these slopes were calculated by propagating the errors from the annual mean values.
The strength and direction of the linear regressions and the significance of the interannual trends were evaluated through a Pearson correlation test. This test yielded correlation coefficients (r2) and corresponding p values to determine statistical significance. Trends with p values ≤ 0.01 were statistically significant at the 99 % confidence level, those with p values ≤ 0.05 were significant at the 95 % confidence level, and those with p values ≤ 0.1 were significant at the 90 % confidence level. Trends with p values > 0.1 were not statistically significant but still provided an estimate of the temporal evolution of the variables within their respective layers.
The uncertainty in ΔfCO2 was calculated by applying standard error propagation rules for the difference of two independent measurements with associated uncertainties (Eq. B1):
where and are the uncertainties for fCO2,sw and fCO2,atm, respectively (see Sect. 2.4.1). The absolute error in FCO2 (; mmol m−2 d−1) associated solely with uncertainty in ΔfCO2 was estimated for each data point using Eq. (B2):
To represent the average magnitude of uncertainty in the estimated FCO2 over the entire dataset (with n being the total number of data), the mean absolute FCO2 error was calculated using Eq. (B3) and the mean relative FCO2 was estimated with Eq. (B4):
The CO2,SYSv3 program for MATLAB (Sharp et al., 2023) is available at https://github.com/jonathansharp/CO2-System-ExtdTS29 (last access: 14 June 2025). This is the updated version of the CO2,SYS program originally developed by Lewis and Wallace (1998) and implemented in MATLAB (van Heuven et al., 2011; Orr et al., 2018) for CO2 system calculations.
The underway observations provided by ES-SOOP-CanOA in the western Mediterranean Sea (February 2019–February 2024) used in this investigation are published open-access on Zenodo (https://doi.org/10.5281/zenodo.13379011, Curbelo-Hernández et al., 2024b) and are periodically published on the ICOS Data Portal (https://www.icos-cp.eu/data-products/ocean-release; last access: 8 July 2025), with data already available since 2024 (Santana-Casiano and González-Dávila, 2024). The SST monthly reanalysis data (0.042° × 0.042°) from the Med MFC physical multiyear product (Escudier et al., 2020, 2021; Nigam et al., 2021) are available at the Copernicus Marine Data Store (https://data.marine.copernicus.eu/products, last access: 15 May 2025, Escudier et al., 2020, 2021; Nigam et al., 2021). The ERA5 hourly wind speed reanalysis data at 10 m above sea level used to calculate the air–sea CO2 fluxes are available from the Copernicus Climate Data Store (https://cds.climate.copernicus.eu/, last access: 15 May 2025, Hersbach et al., 2023).
The supplement related to this article is available online at https://doi.org/10.5194/bg-22-3329-2025-supplement.
All of the authors made significant contributions to this research. MGD, JMSC, and AGG installed and maintained the equipment in the VOS. DCH and DGS participated in routine maintenance and data acquisition. DCH developed the MATLAB® routines and conducted the data processing and analysis. All of the authors contributed to the writing of the manuscript and supported its submission.
The contact author has declared that none of the authors has any competing interests.
Publisher's note: Copernicus Publications remains neutral with regard to jurisdictional claims made in the text, published maps, institutional affiliations, or any other geographical representation in this paper. While Copernicus Publications makes every effort to include appropriate place names, the final responsibility lies with the authors.
We would like to thank the JONA SOPHIE ship owner, Reederei Stefan Patjens GmbH and Co. KG, the NISA-Marítima company, and the captains and crew members for the support during this collaboration. Special thanks go to the technician Adrian Castro-Álamo for biweekly equipment maintenance and discrete sampling of total alkalinity aboard the ship. We would like to thank the two anonymous reviewers for their constructive comments and suggestions, which significantly improved the quality of this paper. The SOOP CanOA-VOS line is part of the Spanish contribution to the Integrated Carbon Observation System (ICOS-ERIC; https://www.icos-cp.eu/, last access: 14 June 2025) since 2021 and has been recognized as an ICOS Class-1 Ocean Station.
This research was supported by the Canary Islands Government and the Loro Parque Foundation through the CanBIO project, CanOA subproject (2019–2024), and CARBOCAN agreement (Consejería de Transición Ecológica y Energía, Gobierno de Canarias). The participation of David Curbelo-Hernández was funded by PhD grant no. PIFULPGC-2020-2 ARTHUM-2.
This paper was edited by Koji Suzuki and reviewed by three anonymous referees.
Alberola, C., Millot, C., and Font, J.: On the seasonal and mesoscale variabilities of the Northern Current during the PRIMO-0 experiment in the western Mediterranean Sea, Oceanol. Acta, 18, 163–192, 1995.
Álvarez, M., Sanleón-Bartolomé, H., Tanhua, T., Mintrop, L., Luchetta, A., Cantoni, C., Schroeder, K., and Civitarese, G.: The CO2 system in the Mediterranean Sea: a basin-wide perspective, Ocean Sci., 10, 69–92, https://doi.org/10.5194/os-10-69-2014, 2014.
Antoine, D., Chami, M., Claustre, H., d'Ortenzio, F., Morel, A., Bécu, G., Gentili, B., Louis, F., Ras, J., Roussier, E., Scott, A. J., Tailliez, D., Hooker, S. B., Guevel, P., Desté, J. F., Dempsey, C., and Adams, D.: BOUSSOLE: A joint CNRS-INSU, ESA, CNES, and NASA ocean color calibration and validation activity, NASA Tech. Memo., 1–59, 2006.
Antoine, D., d'Ortenzio, F., Hooker, S. B., Bécu, G., Gentili, B., and Tailliez, D., and Scott, A. J.: Assessment of uncertainty in the ocean reflectance determined by three satellite ocean color sensors (MERIS, SeaWiFS and MODIS-A) at an offshore site in the Mediterranean Sea (BOUSSOLE project), J. Geophys. Res.-Ocean., 113, C07013, https://doi.org/10.1029/2007JC004472, 2008a.
Antoine, D., Guevel, P., Desté, J. F., Bécu, G., Louis, F., Scott, A. J., and Bardey, P.: The “BOUSSOLE” Buoy - A new transparent-to-swell taut mooring dedicated to marine optics: Design, tests, and performance at sea, J. Atmos. Ocean. Technol., 25, 968–989, https://doi.org/10.1175/2007JTECHO563.1, 2008b.
Bakker, D. C. E., Pfeil, B., Landa, C. S., Metzl, N., O'Brien, K. M., Olsen, A., Smith, K., Cosca, C., Harasawa, S., Jones, S. D., Nakaoka, S., Nojiri, Y., Schuster, U., Steinhoff, T., Sweeney, C., Takahashi, T., Tilbrook, B., Wada, C., Wanninkhof, R., Alin, S. R., Balestrini, C. F., Barbero, L., Bates, N. R., Bianchi, A. A., Bonou, F., Boutin, J., Bozec, Y., Burger, E. F., Cai, W.-J., Castle, R. D., Chen, L., Chierici, M., Currie, K., Evans, W., Featherstone, C., Feely, R. A., Fransson, A., Goyet, C., Greenwood, N., Gregor, L., Hankin, S., Hardman-Mountford, N. J., Harlay, J., Hauck, J., Hoppema, M., Humphreys, M. P., Hunt, C. W., Huss, B., Ibánhez, J. S. P., Johannessen, T., Keeling, R., Kitidis, V., Körtzinger, A., Kozyr, A., Krasakopoulou, E., Kuwata, A., Landschützer, P., Lauvset, S. K., Lefèvre, N., Lo Monaco, C., Manke, A., Mathis, J. T., Merlivat, L., Millero, F. J., Monteiro, P. M. S., Munro, D. R., Murata, A., Newberger, T., Omar, A. M., Ono, T., Paterson, K., Pearce, D., Pierrot, D., Robbins, L. L., Saito, S., Salisbury, J., Schlitzer, R., Schneider, B., Schweitzer, R., Sieger, R., Skjelvan, I., Sullivan, K. F., Sutherland, S. C., Sutton, A. J., Tadokoro, K., Telszewski, M., Tuma, M., Van Heuven, S. M. A. C., Vandemark, D., Ward, B., Watson, A. J., and Xu, S.: A multi-decade record of high quality fCO2 data in version 3 of the Surface Ocean CO2 Atlas (SOCAT), Earth Syst. Sci. Data, 8, 383–413, https://doi.org/10.5194/essd-8-383-2016, 2016.
Bakker, D. C. E., Alin, S. R., Bates, N., Becker, M., Gkritzalis, T., Jones, S. D., Kozyr, A., Lauvset, S. K., Metzl, N., Nakaoka, S., O'Brien, K. M., Olsen, A., Pierrot, D., Steinhoff, T., Sutton, A. J., Takao, S., Tilbrook, B., Wada, C., Wanninkhof, R., Akl, J., Arbilla, L. A., Arruda, R., Azetsu-Scott, K., Barbero, L., Beatty, C. M., Berghoff, C. F., Bittig, H. C., Burger, E. F., Campbell, K., Cardin, V., Collins, A., Coppola, L., Cronin, M., Cross, J. N., Currie, K. I., Emerson, S. R., Enright, M. P., Enyo, K., Evans, W., Feely, R. A., Flohr, A., Gehrung, M., Glockzin, M., González-Dávila, M., Hamnca, S., Hartman, S., Howden, S. D., Kam, K., Kamb, L., Körtzinger, A., Kosugi, N., Lefèvre, N., Lo Monaco, C., Macovei, V. A., Maenner Jones, S., Manalang, D., Martz, T. R., Mdokwana, B., Monacci, N. M., Monteiro, P. M. S., Mordy, C., Morell, J. M., Murata, A., Neill, C., Noh, J.-H., Nojiri, Y., Ohman, M. D., Olivier, L., Ono, T., Petersen, W., Plueddemann, A. J., Prytherch, J., Rehder, G., Rutgersson, A., Santana-Casiano, J. M., Schlitzer, R., Send, U., Skjelvan, I., Sullivan, K. F., T'Jampens, M., Tadokoro, K., Telszewski, M., Theetaert, H., Tsanwani, M., Vandemark, D., van Ooijen, E., Veccia, M. H., Voynova, Y. G., Wang, H., Weller, R. A., and Woosley, R. J.: Surface Ocean CO2 Atlas Database Version 2024 (SOCATv2024), NOAA Natl. Centers for Environ. Inf. [data set], https://doi.org/10.25921/9wpn-th28, 2024.
Bates, N. R., Astor, Y. M., Church, M. J., Currie, K., Dore, J. E., González-Dávila, M., Lorenzoni, L., Muller-Karger, F., Olafsson, J., and Santana-Casiano, J. M.: A time-series view of changing surface ocean chemistry due to ocean uptake of anthropogenic CO2 and ocean acidification, Oceanography, 27, 126–141, https://doi.org/10.5670/oceanog.2014.16, 2014.
Bégovic, M. and Copin-Montégut, C.: Processes controlling annual variations in the partial pressure of CO2 in surface waters of the central northwestern Mediterranean Sea (Dyfamed site), Deep-Sea Res. Pt. II, 49, 2031–2047, https://doi.org/10.1016/S0967-0645(02)00026-7, 2002.
Bergamasco, A. and Malanotte-Rizzoli, P.: The circulation of the Mediterranean Sea: a historical review of experimental investigations, Adv. Oceanogr. Limnol., 1, 11–28, https://doi.org/10.1080/19475721.2010.505354, 2010.
Bolado-Penagos, M., González, C. J., Chioua, J., Sala, I., Jesús Gomiz-Pascual, J., Vázquez, Á., and Bruno, M.: Submesoscale processes in the coastal margins of the Strait of Gibraltar. The Trafalgar – Alboran connection, Prog. Oceanogr., 181, 102219, https://doi.org/10.1016/j.pocean.2019.102219, 2020.
Borges, A. V., Delille, B., and Frankignoulle, M.: Budgeting sinks and sources of CO2 in the coastal ocean: Diversity of ecosystem counts, Geophys. Res. Lett., 32, 1–4, https://doi.org/10.1029/2005GL023053, 2005.
Borghini, M. B. H. S., Bryden, H., Schroeder, K., Sparnocchia, S., and Vetrano, A.: The Mediterranean is becoming saltier, Ocean Sci., 10, 693–700, https://doi.org/10.5194/os-10-693-2014, 2014.
Bormans, M. and Garrett, C.: A simple criterion for gyre formation by the surface outflow from a strait, with application to the Alboran Sea, J. Geophys. Res.-Ocean., 94, 12637–12644, https://doi.org/10.1029/JC094iC09p12637, 1989.
Bosse, A., Testor, P., Damien, P., Estournel, C., Marsaleix, P., Mortier, L., Prieur, L., and Taillandier, V.: Wind-forced submesoscale symmetric instability around deep convection in the northwestern Mediterranean Sea, Fluids, 6, 1–26, https://doi.org/10.3390/fluids6030123, 2021.
Bourg, N. and Molcard, A.: Northern boundary current variability and mesoscale dynamics: a long-term HF RADAR monitoring in the North-Western Mediterranean Sea, Ocean Dynam., 71, 851–870, https://doi.org/10.1007/s10236-021-01466-9, 2021.
Bray, N. A., Ochoa, J., and Kinder, T. H.: The role of the interface in exchange through the Strait of Gibraltar, J. Geophys. Res., 100, 10755–10776, https://doi.org/10.1029/95JC00381, 1995.
Cai, W. J., Dai, M., and Wang, Y.: Air-sea exchange of carbon dioxide in ocean margins: A province-based synthesis, Geophys. Res. Lett., 33, L12603, https://doi.org/10.1029/2006GL026219, 2006.
Chen, C. T. A., Huang, T. H., Chen, Y. C., Bai, Y., He, X., and Kang, Y.: Air-sea exchanges of CO2 in the world's coastal seas, Biogeosciences, 10, 6509–6544, https://doi.org/10.5194/bg-10-6509-2013, 2013.
Conan, P. and Millot, C.: Variability of the northern current off Marseilles, western Mediterranean Sea, from February to June 1992, Oceanol. Acta, 18, 193–205, https://doi.org/10.1016/0399-1784(95)00009-Q, 1995.
Copin-Montégut, C.: Alkalinity and carbon budgets in the Mediterranean Sea, Global Biogeochem. Cy., 7, 915–925, 1993.
Copin-Montégut, C. and Bégovic, M.: Distributions of carbonate properties and oxygen along the water column (0–2000 m) in the central part of the NW Mediterranean Sea (Dyfamed site): Influence of winter vertical mixing on air–sea CO2 and O2 exchanges, Deep-Sea Res. Pt. II, 49, 2049–2066, https://doi.org/10.1016/S0967-0645(02)00027-9, 2002.
Copin-Montégut, C., Bégovic, M., and Merlivat, L.: Variability of the partial pressure of CO2 on diel to annual time scales in the Northwestern Mediterranean Sea, Mar. Chem., 85, 169–189, https://doi.org/10.1016/j.marchem.2003.10.005, 2004.
Coppola, L., Boutin, J., Gattuso, J. P., Lefevre, D., and Metzl, N.: The Carbonate System in the Ligurian Sea, in: Mediterr. Sea Era Glob. Chang. 1 30 Years Multidiscip. Study Ligurian Sea, 1, 79–103, https://doi.org/10.1002/9781119706960.CH4, 2020.
Cossarini, G., Lazzari, P., and Solidoro, C.: Spatiotemporal variability of alkalinity in the Mediterranean Sea, Biogeosciences, 12, 1647–1658, https://doi.org/10.5194/bg-12-1647-2015, 2015.
Cossarini, G., Feudale, L., Teruzzi, A., Bolzon, G., Coidessa, G., Solidoro, C., Di Biagio, V., Amadio, C., Lazzari, P., Brosich, A., and Salon, S.: High-resolution reanalysis of the Mediterranean Sea biogeochemistry (1999–2019), Front. Mar. Sci., 8, 741486, https://doi.org/10.3389/fmars.2021.741486, 2021.
Curbelo-Hernández, D., González-Dávila, M., González, A. G., González-Santana, D., and Santana-Casiano, J. M.: CO2 fluxes in the Northeast Atlantic Ocean based on measurements from a surface ocean observation platform, Sci. Total Environ., 775, 145804, https://doi.org/10.1016/j.scitotenv.2021.145804, 2021a.
Curbelo-Hernández, D., Santana-Casiano, J. M., González, A. G., and González-Dávila, M.: Air-Sea CO2 Exchange in the Strait of Gibraltar, Front. Mar. Sci., 8, 1701, https://doi.org/10.3389/FMARS.2021.745304, 2021b.
Curbelo-Hernández, D., González-Dávila, M., and Santana-Casiano, J. M.: The carbonate system and air-sea CO2 fluxes in coastal and open-ocean waters of the Macaronesia, Front. Mar. Sci., 10, 1094250, https://doi.org/10.3389/fmars.2023.1094250, 2023.
Curbelo-Hernández, D., Pérez, F. F., González-Dávila, M., Gladyshev, S. V., González, A. G., González-Santana, D., Velo, A., Sokov, A., and Santana-Casiano, J. M.: Ocean Acidification trends and Carbonate System dynamics in the North Atlantic Subpolar Gyre during 2009–2019, EGUsphere [preprint], https://doi.org/10.5194/egusphere-2024-1388, 2024a.
Curbelo-Hernández, D., González-Santana, D., González, A. G., Santana-Casiano, J. M., and González-Dávila, M.: Surface Marine Carbonate System Data (2019–2024) from Volunteer Observing Ship monitoring across the Western Mediterranean Sea, Zenodo [data set], https://doi.org/10.5281/zenodo.13379011, 2024b.
De Carlo, E. H., Mousseau, L., Passafiume, O., and Drupp, P. S., and Gattuso, J. P.: Carbonate Chemistry and Air-Sea CO2 Flux in a NW Mediterranean Bay Over a Four-Year Period: 2007–2011, Aquat. Geochem., 19, 399–442, https://doi.org/10.1007/s10498-013-9217-4, 2013.
de la Paz, M., Gómez-Parra, A., and Forja, J.: Seasonal variability of surface fCO2 in the Strait of Gibraltar, Aquat. Sci., 71, 55–64, https://doi.org/10.1007/s00027-008-8060-y, 2009.
de la Paz, M., Huertas, E. M., Padín, X. A., González-Dávila, M., Santana-Casiano, J. M., Forja, J. M., Orbi, A., Pérez, F. F., and Ríos, A. F.: Reconstruction of the seasonal cycle of air-sea CO2 fluxes in the Strait of Gibraltar, Mar. Chem., 126, 155–162, https://doi.org/10.1016/j.marchem.2011.05.004, 2011.
Dickson, A. G.: Standard potential of the reaction: AgCl(s) + H2(g) = Ag(s) + HCl(aq), and the standard acidity constant of the ion HSO4- in synthetic sea water from 273.15 to 318.15 K, J. Chem. Thermodyn., 22, 113–127, https://doi.org/10.1016/0021-9614(90)90074-Z, 1990.
Dickson, A. G., Sabine, C. L., and Christian, J. R. (Eds.): Guide to best practices for ocean CO2 measurements, PICES Spec. Publ., 3, 191 pp., ISBN: 1-897176-07-4, 2007.
Doney, S. C., Fabry, V. J., Feely, R. A., and Kleypas, J. A.: Ocean Acidification: The Other CO2 Problem, Ann. Rev. Mar. Sci., 1, 169–192, https://doi.org/10.1146/annurev.marine.010908.163834, 2009.
D'Ortenzio, F., Antoine, D., and Marullo, S.: Satellite-driven modeling of the upper ocean mixed layer and air-sea CO2 flux in the Mediterranean Sea, Deep-Sea Res. Pt. I, 55, 405–434, https://doi.org/10.1016/j.dsr.2007.12.008, 2008.
Echevarría, F., García Lafuente, J., Bruno, M., Gorsky, G., Goutx, M., González, N., García, C. M., Gómez, F., Vargas, J. M., Picheral, M., Striby, L., Varela, M., Alonso, J. J., Reul, A., Cózar, A., Prieto, L., Sarhan, T., Plaza, F., and Jiménez-Gómez, F.: Physical-biological coupling in the Strait of Gibraltar, Deep-Sea Res. Pt. II, 49, 4115–4130, https://doi.org/10.1016/S0967-0645(02)00145-5, 2002.
Escudier, R., Clementi, E., Omar, M., Cipollone, A., Pistoia, J., Aydogdu, A., Drudi, M., Grandi, A., Lyubartsev, V., Lecci, R., Cretí, S., Masina, S., Coppini, G., and Pinardi, N.: Mediterranean Sea Physical Reanalysis (CMEMS MED-Currents) (Version 1), Copernicus Monitoring Environment Marine Service (CMEMS) [data set], https://doi.org/10.25423/CMCC/, 2020.
Escudier, R., Clementi, E., Cipollone, A., Pistoia, J., Drudi, M., Grandi, A., Lyubartsev, V., Lecci, R., Aydogdu, A., Delrosso, D., Omar, M., Masina, S., Coppini, G., and Pinardi, N.: A High Resolution Reanalysis for the Mediterranean Sea, Front. Earth Sci., 9, 1060, https://doi.org/10.3389/feart.2021.702285, 2021.
Fassbender, A. J., Schlunegger, S., Rodgers, K. B., and Dunne, J. P.: Quantifying the Role of Seasonality in the Marine Carbon Cycle Feedback: An ESM2M Case Study, Global Biogeochem. Cy., 36, 1–15, https://doi.org/10.1029/2021GB007018, 2022.
Folkard, A. M., Davies, P. A., Fiúza, A. F. G., and Ambar, I.: Remotely sensed sea surface thermal patterns in the Gulf of Cadiz and the Strait of Gibraltar: Variability, correlations, and relationships with the surface wind field, J. Geophys. Res.-Ocean., 102, 5669–5683, https://doi.org/10.1029/96JC02505, 1997.
Ford, D. J., Tilstone, G. H., Shutler, J. D., and Kitidis, V.: Identifying the biological control of the annual and multi-year variations in South Atlantic air-sea CO2 flux, Biogeosciences, 19, 4287–4304, https://doi.org/10.5194/bg-19-4287-2022, 2022.
Frankignoulle, M. and Borges, A. V.: European continental shelf as a significant sink for atmospheric carbon dioxide, Global Biogeochem. Cy., 15, 569–576, https://doi.org/10.1029/2000GB001307, 2001.
Friedlingstein, P., O'Sullivan, M., Jones, M. W., Andrew, R. M., Bakker, D. C. E., Hauck, J., Landschützer, P., Le Quéré, C., Luijkx, I. T., Peters, G. P., Peters, W., Pongratz, J., Schwingshackl, C., Sitch, S., Canadell, J. G., Ciais, P., Jackson, R. B., Alin, S. R., Anthoni, P., Barbero, L., Bates, N. R., Becker, M., Bellouin, N., Decharme, B., Bopp, L., Brasika, I. B. M., Cadule, P., Chamberlain, M. A., Chandra, N., Chau, T.-T.-T., Chevallier, F., Chini, L. P., Cronin, M., Dou, X., Enyo, K., Evans, W., Falk, S., Feely, R. A., Feng, L., Ford, D. J., Gasser, T., Ghattas, J., Gkritzalis, T., Grassi, G., Gregor, L., Gruber, N., Gürses, Ö., Harris, I., Hefner, M., Heinke, J., Houghton, R. A., Hurtt, G. C., Iida, Y., Ilyina, T., Jacobson, A. R., Jain, A., Jarníková, T., Jersild, A., Jiang, F., Jin, Z., Joos, F., Kato, E., Keeling, R. F., Kennedy, D., Klein Goldewijk, K., Knauer, J., Korsbakken, J. I., Körtzinger, A., Lan, X., Lefèvre, N., Li, H., Liu, J., Liu, Z., Ma, L., Marland, G., Mayot, N., McGuire, P. C., McKinley, G. A., Meyer, G., Morgan, E. J., Munro, D. R., Nakaoka, S.-I., Niwa, Y., O'Brien, K. M., Olsen, A., Omar, A. M., Ono, T., Paulsen, M., Pierrot, D., Pocock, K., Poulter, B., Powis, C. M., Rehder, G., Resplandy, L., Robertson, E., Rödenbeck, C., Rosan, T. M., Schwinger, J., Séférian, R., Smallman, T. L., Smith, S. M., Sospedra-Alfonso, R., Sun, Q., Sutton, A. J., Sweeney, C., Takao, S., Tans, P. P., Tian, H., Tilbrook, B., Tsujino, H., Tubiello, F., van der Werf, G. R., van Ooijen, E., Wanninkhof, R., Watanabe, M., Wimart-Rousseau, C., Yang, D., Yang, X., Yuan, W., Yue, X., Zaehle, S., Zeng, J., and Zheng, B.: Global Carbon Budget 2023, Earth Syst. Sci. Data, 15, 5301–5369, https://doi.org/10.5194/essd-15-5301-2023, 2023.
Friis, K., Körtzinger, A., and Wallace, D. W. R.: The salinity normalization of marine inorganic carbon chemistry data, Geophys. Res. Lett., 30, 1085, https://doi.org/10.1029/2002GL015898, 2003.
Fröb, F., Olsen, A., Becker, M., Chafik, L., Johannessen, T., Reverdin, G., and Omar, A.: Wintertime fCO2 Variability in the Subpolar North Atlantic Since 2004, Geophys. Res. Lett., 46, 1580–1590, https://doi.org/10.1029/2018GL080554, 2019.
Frölicher, T. L., Fischer, E. M., and Gruber, N.: Marine heatwaves under global warming, Nature, 560, 360–364, https://doi.org/10.1038/s41586-018-0383-9, 2018.
García-Ibáñez, M. I., Zunino, P., Fröb, F., Carracedo, L. I., Ríos, A. F., Mercier, H., Olsen, A., and Pérez, F. F.: Ocean acidification in the subpolar North Atlantic: Rates and mechanisms controlling pH changes, Biogeosciences, 13, 3701–3715, https://doi.org/10.5194/bg-13-3701-2016, 2016.
García Lafuente, J., Álvarez Fanjul, E., Vargas, J. M., and Ratsimandresy, A. W.: Subinertial variability in the flow through the Strait of Gibraltar, J. Geophys. Res.-Ocean., 107, 1–9, https://doi.org/10.1029/2001jc001104, 2002.
Gómez-Jakobsen, F. J., Mercado, J. M., Cortés, D., and Yebra, L., Salles, S.: A first description of the summer upwelling off the Bay of Algeciras and its role in the northwestern Alboran Sea, Estuar. Coast. Shelf Sci., 225, 106230, https://doi.org/10.1016/j.ecss.2019.05.012, 2019.
González-Dávila, M. and Santana-Casiano, J. M.: Long-term trends of pH and inorganic carbon in the Eastern North Atlantic: the ESTOC site, Front. Mar. Sci., 10, 1–16, https://doi.org/10.3389/fmars.2023.1236214, 2023.
Hersbach, H., Bell, B., Berrisford, P., Biavati, G., Horányi, A., Muñoz Sabater, J., Nicolas, J., Peubey, C., Radu, R., Rozum, I., Schepers, D., Simmons, A., Soci, C., Dee, D., and Thépaut, J.-N.: ERA5 hourly data on single levels from 1940 to present, Copernicus Climate Change Service (C3S) Climate Data Store (CDS), https://doi.org/10.24381/cds.adbb2d47, 2023.
Hoegh-Guldberg, O., Jacob, D., Taylor, M., Bindi, M., Brown, S., Camilloni, I., Diedhiou, A., Djalante, R., Ebi, K. L., Engelbrecht, F., Guiot, J., Hijioka, Y., Mehrotra, S., Payne, A., Seneviratne, S. I., Thomas, A., Warren, R., and Zhou, G.: Impacts of 1.5 °C Global Warming on Natural and Human Systems, in: Global Warming of 1.5 °C: An IPCC Special Report on the Impacts of Global Warming of 1.5 °C Above Pre-Industrial Levels and Related Global Greenhouse Gas Emission Pathways, edited by: Masson-Delmotte, V., Zhai, P., Pörtner, H.-O., Roberts, D., Skea, J., Shukla, P. R., Pirani, A., Moufouma-Okia, W., Péan, C., Pidcock, R., Connors, S., Matthews, J. B. R., Chen, Y., Zhou, X., Gomis, M. I., Lonnoy, E., Maycock, T., Tignor, M., and Waterfield, T., Cambridge Univ. Press, Cambridge, UK and New York, NY, USA, 175–312, https://doi.org/10.1017/9781009157940.005, 2018.
Hood, E. M. and Merlivat, L.: Annual to interannual variations of fCO2 in the northwestern Mediterranean Sea: Results from hourly measurements made by CARIOCA buoys, 1995–1997, J. Mar. Res., 59, 113–131, https://doi.org/10.1357/002224001321237399, 2001.
IPCC: Climate Change 2023: Synthesis Report, Contribution of Working Groups I, II and III to the Sixth Assessment Report of the Intergovernmental Panel on Climate Change, edited by: Lee, H. and Romero, J., IPCC, Geneva, Switzerland, 35–115, https://doi.org/10.59327/IPCC/AR6-9789291691647, 2023.
Jiang, Z. P., Tyrrell, T., Hydes, D. J., Dai, M., and Hartman, S. E.: Variability of alkalinity and the alkalinity–salinity relationship in the tropical and subtropical surface ocean, Global Biogeochem. Cy., 28, 729–742, https://doi.org/10.1002/2013GB004678, 2014.
Lacombe, H. and Richez, C.: The regime of the strait of Gibraltar, Elsevier Oceanogr. Ser., 34, 13–73, https://doi.org/10.1016/S0422-9894(08)71237-6, 1982.
Lee, K., Kim, T. W., Byrne, R. H., Millero, F. J., Feely, R. A., and Liu, Y. M.: The universal ratio of boron to chlorinity for the North Pacific and North Atlantic oceans, Geochim. Cosmochim. Ac., 74, 1801–1811, https://doi.org/10.1016/j.gca.2009.12.027, 2010.
Lewis, E. and Wallace, D.: Program Developed for CO2 System Calculations ORNL/CDIAC-105, Carbon Dioxide Information Analysis Centre [code], United State, https://doi.org/10.15485/1464255, 1998.
López-García, M. J., Millot, C., Font, J., and García-Ladona, E.: Surface circulation variability in the Balearic Basin, J. Geophys. Res., 99, 3285–3296, https://doi.org/10.1029/93JC02114, 1994.
López-Jurado, J. L., García-Lafuente, J. M., and Cano-Lucaya, N.: Hydrographic conditions of the Ibiza channel during November 1990, March 1991 and July 1992, Oceanol. Acta, 18, 235–243, 1995.
Lovenduski, N. S., Gruber, N., Doney, S. C., and Lima, I. D.: Enhanced CO2 outgassing in the Southern Ocean from a positive phase of the Southern Annular Mode, Global Biogeochem. Cy., 21, 1–14, https://doi.org/10.1029/2006GB002900, 2007.
Lueker, T. J., Dickson, A. G., and Keeling, C. D.: Ocean pCO2 calculated from dissolved inorganic carbon, alkalinity, and equations for K1 and K2: Validation based on laboratory measurements of CO2 in gas and seawater at equilibrium, Mar. Chem., 70, 105–119, https://doi.org/10.1016/S0304-4203(00)00022-0, 2000.
Macías, D., Bruno, M., Echevarría, F., Vázquez, A., and García, C. M.: Meteorologically-induced mesoscale variability of the North-western Alboran Sea (southern Spain) and related biological patterns, Estuar. Coast. Shelf Sci., 78, 250–266, https://doi.org/10.1016/j.ecss.2007.12.008, 2008.
Macías, D., Garcia-Gorriz, E., and Stips, A.: The seasonal cycle of the Atlantic Jet dynamics in the Alboran Sea: Direct atmospheric forcing versus Mediterranean thermohaline circulation, Ocean Dynam., 66, 137–151, https://doi.org/10.1007/s10236-015-0914-y, 2016.
Marty, J. C.: The DYFAMED time-series program (French-JGOFS), Deep-Sea Res. Pt. II, 49, 1963–1964, https://doi.org/10.1016/S0967-0645(02)00021-8, 2002.
Mémery, L., Lévy, M., Vérant, S., and Merlivat, L.: The relevant time scales in estimating the air-sea CO2 exchange in a mid-latitude region, Deep-Sea Res. Pt. II, 49, 2067–2092, https://doi.org/10.1016/S0967-0645(02)00028-0, 2002.
Merlivat, L., Boutin, J., Antoine, D., Beaumont, L., Golbol, M., and Vellucci, V.: Increase of dissolved inorganic carbon and decrease in pH in near-surface waters in the Mediterranean Sea during the past two decades, Biogeosciences, 15, 5653–5662, https://doi.org/10.5194/bg-15-5653-2018, 2018.
Millero, F. J., Morse, J., and Chen, C. T.: The carbonate system in the western Mediterranean Sea, Deep-Sea Res. Pt. A, 26, 1395–1404, https://doi.org/10.1016/0198-0149(79)90064-2, 1979.
Millot, C.: Circulation in the Western Mediterranean Sea, J. Mar. Syst., 20, 423–442, https://doi.org/10.1016/S0924-7963(98)00078-5, 1999.
Millot, C. and Taupier-Letage, I.: Circulation in the Mediterranean Sea, in: The Mediterranean Sea, Springer, Handbook of Environmental Chemistry, https://doi.org/10.1007/b107143, 29–66, 2005.
Minas, H. J., Coste, B., Le Corre, P., Minas, M., and Raimbault, P.: Biological and geochemical signatures associated with the water circulation through the Strait of Gibraltar and in the western Alboran Sea, J. Geophys. Res., 96, 8755–8771, https://doi.org/10.1029/91JC00360, 1991.
Mintrop, L., Pérez, F. F., González-Dávila, M., Santana-Casiano, J. M., and Körtzinger, A.: Alkalinity determination by potentiometry: Intercalibration using three different methods, Ciencias Mar., 26, 23–37, https://doi.org/10.7773/cm.v26i1.573, 2000.
Nielsen, J. N.: Hydrography of the Mediterranean and Adjacent Waters, Report on the Danish Ocean Exped., 1908–10, 1, 72–191, 1912.
Nigam, T., Escudier, R., Pistoia, J., Aydogdu, A., Omar, M., Clementi, E., Cipollone, A., Drudi, M., Grandi, A., Mariani, A., Lyubartsev, V., Lecci, R., Cretí, S., Masina, S., Coppini, G., and Pinardi, N.: Mediterranean Sea Physical Reanalysis INTERIM (CMEMS MED-Currents, E3R1i system) (Version 1) [Data set], Copernicus Monitoring Environment Marine Service (CMEMS), https://doi.org/10.25423/CMCC/, 2021.
Oliver, E. C. J., Donat, M. G., Burrows, M. T., Moore, P. J., Smale, D. A., Alexander, L. V., Benthuysen, J. A., Feng, M., Sen Gupta, A., Hobday, A. J., Holbrook, N. J., Perkins-Kirkpatrick, S. E., Scannell, H. A., Straub, S. C., and Wernberg, T.: Longer and more frequent marine heatwaves over the past century, Nat. Commun., 9, 1–12, https://doi.org/10.1038/s41467-018-03732-9, 2018.
Orr, J. C., Epitalon, J.-M., Dickson, A. G., and Gattuso, J.-P.: Routine uncertainty propagation for the marine carbon dioxide system, Mar. Chem., 207, 84–107, https://doi.org/10.1016/j.marchem.2018.10.006, 2018.
Padin, X. A., Vazquez-Rodriguez, M., Castaño, M., Velo, A., Alonso-Perez, F., Gago, J., Gilcoto, M., Alvarez, M., Pardo, P. C., De La Paz, M., Rios, A. F., and Pérez, F. F.: Air-Sea CO2 fluxes in the Atlantic as measured during boreal spring and autumn, Biogeosciences, 7, 1587–1606, https://doi.org/10.5194/bg-7-1587-2010, 2010.
Palmiéri, J., Orr, J. C., Dutay, J. C., Béranger, K., Schneider, A., Beuvier, J., and Somot, S.: Simulated anthropogenic CO2 storage and acidification of the Mediterranean Sea, Biogeosciences, 12, 781–802, https://doi.org/10.5194/bg-12-781-2015, 2015.
Peliz, Á., Teles-Machado, A., Marchesiello, P., Dubert, J., and Lafuente, J. G.: Filament generation off the Strait of Gibraltar in response to gap winds, Dyn. Atmos. Ocean., 46, 36–45, https://doi.org/10.1016/j.dynatmoce.2008.08.002, 2009.
Peliz, Á., Boutov, D., and Teles-Machado, A.: The Alboran Sea mesoscale in a long term high resolution simulation: Statistical analysis, Ocean Model., 72, 32–52, https://doi.org/10.1016/j.ocemod.2013.07.002, 2013.
Pérez, F. F. and Fraga, F.: Association constant of fluoride and hydrogen ions in seawater, Mar. Chem., 21, 161–168, https://doi.org/10.1016/0304-4203(87)90036-3, 1987.
Pérez, F. F., Olafsson, J., Ólafsdóttir, S. R., Fontela, M., and Takahashi, T.: Contrasting drivers and trends of ocean acidification in the subarctic Atlantic, Sci. Rep., 11, 1–16, https://doi.org/10.1038/s41598-021-93324-3, 2021.
Pierrot, D., Neill, C., Sullivan, K., Castle, R., Wanninkhof, R., Lüger, H., Johannessen, T., Olsen, A., Feely, R. A., and Cosca, C. E.: Recommendations for autonomous underway pCO2 measuring systems and data-reduction routines, Deep-Sea Res. Pt. II, 56, 512–522, https://doi.org/10.1016/j.dsr2.2008.05.014, 2009.
Pinot, J. M., Tintoré, J., and Gomis, D.: Multivariate analysis of the surface circulation in the Balearic Sea, Prog. Oceanogr., 36, 343–376, https://doi.org/10.1016/0079-6611(96)00003-1, 1995.
Renault, L., Oguz, T., Pascual, A., Vizoso, G., and Tintore, J.: Surface circulation in the Alboran Sea (western Mediterranean) inferred from remotely sensed data, J. Geophys. Res.-Ocean., 117, 1–11, https://doi.org/10.1029/2011JC007659, 2012.
Richez, C. and Kergomard, C.: Characteristic features occurring in the Strait of Gibraltar as seen through remote sensing data, Phys. Oceanogr. Sea Straits, 318, 441–455, https://doi.org/10.1007/978-94-009-0677-8_21, 1990.
Rivaro, P., Messa, R., Massolo, S., and Frache, R.: Distributions of carbonate properties along the water column in the Mediterranean Sea: Spatial and temporal variations, Mar. Chem., 121, 236–245, https://doi.org/10.1016/j.marchem.2010.01.007, 2010.
Robinson, A. R. and Golnaraghi, M.: The physical and dynamical oceanography of the Mediterranean Sea, in: Ocean Processes in Climate Dynamics: Global and Mediterranean Examples, edited by: Robinson, A. R. andBrink, K. , 255–306, Dordrecht, Springer Netherlands, https://doi.org/10.1007/978-94-011-0870-6_12, 1994.
Robinson, A. R., Leslie, W. G., Theocharis, A., and Lascaratos, A.:Mediterranean Sea circulation, Encycl. Ocean Sci., 3, 1689–1705, https://doi.org/10.1006/rwos.2001.0376, 2001.
Rodgers, K. B., Schwinger, J., Fassbender, A. J., Landschützer, P., Yamaguchi, R., Frenzel, H., Stein, K., Müller, J. D., Goris, N., Sharma, S., Bushinsky, S., Chau, T. T. T., Gehlen, M., Gallego, M. A., Gloege, L., Gregor, L., Gruber, N., Hauck, J., Iida, Y., Ishii, M., Keppler, L., Kim, J. E., Schlunegger, S., Tjiputra, J., Toyama, K., Vaittinada Ayar, P., and Velo, A.: Seasonal Variability of the Surface Ocean Carbon Cycle: A Synthesis, Global Biogeochem. Cy., 37, 1–34, https://doi.org/10.1029/2023GB007798, 2023.
Sammari, C., Millot, C., and Prieur, L.: Aspects of the seasonal and mesoscale variabilities of the Northern Current in the western Mediterranean Sea inferred from the PROLIG-2 and PROS-6 experiments, Deep-Sea Res. Pt. I, 42, 893–917, https://doi.org/10.1016/0967-0637(95)00031-Z, 1995.
Sánchez-Garrido, J. C. and Nadal, I.: The Alboran Sea circulation and its biological response: A review, Front. Mar. Sci., 9, 1–15, https://doi.org/10.3389/fmars.2022.933390, 2022.
Sánchez-Garrido, J. C., García Lafuente, J., Álvarez Fanjul, E., Sotillo, M. G., and de los Santos, F. J.: What does cause the collapse of the western Alboran gyre? Results of an operational ocean model, Prog. Oceanogr., 116, 142–153, https://doi.org/10.1016/j.pocean.2013.07.002, 2013.
Santana-Casiano, J. and González-Dávila, M.: ICOS OTC SOOP NRT Product from CanOA, 2024-01-10-2024-12-11, ICOS RI [data set], https://hdl.handle.net/11676/gwO1_f1H5DDIVmrWaeZ3GwDX (last access: 8 July 2025), 2024.
Sarmiento, J. and Gruber, N.: Ocean Biogeochemical Dynamics, Princeton Univ. Press, Princeton, https://doi.org/10.1515/9781400849079, 2006.
Schneider, A., Tanhua, T., Körtzinger, A., and Wallace, D. W. R.: High anthropogenic carbon content in the eastern Mediterranean, J. Geophys. Res.-Ocean., 115, 1–11, https://doi.org/10.1029/2010JC006171, 2010.
Schneider, A., Wallace, D. W., and Körtzinger, A.: Alkalinity of the Mediterranean Sea, Geophys. Res. Lett., 34, L15608, https://doi.org/10.1029/2006GL028842, 2007.
Schroeder, K., García-Lafuente, J., Josey, S. A., Artale, V., Nardelli, B. B., Carrillo, A., Gacic, M., Gasparini, G. P., Herrmann, M, Lionello, P., Ludwig, W., Millot, C., Özsoy, E., Pisacane, G., Sánchez-Garrido, J. C., Sannino, G., Santoleri, R., Somot, S., Struglia, M. V., Stanev, E. V., Taupier-Letage, I., Tsimplis, M., Vargas-Yáñez, M., Zervakis, V., and Zodiatis, G.: Circulation of the Mediterranean Sea and its variability, in: The Climate of the Mediterranean Region, edited by: Alpert, M. D. and Reinhold, L. O., Vol. 187, https://doi.org/10.1016/B978-0-12-416042-2.00003-3, 2012.
Shadwick, E. H., Thomas, H., Comeau, A., Craig, S. E., Hunt, C. W., and Salisbury, J. E.: Air-Sea CO2 fluxes on the Scotian Shelf: Seasonal to multi-annual variability, Biogeosciences, 7, 3851–3867, https://doi.org/10.5194/bg-7-3851-2010, 2010.
Sharp, J. D., Pierrot, D., Humphreys, M. P., Epitalon, J.-M., Orr, J. C., Lewis, E. R., and Wallace, D. W. R.: CO2SYSv3 for MATLAB (Version v3.2.1), Zenodo, https://doi.org/10.5281/zenodo.3950562, 2023.
Sisma-Ventura, G., Bialik, O. M., Yam, R., Herut, B., and Silverman, J.: pCO2 variability in the surface waters of the ultra-oligotrophic Levantine Sea: Exploring the air–sea CO2 fluxes in a fast warming region, Mar. Chem., 196, 13–23, https://doi.org/10.1016/j.marchem.2017.06.006, 2017.
Smale, D. A., Wernberg, T., Oliver, E. C., Thomsen, M., Harvey, B. P., Straub, S. C., Burrows, M. T., Alexander, L. V., Benthuysen, J. A., Donat, M, G., Feng, M., Hobday, A. J., Holbrook, N. J., Perkins-Kirkpatrick, S. E., Scannell, H. A., Gupta, A. S., Payne, B. L., and Moore, P. J.: Marine heatwaves threaten global biodiversity and the provision of ecosystem services, Nat. Clim. Change, 9, 306–312, 2019.
Solé, J., Ballabrera-Poy, J., Macías, D., and Catalán, I. A.: The role of ocean velocity in chlorophyll variability. A modelling study in the Alboran Sea, Sci. Mar., 80, 249–256, https://doi.org/10.3989/scimar.04290.04A, 2016.
Speich, S., Madec, G., and Crépon, M.: A strait outflow circulation process study: The case of the Alboran Sea, J. Phys. Oceanogr., 26, 320–340, https://doi.org/10.1175/1520-0485(1996)026<0320>2.0.CO;2, 1996.
Stanichny, S., Tigny, V., Stanichnaya, R., and Djenidi, S.: Wind driven upwelling along the African coast of the Strait of Gibraltar, Geophys. Res. Lett., 32, 1–4, https://doi.org/10.1029/2004GL021760, 2005.
Steinhoff, T. and Skjelvan, I.: Uncertainty analysis for calculations of the marine carbonate system for ICOS-Oceans stations, ICOS OTC, https://doi.org/10.18160/VB7C-Z758, 2020.
Taillandier, V., D'Ortenzio, F., and Antoine, D.: Carbon fluxes in the mixed layer of the Mediterranean Sea in the 1980s and the 2000s, Deep-Sea Res. Pt. I, 65, 73–84, https://doi.org/10.1016/j.dsr.2012.03.004, 2012.
Takahashi, T., Olafsson, J., Goddard, J. G., Chipman, D. W., and Sutherland, S. C.: Seasonal variation of CO2 and nutrients in the high-latitude surface oceans: A comparative study, Global Biogeochem. Cy., 7, 843–878, https://doi.org/10.1029/93GB02263, 1993.
Takahashi, T., Sutherland, S. C., Chipman, D. W., Goddard, J. G., Ho, C., Newberger, T., and Munro, D. R.: Climatological distributions of pH, pCO2, total CO2, alkalinity, and CaCO3 saturation in the global surface ocean, and temporal changes at selected locations, Mar. Chem., 164, 95–125, https://doi.org/10.1016/j.marchem.2014.06.004, 2014.
Takahashi, T., Sutherland, S. C., Sweeney, C., Poisson, A., Metzl, N., Tilbrook, B., Bates, N., Wanninkhof, R., Feely, R. A., Sabine, C., Olafsson, J., and Nojiri, Y.: Global sea-air CO2 flux based on climatological surface ocean pCO2, and seasonal biological and temperature effects, Deep-Sea Res. Pt. II, 49, 1601–1622, https://doi.org/10.1016/S0967-0645(02)00003-6, 2002.
Tanhua, T., Hainbucher, D., Schroeder, K., Cardin, V., Álvarez, M., and Civitarese, G.: The Mediterranean Sea system: A review and an introduction to the special issue, Ocean Sci., 9, 789–803, https://doi.org/10.5194/OS-9-789-2013, 2013.
Touratier, F. and Goyet, C.: Decadal evolution of anthropogenic CO2 in the northwestern Mediterranean Sea from the mid-1990s to the mid-2000s, Deep-Sea Res. Pt. I, 56, 1708–1716, https://doi.org/10.1016/J.DSR.2009.05.015, 2009.
Turi, G., Lachkar, Z., and Gruber, N.: Spatiotemporal variability and drivers of pCO2 and air-sea CO2 fluxes in the California Current System: An eddy-resolving modeling study, Biogeosciences, 11, 671–690, https://doi.org/10.5194/BG-11-671-2014, 2014.
Ulses, C., Estournel, C., Marsaleix, P., Soetaert, K., Fourrier, M., Coppola, L., Lefèvre, D., Touratier, F., Goyet, C., Guglielmi, V., Kessouri, F., Testor, P., and Durrieu De Madron, X.: Seasonal dynamics and annual budget of dissolved inorganic carbon in the northwestern Mediterranean deep-convection region, Biogeosciences, 20, 4683–4710, https://doi.org/10.5194/bg-20-4683-2023, 2023.
van Heuven, S., Pierrot, D., Rae, J. W. B., Lewis, E., and Wallace, D. W. R.: MATLAB Program Developed for CO2 System Calculations, ORNL/CDIAC-105b, Carbon Dioxide Information Analysis Center, Oak Ridge National Laboratory, U.S. Department of Energy, Oak Ridge, Tennessee, 2011.
Vargas-Yáez, M., Plaza, F., García-Lafuente, J., Sarhan, T., Vargas, J. M., and Vélez-Belchi, P.: About the seasonal variability of the Alboran Sea circulation, J. Mar. Syst., 35, 229–248, https://doi.org/10.1016/S0924-7963(02)00128-8, 2002.
Vélez-Belchı, P., Vargas-Yáñez, M., and Tintoré, J.: Observation of a western Alborán gyre migration event, Prog. Oceanogr., 66, 190–210, https://doi.org/10.1016/j.pocean.2004.09.006, 2005
Viúdez, A., Pinot, J. M., and Haney, R. L.: On the upper layer circulation in the Alboran Sea, J. Geophys. Res.-Ocean., 103, 21653–21666, https://doi.org/10.1029/98JC01082, 1998.
Wanninkhof, R.: Relationship between wind speed and gas exchange over the ocean revisited, Limnol. Oceanogr. Method., 12, 351–362, https://doi.org/10.4319/lom.2014.12.351, 2014.
Wanninkhof, R., Doney, S. C., Peng, T.-H., Bullister, J. L., Lee, K., and Feely, R. A.: Comparison of methods to determine the anthropogenic CO2 invasion into the Atlantic Ocean, Tellus B, 51, 511–530, https://doi.org/10.3402/tellusb.v51i2.16335, 1999.
Wanninkhof, R., Pierrot, D., Sullivan, K., Mears, P., and Barbero, L.: Comparison of discrete and underway CO2 measurements: Inferences on the temperature dependence of the fugacity of CO2 in seawater, Mar. Chem., 247, 104178, https://doi.org/10.1016/j.marchem.2022.104178, 2022.
Weiss, R.: Carbon dioxide in water and seawater: the solubility of a non-ideal gas, Mar. Chem., 2, 203–215, https://doi.org/10.1016/0304-4203(74)90015-2, 1974.
Whitehead, J. A. and Miller, A. R.: Laboratory simulation of the gyre in the Alboran Sea, J. Geophys. Res.-Ocean., 84, 3733–3742, https://doi.org/10.1029/jc084ic07p03733, 1979.
Wimart-Rousseau, C., Lajaunie-Salla, K., Marrec, P., Wagener, T., Raimbault, P., Lagadec, V., Lafont, M., Garcia, N., Diaz, F., Pinazo, C., Yohia, C., Garcia, F., Xueref-Remy, I., Blanc, P. E., Armengaud, A., and Lefèvre, D.: Temporal variability of the carbonate system and air-sea CO2 exchanges in a Mediterranean human-impacted coastal site, Estuar. Coast. Shelf Sci., 236, 106641, https://doi.org/10.1016/j.ecss.2020.106641, 2020.
Wimart-Rousseau, C., Wagener, T., Álvarez, M., Moutin, T., Fourrier, M., Coppola, L., Niclas-Chirurgien, L., Raimbault, P., D'Ortenzio, F., Durrieu de Madron, X., Taillandier, V., Dumas, F., Conan, P., Pujo-Pay, M., and Lefèvre, D.: Seasonal and Interannual Variability of the CO2 System in the Eastern Mediterranean Sea: A Case Study in the North Western Levantine Basin, Front. Mar. Sci., 8, 1–18, https://doi.org/10.3389/fmars.2021.649246, 2021.
Wimart-Rousseau, C., Wagener, T., Bosse, A., Raimbault, P., Coppola, L., Fourrier, M., Ulses, C., and Lefèvre, D.: Assessing seasonal and interannual changes in carbonate chemistry across two time-series sites in the North Western Mediterranean Sea, Front. Mar. Sci., 10, 1281003, https://doi.org/10.3389/fmars.2023.1281003, 2023.
Wolf-Gladrow, D. A., Zeebe, R. E., Klaas, C., Körtzinger, A., and Dickson, A. G.: Total alkalinity: The explicit conservative expression and its application to biogeochemical processes, Mar. Chem., 106, 287–300, https://doi.org/10.1016/j.marchem.2007.01.006, 2007.
Yao, K. M., Marcou, O., Goyet, C., Guglielmi, V., Touratier, F., and Savy, J. P.: Time variability of the north-western Mediter- 5 ranean Sea pH over 1995–2011, Mar. Environ. Res., 116, 51–60, https://doi.org/10.1016/J.MARENVRES.2016.02.016, 2016.
Zambrano-Bigiarini, M., Majone, B., Bellin, A., Bovolo, C. I., Blenkinsop, S., and Fowler, H. J.: Hydrological impacts of climate change on the Ebro River basin, in: The Ebro River Basin, The Handbook of Environmental Chemistry, Springer, Berlin, Heidelberg, 13, 47–75, https://doi.org/10.1007/698_2010_85, 2010.
Zarghamipour, M., Malakooti, H., and Bordbar, M. H.: Air–Sea CO2 Exchange Over the Mediterranean Sea, the Red Sea and the Arabian Sea, Int. J. Environ. Res., 18, 36, https://doi.org/10.1007/s41742-024-00586-6, 2024.
- Abstract
- Introduction
- Material and methods
- Results
- Discussion
- Conclusions
- Appendix A: Data adjustments and statistical procedures
- Appendix B: Uncertainty in FCO2 explained by the propagated error in ΔfCO2
- Code availability
- Data availability
- Author contributions
- Competing interests
- Disclaimer
- Acknowledgements
- Financial support
- Review statement
- References
- Supplement