the Creative Commons Attribution 4.0 License.
the Creative Commons Attribution 4.0 License.
 | 31 Jul 2025
Assessing evapotranspiration dynamics across central Europe in the context of land–atmosphere drivers
Martin J. Baur
María Piles
Bagher Bayat
Mehdi Rahmati
David Chaparro
Clémence Dubois
Florian M. Hellwig
Carsten Montzka
Angelika Kübert
Marlin M. Mueller
Isabel Augscheller
Francois Jonard
Konstantin Schellenberg
Thomas Jagdhuber
Evapotranspiration (ET) is an important variable for analyzing ecosystems, biophysical processes, and drought-related changes in the soil–plant–atmosphere system. In this study, we evaluated freely available ET products from satellite remote sensing (i.e., the Moderate resolution Imaging Spectroradiometer, MODIS; the ESA's Spinning Enhanced Visible and Infrared Imager, SEVIRI; and the Global Land Evaporation Amsterdam model, GLEAM) as well as modeling and reanalysis (i.e., the land component of the Earth system modeling product European Re-Analysis, ERA5-land, and Global Land Data Assimilation System version 2, GLDAS-2) together with in situ observations at eight Integrated Carbon Observation System (ICOS) stations across central Europe between 2017 and 2020. The land cover at the selected ICOS stations ranged from deciduous broad-leaf forests, evergreen needle-leaf forests, and mixed forests to agriculture. Trends in ET were analyzed together with soil moisture (SM) from the Soil Moisture Active Passive (SMAP) mission and the water vapor pressure deficit (VPD) from FLUXNET field measurements over 4 years, including a severe summer drought in 2018 and contrasting wet conditions in 2017. The analyses revealed the increased atmospheric aridity and decreased water supply for plant transpiration under drought conditions, showing that ET was generally lower and VPD higher in 2018 compared to in 2017. Across the study period, results indicate that during moisture-limited drought years, ET strongly decreases due to decreasing SM and increasing VPD. However, during normal or rather-wet years when SM is not limited, ET is mainly controlled by VPD and, hence, the atmospheric demand.
The comparison of the different ET products based on time series, statistics, and extended triple collocation (ETC) shows generally good agreement, with ETC correlations between 0.39 and 0.99, as well as root-mean-square errors lower than 1.07 mm d−1. The greatest deviations were found at the agricultural managed sites Selhausen (Germany) and Bilos (France), with the former also showing the highest potential dependencies (error cross-correlation (ECC)) between the ET products (up to 7.6 and outside the acceptable range of −0.5 < ECC < 0.5). Thus, our results indicate that ET products differ most at stations with spatiotemporally varying land cover conditions (a variety of crops over growing periods and between seasons). This is because complex heterogeneity in land cover complicates the estimation of ET, while ET products agree well at evergreen needle-leaf stations with fewer temporal changes throughout the year and between years. The ET products from SEVIRI, ERA5-land, and GLEAM performed best when compared to ICOS observations, with either the lowest errors or the highest correlations.
- Article
(9647 KB) - Full-text XML
-
Supplement
(2862 KB) - BibTeX
- EndNote


Land–atmosphere dynamics and interactions are of key importance for understanding exchange processes in the global water, energy, and carbon cycles (Zhou et al., 2016). For a holistic and well-founded ecosystem survey, the uptake, consumption, and release of matter and energy need to be monitored. Especially in times of climate change, the availability of terrestrial water and agricultural productivity assuring food security, as well as forest health guaranteeing, for instance, carbon uptake and biodiversity preservation, are mainly monitored using soil moisture (SM) and water vapor pressure deficit (VPD; as a measure of atmospheric aridity) (Novick et al., 2016; Zhou et al., 2019; Liu et al., 2020). Many studies focus on these two variables when analyzing drought-related terrestrial ecosystem productivity and its spatiotemporal changes (Fu et al., 2022; Zhang et al., 2021). Evapotranspiration (ET) is an important proxy for analyzing water stress and its effects on ecosystems since precipitation (P) and evaporation are the two key components of the global water cycle (Miralles et al., 2011). As the sum of evaporation from land, vegetation, and water surfaces as well as transpiration from vegetation, ET directly links the terrestrial energy, water, and carbon cycles (Zhang et al., 2016; Zhou et al., 2016) and integrates meteorological conditions along SM (Bayat et al., 2022). Hence, ET is an important variable for quantifying biophysical processes, ecosystem functioning, and land surface energy and water budgets, as well as improving weather and climate model predictions (Bayat et al., 2024; Zhang et al., 2016; Zhou et al., 2016). For example, Zhou et al. (2019) reported negative SM–VPD coupling, meaning low SM and high VPD due to land–atmosphere feedbacks, since high VPD stimulates ET, which reduces SM. Although whether ET alone determines SM or whether other factors such as precipitation should also be considered is debatable, as reduced P for constant ET can lead to lower SM (Rahmati et al., 2023), ET should, in any case, be one of the essential variables to inform us about ecosystem–atmosphere dynamics and interactions, along with SM and VPD (Bayat et al., 2021).
ET is controlled by biological (e.g., plant growth and plant stomatal regulation) and physical (e.g., temperature) processes. For example, vegetation controls interannual changes and affects spatiotemporal patterns and trends in ET (Zhang et al., 2016). ET can be theoretically linked to the independent physical control factors of demand (humidity, temperature) and supply (precipitation). Depending on environmental and meteorological conditions, ET is primarily influenced by one of these three factors. For instance, across central Europe, ET is mainly driven by the available energy due to reduced solar radiation under cloudy skies (Zhang et al., 2016). However, Seneviratne et al. (2010) stated that decreasing SM leads to decreasing ET due to less accessible SM for plant water uptake and to increasing soil suction.
During summer 2018, Europe experienced a drought event comparable to previous extreme droughts, such as in 2003 and 2010, with a temperature anomaly of +2.8 K (Rakovec et al., 2022) and abnormally reduced SM and increased VPD (Fu et al., 2022). This extreme drought was characterized by a unique geographical distribution focused on regions at higher latitudes (central and northern Europe), a rapid change from a wet spring to a dry summer, and an intense heat wave in the spring of 2018 (Bastos et al., 2020). As a result, it caused severe tree stress in central Europe, with low leaf water potential, leaf discoloration, and premature shedding, leading to significant tree mortality and heavy drought legacy effects in 2019 and leaving trees vulnerable to further damage from pests and pathogens (Schuldt et al., 2020).
The significance of ET can also be seen in relation to the precise parametrization of SM and in the concept of soil moisture memory, when analyzing soil moisture and its anomalies over time in land surface models (LSMs) (Rahmati et al., 2024). Due to its importance and its influence on the entire soil–plant–atmosphere system (SPAS), tracking ET in time and space, meaning from seasonal to multiyear scales and for wide areas, is necessary and calls for a satellite remote sensing approach (complementary to current modeling and reanalysis approaches). Although ET is not directly measurable from remote sensing acquisitions, optical, thermal, infrared, or microwave observations are used to derive ET based on the surface energy balance and physical and empirical models (Zhang et al., 2016; Rahmati et al., 2020; Singh et al., 2020; Bayat et al., 2021; Bhattacharya et al., 2022; Bayat et al., 2024). Still, research comparing the performance of remote sensing with model and reanalysis data under drought conditions is lacking, and an analysis of the main ET drivers (SM and VPD) that impact these ET products is also needed. Bridging this gap is important to assess the products and the conditions that are more suitable for tracking ET, especially under the increasing frequency and severity of droughts due to climate change.
Several regional studies exist to compare various ET products, e.g., over China (Meng et al., 2024; Xu et al., 2024), across the USA (Carter et al., 2018; Xu et al., 2019), over Africa (Trambauer et al., 2014), and across Europe (Ahmed et al., 2020; Stisen et al., 2021). However, due to the complexity of ecosystems, findings from specific regions (e.g., China, USA, Africa) cannot be generalized to other regions (e.g., Europe). Further, individual European studies focused on only one of the following: spatial product comparisons, evaluating the performance of hydrological models (e.g., Stisen et al., 2021) using time periods (e.g., 2003–2013) at the basin scale (Liu et al., 2023), analyzing drought impacts on ET dynamics using a single ET product (e.g., Sepulcre-Canto et al., 2014; Ahmed et al., 2020), and evaluating new ET products (e.g., Hu et al., 2023). For example, the focus of the study of Stisen et al. (2021) was the evaluation of the spatial pattern performance of different hydrological models for ET estimation. For this, four remote-sensing-based ET products were compared for the years 2002–2014, and they found high agreement in spatial patterns across continental Europe (Stisen et al., 2021). Further, Ahmed et al. (2020) investigated the 2018 drought impact on the MODerate Resolution Imaging Spectroradiometer (MODIS) ET across European ecosystems and found that ET decreased up to 50 % compared to a 10-year reference period, with agricultural areas and mixed natural vegetation being the most affected (Ahmed et al., 2020). However, there is a lack of studies comparing various ET products with each other and with in situ measurements across central Europe, especially during severe-drought years (e.g., 2018), as well as evaluating the potential of remote sensing for tracking seasonal ET dynamics. The evaluation of the varying retrieval techniques employed (e.g., eddy covariance, land surface schemes, Penman–Monteith equation) for commonly used ET products under drought conditions is important for assessing whether they capture ET dynamics correctly.
In this study, we first compare the most common ET products from field measurements, modeling, and remote sensing across central Europe for the period of 2017–2020. The six products selected, the Integrated Carbon Observation System (ICOS), the Moderate resolution Imaging Spectroradiometer (MODIS), the ESA's Spinning Enhanced Visible and Infrared Imager (SEVIRI), the land component of the Earth system product European Re-Analysis (ERA5-land), the Global Land Data Assimilation System version 2 (GLDAS-2), and the Global Land Evaporation Amsterdam Model (GLEAM), are well-known, commonly employed, and freely available. The focus hereby is on the evaluation and quality assessment of the individual products regarding the estimation of absolute ET values and their time dynamics. Second, we compare ET products in the context of SM and VPD, disentangling the relative roles of all three variables within the SPAS under severe-drought conditions in 2018 in comparison to the rather-wet year 2017. This is to analyze how the ET products identify drought conditions and to what extent they can be used as indicators of drought events.
2.1 Study area
The focus is on eight Integrated Carbon Observation System (ICOS) (Rebmann et al., 2018) stations within central Europe between 2017 and 2020, where field-scale in situ eddy covariance (EC) ET measurements are available (see Fig. 1).
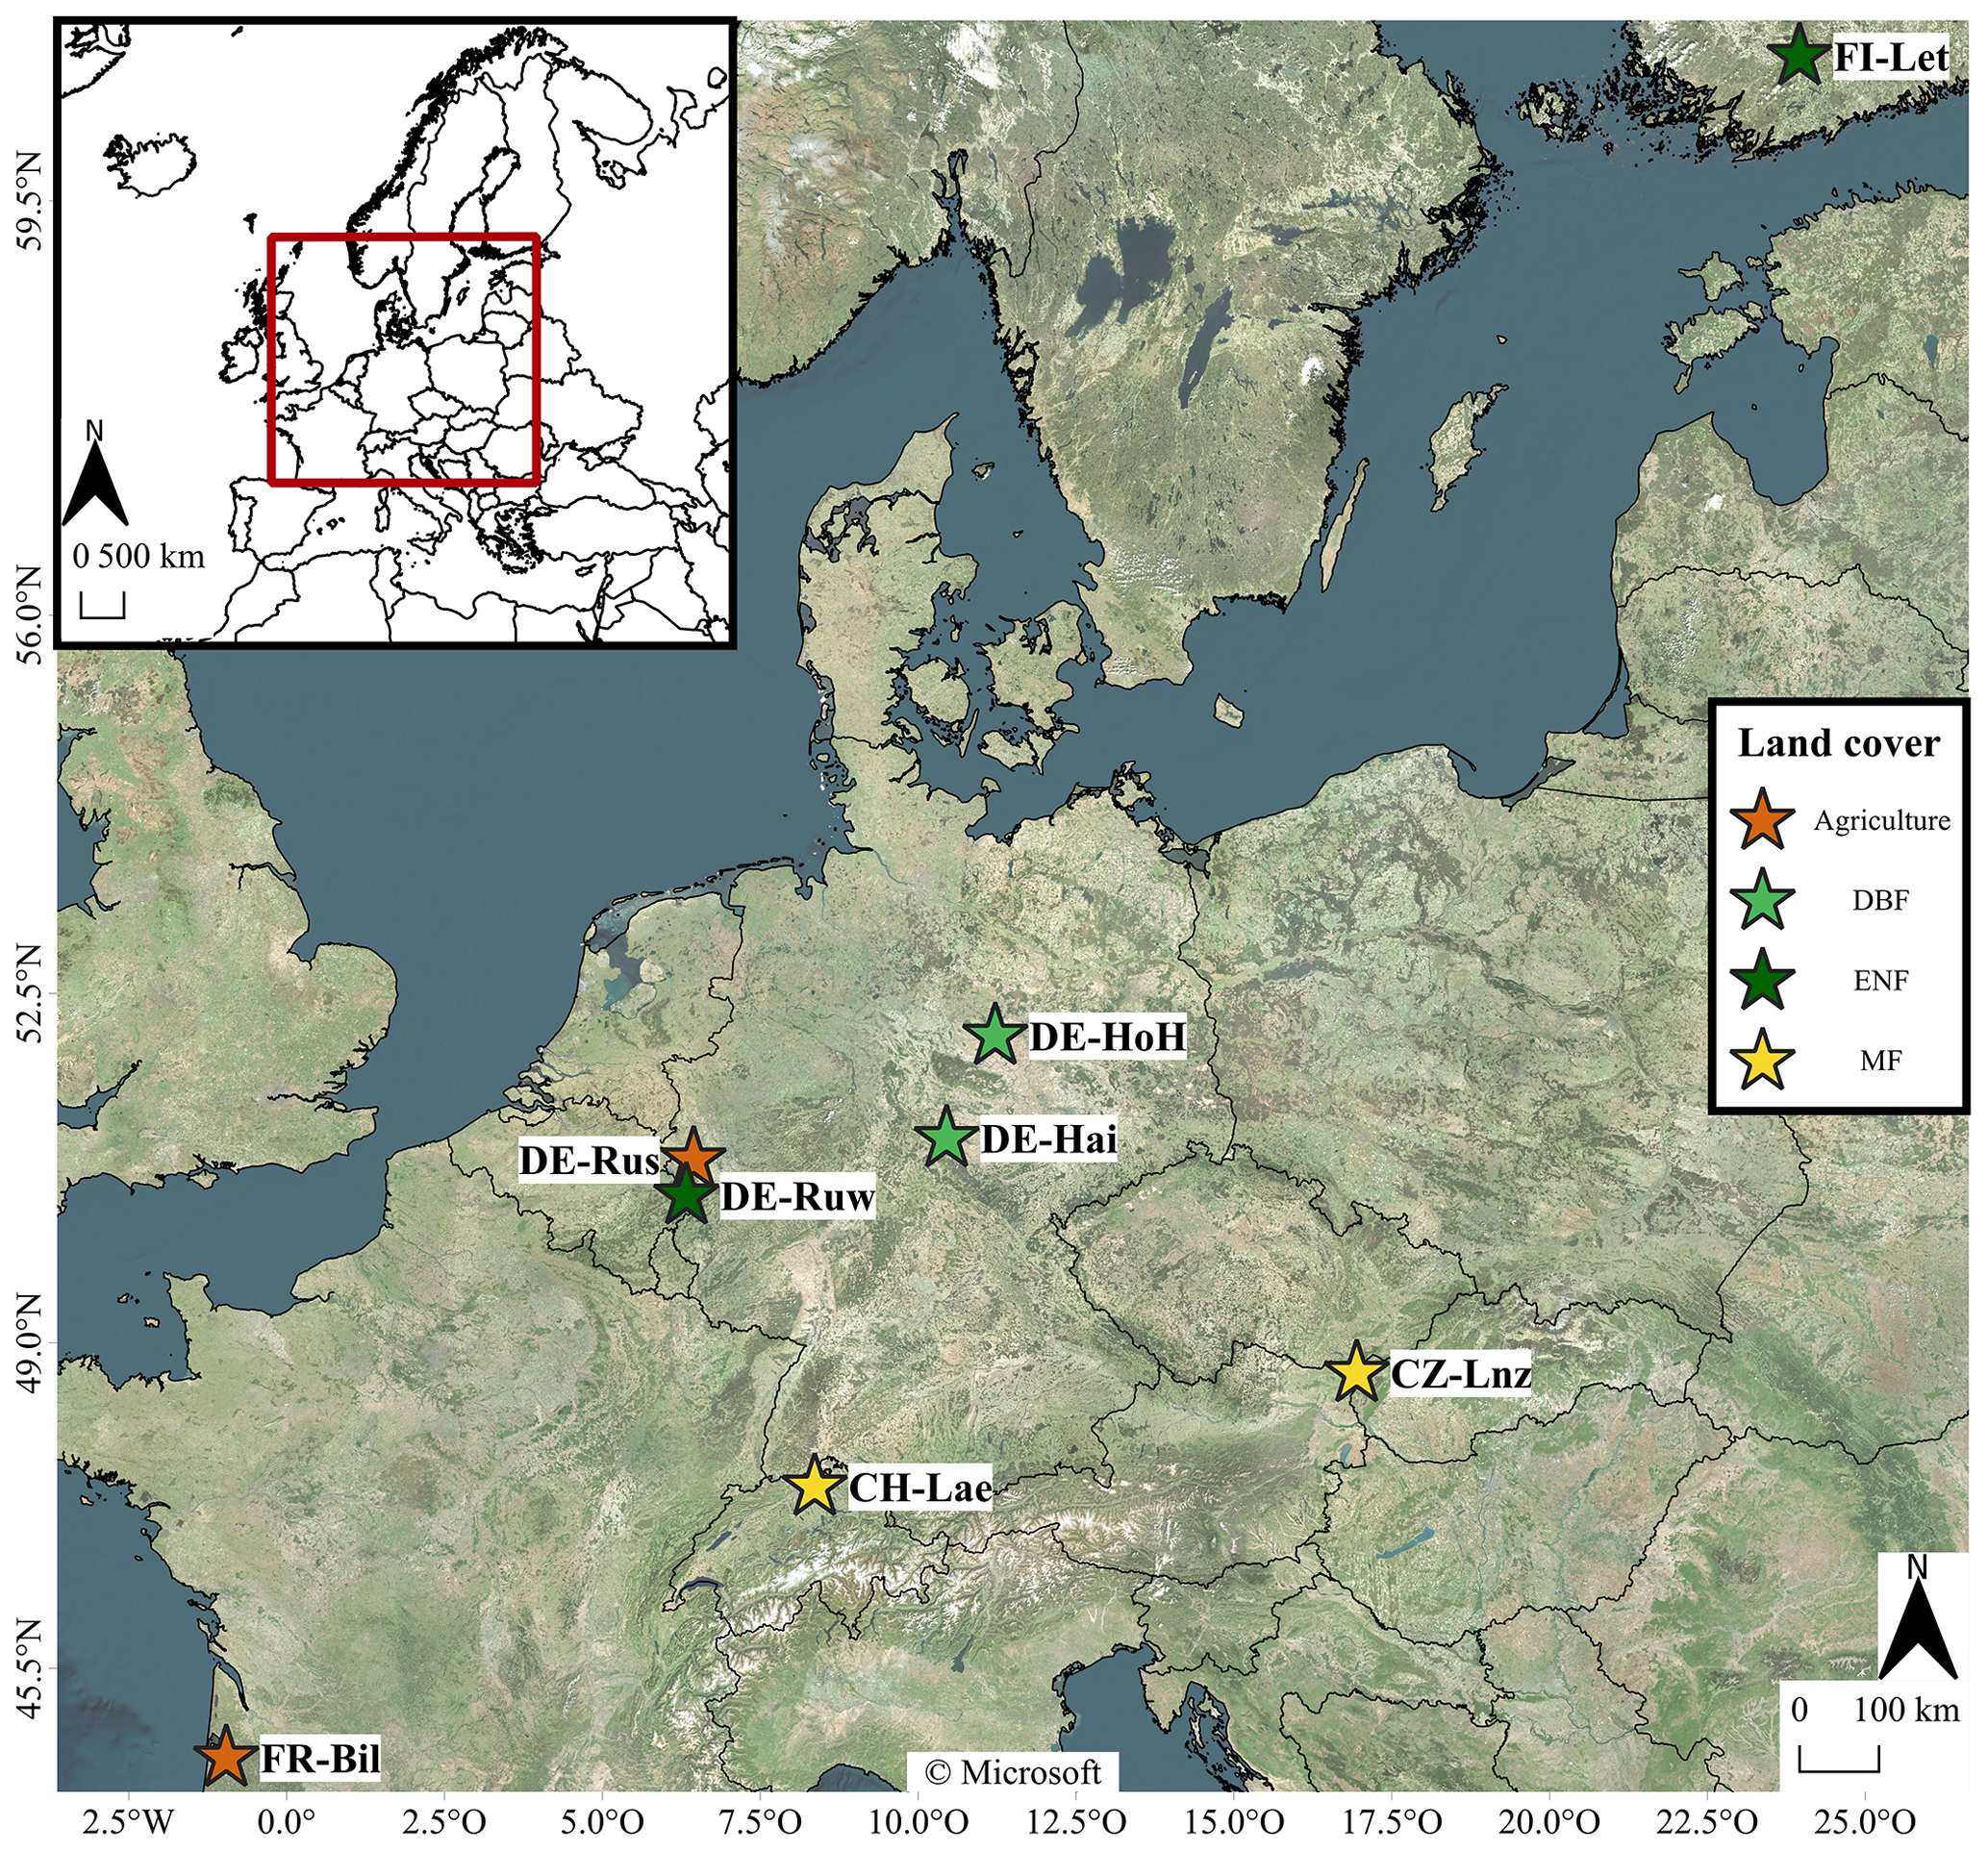
Figure 1Locations of the eight Integrated Carbon Observation System (ICOS) stations in central Europe and their classifications according to the dominant land cover classes. DBF = deciduous broad-leaf forest, ENF = evergreen needle-leaf forest, MF = mixed forest.
The study comprises two deciduous broad-leaf forests (DBF) – the German Hohes Holz (DE-HoH) and Hainich (DE-Hai); two evergreen needle-leaf forests (ENF) – the German Wuestebach (DE-Ruw) and Finnish Lettosuo (FI-Let); and two mixed forest (MF) stations – the Czech Landzhot (CZ-Lnz) and the Swiss Laegern (CH-Lae), as well as two agricultural stations – the German Selhausen (DE-Rus) and the French Bilos (FR-Bil). Details regarding coordinates, altitude, and climate zone for every station are given in Table S1. At every station, a footprint with a 3 km radius is analyzed to account for differences in spatial resolutions among the datasets employed (see Sect. 2.2). As displayed in Fig. 2 and Table S2 (Supplement), the land cover types and their homogeneity within the 3 km × 3 km footprint around every station were analyzed based on the Corine land cover (CLC) 2018 classification from the Copernicus Land Monitoring Service at a 100 m spatial resolution (European Environment Agency, 2019).
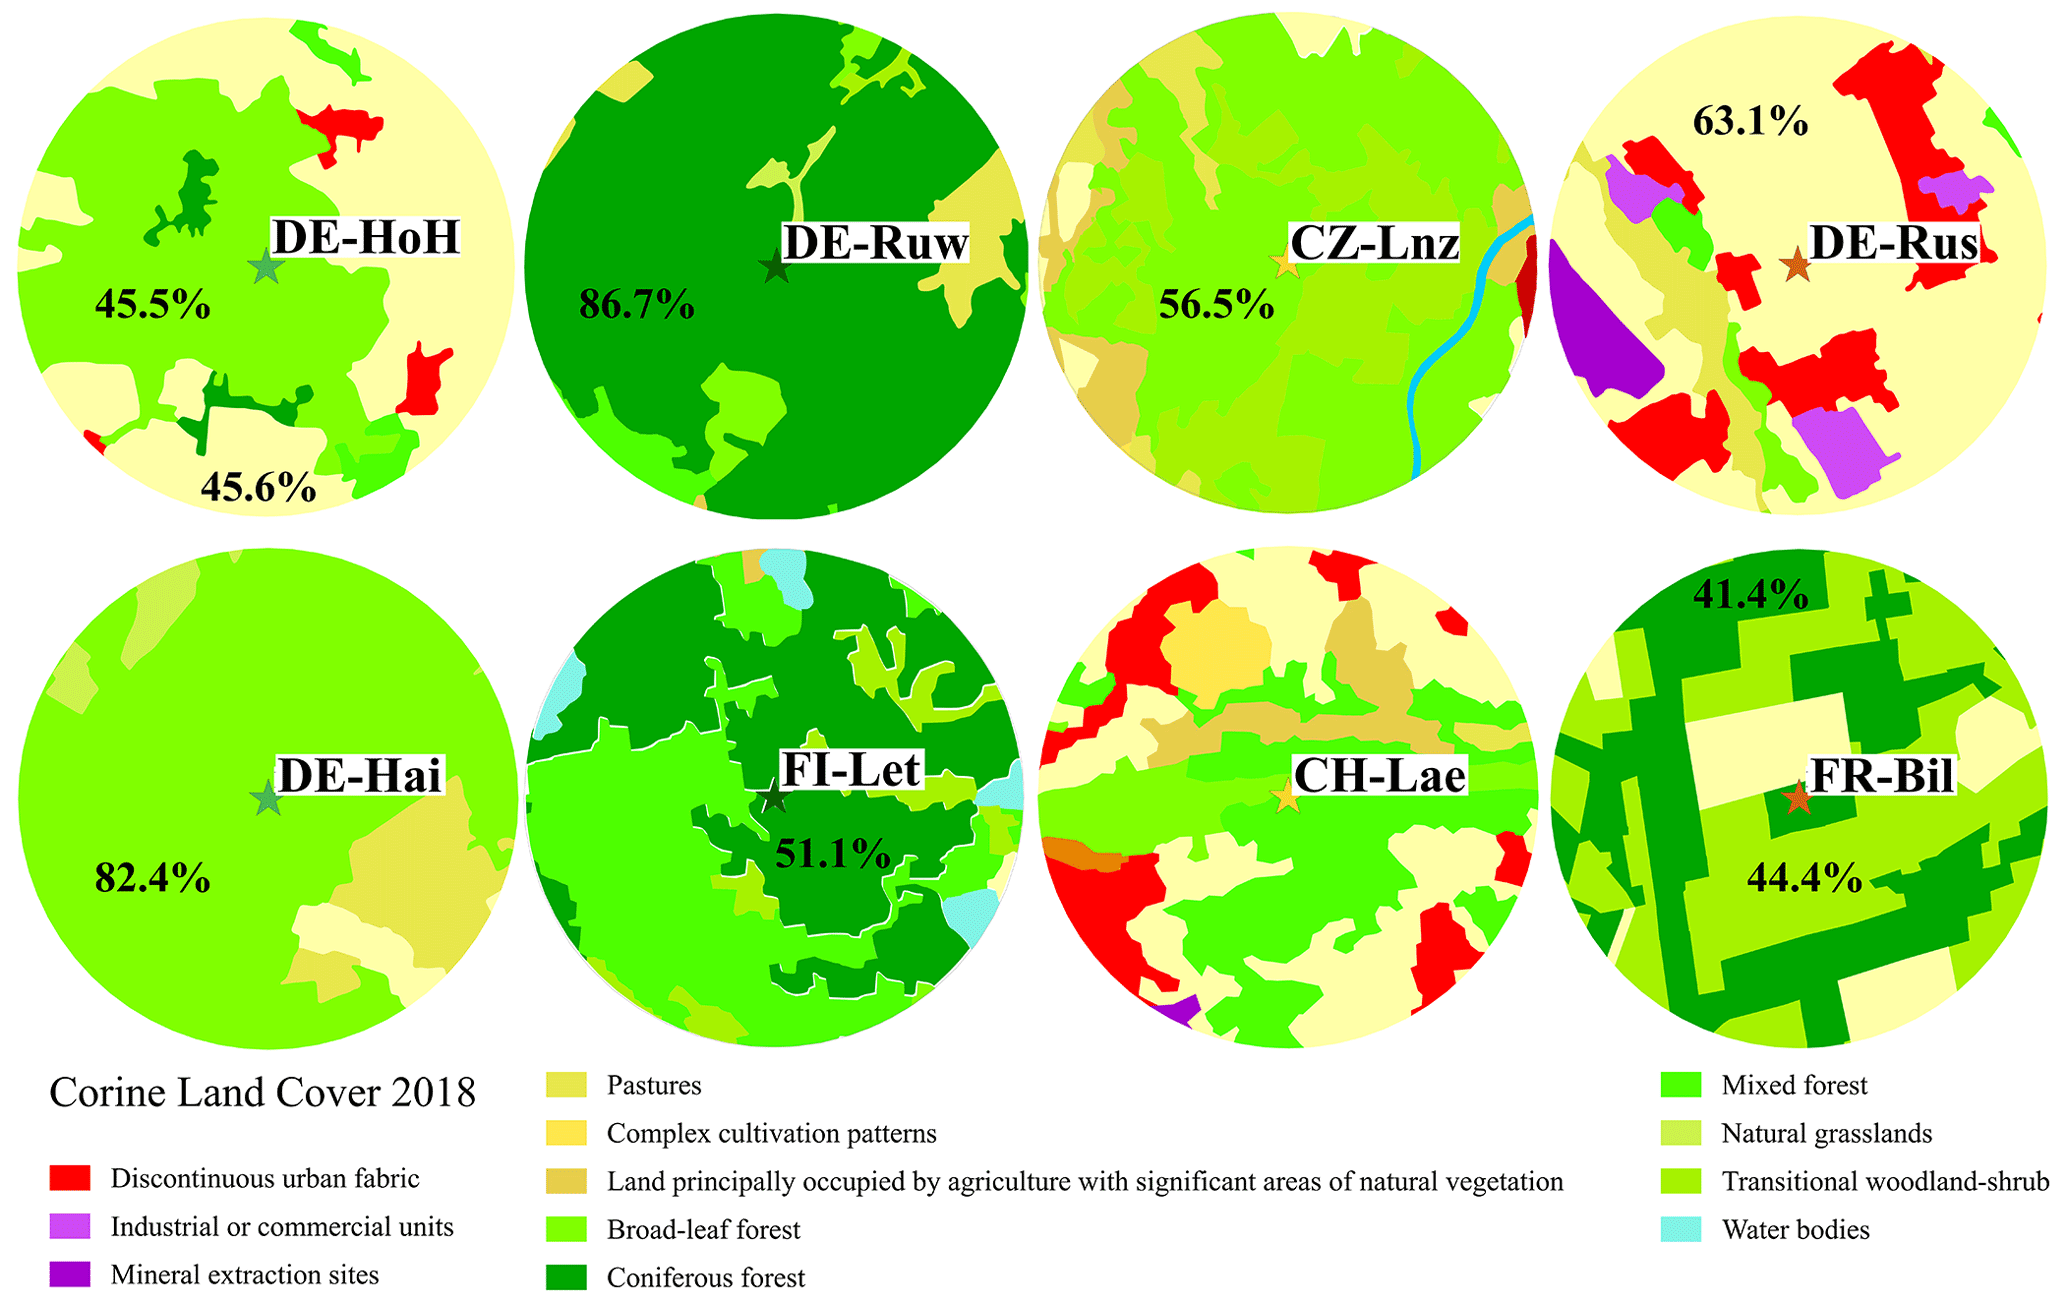
Figure 2Overview of land cover classes according to Corine land cover (CLC) 2018 (European Environment Agency, 2019) within the 3 km × 3 km footprint around every ICOS station investigated. Percentages inside the circles indicate the dominant land cover classes. The percentages of all land cover classes at every station can be found in the Supplement (see Table S2).
According to this classification, two stations can be considered homogeneous, with one dominant land cover class, i.e., 86.7 % coniferous forest at DE-Ruw and 82.4 % broad-leaf forest at DE-Hai. The station DE-Rus is mainly (63.1 %) covered by non-irrigated arable land. Further, two stations show two-part split land cover, with two almost equally dominant classes. At DE-HoH, 45.6 % is covered by non-irrigated arable land, and 45.5 % is covered by broad-leaf forest. At FR-Bil, although it is officially labeled as an ENF station, 44.4 % is covered by transitional woodland shrub, while 41.4 % is covered by coniferous forest, a managed pine forest plantation (Loustau et al., 2022). Hence, due to this heterogeneity and the fact that 14.2 % of the non-irrigated arable land (see Table S2) is mostly located near the station (see Fig. 2), we ranked it as an agricultural station in order to account for the frequently changing land cover conditions and spatial heterogeneity. All other stations are rather heterogeneous, with a mix of more than two different land cover classes (see Table S2 and Fig. 2). However, it is worth noting that the CLC 2018 classification is based on data from 2017 to 2018. Hence, changes in the land cover at each station between 2017 and 2020, e.g., differences between summer and winter months, deforestation, weather extremes (storms, floods), or varying agricultural crop cultivation, are not included here.
Figure 3 illustrates the meteorological conditions (precipitation P and air temperature Tair) at every station during the investigation period. The mean annual P and Tair values are summarized in Table S1. Note that the in situ P measurements contain missing values at the stations DE-HoH, CZ-Lnz, and CH-Lae in 2020. The overall-lowest Tair is found at the northernmost ICOS station, FI-Let, varying between −12.6 °C (absolute minimum) and 22.75 °C (absolute maximum) in the years 2017–2020, with an interannual average of 5.67 °C. In contrast, the highest average Tair (between 2017 and 2020) of 14.1 °C is found at the southernmost ICOS station, FR-Bil, which also has the highest average P value of 3.04 mm d−1. The lowest P is found at DE-HoH, with an average of 1.26 mm d−1, which is similar to that of the other stations in the midlatitudes (see Table S1). The overall-highest Tair and lowest P at every station are always found in 2018, with an average of 1.7 °C higher Tair and 0.76 mm higher annual P compared to the second-hottest and second-driest year in each case. Exceptions can be found at the station FR-Bil, where the highest Tair is recorded in 2019 and the lowest P in 2017, and at DE-Ruw and CH-Lae, where the lowest average annual P is recorded in 2020.
Based on the standardized precipitation–evapotranspiration index (SPEI) (Beguería et al., 2023) (see Fig. S1), which describes drought based on the amount and duration of the water deficit (Yu et al., 2023), distinctly dry and wet years are identified for each ICOS station. While all stations show abnormally dry periods, especially in 2018, only the stations FI-Let and FR-Bil show abnormally wet periods at the end of 2017 and 2019. These two are the northernmost and southernmost stations (see Fig. 1). The choice of SPEI to identify drought conditions instead of the standardized precipitation index (SPI) or other indices (i.e., Palmer drought severity index) is due to the fact that the SPEI considers implicitly temporal changes in ET and, hence, temperature, which is relevant for identifying abnormal (drought) conditions and for this study with a focus on ET variations. Previous studies showed that not only the lack of precipitation but also the level of temperature and consumption of rainfall by evaporation and/or transpiration define drought events (Vicente-Serrano et al., 2010).
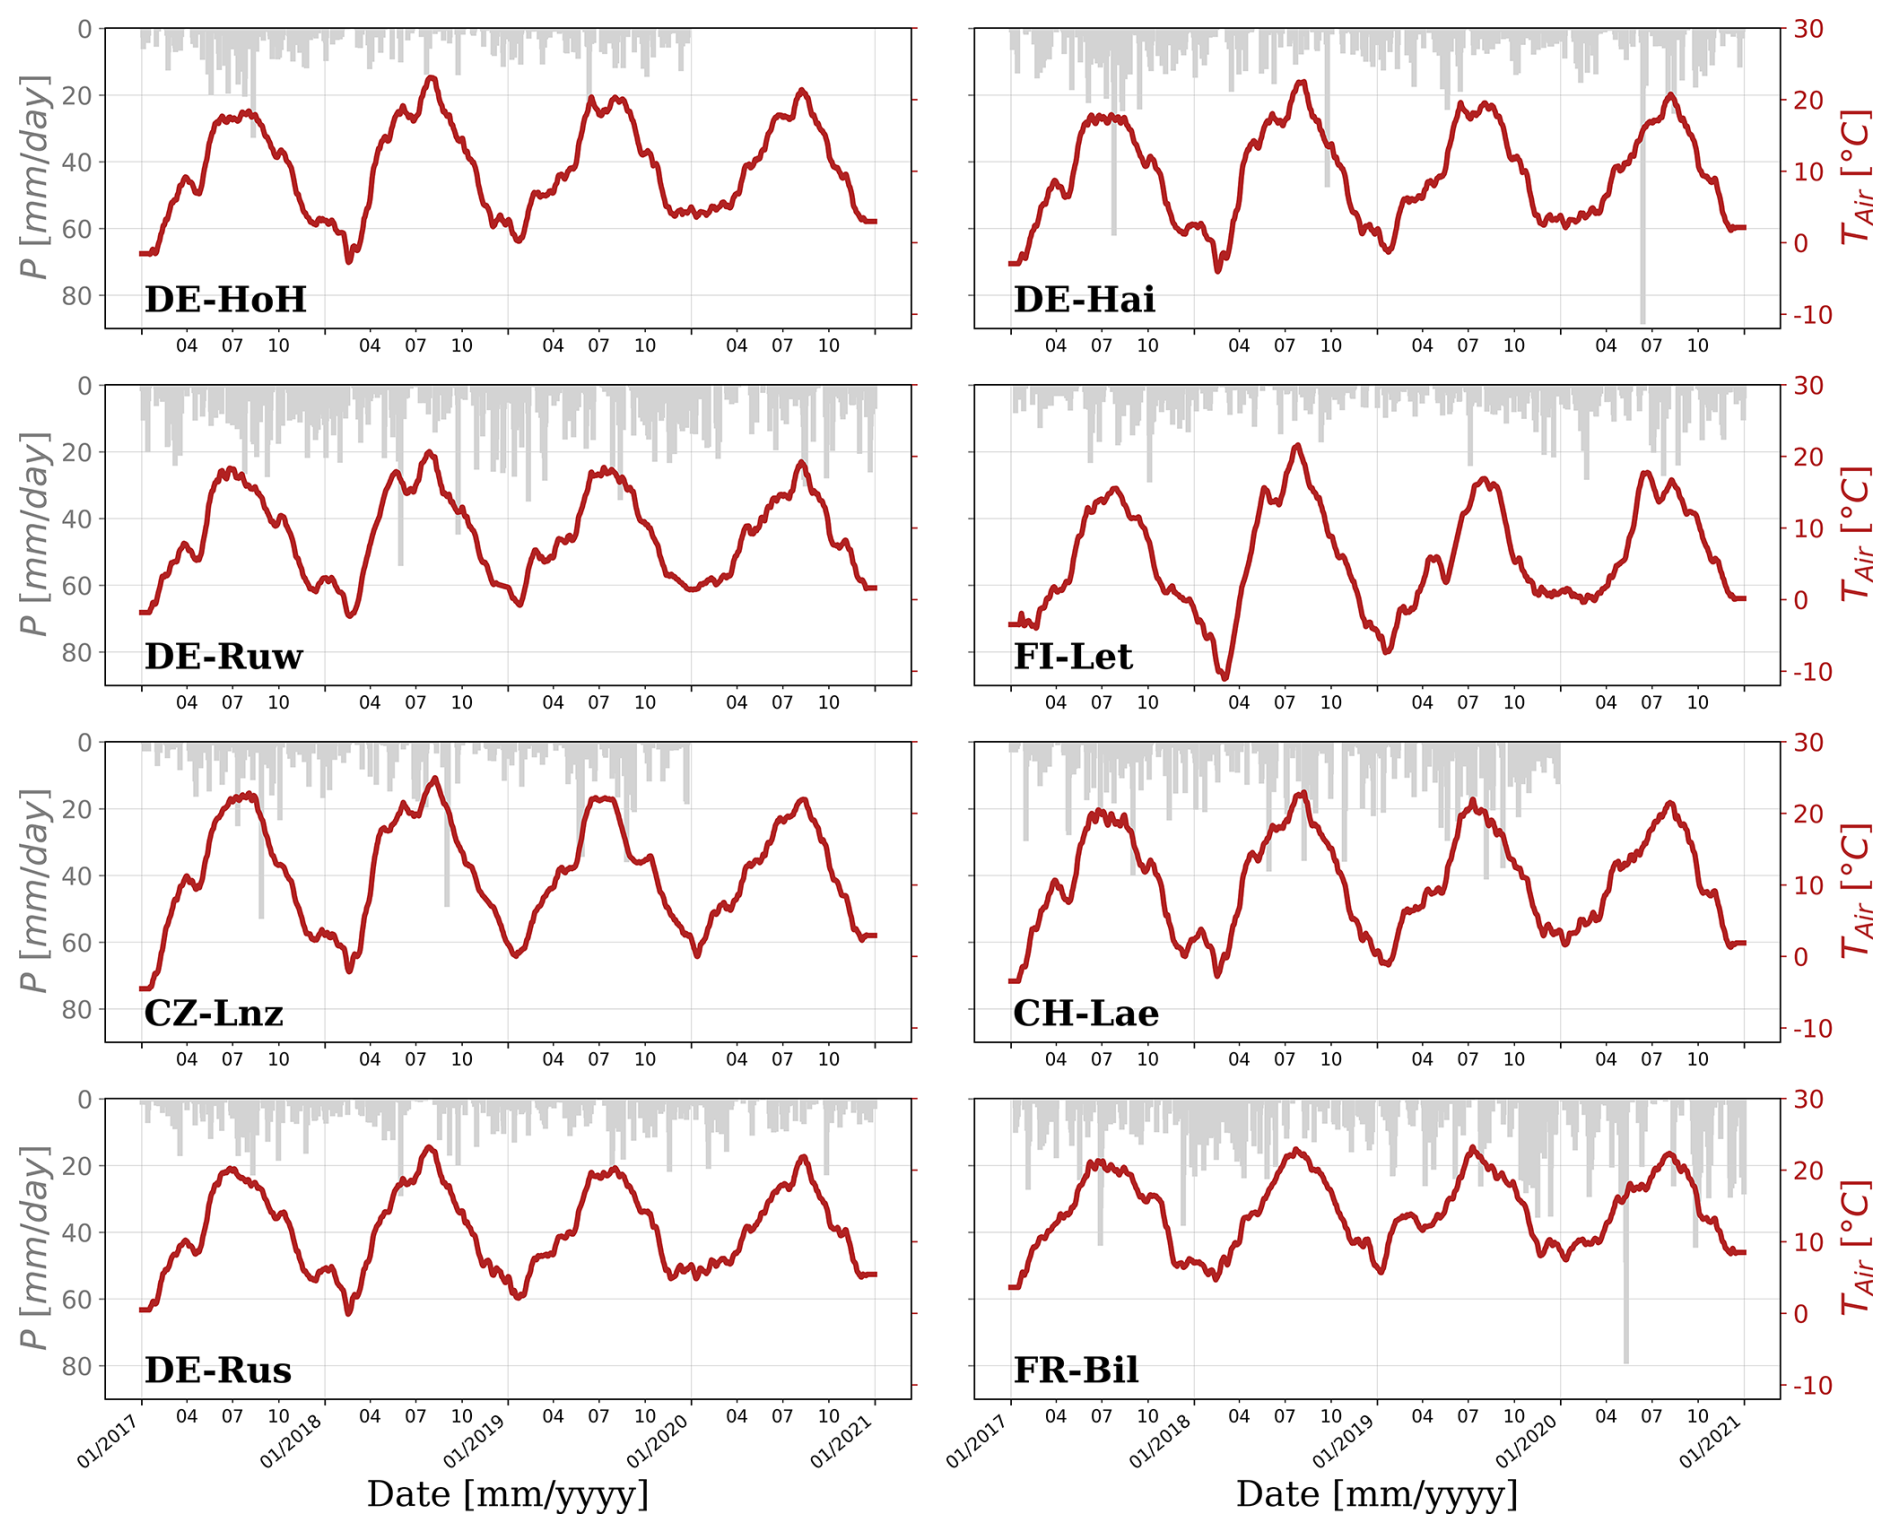
Figure 3Daily in situ measured precipitation (P) [mm d−1] and air temperature (Tair) [°C] at the ICOS stations investigated. Tair was cleaned for daily and weekly dynamics using a Savitzky–Golay (Savitzky and Golay, 1964) filter with a window size of 31 d.
2.2 Database
In the first part of this study, different ET products (see Table 1) are compared in order to evaluate the potential of remote sensing for tracking seasonal ET dynamics. The in situ ET data, recorded at the ICOS stations at the field scale, are mass-balance-based measurements of sensible heat (H) and latent heat (LE) fluxes through the covariance of heat and moisture fluxes, respectively. The LE [W m−2] can then be converted to ET by dividing it by the latent heat of vaporization (2.434 [MJ kg−1] at 20 °C air temperature) (Allen et al., 1998). The ICOS network has made significant efforts to ensure consistently high-quality LE measurements across stations (Rebmann et al., 2018). Aside from in situ ET measurements, we employ some of the most commonly employed optical/thermal remote sensing products from NASA's (National Aeronautics and Space Administration) Moderate-resolution Imaging Spectroradiometer (MODIS) sensor on the Terra satellite (Running et al., 2017), ESA's Spinning Enhanced Visible and Infrared Imager (SEVIRI) sensor on board the Meteosat Second Generation (MSG) satellites, and the Global Land Evaporation Amsterdam Model (GLEAM) (Martens et al., 2017). Further, well-known reanalysis and modeling products from the land component of the Earth system modeling product European Re-Analysis (ERA5-land) from the European Centre for Medium-range Weather Forecasts (ECMWF) (Muñoz Sabater, 2019) and from NASA's Global Land Data Assimilation System version 2 (GLDAS-2) (Beaudoing et al., 2020) are also used (see Table 1). It should be noted that the GLEAM product is based on various remote sensing observations and reanalysis datasets from, e.g., NASA's SMOS (soil moisture and ocean salinity) mission, MODIS, GLDAS-Noah, and ERA-Interim (Martens et al., 2017). The MODIS product with a nominal spatial resolution of 500 m is aggregated to the 3 km footprint, while the SEVIRI, ERA5-land, GLDAS-2, and GLEAM products are maintained at their original spatial resolutions of 3, 9, 25 and 25 km, respectively. Although several downscaling methods and data fusion techniques exist for improving the spatial resolution of remote sensing products (Ha et al., 2013; Mahour et al., 2017; Peng et al., 2017), we decided to keep ET products with a spatial resolution lower than 3 km at their original resolutions (i.e., GLEAM at 25 km). First, the intention of this study is a comparison of well-known and established ET products and not an optimization of rescaled comparisons. Second, we did not want to include additional uncertainties potentially originating from the downscaling method employed or from auxiliary datasets. In particular, downscaling approaches intend to statistically correlate coarse-scale data and fine-scale auxiliaries, yielding interpolation uncertainties and errors that cannot be quantified (Peng et al., 2017). All datasets are, however, temporally aggregated to daily time series in order to provide a temporal basis for comparison and analysis of the signal dynamics.
Table 1Overview of ET and auxiliary products investigated, presenting the data source, the original spatial and temporal resolution, and the retrieval basis and method of each product.
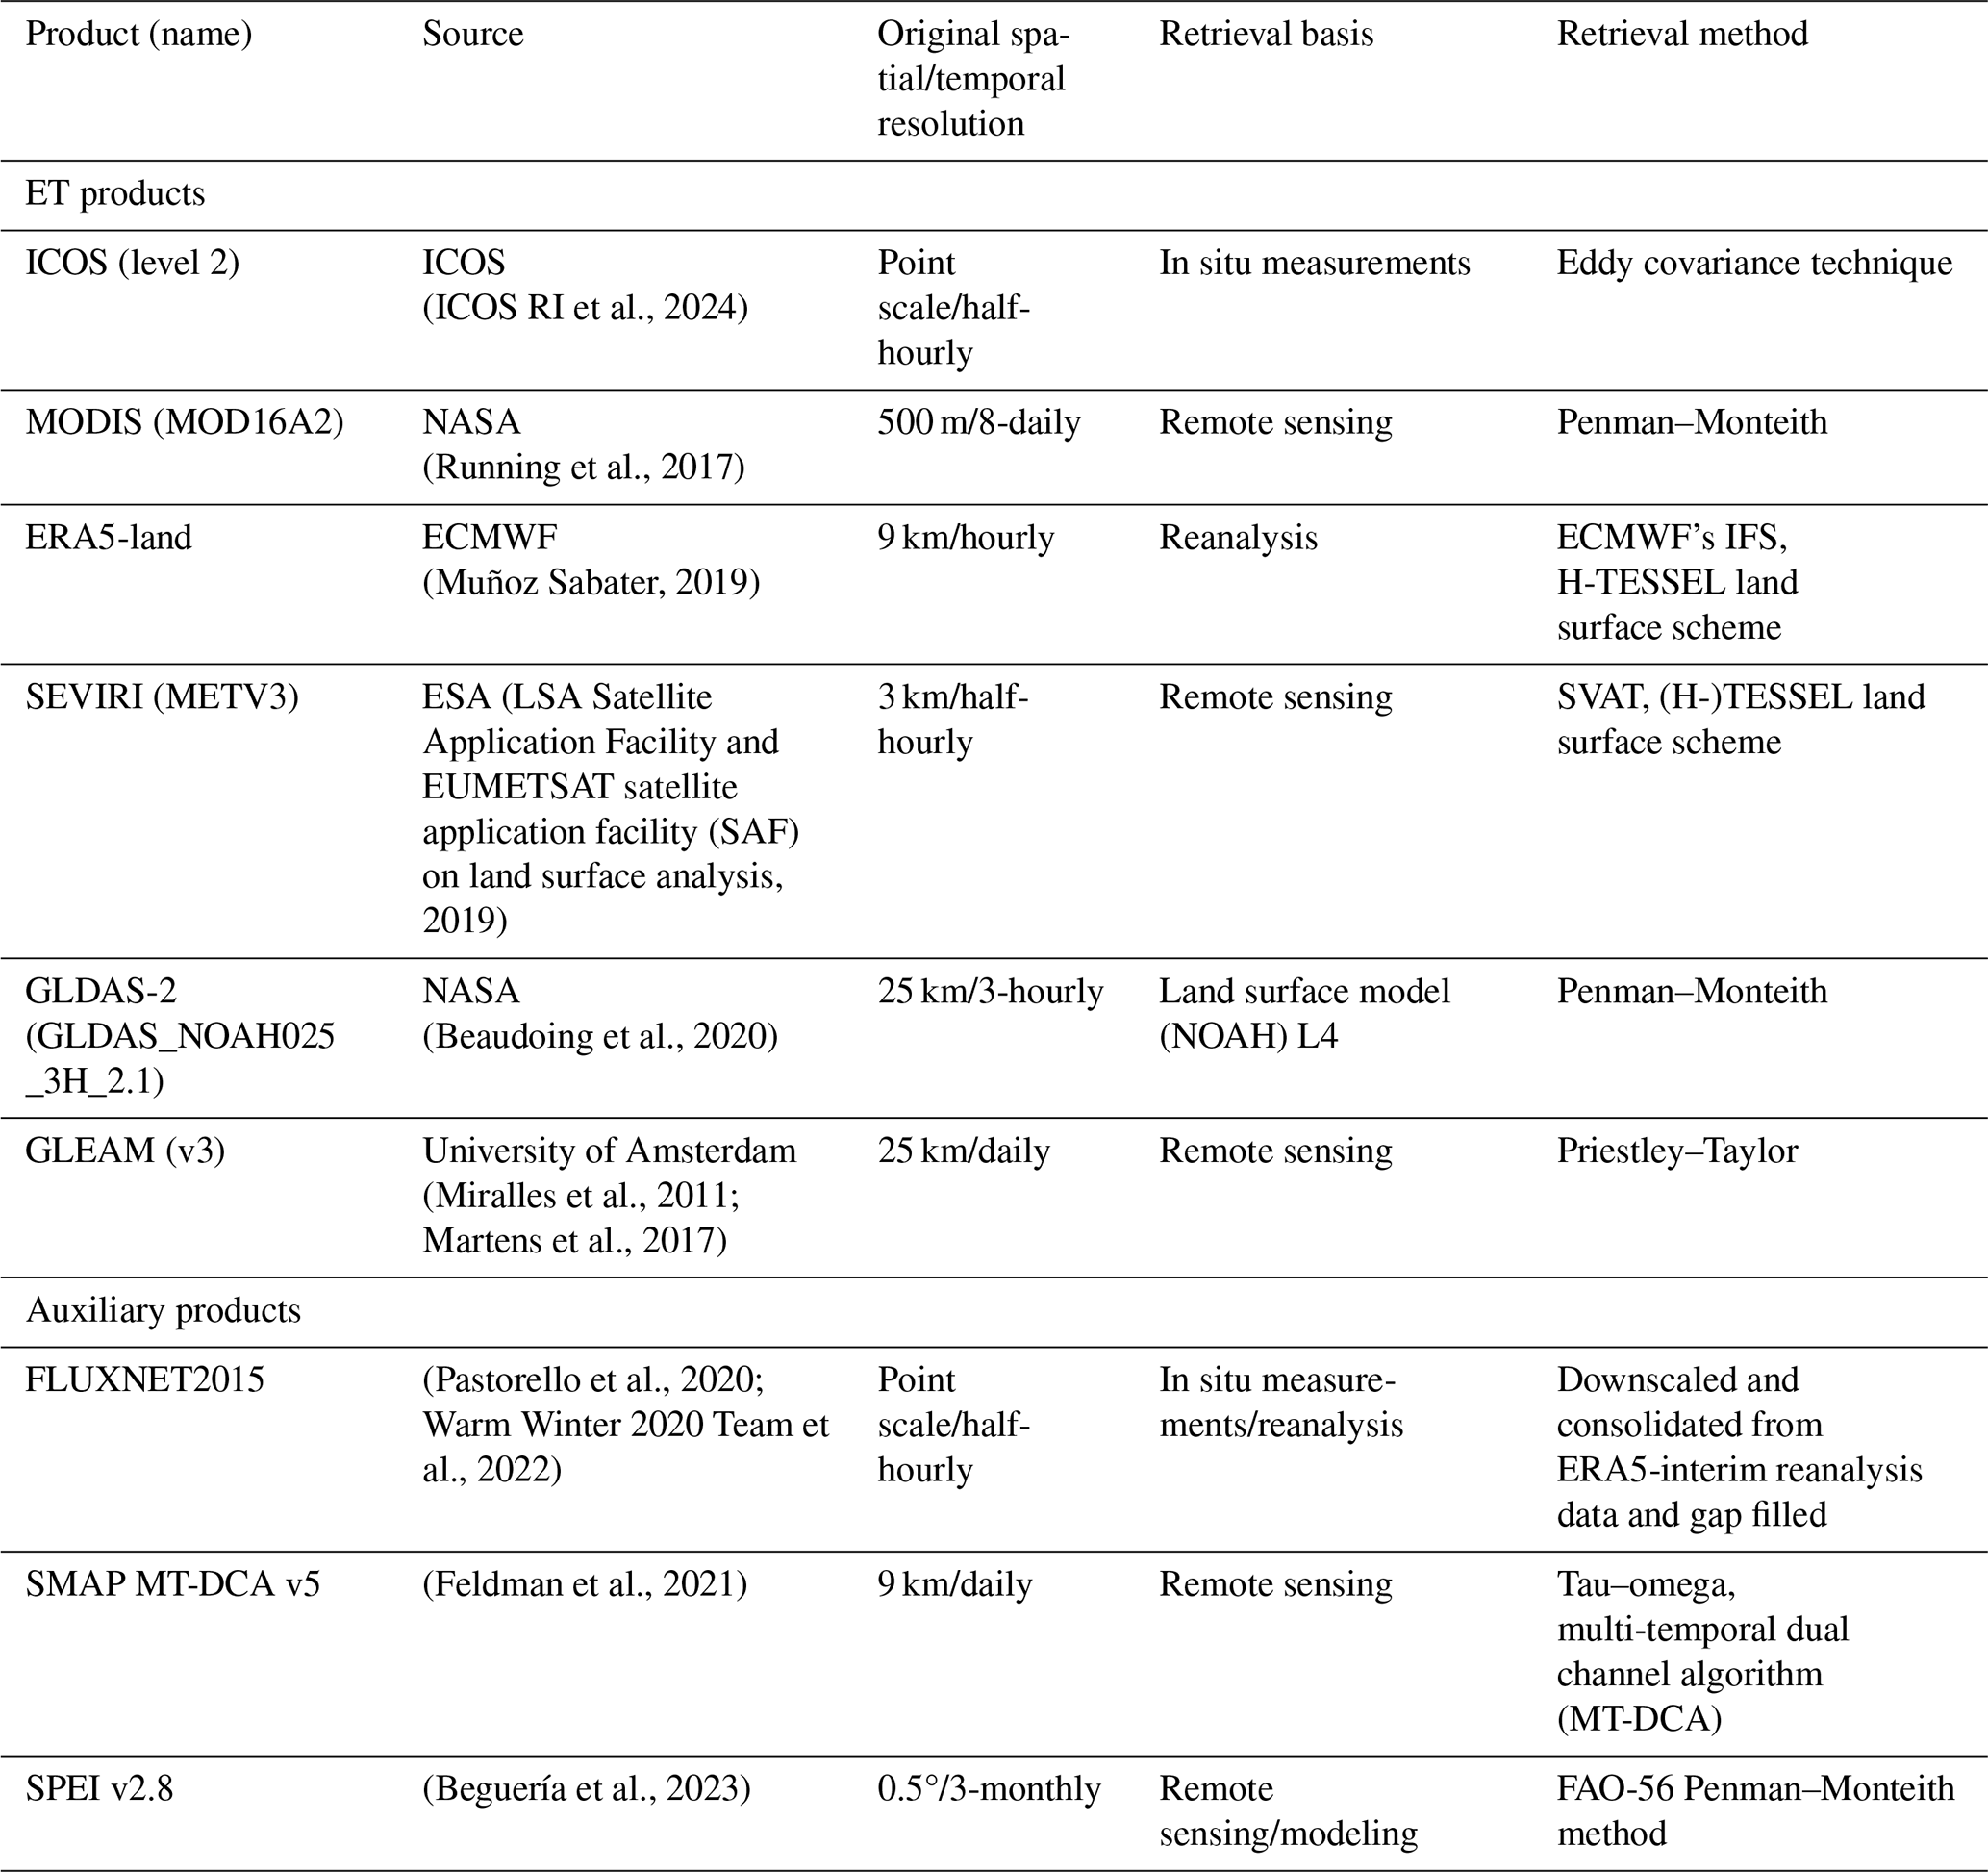
In Table 1, the retrieval methods for each ET product are given. MODIS and GLDAS-2 are based on physically based methods employing the Penman–Monteith equation (Penman, 1948; Monteith, 1965), while GLEAM is based on the Priestley–Taylor equation (Priestley and Taylor, 1972), and ERA5-land uses the ECMWF integrated forecasting system (IFS) and is derived from the ERA5 product where the land surface model is based on Hydrology Tiled ECMWF Surface Scheme for Exchange Processes over Land (H-TESSEL) (Hersbach et al., 2020). Further, SEVIRI employs a soil–vegetation–atmosphere transfer (SVAT) approach also based on the physics of the TESSEL and H-TESSEL land surface schemes (Balsamo et al., 2009; Bayat et al., 2024; Ghilain et al., 2011). The officially reported ET biases after evaluation of each product (based on comparison with multiple EC flux tower measurements) range from −0.11 mm d−1 (MODIS) (Running et al., 2019) and −0.12 mm d−1 (SEVIRI) (The EUMETSAT Satellite Application Facility on Land Surface Analysis, 2024) to −5 % (GLEAM) (Miralles et al., 2011). This means that all three products show, on average, slightly lower ET values compared to EC flux tower measurements. All other products indicate no bias but either employ bias-corrected atmospheric reanalysis data for the forcing to avoid discontinuity in ET retrievals (GLDAS-2) (Rui and Beaudoing, 2022) or found no significant difference in comparison to other products (ERA-land) (Muñoz-Sabater et al., 2021). The Priestley–Taylor equation does not consider the impact of VPD or canopy conductance (Wang and Dickinson, 2012), while within the Penman–Monteith equation VPD and relative humidity (RH) are used according to the function of Fisher et al. (2008) to account for soil water stress when calculating the actual soil evaporation. Further, the canopy conductance is retrieved from stomatal and cuticular conductance depending on the leaf area index (LAI) and the wet-surface fraction, with the stomatal conductance constrained by VPD and minimum air temperature and the cuticular conductance fixed to a constant of 0.01 [mm s−1] (Running et al., 2019; Wang and Dickinson, 2012). As stated by He et al. (2022), the Penman–Monteith equation includes the most important modifications by accounting for the physiological controls on ET, using stomatal resistance to explain water movement from leaves to the atmosphere and aerodynamic resistance to describe heat and water vapor transfer from the dry canopy surface to the air above (Running et al., 2019). Hence, the Penman–Monteith equation is, in theory, more accurate than the Priestley–Taylor equation but, in turn, requires more “parameters that are difficult to characterize” (Fisher et al., 2008). Within the TESSEL and H-TESSEL schemes, canopy conductance is formulated according to the modified Jarvis function and is based on the stomatal conductance (retrieved from net assimilation and Kirchhoff's resistance/conductance analogy) and cuticular conductance (fixed between 0 and 0.25 mm s−1 according to vegetation type), while SM in four layers and therefore also in the deeper soil layers is accounted for when defining the soil water stress on soil evaporation (ECMWF, 2018). Lastly, for this study, it is interesting to note that GLEAM and ERA5-land employ the ECMWF atmospheric reanalysis data (Li et al., 2022), while GLDAS-2 is based on MODIS land surface parameters (Rui and Beaudoing, 2022). These product interdependencies should be kept in mind during interpretation of results.
In the second part of this study, the ET products are compared in relation to two dominant parameters of the SPAS, namely SM and VPD. While VPD comes from in situ measurements of the FLUXNET network (point precise), SM comes from NASA's Soil Moisture Active Passive (SMAP) mission and from the multi-temporal dual channel algorithm (MT-DCA) L-band (1.4 GHz) dataset (9 km spatial resolution) (Konings et al., 2016; Feldman et al., 2021) (see Table 1). We employed the SMAP SM in this study instead of using available in situ measurements from the FLUXNET network since the latter were of poor quality at several stations and for several years, and we wanted to build our analyses on one continuous dataset. The SMAP MT-DCA dataset is quality controlled and filtered, e.g., for snow, frozen ground, and water bodies (Feldman et al., 2021).
2.3 Methods
2.3.1 Extended triple collocation
For the comparison of different ET products in Sect. 3.1., the extended triple collocation (ETC) method (McColl et al., 2014) is employed. The ETC technique provides not only the root-mean-square error σε [mm d−1] of the classical triple collocation (TC) method (Stoffelen, 1998) among three independent measurement systems but also the correlation ρt,X [–] among them, giving the sensitivity of the measuring systems. The most important advantage of the TC and ETC techniques is that one can calculate σε and ρt,X without considering any of the systems the necessary reference. The product with the lowest σε and highest ρt,X is the one with the lowest uncertainty. As input to the ETC, the daily ET time series are filtered for the growing season (April to October) of each year. With the aim of evaluating the performance of the remote sensing products (SEVIRI, MODIS, GLEAM), we compare them individually with ERA5-land and with in situ measurements (ICOS) on the one hand and with GLDAS-2 and ICOS on the other hand. Sanity checks for Gaussian distributions and large sample sizes of ∼ 853 values per product ensure precise and representative ETC analyses. Additionally, since one of the requirements for thorough ETC analyses is the independence among the datasets evaluated (McColl et al., 2014), the error cross-correlation (ECC) values (Gruber et al., 2016) are calculated in order to evaluate product dependencies. In the case that the ECC lies between −0.5 and 0.5, the datasets can be regarded as independent from each other. The ECC for each product comparison (with the ET product ∈ []) is calculated from the error cross-covariance between two products, as well as the random error variance of each dataset (Gruber et al., 2016):
with
and
2.3.2 Anomalies
For the comparison of different SPAS parameters in Sect. 3.2., the seasonal imprint is removed from the signals in order to focus on exceptional events in the time series. For that, we calculated the 30 d anomaly time series for each parameter. To do so, the daily average over all 4 years was calculated first. The resulting daily average was then smoothed using a Savitzky–Golay (Savitzky and Golay, 1964) filter with a window size of 61 d. Lastly, for every day between 2017 and 2020, the difference between the day of interest and the 30 d average of the filtered daily average before that day was calculated.
2.3.3 Binning
To analyze the effects of water supply and demand on ET, we binned daily ET values into a grid of 30 by 30 SM and VPD conditions, with SM ranging between 0.0001 vol % and 40 vol % and VPD ranging between 0.0001 and 25 hPa, both in 31 steps (to create a grid of 30 by 30). While SM is indicative of the available water supply, VPD is an indicator of atmospheric water demand. The co-regulation of ET by SM and VPD is complex, as it depends on stomatal and surface conductance, which in turn are dependent on SM and VPD, as well as vegetation and soil properties (Carminati and Javaux, 2020; Zhang et al., 2021; Vargas Zeppetello et al., 2023). To understand the main directionality of ET changes relative to SM, we calculated the average slopes of ET relative to SM (equivalent to ). The same applies when we examine the directionality of the ET changes with respect to VPD (. These analyses are done in order to obtain an indication of the dominating control of ET.
3.1 Differences in examined ET products
In Fig. 4, times series of the ET products employed (see Table 1) are shown at all the ICOS stations investigated (see Fig. 1) for the period of 2017–2020. Apart from the seasonal dynamics of ET, with the highest values in the summer months (June, July, August) and low values but with more frequent changes in the winter months (November, December, January), the overall good consistency between the different ET products can be noted.
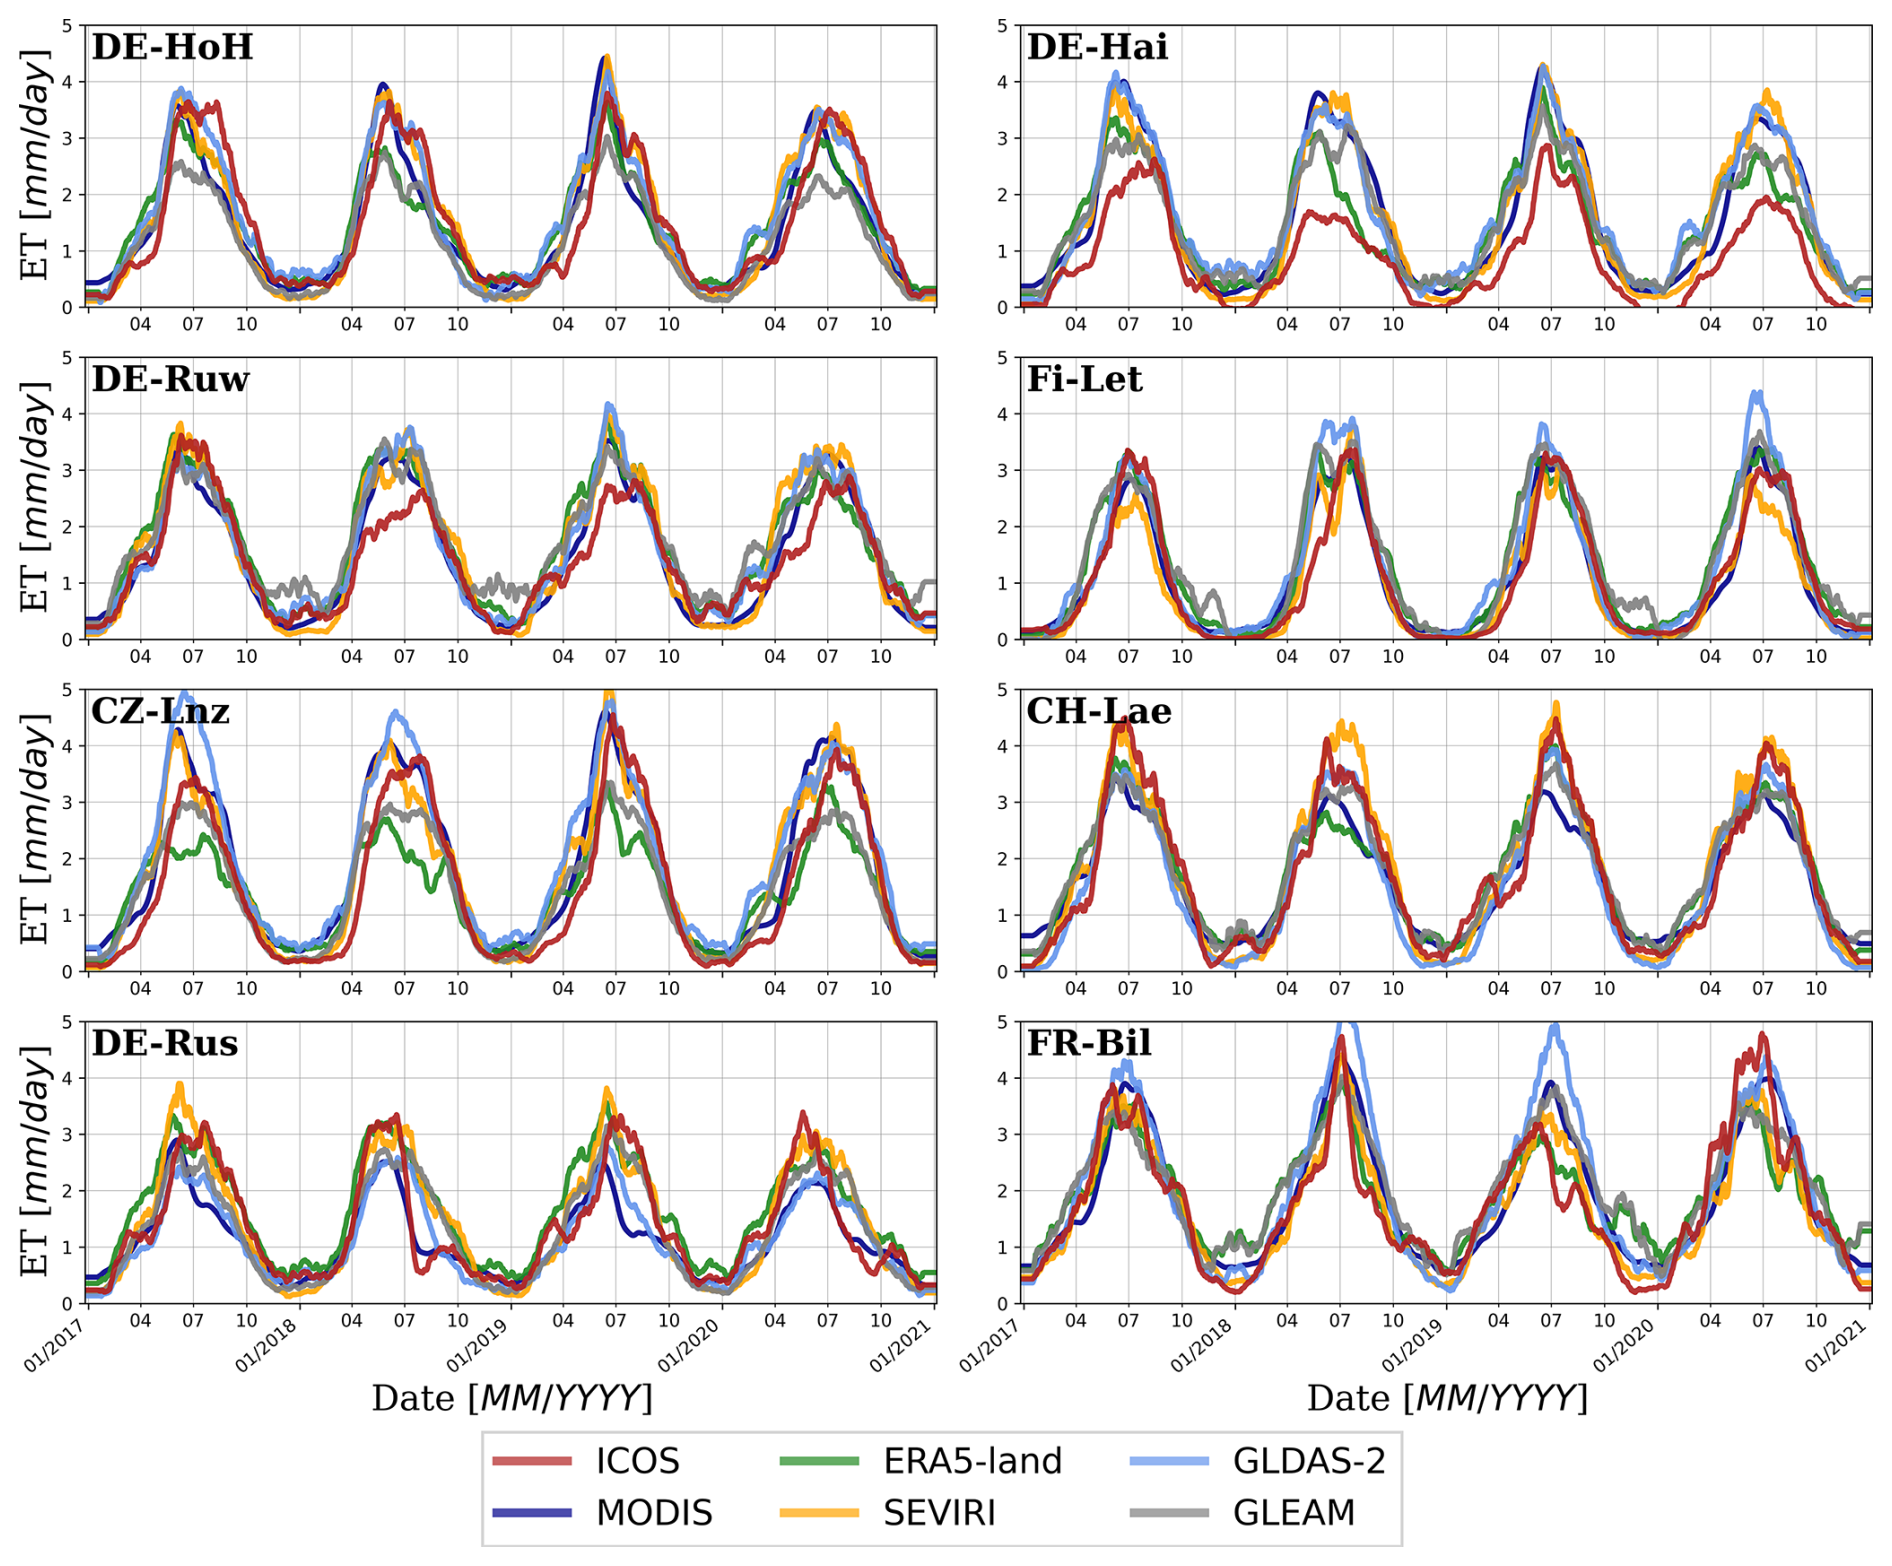
Figure 4Comparison of seasonal dynamics of ET [mm] products for the period of 2017–2020 at the ICOS stations investigated. All time series were cleaned for daily and weekly dynamics using a Savitzky–Golay (Savitzky and Golay, 1964) filter with a window size of 31 d.
The highest variability among products and ET dynamics can be observed during summer months, with the greatest differences at the stations DE-Hai and DE-Ruw when comparing all products to the ICOS measurements. Here, the ground-based ET always shows lower values across all years for DE-Hai and in 2018 and 2019 for DE-Ruw. Additionally, for each year, the ICOS ET rises a few weeks later than the other products at both stations but decreases together with all other ET products. These differences and the delayed seasonal increase in remote sensing, modeling, and reanalysis products compared to the ICOS measurements at the DBF and ENF stations occur, for one, due to the discrepancies in spatial resolutions (point scale versus kilometer scale). Second, ICOS field measurements provide different sensitivities to vegetation phenology than the other remote sensing and modeling products due to measuring directly above the canopy. At the station CZ-Lnz, ERA5-land shows the overall-lowest ET values during the growing period (April–October). Further, the highest ET values are found at the station FR-Bil for the GLDAS-2 product, with the most pronounced differences compared to all other products in 2018, while the overall-lowest values across all years and ET products are displayed at DE-Rus. At the latter, ET values never exceed 4 mm d−1. From these daily time series analyses, the largest differences among ET products can be seen at the DBF stations DE-Hai, at the MF station CZ-Lnz, and at the agricultural station DE-Rus. At DE-Hai, the ICOS ET is overestimated by all other products; at CZ-Lnz, the ERA5-land product is lower compared to all other ET products, especially in the summer months; and at DE-Rus, the MODIS and often also the ICOS product are overestimated by the ERA5-land and SEVIRI products. Hence, no clear pattern at all stations and between different land cover classes can be found.
For more detailed analyses, daily time series of ET products are averaged to 8-daily sums in order to account for the coarse temporal resolution of the MODIS product (see Table 1). In Fig. 5, the 8-daily ET products are compared with each other at the two agriculture stations. The same illustrations for the forest stations can be found in the Supplement (see Figs. S2–4). These figures show the scatter plots between ET products, giving the probability density function (PDF) of points (by color) below (left panels) and above (right panels) the matrix diagonal, as well as the PDF curves for each site and product in the diagonal of the matrix. They support the previously stated good consistency between ET products but outline the exact differences on the 8 d scale in more detail. The highest density of values can be observed between 0 to 10 mm (8 d)−1 at all stations except at DE-Ruw and FR-Bil. This comes from the rather-low ET values during the autumn, winter, and spring seasons due to the overall-reduced solar radiation combined with decreased vegetation cover during cold months. However, at the stations DE-Ruw (see Fig. S3, right panels) and FR-Bil (see Fig. 4, left panels), the density of values is shifted towards higher ET (0 to 20 mm (8 d)−1). These are two out of the three stations covered by coniferous forest. While FR-Bil has two-part split land cover in the footprint (shrubs and coniferous forest), DE-Ruw is almost homogeneously covered by coniferous forest (see Fig. 2), and both stations show higher ET values during autumn and spring seasons compared to all other stations due to, e.g., the lack of leaf-off conditions during that period. The third station covered by coniferous forest (FI-Let), however, shows the density of values between 0 and 10 mm (8 d)−1 (see Fig. S3, left panels), similar to at the DBF and MF stations. This is the northernmost station, typically covered by snow between November and March.
Further, the over- or underestimation of values between two products can be seen, such as the overestimation of ICOS compared to all other ET products at DE-Hai for higher ET values, affirmed by the PDF for ICOS peaking at the highest density (see Fig. S2, left panels). There is also an overestimation of MODIS compared to all other products at DE-Rus (see Fig. 5, right panels) and CH-Lae (see Fig. S4, left panels) when ET values are higher. DE-Rus is the only homogeneously covered agricultural station, with potentially the most changes in land cover classes during the seasons and years, showing the greatest differences in ET products due to the overall-higher complexity of agricultural plants and more frequent alterations. While the PDF of MODIS at DE-Rus peaks at the highest density and gives the smallest range of ET values across all stations, a bimodal distribution of densities is displayed at CH-Lae. This bimodal distribution of densities is also noticeable from other products and at other stations but is always stronger for MODIS.
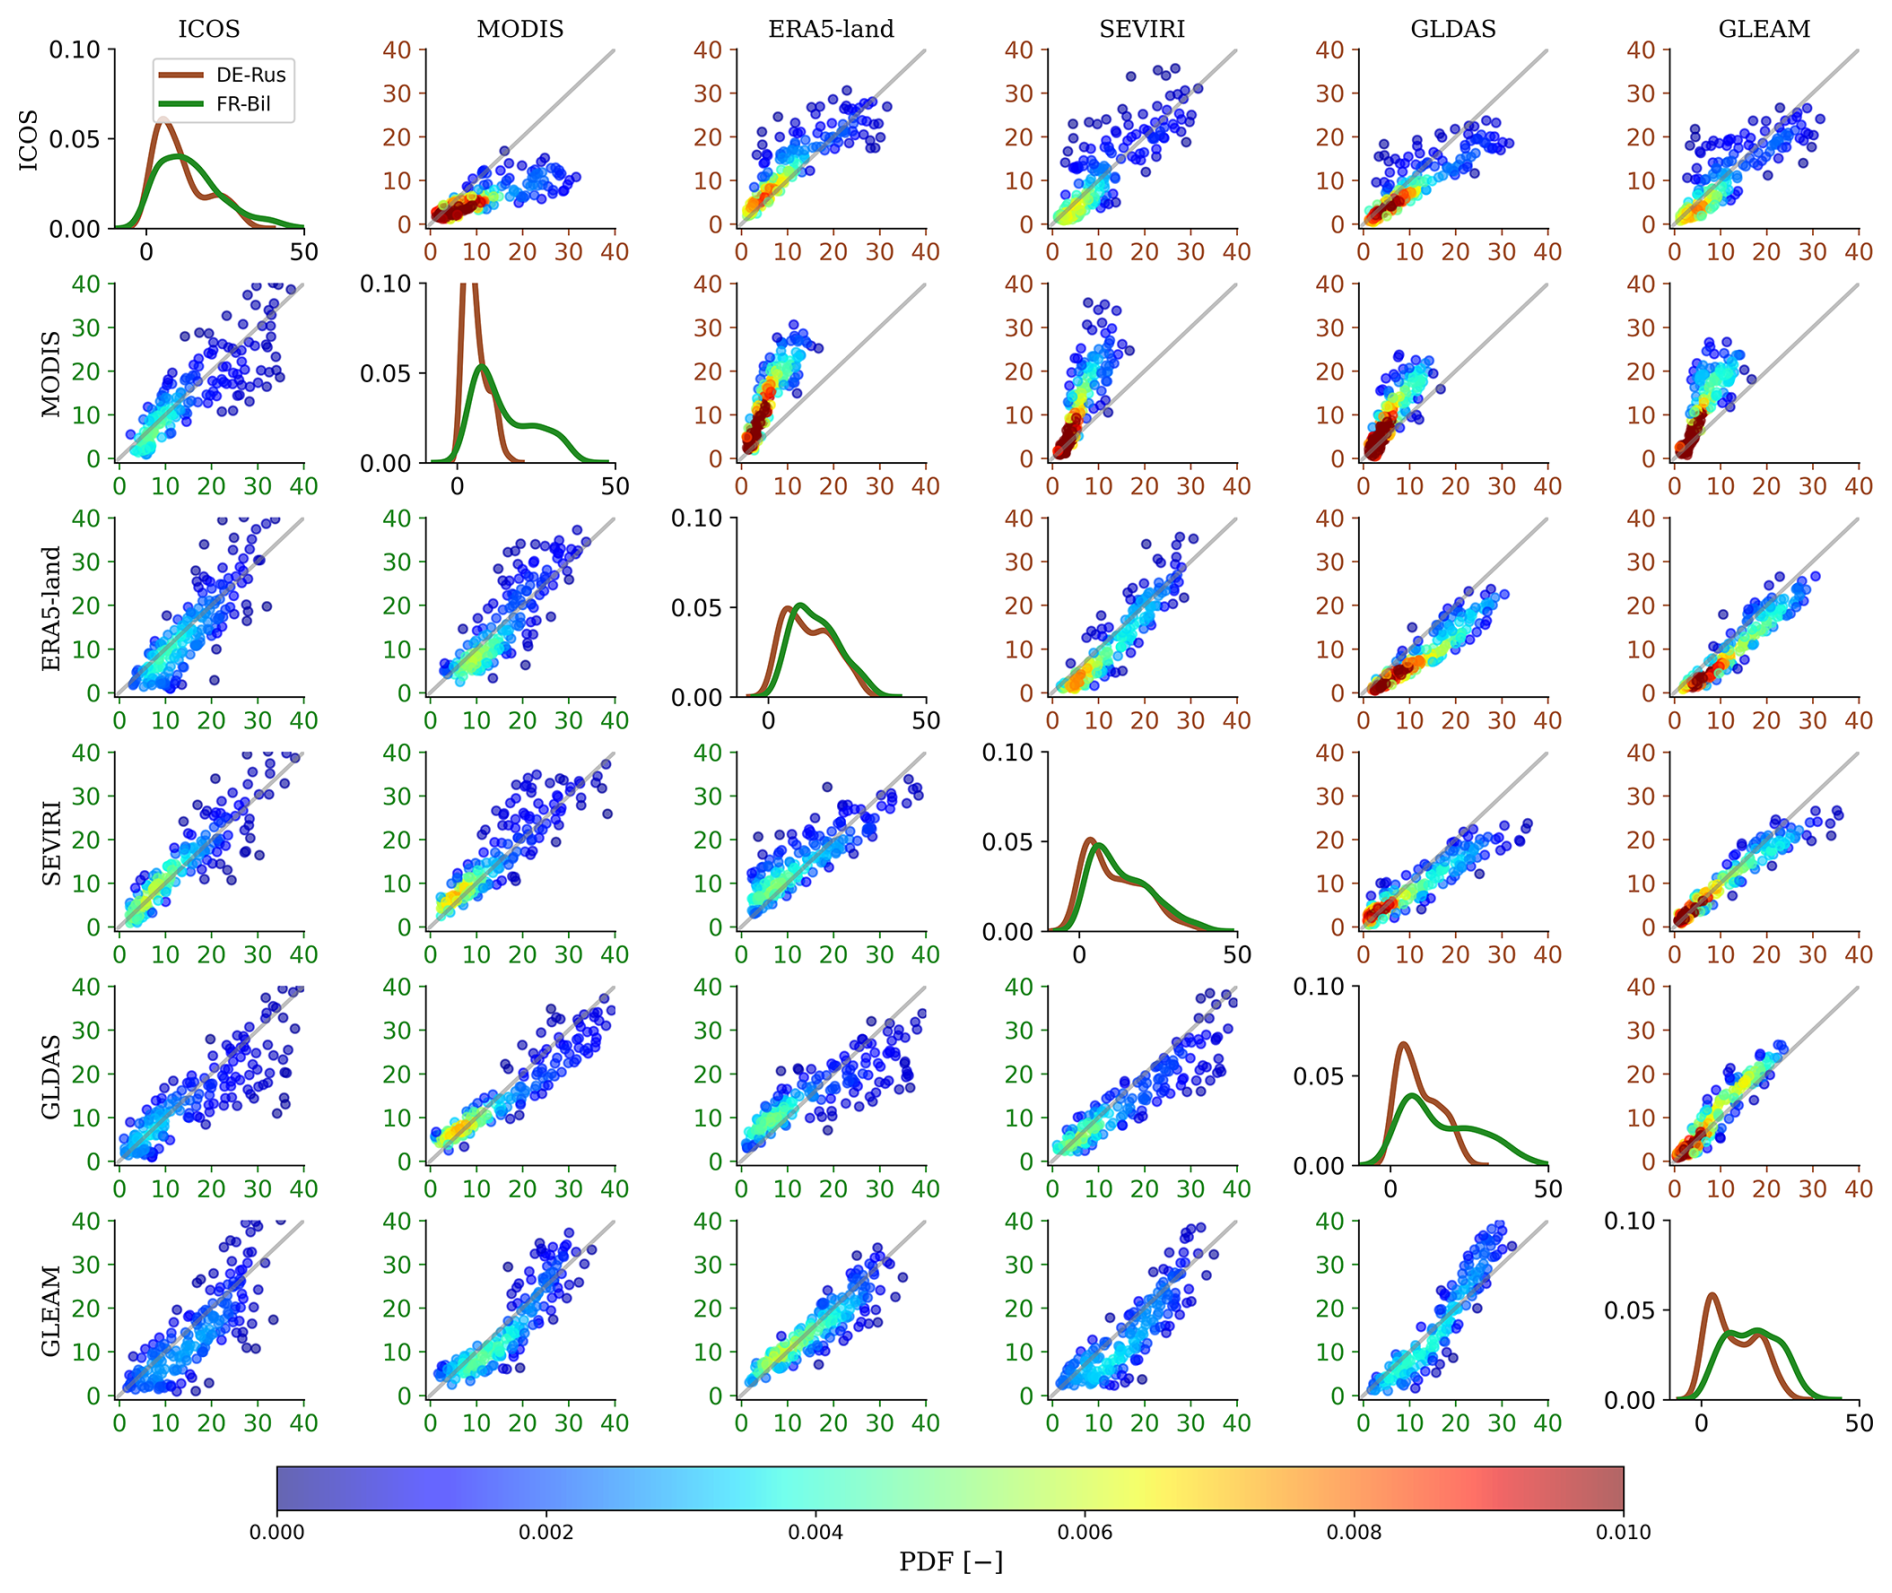
Figure 5Comparison of seasonal dynamics of ET [mm (8 d)−1] products for the period of 2017–2020 at the ICOS stations DE-Rus (right panels above the diagonal of the matrix) and FR-Bil (left panels below the diagonal of the matrix). All time series were averaged to 8-daily sums at MODIS dates and were cleaned for daily and weekly dynamics using a Savitzky–Golay (Savitzky and Golay, 1964) filter with a window size of 31 d. All statistics are included in Supplement Figs. S5–7.
This visual interpretation is also supported by the statistics in Supplement Figs. S5–7. In general, the highest coefficient of determination, R2 [–], among all products can be found at the station CH-Lae, while the overall-lowest root-mean-square errors, RMSEs [mm (8 d)−1], are retrieved at both ENF stations (DE-Ruw, FI-Let). DE-Ruw is also the station with, in general, the lowest percentage bias, PBIAS [%], among all ET products. In detail, the highest R2 of 0.94 is found between GLEAM and GLDAS-2 at CH-Lae, while the lowest RMSE of 2.3 mm (8 d)−1 and the lowest PBIAS of −0.05 % are found between GLEAM and ERA5-land, again at CH-Lae. The lowest R2 of 0.62 and highest PBIAS of 91 % are found between ICOS and MODIS at the agricultural station DE-Rus, while the highest RMSE of 8.8 mm (8 d)−1 is found between MODIS and ERA5-land, again at DE-Rus. In summary, the statistics indicate overall-worse consistency among products at the rather-mixed agricultural station (DE-Rus) and better consistency at ENF stations.
In order to evaluate the performance of each ET product in more detail, the ETC method (McColl et al., 2014) is employed. Here, we use the ETC approach to compare the three remote sensing products individually, first with ERA5-land and ICOS and then with GLDAS-2 and ICOS. The preceding calculation of ECC values among all products (see Fig. S8) is conducted to ensure the independence of the products examined, which is required by ETC analysis (see Sect. 2.3.1). Overall, ECC values are always around zero or within the acceptable range of −0.5 to 0.5. Only at the station DE-HoH between GLDAS-2 and GLEAM, at CZ-Lnz between ERA5-land and GLEAM, at CH-Lae between ERA5-land and MODIS, and for all product comparisons at DE-Rus (except between ERA5-land and SEVIRI) can ECC values outside the acceptable range be found (see Fig. S8). The high ECC values at DE-HoH, CZ-Lnz, and DE-Rus between GLEAM and GLDAS-2 or ERA5-land are not surprising since the GLEAM product is based on various remote sensing and reanalysis datasets, along with GLDAS and ERA5 (see Sect. 2.2). Hence, at most stations, ET products can be regarded as statistically independent from each other. Only some potential product dependencies, especially at the agricultural station DE-Rus, should be kept in mind during the interpretation of ETC results.
In Fig. 6, the ETC statistics for the product combinations applied to all stations are shown. While the x and y axes represent the estimated root-mean-square error σε, the arcs give the correlation ρt,X. Hence, numbers (representing the eight stations) close to zero on the x and y axes and close to 1 on the arcs give the best ETC results, meaning the lowest uncertainty in the ET product (represented by colors) compared to the other two products. It can be seen that all σε values are below 1.07 mm d−1 due to the overall high consistency among ET products, with correlations between 0.39 < ρt,X < 0.99. However, products with the highest ρt,X do not necessarily have the lowest σε. Hence, the discrepancy between products varies but does not dominate differences in the sensitivity among products. The highest σε is found at the station FR-Bil for GLDAS-2 when comparing GLDAS-2 with GLEAM and ICOS. The lowest ρt,X of 0.33 is found at the station DE-Ruw for ICOS as a result of the ETC among GLDAS, MODIS, and ICOS. Despite the high ECC values at DE-Rus (see Fig. S8) and, hence, potential product dependencies, ETC results at this station are not notable, with comparable errors and correlations. Overall, ERA5-land, SEVIRI, and GLEAM perform better at all stations, with either the lowest errors or the highest correlations within their ETC triplets. In summary, compared to ERA5-land and ICOS, the remote sensing products (SEVIRI, MODIS, GLEAM) show similar uncertainties to ERA5-land, but at most stations, ERA5-land outperforms GLEAM and MODIS (see Fig. 6, upper row). Further, compared to GLDAS-2 and ICOS, the remote sensing products in most cases outperform GLDAS-2 and ICOS, showing the lowest uncertainties, i.e., lower errors and higher correlations (see Fig. 6, lower row). During all analyses, ICOS generally shows the highest uncertainties. A potential explanation is the discrepancy in spatial resolutions (see Table 1), which will be discussed in more detail in Sect. 4.
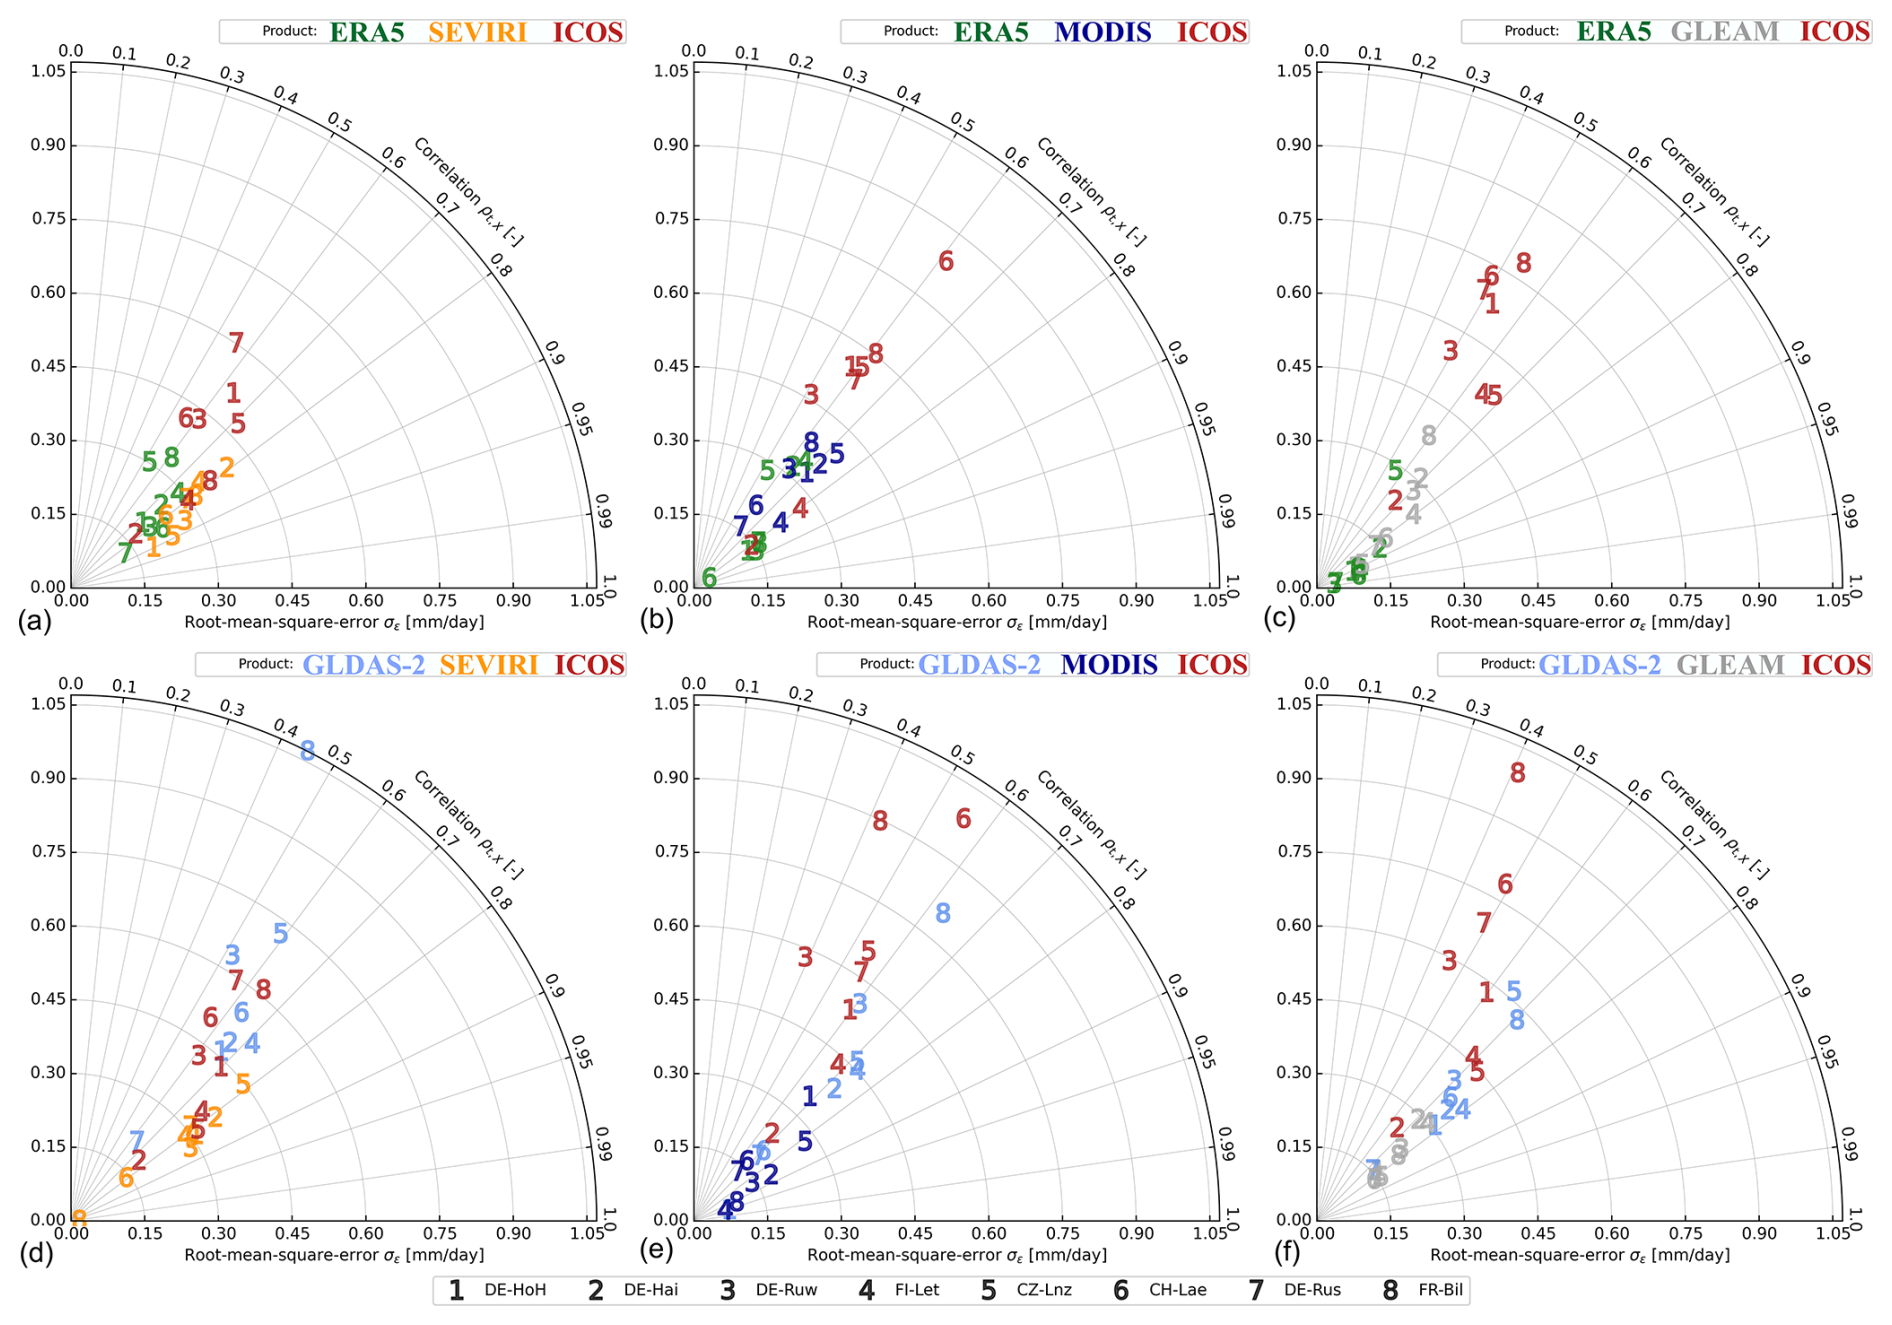
Figure 6Estimated root-mean-square-error (σε) [mm d−1] (on the x and y axes) and correlation (ρt,X) [–] (on the arcs) among ET products at all stations based on the extended triple collocation (ETC) method from McColl et al. (2014). Numbers represent the eight stations and colors the different ET products. ETC between the (a) SEVIRI, (b) MODIS, or (c) GLEAM datasets and ERA5-land and ICOS. ETC between the (d) SEVIRI, (e) MODIS, or (f) GLEAM datasets and GLDAS-2 and ICOS.
3.2 Drought impacts on ET products
As shown in Figs. 3 and S1, 2018 was an exceptional dry year across central Europe. In this section, the impact of the drought in 2018 on ET is investigated by comparing ET to SM and VPD, the two main parameters that are used for monitoring drought-related terrestrial ecosystem productivity (see Sect. 1). For that, we will always compare 2018 to the rather-wet year 2017 to identify significant changes.
In Fig. 7, the time series of ICOS ET, SMAP SM, and in situ measured VPD for 2017 and 2018 are compared to their calculated anomalies (see Sect. 2.3.2) for the DBF (DE-HoH, DE-Hai) and ENF (DE-Ruw, FI-Let) stations. While ET and VPD show distinct seasonal patterns at all stations, with the highest values during summer months, SM shows a less clear seasonal pattern with more inter- and intra-annual variations. At both the DBF stations and the ENF station DE-Ruw, the highest SM values are generally found during the winter months. In contrast, at the ENF station FI-Let, an almost constantly increasing SM in 2017 can be observed, with a distinct drop from in January 2018 and a subsequent distinct increase in April 2018. The SM also stays at high values throughout the entire summer until mid-October 2018, aside from a smaller decrease from end the of May until August. However, these SM values may be an artifact of snow cover or frozen ground at the northernmost station and should be treated carefully, although the MT-DCA is quality controlled and filtered for that (see Sect. 2.2).
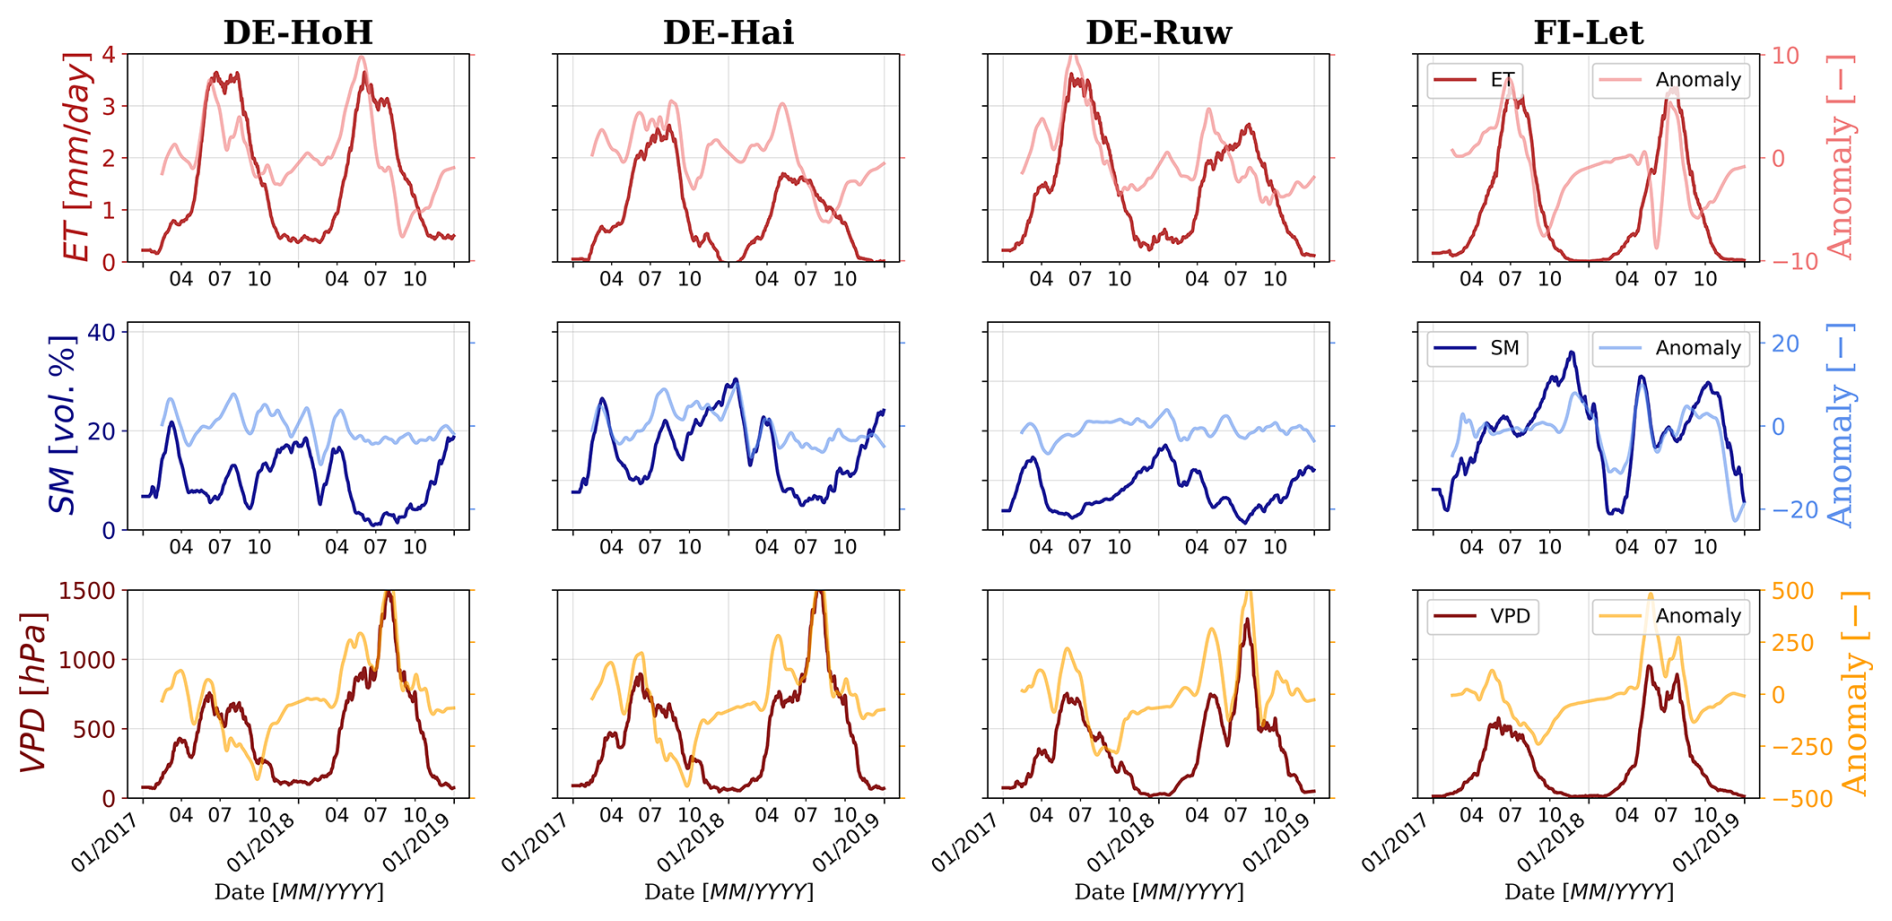
Figure 7Time series of daily ICOS ET [mm d−1], SMAP SM [vol %], and in situ VPD [hPa] for 2017 and 2018 at the DBF (DE-HoH, DE-Hai) and ENF (DE-Ruw, FI-Let) stations compared to their respective anomalies (see Sect. 2.3.2). All time series were cleaned for daily and weekly dynamics using a Savitzky–Golay (Savitzky and Golay, 1964) filter with a window size of 31 d.
From these time series, in general, lower ET and higher VPD values can be found in 2018 compared to in 2017, reflecting the drought conditions with higher atmospheric aridity and decreased water supply for plant transpiration and soil evaporation in 2018. At the MF (CZ-Lnz, CH-Lae) and agricultural (DE-Rus, FR-Bil) stations, the same trends can be observed but with minor differences in VPD maxima between 2017 and 2018 and sometimes higher ET peaks in 2018 at the stations CZ-Lnz and FR-Bil (see Fig. S9). The overall-lowest SM values can also be found in 2018, except at the station FI-Let. At the DBF stations and the station DE-Ruw, consistently low SM values over several months from mid-April to mid-October are shown without any significant increase during this time in 2018 (see Fig. 7). The same is true at the MF station CH-Lae and at the agricultural stations. At the station CZ-Lnz, SM varies monthly at low values between ∼ 5 vol % and 18.6 vol % (see Fig. S9). When analyzing the anomaly time series (seasonal detrending; see Sect. 2.3.2) of each parameter and station, in general, higher ET and VPD anomalies and lower SM anomalies are found in 2018 compared to in 2017, except at the station FI-Let, with higher SM anomalies in 2018 compared to in 2017 (see Figs. 7 and S9).
These anomalies are subsequently used in Fig. 8 to visualize the kernel densities of SM, VPD, and ET anomalies of all stations for 2017 and 2018. In Fig. 8, only the vegetation periods from April to October within each year are analyzed. It can be seen that in 2018 (drought year), the SM and ET anomalies peak at lower, negative values compared to in 2017, where they peak around zero, while the VPD anomalies peak at higher, positive values compared to in 2017. Also, the respective anomaly medians are lower for SM and ET and higher for VPD in 2018. The calculated p values that are always ≤ 0.045 prove the shift in yearly median values at the 5 % significance level.
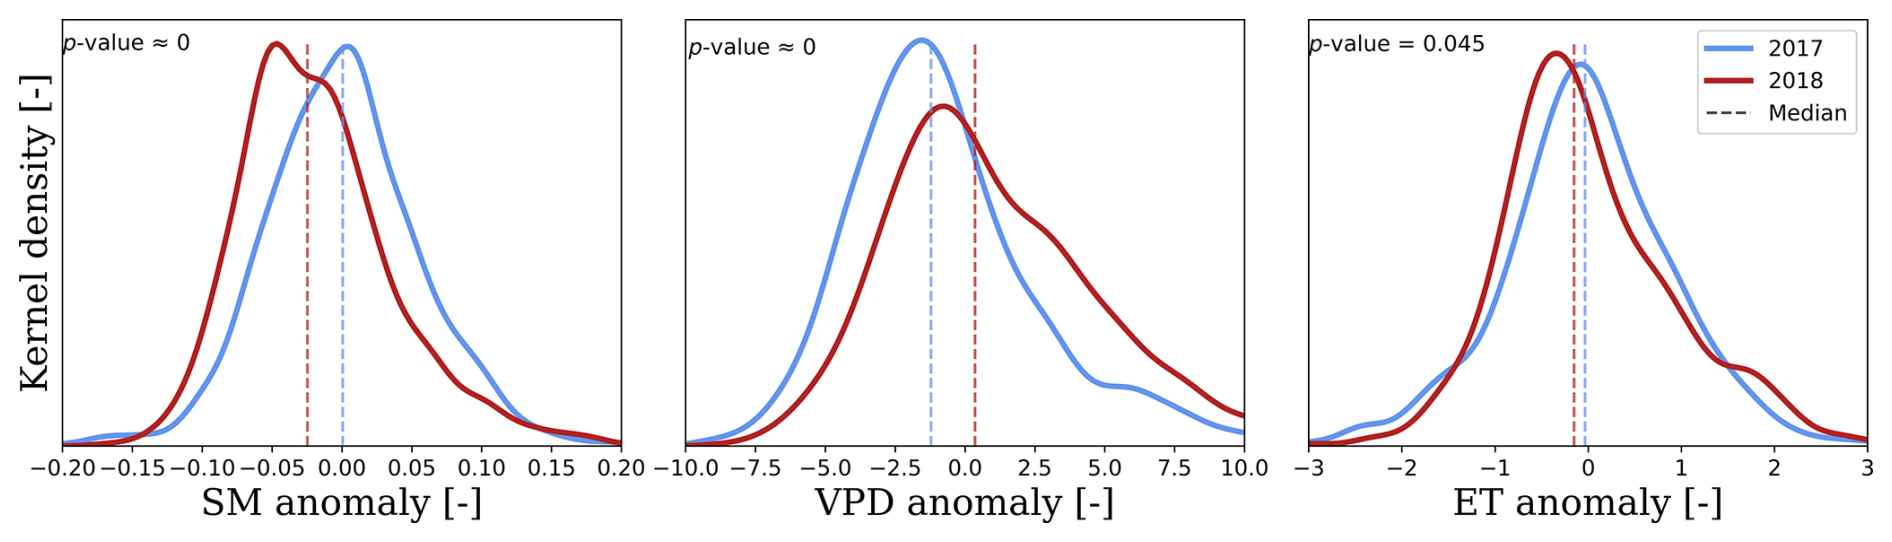
Figure 8Kernel density estimates of daily SMAP SM, in situ VPD, and ICOS ET anomalies (see Sect. 2.3.2) from April to October of 2017 and 2018 across all stations investigated. The dashed lines represent the seasonal medians of the respective parameters and years. The p values of a two-sided Wilcoxon rank sum test indicate the acceptance (> 0.05) or rejection (< 0.05) of the null hypothesis regarding continuous distributions with equal medians at the 5 % significance level.
When comparing the anomalies for different ET products (see Fig. 9), a similar shift towards lower values for 2018 compared to 2017 can be found for the MODIS and ERA5-land products. For SEVIRI, GLDAS-2, and GLEAM, a shift towards higher anomalies in 2018 is found, with medians at slightly higher values compared to in 2017. However, while the ICOS p value of 0.045 is close to the 5 % significance level of equal medians, the values for SEVIRI, GLDAS-2, and GLEAM are more significant around zero. GLEAM anomalies peak at the same value for both years but with higher positive anomalies for 2018 at values greater than 0.6. In general, Gaussian distributions around zero are evident for both years and for all anomalies of ET products. Only in MODIS can a clear bimodal distribution in ET anomalies in 2018, with a first peak around −0.4 and a subsequent second, smaller peak at 0.55, be found. This is also the ET product with the smallest anomaly range, from −1.5 to 2.5. All other ET products vary at least between −3 and 3. For the ET products ERA5-land, GLDAS-2, and GLEAM, a nonlinear decrease in 2018 can be found with almost stagnating anomalies around 1. For the ICOS and SEVIRI data, this trend is first visible at values greater than 1. In contrast, the density curves of ET anomalies for 2017 are smoother for all products, showing a clear Gaussian distribution. Again, the calculated p values of ≤ 0.02 prove the shift in yearly median values at the 5 % significance level, except for the MODIS product (p value < 0.1). The MODIS product is also the ET product with the lowest temporal resolution, 8 d (see Table 1). When analyzing all other ET products at the same 8-daily resolution (see Fig. S10), similar bimodal distributions in 2018 can be found for ERA5-land, SEVIRI, and GLEAM. GLDAS-2 even shows a trimodal distribution, with the highest density of ET anomalies around −4.5, a second peak around 1.4, and a third peak around 6.3. Although no clear bimodal distribution can be seen for ICOS even at an 8-daily resolution, the distribution smoothly increases from −15 to −4 and then nonlinearly decreases, with at least three smaller plateaus (see Fig. S10). Even in 2017, the Gaussian distributions are not as smooth as they are for the daily analyses. More detailed analyses revealed that there is a distinct drop in the 8-daily anomaly time series, leading to this bimodal distribution. In April and August, mostly positive ET anomalies are found, while during September and October mostly negative anomalies are found. The same trend is, of course, also visible for the daily time series, but due to the preserved daily and intra-weekly dynamics, the difference between positive and negative anomalies during both periods (April–August and September–October) is not that distinct. These small-scale dynamics are excluded in the 8-daily analyses. However, the differences in ET anomalies between 2017 and 2018 are greater for the 8-daily anomaly analyses (see Fig. S10) compared to the daily anomaly analyses (see Fig. 9), indicating that drought impacts on ET are more pronounced at longer timescales (more than a week, monthly) than at shorter timescales (less than a week, daily). In summary, the reason for the bimodal distribution in ET anomalies within the MODIS products is the lower temporal resolution.
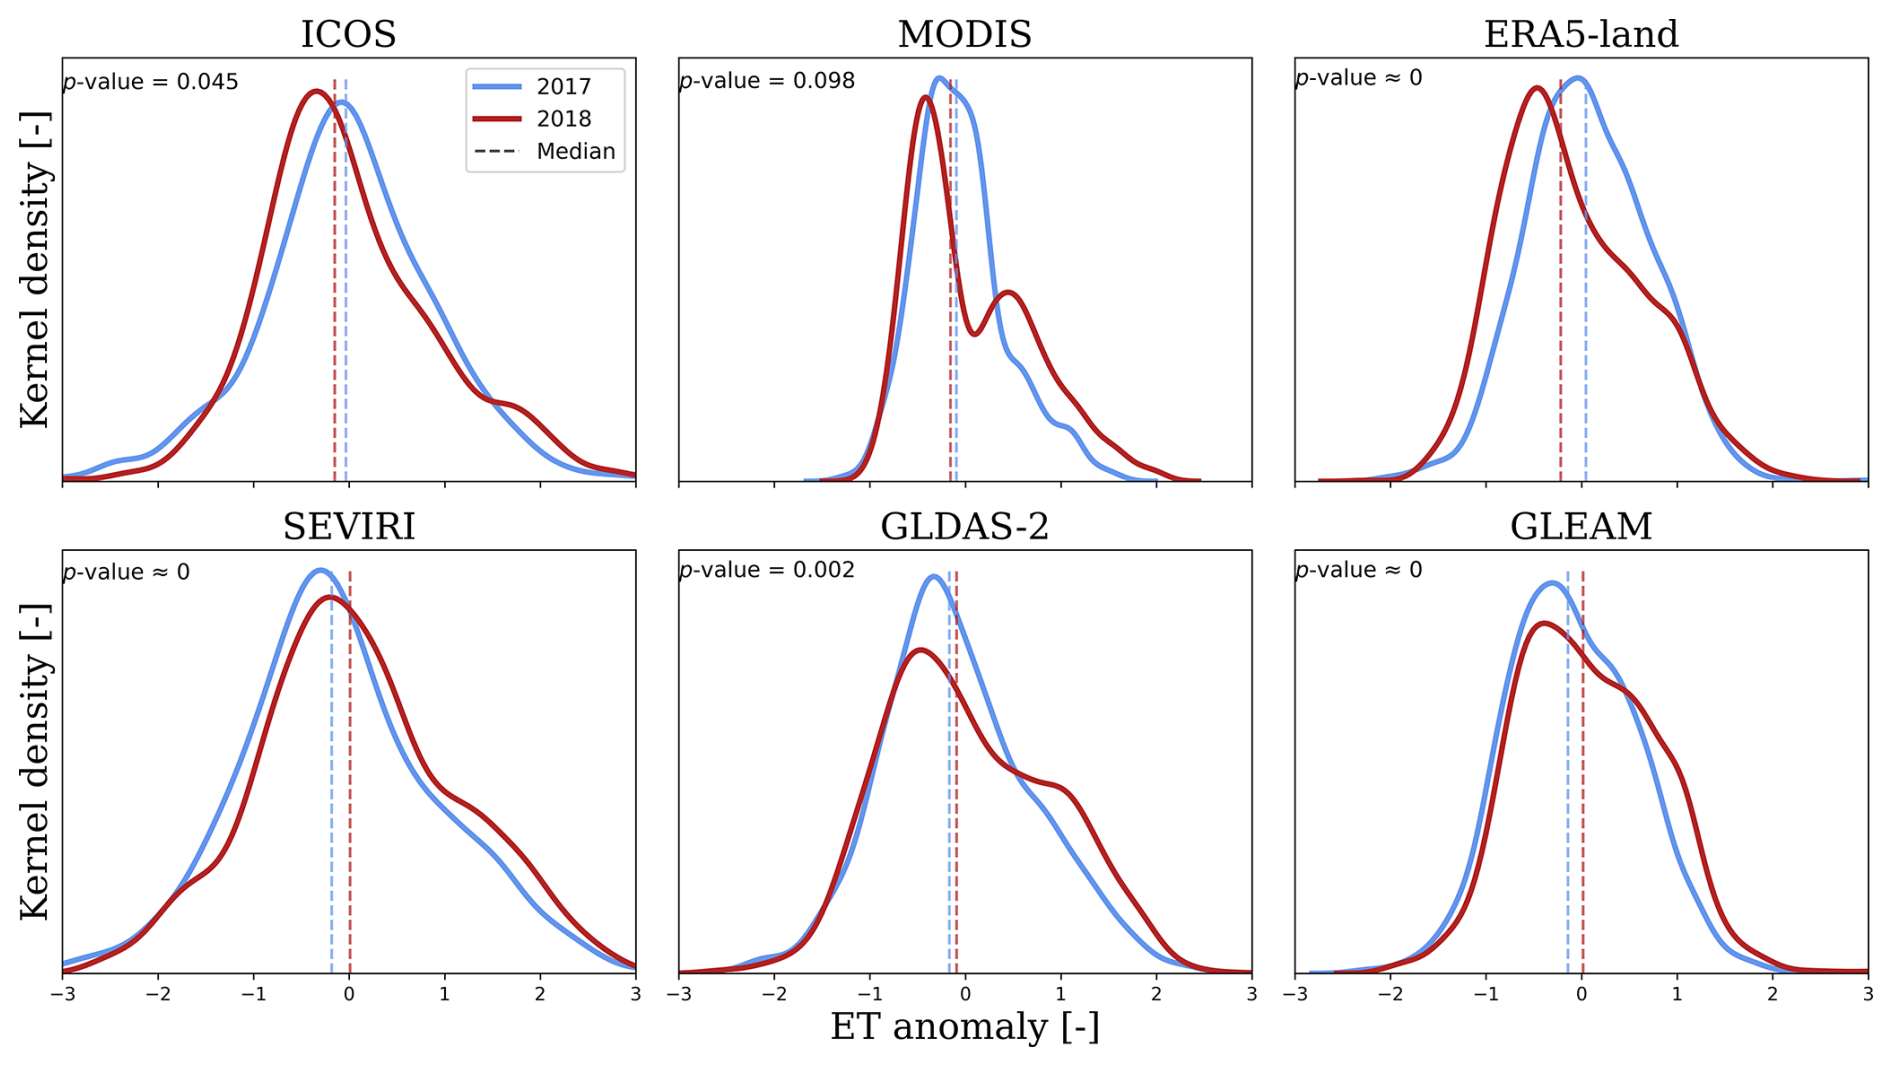
Figure 9Kernel density estimates of daily ET anomalies (see Sect. 2.3.2) for all ET products investigated from April to October of 2017 and 2018 across all stations investigated. The dashed lines represent the seasonal medians of the respective parameters and years. The p values of a two-sided Wilcoxon rank sum test indicate the acceptance (> 0.05) or rejection (< 0.05) of the null hypothesis regarding continuous distributions with equal medians at the 5 % significance level.
To analyze the dependencies between ET, SM and VPD, the respective ET products in SMAP SM and in situ measured VPD bins (see Sect. 2.3.3) are visualized for the wet year 2017 (see Fig. 10) and the dry year 2018 (see Fig. 11) across all stations. ET for all stations and both years is similarly distributed across the SM- and VPD-phase space.
For the rather-wet year 2017, a general decreasing trend in ET values along increasing VPD and increasing SM can be found for all ET products except SEVIRI. Here, a decreasing trend along increasing VPD but decreasing SM is visible, as indicated by the arrow within the inset plot (see Fig. 10). Overall, ET varies more with VPD than with SM. Only ET from ICOS and, to some extent, ERA5-land and GLEAM has the highest values at intermediate VPD and SM and has lower ET at low SM. In particular, the ET products SEVIRI and GLDAS-2 do not display any reductions at low SM.
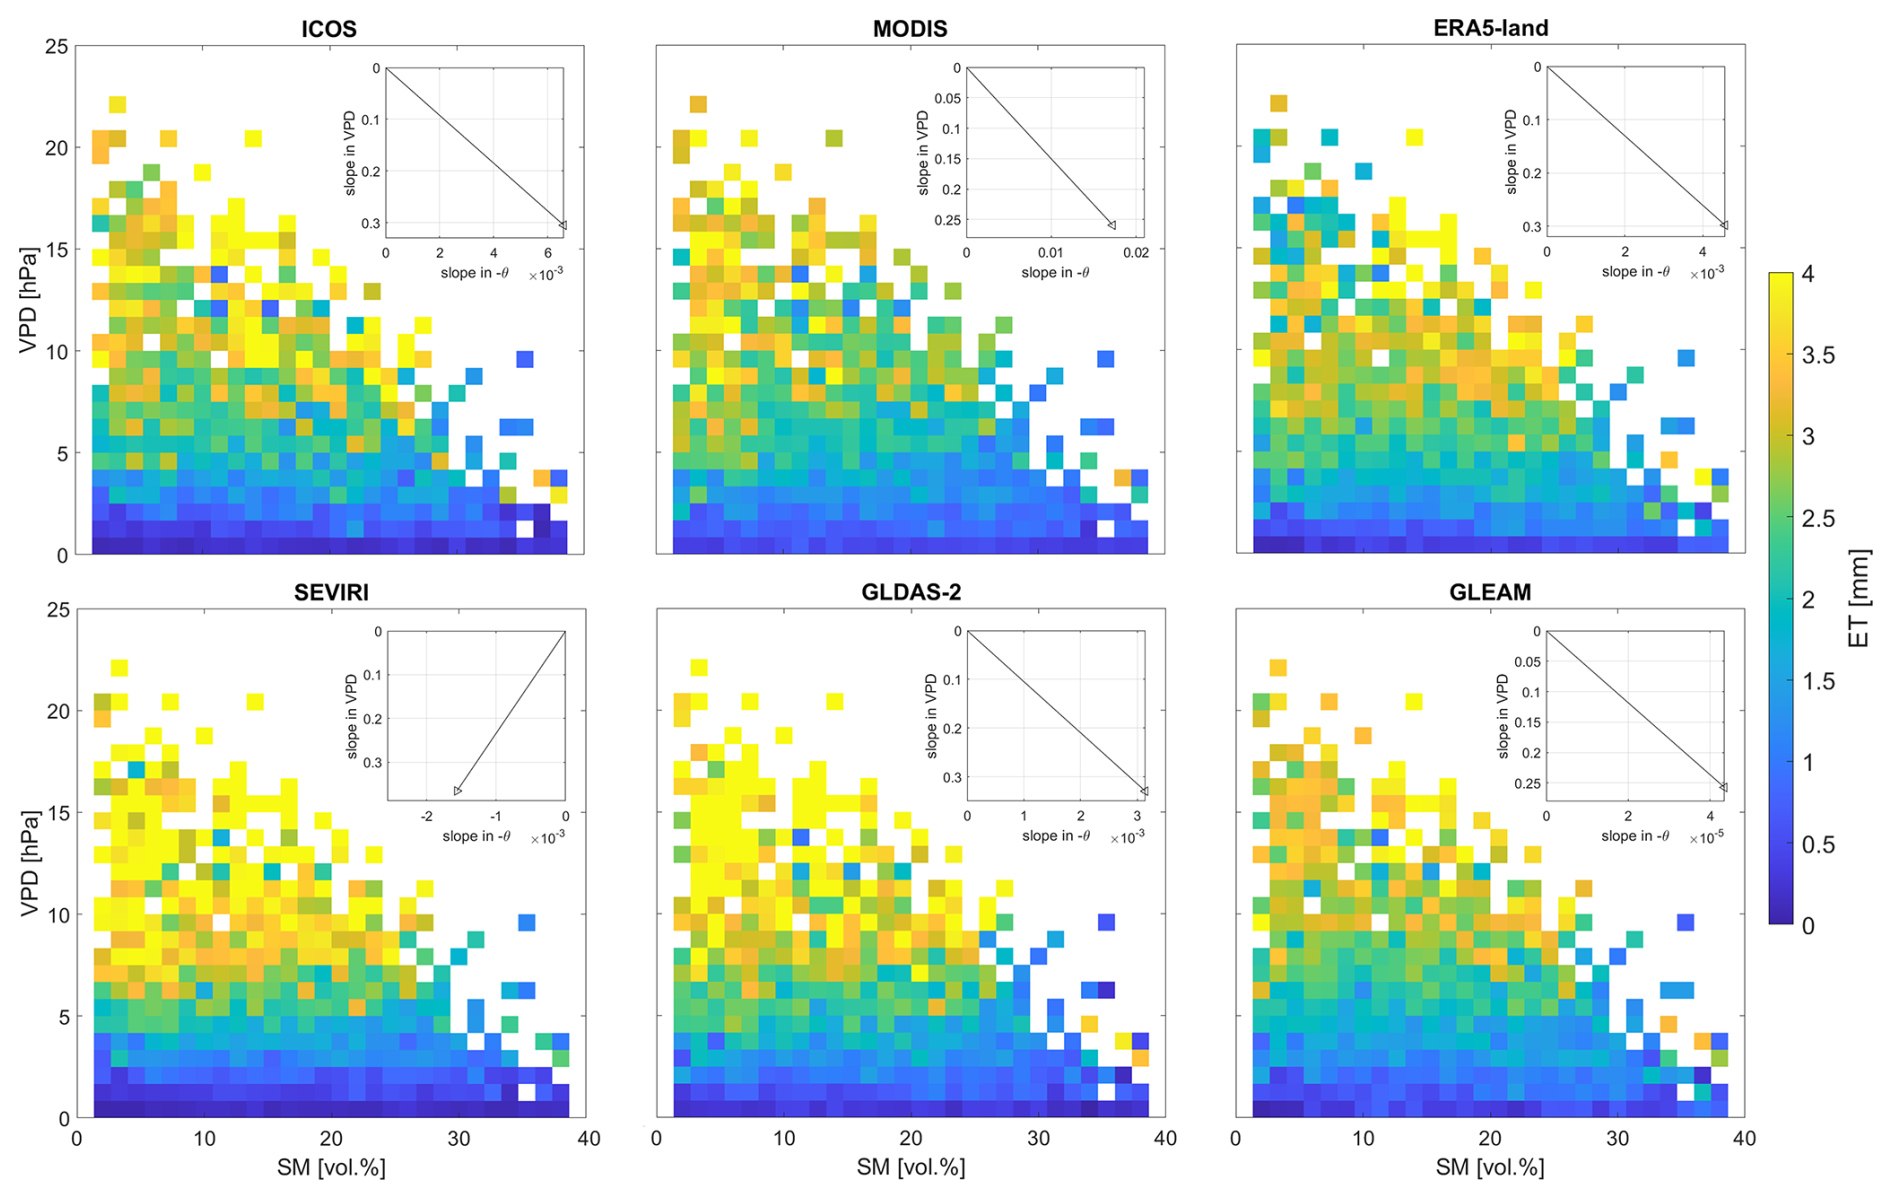
Figure 10ET [mm] relative to SMAP SM [vol %] and in situ VPD [hPa] for all ET products investigated, averaged over all ICOS stations investigated in 2017. The inset plots provide the corresponding median slopes in SM and VPD changes.
For the dry year 2018, only MODIS and GLDAS-2 still show a decreasing trend along increasing VPD for increasing SM. All other products indicate decreasing ET for increasing VPD and decreasing SM (see Fig. 11). For SEVIRI, the slope in the SM direction is twice as low in 2018 compared to in 2017, but it is almost the same for VPD, meaning a greater decrease in ET along with SM during the dry year. A similar trend is observable for MODIS, with half of the slope along SM in 2018 compared to in 2017, meaning that the increase in ET values with SM is half as strong during the drought-affected year 2018. Lastly, for GLDAS-2, the slope along SM bins is increased by a factor of almost 7 in addition to a reduced VPD slope of ∼ 0.1 hPa in 2018, meaning that a stronger increase in ET values at increasing SM at simultaneously decreases VPD during the drought year. Further, ET values are in general lower in 2018 compared to in 2017, but in 2018, bins at higher VPD values with low ET can be found across the entire SM range (see Fig. 11).
In summary, for both years, ET is generally higher at high VPD, i.e., higher atmospheric water demand, and much lower below a VPD of 5 hPa. In Figs. 10 and 11, we do not really see very clear reductions in ET with decreasing SM. Hence, ET varies more with VPD than with SM. The influence of SM on ET is only noticeable when comparing the wet (2017) and dry (2018) years with each other, as the change along SM ( is significantly higher during the drought-affected year.
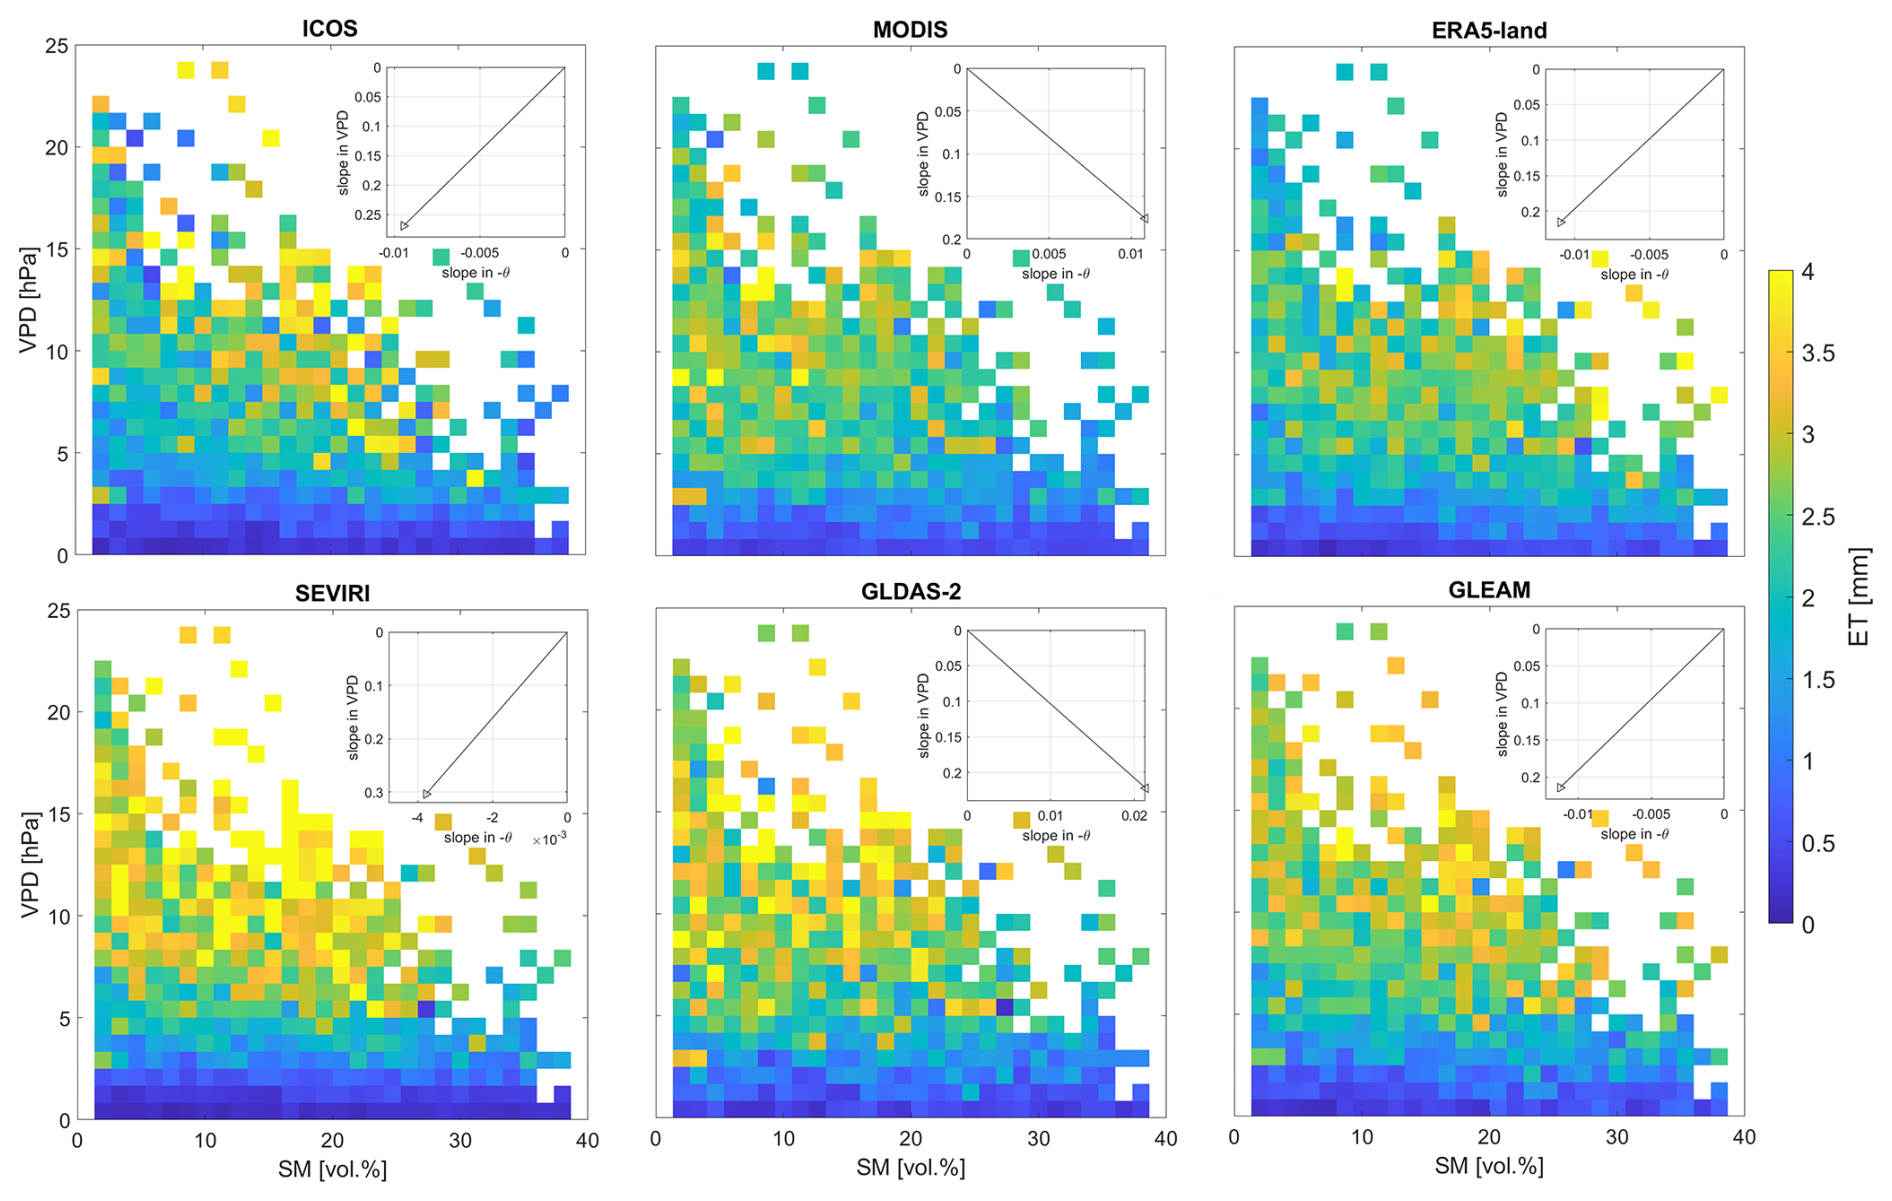
Figure 11ET [mm] relative to SMAP SM [vol %] and in situ VPD [hPa] for all ET products investigated, averaged over all ICOS stations investigated in 2018. The inset plots provide the corresponding median slopes in SM and VPD changes.
For more detailed analyses regarding the drought effect on ET products, we calculated the coefficient of variation (CV) [%] for 2017 and 2018 (see Fig. 12) for each ET bin relative to the SM and VPD ranges (see Sect. 2.3.3.). CV is defined as the ratio between the standard deviation and the mean and provides the relative dispersion or amount of uncertainty in the data. As can be seen, the differences in CV between 2017 and 2018 are highest for low SM. Here, the variability in ET values during the drought year of 2018 reaches higher VPD values compared to in 2017. Furthermore, overall-higher CVs are estimated for low VPD across the entire SM range in 2018 compared to in 2017. In contrast, 2017 shows slightly higher CV values for intermediate values (SM between 10 vol % and 30 vol % and VPD between 4 and 8 hPa). When comparing the different ET products among each other, the CVs show similar patterns overall. However, for both years, the CV median for ICOS (49.23 %, 48.43 %) is always the highest compared to all other products, indicating a greater dispersion of data points within the ET time series. The lowest median CVs are found within ERA5-land, at 33.28 % in 2017 and 36.48 % in 2018 (see Fig. 12), indicating the overall-lowest amount of uncertainty in ET data.
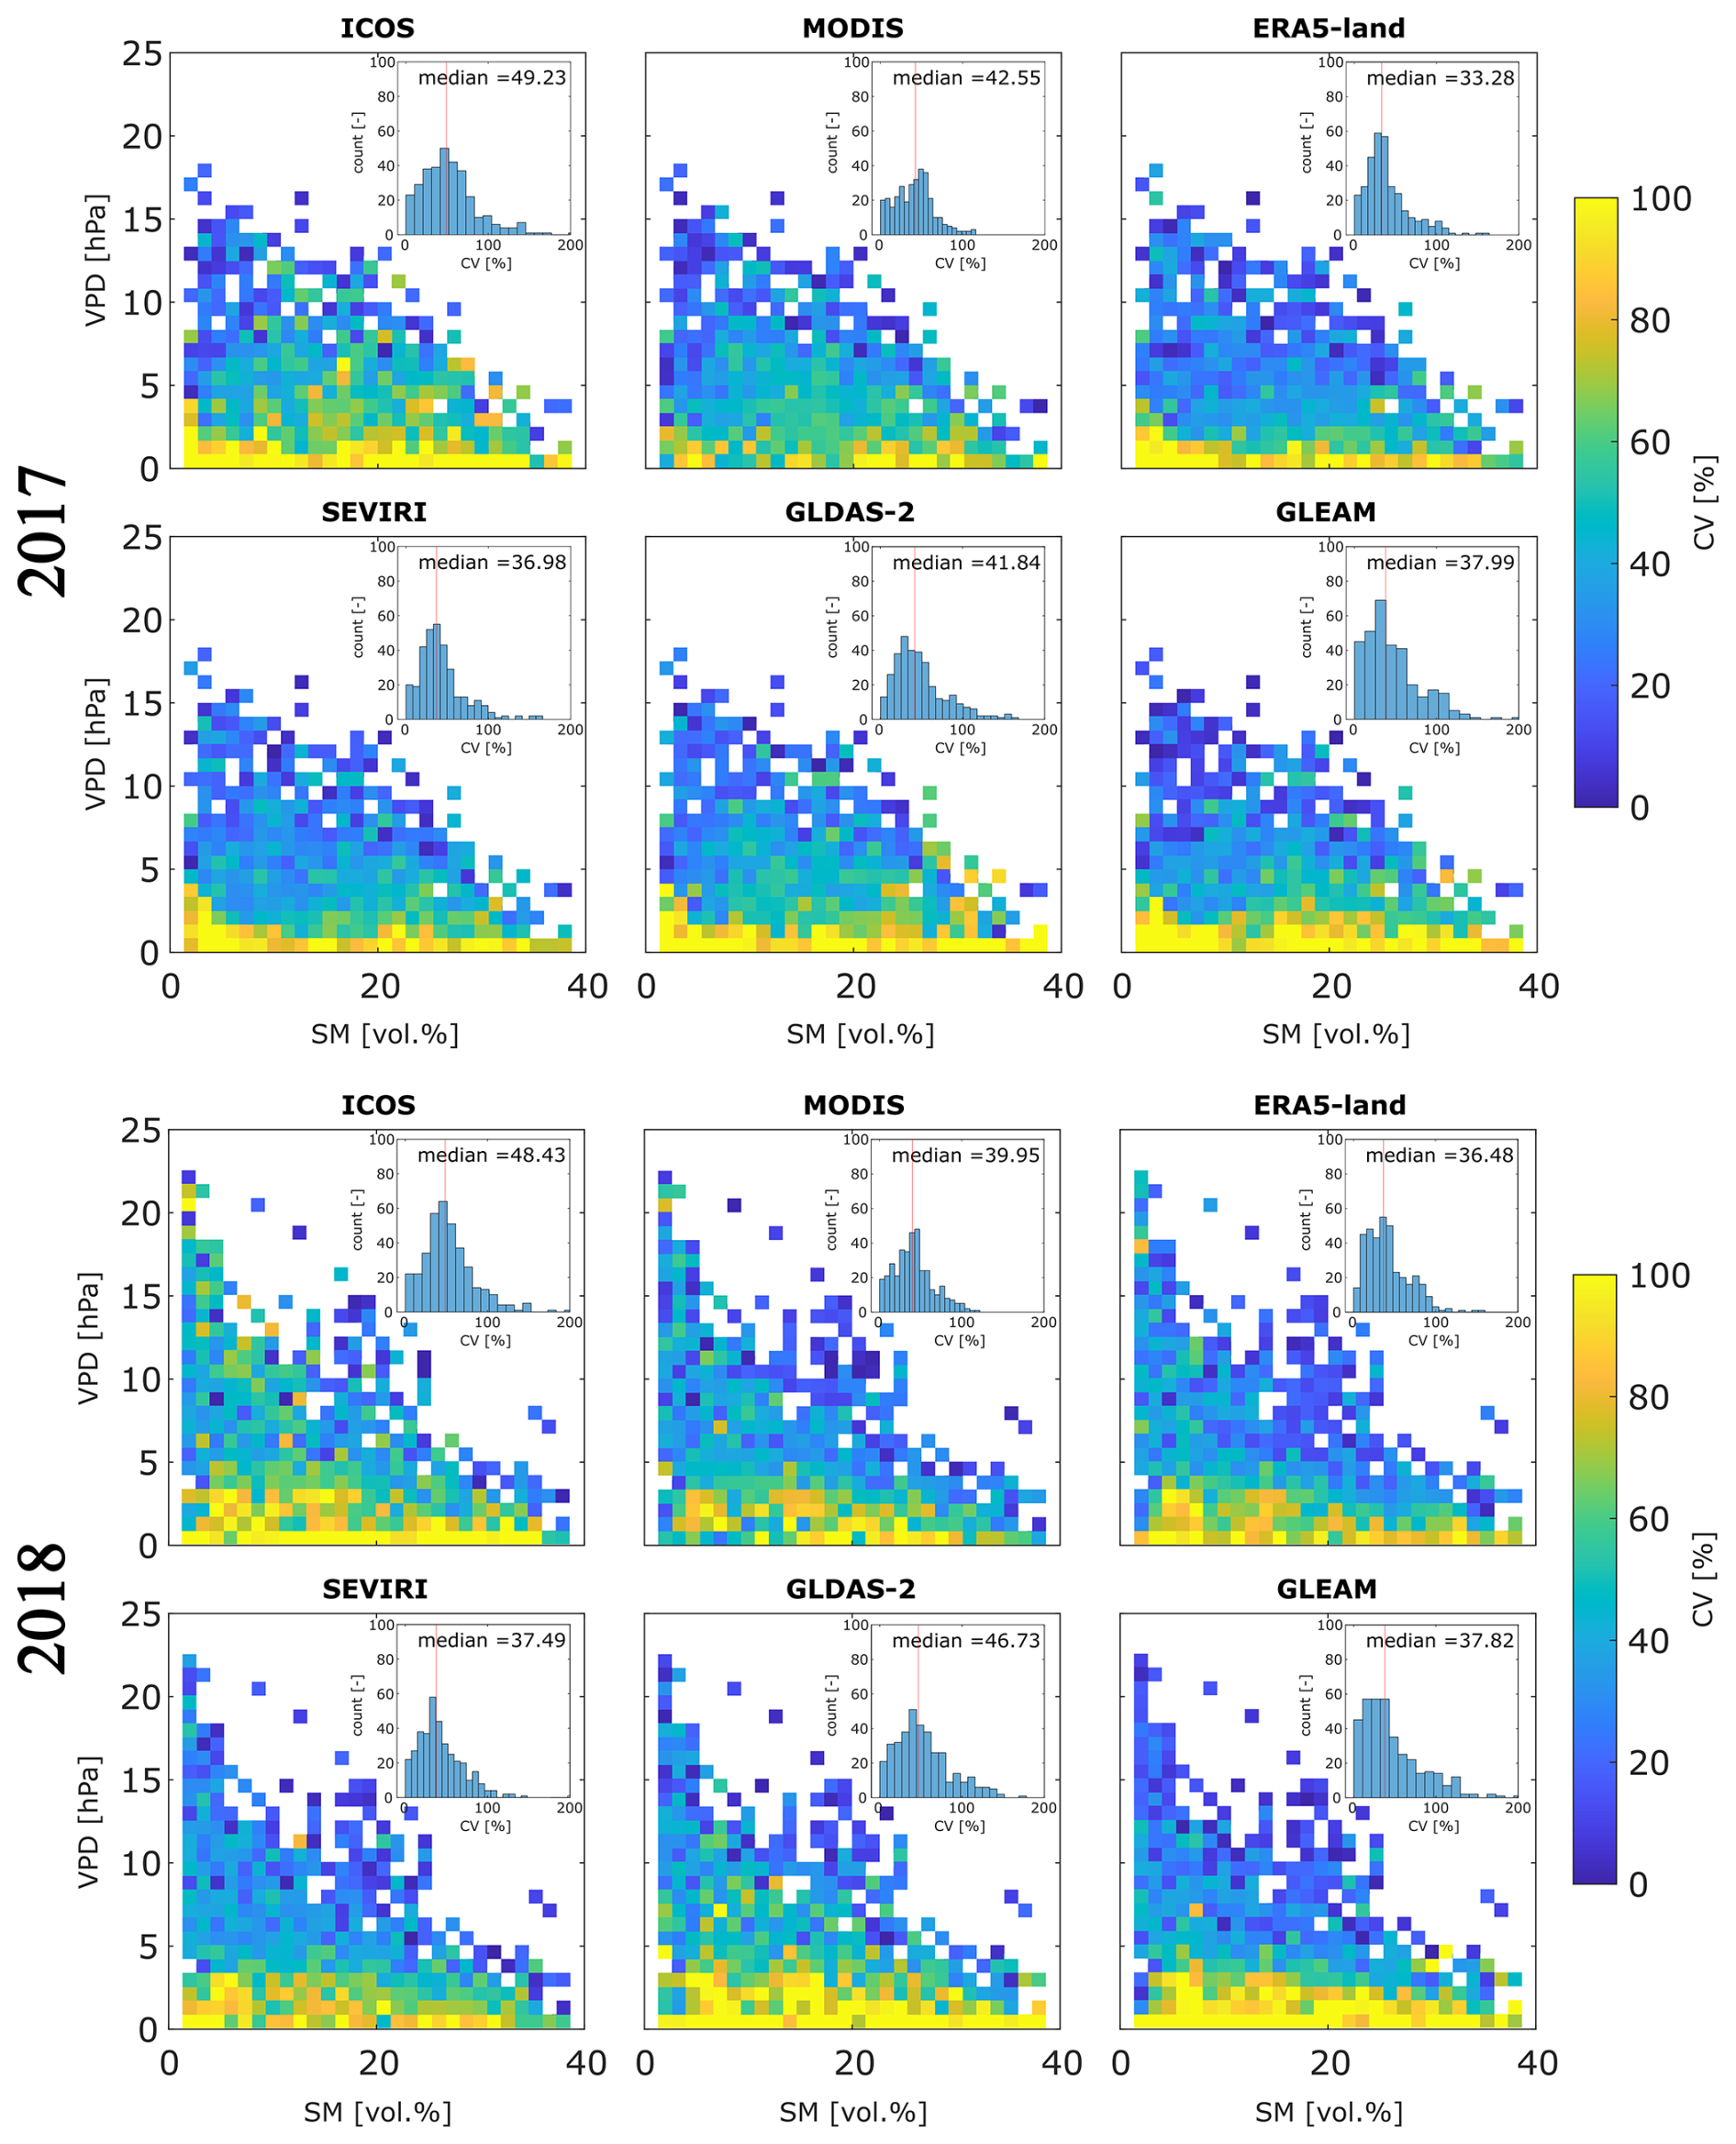
Figure 12Coefficient of variation (CV) [%] of ET values relative to SMAP SM [vol %] and in situ VPD [hPa] for all ET products investigated, averaged over all ICOS stations investigated in 2017 (upper two rows) and 2018 (lower two rows). Inset plots give the histograms of the displayed CV values, with the red line indicating the location of the given median for each product.
4.1 Differences in ET products examined
When evaluating the performance of all ET products from remote sensing, reanalysis, modeling, and ground-based eddy covariance measurements, analyses of their time series revealed that the ICOS ET almost always shows a time lag of a few weeks during the spring ET rise compared to all other products (see Fig. 4). This could be explained by the discrepancy in spatial resolutions, with the ICOS product providing local point-scale measurements compared to the other larger-scale remote sensing and modeling ET products. This spatial mismatch alters the vegetation impact within the ET signal. Another reason is the dependence of models on indicators for phenological changes in vegetation. For example, many models use the leaf-area index (LAI) to track phenology dynamics, which influence ET simulations (Adeluyi et al., 2021). Further, the overall-lowest ET values were found for all products at the agricultural station DE-Rus, while the highest values were found at the southernmost station FR-Bil, where the highest average precipitation was recorded between 2017 and 2020 (see Fig. 3). The reasons for that are (1) reduced transpiration at agricultural sites throughout the year compared to at the forested sites and (2) the humid Atlantic climate at the southernmost station at the lowest altitude (see Table S1). Further, the mostly non-irrigated arable land at the station DE-Rus (see Fig. 2) shows relatively low vegetation cover (LAI < 2; normalized difference vegetation index (NDVI) around 0.5 during summer months (not shown)) compared to at the forested sites (LAI > 5, NDVI around 0.8 during summer months (not shown)), which can lead to an underestimation of ET when using models that rely on vegetation indices (i.e., NDVI, LAI). Combined with the seasonal vegetation dynamics of this station and the lack of irrigation, this explains the lower ET values compared to in forested areas with more consistent canopy cover. The 8 d analyses showed that MODIS gives higher values compared to all other ET products at two stations, while ICOS is higher than all other ET products at one station. Further, the highest density of values was found between 0 and 10 mm (8 d)−1 due to the seasonal imprint of reduced ET across Europe during months with reduced solar radiation and vegetation cover (November–March). Only at the two coniferous forest stations (DE-Ruw, FR-Bil) was the highest density of values between 0 and 20 mm (8 d)−1, with lower ET values only during winter months (December–February). However, this does not apply to the third coniferous station, FI-Let, the northernmost station with less dense forests and more snowfall between November and March, which influences the estimation of ET. Hence, the lack of leaf-off conditions and the reduced number of days with snow cover influence the amount of ET. The statistics conducted confirmed the noticeable differences among ET products and ICOS stations, which indicated overall-lower agreement among products at the rather-mixed agricultural station (DE-Rus) and better consistency at the ENF stations (DE-Ruw, FI-Let). Hence, products differ most at stations with complex land cover conditions, where varying crops and growing seasons (changing phenology) make the estimation of ET more difficult, while evergreen needle-leaf stations with fewer changes throughout the year and between years are easier to define (temporal homogeneity).
For more detailed product performance analyses, the extended triple collocation (ETC) method (McColl et al., 2014) and SM–VPD binning revealed the highest uncertainties (see Fig. 6) and coefficients of variation (see Fig. 12) for the ICOS product and the lowest uncertainties for SEVIRI, GLEAM, and ERA5-land. The highest ETC error was estimated for GLDAS-2 when analyzed together with GLEAM and ICOS, while the lowest sensitivity (correlation) was found for ICOS when analyzed together with GLDAS-2 and MODIS (see Sect. 4.1). Hence, the remote sensing products (SEVIRI, GLEAM) and the reanalysis product (ERA5-land) differed most from the in situ field-scale (ICOS) and modeling (GLDAS-2) products. One reason for the mismatch between the ICOS product and SEVIRI, GLEAM, and ERA5-land is surely the spatial mismatch between the point-scale ground-based EC tower measurements and the remote sensing (3 km) or reanalysis (9 km) products. However, in order to capture vegetation stress, ecosystem health, and fine-scale variability in ET globally, adequate spatial (and temporal) resolutions are necessary. Here, detailed research regarding downscaling techniques (as reviewed in, e.g., Mahour et al., 2017, and Peng et al., 2017) that combine medium-scale ET data with fine-scale auxiliaries in order to improve the spatial resolution are needed to understand its uncertainties and impact on product comparisons. Further, ET measurements based on the eddy covariance method tend to underestimate sensible heat (H) and latent heat (LE) fluxes (Petropoulos et al., 2015), are often too short temporally and too sparse spatially to sample drought conditions correctly (Zhao et al., 2022), and suffer from challenges closing the energy balance (Yu et al., 2023). Several studies (Twine et al., 2000; Petropoulos et al., 2015; Barrios et al., 2024) reported an error range in EC measurements of ∼ 10 %–30 % due to, e.g., a “systematic closure problem in the surface energy budget” (Twine et al., 2000). In order to identify potential product dependencies that may impact the ETC results, the estimated error cross-correlations (ECCs) were calculated, with high ECCs between GLDAS-2 and GLEAM (at DE-HoH), between ERA5-land and GLEAM (at CZ-Lnz), and between all products and GLEAM (at DE-Rus). These need to be accounted for when analyzing the differences among ET products. Although in this study we have analyzed different land cover classes within a 3 km footprint around every ICOS station at a daily resolution to account for the different resolutions, the SEVIRI product provides ET data every 30 min at a moderate spatial resolution (3 km) and showed the ability to capture ET dynamics at small as well as larger temporal scales comparably to or even better than the other products examined, as also reported by previous studies (e.g., Hu et al., 2015; Petropoulos et al., 2015; De Santis et al., 2022). None of the other products examined can provide similar spatiotemporal coverage due to either lower temporal resolution (MODIS) or coarser spatial resolution (ERA5-land, GLDAS-2, GLEAM). Only the ICOS data provide a similar temporal resolution to SEVIRI but at the point scale, which disqualify it for global analyses. Although other ET products from remote sensing and modeling exist (e.g., Jiménez et al., 2011; Mueller et al., 2013; Fisher et al., 2020; De Santis et al., 2022; Yu et al., 2023), the ET products examined in this study are appropriate when addressing global analyses since other products have at least one of the following: a coarser spatial or temporal resolution (Yu et al., 2023); a limitation to only clear-sky conditions (De Santis et al., 2022), which prohibits continuous time series of ET measurements; or higher-order derivatives from either field-measured or merged remote-sensing-based products (Jung et al., 2019; Chen et al., 2021). We also analyzed data from the ECOsystem Spaceborne Thermal Radiometer Experiment on Space Station (ECOSTRESS) launched by NASA in June 2018 (Fisher et al., 2020) at the beginning of our analyses. However, we found several problems with this product and worse performance compared to other ET products, meaning a clear overestimation using the ECO3ETPTJPL product, as has also been reported by previous studies (e.g., Liu et al., 2021; De Santis et al., 2022; Wu et al., 2022). In our research with ECOSTRESS, data were unavailable at CZ-Lnz and FI-Let. Another ECOSTRESS ET product, ECO3ETALEX (based on the DisALEXI model), has shown better performance, but it is more suited for agricultural applications and is limited to the United States (Cawse-Nicholson and Anderson, 2021). ECOSTRESS level 3 ET data come with the advantage of a high spatial resolution (70 m), but their temporal resolution is irregular due to the International Space Station (ISS) orbit, and the dependence on the product type and study region limited our preliminary analyses. For these reasons, we decided not to include it in our research.
4.2 Impact of droughts on ET products
Since remote-sensing-based ET products are not purely observational, the performance of an ET product is highly dependent on the retrieval model employed for ET estimation. This, in turn, is dependent on how the model deals with limitations in SM or VPD and the responses under drought conditions. Every retrieval method has its own strengths and weaknesses, but especially under drought conditions, the ability of the employed algorithm to deal with water shortage and vegetation stress is essential for valid ET estimation. Varying types of vegetation have different strategies to deal with water stress, e.g., by closing stomata to prevent water loss through leaves and by increasing the water uptake from the soil or from deeper soil depths by increasing the water resistance (He et al., 2022). Many studies reported decreasing ET during droughts due to reduced SM supply and, hence, decreasing evaporation, but they also reported decreasing transpiration since plants close their stomata to prevent water loss (Novick et al., 2016; Zhao et al., 2022). However, during drought conditions with increasing air temperatures, ET can also increase due to the higher atmospheric moisture demand (increasing VPD). Further, the generic statement that ET decreases due to decreasing SM often ignores the fact that plants have access to SM from greater soil depths, which are not immediately affected by meteorological droughts, or have different strategies for drought resistance (Gupta et al., 2020; He et al., 2022; Feldman et al., 2024). Hence, the dynamics of ET under drought conditions remain highly variable (Zhao et al., 2022). Novick et al. (2016) pointed out that SM and VPD may become more decoupled in the future, and models need to resolve limitations in SM and VPD independently from each other in order to correctly capture the response of ecosystems to water stress (Novick et al., 2016; Zhao et al., 2022). How models react to limitations in SM and VPD varies significantly, which impacts the resulting ET. Analyses performed in this study revealed that during the rather-wet year 2017, ET varied more with VPD than with SM, with almost no dependency of ET on SM in the SEVIRI and GLDAS-2 products. Here, our results indicate that ET is controlled more by atmospheric demand instead of water supply from the atmosphere (precipitation) and soil (soil moisture), as reported also by Zhou et al. (2019). However, it has been suggested by previous work and by the Budyko framework (Budyko and Miller, 1974) that ET should exhibit some level of dependence on SM (Porporato et al., 2002; Zhang et al., 2021). One reason could be that forests at the ICOS stations selected might have substantial access to deeper SM (root zone) that exceeds the measurement depths of the SMAP satellite (the first 25 cm) (Feldman et al., 2022). When analyzing the controls of SM and VPD on ET during the dry year 2018, however, all ET products except MODIS and GLDAS-2 showed that ET decreases with increasing VPD and decreasing SM. For SEVIRI, a decrease in ET by a factor of 2 along with SM during the drought year was observed compared to ET in the rather-wet year. This declining trend in ET during dry years, when ET is limited by moisture and VPD increases due to increasing air temperatures, is in line with previous studies (Jung et al., 2010; Seneviratne et al., 2010; Zhou et al., 2019). Further, results show that VPD and SM are negatively coupled during extreme events, as reported also by Zhou et al. (2019) and De Santis et al. (2022). However, MODIS and GLDAS-2 products showed an increase in ET with increasing SM and with decreasing VPD during 2018 (see Fig. 11). These are the two products that are based on the Penman—Monteith equation (see Table 1) and that were outperformed by SEVIRI, ERA5-land, and GLEAM in the ETC analyses (see Fig. 6). For MODIS, one reason for the worse performance was found to be the coarse temporal resolution of 8 d since at this timescale the temporal variability in ET is significantly different, lacking all diurnal and day-to-day ET dynamics. The underperformance of MODIS compared to in situ EC measurements was also reported by De Santis et al. (2022), who found that MODIS overestimated in situ ET measurements at stations in Italy, as well as Yu et al. (2023), who investigated several stations with different types of land cover and varying climatic zones across the USA. They concluded that daily or monthly ET products performed best compared to EC tower measurements (Yu et al., 2023). Due to the temporal resolution, MODIS is the only product showing a bimodal distribution of ET anomalies with a p value above the 5 % significance level (see Fig. 9). In this study, we were able to show that differences in ET anomalies between 2017 and 2018 are greater for the 8-daily anomaly analyses (see Fig. S10) compared to the daily anomaly analyses (see Fig. 9), indicating that drought impacts on ET are more pronounced at longer timescales (more than a week, monthly) than on shorter timescales (daily, less than a week). Hence, the temporal scale of ET analyses is crucial for the selection of the temporal component of the ET dynamics that should be considered for each respective application.
Further, although GLEAM is built on the Priestly–Taylor equation, which is less parameterized compared to the Penman–Monteith equation since it does not consider the effects of VPD or canopy conductance on soil water stress, the GLEAM ET product delivered better ETC results and statistics in this study. Comparable or even better performance of the Priestley–Taylor equation compared to the Penman–Monteith equation has also been reported in previous studies (e.g., Akumaga and Alderman, 2019; Bottazzi et al., 2021). Reasons could be the uncertainties in input variables within the Penman–Monteith equation (e.g., for stomatal, canopy, or aerodynamic resistances, which are often unknown, approximated (Widmoser, 2009), or parameterized based on the wrong variable (Hu et al., 2015)); could be due to the overestimation of specific parameters, such as the net radiation; or could be caused by other aerodynamic factors reported by Hao et al. (2018). Similar, Hu et al. (2015) stated that MODIS tends to overestimate water stress during the thawing of frozen soil in spring or over irrigated land, which leads to an underestimation of soil evaporation. Moreover, several studies pointed out that the Penman–Monteith equation needs to be adapted for climate/weather extremes and vegetation-limited cases (e.g., Widmoser, 2009; Hao et al., 2018; McColl, 2020).
The estimated coefficient of variation (CV) showed that during the drought year 2018, ET values display the highest uncertainty for low SM or low VPD, while during the rather-wet year 2017, the highest variability was found for intermediate SM and VPD values. Hence, our results show that during drought conditions, the estimation of ET leads to highest uncertainties and is most difficult for low SM and low VPD depending on the assumptions for controlling factors on ET. For example, within the Penman–Monteith equation, aerodynamic as well as stomatal resistances are considered, but since they can vary significantly for drought and non-drought conditions, erroneous assumptions for them can lead to significant errors. During normal or wet conditions, as shown for 2017, CV results do not vary that much between the ET products investigated but indicate the highest variability for intermediate values of SM and VPD for all products, which originate most probably from the different vegetation and ecosystem types. Here, more research on individual ecosystem types is required to further address ET controls, as vegetation is the controlling factor of ET estimates when SM and VPD are not limited (Brown et al., 2010; Jin et al., 2017).
In summary, it is important for ET retrieval algorithms to account for water droughts and vegetation stress, as is done with adaptable stomatal closure and canopy resistance within the Penman–Monteith equation. However, analyses showed that false assumptions related to these physiological stress indicators can decrease the performance, and this equation's performance can be exceeded by less parameterized and simpler retrieval algorithms like the Priestley–Taylor equation.
In this study, eight different ET products with varying temporal and spatial resolutions as well as varying ET retrieval methods (see Table 1) are analyzed across central Europe for the period of 2017–2020. Despite the spatial mismatch (in situ versus remote sensing) and the spatial heterogeneity of the landscapes analyzed (see Fig. 2), all products showed a concurrent seasonal pattern and overall-low uncertainties during ETC analyses. It was shown that ET varied from year to year for the different forest and agricultural stations due to changing seasonal weather and vegetation conditions over the years. Analyses revealed that temporal and spatial homogeneity helps with the consistency and interpretability of the ET estimates. This is because products were most consistent with each other at stations with less complex land cover conditions and less complex changes throughout the seasons (the evergreen needle-leaf stations DE-Ruw and FI-Let). Despite the good match in seasonal patterns, differences in ET products were noticeable. The remote sensing products, SEVIRI, MODIS, and GLEAM, performed equally well or even better than the in situ measured (ICOS), modeled (GLDAS-2), or reanalysis (ERA5-land) products for this specific study concept (3 km footprint, daily analyses). Extended triple collocation (ETC) and SM–VPD binned ET analyses revealed that SEVIRI and ERA5-land (the two products based on the (H-)TESSEL land surface scheme) perform best. They provide low uncertainties when compared with other products and reasonable SM and VPD controls on absolute ET. GLEAM also shows good performance, although this result should be taken with caution since potential product dependencies with ERA5-land and GLDAS-2 may have affected the ETC results. When analyzing the behavior of ET in the context of SM and VPD during the rather-wet year 2017 and the dry year 2018, it was found that in 2017, ET was highly dependent on VPD and less dependent on SM. Hence, with sufficient moisture supply, ET is mainly controlled by atmospheric demand and vegetation transpiration. In contrast, in 2018, the limited moisture supply because of decreasing SM and increasing VPD, which were in turn due to increasing air temperatures, led to a decline in ET, in line with previous studies. Further, during the dry year 2018, SM and VPD were more negatively coupled, which could also have had an impact on the ET decline. These behaviors were consistently found in all ET products except for GLDAS-2 and MODIS, the two products whose retrieval methods are based on the Penman–Monteith equation. Hence, although GLEAM is based on the less parameterized Priestley–Taylor equation, compared to the Penman–Monteith equation, it outperforms GLDAS-2 and MODIS within this study setup, which supports the idea of adapting the Penman–Monteith equation, as reported by previous studies (e.g., Widmoser, 2009; Hao et al., 2018; Akumaga and Alderman, 2019; McColl, 2020; Bottazzi et al., 2021).
Further, the comparison between estimated coefficients of variation (CVs) for 2017 and 2018 showed that the dispersion of data is higher during the extreme-drought year 2018 for extreme conditions, such as low SM or low VPD across all SM values. In contrast, 2017 showed higher CVs for intermediate conditions. However, the difference between the products investigated is rather minor, with median CVs between 33.28 % (ERA-land) and 49.23 % (ICOS), and should be analyzed in future studies for individual stations and ecosystem types (requiring longer time series and more stations to have enough data points for binning) to determine the impact of varying vegetation types on ET controls. In summary, when considering all analyses together (spatial and temporal resolutions, product dependencies, ETC results, SM and VPD controls on ET), the remote sensing products SEVIRI and GLEAM as well as the reanalysis product ERA5-land seem to provide the most reasonable results compared all other ET products, with SEVIRI providing a higher temporal and spatial resolution compared to those of GLEAM and ERA5-land. Hence, despite their coarse spatial resolution, GLEAM and ERA5-land are able to capture ET dynamics sufficiently even under drought conditions. Future research regarding data fusion techniques and downscaling approaches that combine coarse- or medium-scale ET data with fine-scale auxiliaries in order to improve the spatial resolution of certain ET products may help to decrease the spatial mismatch and optimize the comparison between point-scale field measurements and satellite remote sensing or modeling data.
This study served as a pathfinder, comparing freely available and commonly employed ET products at highly monitored EC towers across central Europe. Whether these reported findings hold true across space and for other drought events has to be analyzed further, with a focus on spatially larger regions and longer time series. Additionally, potential add-on studies could include the examination and comparison of ET dynamics from optical/thermal remote sensing observations with microwave remote sensing data, e.g., the Sentinel-1 backscatter, in order to evaluate the potential of active microwave remote sensing for drought monitoring (e.g., Mueller et al., 2022; Jagdhuber et al., 2023). In order to identify relevant conditions and causal strengths with lagged and contemporaneous causal dependencies between different variables, like ET, the Sentinel-1 backscatter and other important SPAS parameters, like air temperature, relative humidity, and water potential, using of emerging powerful tools for causal discovery could prove useful (Runge et al., 2019; Díaz et al., 2022). Previous studies already outlined the potential of identifying causal relations between Earth system parameters (i.e., precipitation, ET, SM, air temperature) using the wavelet coherency analysis (WCA) (Graf et al., 2014; Rahmati et al., 2020) or the PC algorithm momentary conditional independence (PCMCI) method (Runge et al., 2019, 2023).
The SMAP MT-DCA v5 soil moisture dataset is available at https://zenodo.org/records/5619583, last access: 11 May 2022 (Feldman et al., 2021). The SPEI dataset is available at https://spei.csic.es/database.html (Beguería et al., 2023), last access: 18 November 2023. The evapotranspiration products are available as follows: ICOS data are available at https://www.icos-cp.eu/ (ICOS RI et al., 2024), last access: 20 November 2023. SEVIRI data are available at https://datalsasaf.lsasvcs.ipma.pt/PRODUCTS/MSG/MDMETv3/ (LSA SAF and EUMETSAT SAF CE12 on Land Surface Analysis, 2019), last access: 21 November 2023. MODIS data are available at https://lpdaac.usgs.gov/products/mod16a2v061/ (Running et al., 2017), last access: 20 November 2023. ERA5-land data are available at https://cds.climate.copernicus.eu/datasets/reanalysis-era5-land?tab=overview (Muñoz Sabater, 2019), last access: 20 November 2023. The GLDAS-2 data are available at https://ldas.gsfc.nasa.gov/gldas/model-output (Beaudoing et al., 2020), last access: 22 November 2023. The GLEAM data are available at https://www.gleam.eu/ (Miralles et al., 2011; Martens et al., 2017), last access: 23 August 2024. The Corine land cover classes are available at https://land.copernicus.eu/en/products/corine-land-cover/clc2018?hash=4ecde146e6ca8dd7a42f68a9f5370153d9731a95 (European Environment Agency, 2019), last access: 14 March 2024.
The supplement related to this article is available online at https://doi.org/10.5194/bg-22-3721-2025-supplement.
TJ designed the study concept and assembled the research team. AF, MJB, MP, BB, MR, CM, and TJ were involved in the data acquisition and in developing the methodology. AF led the data curation and visualization of results. The original draft was written and prepared by AF and TJ. Draft editing and review were done by all authors.
The contact author has declared that none of the authors has any competing interests.
Publisher's note: Copernicus Publications remains neutral with regard to jurisdictional claims made in the text, published maps, institutional affiliations, or any other geographical representation in this paper. While Copernicus Publications makes every effort to include appropriate place names, the final responsibility lies with the authors.
The authors would like to thank the editor in chief, the associate editor, and the two anonymous reviewers for their effort and help during the review process.
David Chaparro was supported by “Fundació La Caixa” project LCF/BQ/PI23/11970013 and by the H2020 Project FORGENIUS (Improving access to FORest GENetic resources Information and services for end-USers). María Piles was supported by Conselleria de Innovación, Universidades, Ciencia y Sociedad Digital through the project AI4CS CIPROM/2021/56.
The article processing charges for this open-access publication were covered by the German Aerospace Center (DLR).
This paper was edited by Ivonne Trebs and reviewed by two anonymous referees.
Adeluyi, O., Harris, A., Verrelst, J., Foster, T., and Clay, G. D.: Estimating the phenological dynamics of irrigated rice leaf area index using the combination of PROSAIL and Gaussian Process Regression, Int. J. Appl. Earth Obs., 102, 102454, https://doi.org/10.1016/j.jag.2021.102454, 2021.
Ahmed, K. R., Paul-Limoges, E., Rascher, U., and Damm, A.: A First Assessment of the 2018 European Drought Impact on Ecosystem Evapotranspiration, Remote Sens., 13, 16, https://doi.org/10.3390/rs13010016, 2020.
Akumaga, U. and Alderman, P. D.: Comparison of Penman–Monteith and Priestley-Taylor Evapotranspiration Methods for Crop Modeling in Oklahoma, Agron. J., 111, 1171–1180, https://doi.org/10.2134/agronj2018.10.0694, 2019.
Allen, R. G., Pereira, L. S., Raes, D., and Smith, M.: Crop evapotranspiration-Guidelines for computing crop water requirements-FAO Irrigation and drainage paper 56, Fao, Rome, 300, D05109, https://www.avwatermaster.org/filingdocs/195/70653/172618e_5xAGWAx8.pdf (last access: 20 November 2023), 1998.
Balsamo, G., Beljaars, A., Scipal, K., Viterbo, P., van den Hurk, B., Hirschi, M., and Betts, A. K.: A Revised Hydrology for the ECMWF Model: Verification from Field Site to Terrestrial Water Storage and Impact in the Integrated Forecast System, J. Hydrometeorol., 10, 623–643, https://doi.org/10.1175/2008JHM1068.1, 2009.
Barrios, J. M., Arboleda, A., Dutra, E., Trigo, I., and Gellens-Meulenberghs, F.: Evapotranspiration and surface energy fluxes across Europe, Africa and Eastern South America throughout the operational life of the Meteosat second generation satellite, Geosci. Data J., 11, 589–607, https://doi.org/10.1002/gdj3.235, 2024.
Bastos, A., Ciais, P., Friedlingstein, P., Sitch, S., Pongratz, J., Fan, L., Wigneron, J. P., Weber, U., Reichstein, M., Fu, Z., Anthoni, P., Arneth, A., Haverd, V., Jain, A. K., Joetzjer, E., Knauer, J., Lienert, S., Loughran, T., McGuire, P. C., Tian, H., Viovy, N., and Zaehle, S.: Direct and seasonal legacy effects of the 2018 heat wave and drought on European ecosystem productivity, Sci. Adv., 6, eaba2724, https://doi.org/10.1126/sciadv.aba2724, 2020.
Bayat, B., Camacho, F., Nickeson, J., Cosh, M., Bolten, J., Vereecken, H., and Montzka, C.: Toward operational validation systems for global satellite-based terrestrial essential climate variables, Int. J. Appl. Earth Obs., 95, 102240, https://doi.org/10.1016/j.jag.2020.102240, 2021.
Bayat, B., Montzka, C., Graf, A., Giuliani, G., Santoro, M., and Vereecken, H.: One decade (2011–2020) of European agricultural water stress monitoring by MSG-SEVIRI: workflow implementation on the Virtual Earth Laboratory (VLab) platform, Int. J. Digit., 15, 730–747, https://doi.org/10.1080/17538947.2022.2061617, 2022.
Bayat, B., Raj, R., Graf, A., Vereecken, H., and Montzka, C.: Comprehensive accuracy assessment of long-term geostationary SEVIRI-MSG evapotranspiration estimates across Europe, Remote Sens. Environ., 301, 113875, https://doi.org/10.1016/j.rse.2023.113875, 2024.
Beaudoing, H., Rodell, M., and NASA/GSFC/HSL: GLDAS Noah Land Surface Model L4 3 hourly 0.25×0.25°, Version 2.1, Greenbelt, Maryland, USA, Goddard Earth Sciences Data and Information Services Center (GES DISC) [data set], https://doi.org/10.5067/E7TYRXPJKWOQ, 2020.
Beguería, S., Vicente Serrano, S. M., Reig-Gracia, F., and Latorre Garcés, B.: SPEIbase v.2.8, DIGITAL.CSIC [data set], Version 2.8, https://doi.org/10.20350/DIGITALCSIC/15121, 2023.
Bhattacharya, B. K., Mallick, K., Desai, D., Bhat, G. S., Morrison, R., Clevery, J. R., Woodgate, W., Beringer, J., Cawse-Nicholson, K., Ma, S., Verfaillie, J., and Baldocchi, D.: A coupled ground heat flux–surface energy balance model of evaporation using thermal remote sensing observations, Biogeosciences, 19, 5521–5551, https://doi.org/10.5194/bg-19-5521-2022, 2022.
Bottazzi, M., Bancheri, M., Mobilia, M., Bertoldi, G., Longobardi, A., and Rigon, R.: Comparing Evapotranspiration Estimates from the GEOframe-Prospero Model with Penman–Monteith and Priestley-Taylor Approaches under Different Climate Conditions, Water, 13, 1221, https://doi.org/10.3390/w13091221, 2021.
Brown, S. M., Petrone, R. M., Mendoza, C., and Devito, K. J.: Surface vegetation controls on evapotranspiration from a sub-humid Western Boreal Plain wetland, Hydrol. Process., 24, 1072–1085, https://doi.org/10.1002/hyp.7569, 2010.
Budyko, M. I. and Miller, D. H.: Climate and life, Academic Press, New York, ISBN: 0-12-139450, 1974.
Carminati, A. and Javaux, M.: Soil Rather Than Xylem Vulnerability Controls Stomatal Response to Drought, Trend. Plant Sci., 25, 868–880, https://doi.org/10.1016/j.tplants.2020.04.003, 2020.
Carter, E., Hain, C., Anderson, M., and Steinschneider, S.: A Water Balance–Based, Spatiotemporal Evaluation of Terrestrial Evapotranspiration Products across the Contiguous United States, J. Hydrometeorol., 19, 891–905, https://doi.org/10.1175/JHM-D-17-0186.1, 2018.
Cawse-Nicholson, K. and Anderson, M.: ECOSTRESS Level-3 DisALEXI-JPL Evapotranspiration (ECO3ETALEXI) User Guide, https://lpdaac.usgs.gov/documents/999/ECO3ETALEXI_User_Guide_V1.pdf (last access: 18 November 2023), 2021.
Chen, X., Su, Z., Ma, Y., Trigo, I., and Gentine, P.: Remote Sensing of Global Daily Evapotranspiration based on a Surface Energy Balance Method and Reanalysis Data, JGR Atmos., 126, e2020JD032873, https://doi.org/10.1029/2020JD032873, 2021.
De Santis, D., D'Amato, C., Bartkowiak, P., Azimi, S., Castelli, M., Rigon, R., and Massari, C.: Evaluation of remotely-sensed evapotranspiration datasets at different spatial and temporal scales at forest and grassland sites in Italy, in: 2022 IEEE Workshop on Metrology for Agriculture and Forestry (MetroAgriFor), 2022 IEEE International Workshop on Metrology for Agriculture and Forestry (MetroAgriFor), Perugia, Italy, 356–361, https://doi.org/10.1109/MetroAgriFor55389.2022.9964755, 2022.
Díaz, E., Adsuara, J. E., Martínez, Á. M., Piles, M., and Camps-Valls, G.: Inferring causal relations from observational long-term carbon and water fluxes records, Sci. Rep., 12, 1610, https://doi.org/10.1038/s41598-022-05377-7, 2022.
ECMWF: IFS Documentation CY45R1 – Part IV: Physical processes, https://doi.org/10.21957/4WHWO8JW0, 2018.
EUMETSAT Satellite Application Facility on Land Surface Analysis (LSA SAF): Validation Report Evapotranspiration and Turbulent Fluxes v3, SAF/LAND/RMI/VR/ETFv3/1.0, 2024.
European Environment Agency: CORINE Land Cover 2018 (raster 100 m), Europe, 6-yearly – version 2020_20u1, May 2020 (20.01) [data set], https://doi.org/10.2909/960998C1-1870-4E82-8051-6485205EBBAC, 2019.
Feldman, A., Konings, A., Piles, M., and Entekhabi, D.: The Multi-Temporal Dual Channel Algorithm (MT-DCA), Zenodo [data set], https://doi.org/10.5281/ZENODO.5619583, 2021.
Feldman, A., Gianotti, D., Dong, J., Akbar, R., Crow, W., McColl, K., Nippert, J., Tumber-Dávila, S. J., Holbrook, N. M., Rockwell, F., Scott, R., Reichle, R., Chatterjee, A., Joiner, J., Poulter, B., and Entekhabi, D.: Satellites capture soil moisture dynamics deeper than a few centimeters and arerelevant to plant water uptake, ESS Open Archive, https://doi.org/10.1002/essoar.10511280.1, 2022.
Feldman, A. F., Feng, X., Felton, A. J., Konings, A. G., Knapp, A. K., Biederman, J. A., and Poulter, B.: Plant responses to changing rainfall frequency and intensity, Nat. Rev. Earth Environ., 5, 276–294, https://doi.org/10.1038/s43017-024-00534-0, 2024.
Fisher, J. B., Tu, K. P., and Baldocchi, D. D.: Global estimates of the land–atmosphere water flux based on monthly AVHRR and ISLSCP-II data, validated at 16 FLUXNET sites, Remote Sens. Environ., 112, 901–919, https://doi.org/10.1016/j.rse.2007.06.025, 2008.
Fisher, J. B., Lee, B., Purdy, A. J., Halverson, G. H., Dohlen, M. B., Cawse-Nicholson, K., Wang, A., Anderson, R. G., Aragon, B., Arain, M. A., Baldocchi, D. D., Baker, J. M., Barral, H., Bernacchi, C. J., Bernhofer, C., Biraud, S. C., Bohrer, G., Brunsell, N., Cappelaere, B., Castro-Contreras, S., Chun, J., Conrad, B. J., Cremonese, E., Demarty, J., Desai, A. R., De Ligne, A., Foltýnová, L., Goulden, M. L., Griffis, T. J., Grünwald, T., Johnson, M. S., Kang, M., Kelbe, D., Kowalska, N., Lim, J., Maïnassara, I., McCabe, M. F., Missik, J. E. C., Mohanty, B. P., Moore, C. E., Morillas, L., Morrison, R., Munger, J. W., Posse, G., Richardson, A. D., Russell, E. S., Ryu, Y., Sanchez-Azofeifa, A., Schmidt, M., Schwartz, E., Sharp, I., Šigut, L., Tang, Y., Hulley, G., Anderson, M., Hain, C., French, A., Wood, E., and Hook, S.: ECOSTRESS: NASA's Next Generation Mission to Measure Evapotranspiration From the International Space Station, Water Resour. Res., 56, e2019WR026058, https://doi.org/10.1029/2019WR026058, 2020.
Fu, Z., Ciais, P., Prentice, I. C., Gentine, P., Makowski, D., Bastos, A., Luo, X., Green, J. K., Stoy, P. C., Yang, H., and Hajima, T.: Atmospheric dryness reduces photosynthesis along a large range of soil water deficits, Nat. Commun., 13, 989, https://doi.org/10.1038/s41467-022-28652-7, 2022.
Ghilain, N., Arboleda, A., and Gellens-Meulenberghs, F.: Evapotranspiration modelling at large scale using near-real time MSG SEVIRI derived data, Hydrol. Earth Syst. Sci., 15, 771–786, https://doi.org/10.5194/hess-15-771-2011, 2011.
Graf, A., Bogena, H. R., Drüe, C., Hardelauf, H., Pütz, T., Heinemann, G., and Vereecken, H.: Spatiotemporal relations between water budget components and soil water content in a forested tributary catchment, Water Resour. Res., 50, 4837–4857, https://doi.org/10.1002/2013WR014516, 2014.
Gruber, A., Su, C. -H., Crow, W. T., Zwieback, S., Dorigo, W. A., and Wagner, W.: Estimating error cross-correlations in soil moisture data sets using extended collocation analysis, JGR Atmos., 121, 1208–1219, https://doi.org/10.1002/2015JD024027, 2016.
Gupta, A., Rico-Medina, A., and Caño-Delgado, A. I.: The physiology of plant responses to drought, Science, 368, 266–269, https://doi.org/10.1126/science.aaz7614, 2020.
Ha, W., Gowda, P. H., and Howell, T. A.: A review of downscaling methods for remote sensing-based irrigation management: part I, Irrig. Sci., 31, 831–850, https://doi.org/10.1007/s00271-012-0331-7, 2013.
Hao, X., Zhang, S., Li, W., Duan, W., Fang, G., Zhang, Y., and Guo, B.: The Uncertainty of Penman-Monteith Method and the Energy Balance Closure Problem, JGR Atmos., 123, 7433–7443, https://doi.org/10.1029/2018JD028371, 2018.
He, Q.-L., Xiao, J.-L., and Shi, W.-Y.: Responses of Terrestrial Evapotranspiration to Extreme Drought: A Review, Water, 14, 3847, https://doi.org/10.3390/w14233847, 2022.
Hersbach, H., Bell, B., Berrisford, P., Hirahara, S., Horányi, A., Muñoz-Sabater, J., Nicolas, J., Peubey, C., Radu, R., Schepers, D., Simmons, A., Soci, C., Abdalla, S., Abellan, X., Balsamo, G., Bechtold, P., Biavati, G., Bidlot, J., Bonavita, M., De Chiara, G., Dahlgren, P., Dee, D., Diamantakis, M., Dragani, R., Flemming, J., Forbes, R., Fuentes, M., Geer, A., Haimberger, L., Healy, S., Hogan, R. J., Hólm, E., Janisková, M., Keeley, S., Laloyaux, P., Lopez, P., Lupu, C., Radnoti, G., de Rosnay, P., Rozum, I., Vamborg, F., Villaume, S., and Thépaut, J.: The ERA5 global reanalysis, Q. J. Roy. Meteorol. Soc., 146, 1999–2049, https://doi.org/10.1002/qj.3803, 2020.
Hu, G., Jia, L., and Menenti, M.: Comparison of MOD16 and LSA-SAF MSG evapotranspiration products over Europe for 2011, Remote Sens. Environ., 156, 510–526, https://doi.org/10.1016/j.rse.2014.10.017, 2015.
Hu, T., Mallick, K., Hitzelberger, P., Didry, Y., Boulet, G., Szantoi, Z., Koetz, B., Alonso, I., Pascolini-Campbell, M., Halverson, G., Cawse-Nicholson, K., Hulley, G. C., Hook, S., Bhattarai, N., Olioso, A., Roujean, J., Gamet, P., and Su, B.: Evaluating European ECOSTRESS Hub Evapotranspiration Products Across a Range of Soil-Atmospheric Aridity and Biomes Over Europe, Water Resour. Res., 59, e2022WR034132, https://doi.org/10.1029/2022WR034132, 2023.
ICOS RI, Aalto, J., Aalto, P., Aaltonen, H., Aiguier, T., Akubia, J., Ala-Könni, J., Alivernini, A., Aluome, C., Andersson, T., Arca, A., Arriga, N., Aurela, M., BRECHET, L., Baab, F., Back, J., Baltes, U., Baneschi, I., Barten, S., Baur, T., Bauters, M., Bazot, S., Beauclair, P., Becker, N., Belelli Marchesini, L., Bergström, G., Bernhofer, C., Berveiller, D., Biermann, T., Bignotti, L., Biron, R., Bloor, J., Bodson, B., Boeckx, P., Bogaerts, G., Bonal, D., Boon, G., Bornet, F., Bortoli, M., Bosio, I., Brut, A., Brümmer, C., Buchmann, N., Bulonza, E., Burban, B., Buysse, P., Båth, A., Calandrelli, D., Calvet, J.-C., Canut-Rocafort, G., Carrara, A., Cavagna, M., Ceschia, E., Chabbi, A., Chan, T., Chebbi, W., Chianucci, F., Chipeaux, C., Chopin, H., Christen, A., Chrysoulakis, N., Claverie, N., Cobbe, I., Cohard, J.-M., Colosse, D., Conte, A., Corsanici, R., Coulaud, C., Courtois, P., Coyle, M., Cremonese, E., Crill, P., Cuntz, M., Cuocolo, D., Czerný, R., DEPUYDT, J., Daelman, R., Darenová, E., Darsonville, O., De Ligne, A., De Meulder, T., De Simon, G., Decau, M.-L., Dell'Acqua, A., Delorme, J.-P., Delpierre, N., Demoulin, L., Denou, J.-L., Di Tommasi, P., Dienstbach, L., Dignam, R., Dolfus, D., Domec, J.-C., Douxfils, B., Drösler, M., Drüe, C., Dufrêne, E., Dumont, B., Durand, B., et al.: Ecosystem final quality (L2) product in ETC-Archive format – release 2024-1 [data set], https://doi.org/10.18160/G5KZ-ZD83, 2024.
Jagdhuber, T., Fluhrer, A., Chaparro, D., Dubois, C., Hellwig, F. M., Bayat, B., Montzka, C., Baur, M. J., Ramati, M., Kübert, A., Mueller, M. M., Schellenberg, K., Boehm, M., Jonard, F., Steele-Dunne, S., Piles, M., and Entekhabi, D.: On the Potential of Active and Passive Microwave Remote Sensing for Tracking Seasonal Dynamics of Evapotranspiration, in: IGARSS 2023 – 2023 IEEE International Geoscience and Remote Sensing Symposium, IGARSS 2023 – 2023 IEEE International Geoscience and Remote Sensing Symposium, 16–21 July 2023, Pasadena, CA, USA, 2610–2613, https://doi.org/10.1109/IGARSS52108.2023.10283234, 2023.
Jiménez, C., Prigent, C., Mueller, B., Seneviratne, S. I., McCabe, M. F., Wood, E. F., Rossow, W. B., Balsamo, G., Betts, A. K., Dirmeyer, P. A., Fisher, J. B., Jung, M., Kanamitsu, M., Reichle, R. H., Reichstein, M., Rodell, M., Sheffield, J., Tu, K., and Wang, K.: Global intercomparison of 12 land surface heat flux estimates, J. Geophys. Res., 116, D02102, https://doi.org/10.1029/2010JD014545, 2011.
Jin, Z., Liang, W., Yang, Y., Zhang, W., Yan, J., Chen, X., Li, S., and Mo, X.: Separating Vegetation Greening and Climate Change Controls on Evapotranspiration trend over the Loess Plateau, Sci. Rep., 7, 8191, https://doi.org/10.1038/s41598-017-08477-x, 2017.
Jung, M., Reichstein, M., Ciais, P., Seneviratne, S. I., Sheffield, J., Goulden, M. L., Bonan, G., Cescatti, A., Chen, J., De Jeu, R., Dolman, A. J., Eugster, W., Gerten, D., Gianelle, D., Gobron, N., Heinke, J., Kimball, J., Law, B. E., Montagnani, L., Mu, Q., Mueller, B., Oleson, K., Papale, D., Richardson, A. D., Roupsard, O., Running, S., Tomelleri, E., Viovy, N., Weber, U., Williams, C., Wood, E., Zaehle, S., and Zhang, K.: Recent decline in the global land evapotranspiration trend due to limited moisture supply, Nature, 467, 951–954, https://doi.org/10.1038/nature09396, 2010.
Jung, M., Koirala, S., Weber, U., Ichii, K., Gans, F., Camps-Valls, G., Papale, D., Schwalm, C., Tramontana, G., and Reichstein, M.: The FLUXCOM ensemble of global land-atmosphere energy fluxes, Sci. Data, 6, 74, https://doi.org/10.1038/s41597-019-0076-8, 2019.
Konings, A., Piles, M., Rötzer, M., McColl, K., Chang, S. K., and Entekhabi, D.: Vegetation optical depth and scattering albedo retrieval using time series of dual-polarized L-band radiometer observations, Elsevier Remote Sensing of Environment, 172, 178–189, https://doi.org/10.1016/j.rse.2015.11.009, 2016.
Li, C., Yang, H., Yang, W., Liu, Z., Jia, Y., Li, S., and Yang, D.: Error characterization of global land evapotranspiration products: Collocation-based approach, J. Hydrol., 612, 128102, https://doi.org/10.1016/j.jhydrol.2022.128102, 2022.
Liu, H., Xin, X., Su, Z., Zeng, Y., Lian, T., Li, L., Yu, S., and Zhang, H.: Intercomparison and evaluation of ten global ET products at site and basin scales, J. Hydrol., 617, 128887, https://doi.org/10.1016/j.jhydrol.2022.128887, 2023.
Liu, L., Gudmundsson, L., Hauser, M., Qin, D., Li, S., and Seneviratne, S. I.: Soil moisture dominates dryness stress on ecosystem production globally, Nat. Commun., 11, 4892, https://doi.org/10.1038/s41467-020-18631-1, 2020.
Liu, N., Oishi, A. C., Miniat, C. F., and Bolstad, P.: An evaluation of ECOSTRESS products of a temperate montane humid forest in a complex terrain environment, Remote Sens. Environ., 265, 112662, https://doi.org/10.1016/j.rse.2021.112662, 2021.
Loustau, D., Chipeaux, C., and ICOS Ecosystem Thematic Centre: Warm winter 2020 ecosystem eddy covariance flux product from Bilos (1.0), https://doi.org/10.18160/MSRT-T1YA, 2022.
LSA SAF and EUMETSAT SAF On Land Surface Analysis: MSG Evapotranspiration Version 3 (Metv3), https://datalsasaf.lsasvcs.ipma.pt/PRODUCTS/MSG/METv3/ (last access: 21 November 2023), 2019.
Mahour, M., Tolpekin, V., Stein, A., and Sharifi, A.: A comparison of two downscaling procedures to increase the spatial resolution of mapping actual evapotranspiration, ISPRS J. Photogramm. Remote Sens., 126, 56–67, https://doi.org/10.1016/j.isprsjprs.2017.02.004, 2017.
Martens, B., Miralles, D. G., Lievens, H., van der Schalie, R., de Jeu, R. A. M., Fernández-Prieto, D., Beck, H. E., Dorigo, W. A., and Verhoest, N. E. C.: GLEAM v3: satellite-based land evaporation and root-zone soil moisture, Geosci. Model Dev., 10, 1903–1925, https://doi.org/10.5194/gmd-10-1903-2017, 2017.
McColl, K. A.: Practical and Theoretical Benefits of an Alternative to the Penman-Monteith Evapotranspiration Equation, Water Resour. Res., 56, e2020WR027106, https://doi.org/10.1029/2020WR027106, 2020.
McColl, K. A., Vogelzang, J., Konings, A. G., Entekhabi, D., Piles, M., and Stoffelen, A.: Extended triple collocation: Estimating errors and correlation coefficients with respect to an unknown target, Geophys. Res. Lett., 41, 6229–6236, https://doi.org/10.1002/2014GL061322, 2014.
Meng, X., Deng, M., Shu, L., Chen, H., Wang, S., Li, Z., Zhao, L., and Shang, L.: An evaluation of evapotranspiration products over the Tibetan Plateau, J. Hydrometeorol., 25, 1665–1677, https://doi.org/10.1175/JHM-D-23-0223.1, 2024.
Miralles, D. G., Holmes, T. R. H., De Jeu, R. A. M., Gash, J. H., Meesters, A. G. C. A., and Dolman, A. J.: Global land-surface evaporation estimated from satellite-based observations, Hydrol. Earth Syst. Sci., 15, 453–469, https://doi.org/10.5194/hess-15-453-2011, 2011.
Monteith, J. L.: Evaporation and environment, Symposia of the Society for Experimental Biology, 19, 205–234, 1965.
Mueller, B., Hirschi, M., Jimenez, C., Ciais, P., Dirmeyer, P. A., Dolman, A. J., Fisher, J. B., Jung, M., Ludwig, F., Maignan, F., Miralles, D. G., McCabe, M. F., Reichstein, M., Sheffield, J., Wang, K., Wood, E. F., Zhang, Y., and Seneviratne, S. I.: Benchmark products for land evapotranspiration: LandFlux-EVAL multi-data set synthesis, Hydrol. Earth Syst. Sci., 17, 3707–3720, https://doi.org/10.5194/hess-17-3707-2013, 2013.
Mueller, M. M., Dubois, C., Jagdhuber, T., Hellwig, F. M., Pathe, C., Schmullius, C., and Steele-Dunne, S.: Sentinel-1 Backscatter Time Series for Characterization of Evapotranspiration Dynamics over Temperate Coniferous Forests, Remote Sensing, 14, 6384, https://doi.org/10.3390/rs14246384, 2022.
Muñoz Sabater, J.: ERA5-Land hourly data from 1981 to present, Copernicus Climate Change Service (C3S) Climate Data Store (CDS), https://doi.org/10.24381/CDS.E2161BAC, 2019.
Muñoz-Sabater, J., Dutra, E., Agustí-Panareda, A., Albergel, C., Arduini, G., Balsamo, G., Boussetta, S., Choulga, M., Harrigan, S., Hersbach, H., Martens, B., Miralles, D. G., Piles, M., Rodríguez-Fernández, N. J., Zsoter, E., Buontempo, C., and Thépaut, J.-N.: ERA5-Land: a state-of-the-art global reanalysis dataset for land applications, Earth Syst. Sci. Data, 13, 4349–4383, https://doi.org/10.5194/essd-13-4349-2021, 2021.
Novick, K. A., Ficklin, D. L., Stoy, P. C., Williams, C. A., Bohrer, G., Oishi, A. C., Papuga, S. A., Blanken, P. D., Noormets, A., Sulman, B. N., Scott, R. L., Wang, L., and Phillips, R. P.: The increasing importance of atmospheric demand for ecosystem water and carbon fluxes, Nat. Clim. Change, 6, 1023–1027, https://doi.org/10.1038/nclimate3114, 2016.
Pastorello, G., Poindexter, C., Chen, J., Elbashandy, A., Humphrey, M., Isaac, P., Polidori, D., Reichstein, M., Ribeca, A., van Ingen, C., Vuichard, N., Zhang, L., Amiro, B., Ammann, C., Arain, M. A., Ardö, J., Arkebauer, T., Arndt, S. K., Arriga, N., Aubinet, M., Aurela, M., Baldocchi, D., Barr, A., Beamesderfer, E., Marchesini, L. B., Bergeron, O., Beringer, J., Bernhofer, C., Berveiller, D., Billesbach, D., Black, T. A., Blanken, P. D., Bohrer, G., Boike, J., Bolstad, P. V., Bonal, D., Bonnefond, J.-M., Bowling, D. R., Bracho, R., Brodeur, J., Brümmer, C., Buchmann, N., Burban, B., Burns, S. P., Buysse, P., Cale, P., Cavagna, M., Cellier, P., Chen, S., Chini, I., Christensen, T. R., Cleverly, J., Collalti, A., Consalvo, C., Cook, B. D., Cook, D., Coursolle, C., Cremonese, E., Curtis, P. S., D'Andrea, E., da Rocha, H., Dai, X., Davis, K. J., Cinti, B. D., Grandcourt, A. de, Ligne, A. D., De Oliveira, R. C., Delpierre, N., Desai, A. R., Di Bella, C. M., Tommasi, P. di, Dolman, H., Domingo, F., Dong, G., Dore, S., Duce, P., Dufrêne, E., Dunn, A., Dušek, J., Eamus, D., Eichelmann, U., ElKhidir, H. A. M., Eugster, W., Ewenz, C. M., Ewers, B., Famulari, D., Fares, S., Feigenwinter, I., Feitz, A., Fensholt, R., Filippa, G., Fischer, M., Frank, J., Galvagno, M., Gharun, M., Gianelle, D., Gielen, B., Gioli, B., Gitelson, A., et al.: The FLUXNET2015 dataset and the ONEFlux processing pipeline for eddy covariance data, Sci. Data, 7, 225, https://doi.org/10.1038/s41597-020-0534-3, 2020.
Peng, J., Loew, A., Merlin, O., and Verhoest, N. E. C.: A review of spatial downscaling of satellite remotely sensed soil moisture, Rev. Geophys., 55, 341–366, https://doi.org/10.1002/2016RG000543, 2017.
Penman, H. L.: Natural evaporation from open water, bare soil and grass, Proc. R. Soc. Lond. A, 193, 120–145, https://doi.org/10.1098/rspa.1948.0037, 1948.
Petropoulos, G. P., Ireland, G., Cass, A., and Srivastava, P. K.: Performance Assessment of the SEVIRI Evapotranspiration Operational Product: Results Over Diverse Mediterranean Ecosystems, IEEE Sensors J., 15, 3412–3423, https://doi.org/10.1109/JSEN.2015.2390031, 2015.
Porporato, A., D'Odorico, P., Laio, F., Ridolfi, L., and Rodriguez-Iturbe, I.: Ecohydrology of water-controlled ecosystems, Advances in Water Resources, 25, 1335–1348, https://doi.org/10.1016/S0309-1708(02)00058-1, 2002.
Priestley, C. H. B. and Taylor, R. J.: On the Assessment of Surface Heat Flux and Evaporation Using Large-Scale Parameters, Mon. Weather Rev., 100, 81–92, https://doi.org/10.1175/1520-0493(1972)100<0081:OTAOSH>2.3.CO;2, 1972.
Rahmati, M., Groh, J., Graf, A., Pütz, T., Vanderborght, J., and Vereecken, H.: On the impact of increasing drought on the relationship between soil water content and evapotranspiration of a grassland, Vadose Zone J., 19, e20029, https://doi.org/10.1002/vzj2.20029, 2020.
Rahmati, M., Graf, A., Poppe Terán, C., Amelung, W., Dorigo, W., Franssen, H.-J. H., Montzka, C., Or, D., Sprenger, M., Vanderborght, J., Verhoest, N. E. C., and Vereecken, H.: Continuous increase in evaporative demand shortened the growing season of European ecosystems in the last decade, Commun. Earth Environ., 4, 236, https://doi.org/10.1038/s43247-023-00890-7, 2023.
Rahmati, M., Amelung, W., Brogi, C., Dari, J., Flammini, A., Bogena, H., Brocca, L., Chen, H., Groh, J., Koster, R. D., McColl, K. A., Montzka, C., Moradi, S., Rahi, A., Sharghi S., F., and Vereecken, H.: Soil Moisture Memory: State-Of-The-Art and the Way Forward, Rev. Geophys., 62, e2023RG000828, https://doi.org/10.1029/2023RG000828, 2024.
Rakovec, O., Samaniego, L., Hari, V., Markonis, Y., Moravec, V., Thober, S., Hanel, M., and Kumar, R.: The 2018–2020 Multi-Year Drought Sets a New Benchmark in Europe, Earth's Future, 10, e2021EF002394, https://doi.org/10.1029/2021EF002394, 2022.
Rebmann, C., Aubinet, M., Schmid, H., Arriga, N., Aurela, M., Burba, G., Clement, R., De Ligne, A., Fratini, G., Gielen, B., Grace, J., Graf, A., Gross, P., Haapanala, S., Herbst, M., Hörtnagl, L., Ibrom, A., Joly, L., Kljun, N., Kolle, O., Kowalski, A., Lindroth, A., Loustau, D., Mammarella, I., Mauder, M., Merbold, L., Metzger, S., Mölder, M., Montagnani, L., Papale, D., Pavelka, M., Peichl, M., Roland, M., Serrano-Ortiz, P., Siebicke, L., Steinbrecher, R., Tuovinen, J.-P., Vesala, T., Wohlfahrt, G., and Franz, D.: ICOS eddy covariance flux-station site setup: a review, Int. Agrophys., 32, 471–494, https://doi.org/10.1515/intag-2017-0044, 2018.
Rui, H. and Beaudoing, H.: README Document for NASA GLDAS Version 2 Data Products, NASA Goddard Earth Sciences Data and Information Services Center (GES DISC), 2022.
Runge, J., Nowack, P., Kretschmer, M., Flaxman, S., and Sejdinovic, D.: Detecting and quantifying causal associations in large nonlinear time series datasets, Sci. Adv., 5, eaau4996, https://doi.org/10.1126/sciadv.aau4996, 2019.
Runge, J., Gerhardus, A., Varando, G., Eyring, V., and Camps-Valls, G.: Causal inference for time series, Nat. Rev. Earth Environ., 4, 487–505, https://doi.org/10.1038/s43017-023-00431-y, 2023.
Running, S., Mu, Q., and Zhao, M.: MOD16A2 MODIS/Terra Net Evapotranspiration 8-Day L4 Global 500m SIN Grid V006 [data set], https://doi.org/10.5067/MODIS/MOD16A2.006, 2017.
Running, S., Mu, Q., Zhao, M., and Moreno, A.: User's guide MODIS global terrestrial evapotranspiration (ET) product (MOD16A2/A3 and year-end gap-filled MOD16A2GF/A3GF), MODIS Land Team 40, 2019.
Savitzky, Abraham. and Golay, M. J. E.: Smoothing and Differentiation of Data by Simplified Least Squares Procedures., Anal. Chem., 36, 1627–1639, https://doi.org/10.1021/ac60214a047, 1964.
Schuldt, B., Buras, A., Arend, M., Vitasse, Y., Beierkuhnlein, C., Damm, A., Gharun, M., Grams, T. E. E., Hauck, M., Hajek, P., Hartmann, H., Hiltbrunner, E., Hoch, G., Holloway-Phillips, M., Körner, C., Larysch, E., Lübbe, T., Nelson, D. B., Rammig, A., Rigling, A., Rose, L., Ruehr, N. K., Schumann, K., Weiser, F., Werner, C., Wohlgemuth, T., Zang, C. S., and Kahmen, A.: A first assessment of the impact of the extreme 2018 summer drought on Central European forests, Basic Appl. Ecol., 45, 86–103, https://doi.org/10.1016/j.baae.2020.04.003, 2020.
Seneviratne, S. I., Corti, T., Davin, E. L., Hirschi, M., Jaeger, E. B., Lehner, I., Orlowsky, B., and Teuling, A. J.: Investigating soil moisture–climate interactions in a changing climate: A review, Earth-Sci. Rev., 99, 125–161, https://doi.org/10.1016/j.earscirev.2010.02.004, 2010.
Sepulcre-Canto, G., Vogt, J., Arboleda, A., and Antofie, T.: Assessment of the EUMETSAT LSA-SAF evapotranspiration product for drought monitoring in Europe, Int. J. Appl. Earth Obs., 30, 190–202, https://doi.org/10.1016/j.jag.2014.01.021, 2014.
Singh, R. P., Paramanik, S., Bhattacharya, B. K., and Behera, M. D.: Modelling of evapotranspiration using land surface energy balance and thermal infrared remote sensing, Trop. Ecol., 61, 42–50, https://doi.org/10.1007/s42965-020-00076-8, 2020.
Stisen, S., Soltani, M., Mendiguren, G., Langkilde, H., Garcia, M., and Koch, J.: Spatial Patterns in Actual Evapotranspiration Climatologies for Europe, Remote Sens., 13, 2410, https://doi.org/10.3390/rs13122410, 2021.
Stoffelen, A.: Toward the true near-surface wind speed: Error modeling and calibration using triple collocation, J. Geophys. Res., 103, 7755–7766, https://doi.org/10.1029/97JC03180, 1998.
Trambauer, P., Dutra, E., Maskey, S., Werner, M., Pappenberger, F., Van Beek, L. P. H., and Uhlenbrook, S.: Comparison of different evaporation estimates over the African continent, Hydrol. Earth Syst. Sci., 18, 193–212, https://doi.org/10.5194/hess-18-193-2014, 2014.
Twine, T. E., Kustas, W. P., Norman, J. M., Cook, D. R., Houser, P. R., Meyers, T. P., Prueger, J. H., Starks, P. J., and Wesely, M. L.: Correcting eddy-covariance flux underestimates over a grassland, Agr. Forest Meteorol., 103, 279–300, https://doi.org/10.1016/S0168-1923(00)00123-4, 2000.
Vargas Zeppetello, L. R., McColl, K. A., Bernau, J. A., Bowen, B. B., Tang, L. I., Holbrook, N. M., Gentine, P., and Huybers, P.: Apparent surface conductance sensitivity to vapour pressure deficit in the absence of plants, Nat. Water, 1, 941–951, https://doi.org/10.1038/s44221-023-00147-9, 2023.
Vicente-Serrano, S. M., Beguería, S., and López-Moreno, J. I.: A Multiscalar Drought Index Sensitive to Global Warming: The Standardized Precipitation Evapotranspiration Index, J. Clim., 23, 1696–1718, https://doi.org/10.1175/2009JCLI2909.1, 2010.
Wang, K. and Dickinson, R. E.: A review of global terrestrial evapotranspiration: Observation, modeling, climatology, and climatic variability, Rev. Geophys., 50, 2011RG000373, https://doi.org/10.1029/2011RG000373, 2012.
Warm Winter 2020 Team, ICOS Ecosystem Thematic Centre, ICOS Ecosystem Thematic Centre, and Trotta, C.: Warm Winter 2020 ecosystem eddy covariance flux product for 73 stations in FLUXNET-Archive format – release 2022-1, https://doi.org/10.18160/2G60-ZHAK, 2022.
Widmoser, P.: A discussion on and alternative to the Penman–Monteith equation, Agr. Water Manag., 96, 711–721, https://doi.org/10.1016/j.agwat.2008.10.003, 2009.
Wu, J., Feng, Y., Liang, L., He, X., and Zeng, Z.: Assessing evapotranspiration observed from ECOSTRESS using flux measurements in agroecosystems, Agr. Water Manag., 269, 107706, https://doi.org/10.1016/j.agwat.2022.107706, 2022.
Xu, C., Wang, W., Hu, Y., and Liu, Y.: Evaluation of ERA5, ERA5-Land, GLDAS-2.1, and GLEAM potential evapotranspiration data over mainland China, J. Hydrol. Reg. Stud., 51, 101651, https://doi.org/10.1016/j.ejrh.2023.101651, 2024.
Xu, T., Guo, Z., Xia, Y., Ferreira, V. G., Liu, S., Wang, K., Yao, Y., Zhang, X., and Zhao, C.: Evaluation of twelve evapotranspiration products from machine learning, remote sensing and land surface models over conterminous United States, J. Hydrol., 578, 124105, https://doi.org/10.1016/j.jhydrol.2019.124105, 2019.
Yu, X., Qian, L., Wang, W., Hu, X., Dong, J., Pi, Y., and Fan, K.: Comprehensive evaluation of terrestrial evapotranspiration from different models under extreme condition over conterminous United States, Agr. Water Manag., 289, 108555, https://doi.org/10.1016/j.agwat.2023.108555, 2023.
Zhang, J., Guan, K., Peng, B., Pan, M., Zhou, W., Jiang, C., Kimm, H., Franz, T. E., Grant, R. F., Yang, Y., Rudnick, D. R., Heeren, D. M., Suyker, A. E., Bauerle, W. L., and Miner, G. L.: Sustainable irrigation based on co-regulation of soil water supply and atmospheric evaporative demand, Nat. Commun., 12, 5549, https://doi.org/10.1038/s41467-021-25254-7, 2021.
Zhang, K., Kimball, J. S., and Running, S. W.: A review of remote sensing based actual evapotranspiration estimation, WIREs Water, 3, 834–853, https://doi.org/10.1002/wat2.1168, 2016.
Zhao, M., A, G., Liu, Y., and Konings, A. G.: Evapotranspiration frequently increases during droughts, Nat. Clim. Change, 12, 1024–1030, https://doi.org/10.1038/s41558-022-01505-3, 2022.
Zhou, S., Yu, B., Zhang, Y., Huang, Y., and Wang, G.: Partitioning evapotranspiration based on the concept of underlying water use efficiency, Water Resour. Res., 52, 1160–1175, https://doi.org/10.1002/2015WR017766, 2016.
Zhou, S., Zhang, Y., Park Williams, A., and Gentine, P.: Projected increases in intensity, frequency, and terrestrial carbon costs of compound drought and aridity events, Sci. Adv., 5, eaau5740, https://doi.org/10.1126/sciadv.aau5740, 2019.