the Creative Commons Attribution 4.0 License.
the Creative Commons Attribution 4.0 License.
 | 14 Aug 2025
Fertilization turns a rubber plantation from sink to methane source
Daniel Epron
Rawiwan Chotiphan
Zixiao Wang
Ornuma Duangngam
Makoto Shibata
Sumonta Kumar Paul
Takumi Mochidome
Jate Sathornkich
Wakana A. Azuma
Jun Murase
Yann Nouvellon
Poonpipope Kasemsap
Kannika Sajjaphan
The rapid expansion of rubber cultivation, driven by the demand for natural rubber in the tire industry, constitutes a significant land-use change in Southeast Asia. This significant land-use change has reduced soil methane (CH4) uptake, thereby weakening atmospheric CH4 removal over extensive areas. While fertilization is a widespread practice in rubber plantations, its role in further weakening the soil CH4 sink has remained poorly understood. Over 1.5 years, we measured soil CH4 fluxes biweekly (every 2 weeks) in an experimental rubber plantation with four distinct fertilization treatments to evaluate their impact on the soil CH4 uptake. Our findings revealed that fertilization not only reduced soil CH4 consumption, but also increased soil CH4 production. The difference in soil CH4 uptake between unfertilized plots (−2.9 kg CH4 ha−1 yr−1) and those with rational fertilization (−2.1 kg CH4 ha−1 yr−1) was moderate. Recommended fertilization rates reduced soil CH4 uptake by 60 % (−1.1 kg CH4 ha−1 yr−1), and heavy fertilization transformed the soil into a net source of CH4 (+0.3 kg CH4 ha−1 yr−1). The suppression of soil CH4 oxidation was likely driven by increased mineral nitrogen in the soil solution and soil acidification, while elevated dissolved organic carbon likely stimulated CH4 production in the topsoil. Most rubber tree trunks emitted CH4, likely of internal origin. Trunk CH4 fluxes ranged from −0.10 to 0.51 nmol s−1 per tree, with no significant fertilization effect. At the national level, adopting rational fertilization practices in Thailand could enhance the net soil CH4 sink by 5.9 Gg CH4 yr−1. However, this mitigation strategy would have a limited impact on the overall greenhouse gas budget of the agricultural sector in Southeast Asia, unless it is extended to other tree plantations and cropping systems.
- Article
(4718 KB) - Full-text XML
- BibTeX
- EndNote


Methane (CH4) is the second most impactful anthropogenic greenhouse gas, contributing approximatively one-third to the anthropogenic radiative forcing (IPCC, 2021). The Global Methane Pledge endorsed by 111 countries at the 26th session of the Conference of the Parties (COP26) to the United Nations Framework Convention on Climate Change commits to a 30 % reduction of emissions from anthropogenic sources by 2030. Atmospheric CH4 removal (negative CH4 emission) may be necessary to achieve this goal (Jackson et al., 2021). Soils serve as the largest biological sink for atmospheric CH4, with an annual global uptake estimated as 25–45 Tg (Saunois et al., 2020). Upland tropical forest soils, in particularly, play a critical role in this global sink, providing a valuable ecosystem service.
Southeast Asia has experienced extensive land-use changes over recent decades, with rubber and oil palm cultivation being the dominant agricultural expansion. Rubber plantations now occupy over 142 000 km2 in the region (Wang et al., 2023), and this area is projected to quadruple within the next 30 years, driven by increasing global demand of natural rubber, particularly for tire manufacturing (Fox et al., 2014). While land-use comparisons have been extensively studied, to our knowledge, no previous research has specifically addressed the effect of management practices – particularly fertilization – on the CH4 budget of rubber plantations. A recent study found no effect of reduced fertilization on soil CH4 uptake in an oil palm plantation in Indonesia (Chen et al., 2024).
A recent survey of Thai rubber smallholders, who manage 90 % of the country's rubber plantations, revealed that fertilization is nearly ubiquitous. Two-thirds of these plantations employ intensive (N application above 53 kg ha−1 yr−1) or very intensive (N application above 94 kg ha−1 yr−1) fertilization rates, even though the benefits of such practices are not well demonstrated (Chambon et al., 2018). Given the importance of agriculture as the largest anthropogenic CH4 source, mitigation strategies targeting CH4 emission from rice cultivation, enteric fermentation, manure management, and residue burning have been extensively evaluated (Smith et al., 2021). However, the potential of rational fertilization to enhance soil CH4 uptake has not yet to be assessed, although it may be another effective mechanism for atmospheric CH4 removal for agriculture.
The conversion of forests to rubber plantations in Southeast Asia is known to reduce soil CH4 uptake compared to natural forests (Ishizuka et al., 2002, 2005; Lang et al., 2017, 2019; Werner et al., 2006). Given the current extent and anticipated expansion of rubber plantations in Southeast Asia and other tropical regions, a weaker soil CH4 sink could have significant implications for the global CH4 budget. The net rate of CH4 uptake, defined as the difference between CH4 production and oxidation rates (Le Mer and Roger, 2001), depends primarily on the air-filled porosity (AFP) of the soil. AFP itself is determined by soil water content (SWC) and total porosity (Epron et al., 2016; Kruse et al., 1996). A high AFP enhances gas diffusion within the soil, thereby promoting microbial CH4 oxidation. It has been hypothesized that the reduction in soil CH4 uptake following forest conversion is primarily due to increased SWC, attributed to lower water use by rubber trees compared forest trees (Lang et al., 2020). However, studies have reported higher evapotranspiration rates in rubber plantations than in tropical forests (Giambelluca et al., 2016; Guardiola-Claramonte et al., 2008; Niu et al., 2017; Tan et al., 2011), which contradicts the assumption of higher SWC. The underlying causes of reduced soil CH4 uptake in rubber plantations compared to forests remain unclear, particularly the extent to which management practice may mitigate or exacerbate this weakening of the soil CH4 sink.
Although fertilization is a common practice in rubber plantations, its effects on soil CH4 uptake have not yet been documented. Fertilization can enhance tree growth, potentially increasing tree water use if the transpiration efficiency – the ratio of dry biomass accumulation per unit water transpired – does not improve significantly. Higher rates of evapotranspiration could lower SWC, particularly in the upper soil layers, thereby increasing AFP. This, in turn, would facilitate the diffusion of atmospheric CH4 and oxygen (O2) into the soil pores, where CH4 is oxidized by methanotrophs, unless SWC becomes too low, which could limit microbial activity and hinder CH4 oxidation (Borken et al., 2006; Bras et al., 2022; von Fischer et al., 2009; Qiu et al., 2024).
Fertilizers can also have direct effects, either positive or negative, on soil CH4 uptake. They can alleviate nitrogen (N) or phosphorus (P) limitations for methane oxidizing bacteria (MOB) in tropical forests soils, depending on the nutrient status of the soil. Like other microorganisms, MOB require N and P to sustain their growth and activity (Bodelier and Laanbroek, 2004; Martinson et al., 2021; Veldkamp et al., 2013). However, excessive nitrogen inputs can reduce soil CH4 oxidation (Lee et al., 2023; Steudler et al., 1989; Zhang et al., 2020). Several mechanisms have been proposed to explain this inhibition. Ammonia-oxidizing bacteria, which can oxidize CH4 instead of ammonium (NH) under low NH availability due to the similarity between the enzymes ammonia monooxygenase and methane monooxygenase, shift their activity to NH oxidation when N limitation is alleviated (Bédard and Knowles, 1989). A similar substrate competition occurs when NH competes with CH4 for the active site of methane monooxygenase (King and Schnell, 1994; O'Neill and Wilkinson, 1977). However, unlike CH4, NH does not provide carbon to sustain the growth of methanotrophic bacteria and produces nitrite, which is toxic to them (Schnell and King, 1994). Additionally, cations in fertilizers, such as potassium, can compete with NH for exchange sites on clay-humus complexes in the soil, releasing NH into the soil solution (King and Schnell, 1998). Nitrate (NO), possibly after been reduced to nitrite (NO), has also been identified as a potent inhibitor of CH4 oxidation in some soils (Mochizuki et al., 2012; Reay and Nedwell, 2004; Wang and Ineson, 2003). Excessive N fertilizer application can further acidify the soil (Qu et al., 2014), which is known to negatively impact soil CH4 oxidation (Benstead and King, 2001; Hütsch et al., 1994). Conversely, phosphate (PO) has been found to mitigate the inhibitory effect of N on CH4 oxidation at certain sites, while at others, it has been suspected of stimulating methanogenesis, thereby reducing net atmospheric CH4 uptake (Zhang et al., 2011; Zheng et al., 2016).
In addition to anoxic conditions, the main factor controlling methanogenesis is the availability of organic substrates derived from primary production (Liu et al., 2011; Whiting and Chanton, 1993). This availability can increase with fertilizer inputs, due to greater production of above- or below-ground litter (including sloughed-off cells), enhanced decomposition rates, and increased root exudation (Banger et al., 2012; Hobbie, 2005; Melillo et al., 1982; Zhu et al., 2013). Significant increases in CH4 emissions have been reported from eutrophied lakes and ponds in agricultural catchments, mangrove sediments receiving sewage discharges or anthropogenic nutrient inputs, and irrigated and fertilized young tree plantations on lowland soils (Allen et al., 2011; Beaulieu et al., 2019; Huttunen et al., 2003; Purvaja and Ramesh, 2001; Rabbai et al., 2024; Sotomayor et al., 1994). In contrast, nitrate additions have been reported to decrease CH4 emissions in rice paddies and wetlands, highlighting the variability in methanogenesis responses depending on environmental conditions and nutrient dynamics (Kim et al., 2015; Roy and Conrad, 1999).
Trees can both emit and uptake CH4, complicating our understanding of the greenhouse gas budget of forest ecosystems and tree plantations (Barba et al., 2019b; Gauci et al., 2024). For example, trees contribute up to 87 % of the total ecosystem CH4 flux in a Southeast Asian tropical peat forest (Pangala et al., 2013). While CH4 produced in the soil or sediment is a well-recognized sources of tree CH4 emissions in forested wetland (Gauci et al., 2010; Sakabe et al., 2021; Terazawa et al., 2015), CH4 can also be produced endogenously within the heartwood under anaerobic conditions (Epron et al., 2023; Pitz et al., 2018; Wang et al., 2017). Regardless of whether CH4 originates from the soil or is produced within the tree, it can be further consumed by methanotrophic bacteria living in the stem bark; these MOB can also oxidize atmospheric CH4 (Gauci et al., 2024; Jeffrey et al., 2021; Machacova et al., 2021).
In this study, we measured soil CH4 fluxes over 1.5 years at 2-week intervals in an experimental rubber plantation with four fertilization treatments applied over 8 years. The objective was to assess the impact of fertilizers on the soil CH4 uptake. Specifically, we hypothesized that fertilization decreases soil CH4 oxidation while also considering the possibility that fertilization could stimulate CH4 production, particularly during the rainy season. To better understand the factors driving changes in soil CH4 uptake in response to fertilization, we also monitored soil CH4 concentration gradients and mineral N and PO availability using ion exchange resin bags, as well as dissolved organic carbon (DOC), total dissolved nitrogen (TDN), and other edaphic factors. Additionally, we measured CH4 emissions from the tree trunk surface to assess the extent to which they offset soil CH4 uptake or contributed to the combined net CH4 emissions from trunks and soil.
2.1 Experimental site
The experimental rubber plantation is located at the Sithiporn Kridakara Research Station of Kasetsart University in Prachuap Khiri Khan province, Thailand (10°59′13′′ N, 99°29′22′′ E; 10 m a.s.l.). The site lies at the transition between two climate groups according to the Köppen climate classification: tropical rain forest (Af) and tropical monsoon climate (Am). Annual rainfall averaged 1700 mm between 2010 and 2023, with a wet season extending from May to November and a dry season from December to April. October and November are the wettest months, receiving over 250 mm of rain per month on average. The deep sandy loam soil is classified as Arenic Kandiudults (Soil Survey Staff, 2022) or Ferralic Chromic Acrisols (Loamic, Geric, Ochric) (IUSS Working Group WRB, 2022), developed on Cenozoic sedimentary rocks. The rubber plantation (9 ha, clone RRIM600) was established in 2007, replacing a coconut plantation at a planting density of 500 trees ha−1, in accordance with the recommendation of the Rubber Research Institute of Thailand. Latex harvesting by taping the bark of the trees began in May 2014 and continues annually from May to February (Chotiphan et al., 2019).
A complete randomized block design was implemented with four blocks and four fertilizer treatments (N/P/K): T1 (no fertilizer), T2 ( kg ha−1 yr−1), T3 ( kg ha−1 yr−1), and T4 ( kg ha−1 yr−1). Fertilization treatments began in May 2014, coinciding the start of latex harvesting by tapping. Treatment T2 represents a rational fertilization level recommended by agronomists specializing in rubber cultivation (Gohet et al., 2013). Treatment T3 falls within the range of rates recommended by Thai public institutions for mature rubber plantations, though 40 % of rubber farmers exceed these recommendations (Chambon et al., 2018), a practice represented by treatment T4. Fertilizer for T2 was applied only during the early rainy season (May), while a second application was made during the late rainy season (October) for T3 and T4. Fertilizer was applied by broadcasting, with workers walking along the interrow at approximately 2 m from the planting rows. The 16 elementary plots (4 treatments across 4 blocks) each contained 108 trees and covered an area of 2160 m2.
2.2 Methane flux measurement
Soil CH4 fluxes () were measured over 1.5 years at approximately 2-week intervals (37 measurement dates between 6 September 2022 and 19 February 2024). A total of 96 PVC collars (20 cm in diameter and 13 cm in height), inserted 6 cm into the soil, were distributed across four blocks and four fertilizer treatments. Each plot contained six collars, positioned at three distances from the tree rows (0.7, 2.0, and 3.3 m) to capture spatial variability associated with the planting scheme and fertilizer application. The collars were covered with a 20 cm soil chamber (Li 8100-103, Li-Cor; Lincoln, USA), and change in the CH4 mole fraction inside the closed chamber was recorded for 3 min at a frequency of 1 Hz using a cavity-enhanced absorption spectroscopy gas analyser (Li 7810). Soil temperature at a depth of 10 cm (TSOIL) and volumetric soil water content (SWC) in the 0–6 cm layer were measured simultaneously near each collar. TSOIL and SWC measurements were performed using a digital thermometer and a soil moisture probe (SM150, Delta-T Devices, Cambridge, UK).
Trunk CH4 fluxes () were measured in August 2023, October 2023, and February 2024 on 8 to 13 trees per treatment. Rectangular polypropylene chamber bases (80 cm2) were affixed to the bark surface with neutral seal putty after gently brushing the bark to ensure proper adhesion. Chambers were closed during measurement by attaching a polypropylene lid lined with a silicone rubber gasket and connected to the gas analyser. Measurements were performed first at 40–60 cm above the ground. If the increase in the CH4 mole fraction exceeded 0.01 ppb s−1, additional measurements were taken at 150–170 cm and, if necessary, at 190–220 cm following the same decision rule. values were scaled to the tree level (nmol CH4 s−1 per tree) by multiplying flux measurements by the corresponding stem surface areas. The trunk of each tree was divided into virtual segments, for which both and diameter were measured at the chamber location. The length of each virtual segment was calculated as the difference between half the distance to the chamber located above (or 3.5 m height for the upper chamber) and half the distance to the chamber located below (or the height above the ground for the lower chamber). The surface area of each segment was calculated assuming a cylindrical shape and then multiplied by the flux per unit area measured at the corresponding chamber. The integrated fluxes of all trunk segments were summed for each individual tree. Finally, was multiplied by tree density to expressed at the plantation scale, allowing comparison with on a soil surface area basis.
The slopes of the linear variations in CH4 mole fractions over time were used to calculate CH4 flux, discarding the first 60 s of measurements (Epron et al., 2023; Plain et al., 2019):
where is the net CH4 flux (nmol m−2 s−1) from either soil or trunk; is the slope of linear CH4 mole fractions variations over time (ppb s−1); V is the system volume (m3), including the chamber, part of the collar protruding from the soil, tubing, and analyser; A is the soil or trunk surface area covered by the chamber (m2); Tair is the air temperature (°C); R is the ideal gas constant (8.314 J K−1 mol−1); and Patm is the atmospheric pressure, assumed constant at 101 325 Pa. Based on the manufacturer's specifications (precision of 0.60 ppb CH4 at 2 ppm with 1 s averaging), the minimal detectable flux was estimated at 0.005 nmol m−2 s−1 for soil and 0.003 nmol m−2 s−1 for trunks (Bréchet et al., 2021; Epron et al., 2023). Positive CH4 fluxes indicate net emission to the atmosphere, while negative fluxes represent net uptake.
Cumulative annual soil CH4 fluxes were calculated for each collar using linear interpolations of between consecutive measurement date following the method described by Gana et al. (2018) for CO2 fluxes. Results were expressed in kg CH4 ha−1 yr−1 and calculated for two periods: 6 September 2022 and 5 September 2023 as well as 20 February 2023 and 19 February 2024. These two periods overlap by approximately 6 months due to the late start of the project caused by international travel restrictions during the Covid-19 pandemic in Japan and Thailand until summer 2022. Nevertheless, the first 1-year period was wetter than the second, with cumulative rainfall of 1889 and 1565 mm, respectively.
2.3 Soil methane mole fraction
Soil CH4 mole fractions ([CH4]S) were measured only three times during the study, at two soil depths (10 and 40 cm) near 24 soil collars (six per fertilization treatments, though not evenly distributed across the four blocks). In August 2023, two stainless-steel pipes (inner diameter: 5 mm), 20 and 50 cm in length, were vertically inserted into the soil next to each other, with a 10 cm gap between them. The buried ends of the pipes were pinched closed, and two side holes (2 mm in diameter) were drilled just above the closed end. The opposite ends of the pipes protruded 10 cm above the soil surface and were sealed with septa.
One week later, an air sample (0.5 mL) was drawn from each pipe using a syringe through the septum and injected into the sample kit (Li 7800-110), which was connected to the gas analyser. Before injecting, the sample kit and analyser loop were flushed with ambient air and closed. The mole fraction of CH4 in the closed loop was recorded for 1 min before injection and for 2 min after injection. The mole fraction of CH4 in the injected air sample was calculated as follows:
where VL and VS are the volumes of the loop and injected sample, respectively. The indices for [CH4] indicate the mole fractions in the loop before injection (L), in the loop after injection (P), and in the air sample (S). The same sampling procedure was repeated in October 2023 and February 2024.
Gradients in CH4 mole fraction within the two soil layers (0–10 and 10–40 cm) were calculated as the difference between [CH4]S between the upper and lower depths of each layer, divided by the depth difference (d):
The CH4 mole fraction in the ambient air, measured 15 cm above the ground before closing the loop, was used as the reference value at 0 cm depth. A negative ΔCH4 indicated that CH4 oxidation dominated over CH4 production (net CH4 consumption), while a positive ΔCH4 value indicated that CH4 production exceeded CH4 oxidation (net CH4 production).
2.4 Resin bags
Soil mineral nitrogen (NO and NH) and phosphate (PO) availability was assessed over four periods of 60 to 120 d using ion exchange resin bags. The bags were prepared by cutting nylon stockings into 10 cm long pieces. One end was closed with a zip tie, and the bags were filled with 15 mL of mixed ion exchange resin beads (AmberLite MB20, Sigma-Aldrich; Tokyo, Japan). After closing the other end with a zip tie, the bags formed flat cylinders of approximately 4 cm in diameter. Before deployment, the resin bags were acid-washed in 10 % HCl solution for 1 h and rinsed multiple times with deionized water until the rinse water reached the same pH as the deionized water.
Resin bags were buried in the mineral soil at a depth of 5 cm below the litter layer in each of the four blocks and four fertilizer treatments. Three bags were installed in each of the 16 individual plots on four occasions: February–May 2023; May–August 2023 immediately following the first fertilizer application in T2, T3, and T4; August–October 2023; and October 2023–February 2024 following the second fertilizer application in T3 and T4. Each new bag was placed at 90° angle from the previous position along the perimeter of a virtual circle with a radius of 20 cm.
After retrieval, the resin bags were rinsed in deionized water and stored either in a refrigerator in the laboratory or in a cooler box during transport prior to extraction. The resin bags were extracted three times with 25 mL of 2 M NaCl, shaking for 1 h each time. Extracts were analysed for NO and NH using flow injection analysis (Flow Injection Analyzer FI-5000V, Aqua Lab, Japan) and for PO colorimetrically. After extraction, the resin beads were removed from the bags, dried at 70 °C and weighed.
2.5 Dissolved organic carbon and total dissolved nitrogen in soil solutions
Six lysimetric pits (three in treatment T1 and three in T3, distributed across three blocks) were installed in 2017 as part of another project to collect soil solutions. Solutions were collected using ceramic cup lysimeters connected to a vacuum pump set to −60 kPa of suction.
On 21 February, 17 August, and 8 October 2023, soil solutions were retrieved from two ceramic cup lysimeters installed at a depth of 15 cm in each pit. The collected solutions were stored at 4 °C and subsequently analysed for total dissolved nitrogen (TDN) and dissolved organic carbon (DOC) using a total organic carbon analyser (TOC-L with TNM-L unit, Shimadzu, Japan).
2.6 Soil and climate ancillary data
Topsoil cores were collected in March and October 2023 using 5×5 cm sampling cylinders. In March, four samples per plot (16 per treatment) were taken, while in October, one sample per plot was collected. Before sampling, SWC was measured at two positions 10 cm away from the sampling location to verify the calibration of the SWC probe. The fresh weight of the soil samples was recorded, after which they were air-dried, reweighed, and sieved through a 2 mm mesh. Bulk density (BD) was calculated as the ratio of oven-dried soil mass (measured on a subsample dried at 105 °C) to the volume of the sampling cylinders. SWC and bulk density (BD) were used to calculate air-filled porosity (AFP), assuming a particle density of 2.65 g cm−3.
Soil pH (1:2.5 soil-to-water ratio) was measured on three soil samples (0–10 cm depth) in each plot (12 per treatment) after shaking the soil suspensions for 1 h. Total soil carbon (C) and nitrogen (N) concentrations were determined on two soil samples (0–10 cm depth) from each plot (eight per treatment) using an elemental analyser (EA-Isolink CN, Thermo Fisher Scientific).
Litterfall was collected biweekly from January 2023 to April 2023 (covering the leaf fall period) using two 50×50 cm litter traps installed in each plot (eight per treatment). The collected litter was oven-dried at 65 °C and weighed. Composite samples for each treatment in each block were ground, and total C and N concentrations were measured as described for the soil samples.
Air temperature (Tair; HMP155, Vaisala; Vantaa, Finland) and incident precipitation (PI; tipping bucket rain gauge, ARG100/EC, Environmental Measurements Limited; North Shields, United Kingdom) were recorded every 10 s and stored as 30 min averages for Tair and cumulative sums for PI. Measurements were taken using a data logger (CR200X, Campbell Scientific, Logan, UT, USA) at a nearby weather station located 500 m from the plantation in an open area.
2.7 Statistical analyses
All data analyses were performed using R version 4.3.2 (R Core Team, 2023). Linear mixed-effects models (LMMs) were used to test the effects of fertilization and measurement date (fixed effects) on , TSOIL, AFP, and SWC, with collar identifiers included as a random effect. Similarly, LMMs were applied to soil CH4 molar fraction, resin bag data, and lysimeter data, using the location identifier as a random effect. For soil characteristics (BD, pH, total C and N), which were measured only once, and for , which was not always measured on the same trees, block was included as a random effect. LMMs were fitted using the “lmerTest” package (Bates et al., 2015; Kuznetsova et al., 2017). For litterfall and litter N content, simple linear models were used because all samples from each plot were combined, resulting in only one sample per treatment per block. When residuals did not meet the assumption of normality, the dependent variables were rank-transformed in the final models (Conover and Iman, 1981) using aligned rank transformation for nonparametric factorial analyses, as implemented in the “ARTool” package (Wobbrock et al., 2011). Post hoc contrasts were applied to test differences between treatments. The conclusions obtained from the rank-transformed data were consistent with those obtained from the raw data.
An LMM was also fitted to analyse the relationship between and AFP. Marginal () and conditional () coefficients of determination (Nakagawa and Schielzeth, 2013) were calculated using the “MUMIn” package (Bartoń, 2023).
For each collar in each treatment, the number of measurement days with positive CH4 fluxes was recorded. This number could range between 0 (all measured fluxes were negative for this collar) and 37 (all measured fluxes were positive for this collar). For the 24 collars in each treatment, both the median and the maximum of the number of days with positive flux were calculated.
3.1 Edaphic factors
Fertilization did not significantly affect soil bulk density, total carbon, or nitrogen concentrations (p= 0.11, 0.55, and 0.81, respectively) but acidified the soil, particularly in T3 and T4 (Table 1, p < 0.001). While the amount of litterfall did not differ markedly between treatments (0.73±0.03 kg m−2 on average), the nitrogen content of the litter was 9 % higher in T3 and T4 litters compared to T1 and T2 (Table 1, p < 0.001).
Table 1Soil and litter characteristics under four fertilization treatments. Differences in bulk density (BD), pH, and total carbon and nitrogen concentrations in the top 10 cm of soil between the four fertilization treatments. Values are averaged by treatment and presented with standard error. The p values from ANOVA applied to linear mixed-effects models (soil) or linear model (litter) on rank-transformed data are shown, along with n, the number of independent replicates in each treatment. Significant differences between fertilization levels (p < 0.05) are indicated by different lowercase letters.
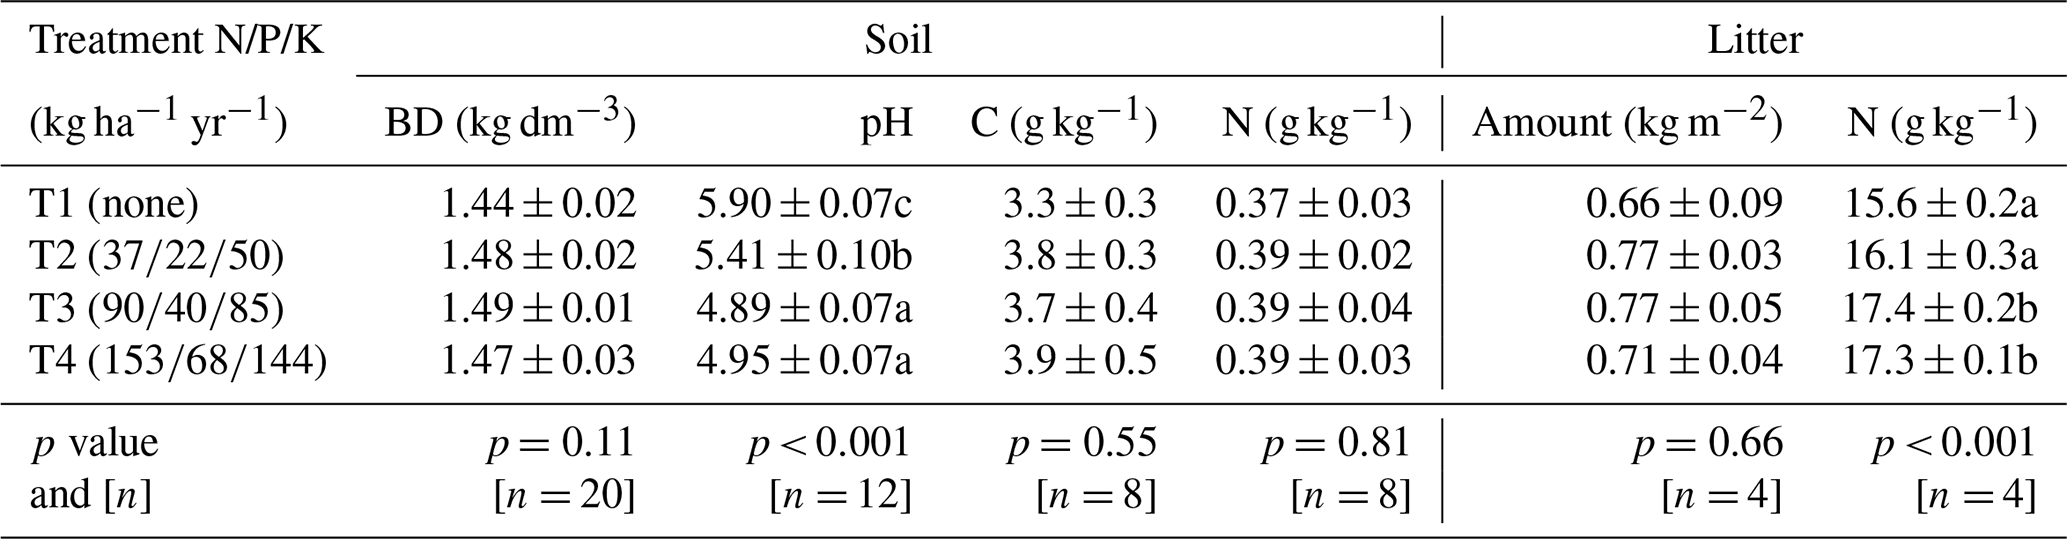
Fertilization did not significantly affect SWC or AFP (Table A1, p > 0.1). The soil in T1 exhibits slightly but significantly higher temperatures at 10 cm depth compared to the other treatments (+0.5, +0.7, and +0.8 °C above T2, T3, and T4, respectively; Table A1, p < 0.001).
3.2 Soil methane flux
Seasonal rainfall influenced the AFP and soil CH4 fluxes (), with higher AFP and increased CH4 uptake (more negative values) during the dry season compared to the rainy season (Fig. 1a–c). Lower CH4 uptake was observed at 2.0 m from the planting rows compared to 0.7 and 3.3 m in the fertilized treatments, likely reflecting spatial heterogeneity in fertilizer application, as fertilizer was broadcast by workers walking approximately 2 m from the planting rows. Significant differences in were observed across all dates and fertilization treatments, with fertilization decreasing soil CH4 uptake and increasing emissions (Fig. 1d, Table A1, p < 0.001). In heavily fertilized plots, the soil even transitioned from a net CH4 sink to a net source during the rainy season. Out of 24 collars, 6 in T1 never showed positive . The median number of measurement days with positive was 2 (maximum of 7 d). For T2, T3, and T4, these numbers were three collars (median: 3 days; maximum: 23 d), two collars (median: 7 d; maximum: 27 d), and one collar (median: 15 d; maximum: 31 d), respectively. Some collars exhibited transient positive , occasionally during the dry season, without synchronization within the same treatment (Fig. A1).
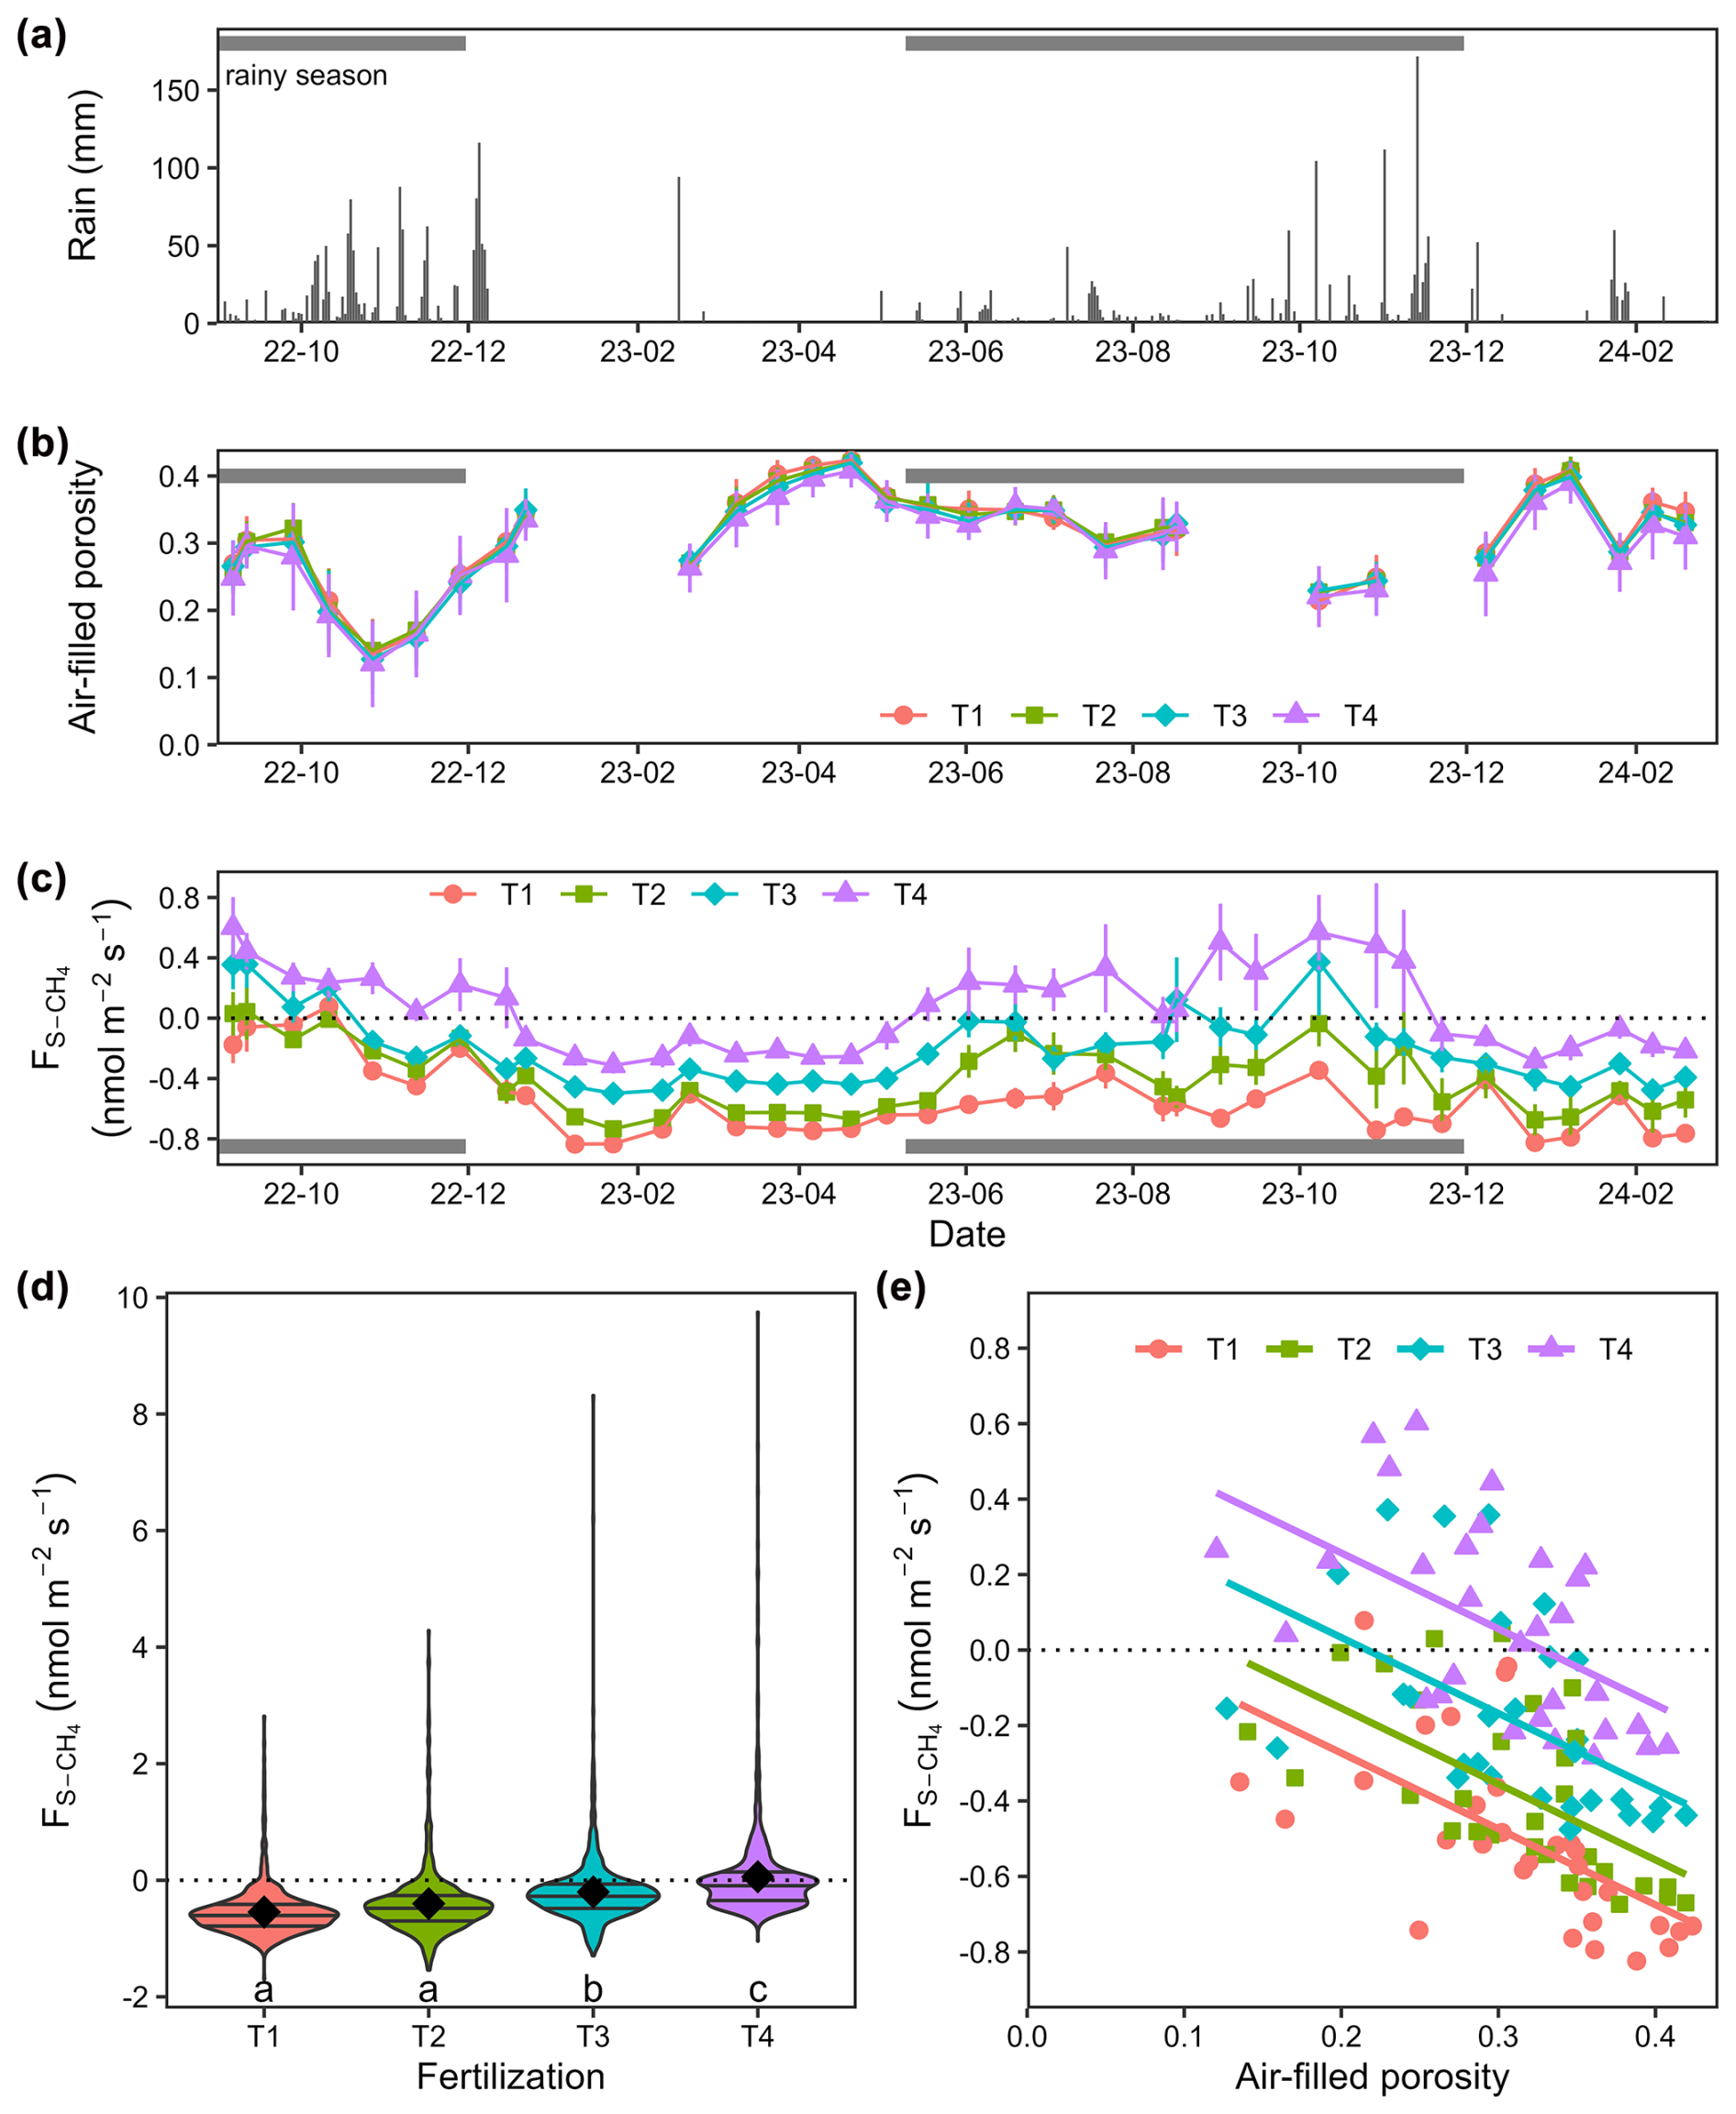
Figure 1Soil CH4 fluxes over 1.5 years in an experimental rubber plantation with four levels of fertilization. (a) Daily rainfall, (b) soil air-filled porosity averaged by treatment with SEM bars (n= 24), (c) soil CH4 fluxes () averaged by treatment with SEM bars (n= 24), (d) violin plots showing the variability in within and between the four fertilization treatments (n= 888), and (e) linear regressions between air-filled porosity and averaged for each day across fertilization levels (n= 37, statistics and model parameters are provided in Table A2). Fertilization treatments are ranked from T1 (no fertilization) to T4 (highest fertilization level) and are represented by different colours in panels (b)–(e) and different symbols in panels (b), (c), and (e). Significant differences between fertilization treatments (p < 0.05) are indicated by different lowercase letters in panel (d).
The average CH4 uptake was higher in the non-fertilized treatment (T1: nmol m−2 s−1, n= 888, mean ± SEM) compared to T2 ( nmol m−2 s−1) and T3 ( nmol m−2 s−1). In T4, the average was positive (0.06±0.03 nmol m−2 s−1). Across 37 measurement days from September 2022 to February 2024, the spatially averaged was positive on only 1 d for T1, 2 d for T2, 6 d for T3, and 20 d for T4. Fertilization increased the intercept of the relationships between and AFP, while the slope remained consistent across treatments (Fig. 1e and Table A2).
3.3 Soil methane mole fraction
Soil CH4 mole fractions ([CH4]S) between 0 and 10 cm depth decreased by an average of −35 ppb cm−1 (ΔCH4) compared to ambient air (mole fraction of 1975 ppb on average) across all dates and locations in T1. An exception was observed in one pipe in August 2023 where [CH4]S at 10 cm depth was higher than ambient air (2025 ppb; Fig. 2a). A similar trend was noted in T2, with a lesser decrease (ΔCH4= −20 ppb cm−1) and three occurrences of mole fractions above ambient air, including a hot spot of CH4 accumulation during the rainy season (October 2023, lowest AFP, 3759 ppb). In T3 and T4, [CH4]S increased between 0 and 10 cm with ΔCH4 values of 14 and 7 ppb cm−1 on average, respectively (p= 0.04, Table A3), and hotspots of CH4 accumulation (> 2500 ppb) occurring in October 2023 for both treatments. Overall, net CH4 consumption dominated in T1 and T2 soils at a depth of 0 to 10 cm, while net CH4 production dominated in T3 and T4 soils.
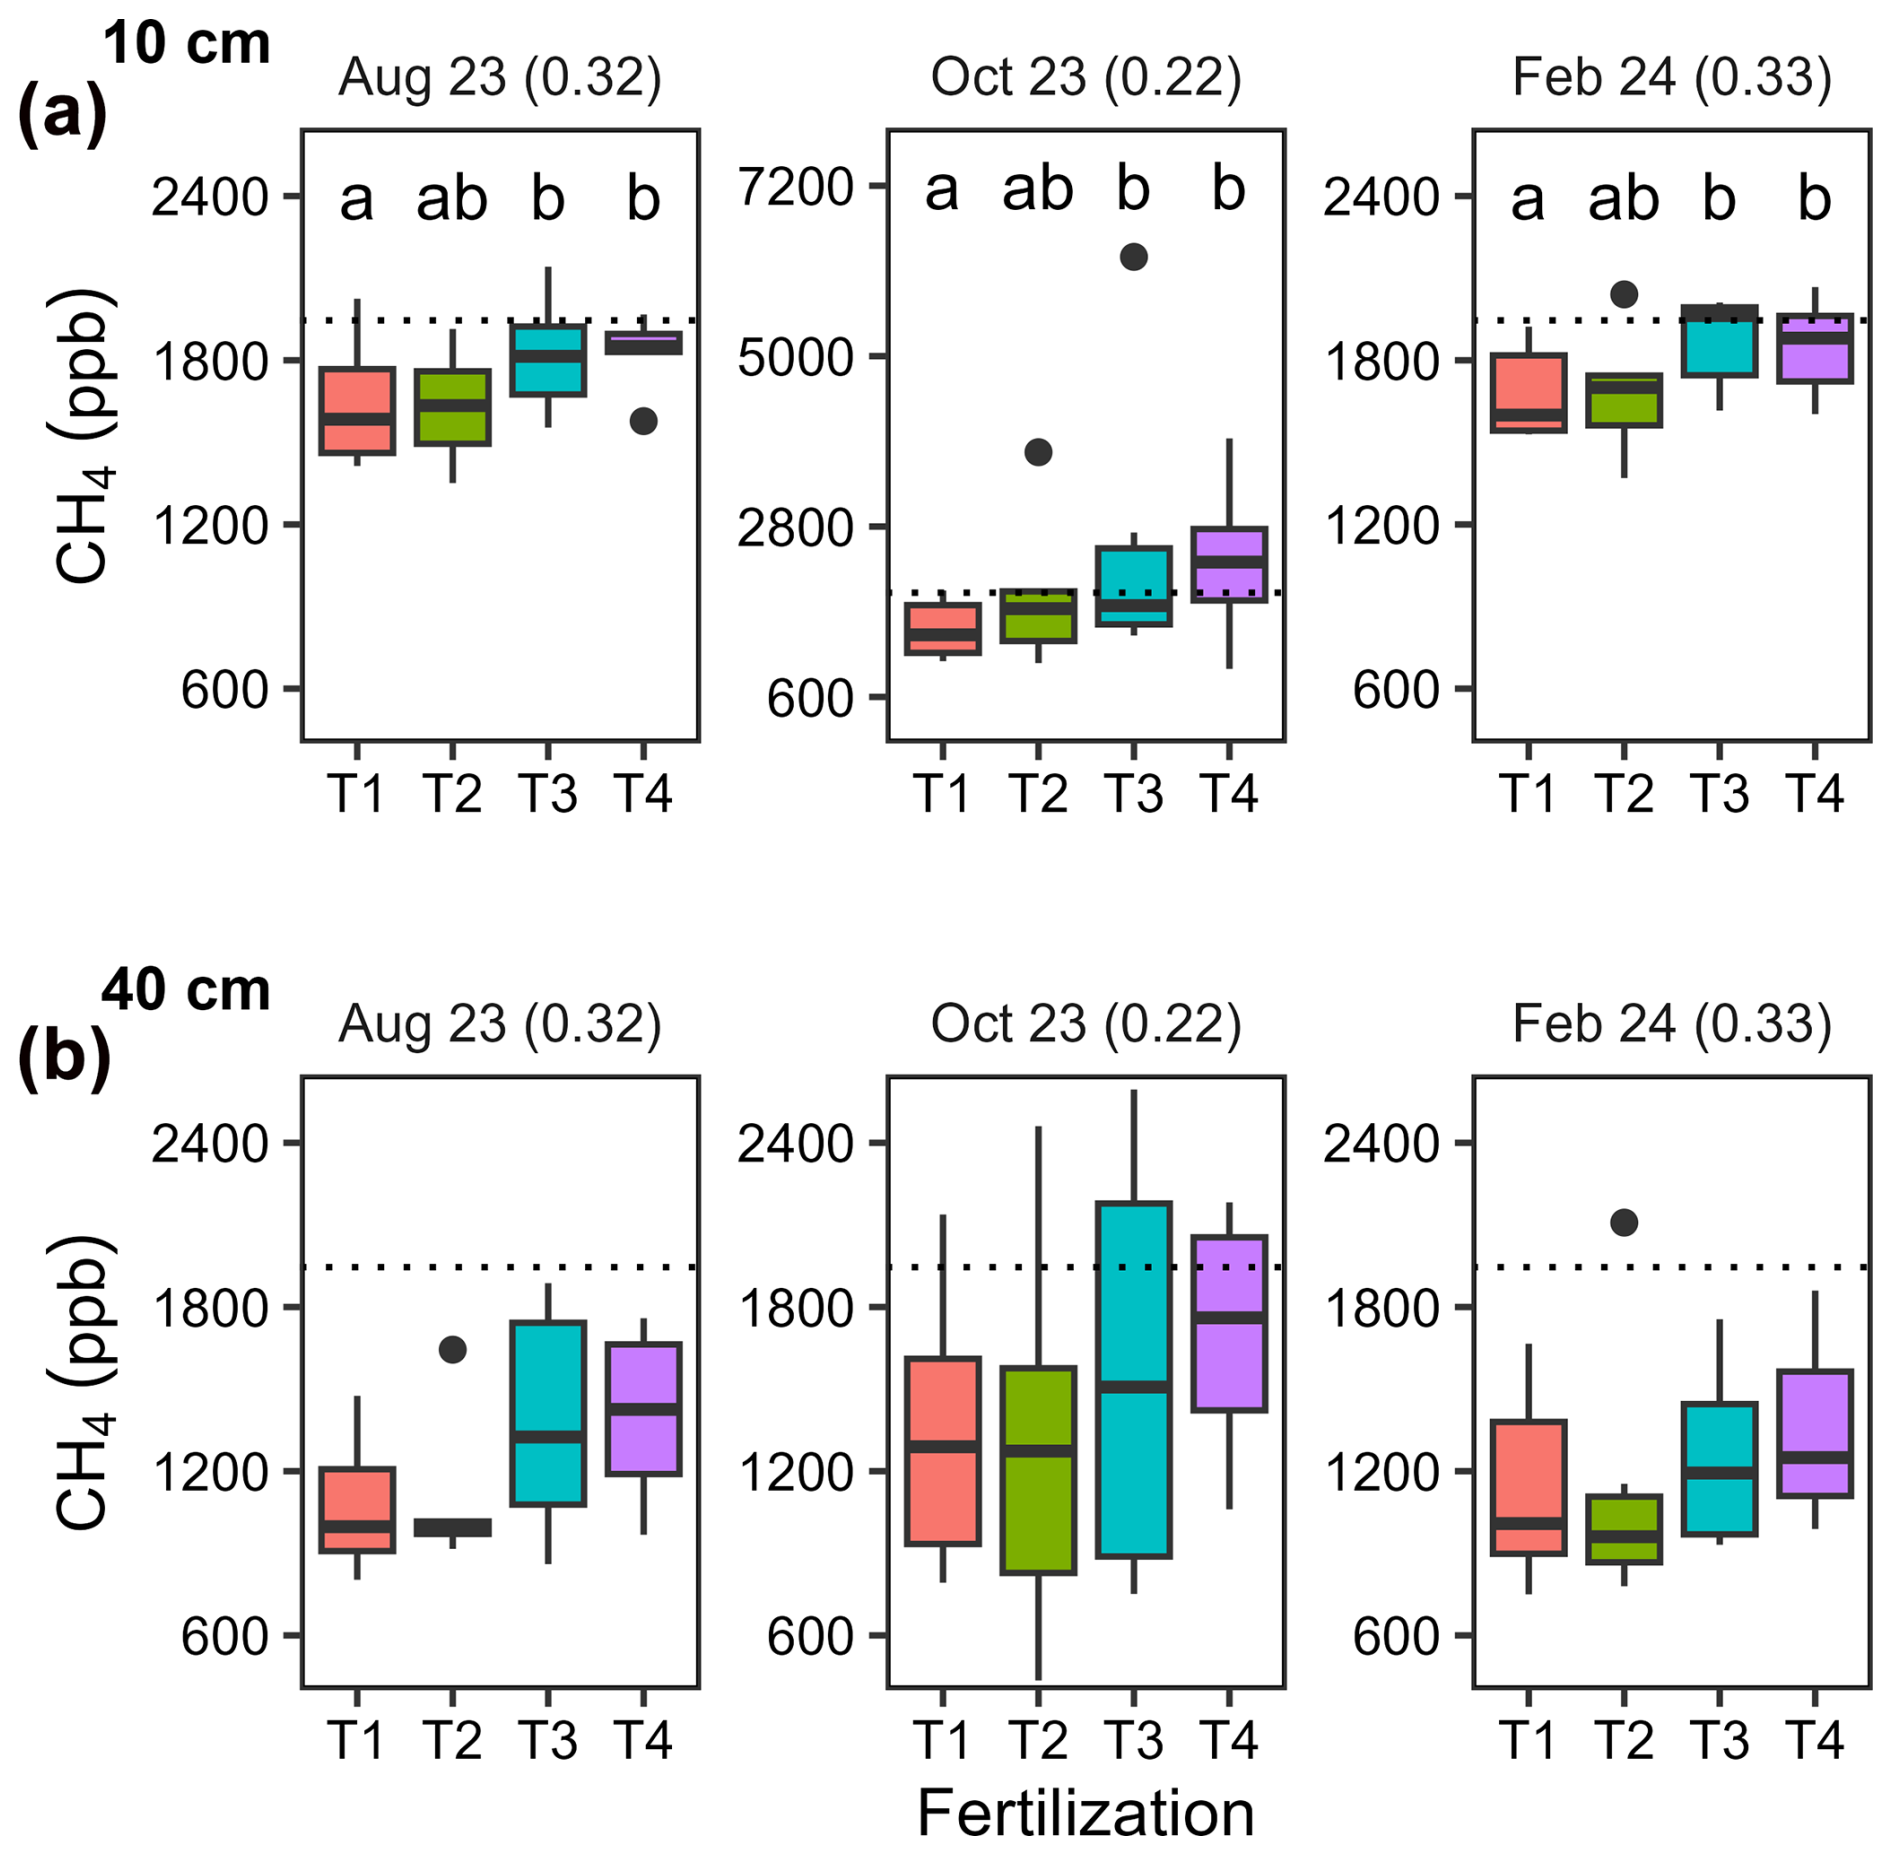
Figure 2Soil CH4 mole fractions measured at two depths in different seasons. Boxplots (n= 6) illustrating soil CH4 mole fractions at (a) 10 cm depth and (b) 140 cm depth on three different dates. Fertilization treatments are ranked from T1 (no fertilization) to T4 (highest fertilization level) and are shown in different colours. The boxes delimitate the interquartile range, the solid lines indicate the median, and the points represent outliers. Note that the scale is different for the topsoil (10 cm) in October 2023.
At a depth of 10 to 40 cm, [CH4]S decreased with ΔCH4 values of −18 ppb cm−1 on average, with no significant differences between fertilization treatments (Fig. 2b and Table A3, p > 0.6). [CH4]S at 40 cm depth was higher in October 2023 during the wet season than on the two other dates.
3.4 Inorganic nitrogen and phosphorus dynamics
Ammonium (NH), nitrate (NO), and phosphate (PO) accumulated in resin bags, particularly those buried immediately after fertilization applications in May (T2, T3 and T4) and in October (T3 and T4 only; Fig. 3 and Table A4). Concentrations increased with fertilization levels (p < 0.001) with higher values in T3 and T4 compared to T1 and T2. Differences were less pronounced for NH than for NO and PO. After May fertilization, resin bags collected 1.7 times more NH in T2, 9.0 times more in T3, and 9.6 times more in T4 than in T1. Similarly, NO concentrations increased by 13, 494, and 600 times and PO concentrations by 16, 25, and 43 times, respectively. After the October fertilization, NH concentrations increased by 2.3 times in T2 (despite no fertilization), 7.4 times in T3, and 9.6 times in T4 compared to T1. NO and PO concentrations also increased substantially. The lowest concentrations were recorded during the dry season (February to May), and lower concentrations were observed in bags buried 3 months after fertilization (August) compared to those buried immediately after (May and October).
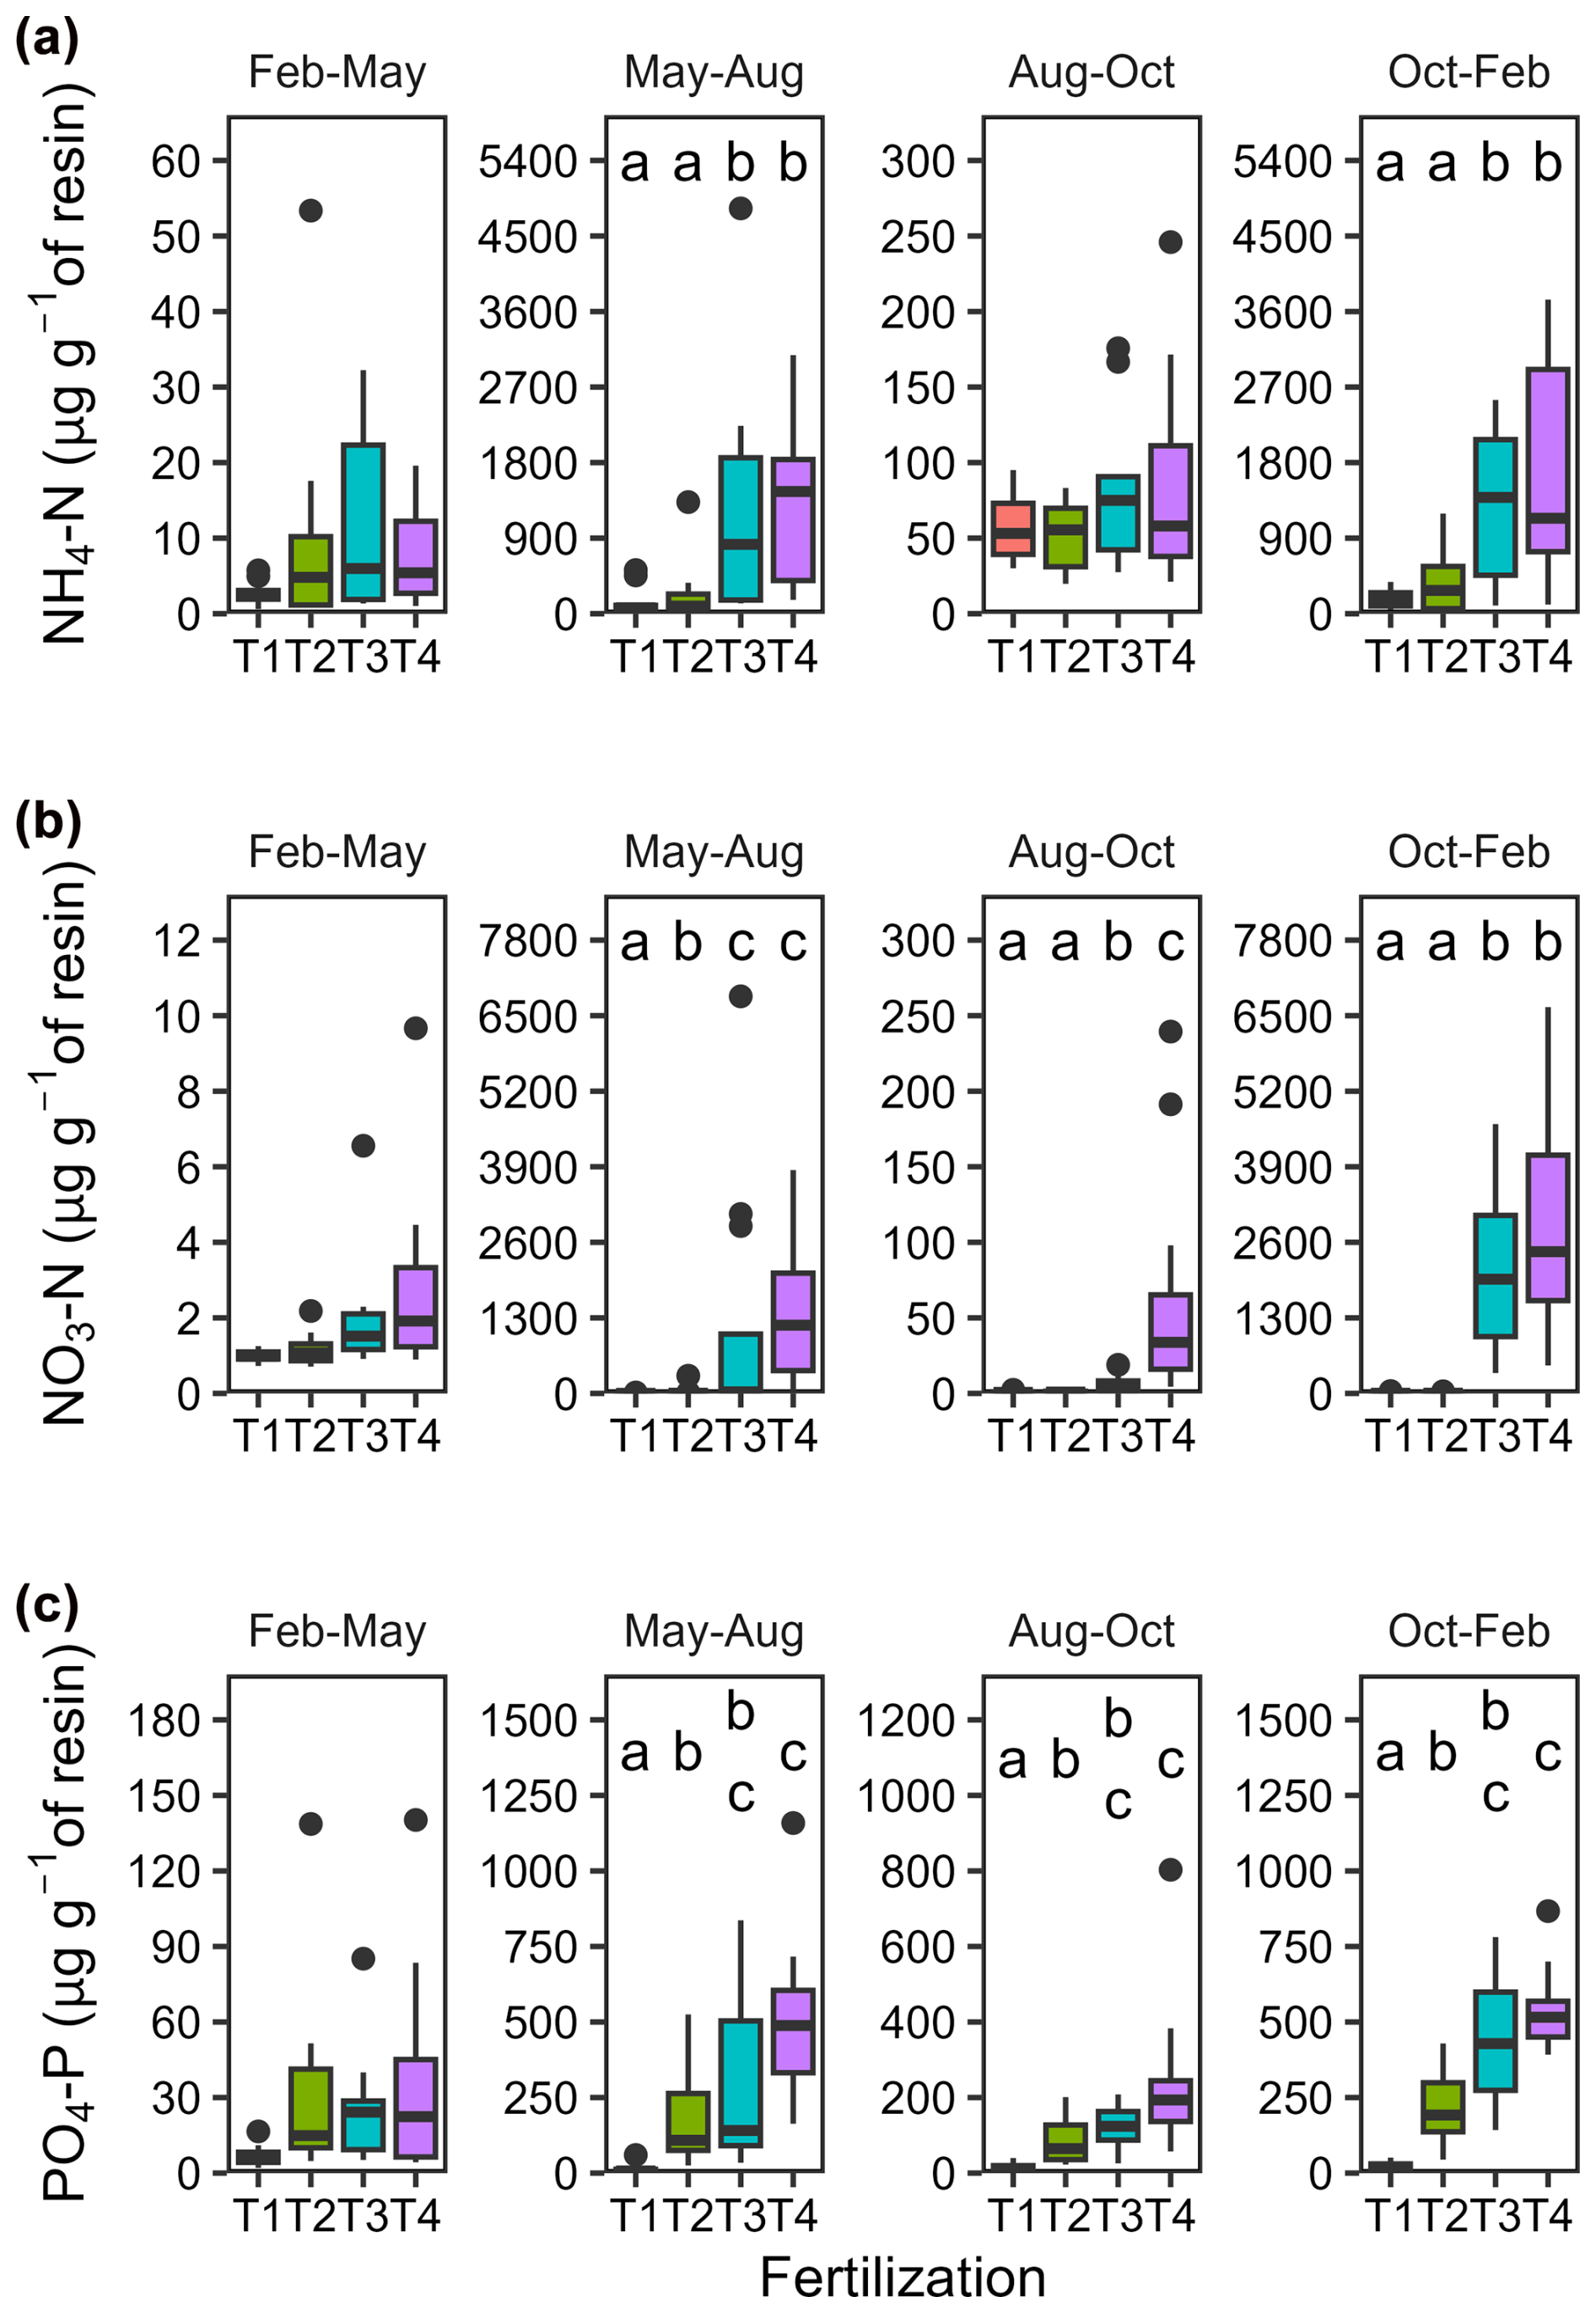
Figure 3Seasonal variations in mineral nitrogen and phosphate concentrations in resin bags. Boxplots (n = 12) illustrating concentrations in (a) NH4-N, (b) NO3-N, and (c) PO4-P collected during four different seasons using resin bags buried at 5 cm soil depth. Fertilization treatments are ranked from T1 (no fertilization) to T4 (highest fertilization level) and are shown in different colours. The boxes delimitate the interquartile range, the solid lines indicate the median, and the points represent outliers. Note that the scales differ between seasons to accommodate the large variations associated with rainfall seasonality (dry season from early December to early May) and fertilizer applications (in May for all treatments except T1, and additionally in October for T3 and T4).
3.5 Total dissolved nitrogen and dissolved organic carbon in lysimeter water
Total dissolved nitrogen (TDN) and dissolved organic carbon (DOC) in lysimeter waters collected at 15 cm depth (T1 and T3 only) showed no pronounced seasonal variations (p= 0.08) but significant differences between treatments (p < 0.001, Fig. 4 and Table A5). On average, TDN and DOC concentrations were positively correlated (Spearman's rank correlation coefficient, ρ= 0.61, p < 0.001, df = 33), with concentrations 3.6 and 4.5 times higher, respectively, in T3 compared to T1.
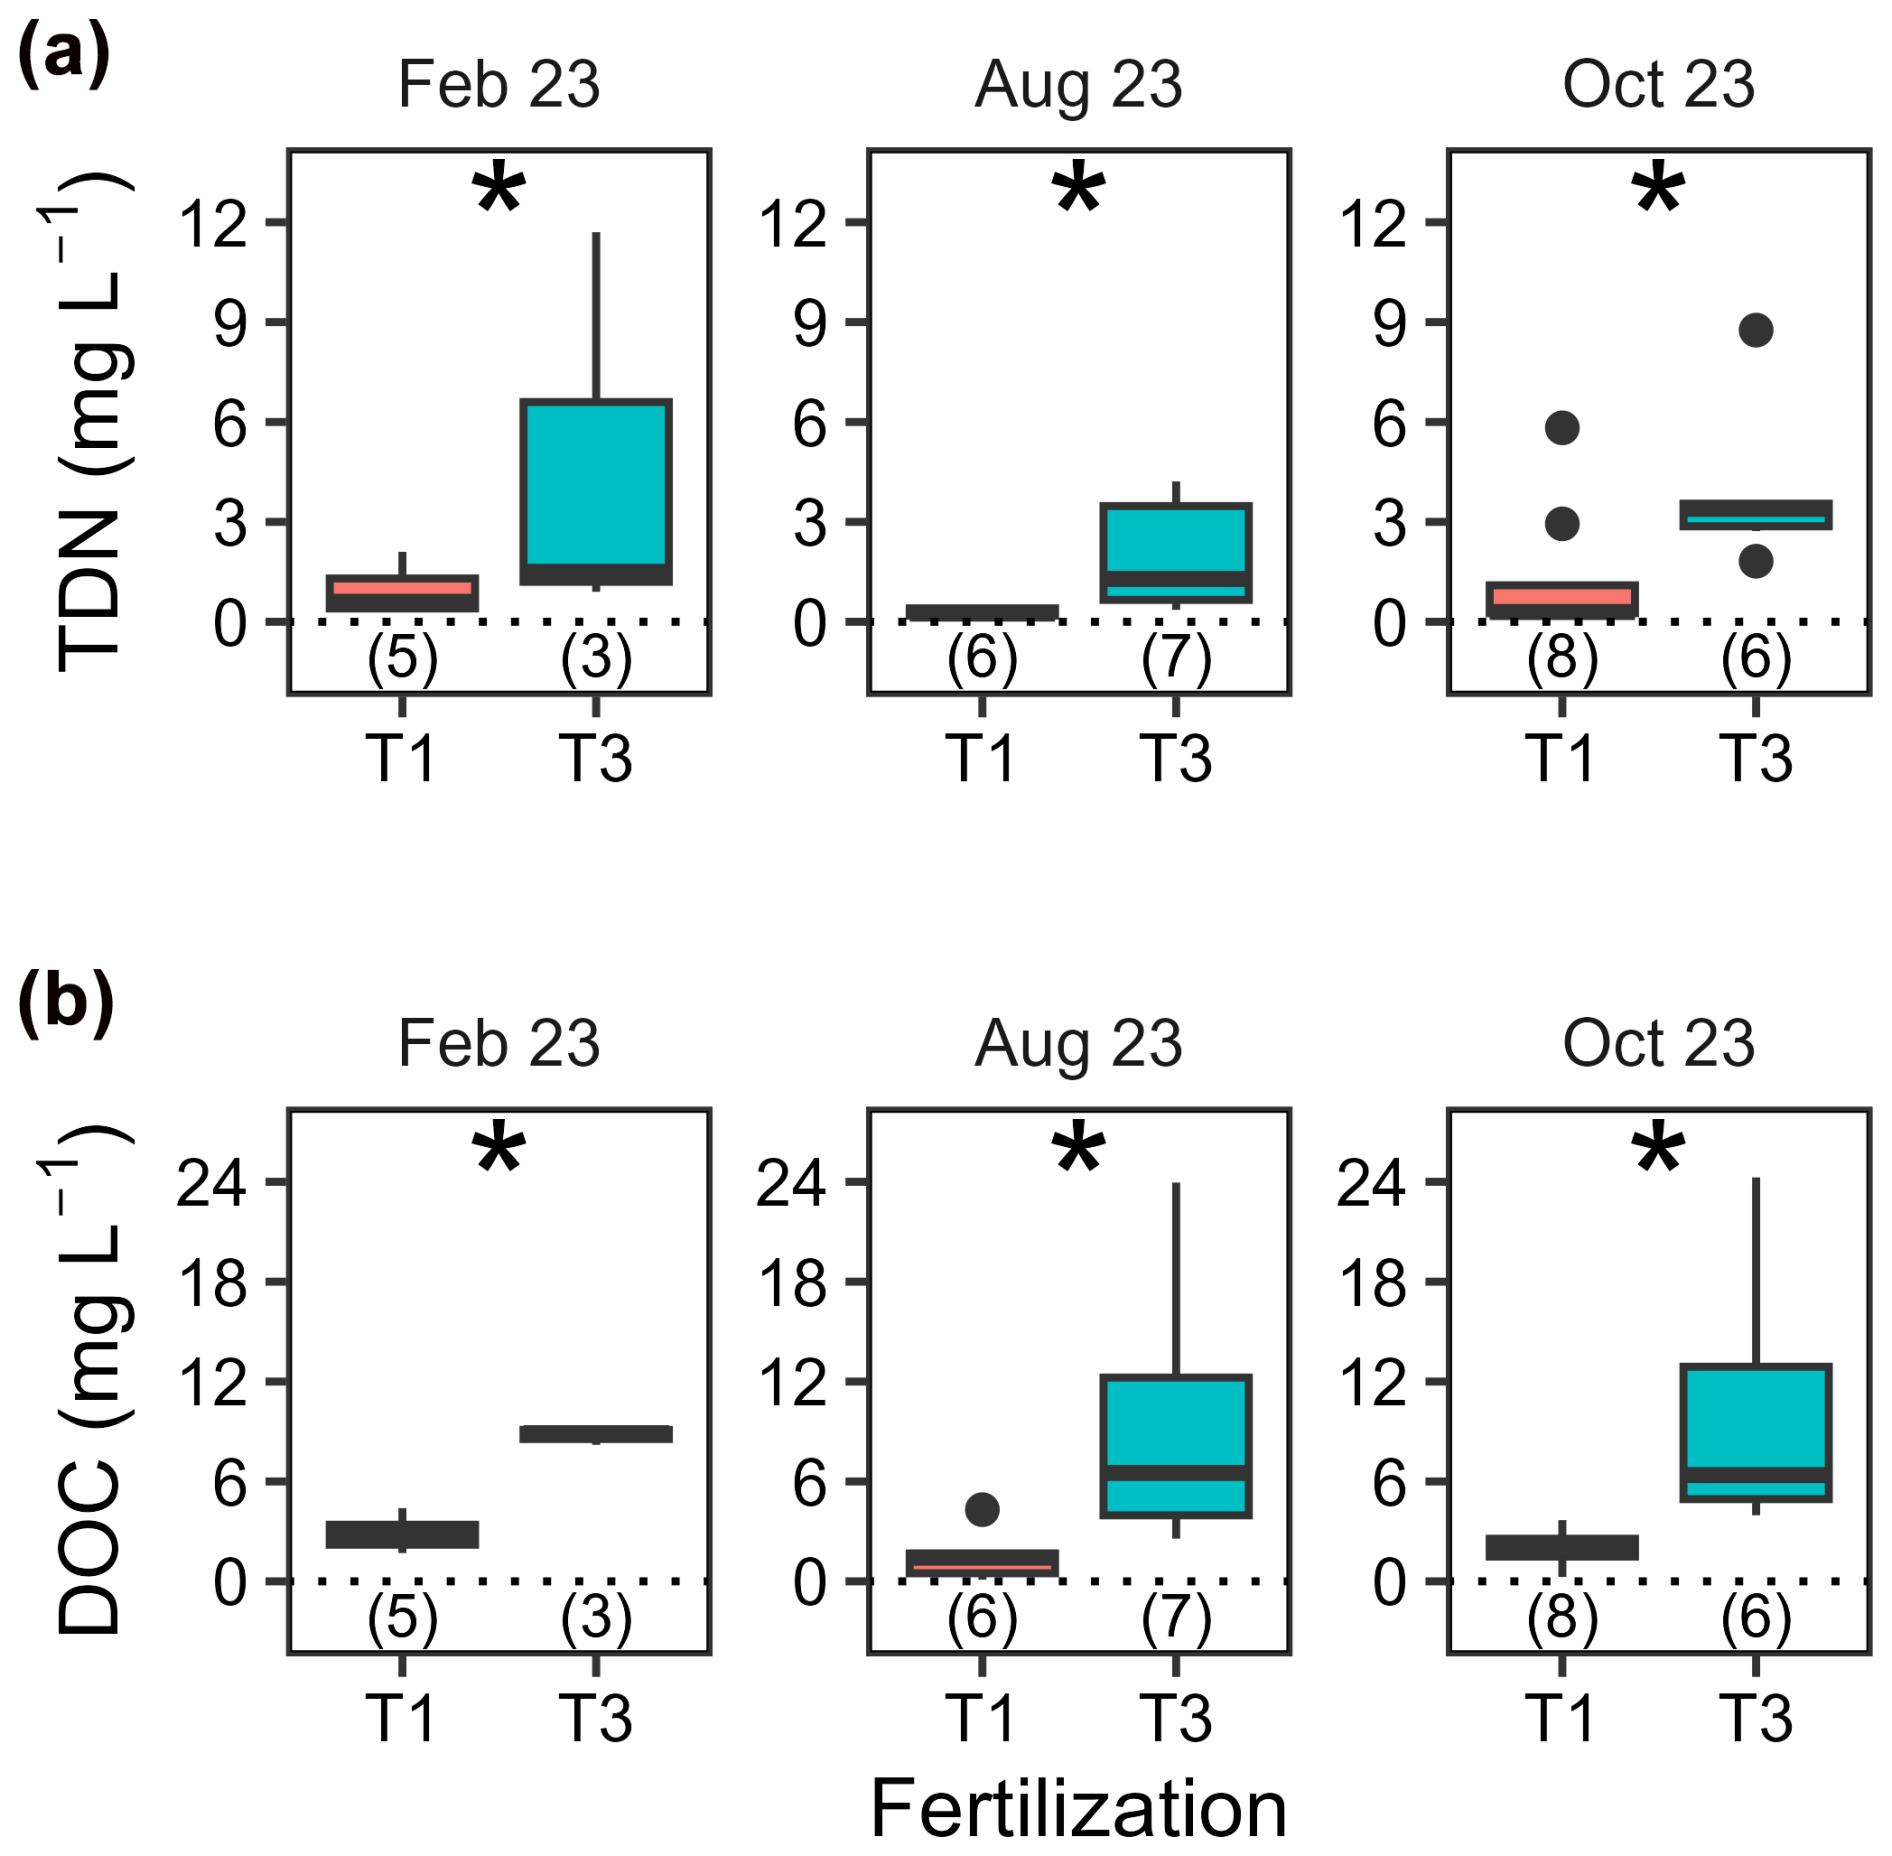
Figure 4Concentrations of total dissolved nitrogen and dissolved organic carbon in lysimeter waters. Boxplots illustrating concentrations of (a) total dissolved nitrogen (TDN) and (b) dissolved organic carbon (DOC) in lysimeter waters collected at 15 cm soil depth on three different dates. Fertilization treatments are ranked from T1 (no fertilization) and T3 and are shown in different colours. The boxes delimitate the interquartile range, the solid lines indicate the median, and the points represent outliers. The number of samples analysed varied and is indicated in parentheses below each box. Note that a minimum of five values is formally required to produce a boxplot, which was not the case for T3 in February 2023.
3.6 Trunk methane flux
Most rubber tree trunks emitted CH4 (positive ), although a few oxidized it (negative ). ranged from −0.04 to 0.93 nmol m−2 s−1, with a median of 0.05 (n= 233). For most trees, was highest near the base (40–60 cm from the ground) and decreased slightly with height along the trunk, although the differences between heights were not significant (p= 0.34).
Upscaled trunk CH4 fluxes ranged from −0.10 to 0.51 nmol s−1 per tree, with no significant fertilization effect but marked differences between measurement dates (Fig. 5 and Table A6, p= 0.91 and < 0.001, respectively). The upscaled fluxes increased substantially between August 2023 (0.044±0.008 nmol s−1 per tree, mean with SEM, n= 45) and October 2023 during the wet season (0.10±0.01, n= 33) and again between October 2023 and February 2024 during the dry season (0.19±0.01, n= 33). Out of 45 trunks, 7 were net CH4 oxidizers in August 2023, but all trunks were net CH4 emitters in subsequent measurements.
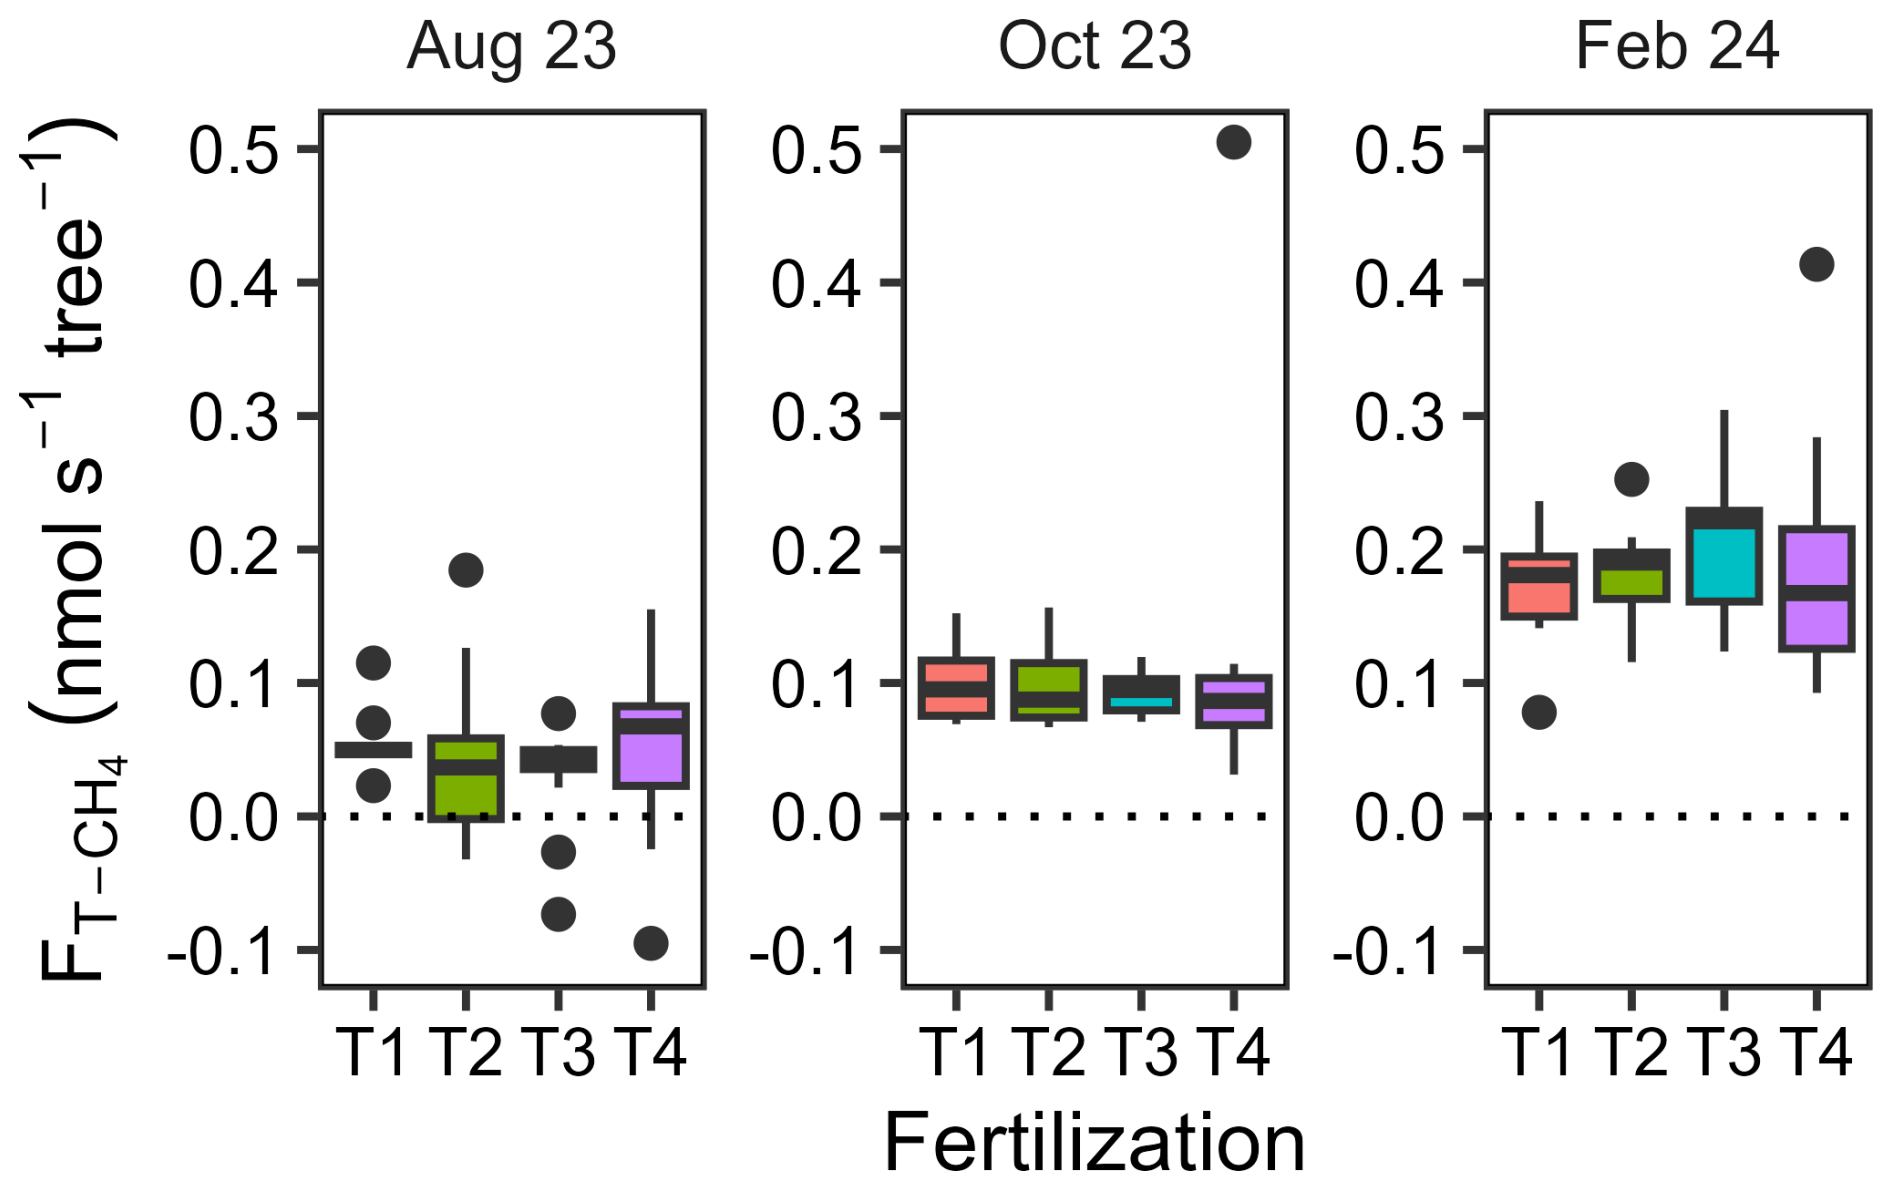
Figure 5Trunk CH4 fluxes scaled to tree levels across seasons. Boxplots illustrating trunk CH4 fluxes scaled to tree level, measured on 8 to 13 trees per treatment and on three different dates in August 2023, October 2023, and February 2024. Fertilization treatments are ranked from T1 (no fertilization) to T4 (highest fertilization level) and are shown in different colours. The boxes delimitate the interquartile range, the solid lines indicate the median, and the points represent outliers.
When was scaled by tree density to allow comparison with , both expressed on a soil surface basis, offset soil CH4 uptake by less than 0.5 % in T1 and T2 and 1.8 % in T3 in August 2023. In T4, however, trunk emissions accounted for 3.6 % of the combined net CH4 emissions from trunks and soil. In October 2023, offset soil CH4 uptake by 1.5 % in T1 and 14 % in T2 and contributed 1.6 % in T3 and 0.9 % in T4 to the combined net CH4 emissions. In February 2024,the proportion of soil CH4 uptake offset by was 1.2 %, 1.7 %, 2.4 %, and 4.4 % for T1, T2, T3, and T4, respectively.
3.7 Annual soil methane uptake
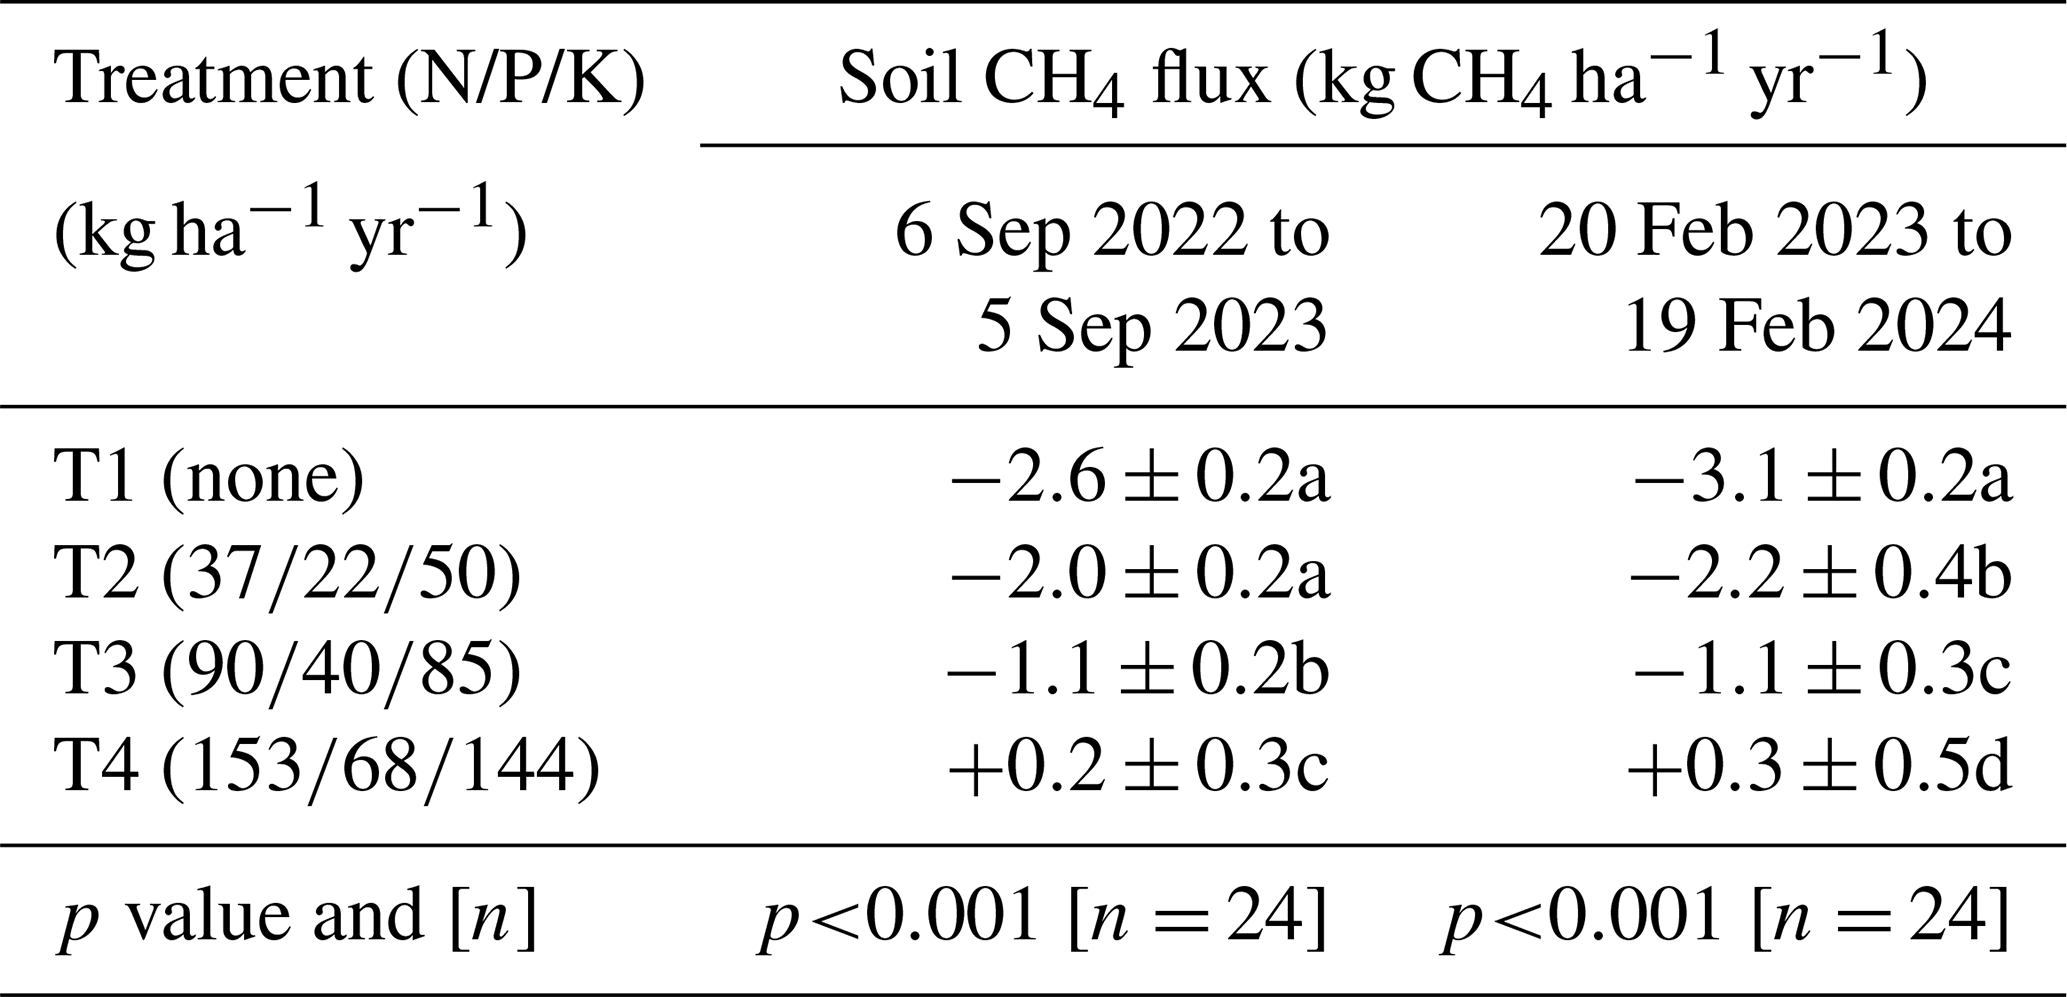
Annual soil CH4 fluxes, upscaled to the plantation level for the periods from 6 September 2022 to 5 September 2023 and from 20 February 2023 to 19 February 2024, decreased significantly with increasing levels of fertilization (p < 0.001). The differences between T1 (no fertilizer application) and T2 were moderate (Table 2). However, the soil CH4 sink in T3 was reduced by approximately 60 %, and heavy fertilizer application in T4 even transformed the soil from a net CH4 sink into a net CH4 source.
Table 2Net annual soil CH4 uptake. Cumulative annual soil CH4 fluxes measured from 6 September 2022 to 5 September 2023 and from 20 February 2023 and 19 February 2024, averaged by treatment (n= 4 blocks) with standard errors. The p values from ANOVA applied to linear mixed-effects models on rank-transformed soil fluxes are shown, along with n, the number of independent replicates per treatment. Significant differences between fertilization levels (p < 0.05) are indicated by different lowercase letters.
4.1 Fertilizer application reduces soil methane uptake
Soil CH4 fluxes measured in this study were within the range previously reported for mature rubber plantations in Southeast Asia (Sumatra, Yunnan). These studies reported daily averages ranging from −0.71 to 1.13 nmol m−2 s−1 and annual fluxes between −3.1 and −0.2 kg CH4 ha−1 yr−1 (Aini et al., 2020; Ishizuka et al., 2002, 2005; Lang et al., 2017, 2019; Werner et al., 2006; Zhou et al., 2021). These broad ranges likely reflect differences in edaphic factors across sites – such as soil texture, porosity, and infiltrability – which influence gas diffusion and soil moisture, and thereby affect CH4 consumption and production. However, based on our results, variability in fertilizer application could also explained some of these differences, as not all plantations in earlier studies were fertilized.
Seasonal variations in were closely linked to changes in AFP. Low AFP restricts gas diffusion from the atmosphere into the soil, limiting the availability of O2 and CH4 for methanotrophic bacteria (Hu et al., 2023; Kruse et al., 1996). In our study, differences in between fertilization treatments were not driven by differences in AFP, which might have resulted from differences in tree water use (Qiu et al., 2024). Instead, they were clearly related to the rate of fertilizer applications.
The vertical profile of [CH4]S indicated that CH4 oxidation occurred throughout the soil profile, at least down to a depth of 40 cm. Negative concentration gradients between 10 and 40 cm depth were observed across all seasons and treatments. Contrary to previous suggestions (Wang and Ineson, 2003), high concentrations of inorganic nitrogen in the topsoil of fertilized plots did not displace CH4 oxidation to deeper layers. Instead, fertilizer application inhibited CH4 oxidation in the topsoil when AFP was high. This was evident from the lower [CH4]S measured at 10 cm depth in T1 and T2 compared to T3 and T4 in August 2023 and February 2024.
4.2 Effects of fertilizer on methane oxidation
Previous studies examining the effects of nitrogen fertilizer applications on CH4 consumption in forest soils have reported contradictory results. Some studies reported reduced CH4 oxidation in response to nitrogen addition (Castro et al., 1994; Chan et al., 2005; Jassal et al., 2011; Steudler et al., 1989; Zhang et al., 2008), while others reported stimulation, suggesting that nitrogen-limited methanotrophic activity could benefit from fertilizer application (Börjesson and Nohrstedt, 2000; Hassler et al., 2015; Martinson et al., 2021; Papen et al., 2001; Qiu et al., 2024; Veldkamp et al., 2013). Therefore, nitrogen can potentially inhibit or stimulate CH4 consumption in soils (Bodelier and Laanbroek, 2004). In our experimental plantation, ex situ soil incubations showed that fertilization suppressed soil CH4 oxidation potentials throughout the soil profile, at least down to 60 cm depth (Murase et al., 2025). We did not observe the biphasic dose–response relationship often reported, where low nitrogen inputs stimulate soil CH4 uptake and higher doses inhibit it (Aronson and Helliker, 2010; Cen et al., 2024). In our study, even low fertilizer application rates (T2) failed to stimulate CH4 uptake, suggesting that the soil may already have been nitrogen-saturated. The long-term application of fertilizers (8 years at our site) may have increased the sensitivity of the soil methanotrophic communities to nitrogen addition (Aronson and Helliker, 2010). The response factor of soil CH4 flux to nitrogen input, calculated as the ratio of the difference in CH4 flux between each fertilized treatment and T1 to the annual nitrogen input, was 0.02 kg CH4 kg N−1 across all treatments. This value aligns with those reported for nitrogen-saturated forest soils under high nitrogen inputs (Cen et al., 2024) and is consistent with the previous land use (coconut plantation) and the applied fertilization levels. Furthermore, increased nitrogen input via litter decomposition may contribute to reduced CH4 uptake, as has been suggested for tropical forest soils (Gao et al., 2022).
While the accumulation of NH in resin bags, particularly in T3 and T4 after fertilization, suggests it may contribute to inhibition, the consistent accumulation of NO at all deployment dates indicates that NO toxicity could also play a significant role (Mochizuki et al., 2012; Reay and Nedwell, 2004; Wang and Ineson, 2003). This effect can be exacerbated if NO is reduced to NO in anaerobic microsites. Additionally, the decrease in soil pH observed from T1 to T4 with increased nitrogen addition is therefore another factor known to inhibit soil CH4 oxidation (Benstead and King, 2001). Although methanotrophs can occur in both acidic and alkaline habitats, they usually grow better at neutral pH (Chowdhury and Dick, 2013; Hanson and Hanson, 1996; Whittenbury et al., 1970; Yao et al., 2023). Liming agricultural soils to raise their pH is known to stimulate soil CH4 oxidation (Abalos et al., 2020; Fonseca de Souza et al., 2025). Large concentrations of PO also accumulated in resin bags across all dates and fertilized treatments. However, the mechanisms underlying the interaction between phosphorus and nitrogen and its effects on CH4 oxidation have remained poorly understood (Veraart et al., 2015; Zheng et al., 2016).
4.3 Fertilizer application increase soil methane production
Our study revealed that CH4 production occurred in the soil, particularly during the wet season, as indicated by positive values and soil CH4 mole fraction ([CH4]S) exceeding those of ambient air. Therefore, reflected the net balance between CH4 production and CH4 consumption. More frequent and intense soil CH4 emissions, along with higher soil CH4 mole fractions in the fertilized treatments – particularly in T3 and T4 – suggest that fertilizer application not only suppressed methanotrophic activity but also stimulated methanogenesis, as recently observed in an irrigated and fertilized sapling plantation on a lowland soil (Rabbai et al., 2024), despite concurrent soil acidification. Like methanotrophs, methanogens typically grow better at neutral pH, and methanogenesis has been shown to be limited under low pH conditions in anoxic sediments (Garcia et al., 2000; Phelps and Zeikus, 1984). Our findings contrast with previous studies that reported decreased methanogenesis following either NO addition to rice paddy soils and wetland sediments (Kim et al., 2015; Roy and Conrad, 1999) or lowering soil pH of peatland and rice paddy soils (Wang et al., 1993; Ye et al., 2012). However, our results are consistent with a recent finding showing that combined nitrogen and phosphorus amendments increased CH4 production in incubated soils from boreal peatland (Byun et al., 2025).
Banger et al. (2012) suggested that nitrogen fertilizers may stimulate CH4 production both by alleviating nitrogen limitation to methanogens and by increasing crop growth, thereby enhancing the availability of carbon substrates for methanogenesis. In addition to anaerobic conditions, methanogenesis actually requires organic substrates derived from root exudates, buried litter fragments, or litter leachates – all products of plant photosynthesis (Bertora et al., 2018; Lu and Conrad, 2005; Minoda et al., 1996; Minoda and Kimura, 1994; Whiting and Chanton, 1993). CH4 production potential has been linked to DOC concentration in wetland soils (Liu et al., 2011). The higher DOC concentrations observed in lysimeter water at 15 cm depth in T3 compared to T1 align with higher CH4 production in T3 compared to T1. The cause of the elevated DOC concentration remained unclear, but phosphorus has been shown to enhance fine root biomass in P-limited tropical secondary forests and tree plantations, potentially increasing root exudation (Zheng et al., 2016; Zhu et al., 2013). Furthermore, trees in T3 and T4 produced litter with higher nitrogen content, which likely decomposes more rapidly, especially if nitrogen addition stimulates microbial mineralization (Cornwell et al., 2008; Hobbie, 2005; Melillo et al., 1982).
Interestingly, net CH4 production mainly occurred in the top soil layer in our study. When soil CH4 concentrations exceeded ambient level, they were consistently higher at 10 cm than at 40 cm depth. Methanogenesis requires anaerobic conditions, typically found in water-saturated soils (Epron et al., 2016; Smith et al., 2003). However, except for brief periods following heavy rainfall, the soil was not flooded, and the AFP of the top soil layer remained above 0.1. This suggests the presence of anaerobic microsites in the topsoil, where O2 consumption by root and microbial respiration outpaces the diffusive flux of O2 from the atmosphere. Such microsites are commonly found in otherwise oxic soils (Lacroix et al., 2023; Sexstone et al., 1985; Smith et al., 2003; Teh et al., 2005). Using an isotope-based pool dilution technique, von Fischer and Hedin (2007) demonstrated that small diversions of organic carbon flow from non-methanogenic to methanogenic pathways, likely occurring in anaerobic microsites, can transform soil cores from a net CH4 sink into a net CH4 source. Higher methanogenic activity and greater abundance of Archaea were found in soil cores containing larger amounts of fresh organic matter compared to those with lower amounts when anaerobically incubated (Wachinger et al., 2000). The transient nature of positive values and the lack of synchronicity between collars likely reflect the dynamic nature of these microsites, which are driven by small-scale spatial and temporal variations in soil O2 supply and demand (Lacroix et al., 2023). Variations of O2 demand could arise from microbial respiration, potentially driven by soil invertebrates, such as leaf-cutting ants and earthworms, which bury plant debris or organic matter (Caiafa et al., 2023; Kammann et al., 2009; Mehring et al., 2021). Termite colonies or Scarabaeidae larvae might also contribute to localized hotspots of CH4 production (Hackstein and Stumm, 1994; Räsänen et al., 2023; Rasmussen and Khalil, 1983). Although we did not investigate soil invertebrates in this study, termite mounds and ant nests were present in the plantation. Future research should explore the long-term impacts of fertilization on all soil microbial and invertebrate communities, not only methanotrophs and methanogens.
4.4 The CH4 emitted by the rubber tree trunks is probably of internal origin
Rubber trees at our site emitted CH4, which could either be transported from the soil or produced internally by methanogenic archaea (Barba et al., 2019b; Covey and Megonigal, 2019). Interestingly, while soil CH4 emissions and elevated soil CH4 mole fractions were primarily observed during the wet season, the highest emissions from tree trunks occurred in February, during the dry season. Additionally, trunk CH4 emissions did not differ significantly between fertilization treatments, despite higher CH4 production in the soils of heavily fertilized plots (T3 and T4). These findings suggest that CH4 emitted by rubber trees, despite a slight decreasing trend with height along the trunk, may have been produced internally rather than transported from the soil.
Trunk CH4 emissions are commonly observed in large trees and positively correlated with trunk diameter when CH4 production occurred in the heartwood (Epron et al., 2023; Pitz et al., 2018; Wang et al., 2017). This is because the anoxic conditions required for methanogenesis are more likely to develop as the length of the O2 diffusion path increases or when water begins to accumulate in the heartwood (wetwood). With tree ageing, the onset of heartwood decay can provide substrates for methanogens, further facilitating CH4 production (Epron and Mochidome, 2024).
In our study area, rubber trees are tapped for latex collection annually from May to late February. Previous studies have shown that the respiration rate of inner bark tissue in rubber trees increases after tapping resumes and decreases during the resting period (Annamalainathan et al., 2001). Trunk CH4 emissions were lowest in August (3 months after tapping resumed), intermediate in October (5 months after), and highest in February (9 months after). Although this temporal pattern could be coincidental, it is possible that the intense physiological activity associated with latex regeneration in the inner bark consumes substantial amounts of O2, reducing the quantity available for diffusion into the trunk. This reduction in O2 could create localized anoxic conditions, facilitating CH4 production in the wood.
4.5 Implications for the greenhouse gas budget of the agriculture, forestry, and other land use sector
Our study provides new insights into the dual effects of fertilization on CH4 dynamics in rubber plantations, demonstrating that it can simultaneously reduce CH4 uptake and increase CH4 emission. We acknowledge the potential biases associated with interpolating biweekly manual soil flux measurements, particularly given the possibility of high short-term temporal variability. Automated measurements would have been valuable for capturing flux dynamics at finer temporal scales (Barba et al., 2019a; Gana et al., 2018). However, implementing such a system would have been challenging in our experimental plantation, which included four blocks and four fertilizer treatments spread over a 9 ha area, with large distances between chambers and the gas analyser. Despite these limitations, our findings provide indicative estimates that advance our understanding of the complex interactions between land management practices and greenhouse gas fluxes in tropical agricultural systems. In the agriculture, forestry, and other land use (AFOLU) sector, only positive CH4 fluxes are typically reported as greenhouse gas emissions. Negative CH4 emissions (atmospheric CH4 removal) are not accounted for. However, the loss of soil CH4 oxidation potential caused by agricultural practice is equally important. Conversely, practices that preserve or enhance soil CH4 uptake could serve as effective mitigation strategies.
Given that T3 represents the recommended fertilizer application rate for mature rubber plantations in Thailand, as advised by Thai public institutions, and that 40 % of rubber farmers exceed this recommendation, as represented by T4 (Chambon et al., 2018), the net CH4 uptake by soils of rubber plantations in Thailand is estimated at approximately −0.6 kg CH4 ha−1 yr−1 (based on Table 2). Reducing fertilization to the levels applied in T2 (rational fertilization) could increase the net CH4 sink by a factor of 3.5, reaching 2.1 kg CH4 ha−1 yr−1. With rubber plantations covering 39 000 km2 in Thailand in 2021 (IRSG, 2023), such a reduction in fertilizer application could enhance the net soil CH4 sink by approximately 5.9 Gg CH4 yr−1. This corresponds to more than 0.5 Tg CO yr−1, given the high 20-year global warming potential (GWP) of CH4, which is more than 80 times that of CO2 (IPCC, 2021). If all else is equal, the mitigation potential for the whole Southeast Asia would be 4 times higher than that estimated for Thailand, since rubber plantations in Thailand represent only 25 % of the area under rubber cultivation in all of Southeast Asia. There are, however, limitations to this scaling-up estimate. For instance, this study was conducted at a single site, and the response of soil CH4 efflux to fertilizer application may vary across the different physiographic regions of Thailand due to differences in climatic and edaphic conditions (Rabbai et al., 2024). Specifically, the documented response for the sandy-textured soil at our site may differ from those for soils with higher clay contents, which are expected to exhibit more reductive microsites, or from those of drained peatland. However, to our knowledge, this experimental site is the only one in Thailand – and possibly in all of Southeast Asia – actively testing different fertilization levels on mature rubber plantations. Therefore, the estimated potential of atmospheric methane removal remains speculative and should be considered a first approximation to encourage further research in this direction.
Reducing fertilization in rubber plantation is thus an effective mechanism for atmospheric CH4 removal. Our results nevertheless suggest that its potential to offset greenhouse gas emission from other agricultural activities in Southeast Asia, such as rice cultivation – the primary contributor to greenhouse gas emissions from the agriculture sector, with 30 Tg CO yr−1 in Thailand (Saiyasitpanich et al., 2024) – is limited. However, Tang et al. (2024) have recently documented the stimulation of CH4 emissions from rice fields by nitrogen fertilization at the global scale. Applying rational fertilization practices to other tree plantations and cropping systems worldwide could thus contribute to curb the increase in atmospheric CH4 concentration. However, to convince policy makers, local authorities, and producers that implementing rational fertilization practices is a credible pathway to enhance atmospheric CH4 removal, it is essential to ensure that such practices do not compromise yields and stakeholder's incomes. This was the case for the rubber plantation at our site (Table A7) but remained to be confirmed for rubber plantations in other pedoclimatic contexts and for other agricultural land uses.
The rapid expansion of rubber cultivation, driven by the demand for natural rubber in the tire industry, constitutes a significant land-use change in Southeast Asia. Despite fertilization been a common practice in rubber plantations, its impact on soil methane (CH4) dynamics has remained poorly understood. Our study demonstrates that fertilization not only reduces soil CH4 consumption but also increases CH4 production, transforming rubber plantations from a net CH4 sink into a source. Implementing rational fertilization practices could enhance atmospheric CH4 removal. However, its overall impact on greenhouse gas emissions from the agricultural sector in Southeast Asia would remain modest, unless it is extended to other tree plantations and cropping systems. Moreover, to fully understand the impact of reduced fertilizer applications on greenhouse gas budgets, further research should also evaluate possible reductions in nitrous oxide (N2O) emissions from soil, as N2O is another potent greenhouse gas. The scalability of mitigation strategies should also be assessed under varying climatic and management conditions.
Table A1Soil CH4 fluxes (Fig. 1d). Summary of linear mixed models (LMMs) analysing the effects of fertilization, measurement dates, and their interactions (fixed effects) on rank-transformed soil CH4 fluxes (), soil temperature (TSOIL), soil water content (SWC), and air-filled porosity (AFP). Collar identifier was included as random effects.
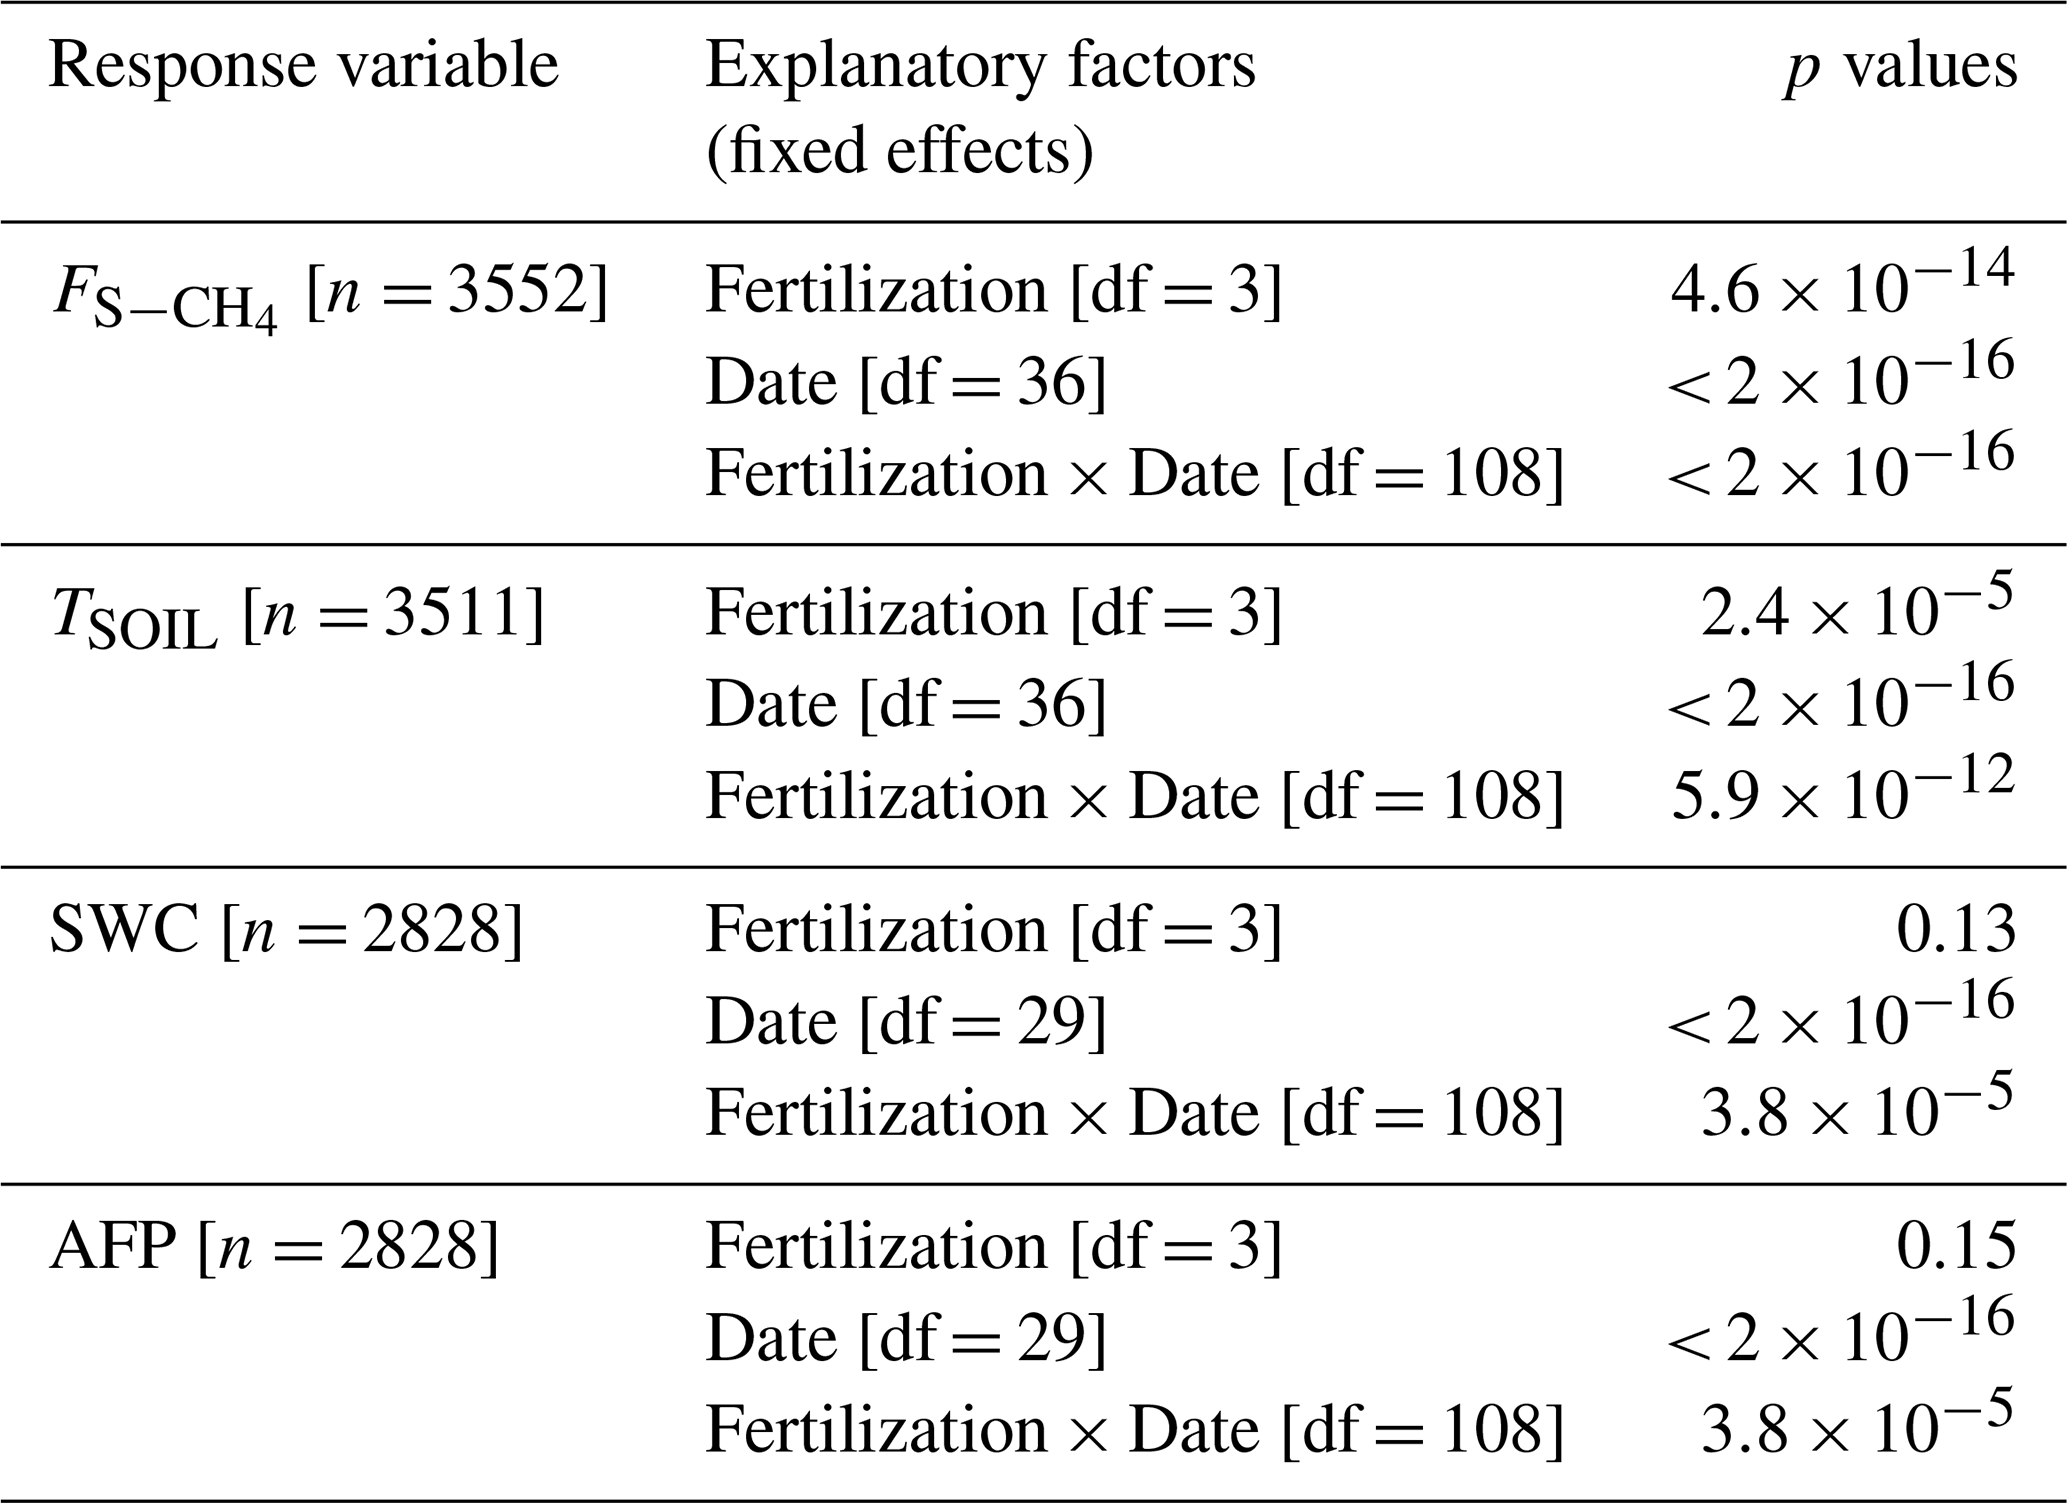
Table A2Relationships between soil CH4 fluxes and air-filled porosity (Fig. 1e). Summary of linear mixed models (LMMs) analysing the effect of air-filled porosity (AFP) on soil CH4 fluxes (), with fertilization treatment included as random intercept. Marginal () and conditional () coefficients of determination are reported in the final columns.
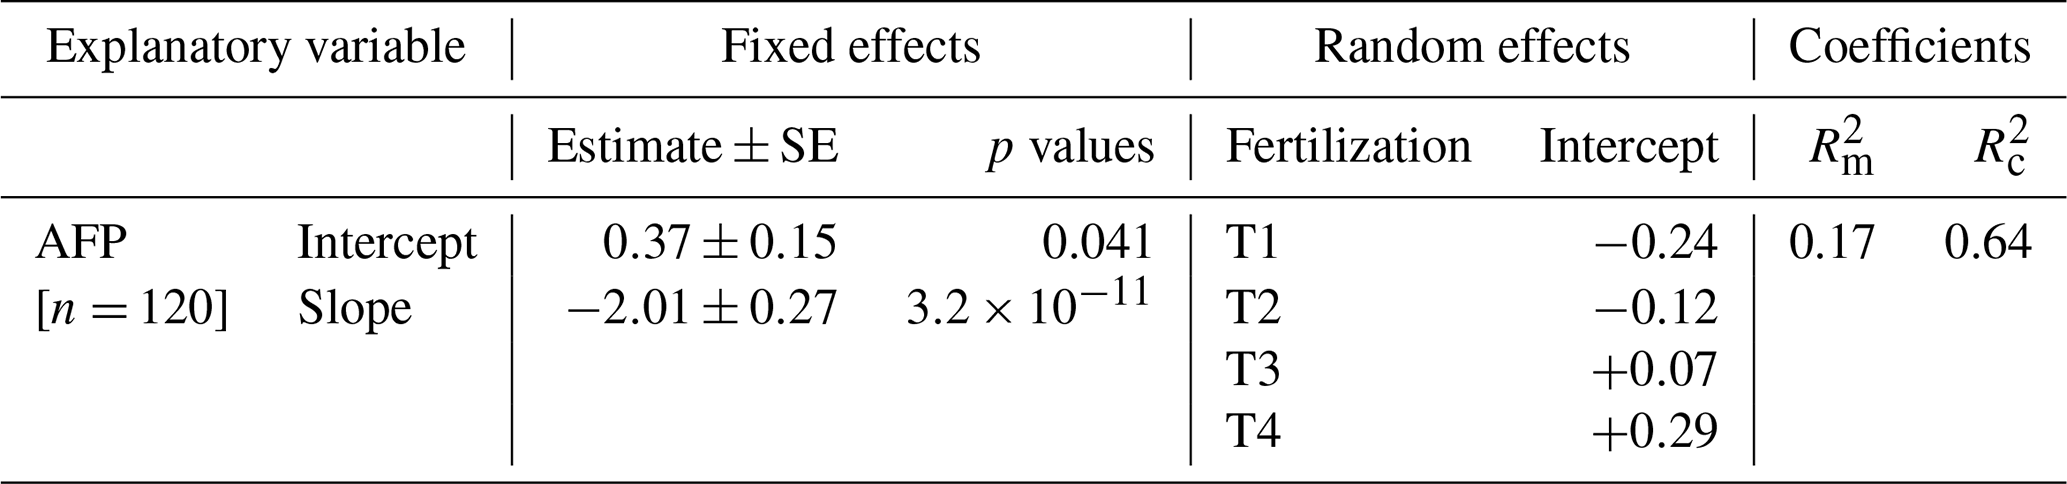
Table A3Soil CH4 molar fractions and gradient in soil CH4 molar fractions (Fig. 2). Summary of linear mixed models (LMMs) analysing the effects of fertilization, measurement dates, and their interactions on rank-transformed soil CH4 molar fractions [CH4] and gradient in soil CH4 molar fractions (ΔCH4) at 10 and 40 cm depths. Collar identifier was included as random effects.
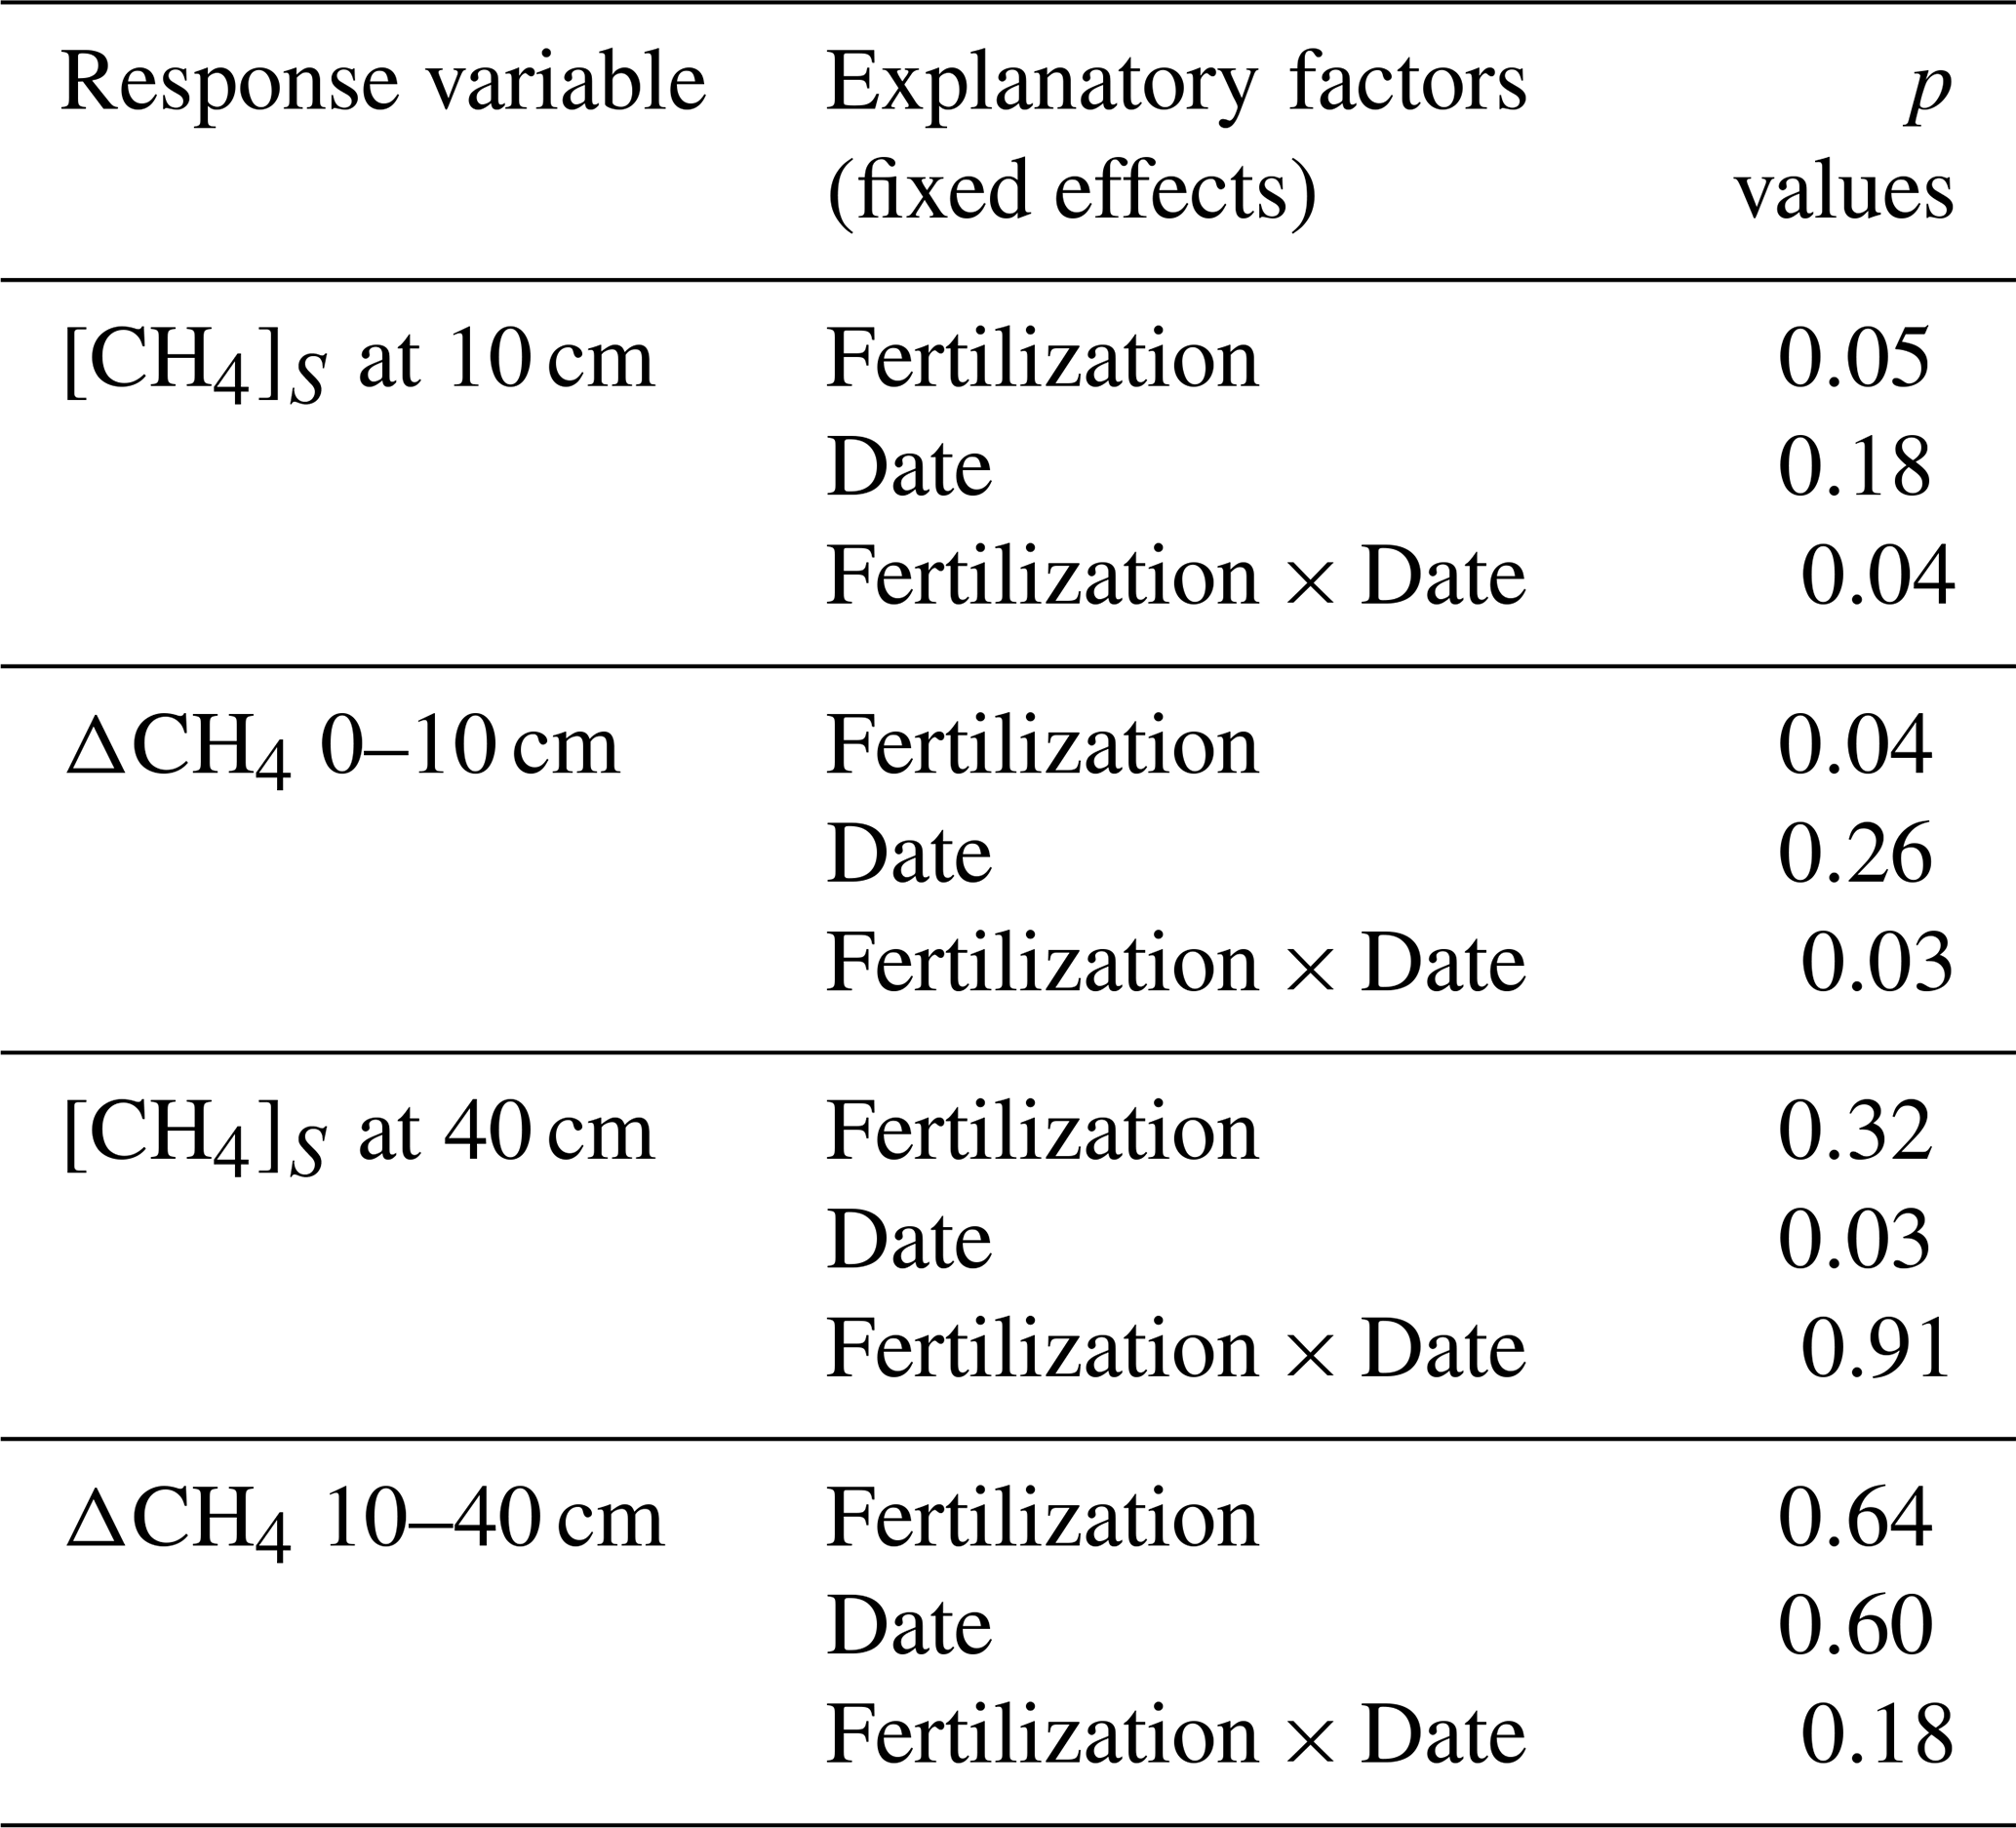
Table A4Mineral nitrogen and phosphate concentrations in resin bags (Fig. 3). Summary of linear mixed models (LMMs) analysing the effects of fertilization, measurement dates, and their interactions (fixed effects) on rank-transformed NH, NO, and PO concentrations accumulated in resin bags. Location identifier was included as random effects.
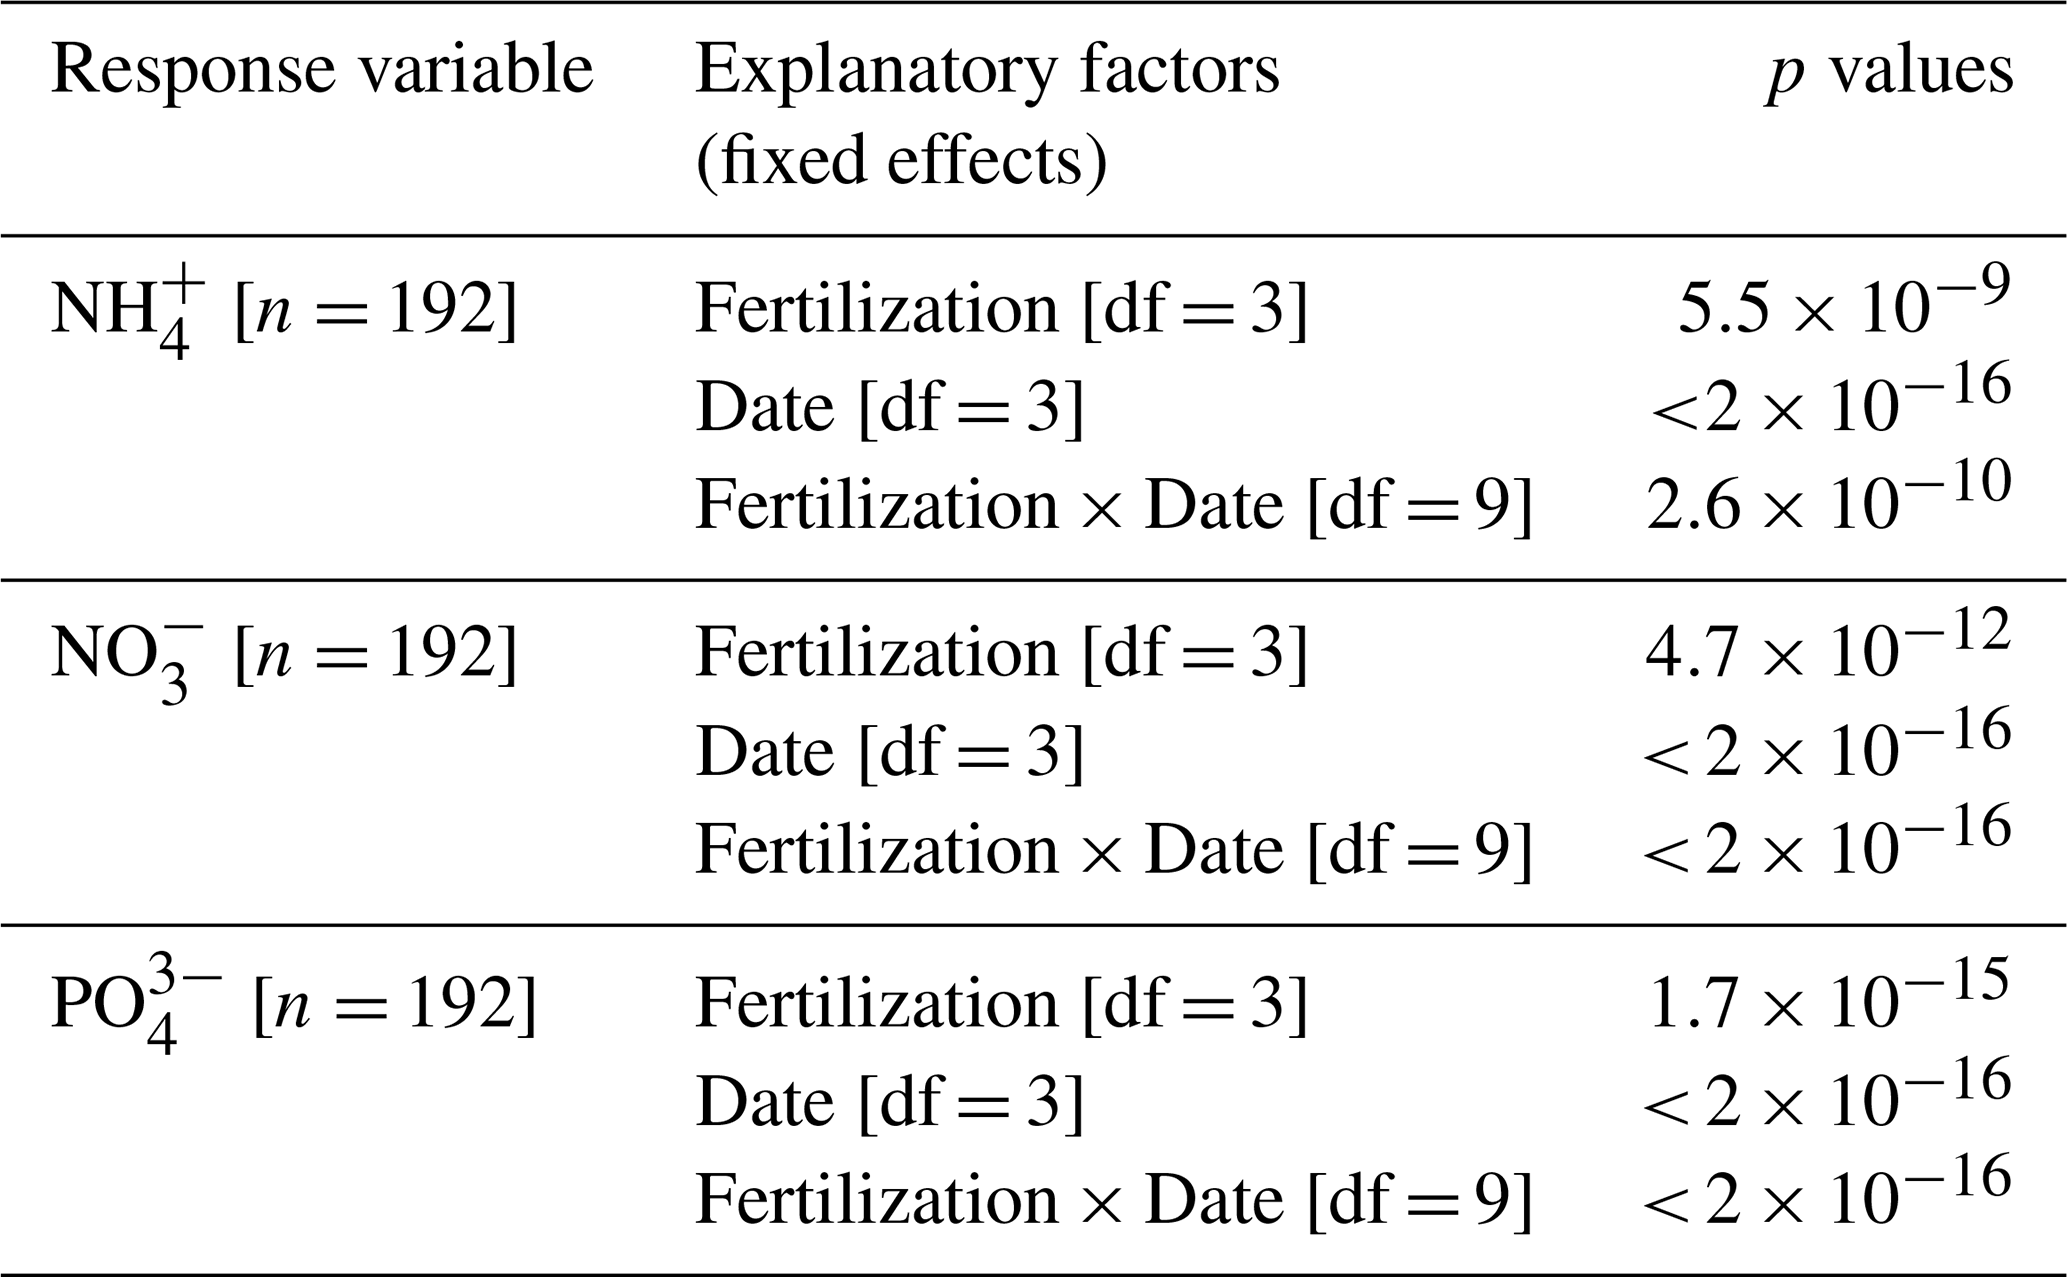
Table A5Concentrations of total dissolved nitrogen and dissolved organic carbon in lysimeter waters (Fig. 4). Summary of linear mixed models (LMMs) analysing the effects of fertilization, measurement dates, and their interactions (fixed effects) on rank-transformed total dissolved nitrogen (TDN) and dissolved organic carbon (DOC) concentrations in lysimeter water. Location identifier was included as random effect.
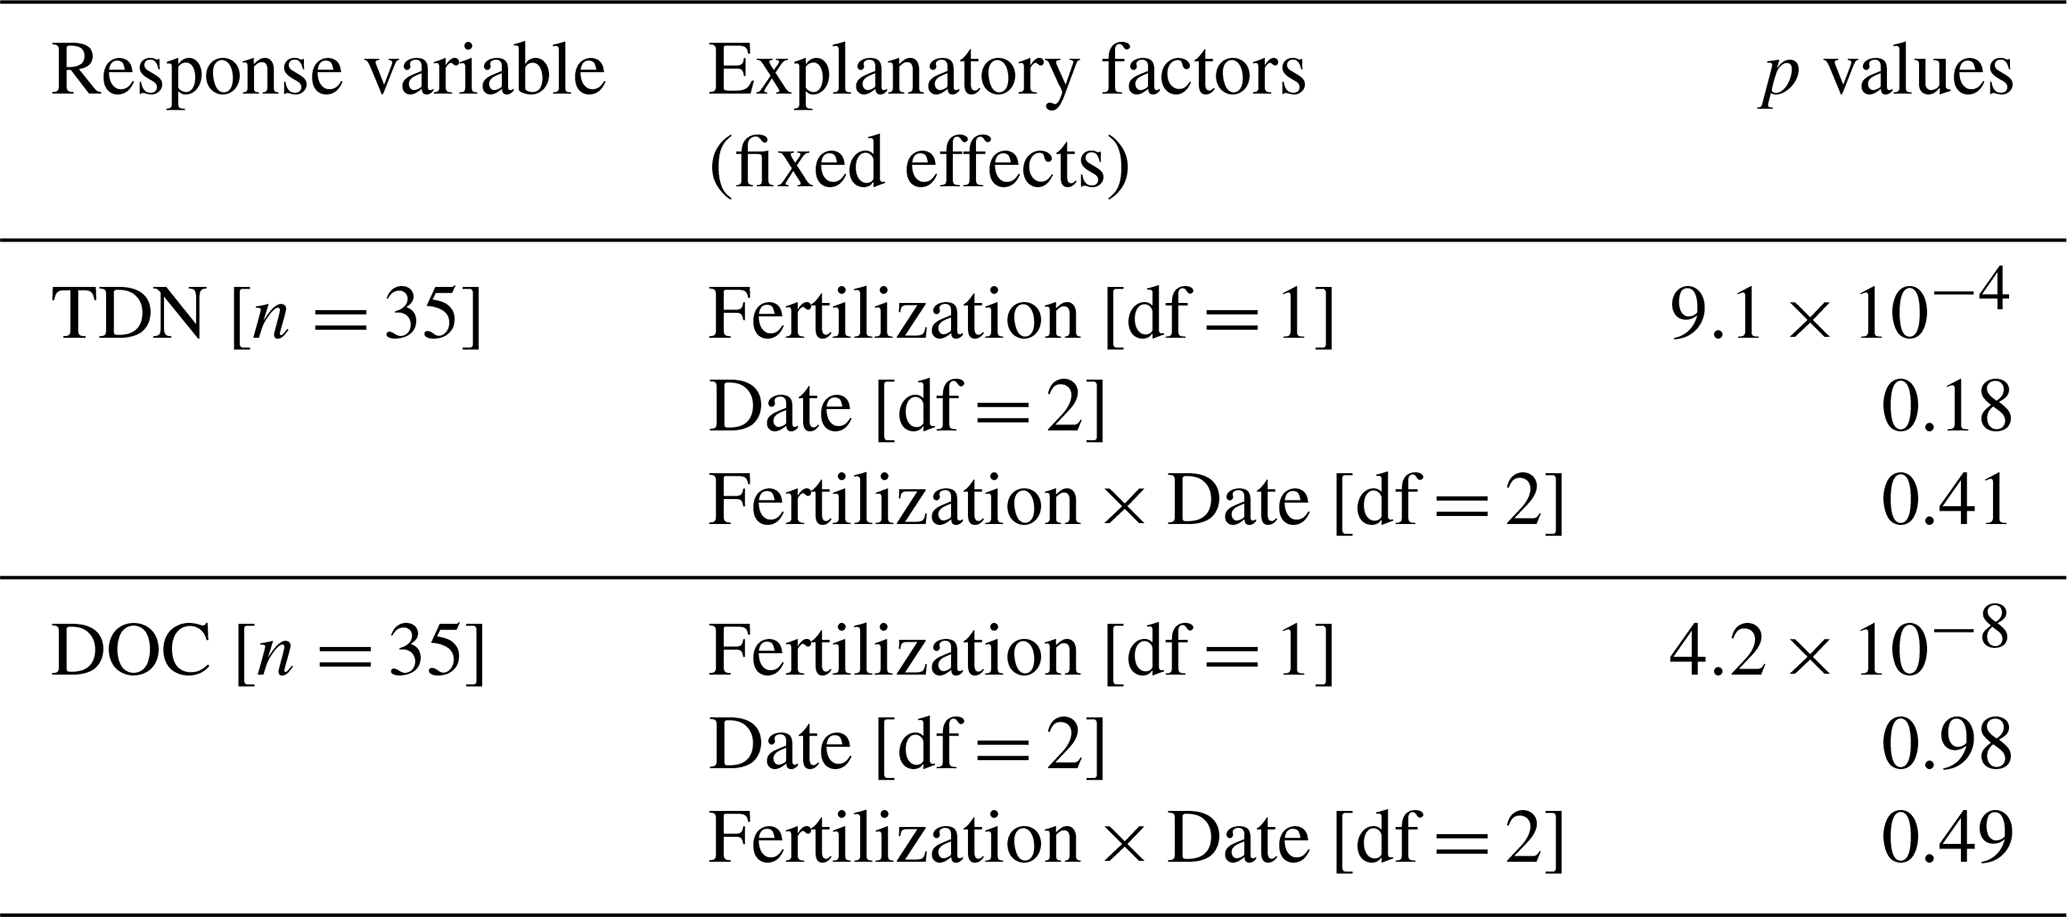
Table A6Trunk CH4 fluxes scaled to tree levels across seasons (Fig. 5). Summary of linear mixed models (LMMs) analysing the effects of fertilization, measurement dates, and their interaction (fixed effects) on rank-transformed trunk CH4 fluxes (). Block was included as random effect.
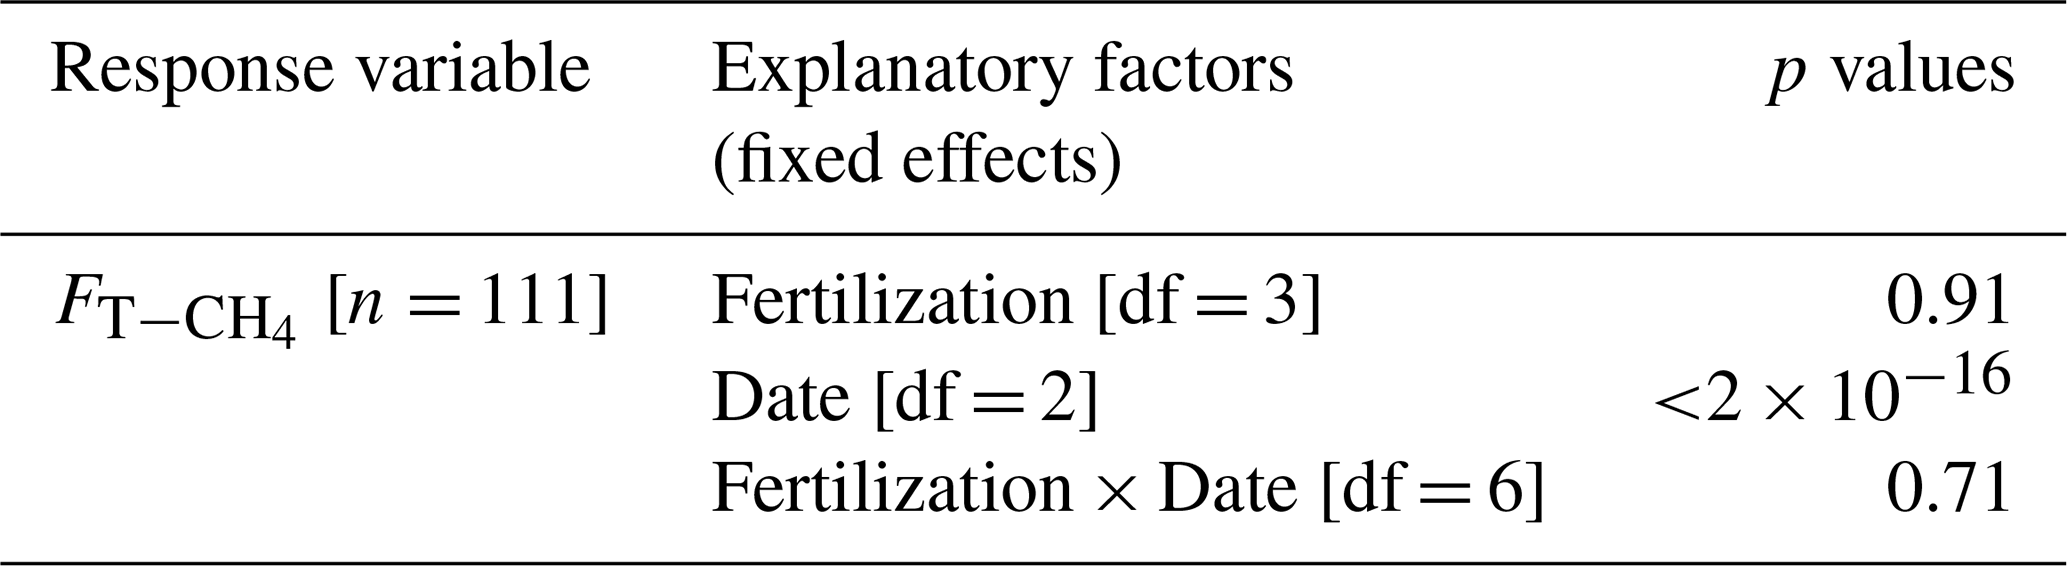
Table A7Effect of the fertilization on the cumulative dry latex yield over 10 years after the beginning of tapping (May 2014–February 2024) expressed in kg per tree. Values are averaged by treatment and presented with standard error. The p value is from ANOVA applied to a linear model.
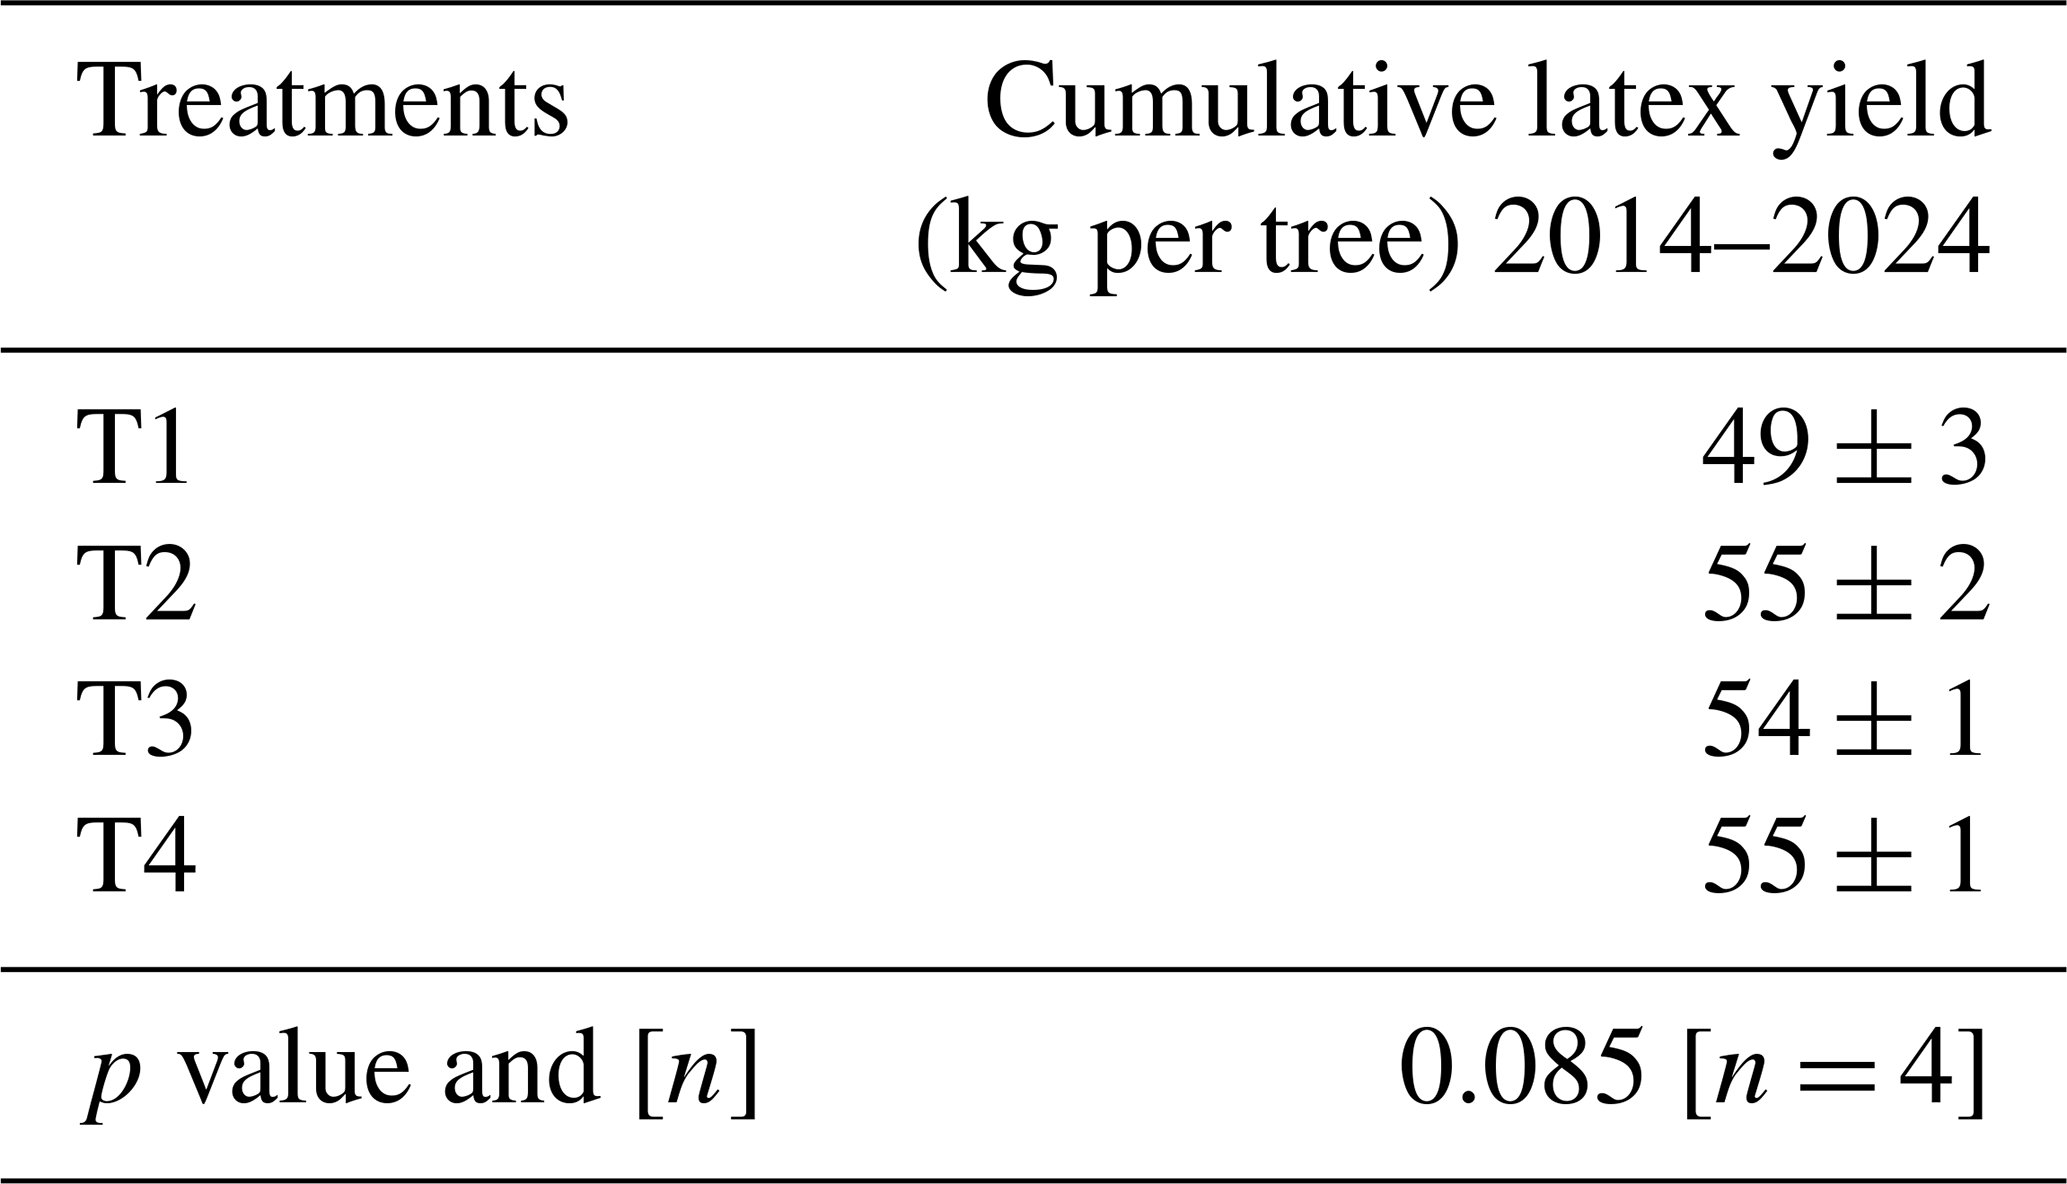
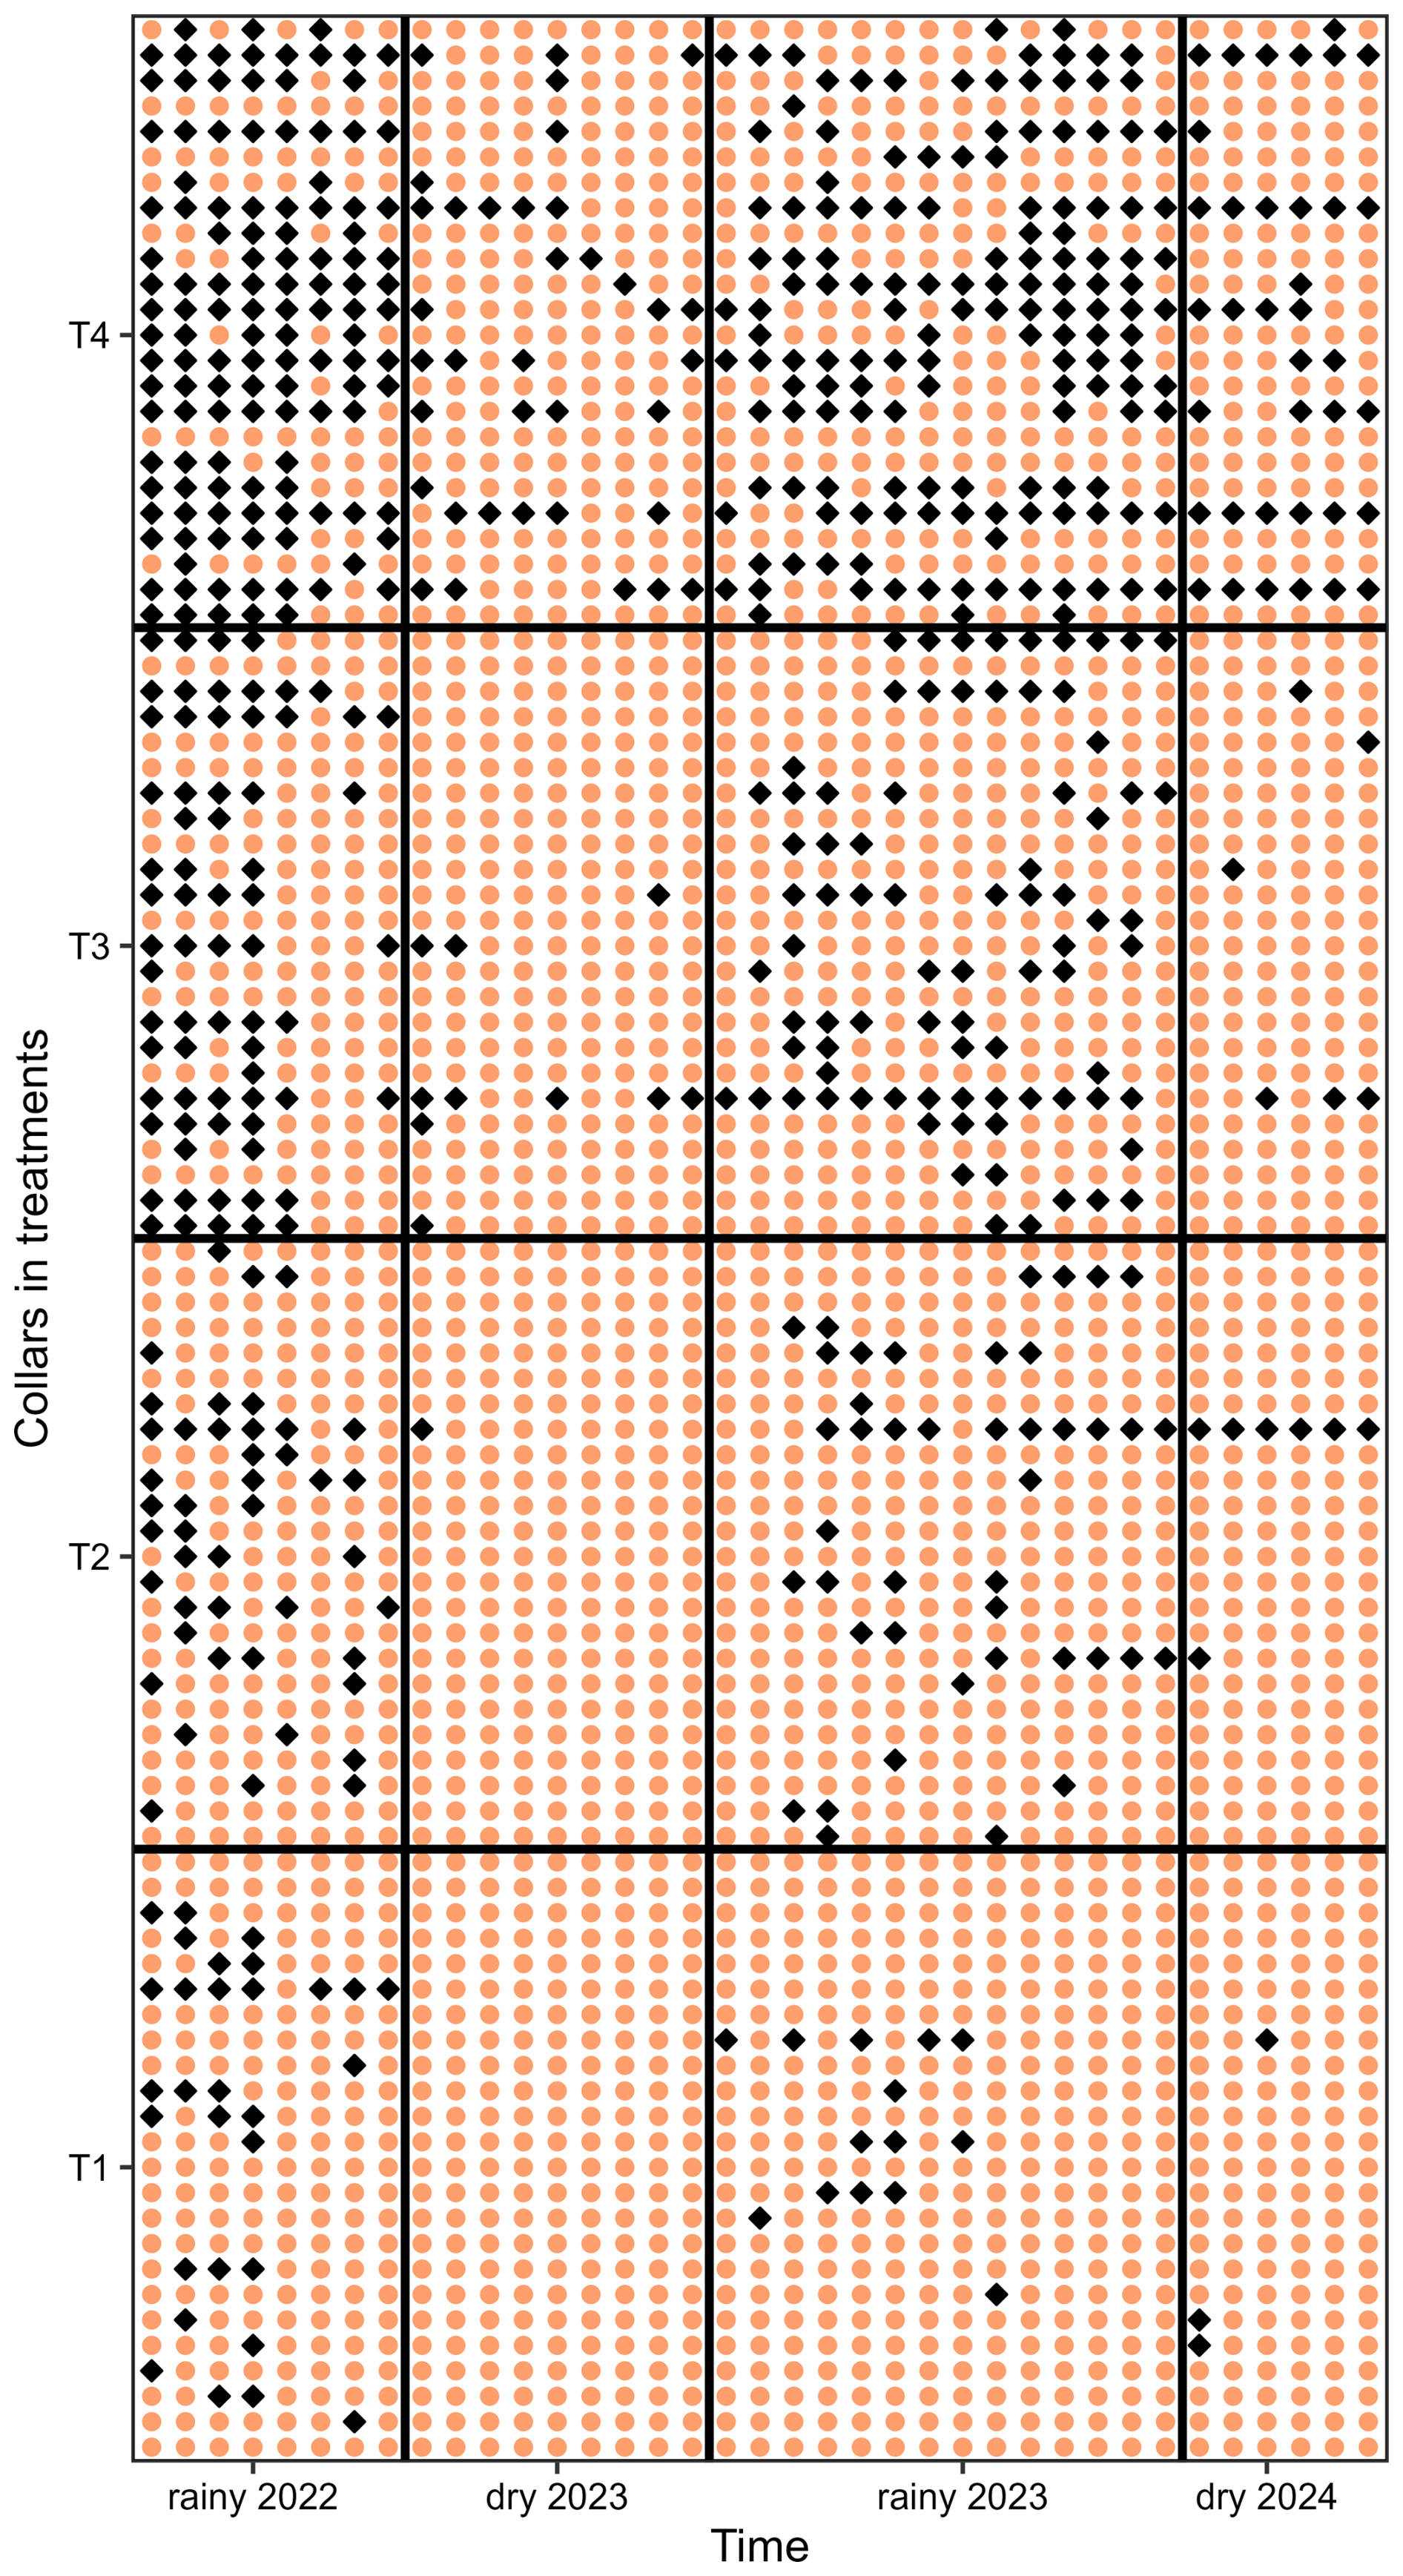
Figure A1Spatial and temporal change of the direction of soil methane fluxes. Orange circles represent negative fluxes (net CH4 uptake), while blue diamonds indicate positive fluxes (net CH4 emission). Spatial variation corresponds to the different collars (y axis, 96 collars, 24 per treatment, ranked from T1 to T4), and temporal changes reflect measurements over time (x axis, 37 dates). The colour-blind-friendly palette “viridis” for R was used.
The data used in this study are available at the Kyoto University Research Information Repository (KURENAI, https://doi.org/10.57723/kds591970, Epron, 2025).
DE led the research. DE, OD, YN, PK, and KS designed the research. DE, RC, ZW, OD, MS, SKP, TM, JS, WAA, and JM performed the research. DE analysed the data. DE wrote the manuscript, which was critically revised by all co-authors.
The setup of the experimental site was financially supported by Yara International, although this research project itself received no funding from Yara. The authors declare that they have no conflict of interest.
Publisher’s note: Copernicus Publications remains neutral with regard to jurisdictional claims made in the text, published maps, institutional affiliations, or any other geographical representation in this paper. While Copernicus Publications makes every effort to include appropriate place names, the final responsibility lies with the authors.
The authors express their gratitude to the Faculty of Agriculture of Kasetsart University, Khampaeng Sean campus, for providing access to the Sithiporn Kridakara Research Station. Special thanks are extended to the staff of the Sithiporn Kridakara Research Station and the DORAS research centre for their invaluable contribution to the fieldwork, particularly Jeerapan Tipparat, Phetrada Kayankit, Natthaworn Kahohem, Jutamas Merasanud, Chalermchart Wongleecharoen, and Rungtawan Thabkhum.
This research was supported by the KAKENHI Grant-in-Aid for the Promotion of Joint International Research, Fostering Joint International Research B (grant no. 21KK0114), and International Collaborative Research Acceleration Fund, overseas collaborative research (grant no. 24KK0127). Additional supports were provided by the Office of the Ministry of Higher Education, Science, Research and Innovation and the Thailand Science Research and Innovation through the Kasetsart University Reinventing University Program 2023.
This paper was edited by Edzo Veldkamp and reviewed by Yit Arn Teh and two anonymous referees.
Abalos, D., Liang, Z., Dörsch, P., and Elsgaard, L.: Trade-offs in greenhouse gas emissions across a liming-induced gradient of soil pH: Role of microbial structure and functioning, Soil Biol. Biochem., 150, 108006, https://doi.org/10.1016/j.soilbio.2020.108006, 2020.
Aini, F. K., Hergoualc'h, K., Smith, J. U., Verchot, L., and Martius, C.: How does replacing natural forests with rubber and oil palm plantations affect soil respiration and methane fluxes?, Ecosphere, 11, e03284, https://doi.org/10.1002/ecs2.3284, 2020.
Allen, D., Dalal, R. C., Rennenberg, H., and Schmidt, S.: Seasonal variation in nitrous oxide and methane emissions from subtropical estuary and coastal mangrove sediments, Australia, Plant Biol., 13, 126–133, https://doi.org/10.1111/j.1438-8677.2010.00331.x, 2011.
Annamalainathan, K., Krishnakumar, R., and Jacob, J.: Tapping-induced changes in respiratory metabolism, ATP production and reactive oxygen species scavenging in Hevea, J. Rubber Res., 4, 245–254, 2001.
Aronson, E. L. and Helliker, B. R.: Methane flux in non-wetland soils in response to nitrogen addition: a meta-analysis, Ecology, 91, 3242–3251, https://doi.org/10.1890/09-2185.1, 2010.
Banger, K., Tian, H., and Lu, C.: Do nitrogen fertilizers stimulate or inhibit methane emissions from rice fields?, Glob. Change Biol., 18, 3259–3267, https://doi.org/10.1111/j.1365-2486.2012.02762.x, 2012.
Barba, J., Poyatos, R., and Vargas, R.: Automated measurements of greenhouse gases fluxes from tree stems and soils: magnitudes, patterns and drivers, Sci. Rep., 9, 4005, https://doi.org/10.1038/s41598-019-39663-8, 2019a.
Barba, J., Bradford, M. A., Brewer, P. E., Bruhn, D., Covey, K., van Haren, J., Megonigal, J. P., Mikkelsen, T. N., Pangala, S. R., Pihlatie, M., Poulter, B., Rivas-Ubach, A., Schadt, C. W., Terazawa, K., Warner, D. L., Zhang, Z., and Vargas, R.: Methane emissions from tree stems: a new frontier in the global carbon cycle, New Phytol., 222, 18–28, https://doi.org/10.1111/nph.15582, 2019b.
Bartoń, K.: MuMIn: Multi-Model Inference, R package version 1.47.5, https://CRAN.R-project.org/package=MuMIn, (last access: 8 January 2024), 2023.
Bates, D., Mächler, M., Bolker, B., and Walker, S.: Fitting linear mixed-effects models using lme4, J. Stat. Softw., 67, 1–48, https://doi.org/10.18637/jss.v067.i01, 2015.
Beaulieu, J. J., DelSontro, T., and Downing, J. A.: Eutrophication will increase methane emissions from lakes and impoundments during the 21st century, Nat. Commun., 10, 1375, https://doi.org/10.1038/s41467-019-09100-5, 2019.
Bédard, C. and Knowles, R.: Physiology, biochemistry, and specific inhibitors of CH4, NH, and CO oxidation by methanotrophs and nitrifiers, Microbiol. Rev., 53, 68–84, 1989.
Benstead, J. and King, G. M.: The effect of soil acidification on atmospheric methane uptake by a Maine forest soil, FEMS Microbiol. Ecol., 34, 207–212, https://doi.org/10.1111/j.1574-6941.2001.tb00771.x, 2001.
Bertora, C., Cucu, M. A., Lerda, C., Peyron, M., Bardi, L., Gorra, R., Sacco, D., Celi, L., and Said-Pullicino, D.: Dissolved organic carbon cycling, methane emissions and related microbial populations in temperate rice paddies with contrasting straw and water management, Agr. Ecosyst. Environ., 265, 292–306, https://doi.org/10.1016/j.agee.2018.06.004, 2018.
Bodelier, P. L. E. and Laanbroek, H. J.: Nitrogen as a regulatory factor of methane oxidation in soils and sediments, FEMS Microbiol. Ecol., 47, 265–277, https://doi.org/10.1016/S0168-6496(03)00304-0, 2004.
Börjesson, G. and Nohrstedt, H.-Ö.: Fast recovery of atmospheric methane consumption in a Swedish forest soil after single-shot N-fertilization, Forest Ecol. Manag., 134, 83–88, https://doi.org/10.1016/S0378-1127(99)00249-2, 2000.
Borken, W., Davidson, E. A., Savage, K., Sundquist, E. T., and Steudler, P.: Effect of summer throughfall exclusion, summer drought, and winter snow cover on methane fluxes in a temperate forest soil, Soil Biol. Biochem., 38, 1388–1395, https://doi.org/10.1016/j.soilbio.2005.10.011, 2006.
Bras, N., Plain, C., and Epron, D.: Potential soil methane oxidation in naturally regenerated oak-dominated temperate deciduous forest stands responds to soil water status regardless of their age – an intact core incubation study, Ann. For. Sci., 79, 29, https://doi.org/10.1186/s13595-022-01145-9, 2022.
Bréchet, L. M., Daniel, W., Stahl, C., Burban, B., Goret, J., Salomn, R. L., and Janssens, I. A.: Simultaneous tree stem and soil greenhouse gas (CO2, CH4, N2O) flux measurements: a novel design for continuous monitoring towards improving flux estimates and temporal resolution, New Phytol., 230, 2487–2500, https://doi.org/10.1111/nph.17352, 2021.
Byun, E., Rezanezhad, F., Slowinski, S., Lam, C., Bhusal, S., Wright, S., Quinton, W. L., Webster, K. L., and Van Cappellen, P.: Effects of nitrogen and phosphorus amendments on CO2 and CH4 production in peat soils of Scotty Creek, Northwest Territories: potential considerations for wildfire and permafrost thaw impacts on peatland carbon exchanges, SOIL, 11, 309–321, https://doi.org/10.5194/soil-11-309-2025, 2025.
Caiafa, L., Barros, N. O., and Lopes, J. F. S.: Greenhouse gas emissions from ant nests: A systematic review, Ecol. Entomol., 48, 397–408, https://doi.org/10.1111/een.13238, 2023.
Castro, M. S., Peterjohn, W. T., Melillo, J. M., Steudler, P. A., Gholz, H. L., and Lewis, D.: Effects of nitrogen fertilization on the fluxes of N2O, CH4, and CO2 from soils in a Florida slash pine plantation, Can. J. Forest Res., 24, 9–13, https://doi.org/10.1139/x94-002, 1994.
Cen, X., He, N., Li, M., Xu, L., Yu, X., Cai, W., Li, X., and Butterbach-Bahl, K.: Suppression of nitrogen deposition on global forest soil CH4 uptake depends on nitrogen status, Global Biogeochem. Cy., 38, e2024GB008098, https://doi.org/10.1029/2024GB008098, 2024.
Chambon, B., Dao, X. L., Tongkaemkaew, U., and Gay, F.: What determine smallholders' fertilization practices during the mature period of rubber plantations in Thailand?, Ex. Agric., 54, 824–841, https://doi.org/10.1017/S0014479717000400, 2018.
Chan, A. S. K., Steudler, P. A., Bowden, R. D., Gulledge, J., and Cavanaugh, C. M.: Consequences of nitrogen fertilization on soil methane consumption in a productive temperate deciduous forest, Biol Fertil Soils, 41, 182–189, https://doi.org/10.1007/s00374-004-0822-7, 2005.
Chen, G., Veldkamp, E., Damris, M., Irawan, B., Tjoa, A., and Corre, M. D.: Large contribution of soil N2O emission to the global warming potential of a large-scale oil palm plantation despite changing from conventional to reduced management practices, Biogeosciences, 21, 513–529, https://doi.org/10.5194/bg-21-513-2024, 2024.
Chotiphan, R., Vaysse, L., Lacote, R., Gohet, E., Thaler, P., Sajjaphan, K., Bottier, C., Char, C., Liengprayoon, S., and Gay, F.: Can fertilization be a driver of rubber plantation intensification?, Ind. Crop. Prod., 141, 111813, https://doi.org/10.1016/j.indcrop.2019.111813, 2019.
Chowdhury, T. R. and Dick, R. P.: Ecology of aerobic methanotrophs in controlling methane fluxes from wetlands, Appl. Soil Ecol., 65, 8–22, https://doi.org/10.1016/j.apsoil.2012.12.014, 2013.
Conover, W. J. and Iman, R. L.: Rank transformations as a bridge between parametric and nonparametric statistics, Am. Stat., 35, 124–129, https://doi.org/10.1080/00031305.1981.10479327, 1981.
Cornwell, W. K., Cornelissen, J. H. C., Amatangelo, K., Dorrepaal, E., Eviner, V. T., Godoy, O., Hobbie, S. E., Hoorens, B., Kurokawa, H., Pérez-Harguindeguy, N., Quested, H. M., Santiago, L. S., Wardle, D. A., Wright, I. J., Aerts, R., Allison, S. D., van Bodegom, P., Brovkin, V., Chatain, A., Callaghan, T. V., Díaz, S., Garnier, E., Gurvich, D. E., Kazakou, E., Klein, J. A., Read, J., Reich, P. B., Soudzilovskaia, N. A., Vaieretti, M. V., and Westoby, M.: Plant species traits are the predominant control on litter decomposition rates within biomes worldwide, Ecol. Lett., 11, 1065–1071, https://doi.org/10.1111/j.1461-0248.2008.01219.x, 2008.
Covey, K. R. and Megonigal, J. P.: Methane production and emissions in trees and forests, New Phytol., 222, 35–51, https://doi.org/10.1111/nph.15624, 2019.
Epron, D.: Fertilization turns a rubber plantation from sink to methane source, KURENAI [data set], https://doi.org/10.57723/kds591970, 2025.
Epron, D. and Mochidome, T.: Methane concentration in the heartwood of living trees in a cold temperate mountain forest: variation, transport and emission, Tree Physiol., tpae122, https://doi.org/10.1093/treephys/tpae122, 2024.
Epron, D., Plain, C., Ndiaye, F.-K., Bonnaud, P., Pasquier, C., and Ranger, J.: Effects of compaction by heavy machine traffic on soil fluxes of methane and carbon dioxide in a temperate broadleaved forest, Forest Ecol. Manag., 382, 1–9, https://doi.org/10.1016/j.foreco.2016.09.037, 2016.
Epron, D., Mochidome, T., Tanabe, T., Dannoura, M., and Sakabe, A.: Variability in stem methane emissions and wood methane production of different tree species in a cold temperate mountain forest, Ecosystems, 26, 784–799, https://doi.org/10.1007/s10021-022-00795-0, 2023.
Fonseca de Souza, L., Nakamura, F. M., Kroeger, M., Obregon, D., de Moraes, M. T., Vicente, M. G., Moreira, M. Z., Pellizari, V. H., Tsai, S. M., and Nüsslein, K.: Soil pH modulates the activity of low-affinity methane oxidation in soils from the Amazon region, J. Appl. Microbiol., 136, lxae303, https://doi.org/10.1093/jambio/lxae303, 2025.
Fox, J. M., Castella, J.-C., Ziegler, A. D., and Westley, S. B.: Rubber plantations expand in mountainous Southeast Asia: what are the consequences for the environment?, Asia Pacific Issues, 114, 1–8, 2014.
Gana, C., Nouvellon, Y., Marron, N., Stape, J. L., and Epron, D.: Sampling and interpolation strategies derived from the analysis of continuous soil CO2 flux, J. Plant Nutr. Soil Sc., 181, 12–20, https://doi.org/10.1002/jpln.201600133, 2018.
Gao, J., Zhou, W., Liu, Y., Sha, L., Song, Q., Lin, Y., Yu, G., Zhang, J., Zheng, X., Fang, Y., Grace, J., Zhao, J., Xu, J., Gui, H., Sinclair, F., and Zhang, Y.: Litter-derived nitrogen reduces methane uptake in tropical rainforest soils, Sci. Total Environ., 849, 157891, https://doi.org/10.1016/j.scitotenv.2022.157891, 2022.
Garcia, J.-L., Patel, B. K. C., and Ollivier, B.: Taxonomic, Phylogenetic, and Ecological Diversity of Methanogenic Archaea, Anaerobe, 6, 205–226, https://doi.org/10.1006/anae.2000.0345, 2000.
Gauci, V., Gowing, D. J. G., Hornibrook, E. R. C., Davis, J. M., and Dise, N. B.: Woody stem methane emission in mature wetland alder trees, Atmos. Environ., 44, 2157–2160, https://doi.org/10.1016/j.atmosenv.2010.02.034, 2010.
Gauci, V., Pangala, S. R., Shenkin, A., Barba, J., Bastviken, D., Figueiredo, V., Gomez, C., Enrich-Prast, A., Sayer, E., Stauffer, T., Welch, B., Elias, D., McNamara, N., Allen, M., and Malhi, Y.: Global atmospheric methane uptake by upland tree woody surfaces, Nature, 631, 796–800, https://doi.org/10.1038/s41586-024-07592-w, 2024.
Giambelluca, T. W., Mudd, R. G., Liu, W., Ziegler, A. D., Kobayashi, N., Kumagai, T., Miyazawa, Y., Lim, T. K., Huang, M., Fox, J., Yin, S., Mak, S. V., and Kasemsap, P.: Evapotranspiration of rubber (Hevea brasiliensis) cultivated at two plantation sites in Southeast Asia, Water Resour. Res., 52, 660–679, https://doi.org/10.1002/2015WR017755, 2016.
Gohet, E., Saaban, I., Soumahoro, M., Uche, E., Soumahoro, B., and Cauchy, T.: Sustainable rubber production through good latex harvesting practices: an update on mature rubber fertilization effects on latex cell biochemistry and rubber yield potential., in: IRRDB Workshop on Latex Harvesting Technology, Vietname, Binh Duong, 19–22 November 2013, https://publications.cirad.fr/une_notice.php?dk=574668 (last access: 26 September 2024), 2013.
Guardiola-Claramonte, M., Troch, P. A., Ziegler, A. D., Giambelluca, T. W., Vogler, J. B., and Nullet, M. A.: Local hydrologic effects of introducing non-native vegetation in a tropical catchment, Ecohydrology, 1, 13–22, https://doi.org/10.1002/eco.3, 2008.
Hackstein, J. H. and Stumm, C. K.: Methane production in terrestrial arthropods., Proc. Natl. Acad. Sci. USA, 91, 5441–5445, https://doi.org/10.1073/pnas.91.12.5441, 1994.
Hanson, R. S. and Hanson, T. E.: Methanotrophic bacteria, Microbiol. Rev., 60, 439–471, 1996.
Hassler, E., Corre, M. D., Tjoa, A., Damris, M., Utami, S. R., and Veldkamp, E.: Soil fertility controls soil–atmosphere carbon dioxide and methane fluxes in a tropical landscape converted from lowland forest to rubber and oil palm plantations, Biogeosciences, 12, 5831–5852, https://doi.org/10.5194/bg-12-5831-2015, 2015.
Hobbie, S. E.: Contrasting effects of substrate and fertilizer nitrogen on the early stages of litter decomposition, Ecosystems, 8, 644–656, https://doi.org/10.1007/s10021-003-0110-7, 2005.
Hu, R., Hirano, T., Sakaguchi, K., Yamashita, S., Cui, R., Sun, L., and Liang, N.: Spatiotemporal variation in soil methane uptake in a cool-temperate immature deciduous forest, Soil Biol. Biochem., 184, 109094, https://doi.org/10.1016/j.soilbio.2023.109094, 2023.
Hütsch, B. W., Webster, C. P., and Powlson, D. S.: Methane oxidation in soil as affected by land use, soil pH and N fertilization, Soil Biol. Biochem., 26, 1613–1622, https://doi.org/10.1016/0038-0717(94)90313-1, 1994.
Huttunen, J. T., Alm, J., Liikanen, A., Juutinen, S., Larmola, T., Hammar, T., Silvola, J., and Martikainen, P. J.: Fluxes of methane, carbon dioxide and nitrous oxide in boreal lakes and potential anthropogenic effects on the aquatic greenhouse gas emissions, Chemosphere, 52, 609–621, https://doi.org/10.1016/S0045-6535(03)00243-1, 2003.
IPCC: Climate Change 2021: The Physical Science Basis. Contribution of Working Group I to the Sixth Assessment Report of the Intergovernmental Panel on Climate Change, Cambridge University Press, Cambridge, United Kingdom, https://doi.org/10.1017/9781009157896, 2021.
IRSG: Rubber Statistical Bulletin, 78 (1-3), The International Rubber Study Group, Singapore, https://www.rubberstudy.org/reports (last access: 10 August 2025), 2023.
Ishizuka, S., Tsuruta, H., and Murdiyarso, D.: An intensive field study on CO2, CH4, and N2O emissions from soils at four land-use types in Sumatra, Indonesia, Global Biogeochem. Cy., 16, 22-1–22–11, https://doi.org/10.1029/2001GB001614, 2002.
Ishizuka, S., Iswandi, A., Nakajima, Y., Yonemura, S., Sudo, S., Tsuruta, H., and Murdiyarso, D.: The variation of greenhouse gas emissions from soils of various land-use/cover types in Jambi province, Indonesia, Nutr. Cycl. Agroecosys., 71, 17–32, https://doi.org/10.1007/s10705-004-0382-0, 2005.
IUSS Working Group WRB: World Reference Base for Soil Resources. International soil classification system for naming soils and creating legends for soil maps. 4th edition, International Union of Soil Sciences (IUSS), Vienna, Austria, 236 pp., ISBN 979-8-9862451-1-9, 2022.
Jackson, R. B., Abernethy, S., Canadell, J. G., Cargnello, M., Davis, S. J., Féron, S., Fuss, S., Heyer, A. J., Hong, C., Jones, C. D., Damon Matthews, H., O'Connor, F. M., Pisciotta, M., Rhoda, H. M., De Richter, R., Solomon, E. I., Wilcox, J. L., and Zickfeld, K.: Atmospheric methane removal: a research agenda, Philos. T. R. Soc. A., 379, 20200454, https://doi.org/10.1098/rsta.2020.0454, 2021.
Jassal, R. S., Black, T. A., Roy, R., and Ethier, G.: Effect of nitrogen fertilization on soil CH4 and N2O fluxes, and soil and bole respiration, Geoderma, 162, 182–186, https://doi.org/10.1016/j.geoderma.2011.02.002, 2011.
Jeffrey, L. C., Maher, D. T., Chiri, E., Leung, P. M., Nauer, P. A., Arndt, S. K., Tait, D. R., Greening, C., and Johnston, S. G.: Bark-dwelling methanotrophic bacteria decrease methane emissions from trees, Nat. Commun., 12, 2127, https://doi.org/10.1038/s41467-021-22333-7, 2021.
Kammann, C., Hepp, S., Lenhart, K., and Müller, C.: Stimulation of methane consumption by endogenous CH4 production in aerobic grassland soil, Soil Biol. Biochem., 41, 622–629, https://doi.org/10.1016/j.soilbio.2008.12.025, 2009.
Kim, S. Y., Veraart, A. J., Meima-Franke, M., and Bodelier, P. L. E.: Combined effects of carbon, nitrogen and phosphorus on CH4 production and denitrification in wetland sediments, Geoderma, 259–260, 354–361, https://doi.org/10.1016/j.geoderma.2015.03.015, 2015.
King, G. M. and Schnell, S.: Ammonium and nitrite inhibition of methane oxidation by Methylobacter albus BG8 and Methylosinus trichosporium OB3b at low methane concentrations, Appl. Environ. Microbiol., 60, 3508–3513, https://doi.org/10.1128/aem.60.10.3508-3513.1994, 1994.
King, G. M. and Schnell, S.: Effects of ammonium and non-ammonium salt additions on methane oxidation by Methylosinus trichosporium OB3b and maine forest soils, Appl. Environ. Microb., 64, 253–257, https://doi.org/10.1128/AEM.64.1.253-257.1998, 1998.
Kruse, C. W., Moldrup, P., and Iversen, N.: Modeling diffusion and reaction in soils: ii. atmospheric methane diffusion and consumption in a forest soil, Soil Sci., 161, 355–365, 1996.
Kuznetsova, A., Brockhoff, P. B., and Christensen, R. H. B.: lmerTest package: Tests in linear mixed effects models, J. Stat. Soft., 82, 1–26, https://doi.org/10.18637/jss.v082.i13, 2017.
Lacroix, E. M., Aeppli, M., Boye, K., Brodie, E., Fendorf, S., Keiluweit, M., Naughton, H. R., Noël, V., and Sihi, D.: Consider the anoxic microsite: acknowledging and appreciating spatiotemporal redox heterogeneity in soils and sediments, ACS Earth Space Chem., 7, 1592–1609, https://doi.org/10.1021/acsearthspacechem.3c00032, 2023.
Lang, R., Blagodatsky, S., Xu, J., and Cadisch, G.: Seasonal differences in soil respiration and methane uptake in rubber plantation and rainforest, Agr. Ecosyst. Environ., 240, 314–328, https://doi.org/10.1016/j.agee.2017.02.032, 2017.
Lang, R., Goldberg, S., Blagodatsky, S., Piepho, H., Harrison, R. D., Xu, J., and Cadisch, G.: Converting forests into rubber plantations weakened the soil CH4 sink in tropical uplands, Land Degrad. Dev., 30, 2311–2322, https://doi.org/10.1002/ldr.3417, 2019.
Lang, R., Goldberg, S. D., Blagodatsky, S., Piepho, H.-P., Hoyt, A. M., Harrison, R. D., Xu, J., and Cadisch, G.: Mechanism of methane uptake in profiles of tropical soils converted from forest to rubber plantations, Soil Biol. Biochem., 145, 107796, https://doi.org/10.1016/j.soilbio.2020.107796, 2020.
Le Mer, J. and Roger, P.: Production, oxidation, emission and consumption of methane by soils: A review, Eur. J. Soil Biol., 37, 25–50, https://doi.org/10.1016/S1164-5563(01)01067-6, 2001.
Lee, J., Yun, J., Yang, Y., Jung, J. Y., Lee, Y. K., Yuan, J., Ding, W., Freeman, C., and Kang, H.: Attenuation of methane oxidation by nitrogen availability in arctic tundra soils, Environ. Sci. Technol., 57, 2647–2659, https://doi.org/10.1021/acs.est.2c05228, 2023.
Liu, D. Y., Ding, W. X., Jia, Z. J., and Cai, Z. C.: Relation between methanogenic archaea and methane production potential in selected natural wetland ecosystems across China, Biogeosciences, 8, 329–338, https://doi.org/10.5194/bg-8-329-2011, 2011.
Lu, Y. and Conrad, R.: In situ stable isotope probing of methanogenic Archaea in the rice rhizosphere, Science, 309, 1088–1090, https://doi.org/10.1126/science.1113435, 2005.
Machacova, K., Borak, L., Agyei, T., Schindler, T., Soosaar, K., Mander, Ü., and Ah-Peng, C.: Trees as net sinks for methane (CH4) and nitrous oxide (N2O) in the lowland tropical rain forest on volcanic Réunion Island, New Phytol., 229, 1983–1994, https://doi.org/10.1111/nph.17002, 2021.
Martinson, G. O., Müller, A. K., Matson, A. L., Corre, M. D., and Veldkamp, E.: Nitrogen and phosphorus control soil methane uptake in tropical montane forests, J. Geophys. Res.-Biogeo., 126, e2020JG005970, https://doi.org/10.1029/2020JG005970, 2021.
Mehring, A. S., Martin, R. M., Delavaux, C. S., James, E. B., Quispe, J. J., and Yaffar, D.: Leaf-cutting ant (Atta cephalotes) nests may be hotspots of methane and carbon dioxide emissions in tropical forests, Pedobiologia, 87–88, 150754, https://doi.org/10.1016/j.pedobi.2021.150754, 2021.
Melillo, J. M., Aber, J. D., and Muratore, J. F.: Nitrogen and lignin control of hardwood leaf litter decomposition dynamics, Ecology, 63, 621–626, https://doi.org/10.2307/1936780, 1982.
Minoda, T. and Kimura, M.: Contribution of photosynthesized carbon to the methane emitted from paddy fields, Geophys. Res. Lett., 21, 2007–2010, https://doi.org/10.1029/94GL01595, 1994.
Minoda, T., Kimura, M., and Wada, E.: Photosynthates as dominant source of CH4 and CO2 in soil water and CH4 emitted to the atmosphere from paddy fields, J. Geophys. Res, 101, 21091–21097, https://doi.org/10.1029/96JD01710, 1996.
Mochizuki, Y., Koba, K., and Yoh, M.: Strong inhibitory effect of nitrate on atmospheric methane oxidation in forest soils, Soil Biol. Biochem., 50, 164–166, https://doi.org/10.1016/j.soilbio.2012.03.013, 2012.
Murase, J., Sajjaphan, K., Dechjiraratthanasiri, C., Duangngam, O., Chotiphan, R., Rattanapichai, W., Azuma, W., Shibata, M., Kasemsap, P., and Epron, D.: Methane oxidation potential of soils in a rubber plantation in Thailand affected by fertilization, SOIL, 11, 457–466, https://doi.org/10.5194/soil-11-457-2025, 2025.
Nakagawa, S. and Schielzeth, H.: A general and simple method for obtaining R2 from generalized linear mixed-effects models, Meth. Ecol. Evol., 4, 133–142, https://doi.org/10.1111/j.2041-210x.2012.00261.x, 2013.
Niu, F., Röll, A., Meijide, A., Hendrayanto, and Hölscher, D.: Rubber tree transpiration in the lowlands of Sumatra, Ecohydrology, 10, e1882, https://doi.org/10.1002/eco.1882, 2017.
O'Neill, J. G. and Wilkinson, J. F.: Oxidation of ammonia by methane-oxidizing bacteria and the effects of ammonia on methane oxidation, J. Gen. Microbiol., 100, 407–412, 1977.
Pangala, S. R., Moore, S., Hornibrook, E. R. C., and Gauci, V.: Trees are major conduits for methane egress from tropical forested wetlands, New Phytol., 197, 524–531, https://doi.org/10.1111/nph.12031, 2013.
Papen, H., Daum, M., Steinkamp, R., and Butterbach-Bahl, K.: N2O- and CH4-fluxes from soils of a N-limited and N-fertilized spruce forest ecosystem of the temperate zone, J. Appl. Bot., 75, 159–163, 2001.
Phelps, T. J. and Zeikus, J. G.: Influence of ph on terminal carbon metabolism in anoxic sediments from a mildly acidic lake, Appl. Environ. Microb., 48, 1088–1095, https://doi.org/10.1128/aem.48.6.1088-1095.1984, 1984.
Pitz, S. L., Megonigal, J. P., Chang, C.-H., and Szlavecz, K.: Methane fluxes from tree stems and soils along a habitat gradient, Biogeochemistry, 137, 307–320, https://doi.org/10.1007/s10533-017-0400-3, 2018.
Plain, C., Ndiaye, F.-K., Bonnaud, P., Ranger, J., and Epron, D.: Impact of vegetation on the methane budget of a temperate forest, New Phytol., 221, 1447–1456, https://doi.org/10.1111/nph.15452, 2019.
Purvaja, R. and Ramesh, R.: Natural and anthropogenic methane emission from coastal wetlands of south india, Environ. Manage., 27, 547–557, https://doi.org/10.1007/s002670010169, 2001.
Qiu, Q., Ding, C., Mgelwa, A. S., Feng, J., Lei, M., Gan, Z., Zhu, B., and Hu, Y.: Contrasting impacts of fertilization on topsoil and subsoil greenhouse gas fluxes in a thinned Chinese fir plantation, J. Environ. Manage., 359, 121055, https://doi.org/10.1016/j.jenvman.2024.121055, 2024.
Qu, Z., Wang, J., Almøy, T., and Bakken, L. R.: Excessive use of nitrogen in Chinese agriculture results in high N2O/(N2O+N2) product ratio of denitrification, primarily due to acidification of the soils, Glob. Change Biol., 20, 1685–1698, https://doi.org/10.1111/gcb.12461, 2014.
R Core Team: R: A language and environment for statistical computing, http://www.R-project.org/ (last access: 16 February 2024), 2023.
Rabbai, A., Barba, J., Canducci, M., Hart, K. M., MacKenzie, A. R., Kettridge, N., Curioni, G., Ullah, S., and Krause, S.: Fertilization-induced greenhouse gas emissions partially offset carbon sequestration during afforestation, Soil Biol. Biochem., 199, 109577, https://doi.org/10.1016/j.soilbio.2024.109577, 2024.
Räsänen, M., Vesala, R., Rönnholm, P., Arppe, L., Manninen, P., Jylhä, M., Rikkinen, J., Pellikka, P., and Rinne, J.: Carbon dioxide and methane fluxes from mounds of African fungus-growing termites, Biogeosciences, 20, 4029–4042, https://doi.org/10.5194/bg-20-4029-2023, 2023.
Rasmussen, R. A. and Khalil, M. A. K.: Global production of methane by termites, Nature, 301, 700–702, https://doi.org/10.1038/301700a0, 1983.
Reay, D. S. and Nedwell, D. B.: Methane oxidation in temperate soils: effects of inorganic N, Soil Biol. Biochem., 36, 2059–2065, https://doi.org/10.1016/j.soilbio.2004.06.002, 2004.
Roy, R. and Conrad, R.: effect of methanogenic precursors (acetate, hydrogen, propionate) on the suppression of methane production by nitrate in anoxic rice field soil, FEMS Microbiol. Ecol., https://doi.org/10.1111/j.1574-6941.1999.tb00560.x, 1999.
Saiyasitpanich, P., Ratisoonthorn, J., and Panmanee, N.: Thailand's Fourth National Communication (NC4), Ministry of Natural Resources and Environment, Bangkok, Thailand, https://unfccc.int/documents/624738 (last access: 27 September 2024), 2024.
Sakabe, A., Takahashi, K., Azuma, W., Itoh, M., Tateishi, M., and Kosugi, Y.: Controlling factors of seasonal variation of stem methane emissions from Alnus japonica in a riparian wetland of a temperate forest, J. Geophys. Res.-Biogeo., 126, e2021JG006326, https://doi.org/10.1029/2021JG006326, 2021.
Saunois, M., Stavert, A. R., Poulter, B., Bousquet, P., Canadell, J. G., Jackson, R. B., Raymond, P. A., Dlugokencky, E. J., Houweling, S., Patra, P. K., Ciais, P., Arora, V. K., Bastviken, D., Bergamaschi, P., Blake, D. R., Brailsford, G., Bruhwiler, L., Carlson, K. M., Carrol, M., Castaldi, S., Chandra, N., Crevoisier, C., Crill, P. M., Covey, K., Curry, C. L., Etiope, G., Frankenberg, C., Gedney, N., Hegglin, M. I., Höglund-Isaksson, L., Hugelius, G., Ishizawa, M., Ito, A., Janssens-Maenhout, G., Jensen, K. M., Joos, F., Kleinen, T., Krummel, P. B., Langenfelds, R. L., Laruelle, G. G., Liu, L., Machida, T., Maksyutov, S., McDonald, K. C., McNorton, J., Miller, P. A., Melton, J. R., Morino, I., Müller, J., Murguia-Flores, F., Naik, V., Niwa, Y., Noce, S., O'Doherty, S., Parker, R. J., Peng, C., Peng, S., Peters, G. P., Prigent, C., Prinn, R., Ramonet, M., Regnier, P., Riley, W. J., Rosentreter, J. A., Segers, A., Simpson, I. J., Shi, H., Smith, S. J., Steele, L. P., Thornton, B. F., Tian, H., Tohjima, Y., Tubiello, F. N., Tsuruta, A., Viovy, N., Voulgarakis, A., Weber, T. S., van Weele, M., van der Werf, G. R., Weiss, R. F., Worthy, D., Wunch, D., Yin, Y., Yoshida, Y., Zhang, W., Zhang, Z., Zhao, Y., Zheng, B., Zhu, Q., Zhu, Q., and Zhuang, Q.: The Global Methane Budget 2000–2017, Earth Syst. Sci. Data, 12, 1561–1623, https://doi.org/10.5194/essd-12-1561-2020, 2020.
Schnell, S. and King, G. M.: Mechanistic analysis of ammonium inhibition of atmospheric methane consumption in forest soils, Appl. Environ. Microb., 60, 3514–3521, https://doi.org/10.1128/aem.60.10.3514-3521.1994, 1994.
Sexstone, A. J., Revsbech, N. P., Parkin, T. B., and Tiedje, J. M.: Direct measurement of oxygen profiles and denitrification rates in soil aggregates, Soil Sci. Soc. Am. J., 49, 645–651, https://doi.org/10.2136/sssaj1985.03615995004900030024x, 1985.
Smith, K. A., Ball, T., Conen, F., Dobbie, K. E., Massheder, J., and Rey, A.: Exchange of greenhouse gases between soil and atmosphere: interactions of soil physical factors and biological processes, Eur. J. Soil Sci., 54, 779–791, https://doi.org/10.1046/j.1351-0754.2003.0567.x, 2003.
Smith, P., Reay, D., and Smith, J.: Agricultural methane emissions and the potential for mitigation, Philos. T. R. Soc. A., 379, 20200451, https://doi.org/10.1098/rsta.2020.0451, 2021.
Soil Survey Staff: Keys to Soil Taxonomy, 13th edition, USDA Natural Resources Conservation Service, 410 pp., https://www.nrcs.usda.gov/resources/guides-and-instructions/keys-to-soil-taxonomy (last access: 3 October 2014) 2022.
Sotomayor, D., Corredor, J. E., and Morell, J. M.: Methane flux from mangrove sediments along the southwestern coast of Puerto Rico, Estuaries, 17, 140, https://doi.org/10.2307/1352563, 1994.
Steudler, P. A., Bowden, R. D., Melillo, J. M., and Aber, J. D.: Influence of nitrogen fertilization on methane uptake in temperate forest soils, Nature, 341, 314–316, https://doi.org/10.1038/341314a0, 1989.
Tan, Z.-H., Zhang, Y.-P., Song, Q.-H., Liu, W.-J., Deng, X.-B., Tang, J.-W., Deng, Y., Zhou, W.-J., Yang, L.-Y., Yu, G.-R., Sun, X.-M., and Liang, N.-S.: Rubber plantations act as water pumps in tropical China, Geophys. Res. Lett., 38, L24406, https://doi.org/10.1029/2011GL050006, 2011.
Tang, J., Qian, H., Zhu, X., Liu, Z., Kuzyakov, Y., Zou, J., Wang, J., Xu, Q., Li, G., Liu, Z., Wang, S., Zhang, W., Zhang, J., Huang, S., Ding, Y., Van Groenigen, K. J., and Jiang, Y.: Soil pH determines nitrogen effects on methane emissions from rice paddies, Glob. Change Biol., 30, e17577, https://doi.org/10.1111/gcb.17577, 2024.
Teh, Y. A., Silver, W. L., and Conrad, M. E.: Oxygen effects on methane production and oxidation in humid tropical forest soils, Glob. Change Biol., 11, 1283–1297, https://doi.org/10.1111/j.1365-2486.2005.00983.x, 2005.
Terazawa, K., Yamada, K., Ohno, Y., Sakata, T., and Ishizuka, S.: Spatial and temporal variability in methane emissions from tree stems of Fraxinus mandshurica in a cool-temperate floodplain forest, Biogeochemistry, 123, 349–362, https://doi.org/10.1007/s10533-015-0070-y, 2015.
Veldkamp, E., Koehler, B., and Corre, M. D.: Indications of nitrogen-limited methane uptake in tropical forest soils, Biogeosciences, 10, 5367–5379, https://doi.org/10.5194/bg-10-5367-2013, 2013.
Veraart, A. J., Steenbergh, A. K., Ho, A., Kim, S. Y., and Bodelier, P. L. E.: Beyond nitrogen: The importance of phosphorus for CH4 oxidation in soils and sediments, Geoderma, 259–260, 337–346, https://doi.org/10.1016/j.geoderma.2015.03.025, 2015.
von Fischer, J. C. and Hedin, L. O.: Controls on soil methane fluxes: Tests of biophysical mechanisms using stable isotope tracers, Global Biogeochem. Cy., 21, GB2007, https://doi.org/10.1029/2006GB002687, 2007.
von Fischer, J. C., Butters, G., Duchateau, P. C., Thelwell, R. J., and Siller, R.: In situ measures of methanotroph activity in upland soils: A reaction-diffusion model and field observation of water stress, J. Geophys. Res.-Biogeo., 114, G01015, https://doi.org/10.1029/2008JG000731, 2009.
Wachinger, G., Fiedler, S., Zepp, K., Gattinger, A., Sommer, M., and Roth, K.: Variability of soil methane production on the micro-scale: spatial association with hot spots of organic material and Archaeal populations, Soil Biol. Biochem., 32, 1121–1130, https://doi.org/10.1016/S0038-0717(00)00024-9, 2000.
Wang, Y., Hollingsworth, P. M., Zhai, D., West, C. D., Green, J. M. H., Chen, H., Hurni, K., Su, Y., Warren-Thomas, E., Xu, J., and Ahrends, A.: High-resolution maps show that rubber causes substantial deforestation, Nature, 623, 340–346, https://doi.org/10.1038/s41586-023-06642-z, 2023.
Wang, Z. P., DeLaune, R. D., Patrick, W. H., and Masscheleyn, P. H.: Soil redox and pH effects on methane production in a flooded rice soil, Soil Sci. Soc. Am. J., 57, 382–385, https://doi.org/10.2136/sssaj1993.03615995005700020016x, 1993.
Wang, Z.-P. and Ineson, P.: Methane oxidation in a temperate coniferous forest soil: effects of inorganic N, Soil Biol. Biochem., 35, 427–433, https://doi.org/10.1016/S0038-0717(02)00294-8, 2003.
Wang, Z.-P., Han, S.-J., Li, H.-L., Deng, F.-D., Zheng, Y.-H., Liu, H.-F., and Han, X.-G.: Methane production explained largely by water content in the heartwood of living trees in upland forests, J. Geophys. Res.-Biogeo., 122, 2479–2489, https://doi.org/10.1002/2017JG003991, 2017.
Werner, C., Zheng, X., Tang, J., Xie, B., Liu, C., Kiese, R., and Butterbach-Bahl, K.: N2O, CH4 and CO2 emissions from seasonal tropical rainforests and a rubber plantation in southwest china, Plant Soil, 289, 335–353, https://doi.org/10.1007/s11104-006-9143-y, 2006.
Whiting, G. J. and Chanton, J. P.: Primary production control of methane emission from wetlands, Nature, 364, 794–795, https://doi.org/10.1038/364794a0, 1993.
Whittenbury, R., Phillips, K. C., and Wilkinson, J. F.: Enrichment, isolation and some properties of methane-utilizing bacteria, J. Gen. Microbiol., 61, 205–218, https://doi.org/10.1099/00221287-61-2-205, 1970.
Wobbrock, J. O., Findlater, L., Gergle, D., and Higgins, J. J.: The aligned rank transform for nonparametric factorial analyses using only anova procedures, in: Proceedings of the SIGCHI Conference on Human Factors in Computing Systems, CHI '11: CHI Conference on Human Factors in Computing Systems, Vancouver BC Canada, 7–12 May 2011, 143–146, https://doi.org/10.1145/1978942.1978963, 2011.
Yao, X., Wang, J., and Hu, B.: How methanotrophs respond to pH: A review of ecophysiology, Front. Microbiol., 13, 1034164, https://doi.org/10.3389/fmicb.2022.1034164, 2023.
Ye, R., Jin, Q., Bohannan, B., Keller, J. K., McAllister, S. A., and Bridgham, S. D.: pH controls over anaerobic carbon mineralization, the efficiency of methane production, and methanogenic pathways in peatlands across an ombrotrophic–minerotrophic gradient, Soil Biol. Biochem., 54, 36–47, https://doi.org/10.1016/j.soilbio.2012.05.015, 2012.
Zhang, L., Yuan, F., Bai, J., Duan, H., Gu, X., Hou, L., Huang, Y., Yang, M., He, J., Zhang, Z., Yu, L., Song, C., Lipson, D. A., Zona, D., Oechel, W., Janssens, I. A., and Xu, X.: Phosphorus alleviation of nitrogen-suppressed methane sink in global grasslands, Ecol. Lett., 23, 821–830, https://doi.org/10.1111/ele.13480, 2020.
Zhang, T., Zhu, W., Mo, J., Liu, L., and Dong, S.: Increased phosphorus availability mitigates the inhibition of nitrogen deposition on CH4 uptake in an old-growth tropical forest, southern China, Biogeosciences, 8, 2805–2813, https://doi.org/10.5194/bg-8-2805-2011, 2011.
Zhang, W., Mo, J., Zhou, G., Gundersen, P., Fang, Y., Lu, X., Zhang, T., and Dong, S.: Methane uptake responses to nitrogen deposition in three tropical forests in southern China, J. Geophys. Res., 113, D11116, https://doi.org/10.1029/2007JD009195, 2008.
Zheng, M., Zhang, T., Liu, L., Zhang, W., Lu, X., and Mo, J.: Effects of nitrogen and phosphorus additions on soil methane uptake in disturbed forests: N and P regulate CH4 uptake in forests, J. Geophys. Res.-Biogeo., 121, 3089–3100, https://doi.org/10.1002/2016JG003476, 2016.
Zhou, W., Zhu, J., Ji, H., Grace, J., Sha, L., Song, Q., Liu, Y., Bai, X., Lin, Y., Gao, J., Fei, X., Zhou, R., Tang, J., Deng, X., Yu, G., Zhang, J., Zheng, X., Zhao, J., and Zhang, Y.: Drivers of difference in CO2 and CH4 emissions between rubber plantation and tropical rainforest soils, Agr. Forest Meteorol., 304–305, 108391, https://doi.org/10.1016/j.agrformet.2021.108391, 2021.
Zhu, F., Yoh, M., Gilliam, F. S., Lu, X., and Mo, J.: Nutrient limitation in three lowland tropical forests in Southern China receiving high nitrogen deposition: insights from fine root responses to nutrient additions, PLoS ONE, 8, e82661, https://doi.org/10.1371/journal.pone.0082661, 2013.