the Creative Commons Attribution 4.0 License.
the Creative Commons Attribution 4.0 License.
 | 29 Sep 2025
Hydrodynamic and primary production effects on seasonal DO variability in the Danube River
Anna-Neva Visser
Christina M. Schubert
Simon T. Wander
Johannes A. C. Barth
Dissolved oxygen (DO) is a fundamental indicator for water quality and ecosystem health, particularly in the context of anthropogenic impacts and climate change. This study presents the first large-scale dataset of DO concentrations combined with its stable oxygen isotope ratios (expressed as δ18ODO), particulate organic carbon concentrations (POC), and respiration photosynthesis (R P ratios) from five seasonal campaigns along the entire Danube River in 2023 and 2024. Our findings reveal pronounced seasonal DO driven by temperature, biological activity, and hydrodynamic conditions. During spring and summer, enhanced photosynthesis increased DO up to 0.40 mmol L−1, with δ18ODO values down to +12.1 ‰ and POC up to 0.25 mmol L−1 in two highly productive river sections. Low R P ratios of 0.1 further indicated strong net autotrophic conditions. Strong correlations between δ18ODO and POC additionally confirm the influence of primary producers (i.e., photosynthetic organisms) in a river section where a reduced slope led to slower flow and lower turbulence. Notably, δ18ODO values were lower than those expected for atmospheric equilibrium (+24.6 ‰ ± 0.4 ‰), a pattern rarely documented in large river systems. In contrast, tributary inflows from the Tisa and Sava rivers diluted biomass and organic material inputs and led to declines in DO and POC. By late summer, intensified respiration reversed photosynthetic signals, led to the lowest DO concentrations down to 0.16 mmol L−1, and raised δ18ODO up to +23.7 ‰, particularly in the Sava River. In fall, DO levels partially recovered despite continued respiration, as indicated by the highest observed δ18ODO values of +25.9 ‰ and the highest R P ratios of the entire season, reaching 8.9. In winter, oxygen input from the atmosphere became dominant with minimal biological influences. Overall, this study provides new insights into oxygen sources and sinks across the river continuum over several seasons. These new insights underscore the need for continuous DO monitoring, particularly in late summer when oxygen levels can become critically low. Understanding these interactions can help to establish efficient aqueous ecosystem management and conservation strategies in the face of land use and climate change.
- Article
(5885 KB) - Full-text XML
-
Supplement
(2440 KB) - BibTeX
- EndNote


Freshwater ecosystems are increasingly threatened by complex global stressors (Borgwardt et al., 2019; Vörösmarty et al., 2013). Beyond climate change, anthropogenically induced alterations of river morphology (Belletti et al., 2015), disrupted flow regimes (Acreman and Dunbar, 2004; Poff and Zimmerman, 2010), nutrient input (Fowler et al., 2013; Seitzinger et al., 2006; Sutton et al., 2011), and pollution from urban and industrial sources (Nyenje et al., 2010; Qing et al., 2015; Suthar et al., 2009; Xia et al., 2016) continue to degrade the water quality and stability of aquatic habitats. Land use changes further intensify these pressures, thus often jeopardizing river basin health. Such influences can also amplify the impacts of environmental stressors (Honisch et al., 2002; Hua, 2017). Consequently, between 2015 and 2021, only 37 % of all European surface water bodies achieved a “good” ecological status and only 29 % a “good” chemical status (EEA, 2021). These numbers highlight the urgency to address environmental challenges for terrestrial aqueous systems. Particularly excessive nutrient inputs from mostly agricultural land use, primarily phosphorus and nitrogen, threaten aquatic life and can trigger algal blooms that lead to eutrophication, oxygen depletion, and ultimately a decline in biodiversity (Carpenter et al., 1998; Dudgeon et al., 2006; Grizzetti et al., 2017).
Among many consequences of these stressors, disruptions of dissolved oxygen (DO) sources and sinks can impact freshwater habitats and influence biodiversity, biogeochemical cycles, and overall environmental health (Franklin, 2014; Killgore and Hoover, 2001; North et al., 2014). Primary producers, such as phytoplankton, serve as a key source of DO via photosynthesis, whereas respiration by heterotrophic organisms provides major sinks that consume DO (Heddam, 2014; Wetzel, 2011). However, DO concentrations are not solely regulated by biological activity. They are also influenced by atmospheric exchange and environmental factors such as temperature, light availability, and nutrient levels (Benson et al., 1979; Odum, 1956; Stumm and Morgan, 1995). In addition, chemical processes, such as redox reactions and the mineralization of organic carbon under stratified or eutrophic conditions, can also serve as important DO sinks, particularly in hypolimnetic lake environments, anoxic groundwaters, and rivers with elevated groundwater input (Jurgens et al., 2009; Piatka et al., 2021; Rosecrans et al., 2017).
In the context of fluvial systems, a better understanding and prediction of DO distributions and their controlling processes are essential to assess aquatic health and to prevent or at least manage potential anoxic events. This is especially important for the Danube River, Europe's second-longest waterway. While the river provides important agriculture and energy production services, these activities also impose significant pressures on its natural system. Additionally, the Danube serves as a crucial ecological corridor that promotes biodiversity across central and eastern Europe (Habersack et al., 2016; Liška et al., 2018; Sommerwerk et al., 2009). Although the ecological quality improved in the last 30 years, the Danube River still faces ongoing threats, particularly from organic pollution downstream of major cities and after confluences of key tributaries (Mănoiu and Crăciun, 2021; Wachs, 1997).
Despite the critical role of DO in freshwater ecosystems, research has primarily focused on DO concentration patterns as an indicator of water quality, while the relative contributions of biological and atmospheric inputs often remain poorly quantified. In particular, photosynthesis and community respiration drive DO dynamics in fundamentally different ways, yet their individual effects cannot be fully distinguished through concentration measurements alone. Traditional approaches lack a framework to separate DO sources and sinks, thus leaving significant gaps in our understanding of aqueous DO cycling. Stable isotope measurements of DO provide a powerful tool to overcome these limitations by distinguishing between three key processes that govern DO dynamics in aqueous environments: photosynthesis, respiration, and atmospheric exchange. Aquatic photosynthesis, by splitting water molecules, transfers a typically 16O-enriched signature into the DO pool (Guy et al., 1993; Limburg et al., 1999). However, under low DO concentrations, concurrent DO consumption can lead to 18O enrichments even during photosynthesis (Eisenstadt et al., 2010). Similarly, aerobic respiration preferentially consumes 16O, leaving the remaining DO enriched in 18O (Mader et al., 2017). This study is among the few to apply DO isotopes to river systems and contributes to a still limited body of research on DO dynamics in aqueous systems (e.g., Parker et al., 2010; Quay et al., 1995; Tobias et al., 2007; Wassenaar et al., 2010).
With increasing environmental pressures, a comprehensive understanding of DO sources and sinks in the Danube is essential for assessing and managing river health. To address this issue, we conducted the first large-scale study of the DO budget of the entire Danube main channel and its key tributaries (e.g., Inn, Tisa, and Sava) (Fig. 1) based on five sampling campaigns between 2023 and 2024. By integrating high-spatial-resolution DO measurements with δ18ODO analyses, particulate organic carbon (POC), and ratios between respiration and photosynthesis (R P), we were able to reveal DO sources and sinks along the river continuum together with its seasonal dynamics. This approach could identify critical periods and regions characterized by elevated or depleted DO levels and also disentangle variable contributions by photosynthesis, respiration, and atmospheric exchange. Together, these findings contribute to a more comprehensive understanding of the Danube River's functioning.
2.1 Study area
The Danube has a total length of 2857 km and a mean annual discharge of 6486 m3 s−1 (Sommerwerk et al., 2009). Its catchment area of 807 827 km2 hosts a population of approximately 83 million people in 10 different countries and serves as a vital freshwater resource for central and eastern Europe (Habersack et al., 2016; Liška, 2018; Sommerwerk et al., 2009). In 2023 and 2024, five sampling campaigns were conducted on the main river and its major tributaries (e.g., Inn, Tisa, and Sava), covering the following key seasons: summer (July 2023), fall (late October to early November 2023), winter (February 2024), spring (April 2024), and late summer (late August to early September 2024). During each sampling campaign, between 54 and 89 sampling locations along the entire mainstream were surveyed (Fig. 1). The coordinates of the sampling sites were recorded in the field by Google Maps and confirmed by a Garmin eTrex HC-series GPS device. Elevation data were determined with a barometric altimeter via the mobile Elevation App from Mapnitude Company Limited (https://mapnitude.com/elevation, last access: 4 September 2024). Discharge data were provided by the International Commission of the Danube River (ICPDR, https://www.danubehis.org, last access: 11 March 2025; ICPDR, 2025).
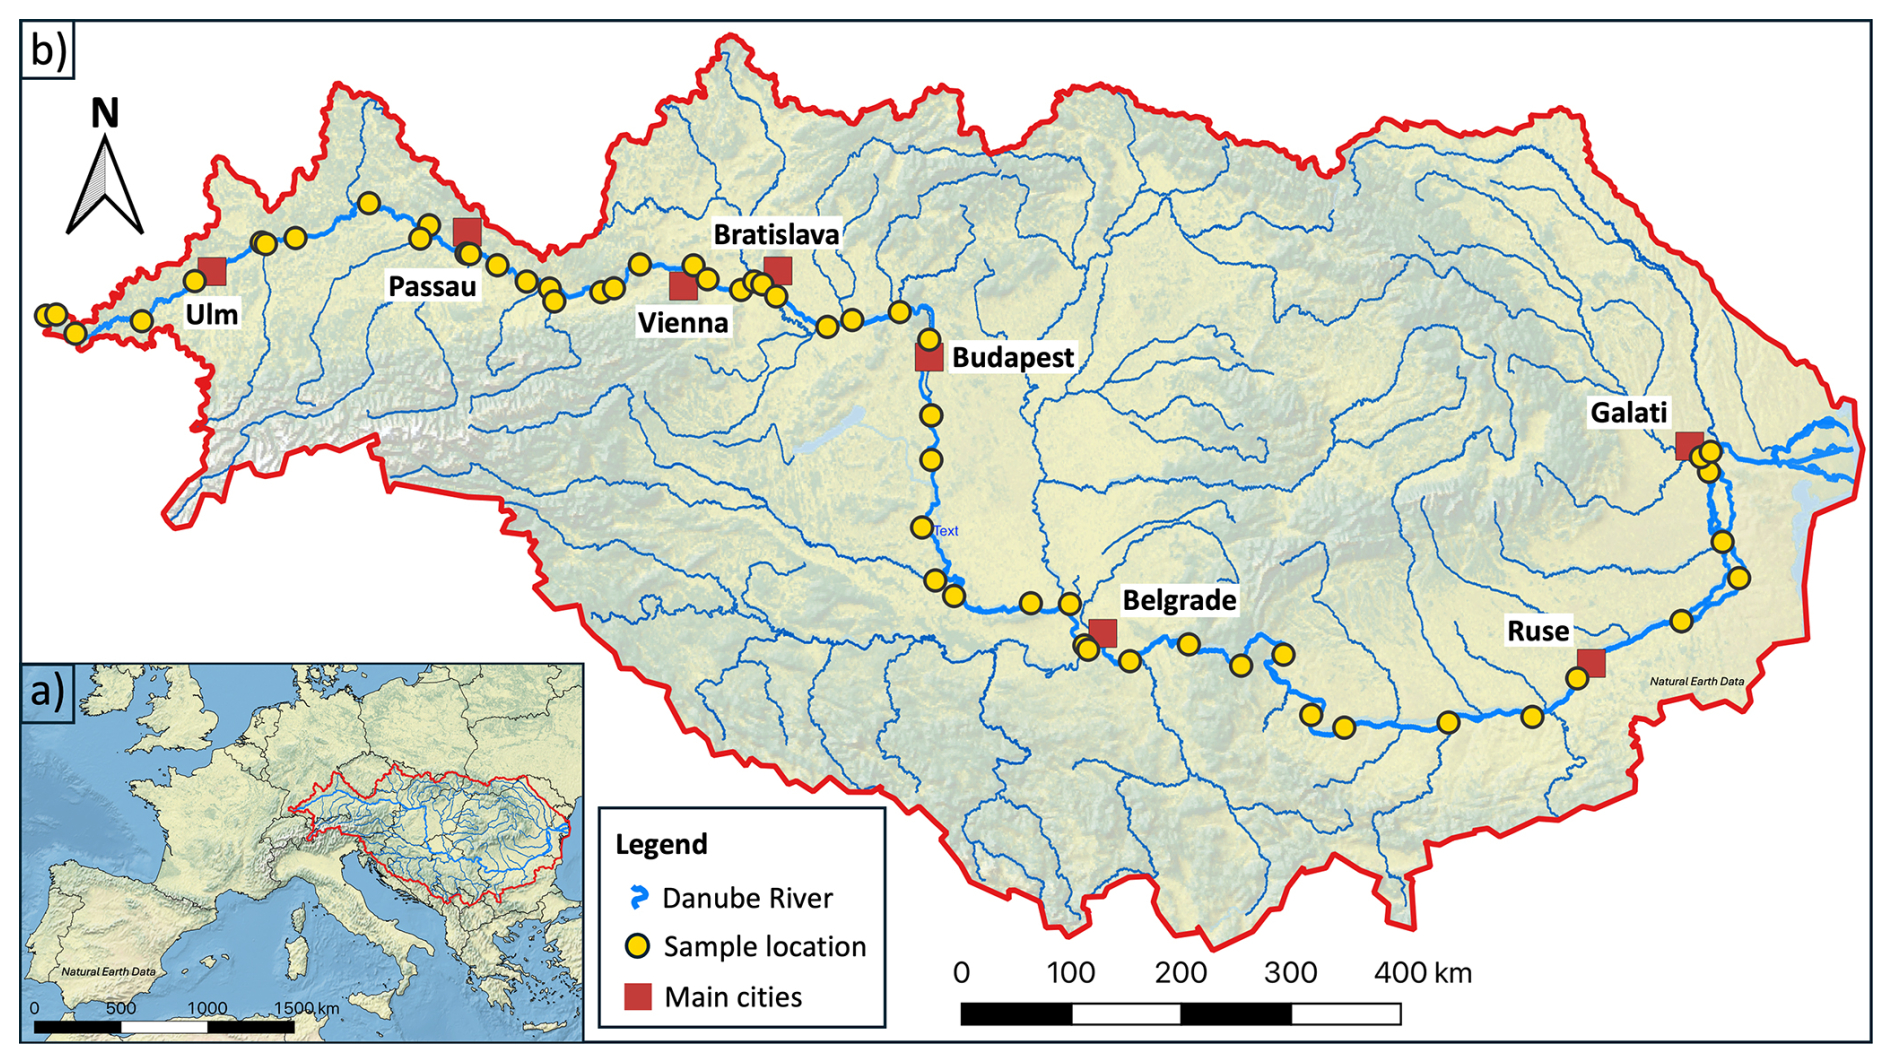
Figure 1(a) Overview map of Europe and (b) detailed view of the Danube River Basin (red outline), including the Danube River (thick blue line) and its major tributaries (thin blue lines); data were provided by the ICPDR (data source ICPDR, 2025, last access: 11 March 2025). Yellow dots represent the sampling locations of late summer 2024; red squares show main cities along the Danube. Sampled tributaries include the Brigach, Breg, Lech, Isar, Inn, Enns, March, Váh, Dráva, Tisa, Sava, and Siret. The map was created using QGIS v 3.28.3 with raster data from Natural Earth Data (version 3.2.0, https://www.naturalearthdata.com/downloads/10m-raster-data/10m-cross-blend-hypso/, last access: 11 December 2024) and shapefiles from geoBoundaries (https://www.geoboundaries.org/globalDownloads.html, last access: 11 December 2024).
2.2 Field methods
Samples were collected using a weighted narrow-mouth 2 L polyethylene sampling bottle that was submerged between 1 and 2 m below the water surface to obtain well-mixed water and to minimize influences by rain and evaporation. Sampling took place either from the center (via bridges or passenger boats) or occasionally from the riverbank. In each case, well-mixed water samples were obtained from the flowing section of the river. To ensure that the samples represented the entire river section, two cross-sectional profiles were sampled during each sampling campaign, and in all cases, they confirmed homogeneously mixed water from each location.
In situ measurements of temperature (T), DO, and oxygen saturation (DO %) were performed with a multiparameter instrument (HQ40d, HACH™, Loveland, CO, USA). This instrument was calibrated daily. Measurement standard deviations were ± 0.1 mg L−1 for DO, ± 0.42 % for DO %, and ± 0.07 °C for T.
For δ18ODO analyses, samples were filtered through 0.45 µm pore size nylon syringe filters (Sartorius™) into pre-poisoned 12 mL vials (Labco LTD. Lampeter Exetainer™). These vials contained 10 µL of a saturated HgCl2 solution to inhibit microbial activity after sampling. Vials were filled completely and sealed with screw caps and butyl septa for efficient sealing against atmospheric influences. Triplicate samples were stored in the dark at 4 °C. To evaluate potential diel effects on DO, nighttime samples were collected in the main river channel at two sites during the late summer 2024 campaign. These samples revealed minor differences in DO concentration (< 0.01 mg L−1) and a slight increase in δ18ODO (< 1 ‰). For water isotopes (expressed as δ18O), necessary for R P calculations, water samples were collected in identical 12 mL Exetainers but without poisoning by HgCl2.
For the determination of POC, 500 mL of unfiltered water was collected in acid-washed high-density polyethylene Nalgene bottles. Before sampling, the bottles were thoroughly rinsed three times with sample water. Preparation for POC analysis involved filtering the collected water through pre-weighed glass-fiber filters (GF-5, pore size 0.4 µm; Macherey-Nagel, Düren, Germany). To eliminate residual organic carbon, these filters were pre-heated at 400 °C for 4 h and stored under sterile conditions until sampling.
2.3 Laboratory methods
δ18ODO measurements were performed using a modified automated equilibration system (Gasbench II, ThermoFisher Scientific™) connected in continuous-flow mode to a DELTA V Advantage isotope ratio mass spectrometer (IRMS, ThermoFisher Scientific™). The analytical approach was based on methods described by Barth et al. (2004) and Wassenaar and Koehler (1999). Briefly, a 3 mL pure helium headspace was established in the sample vial, and dissolved gases were extracted by shaking the sample vials on an orbital shaker at 250 rotations per minute for 30 min. The extracted O2 in the headspace was separated from nitrogen (N2) and other trace gases using a gas chromatography column (CP-Molsieve 5 Å, 25 m length, 0.53 mm outer diameter, 0.05 mm inner diameter; Agilent™, Santa Clara, CA, USA) before introduction into the isotope ratio mass spectrometer (IRMS) for analysis. Results are reported as averages of triplicate measurements, with an external reproducibility better than ± 0.2 ‰ (1σ).
Values of δ18O were determined by infrared spectroscopy (IRIS) with a Picarro™ analyzer (L 1102-i WS-CRDS, Santa Clara, CA, USA). The analysis was conducted following the protocol outlined by van Geldern and Barth (2012).
All stable isotope values are reported in the standard δ notation relative to the Vienna Standard Mean Ocean Water (VSMOW) and are calculated as
and then multiplied by 1000 to express them in per mille (‰). R represents the molar ratio of the heavy to light isotopes (18O 16O for oxygen; 2H 1H and 18O 16O for H2O) in the sample and the reference (Coplen, 2011). The ratio of VSMOW is 2005.20 ± 0.43 ppm (Baertschi, 1976). For δ18O, external reproducibility was better than ± 0.1 ‰ (1σ).
For POC determination, filters previously loaded with particulate material were freeze-dried for 60 min under vacuum conditions (< 10 mbar) using a freeze dryer (Lyovac GT 2 GT 2-E, FinnAqua, Gemini BV, Apeldoorn, Netherlands). The dried filters were then pulverized for 60 s using a ball mill (CryoMill, Retsch, Verder, Vleuten, Netherlands). To ensure complete removal of potential carbonate residues, the powdered filter material was fumigated with concentrated HCl in a desiccator for 24 h. After fumigation, aliquots of the prepared filter material were weighed into tin capsules (5×9 mm, IVA Analysentechnik GmbH & Co. KG, Meerbusch, Germany). Carbon contents and 13C 12C isotope ratios of the samples were then determined with an elemental analyzer (Costech ECS 4010, NC Technologies, Bussero, Italy) coupled in helium continuous-flow mode to an IRMS (Delta V plus, ThermoFisher, Bremen, Germany).
2.4 Isotope calculations
Ratios of respiration to photosynthesis (R P) were determined according to Quay et al. (1995) with
where Ow and O represent the isotope ratios of oxygen in water and in DO, respectively. The photosynthesis fractionation factor (αp) was assumed to be 1.000 ± 0.003 (Russ et al., 2004; Stevens et al., 1975) and the respiration fractionation factor (αr) is commonly assumed with a value of 0.982 for community respiration (Quay et al., 1995).
The parameter , described in Eq. (3), accounts for the isotope ratio of net air–water fluxes and is calculated as
with αg being the fractionation factor for gas transfer velocities (0.9972 at 20 °C; Knox et al., 1992) and αs the fractionation factor for oxygen dissolution in water (1.0007 at 28 °C) as calculated by Benson and Krause (1984). The atmospheric oxygen isotopic ratio is known with a value of +23.9 ‰ (Dordoni et al., 2022). The ratio represents the concentration of DO in the sample relative to the maximum temperature-dependent equilibrium concentration after Henry's law. Multiplying this ratio by 100 is equal to DO saturation (DO %) as measured in the field.
This model assumes isotopic steady-state conditions, constant αr, and simplified gas exchange. Although it cannot resolve short-term variability such as diel cycles, these effects appear minor in the entire Danube mainstream and render the model suitable for this broad-scale seasonal and spatial assessment.
2.5 Statistical analyses
All statistical analyses were conducted in R (v.4.3.2; R Core Team, 2023) using the lm() function to create the linear model and anova() for variance analysis. The coefficient of determination (R2) was reported to evaluate the proportion of variance in δ18ODO explained by DO concentration (Fig. 6a, b) and POC concentration (Fig. 6c, d). To assess the effect of DO POC concentration on δ18ODO, we performed a one-way analysis of variance (ANOVA; Fisher, 1992) based on the following linear model:
where β0 is the intercept, β1 the regression coefficient, and ε the error term. ANOVA was used to determine whether the DO and POC concentration explains a significant proportion of the variance in δ18ODO. The p value from the F test was used to assess statistical significance with a commonly accepted threshold value α of 0.05.
To investigate seasonal variations in DO, δ18ODO, and POC concentrations, data were analyzed along the Danube River for the five different sampling campaigns in spring, summer, late summer, fall, and winter. DO concentrations showed clear seasonal fluctuations and variations, which ranged from 0.16 to 0.40 mmol L−1 (5.1 and 12.8 mg L−1) (Fig. 2a–d). The highest mean DO concentrations occurred during winter (0.36 mmol L−1 ± 0.01), while the lowest mean occurred in late summer (0.25 mmol L−1 ± 0.03). Spatial variability was most pronounced in summer 2023, late summer 2024, and spring 2024 (Fig. 2a, d). In contrast, concentrations during fall 2023 and winter 2024 showed little variation over the entire course of the river and ranged from ca. 0.30 to 0.35 mmol L−1 (Fig. 2b, c). As indicated by the red arrows in Fig. 2a, three DO maxima occurred during summer, with two being the most pronounced: first in the mid-Danube (∼ 1220 km; 0.35 mmol L−1) and second in the lower Danube (∼ 440 km; 0.40 mmol L−1). Similar but less pronounced patterns were also observed in spring and late summer. However, in these seasons, the downstream maximum did not exceed the upstream one, and blue arrows mark the DO minima.
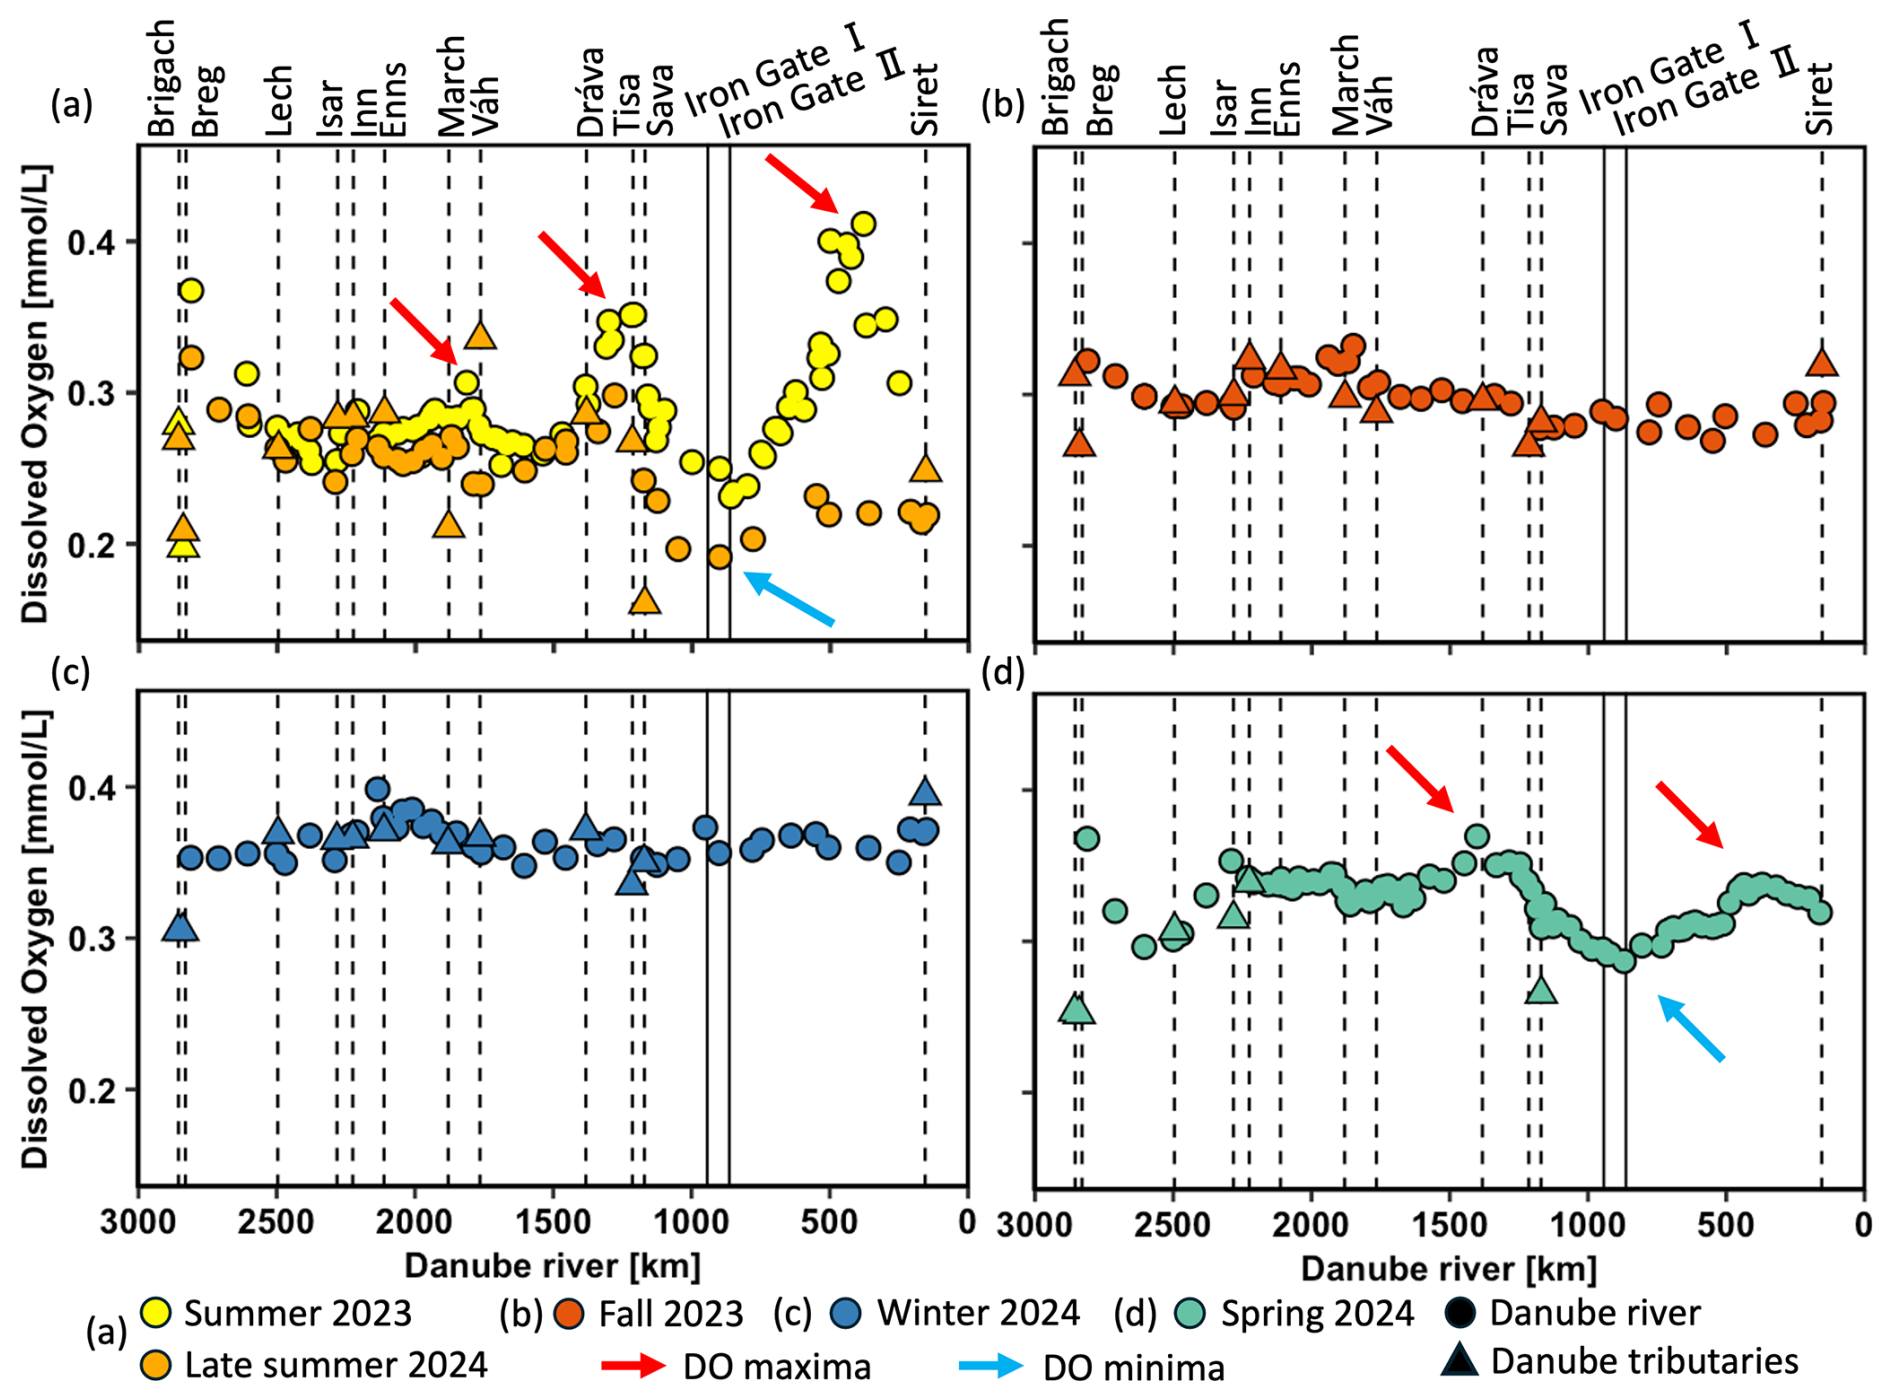
Figure 2Dissolved oxygen (DO) concentrations (mmol L−1) in the Danube River at various distances from the river mouth. Standard error bars are within the symbol size. Circles represent Danube River samples, triangles denote tributary samples, and dotted lines indicate the river kilometer where tributaries enter. Vertical solid lines represent the Iron Gate I and II dams. The red arrows show DO maxima and blue arrows DO minima.
DO stable isotope values (δ18ODO) ranged from +25.9 ‰ to +12.1 ‰ in the entire dataset (Fig. 3a–d). Here, the equilibrium with atmospheric oxygen (+24.6 ‰ ± 0.4 ‰) serves as the boundary value between photosynthesis and respiration (Dordoni et al., 2022). Values below this threshold refer to photosynthesis, while values above it refer to respiration. Consequently, samples from summer 2023, late summer 2024, and spring 2024 predominantly showed photosynthesis-driven signals with δ18ODO values lower than +24.6 ‰ (Fig. 3a, d). Conversely, samples from fall 2023 and winter 2024 often fell into the respiration range, even though they were close to the equilibrium (Fig. 3b, c). Variability in δ18ODO was highest during summer (+19.4 ± 3.2 ‰), late summer (+22.4 ± 2.3 ‰), and spring (+21.9 ± 1.4 ‰). On the other hand, fall and winter exhibited lower variabilities with +24.3 ± 1.1 ‰ and +24.7 ± 0.4 ‰. As shown by the red arrows in Fig. 3a, four minima in δ18ODO were observed during summer: one near the source region and three others at the same locations as the DO maxima. Among these, the two most pronounced occurred in the mid-Danube (+14.8 ‰) and the lower Danube (+12.1 ‰). In late summer, two δ18ODO minima occurred, with the upstream minimum being more pronounced than the downstream one. In spring, three smaller minima of δ18ODO appeared across the upper, middle, and lower Danube.
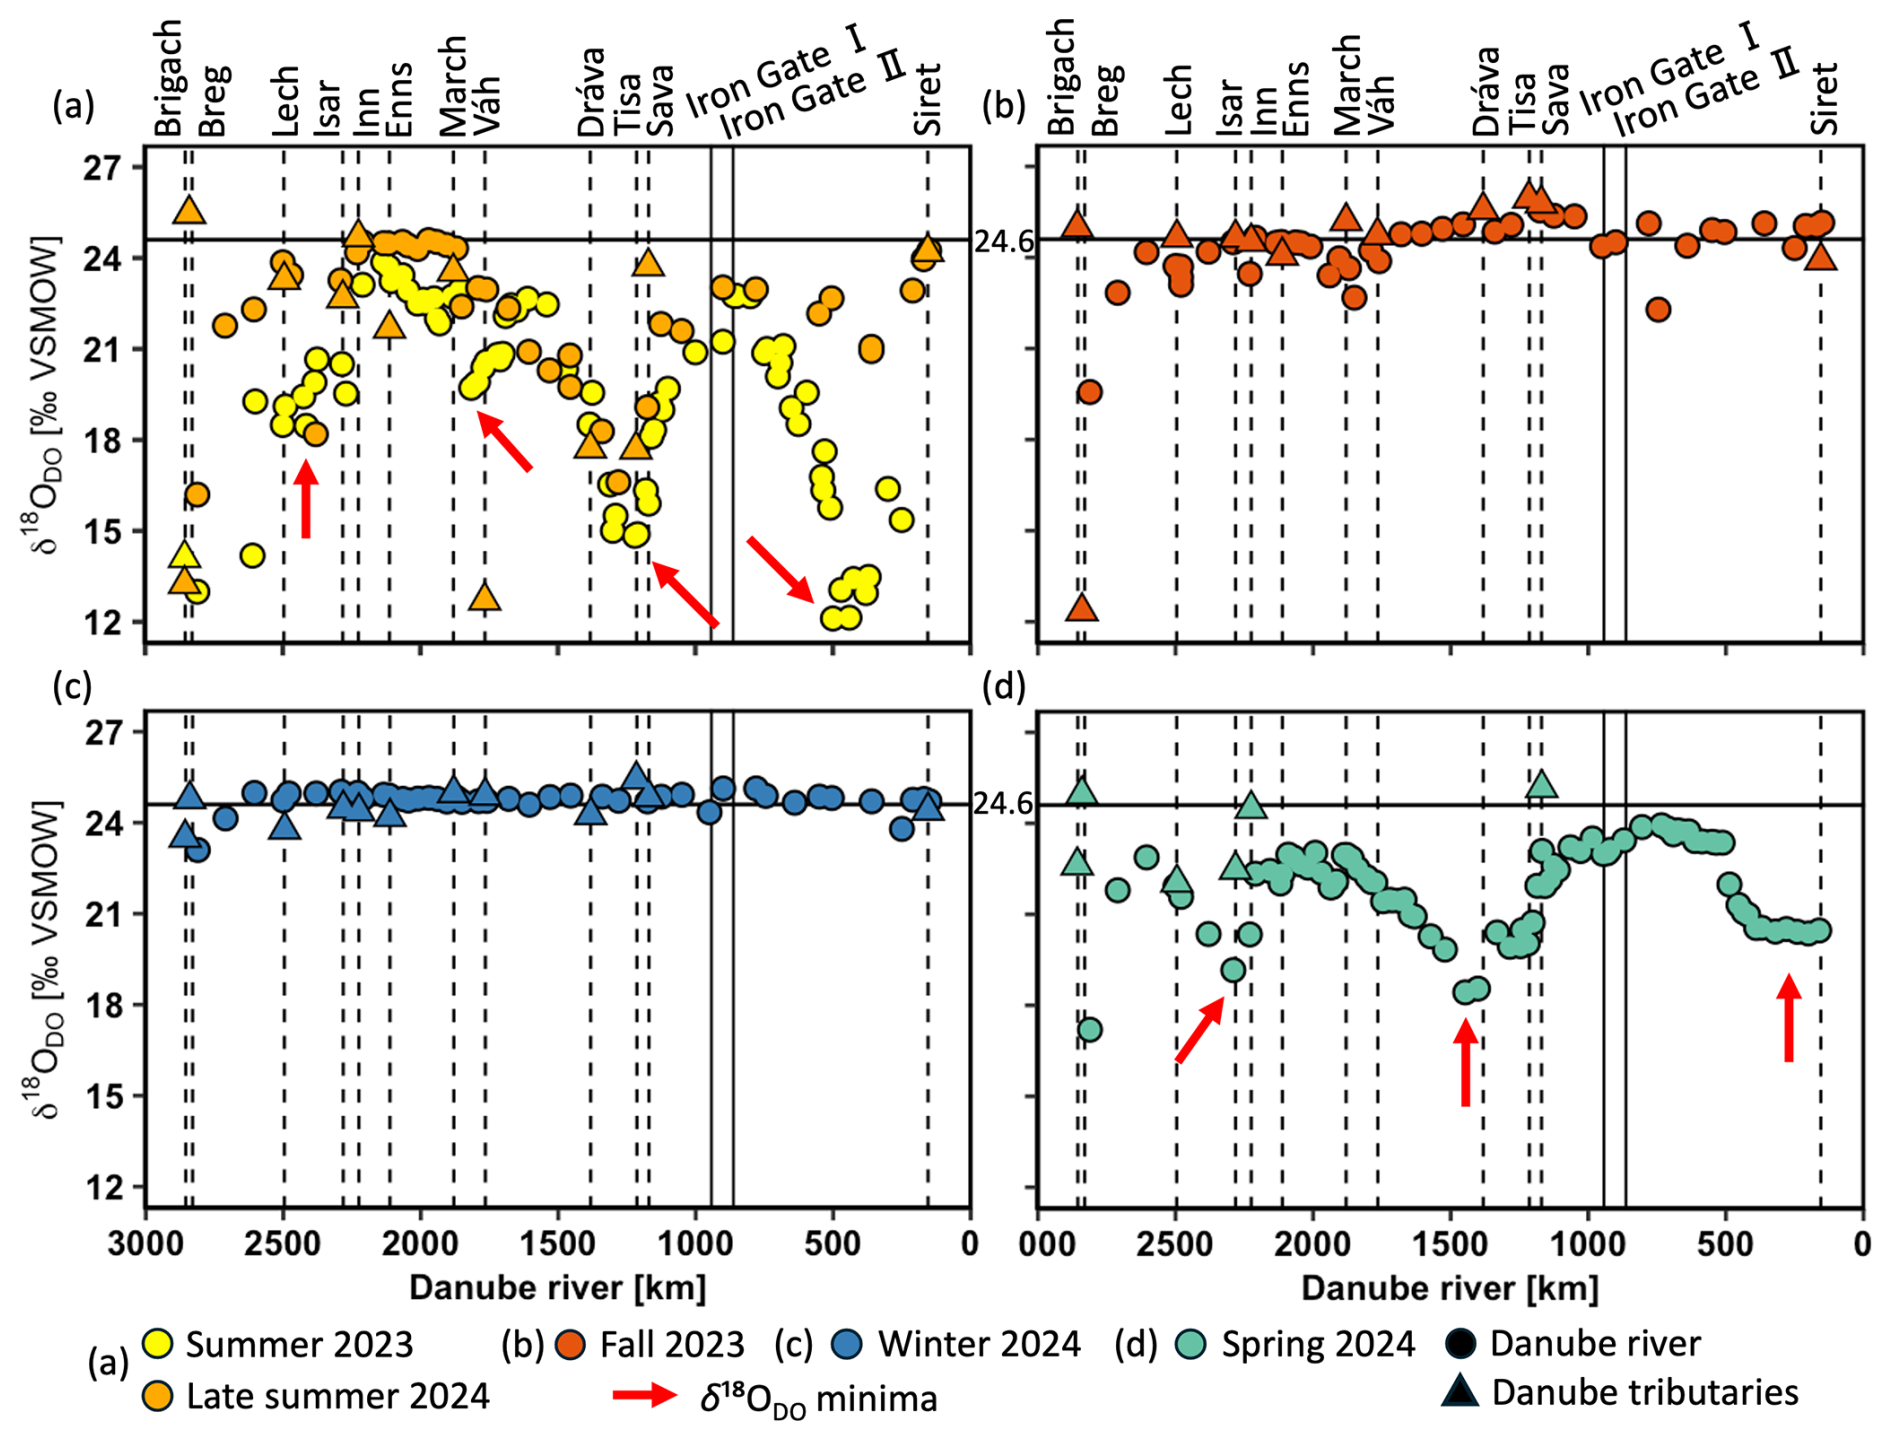
Figure 3Stable isotopes of dissolved oxygen (δ18ODO) in the Danube River at various distances from the river mouth. Standard error bars are within the symbol size. Circles represent Danube River samples, triangles denote tributary samples, and dotted lines indicate the river kilometer where tributaries enter. Vertical solid lines represent the Iron Gate I and II dams, and the horizontal solid line at +24.6 ‰ is the equilibrium for atmospheric oxygen. Values > +24.6 ‰ indicate respiration and < +24.6 ‰ photosynthesis. The red arrows show δ18ODO minima.
POC concentrations ranged from 0.01 to 0.26 mmol L−1 (0.1 to 3.1 mg L−1) (Fig. 4a–d) with pronounced seasonal fluctuations. Maxima in POC occurred in summer 2023, late summer 2024, and spring 2024, aligning well with elevated DO concentrations and inversely related δ18ODO minima. In contrast, POC levels in fall 2023 and winter 2024 were less variable and mostly remained below 0.10 mmol L−1. As highlighted by the red arrows in Fig. 4a, three maxima in POC concentrations were also observed during summer, with two being the most pronounced: the first one in the mid-Danube (∼1210 km; 0.25 mmol L−1) and the second in the lower Danube (∼500 km; 0.24 mmol L−1). Samples from late summer showed a scattered pattern, with slightly elevated values in the upper Danube, a weaker increase in the mid-Danube, and generally lower values downstream. Spring samples showed two peaks in the middle and lower Danube, where the downstream peak was smaller than the upstream one.
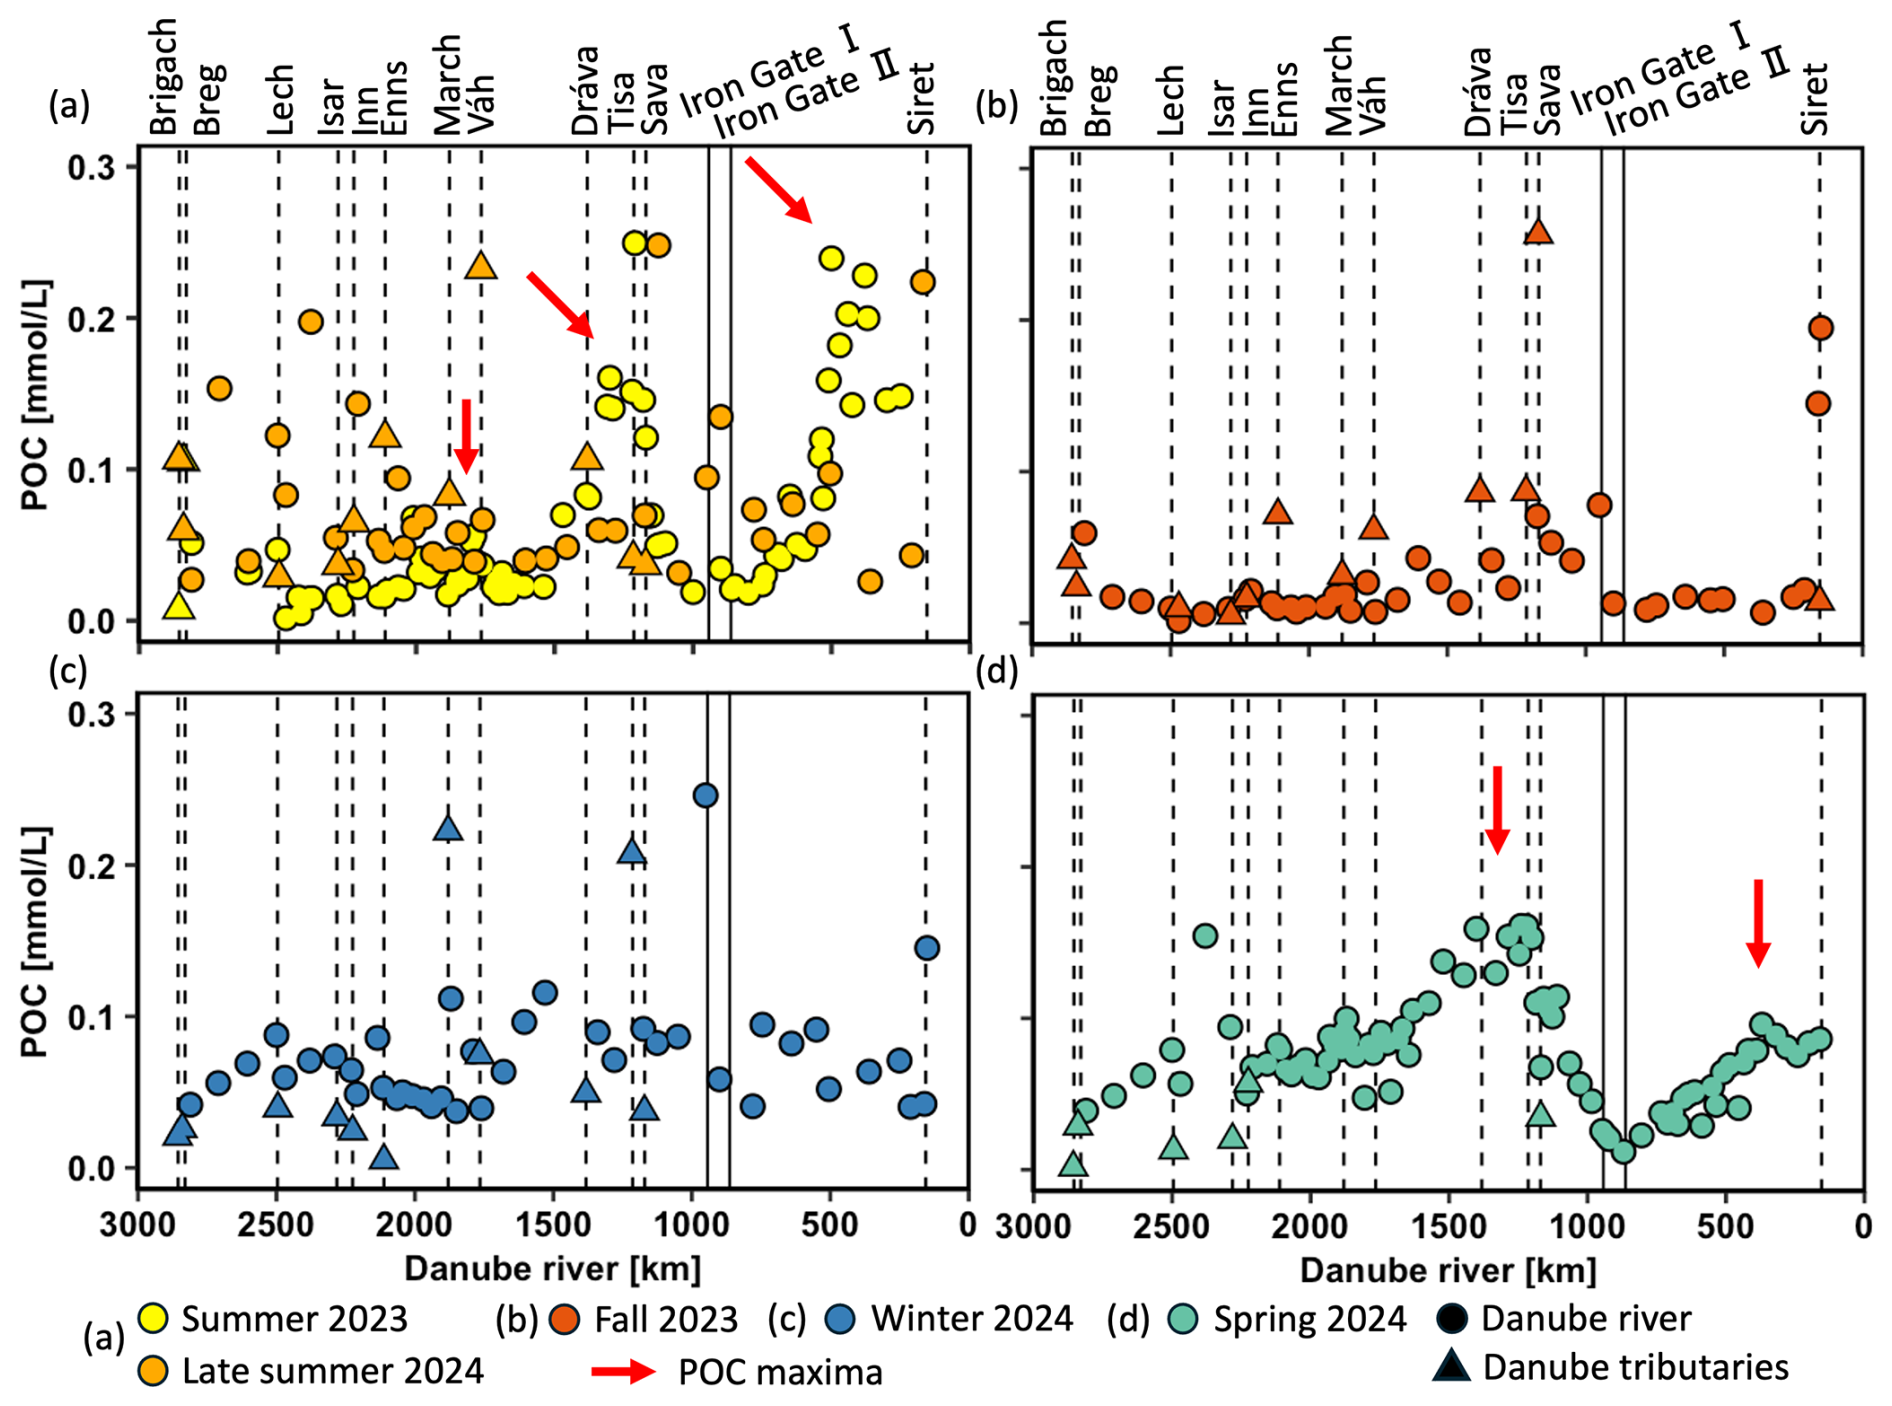
Figure 4Particular organic carbon (POC) concentrations (mmol L−1) in the Danube River at various distances from the river mouth. Standard error bars are within the symbol size. Circles represent Danube River samples, triangles denote tributary samples, and dotted lines indicate the river kilometer where tributaries enter. Vertical solid lines represent the Iron Gate I and II dams. The red arrows indicate POC maxima.
R P ratios are not plotted here over the entire range of the river but showed similar trends as shown for DO, δ18ODO, and POC (Fig. S1). However, a cross-plot between δ18ODO and the R P ratio showed a nonlinear relationship of both parameters (Fig. 5). R P ratios ranged from 0.1 in summer to 8.9 in fall. Spring and summer samples were more dominated by photosynthesis, with R P ratios smaller than 1, while winter and fall samples were more dominated by respiration, with R P ratios larger than 1. Late summer samples exhibited a mixed signal, with most values in a range of overlapping photosynthesis and respiration and R P values mostly larger than 1.
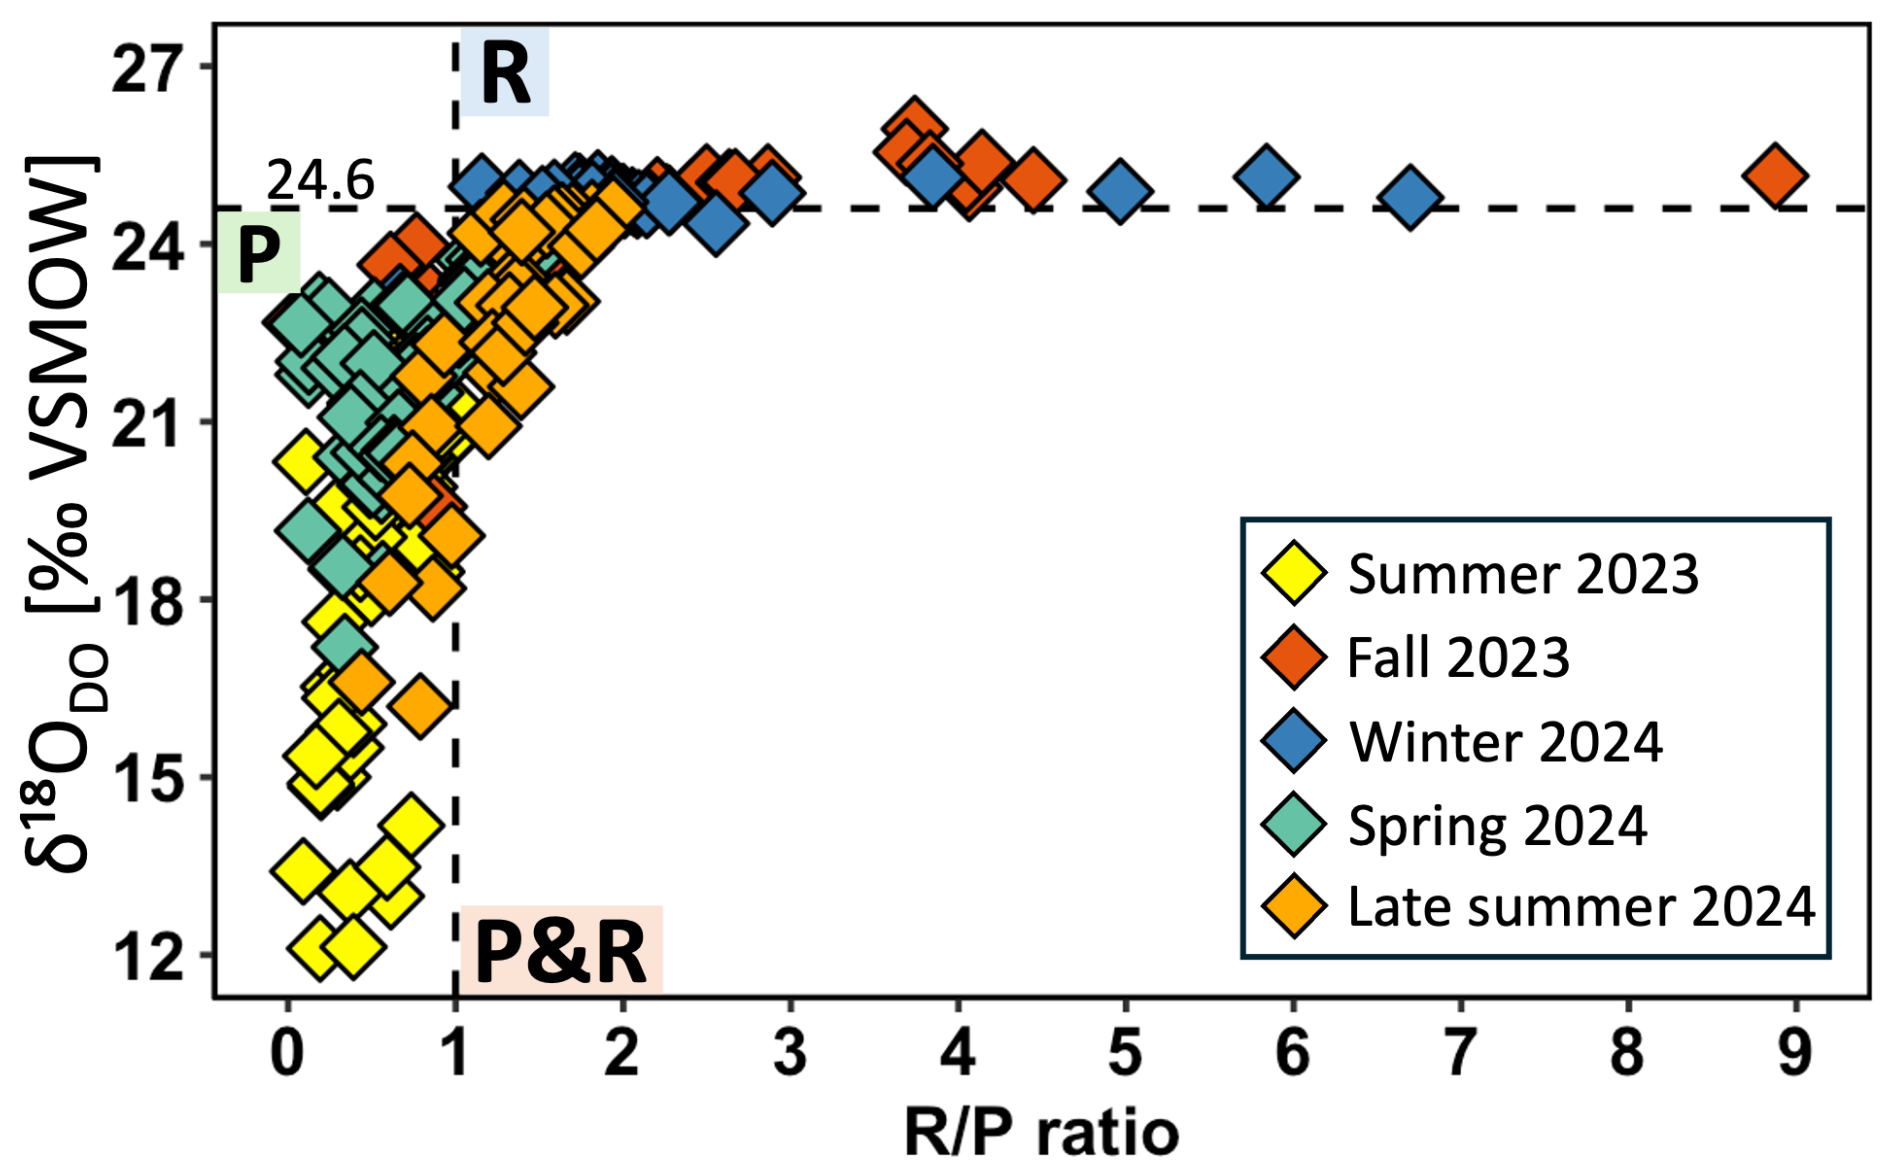
Figure 5Cross-plots of δ18ODO versus respiration photosynthesis (R P) ratios of the Danube River. The horizontal dotted line at +24.6 ‰ marks the equilibrium for atmospheric oxygen. Values of > +24.6 ‰ indicate respiration and < +24.6 ‰ photosynthesis. The vertical dotted line at R P = 1 denotes the transition between photosynthesis and respiration. R P values < 1 indicate dominance by photosynthesis and R P > 1 dominance by respiration.
Correlation plots between δ18ODO and DO concentrations are shown for spring and summer (Fig. 6a) and for late summer, fall, and winter (Fig. 6b). Here, the strongest and statistically significant correlations were observed in spring (R2 = 0.52, p < 0.05) and summer (R2 = 0.75, p < 0.05). In spring, higher DO coincided with lower δ18ODO, while in summer, this relationship was even stronger. In contrast, correlations weakened in late summer (R2 = 0.14, p < 0.05) and fall (R2 = 0.33, p < 0.05), even though they were still statistically significant. This suggests that while δ18ODO and DO are still related, other factors such as respiration, chemical processes, or elevated groundwater input likely contributed to δ18ODO variability. In winter (R2 = 0.04, p>0.05), no significant correlation was observed between the two parameters.
To further investigate potential biological influences on δ18ODO, it was correlated with POC concentrations at selected areas of high DO contents (ca. 1600 to 200 km) that were found during spring and summer (Fig. 6c) and for late summer, fall, and winter (Fig. 6d). The strongest and statistically significant correlations were observed in spring (R2 = 0.60, p < 0.05) and summer (R2 = 0.88, p < 0.05). In spring, this correlation was moderately strong, and increasing POC concentrations coincided with decreasing δ18ODO values. However, no direct biological influence on δ18ODO values could be identified in late summer (R2 = 0.16), fall (R2 = 0.06), and winter (R2 = 0.13), as reflected by weak, nonsignificant correlations (p>0.05).
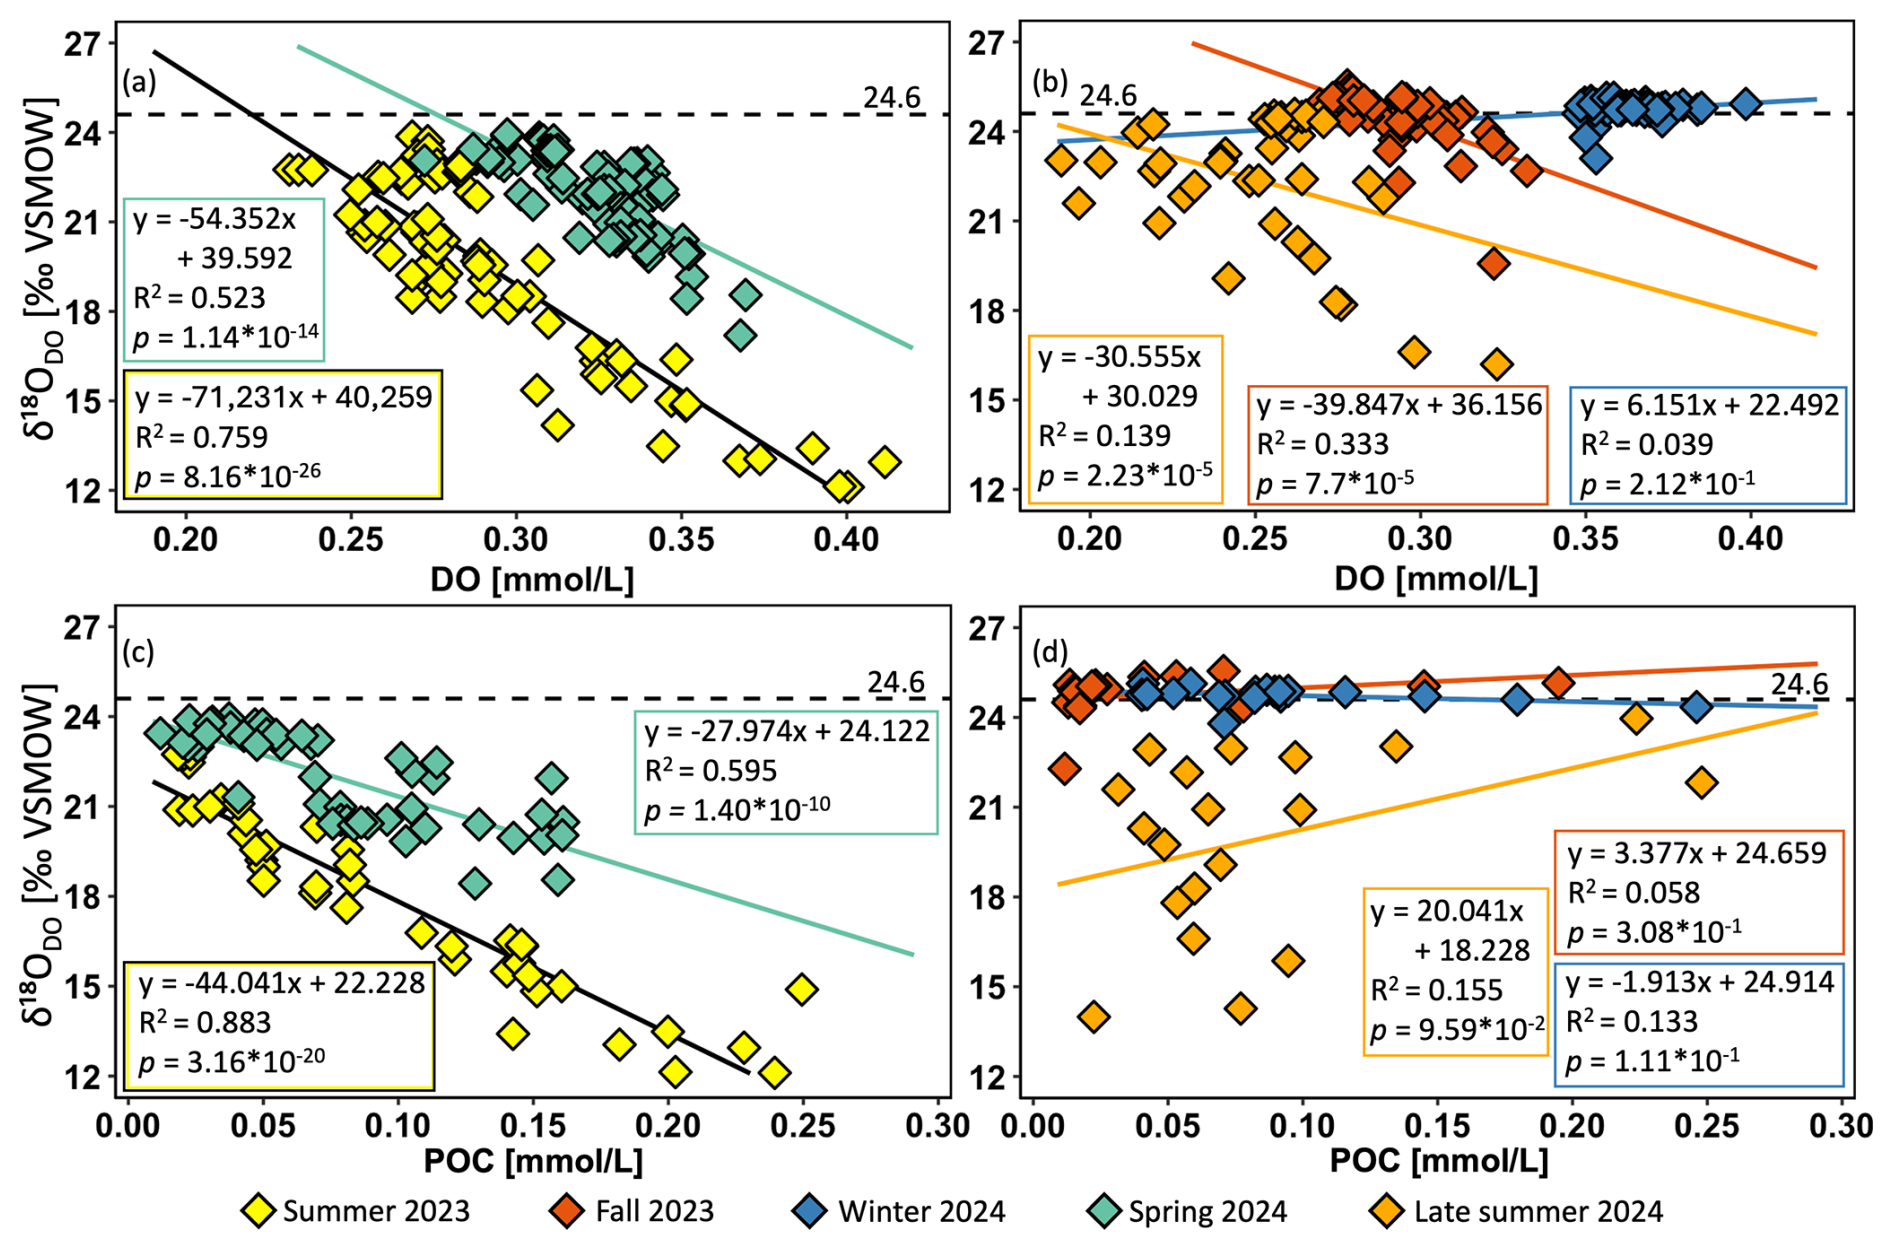
Figure 6Correlation plots for all Danube sampling locations of δ18ODO and dissolved oxygen (DO) in summer and spring (a) and in late summer, fall, and winter (b). High-productivity-area (∼ 1600 to ∼ 200 km) correlation plots of δ18ODO and particulate organic carbon (POC) for the same periods are presented to highlight potential biological inputs (c, d). The negative correlation indicates that POC increases as δ18ODO values decrease. This pattern is consistent with biological oxygen production (< +24.6 ‰) and consumption (> +24.6 ‰), as oxygen produced by algal activity is usually enriched in 16O when compared to the atmosphere. These results support the role of algae-derived organic matter in influencing the δ18O signature of dissolved oxygen.
4.1 Seasonal dynamics
Seasonal variations in DO and δ18ODO along the Danube River are primarily influenced by temperature, biological activity, and atmospheric exchange. During winter, colder water temperatures decreased to 6.5 °C and thereby enhanced O2 solubility (Fig. S2c) (Rettich et al., 2000). Additionally, higher river discharge and associated turbulence likely accelerated atmospheric oxygen exchange and contributed to the highest DO concentrations measured throughout the year (Figs. 2c, S3, S4c) (Vautier et al., 2020). The associated δ18ODO data support this interpretation because values remained consistently close to those expected for atmospheric equilibrium (± 24.6 ‰ ± 0.4 ‰) (Figs. 3c, S5). Although respiration must have occurred as well, its overall impact on the DO budget was likely minimal and largely masked by continuous atmospheric equilibration (Figs. 3c, 6b). At first glance, associated R P ratios might contradict this interpretation with values larger than 1 (Figs. 5, S1c). However, according to Dordoni et al. (2022), true dominance of respiration only becomes evident when R P ratios exceed 2. Therefore, winter conditions reflect a mixed signal, with minor respiration influences and dominant atmospheric exchange.
With rising temperatures and longer daylight in spring, biological activity became more prominent and led to moderate to high DO concentrations (Figs. 2d, S2d, S3) (Wetzel, 2011). The associated δ18ODO values indicated enhanced photosynthetic activity, as they gradually shifted from atmospheric equilibrium toward less positive values (Figs. 3d, S5). Such a photosynthesis increase was further confirmed by slight rises in POC concentrations when compared to winter. While some of this POC may have originated from external sources, such as soil material washed into the river (Aramaki et al., 2010; Reddy et al., 2021), the concurrent buildup of POC, DO, and δ18ODO suggests an accumulation of algae biomass driven by in-river photosynthetic activity (Figs. 2d, 3d, 4d). A moderate but statistically significant correlation between DO concentration and their δ18ODO values (R2 = 0.52, p < 0.05) further supported direct influences of photosynthesis on DO, thus highlighting the link between oxygen production and its photosynthetic source. Although photosynthesis predominantly influenced DO in spring, atmospheric exchange likely remained a significant contributor. This process was likely supported by cool temperatures that remained below 18 °C and elevated discharge rates that also increased turbulent flow (Figs. S2d, S3d). Moreover, the interplay between biological and physical processes was also reflected by R P ratios (Figs. 5, S1d). Most of these ratios remained below 1 and indicated shifts towards photosynthesis. However, occasional mixed signals, with R P ratios around and larger than 1, suggest that both atmospheric exchange and respiration processes also influenced the river's DO budget.
The intensification of biological activity in summer was most evident by δ18ODO values that decreased to +12.1 ‰ (Figs. 3a, S5). This distinct shift marks the time of peak photosynthetic activity in the Danube and is particularly notable because such pronounced deviations from atmospheric equilibrium are typically observed in standing waters (e.g., Quay et al., 1995; Wassenaar, 2012) or smaller streams (e.g., Parker et al., 2010; Wassenaar et al., 2010), but rarely in larger river systems (Quay et al., 1995), and support our finding that rivers are capable of strong photosynthetic DO input. The strong photosynthetic signal was further reflected in the increases in POC concentrations, which indicate an accumulation of organic matter. Overall, the simultaneous increases in POC and DO, along with parallel decreases in δ18ODO and characteristic fluctuations in R P ratios that also consistently fell below 1 in summer, underscore intensified photosynthetic activity (Figs. 2a, 3a, 4a, 5, S1a). The strong linear correlation and statistical significance between δ18ODO and DO further confirm this relationship (R2 = 0.76, p < 0.05; Fig. 6a). These indicators reflect the preferential input of 16O via photosynthetic water splitting, a process that proceeds without isotopic fractionation (Mader et al., 2017). Interestingly, despite such strong biological DO inputs, DO concentrations were often lower in summer when compared to winter and spring (Fig. S3). These declines in DO concentrations can be attributed to higher water temperatures (Fig. S2), which reduce O2 solubility (Rettich et al., 2000). Another factor that may have reduced DO could have been the simultaneous decomposition of POC by respiration. If so, and while this process likely contributed to DO depletion, its impact on POC levels must have been minor. In fact, POC input appeared to outperform its consumption, as indicated by rising concentrations (Fig. 4a). However, it is possible that short-term fluctuations in POC were not fully captured by the sampling frequency, which implies that elevated POC levels do not necessarily contradict intensified decomposition activity under warmer conditions. Although DO levels were higher in winter, photosynthetic DO production likely played an important ecological role during warmer periods, when solubility was reduced despite enhanced atmospheric O2 exchange rates. However, such photosynthetic DO increases may also be associated with declines during nighttime due to ongoing respiration. In riparian zones and in headwaters this process may have been more important than in the main river, where our limited night measurements indicated only minor diel variations. Notably, recent research has shown that δ18ODO responds more sensitively to metabolic shifts than DO concentrations, as it can detect transitions between photosynthesis and respiration before they become evident in net DO concentrations (Dordoni et al., 2024). Such observations justify the additional application of stable isotopes.
Late summer samples differed from those of mid-summer, despite similar water temperatures (Fig. S2a). During this later period, DO concentrations reached their lowest levels, particularly in the Sava River, where oxygen levels decreased to 0.16 mmol L−1. After its confluence with the Danube, DO levels showed a slight recovery but remained depleted at around 0.20 mmol L−1 (see blue arrow in Fig. 2a). Given that healthy aquatic systems should maintain DO levels above 0.156 mmol L−1 (WHO, Atlas Scientific), these late summer values raise concerns about critical oxygen depletion. This concern is further supported by a shift in R P ratios from a photosynthesis-dominated signal (R P < 1) to a mixed signal (R P > 1) (Figs. 5, S1a), thus indicating that respiration rates had begun to exceed those of photosynthesis. In parallel, DO saturations increasingly fell below 100 %, thus suggesting net oxygen production and further supporting the interpretation of enhanced respiration. Additionally, compared to mid-summer, the weakening correlation between DO and δ18ODO (R2=0.14) suggests a reduced influence of photosynthesis and a relatively greater contribution of respiration or atmospheric exchange, both of which can introduce more variable isotopic signatures and alter the relationship (Fig. 6b). A combination of declining primary production, enhanced respiration, and potential organic matter decomposition likely contributed to the observed decrease in DO concentrations.
In fall, declining water temperatures increased O2 solubility and led to a moderate rise in DO concentrations when compared to late summer (Figs. 2b, S2b) (Rettich et al., 2000). These temperature decreases also contributed to a more homogeneous DO distribution along the entire river system, which showed a large-scale seasonal effect that contrasted with the localized areas of high DO production in summer. This seems plausible because such temperature shifts by changing seasons can affect an entire river system. As a result, δ18ODO values shifted towards more positive values and approached those of atmospheric exchange (Figs. 3b, S5). On the other hand, reduced light intensity and a decline in photosynthetic activity during fall also affected the entire river system (Aruga, 1965; Collins and Boylen, 1982). With the decline in photosynthesis, respiration became the dominant process, as also reflected by R P ratios that were mostly above 2, especially in the lower section of the Danube (Figs. 5, S1b). This transition from photosynthesis to a respiration-dominated river was likely further enhanced by the accumulation of organic material over the summer, which provided fresh biomass for decomposition by respiration in fall (DeNicola, 1996; Uehlinger et al., 2000). Although in fall, increased respiration was evident in the R P ratios, δ18ODO levels remained close to atmospheric equilibrium (Figs. 3b, S5). This pattern suggests that during this time, the Danube system is buffered by atmospheric O2 exchange, which serves as a crucial DO source, preventing DO depletion despite the dominance of respiration.
Overall, seasonal fluctuations in DO and δ18ODO along the Danube River were primarily influenced by temperature, associated atmospheric exchange, and biological activity. In spring and summer, photosynthesis was an important process that increased DO and lowered δ18ODO, while in late summer, enhanced respiration became more predominant and caused lower DO levels and higher δ18ODO, particularly evident in the Sava tributary. With cooler temperatures in fall, DO levels recovered, although respiration remained an important driver. In winter, oxygen solubility was the dominant control, with minimal biological influence.
4.2 Areas of increased primary production
Beyond the seasonal dynamics, our data revealed three areas of increased DO production. They occurred during the warm season, with one area located in the middle and the other in the lower section of the river. These areas were characterized by elevated DO and POC concentrations, while δ18ODO showed corresponding decreases (Figs. 2a, d; 3a, d; 4a, d, S6a–c). Especially the pronounced decline in δ18ODO indicated enhanced photosynthesis, which has already been identified as the primary driver of oxygen production during the warmer months (Fig. 6a, b). The strong photosynthetic impact is further supported by correlations between δ18ODO values and POC concentrations (Fig. 6c). This relationship indicates the importance of autotrophic organisms as key DO sources in these highly productive river sections during spring and summer and is supported by previous studies on the Danube (Hein et al., 1999; Riedler and Schagerl, 1998).
As the warm season progressed, the correlation between δ18ODO and POC strengthened, thus reflecting the increasing role of autotrophic production, with a moderate correlation in spring (R2 = 0.60) that became even stronger in summer (R2 = 0.88). These positive correlations indicate that a substantial portion of the organic material must have originated from primary producers and directly contributed to the formation of these maxima. This pattern aligns well with the composition of the Danube's phytoplankton community, which is primarily composed of diatoms, alongside notable co-occurrence of Cyanobacteria, Chlorophyta, and Cryptophyta. In particular, the downstream shift from benthic to planktonic diatoms, observed by Liška et al. (2021), likely supported enhanced primary production in the middle and lower Danube and supports the 16O-enriched isotope signals. Although the same areas of elevated productivity did not change in late summer (Figs. 2a, 3a, 4a), the previously strong correlation disappeared during this period (Fig. 6d). This lack of correlation may result from the gradual depletion of DO and POC during this transition period, thereby suggesting a weakening of autotrophic activity. At the same time, the increasing influence of allochthonous POC sources (i.e., material transported into the river) may have further decoupled the relationship between δ18ODO and POC. Despite occasionally elevated DO levels, this seasonal shift likely reflects a decline in primary production as environmental conditions changed and the relative contribution of autotrophic material to the overall organic matter pool decreased.
The link between primary producers and DO observed in this study is further supported by previous research on the Danube. For instance, phytoplankton data from Literáthy et al. (2002) showed that the highest biomass occurred in the middle section of the river, thus aligning with the area identified by our study and supporting the connection between increased primary production and DO-rich zones. Furthermore, Dokulil (2015) highlighted findings from several chlorophyll a studies in the Danube that indicated peak algae growth during summer with significant temporal variations in both the intensity and timing of algae blooms across several years (e.g., 1988, 1998, and 2001). The agreement between these findings and our data suggests that algal blooms occur regularly in this section of the Danube, thus contributing to and reinforcing seasonal variations.
One key factor that influences these areas of increased productivity is the decreasing flow gradient of the Danube (Fig. S6d). According to Habersack et al. (2016), the riverbed slope decreases in its middle section from a steeper gradient of about 0.4 % in the upper Danube to a much flatter gradient of about 0.1 %. The observed decrease in slope begins in the region of the first lower-productivity area and becomes increasingly pronounced towards the second and third high-productivity area in the middle and lower Danube. This reduction in slope decreases the velocity of the river and creates flow conditions that favor primary producers. In addition, slower flow velocities enhance sedimentation, which in turn decreases turbidity and light penetration and further supports photosynthetic activity. These conditions also align with findings of Dokulil (2006, 2015), who identified the middle reach of the Danube as an optimal zone for primary production due to moderate flow velocities and increased light availability. Moreover, the Danube had low to moderate discharge levels during summer that could further intensify these effects (Fig. S4a). While not at its lowest, this discharge still enables longer water residence times that increase light exposure for algae and create favorable growth conditions (Kamjunke et al., 2021; Weitere and Arndt, 2002).
Another factor that may have contributed to the observed productivity patterns is the proximity of Budapest (Fig. S6a–d). Located upstream of the productivity maximum in the mid-Danube, it could influence primary production through nutrient inputs. Urban areas such as Budapest are known sources of nutrient pollution due to wastewater discharge (Nyenje et al., 2010; Xia et al., 2016), while agricultural activities further contribute to nutrient loading. However, our analyses were unable to reveal links between nutrient concentrations, POC, DO levels, and δ18ODO values. For instance, nitrate concentrations were around a mean value of 0.10 mmol L−1 ± 0.0025 (standard error) throughout the year and along the entire river (Fig. S7a–d), while phosphate levels remained consistently below the detection limit. These results align well with previous findings published by Liška et al. (2021), who reported stable nitrate concentrations in the Danube over the past decades without noticeable peaks from potential point sources. One possible explanation is that primary producers rapidly absorb and utilize available nutrients and prevent their accumulation in measurable concentrations (Joint et al., 2001; Wetzel, 2011). This mechanism could explain the observed productivity patterns, despite minimal variance in nutrient levels, and may particularly account for undetectable phosphate concentrations because this nutrient is rapidly taken up by primary producers. To further investigate this possibility, more detailed studies on aquatic biomass and nutrient uptake processes would be required.
Following the upstream productivity maximum near Budapest, DO concentrations declined abruptly, together with decreases in POC and increases in δ18ODO values (Figs. 2a, d, 3a, d, 4a, d). Previous studies have also documented reductions in phytoplankton biomass and chlorophyll a concentrations in this region (Dokulil, 2006, 2015; Dokulil and Kaiblinger, 2008; Literáthy et al., 2002). These patterns suggest that external factors, particularly the inflows of the Tisa and Sava rivers, play a role. Both tributaries introduce large volumes of water and contribute to substantial dilution in the main course of the Danube. Although the Tisa and Sava rivers could not be sampled during all campaigns, data from late summer and spring indicate that they contain lower DO concentrations (Fig. 2a, d), higher δ18ODO values, and reduced POC levels compared to the main stem of the Danube (Figs. 3a, d, 4a, d). This observation supports dilution as a plausible mechanism for the observed decrease. Further evidence arises from previous studies, which estimated that this confluence with the Danube becomes diluted by approximately 27 % during average discharge conditions (Dokulil, 2015). Discharge data from summer and spring confirm this effect and show a substantial increase in total river discharge following the confluence with these tributaries (Fig. S4a, d). Additionally, the inflow of the Morava River (not analyzed in this study) likely added further dilution effects (Dokulil, 2015). Moreover, a similar dilution effect likely occurred between the smaller upstream increase and the mid-Danube productivity maximum. In this case it was influenced by the March and Váh rivers. Although not sampled during summer, both tributaries contribute substantial discharge and likely carry water with lower DO and POC and higher δ18ODO, thereby contributing to the observed decline.
Beyond these hydrological factors, land use, including agriculture and urbanization across the basin, may act as a key driver of DO dynamics. Although nitrate levels remain relatively low and indicate no critical eutrophication risk, these inputs still support the observed productivity maxima. To better trace and understand sources and transformation of land use and associated nutrient influences on DO dynamics, further investigations with detailed GIS mapping and other tracers such as nitrogen isotopes may be necessary.
Further downstream, the Danube featured a second and even more intense productivity zone with similar patterns to the upstream peak area. While this area shows increased chlorophyll a and suspended solids (Dokulil, 2015; Dokulil and Kaiblinger, 2008), phytoplankton biomass does not rise accordingly (Literáthy et al., 2002), thus suggesting an unconventional productivity pattern. On the other hand, a pronounced decrease in δ18ODO indicated active photosynthesis despite potential phytoplankton growth limitations (Wetzel, 2011). Notably, this region exhibited the lowest δ18ODO values in the study, along with R P ratios close to 0 in summer, thus underscoring the significance of photosynthetic activity (Figs. 5, S1a). These findings align with those of Dokulil (2006, 2015), who reported that despite significant increases in chlorophyll a, primary production remained low due to poor light availability in the water column that in turn may have been caused by elevated turbidity. Similar to the upstream peak, the emergence of this second productivity zone coincided with a decrease in the river gradient (0.05 %–0.01 %) that likely fosters favorable hydrodynamic conditions for algae (Habersack et al., 2016).
The spatial patterns observed also coincide with the above-discussed seasonality. They enhance spatial DO dynamics and play a crucial role, as the second-most productive area is clearly visible in summer but weakens and even disappears by late summer (Figs. 2a, 3a). Initially, the peak was driven by primary production, but as the season progressed, it declined rapidly. This decrease was also reflected by the absence of a pronounced δ18ODO peak and a shift in R P ratios toward respiration in late summer (Figs. 5b, S1a) and highlights growing influences of heterotrophic processes, particularly in the lower section of the river. Additionally, the decreasing correlation between δ18ODO and POC concentration in late summer suggests a shift towards respiration (Fig. 6d). While a strong correlation in summer indicated active primary production, this link weakened as phytoplankton started to decompose, thus leading to organic matter accumulation and increased microbial respiration. This transition further supports the interpretation that the second peak was initially fueled by photosynthesis during slow flow but shifted toward organic matter degradation as the season progressed. Therefore, areas with shallow gradients not only promote algal growth but also facilitate biomass accumulation and subsequent respiration, making them key zones of enhanced biogeochemical activity in the river.
Connecting these findings with previous research underscores the critical role of primary producers in shaping oxygen dynamics and in influencing organic material distribution across the Danube River. The persistence of intensive algae growth also highlights the need for stricter compliance with EU regulations on water quality. Since DO serves as a key parameter for assessing ecosystem health, further monitoring is essential to mitigate human-induced impacts and maintain balanced aquatic conditions in the Danube system.
Our study demonstrated that seasonal variations in temperature, biological activity, and hydrodynamic conditions drive complex seasonal and spatial DO dynamics in the Danube River. In spring and summer, enhanced photosynthesis raised POC and DO levels while lowering associated δ18ODO values. This precise source identification is novel in the Danube River and serves as a crucial indicator of ecosystem health. Photosynthetic effects were particularly evident in two areas of higher productivity where reduced slopes resulted in slower flow velocities and lower turbulence. In these zones, where river conditions approached those of standing waters, primary producers played a critical role, as shown by strong correlations between δ18ODO and POC. These findings underscore the importance of autotrophic DO production in the Danube and suggest that with rising temperatures and resulting reduced DO solubility the ecosystem may increasingly rely on this internal form of oxygen input. However, tributary inflows from the Tisa and Sava rivers diluted biomass and organic material inputs and contributed to declines in DO and POC levels downstream.
Although the Danube River's water quality has improved over last three decades, vulnerable sections such as the Sava and lower Danube continue to face the risk of further DO depletion. This risk is especially pronounced during late summer and early fall, when photosynthetic oxygen production declines and respiration intensifies while the river is often still too warm to dissolve sufficient atmospheric O2. With ongoing climate warming, these potential DO deficits are expected to worsen, a trend likely to extend to other temperate large river systems.
By integrating high-resolution measurements of DO, δ18ODO, POC, and R P ratios, our study identified new arrays of biogeochemical processes that regulate DO. Notably, DO concentrations alone are often insufficient to identify their sources, but when combined with δ18ODO values, relative contributions of different sources (photosynthetic and atmospheric input) and sinks (respiration) become clearer. Such knowledge is crucial for future river management and may help to plan ecological conservation amid increasing environmental pressures. We therefore recommend high-resolution monitoring of DO and its sources and sinks, with a particular focus on vulnerable regions with critically low DO in late summer. The potential to identify DO sources and sinks with the application of stable isotopes in other aquatic systems offers a powerful tool for understanding and conserving diverse aquatic ecosystems.
The dataset is stored and available on PANGAEA under https://doi.org/10.1594/PANGAEA.983395 (Maier et al., 2025).
The supplement related to this article is available online at https://doi.org/10.5194/bg-22-5123-2025-supplement.
JM: sampling, conceptualization, formal analysis, investigation, methodology, visualization, and writing (original draft preparation). ANV: conceptualization, formal analysis, investigation, methodology, visualization, and writing (original draft preparation). CMS: investigation, methodology, visualization, and writing (original draft preparation). STW: investigation, methodology, visualization, and writing (original draft preparation). JACB: conceptualization, resources, supervision, and writing (original draft preparation).
The contact author has declared that none of the authors has any competing interests.
Publisher's note: Copernicus Publications remains neutral with regard to jurisdictional claims made in the text, published maps, institutional affiliations, or any other geographical representation in this paper. While Copernicus Publications makes every effort to include appropriate place names, the final responsibility lies with the authors.
Discharge visualization used in this paper was produced by the International Commission for the Protection of the Danube River (ICPDR). We acknowledge and appreciate their contribution to the availability and accessibility of valuable data for our research. We acknowledge OpenAI's ChatGPT for its support in statistical computations and creating R-based visualizations. We also express our gratitude to Christian Hanke, Irene Wein, Anja Schuster, and Robert van Geldern for providing technical and analytical support. We further thank SE-Tours GmbH and nicko Cruises Schiffreisen GmbH for allowing us to join their cruises at partially reduced prices to conduct our sampling from their ships. Their cooperation has greatly facilitated our research.
This research has been supported by the DALIA project – project no. 101094070.
This paper was edited by Perran Cook and reviewed by Marlene Dordoni and David Piatka.
Acreman, M. and Dunbar, M. J.: Defining environmental river flow requirements – a review, Hydrol. Earth Syst. Sci., 8, 861–876, 2004.
Aramaki, T., Nagao, S., Nakamura, Y.-H., Uchida, M., and Shibata, Y.: The Effects of Rainfall on Carbon Isotopes of POC in the Teshio River, Northern Japan, Radiocarbon, 52, 808–814, 2010.
Aruga, Y.: Ecological Studies of Photosynthesis and Matter Production of Phytoplankton II. Photosynthesis of Algae in Relation to Light Intensity and Temperature, Tokyo, 78, 360–365, 1965.
Baertschi, P.: Absolute 18O content of standard mean ocean water, Earth Planet. Sc. Lett., 31, 341–344, 1976.
Barth, J. A. C., Tait, A., and Bolshaw, M.: Automated analyses of 18O 16O ratios in dissolved oxygen from 12-mL water samples, Limnol. Oceanogr. Method., 2, 35–41, https://doi.org/10.4319/lom.2004.2.35, 2004.
Belletti, B., Rinaldi, M., Buijse, A. D., Gurnell, A. M., and Mosselman, E.: A review of assessment methods for river hydromorphology, Environ. Earth Sci., 73, 2079–2100, https://doi.org/10.1007/s12665-014-3558-1, 2015.
Benson, B. B. and Krause, D.: The concentration and isotopic fractionation of oxygen dissolved in freshwater and seawater in equilibrium with the atmosphere, Limnol. Oceanogr., 29, 620–632, https://doi.org/10.4319/lo.1984.29.3.0620, 1984.
Benson, B. B., Krause, D., and Peterson, M. A.: The Solubility and Isotopic Fractionation of Gases in Dilute Aqueous Solution, I. Oxygen, J. Solution Chem., 8, 655–690, 1979.
Borgwardt, F., Robinson, L., Trauner, D., Teixeira, H., Nogueira, A. J. A., Lillebø, A. I., Piet, G., Kuemmerlen, M., O'Higgins, T., McDonald, H., Arevalo-Torres, J., Barbosa, A. L., Iglesias-Campos, A., Hein, T., and Culhane, F.: Exploring variability in environmental impact risk from human activities across aquatic ecosystems, Sci. Total Environ., 652, 1396–1408, https://doi.org/10.1016/j.scitotenv.2018.10.339, 2019.
Carpenter, S. R., Caraco, N. F., Correll, D. L., Howarth, R. W., Sharpley, A. N., and Smith, V. H.: Nonpoint pollution of surface waters with phosphorus and nitrogen, Ecol. Appl., 8, 559–568, https://doi.org/10.1890/1051-0761(1998)008[0559:NPOSWW]2.0.CO;2, 1998.
Collins, C. D. and Boylen, C. W.: Physiological responses of Anabeana Variabilis (Cyanophyceae) to instantaneous exposure to various combination of light intensity and temperature, J. Phycol., 18, 206–211, https://doi.org/10.1111/j.1529-8817.1982.tb03175.x, 1982.
Coplen, T. B.: Guidelines and recommended terms for expression of stable-isotope-ratio and gas-ratio measurement results, Rapid Commun. Mass Sp., 25, 2538–2560, https://doi.org/10.1002/rcm.5129, 2011.
DeNicola, D. M.: Periphyton responses to temperature, in: Algal Ecology: Freshwater Benthic Ecosystems, edited by: Stevenson, R. J., Bothwell, M. L., and Lowe, R. L., Academic Press, San Diego, 149–181, ISBN 978-0-12-668450-6, 1996.
Dokulil, M. T.: Assessment of potamoplankton and primary productivity in the river Danube: A review, in: Proceedings 36th International Conference of IAD, Austrian Committee Danube Research/IAD, 1–5, 2006.
Dokulil, M. T.: Phytoplankton of the River Danube: Composition, Seasonality and Long-Term Dynamics, The Danube River Basin, 411–428, https://doi.org/10.1007/698_2014_293, 2015.
Dokulil, M. T. and Kaiblinger, C. M.: Phytoplankton, in: Joint danube survey 2, edited by: Liska, I., Wagner, F., and Slobodnik, J., Final Scientific report, ICPDR, http://www.icpdr.org/main/activities-projects/joint-danube-survey-2 (last access: 9 March 2025), 2008.
Dordoni, M., Seewald, M., Rinke, K., Schmidmeier, J., and Barth, J. A. C.: Novel evaluations of sources and sinks of dissolved oxygen via stable isotopes in lentic water bodies, Sci. Total Environ., 838, 156541, https://doi.org/10.1016/j.scitotenv.2022.156541, 2022.
Dordoni, M., Tittel, J., Rosenlöcher, Y., Rinke, K., and Barth, J. A. C.: Metabolic activity of Planktothrix rubescens and its consequences on oxygen dynamics in laboratory experiment: A stable isotope study, J. Phycol., 60, 642–653, https://doi.org/10.1111/jpy.13455, 2024.
Dudgeon, D., Arthington, A. H., Gessner, M. O., Kawabata, Z. I., Knowler, D. J., Lévêque, C., Naiman, R. J., Prieur-Richard, A. H., Soto, D., Stiassny, M. L. J., and Sullivan, C. A.: Freshwater biodiversity: Importance, threats, status and conservation challenges, Biol. Rev. Camb. Philos. Soc., 81, 163–182, https://doi.org/10.1017/S1464793105006950, 2006.
EEA (European Environment Agency): Water resources across Europe-confronting water stress: an updated assessment, EEA Report 12/2021, https://doi.org/10.2800/320975, 2021.
Eisenstadt, D., Barkan, E., Luz, B., and Kaplan, A.: Enrichment of oxygen heavy isotopes during photosynthesis in phytoplankton, Photosynth. Res., 103, 97–103, https://doi.org/10.1007/s11120-009-9518-z, 2010.
Fisher, R. A.: Statistical Methods for Research Workers, in: Breakthroughs in Statistics, Springer Series in Statistics, edited by: Kotz, S., and Johnson, N. L., Springer, New York, NY, https://doi.org/10.1007/978-1-4612-4380-9_6, 1992.
Fowler, D., Coyle, M., Skiba, U., Sutton, M. A., Cape, J. N., Reis, S., Sheppard, L. J., Jenkins, A., Grizzetti, B., Galloway, J. N., Vitousek, P., Leach, A., Bouwman, A. F., Butterbach-Bahl, K., Dentener, F., Stevenson, D., Amann, M., and Voss, M.: The global nitrogen cycle in the Twentyfirst century, Philos. T. R. Soc. B, 368, 20130164, https://doi.org/10.1098/rstb.2013.0164, 2013.
Franklin, P. A.: Dissolved oxygen criteria for freshwater fish in New Zealand: A revised approach, N. Z. J. Mar. Freshwater Res., 48, 112–126, https://doi.org/10.1080/00288330.2013.827123, 2014.
Grizzetti, B., Pistocchi, A., Liquete, C., Udias, A., Bouraoui, F., and Van De Bund, W.: Human pressures and ecological status of European rivers, Sci. Rep., 7, 205, https://doi.org/10.1038/s41598-017-00324-3, 2017.
Guy, R. D., Fogel, M. L., and Berry, J. A.: Photosynthetic Fractionation of the Stable lsotopes of Oxygen and Carbon, Plant Physiol., 101, 37–47, 1993.
Habersack, H., Hein, T., Stanica, A., Liska, I., Mair, R., Jäger, E., Hauer, C., and Bradley, C.: Challenges of river basin management: Current status of, and prospects for, the River Danube from a river engineering perspective, Sci. Total Environ., 543, 828–845, https://doi.org/10.1016/j.scitotenv.2015.10.123, 2016.
Heddam, S.: Modelling hourly dissolved oxygen concentration (DO) using dynamic evolving neural-fuzzy inference system (DENFIS)-based approach: Case study of Klamath River at Miller Island Boat Ramp, OR, USA, Environ. Sci. Poll. Res., 21, 9212–9227, https://doi.org/10.1007/s11356-014-2842-7, 2014.
Hein, T., Baranyi, C., Heiler, G., Holarek, C., Riedler, P., and Schiemer, F.: Hydrology as a major factor determining plankton development in two floodplain segments and the River Danube, Austria, Large Rivers, 3, 439–452, 1999.
Honisch, M., Hellmeier, C., and Weiss, K.: Response of surface and subsurface water quality to land use changes, Geoderma, 105, 277–298, https://doi.org/10.1016/S0016-7061(01)00108-2, 2002.
Hua, A. K.: Land Use Land Cover Changes in Detection of Water Quality: A Study Based on Remote Sensing and Multivariate Statistics, J. Environ. Public. Health, 2017, 515130, https://doi.org/10.1155/2017/7515130, 2017.
ICPDR: Danube River Basin Hydrological Information System (DanubeHIS), https://www.danubehis.org, last access: 11 March 2025.
Joint, I., Rees, A. P., Malcolm, E., and Woodward, S.: Primary production and nutrient assimilation in the Iberian upwelling in August 1998, Prog. Oceanogr., 51, 303–320, 2001.
Jurgens, B. C., McMahon, P. B., Chapelle, F. H., and Eberts, S. M.: An Excel workbook for identifying redox processes in ground water, 2009-1004, https://doi.org/10.3133/ofr20091004, 2009.
Kamjunke, N., Rode, M., Baborowski, M., Kunz, J. V., Zehner, J., Borchardt, D., and Weitere, M.: High irradiation and low discharge promote the dominant role of phytoplankton in riverine nutrient dynamics, Limnol. Oceanogr., 66, 2648–2660, https://doi.org/10.1002/lno.11778, 2021.
Killgore, K. J. and Hoover, J. J.: Effects of Hypoxia on Fish Assemblages in a Vegetated Waterbody, J. Aquat. Plant Manag., 39, 40–44, 2001.
Knox, M., Quay, P. D., and Wilbur, D.: Kinetic isotopic fractionation during air-water gas transfer of O2, N2, CH4, and H2, J. Geophys. Res., 97, 20335–20343, https://doi.org/10.1029/92jc00949, 1992.
Limburg, J., Vrettos, J. S., Liable-Sands, L. M., Rheingold, A. L., Crabtree, R. H., and Brudvig, G. W.: A functional model for OO bond formation by the O2-evolving complex in photosystem II, Science, 283, 1524–1527, 1999.
Liška, I., Wagner, F., Sengl, M., Deutsch, K., and Slobodník, J.: Joint Danube Survey 3: a comprehensive analysis of Danube water quality, ICPDR–International Commission for the Protection of the Danube River, Vienna, Austria, ISBN 978-3-200-03795-3, 2018.
Liška, I., Wagner, F., Sengl, M., Deutsch, K., Slobodník, J., and Paunovic, M.: Joint Danube survey 4 scientific report: A shared analysis of the Danube river, Vienna, International Commission for the Protection of the Danube River-ICPDR, ISBN 978-3-200-07450-7, 2021.
Literáthy, P., Koller-Kreiml, V., and Liška, I.: Final Report of the Joined Danube Survey. International Commission for the Protection of the Danube River–ICPDR, Vienna, Austria, 262 pp., 2002.
Mader, M., Schmidt, C., van Geldern, R., and Barth, J. A. C.: Dissolved oxygen in water and its stable isotope effects: A review, Chem. Geol., 473, 10–21, https://doi.org/10.1016/j.chemgeo.2017.10.003, 2017.
Maier, J., Visser, A.-N., Schubert, C. M., Wander, S. T., and Barth, J. A. C.: Seasonal Dataset of DO, δ18ODO and Biogeochemical Parameters in the Danube River (2023–2024), PANGEA [data set], https://doi.org/10.1594/PANGAEA.983395, 2025.
Mănoiu, V. M. and Crăciun, A. I.: Danube river water quality trends: A qualitative review based on the open access web of science database, Ecohydrol. Hydrobiol., 21, 613–628, https://doi.org/10.1016/j.ecohyd.2021.08.002, 2021.
North, R. P., North, R. L., Livingstone, D. M., Köster, O., and Kipfer, R.: Long-term changes in hypoxia and soluble reactive phosphorus in the hypolimnion of a large temperate lake: Consequences of a climate regime shift, Glob. Change Biol., 20, 811–823, https://doi.org/10.1111/gcb.12371, 2014.
Nyenje, P. M., Foppen, J. W., Uhlenbrook, S., Kulabako, R., and Muwanga, A.: Eutrophication and nutrient release in urban areas of sub-Saharan Africa – A review, Sci. Total Environ., 408, 447–455, https://doi.org/10.1016/j.scitotenv.2009.10.020, 2010.
Odum, H. T.: Primary Production in Flowing Waters, Limnol. Oceanogr., 1, 102–117, https://doi.org/10.4319/lo.1956.1.2.0102, 1956.
Parker, S. R., Gammons, C. H., Poulson, S. R., DeGrandpre, M. D., Weyer, C. L., Smith, M. G., Babcock, J. N., and Oba, Y.: Diel behavior of stable isotopes of dissolved oxygen and dissolved inorganic carbon in rivers over a range of trophic conditions, and in a mesocosm experiment, Chem. Geol., 269, 22–32, https://doi.org/10.1016/j.chemgeo.2009.06.016, 2010.
Piatka, D. R., Wild, R., Hartmann, J., Kaule, R., Kaule, L., Gilfedder, B., Peiffer, S., Geist, J., Beierkuhnlein, C., and Barth, J. A. C.: Transfer and transformations of oxygen in rivers as catchment reflectors of continental landscapes: A review, https://doi.org/10.1016/j.earscirev.2021.103729, 2021.
Poff, N. L. and Zimmerman, J. K. H.: Ecological responses to altered flow regimes: A literature review to inform the science and management of environmental flows, Freshw. Biol., 55, 194–205, https://doi.org/10.1111/j.1365-2427.2009.02272.x, 2010.
Qing, X., Yutong, Z., and Shenggao, L.: Assessment of heavy metal pollution and human health risk in urban soils of steel industrial city (Anshan), Liaoning, Northeast China, Ecotoxicol. Environ. Saf., 120, 377–385, https://doi.org/10.1016/j.ecoenv.2015.06.019, 2015.
Quay, P. D., Wilbur, D. 0, Richey, J. E., Devol, A. H., Benner, R., and Forsberg, B. R.: The 18O : 16O of dissolved oxygen in rivers and lakes in the Amazon Basin: Determining the ratio of respiration to photosynthesis rates in freshwaters, Limnol. Oceanogr., 40, 718–729, 1995.
R Core Team: R: A Language and Environment for Statistical Computing, https://www.r-project.org/ (last access: 18 June 2025), 2023.
Reddy, S. K. K., Gupta, H., Badimela, U., Reddy, D. V., Kurakalva, R. M., and Kumar, D.: Export of particulate organic carbon by the mountainous tropical rivers of Western Ghats, India, Variations and controls, Sci. Total Environ., 751, 142115, https://doi.org/10.1016/j.scitotenv.2020.142115, 2021.
Rettich, T. R., Battino, R., and Wilhelm, E.: Solubility of gases in liquids, 22. High-precision determination of Henry's law constants of oxygen in liquid water from T = 274 K to T = 328 Ka, J. Chem. Thermodynam., 32, 1145–1156, https://doi.org/10.1006/jcht.1999.0581, 2000.
Riedler P. and Schagerl M.: Pelagic primary production and related parameters in the River Danube near Vienna (Austria), Archiv für Hydrobiologie, Supplementbände, 115, 139–151, 1998.
Rosecrans, C. Z., Nolan, B. T., and Gronberg, J. A. M.: Prediction and visualization of redox conditions in the groundwater of Central Valley, California, J. Hydrol., 546, 341–356, https://doi.org/10.1016/j.jhydrol.2017.01.014, 2017.
Russ, M. E., Ostrom, N. E., Gandhi, H., Ostrom, P. H., and Urban, N. R.: Temporal and spatial variations in R : P ratios in Lake Superior, an oligotrophic freshwater environment, J. Geophys. Res.-Ocean., 109, C10S12, https://doi.org/10.1029/2003JC001890, 2004.
Seitzinger, S., Harrison, J. A., Böhlke, J. K., Bouwman, A. F., Lowrance, R., Peterson, B., Tobias, C., and Van Drecht, G.: Denitrification across landscapes and waterscapes: A synthesis, Ecol. Appl., 16, 2064–2090, https://doi.org/10.1890/1051-0761(2006)016[2064:DALAWA]2.0.CO;2, 2006.
Sommerwerk, N., Hein, T., Schneider-Jacoby, M., Baumgartner, C., Ostojić, A., Siber, R., Bloesch, J., Paunović, M., and Tockner, K.: The Danube River Basin, in: Rivers of Europe, Elsevier, 59–112, https://doi.org/10.1016/B978-0-12-369449-2.00003-5, 2009.
Stevens, C. L. R., Schultz, D., Van Baalen, C., and Parker, P. L.: Oxygen Isotope Fractionation during Photosynthesis in a Blue-Green and a Green Algal, Plant Physiol., 56, 126–129, 1975.
Stumm, W. and Morgan, J. J.: Aquatic Chemistry: Chemical Equilibria and Rates in Natural Waters, 3rd Edn., Wiley-Interscience, New York, 455–464, 1995.
Suthar, S., Nema, A. K., Chabukdhara, M., and Gupta, S. K.: Assessment of metals in water and sediments of Hindon River, India: Impact of industrial and urban discharges, J. Hazard. Mater, 171, 1088–1095, https://doi.org/10.1016/j.jhazmat.2009.06.109, 2009.
Sutton, M., Howard, C. M., Erisman, J. W., Billen, G., Bleeker, A., Grennfelt, P., Van Grinsven, H., and Grizzetti, B.: The European Nitrogen Assessment: Sources, Effects and Policy Perspectives, Cambridge University Press, ISBN 978-1-107-00612-6, 2011.
Tobias, C. R., Böhlke, J. K., and Harvey, J. W.: The oxygen-18 isotope approach for measuring aquatic metabolism in high-productivity waters, Limnol. Oceanogr., 52, 1439–1453, https://doi.org/10.4319/lo.2007.52.4.1439, 2007.
Uehlinger, U., König, C., and Reichert, P.: Variability of photosynthesis-irradiance curves and ecosystem respiration in a small river, Freshw. Biol., 44, 493–507, https://doi.org/10.1046/j.1365-2427.2000.00602.x, 2000.
van Geldern, R. and Barth, J. A. C.: Optimization of instrument setup and post-run corrections for oxygen and hydrogen stable isotope measurements of water by isotope ratio infrared spectroscopy (IRIS), Limnol. Oceanogr. Method., 10, 1024–1036, https://doi.org/10.4319/lom.2012.10.1024, 2012.
Vautier, C., Abhervé, R., Labasque, T., Laverman, A. M., Guillou, A., Chatton, E., Dupont, P., Aquilina, L., and de Dreuzy, J. R.: Mapping gas exchanges in headwater streams with membrane inlet mass spectrometry, J. Hydrol., 581, 124398, https://doi.org/10.1016/j.jhydrol.2019.124398, 2020.
Vörösmarty, C. J., Pahl-Wostl, C., Bunn, S. E., and Lawford, R.: Global water, the anthropocene and the transformation of a science, Curr. Opin. Environ. Sustain., 5, 539–550, https://doi.org/10.1016/j.cosust.2013.10.005, 2013.
Wachs, B.: Zustand und Qualität der Donau, Verantwortung für einen europäischen Strom, Schriftenreihe des Bundesamtes für Wasserwirtschaft “4”, 28–51, 1997.
Wassenaar, L. I.: Dissolved oxygen status of Lake Winnipeg: Spatio-temporal and isotopic (δ18O-O2) patterns, J. Great Lakes Res., 38, 123–134, https://doi.org/10.1016/j.jglr.2010.12.011, 2012.
Wassenaar, L. I. and Koehler, G.: An on-line technique for the determination of the δ18O and δ17O of gaseous and dissolved oxygen, Anal. Chem., 71, 4965–4968, https://doi.org/10.1021/ac9903961, 1999.
Wassenaar, L. I., Venkiteswaran, J. J., Schiff, S. L., and Koehler, G.: Aquatic community metabolism response to municipal effluent inputs in rivers quantified using diel δ18O values of dissolved oxygen, Can. J. Fish. Aquat. Sci., 67, 1232–1246, https://doi.org/10.1139/F10-057, 2010.
Weitere, M. and Arndt, H.: Top-down effects on pelagic heterotrophic nanoflagellates (HNF) in a large river (River Rhine): Do losses to the benthos play a role?, Freshw. Biol., 47, 1437–1450, https://doi.org/10.1046/j.1365-2427.2002.00875.x, 2002.
Wetzel, R. G.: Limnology: Lake ad River Ecosystems, 3rd Edn., Academic Press, San Diego, California, ISBN-13 978-0-12-744760-5, 2011.
Xia, Y., Ti, C., She, D., and Yan, X.: Linking river nutrient concentrations to land use and rainfall in a paddy agriculture–urban area gradient watershed in southeast China, Sci. Total Environ., 566, 1094–1105, https://doi.org/10.1016/j.scitotenv.2016.05.134, 2016.