the Creative Commons Attribution 4.0 License.
the Creative Commons Attribution 4.0 License.
 | 07 Oct 2025
Future forests: estimating biogenic emissions from net-zero aligned afforestation pathways in the UK
Stephen Arnold
Ben Silver
Piers M. Forster
Catherine E. Scott
Woodlands sequester carbon dioxide from the atmosphere, which could help mitigate climate change. As part of efforts to reach net-zero greenhouse gas emissions by the year 2050, the UK's Climate Change Committee (CCC) recommend increasing woodland cover from a UK average of 13 % to 17 %–19 %. Woodlands can also have benefits for air quality. However, they emit biogenic volatile organic compounds (BVOCs) which are precursors to atmospheric pollutants, such as ozone (O3) and particulate matter (PM), which have the potential to degrade air quality. Here we make an estimate of the potential impact of afforestation in the UK on BVOC emissions, coupling information on tree species' emissions potential, planting suitability and policy-informed land cover change. We quantify the potential emission of BVOCs from five afforestation experiments using the Model of Emissions of Gases and Aerosols from Nature (MEGAN) (v2.1) in the Community Land Model (CLM) (v4.5) for the year 2050. Experiments were designed to explore the impact of variation in BVOC emissions potentials between and within plant functional types (PFTs) on estimates of BVOC emissions from UK land cover, in a future warmer climate under elevated atmospheric CO2 concentrations, to understand the scale of change associated with afforestation to 19 % woodland cover by the year 2050.
Our estimate of current annual UK emissions is 39 kt yr−1 for isoprene and 46 kt yr−1 for total monoterpenes. Broadleaf afforestation results in a change to UK isoprene emission of between −3 % and +123 %, and a change to total monoterpene emission of between +5 % and +48 %. Needleleaf afforestation leads to a change in UK isoprene emission of between −3 % and +22 %, and a change to total monoterpene emission of between +60 % and +86 %.
Our study highlights the potential for net-zero aligned afforestation, in a likely warmer and drier future UK climate, to have substantial impacts on BVOC emissions. However, the results highlight possible pathways to achieving 19 % woodland cover without requiring large increases in isoprene emissions. The emissions estimates presented here provide the opportunity to quantify future impacts on air pollution associated with changes in biogenic emissions, as well as how these impacts would be affected by concurrent changes in anthropogenic emissions.
- Article
(3653 KB) - Full-text XML
-
Supplement
(1260 KB) - BibTeX
- EndNote


The terrestrial biosphere plays a key part in suggested pathways for mitigating climate change and helping to reach net-zero greenhouse gas (GHG) emissions, due to the capacity for the biosphere to sequester and store carbon. The Sixth Assessment Report of the Intergovernmental Panel on Climate Change (IPCC) estimated that afforestation, reduced deforestation and ecosystem restoration could mitigate nearly 3 Gt CO2 e yr−1 globally by 2030 (Shukla et al., 2022). In 2019, the UK Climate Change Committee (CCC) set out a series of pathways to achieving net-zero GHG emissions by 2050, including a large increase in rates of afforestation to expand the land carbon sink (Climate Change Committee, 2019). To achieve their “further ambition” scenario (a pathway estimated to reduce emissions by 96 %), the CCC recommended planting at least 30 000 ha of trees per year (ha yr−1) in the UK until 2050, whilst their “speculative scenario” (a pathway estimated to reduce emissions by 100 % by 2050), recommended increased planting at 50 000 ha yr−1 (Climate Change Committee, 2019). Planting at this rate would increase woodland cover from the current UK average of 13 % to between 17 % and 19 %, a relative increase of 31 %–46 %. Following these recommendations, the UK Government committed to increase planting to 30 000 ha yr−1 by 2024, and rising from thereafter (Department for Business, Energy and Industrial Strategy, 2021). Planting at this scale requires a doubling of the rate of afforestation in the UK, which has averaged 15 000 ha yr−1 between 2019 and 2024 (Forest Research, 2024b). Increasing forest cover to such an extent could not only bring benefits for climate change mitigation but also a series of co-benefits including habitat creation, flood risk reduction, improving access for people to trees and woodlands (with the associated economic and health benefits), reducing concentrations of particulate matter through deposition, and local temperature reductions (Bolund and Hunhammar, 1999; Costanza et al., 1997; D'Alessandro et al., 2015; Department for Environment, Food and Rural Affairs, 2018; Monger et al., 2022; Nowak, 2022; Purser et al., 2023; Wang et al., 2023). There is also the potential for side-effects and trade-offs, such as the degradation of air quality potentially associated with the emission of biogenic volatile organic compounds (BVOCs) (e.g. Chameides et al., 1988; Churkina et al., 2017; Gu et al., 2021; Rasmussen, 1972).
In addition to influencing atmospheric concentrations of CO2, vegetation exchanges carbon in the form of BVOCs. BVOCs are gaseous compounds synthesised within the chloroplast of the plant, and in some cases, stored in the leaf until volatilised. Examples of BVOC compound classes are isoprene (C5H8, 2-methyl 1,3-butadiene) and monoterpenes (C10H16). Plants use a large amount of energy in the production of BVOCs but appear to derive resilience against pests, disease and other environmental stressors from their emission (Dicke, 2009; Dudareva et al., 2006; Fitzky et al., 2019; Sharkey, 1996). BVOC emission from trees is controlled largely by temperature and light, but also leaf age, atmospheric CO2 concentrations and soil moisture (Guenther et al., 1993; Potosnak et al., 2014; Sharkey, 1996; Zeng et al., 2023). Plant BVOC emissions can be induced by stress from pests and disease; globally the rate at which new tree diseases are reported is doubling approximately every 11 years (Gougherty, 2023), with implications for the quantity and composition of future BVOC emissions (e.g. Dicke, 2009; Ghimire et al., 2022; Irmisch et al., 2014; Jaakkola et al., 2023; Trowbridge and Stoy, 2013). Algorithms have been developed to capture the dependency of BVOCs on the environmental factors mentioned above and to quantify ecosystem- or global-scale emissions of BVOCs (Guenther et al., 1995, 1993, 2012; Martin et al., 2000; Niinemets et al., 1999). Global emissions of BVOCs are estimated at 1000 Tg yr−1, of which ∼500 Tg yr−1 comes from isoprene and ∼150 Tg yr−1 from total monoterpenes (Guenther et al., 2012). For isoprene, as temperature increases, emissions increase until a maximum temperature ∼35 °C after which emissions steeply decline following denaturing of the enzyme isoprene synthase (Monson et al., 1992). Evidence also shows the suppression of isoprene emissions when plants are exposed to elevated atmospheric CO2 concentrations, due to the inhibition of the enzyme responsible for the synthesis of dimethylallyl diphosphate (DMADP) from hydroxymethylbutenyl diphosphate (HMBDP) (Sahu et al., 2023). The emission of monoterpenes has historically been thought to be dependent mostly on temperature (Guenther al., 1993), but increasingly evidence shows a light dependence in monoterpene emission for some plant species (e.g. Bao et al., 2008; Ghirardo et al., 2010; Jardine et al., 2015). Some plants have a store of monoterpenes (referred to as pool emissions), which are produced and stored within the leaf until temperatures are high enough for the liquid compound to volatilise (Tingey et al., 1980). De novo emissions are those synthesised in response to both light and temperature without a period of storage in the plant; due to the dependence on light, emissions rates of de novo emissions tend to follow day light patterns (Ghirardo et al., 2010). The response of monoterpene emissions to climate change is influenced by the behaviour of individual enantiomers. Byron et al. (2022) found that drought affects monoterpene enantiomers differently, depending on both the severity and duration of the drought. Since enantiomers can help distinguish between emissions from de novo synthesis and those from storage pools, differing enantiomeric responses introduce uncertainty in future emission estimates – especially if the balance between de novo and storage-derived emissions shifts.
Elevated CO2 has been found to have little effect on monoterpene emissions (Feng et al., 2019). A global modelling study by Heald et al. (2009) concluded that the enhanced emission of BVOCs attributed to a warmer climate could be almost entirely offset by CO2 inhibition, despite elevated CO2 enhancing rates of photosynthesis (e.g. Feng et al., 2019; Pegoraro et al., 2004). The climate forcing impact that a large change in forest cover and associated BVOC emissions may have is uncertain (Scott et al., 2018; Weber et al., 2024), as is the response of vegetation to elevated CO2 concentrations and temperature. The point at which temperature or CO2 concentration become inhibiting factors for vegetation growth and BVOC emission, varies between species and when interacting with other controls, such as moisture availability (e.g. Fortunati et al., 2008; Pegoraro et al., 2004).
BVOCs are highly reactive and oxidised in the atmosphere by the hydroxyl radical (OH), ozone (O3) and nitrate radical (NO3). BVOCs influence the production of O3 through a cycle between nitric oxide (NO) and nitrogen dioxide (NO2), with peroxy radicals derived from BVOC oxidation enabling NO to cycle to NO2 without depleting O3 and therefore enabling net O3 formation (Sillman et al., 1990; Wennberg et al., 2018). The oxidation of BVOCs also generates secondary organic aerosol (SOA), which contributes to the formation of particulate matter (PM) which has negative impacts on human health. Of particular concern are particles less than 2.5 µm in diameter (PM2.5) due to the capacity of these particles to travel further into the human body than larger particles such as PM10 (Committee on the Medical Effects of Air Pollutants, 2015).
Following the rise in ambitions to plant trees for climate change mitigation, several studies have examined the impact of afforestation on BVOC emissions and air quality (e.g. Gai et al., 2024; Gu et al., 2021; Purser et al., 2023). Gu et al. (2021) quantified the increase in BVOC emissions from urban greening scenarios in Los Angeles. They illustrate the potential for the increase in BVOCs to offset the benefits of a reduction in anthropogenic volatile organic compounds (AVOCs). In the UK context, Stewart et al. (2003) previously constructed a BVOC inventory for Great Britain, and estimated that BVOC emissions are 10 % of those of AVOCs, though recognising this may change with a warmer climate. Using the WRF-EMEP4UK modelling framework, Purser et al. (2023) present an assessment of the potential air quality impact of BVOCs associated with large-scale afforestation for bioenergy and short rotation forestry in the UK. Based on four planting scenarios, each of single tree species (Eucalyptus gunnii, Populus tremulus, Alnus cordata and Picea sitchensis) and delivering up to 164 % more woodland cover than present day, Purser et al. (2023) estimated isoprene emissions to increase between 53 % and 135 %, except with Alder where emissions declined by 14 % due to its lower emissions potentials relative to the grassland and agriculture being replaced. An increase in monoterpene emissions between 5 % and 94 % was simulated, except for Aspen where a decline of 8 % was again attributed to the lower emissions potential of the trees relative to the land cover being replaced (Purser et al., 2023). To best understand the potential scale of BVOC emissions associated with afforestation, we need to understand the role that the mixture of tree species planted plays in determining BVOC emissions.
In this work, we quantify for the first time the emission of BVOCs from UK afforestation scenarios under which 19 % woodland cover is achieved with mixed tree species afforestation. We assume that afforestation occurs in line with recent and committed afforestation rates for the four UK nations. We present five afforestation experiments for the UK which represent different pathways to achieving woodland cover of 19 % in 2050, with varying contributions from high and low BVOC emitting tree species. Our study seeks to explore the potential range of BVOC emissions resulting from a net-zero consistent level of afforestation, if the afforestation was to occur with feasible but extreme (in terms of BVOC emission potentials) mixtures of tree species. Estimating potential changes in BVOC emissions will help guide policy decisions regarding species prioritisation for planting, particularly when considered in the context of minimising air-quality side-effects associated with afforestation, a concern noted by The Royal Society (2021) in their report on net-zero effects on air quality. The potential impact that increased emissions of BVOCs could have for air quality (associated with their role as precursors to atmospheric pollutants) will depend also on the future of anthropogenic emissions and other precursors, such as NOx, which influence the formation of O3. Our estimates of BVOC emissions from future afforestation scenarios will facilitate this assessment of future air quality impacts.
To quantify the emissions of BVOCs from a range of afforestation experiments, we use the Community Land Model v4.5 (CLM) (Oleson et al., 2013), which includes the Model of Emissions of Gases and Aerosols from Nature v2.1 (MEGAN; Guenther et al., 1993, 2012). When operating inside the CLM, MEGAN takes information about vegetation type and fraction (PFT), leaf area index (LAI) and meteorological variables from the CLM. These are provided as input data when the CLM is operating offline. Within the CLM, these input variables are used to calculate leaf temperature, soil moisture, soil temperature and humidity. The CLM also calculates canopy variables, including the fraction of sunlit vs shaded leaves and the canopy environment coefficient. To calculate BVOC emissions, MEGAN uses leaf temperature, soil moisture, soil temperature, solar radiation and CO2 concentrations (which are used to estimate CO2 inhibition of isoprene emission) as well as the canopy environment coefficient provided by the CLM.
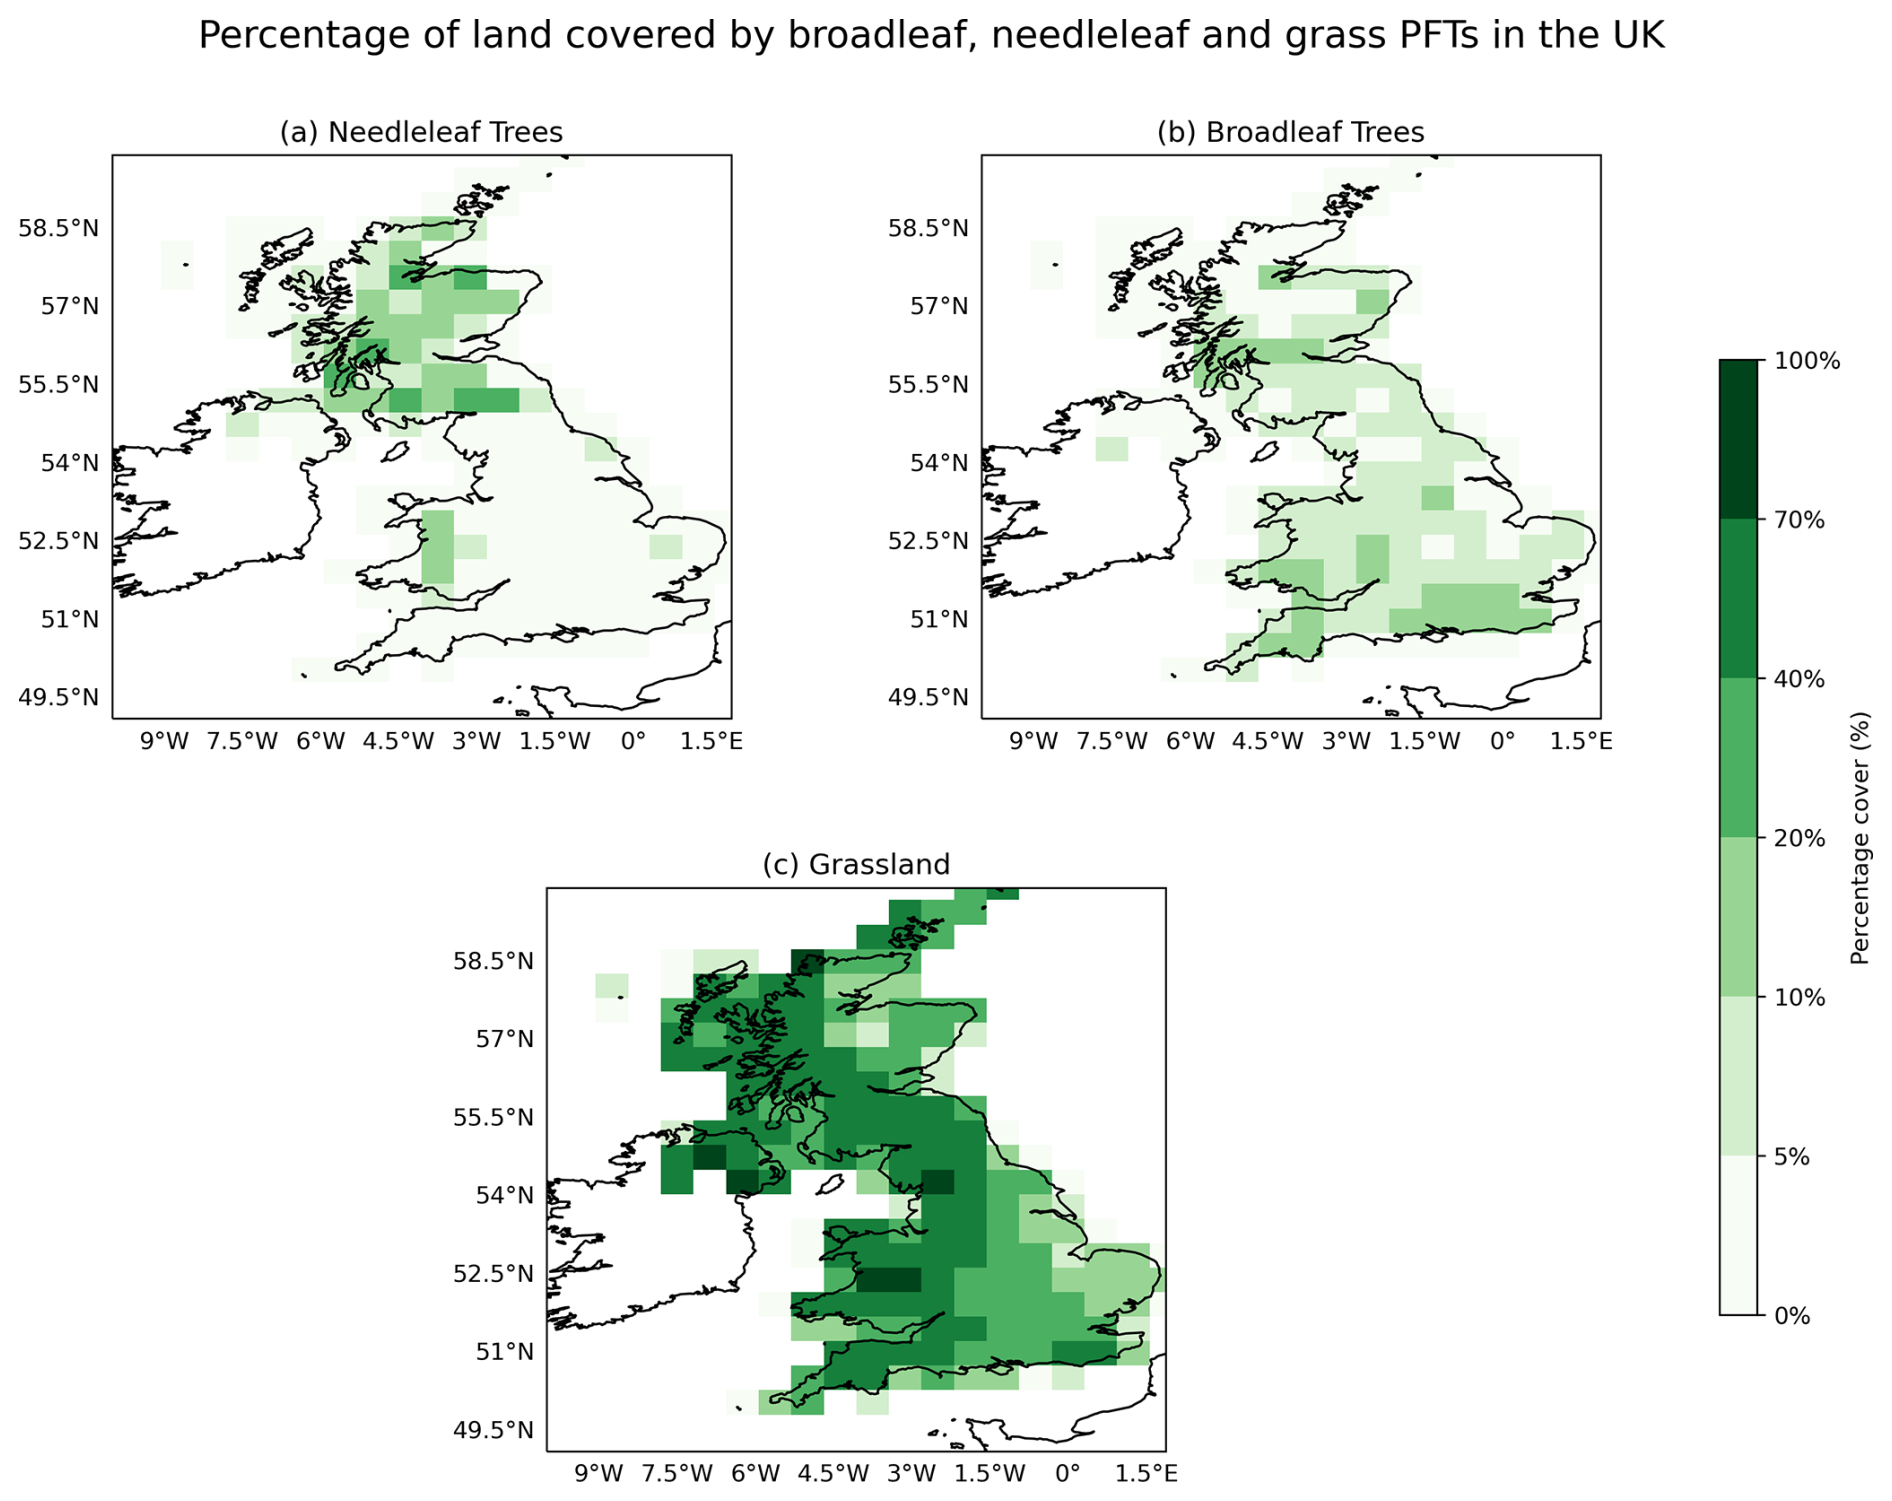
Figure 1Percentage share of land in gridcell covered by (a) broadleaf trees, (b) needleleaf trees, and (c) grass PFTs. The distribution of PFTs presented here is inferred from the UKCEH landcover map (1 km × 1 km resolution) (Marston et al., 2022), reassigned to the land cover categories of the CLM (Oleson et al., 2013) to produce the CEH-CLM dataset.
2.1 Representing the land surface
We use the CLM (Oleson et al., 2013) at a resolution of 0.47° × 0.63° with land surface data from the UKCEH land cover map for 2021 (Marston et al., 2022). The UKCEH map is produced at a resolution of 1 km, combining Sentinel-2 seasonal composite images and 10 context layers to map 21 land cover classes based on the Biodiversity Action Plan broad habitats (Marston et al., 2022). We use the 1 km percentage product, which details the percentage cover for each of 21 land cover classes within each 1 km pixel. The UKCEH dataset was regridded to the 0.47° × 0.63° resolution of our CLM configuration. As land surface categories vary between the UKCEH and the CLM, variables of the UKCEH map were reassigned to the closest matching plant functional type (PFT) or land surface category in the CLM, including the urban, natural vegetation, crops and lake land surface categories. Figure 1 illustrates the percentage cover of needleleaf and broadleaf tree PFTs and grassland PFTs in the resulting CEH-CLM dataset which represents present day UK land cover. In this dataset, woodlands cover approximately 13 % of UK land, and of this 52 % is broadleaf woodland and 48 % needleleaf woodland (Forest Research, 2024b). Grassland makes up approximately 40 % of UK land cover (Marston et al., 2022).
2.2 Identifying land for afforestation
The exact locations for afforestation in the UK are undetermined, though the individual four nations (England, Northern Ireland, Scotland and Wales) have their own ambitions relating to the net-zero aligned planting recommendations (Department for Agriculture, Environment and Rural Affairs, 2020; Department for Environment, Food and Rural Affairs, 2021; Scottish Government, 2017; Welsh Government, 2018). For our study, we present five afforestation experiments equivalent to the achievement of 19 % woodland cover by 2050 in the UK. We assume a direct replacement of grassland with woodland as a simplified land cover change. In reality, detailed assessments are required to establish the suitability (ecologically, socially and culturally) of any site for woodland creation; conversion to woodland in our study is used only to estimate the impact on BVOC emissions and should not be used to infer the suitability of any specific site.
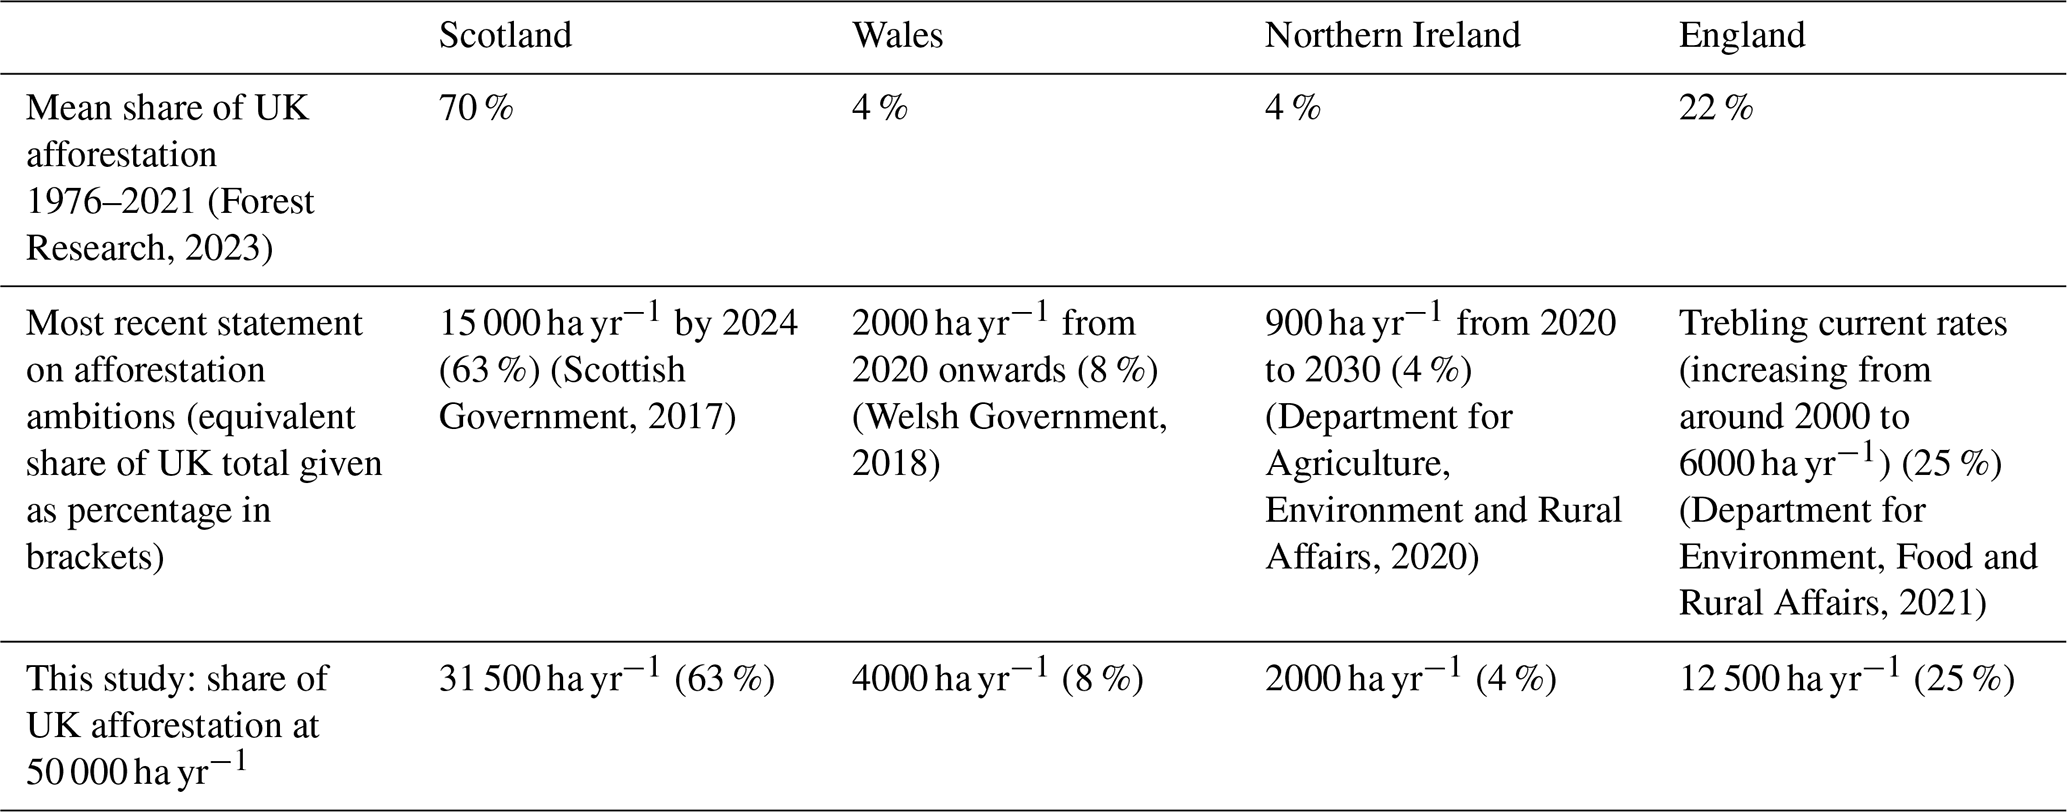
Whilst a lack of specific locations for future additional woodland adds extra uncertainty to any estimates of future BVOC emissions, we seek to minimise this by distributing the new woodland in accordance with historical planting rates and future planting commitments across the four nations of the UK (Department for Agriculture, Environment and Rural Affairs, 2020; Department for Environment, Food and Rural Affairs, 2021; Forest Research, 2023; Scottish Government, 2017; Welsh Government, 2018). Table 1 details the rates of afforestation reported for each nation during the past five decades, their current commitments to afforestation and the proposed share of afforestation implemented in this study. Our experiments assume the greater level of afforestation from the CCC's recommendations (equivalent to planting 50 000 ha yr−1), as this enables estimation of the change in BVOCs associated with the greatest scale of afforestation in recent discourse for the UK. We assume 63 % of the UK's new woodland is created in Scotland, 8 % in Wales, 4 % in Northern Ireland and 25 % in England.
Table 1Historical rates of afforestation in the UK by nation between 1976 and 2021 and current national ambitions for afforestation. These rates inform the share of UK afforestation at 50 000 ha yr−1 used in this study.
We use the presence of a tree PFT within a grid cell of the CEH-CLM dataset as indicative of climatic suitability of the land for new planting of that type. The tree PFTs considered in this study are Broadleaf Deciduous Temperate Trees (BDTT), Broadleaf Deciduous Boreal Trees (BDBT), Needleleaf Evergreen Temperate Trees (NETT) and Needleleaf Evergreen Boreal Trees (NEBT). For replacement with woodland to take place, grid cells are required to have some existing grassland (namely Cool C3 or Arctic C3 grass). New tree cover was created in proportion to the amount of grassland in any eligible grid cell and in the same ratio of temperate to boreal PFTs as was already present in the CEH-CLM dataset. Afforestation was implemented as either all needleleaf, or all broadleaf, to enable examination of the variation in emissions that would be generated by different planting decisions. This method does not account for the specific suitability of a given location for tree planting but provides the necessary scope to consider the scale of emissions changes across the UK associated with present ambitions for afforestation. Figure 2 shows the absolute change in percentage area of PFTs following afforestation. The quantities of change in PFT cover are consistent across both needleleaf and broadleaf afforestation experiments. Figures S1 and S2 in the Supplement illustrate the percentage change in area of PFTs following broadleaf and needleleaf afforestation respectively.
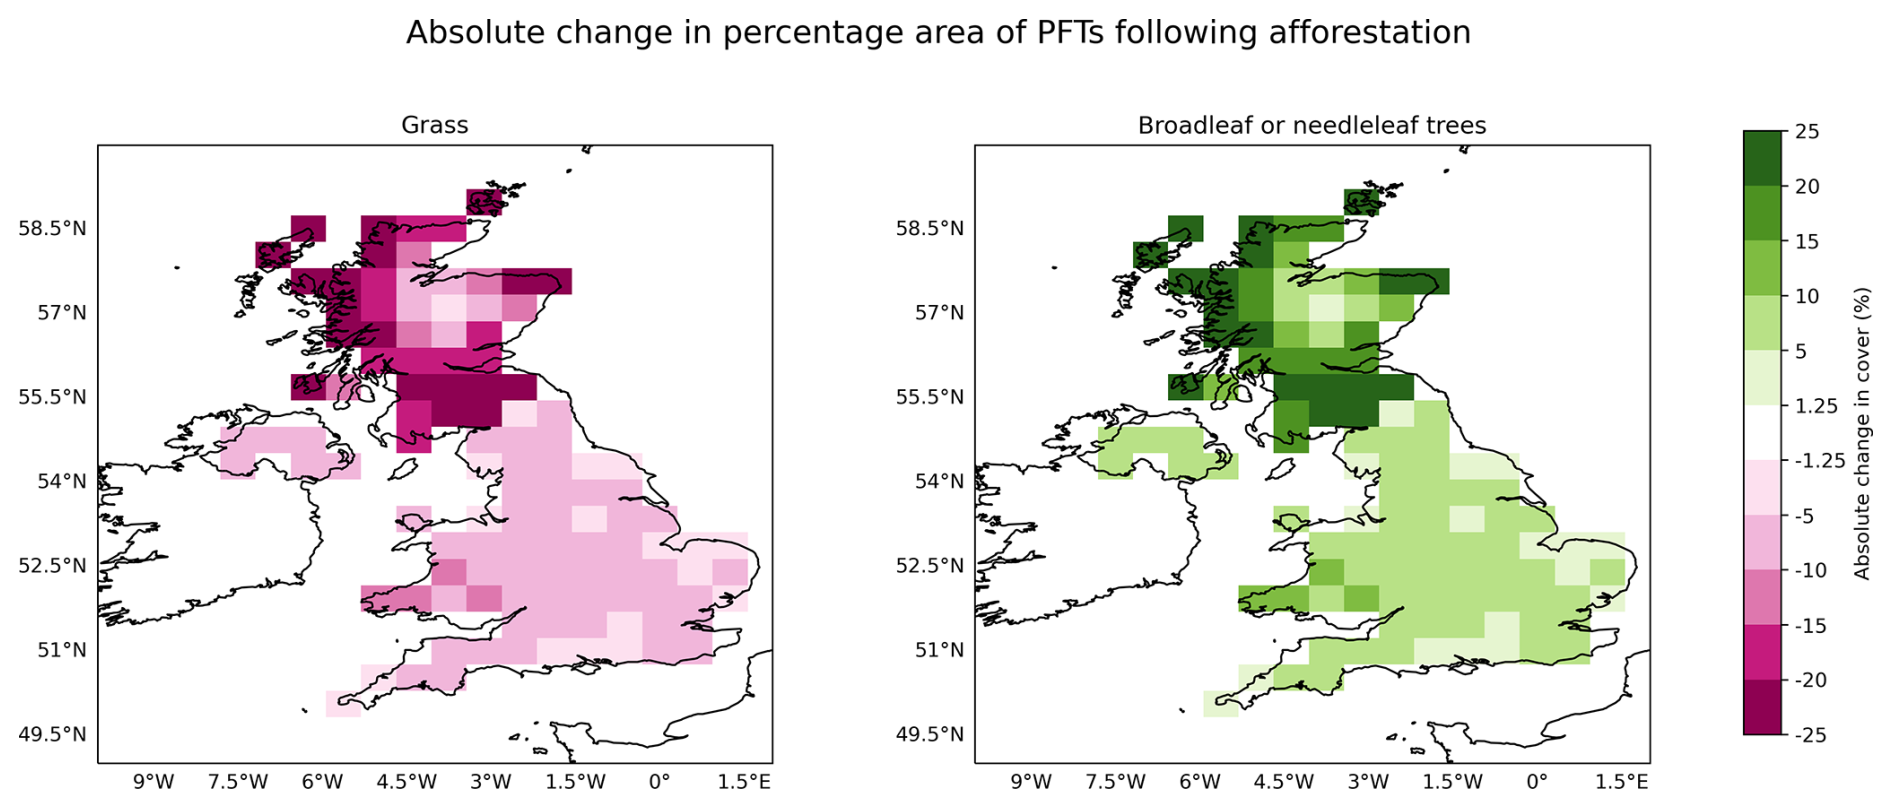
Figure 2Absolute change in the percentage cover of grass and tree PFTs following either needleleaf or broadleaf afforestation.
2.3 Identifying tree species for afforestation
The subset of tree species represented in this study was informed by the Forest Research tree species database (Forest Research, 2024a) and associated Ecological Site Classification (ESC) tool. This online tool enables users to identify suitable trees for planting in each part of the UK according to known or projected conditions for climate, lithology, ecology, soil moisture and soil nutrients (Pyatt et al., 2001). 60 tree species are considered in the ESC tool. Of these species, those classified as principal species (defined as species already widely used or increasing in deployment in the UK, and of continuing importance unless adversely affected by a new pest or disease, or climate change) (Forest Research, 2024a) were considered for representation in our study. We compare this subset of 25 tree species to statistics on current tree species composition in the UK (Forest Research, 2023) and the EU-Trees4F project which examines the changing distribution of European tree species under a selection of climate futures considering natural dispersal and planting (Mauri et al., 2022). Based on these requirements, we selected 18 tree species to include in our review of emissions potentials data (details of included tree species can be found in Table S1 in the Supplement).
2.4 Preparing UK specific emissions potential data
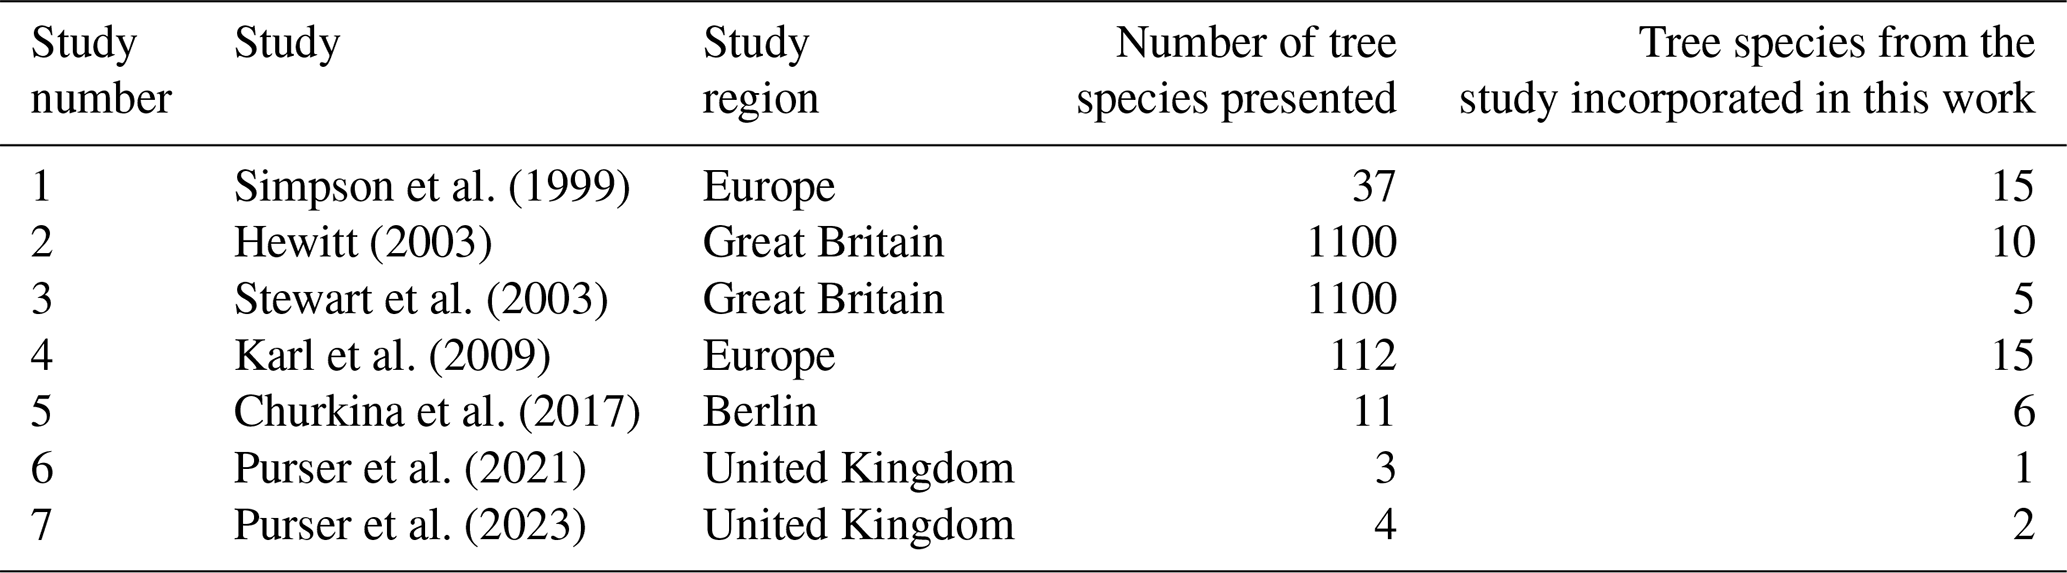
We generate a bespoke UK-specific emissions potential dataset to capture isoprene and monoterpene emissions from UK-specific tree species. We use this dataset to adjust estimates of BVOC emission from tree species for our present-day land cover and afforestation experiments. Tree species specific emissions potentials were used to generate PFT emissions potential scenarios based on both present-day tree species abundance in the UK, and a range of hypothetical planting mixtures that demonstrate the variation within and between PFTs. We reviewed European or UK specific emissions potentials of tree species to identify values representative of UK trees. Emissions data were obtained for isoprene and monoterpene compound classes, as the BVOCs dominating VOC chemistry in Great Britain (Atkinson, 1990). If data was available for tree species in our subset, emissions values were recorded (applicable studies are summarised in Table 2). The review returned emissions potential data for isoprene and monoterpenes for 6 needleleaf and 10 broadleaf tree species (listed in Table 3; additional details can be found in Table S1) which make up existing UK woodland cover and/or are expected to play a role in afforestation in the future.
Monoterpenes have pool emissions (previously synthesised compounds emitted from storage pools) as well as synthesis (or de novo; compounds synthesised and emitted in response to light) emissions. The review of emissions potential literature highlighted inconsistencies in the level of differentiation between pool and synthesis emissions. In MEGAN, the relative light dependence of BVOC compound class emissions is managed by assigning a light dependent fraction (Guenther et al., 2012). We account for this by taking the sum, where synthesis and pool emission potentials are explicit in the published dataset, and reapplying the existing light dependent fractions in MEGAN.
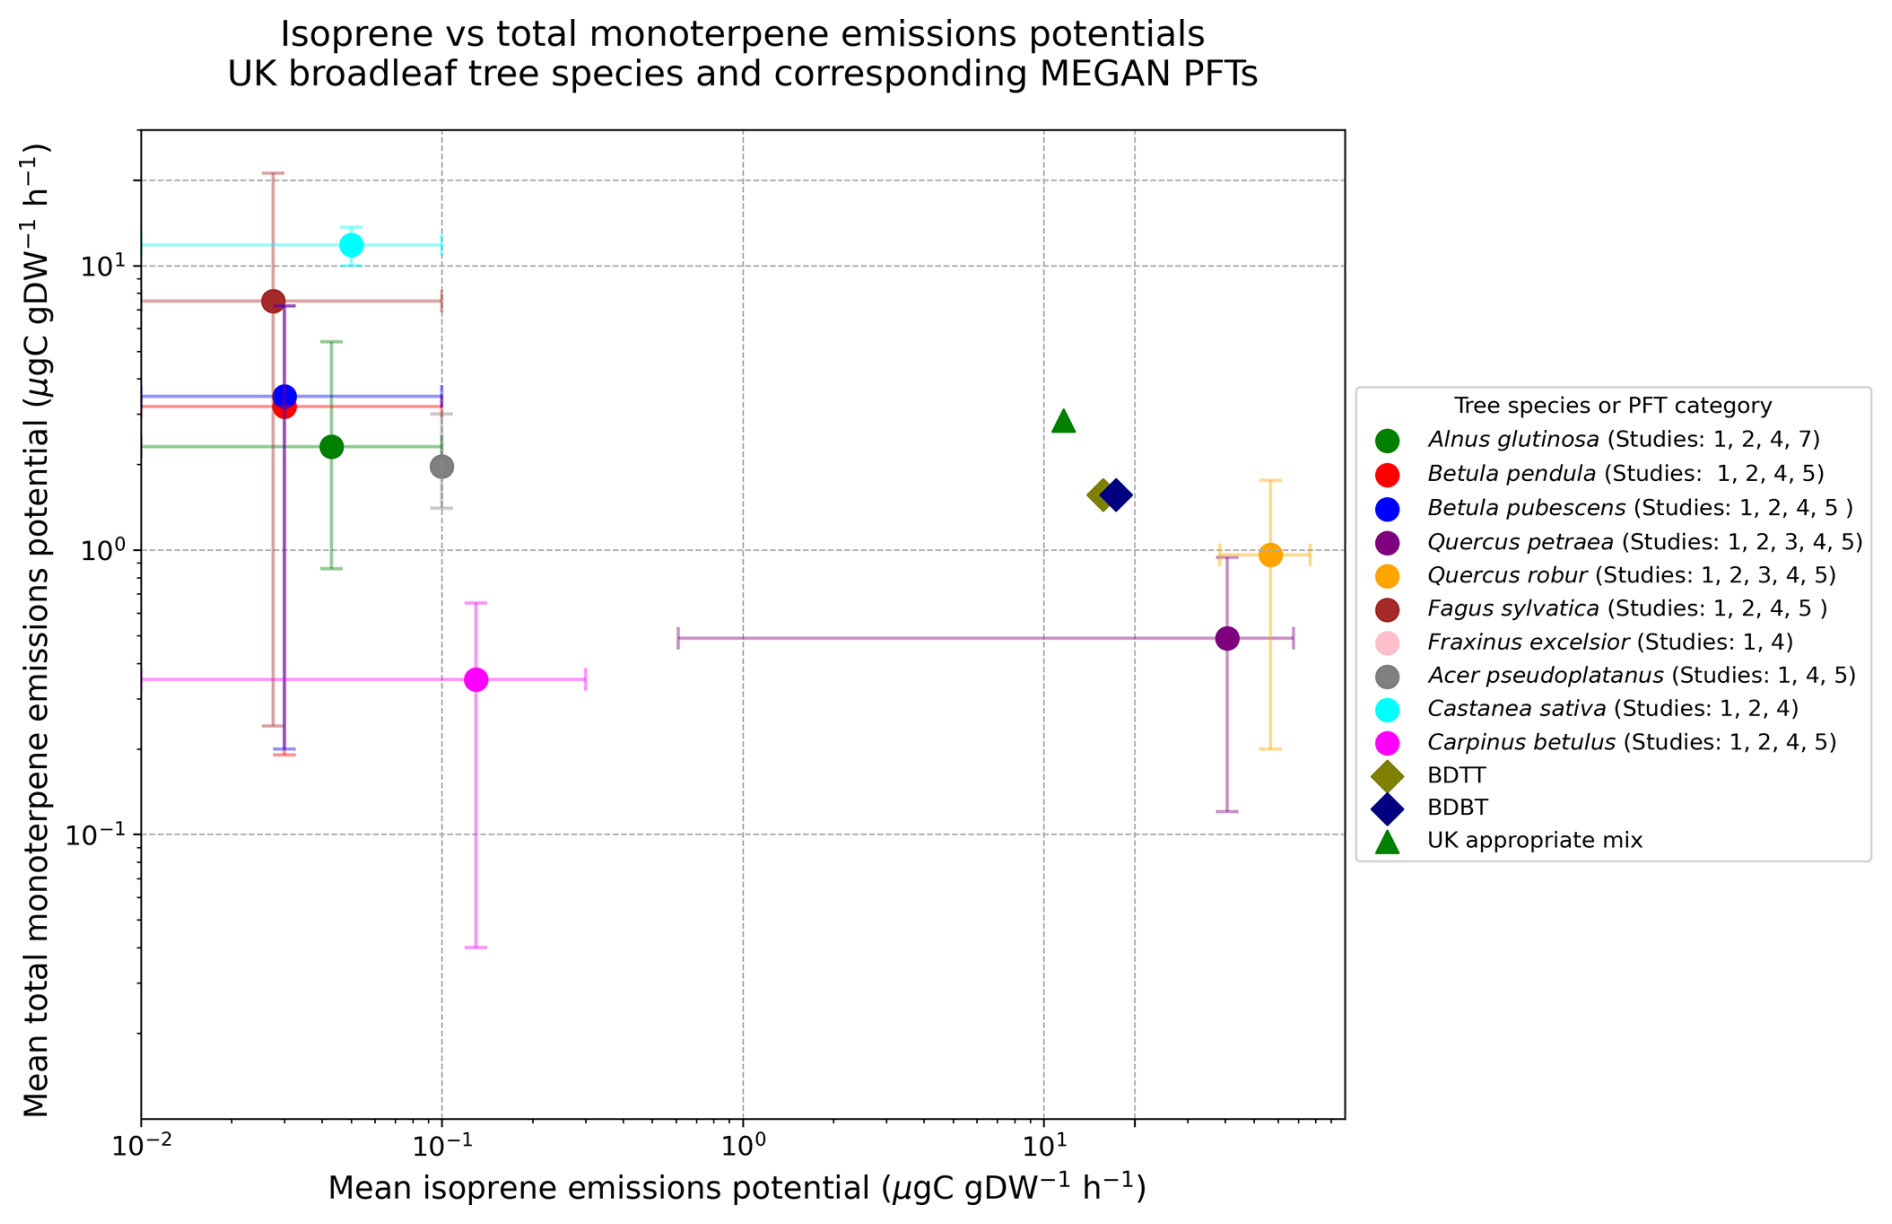
Figure 3Relationship between the mean isoprene and mean total monoterpene emissions potentials for UK appropriate broadleaf tree species. Circular markers represent the mean of values obtained for a given broadleaf tree species from the literature (see Table 2). Triangular markers represent a UK appropriate value calculated as a mean of broadleaf species emissions potentials weighted according to their present-day abundance in the UK (Forest Research, 2023). Diamond markers represent the emissions potentials of corresponding PFT categories within the default release version of MEGANv2.1 (BDTT and BDBT). Numbers in the figure legend correspond to the study number detailed in Table 2. Error bars indicate the minimum and maximum values obtained from the literature.
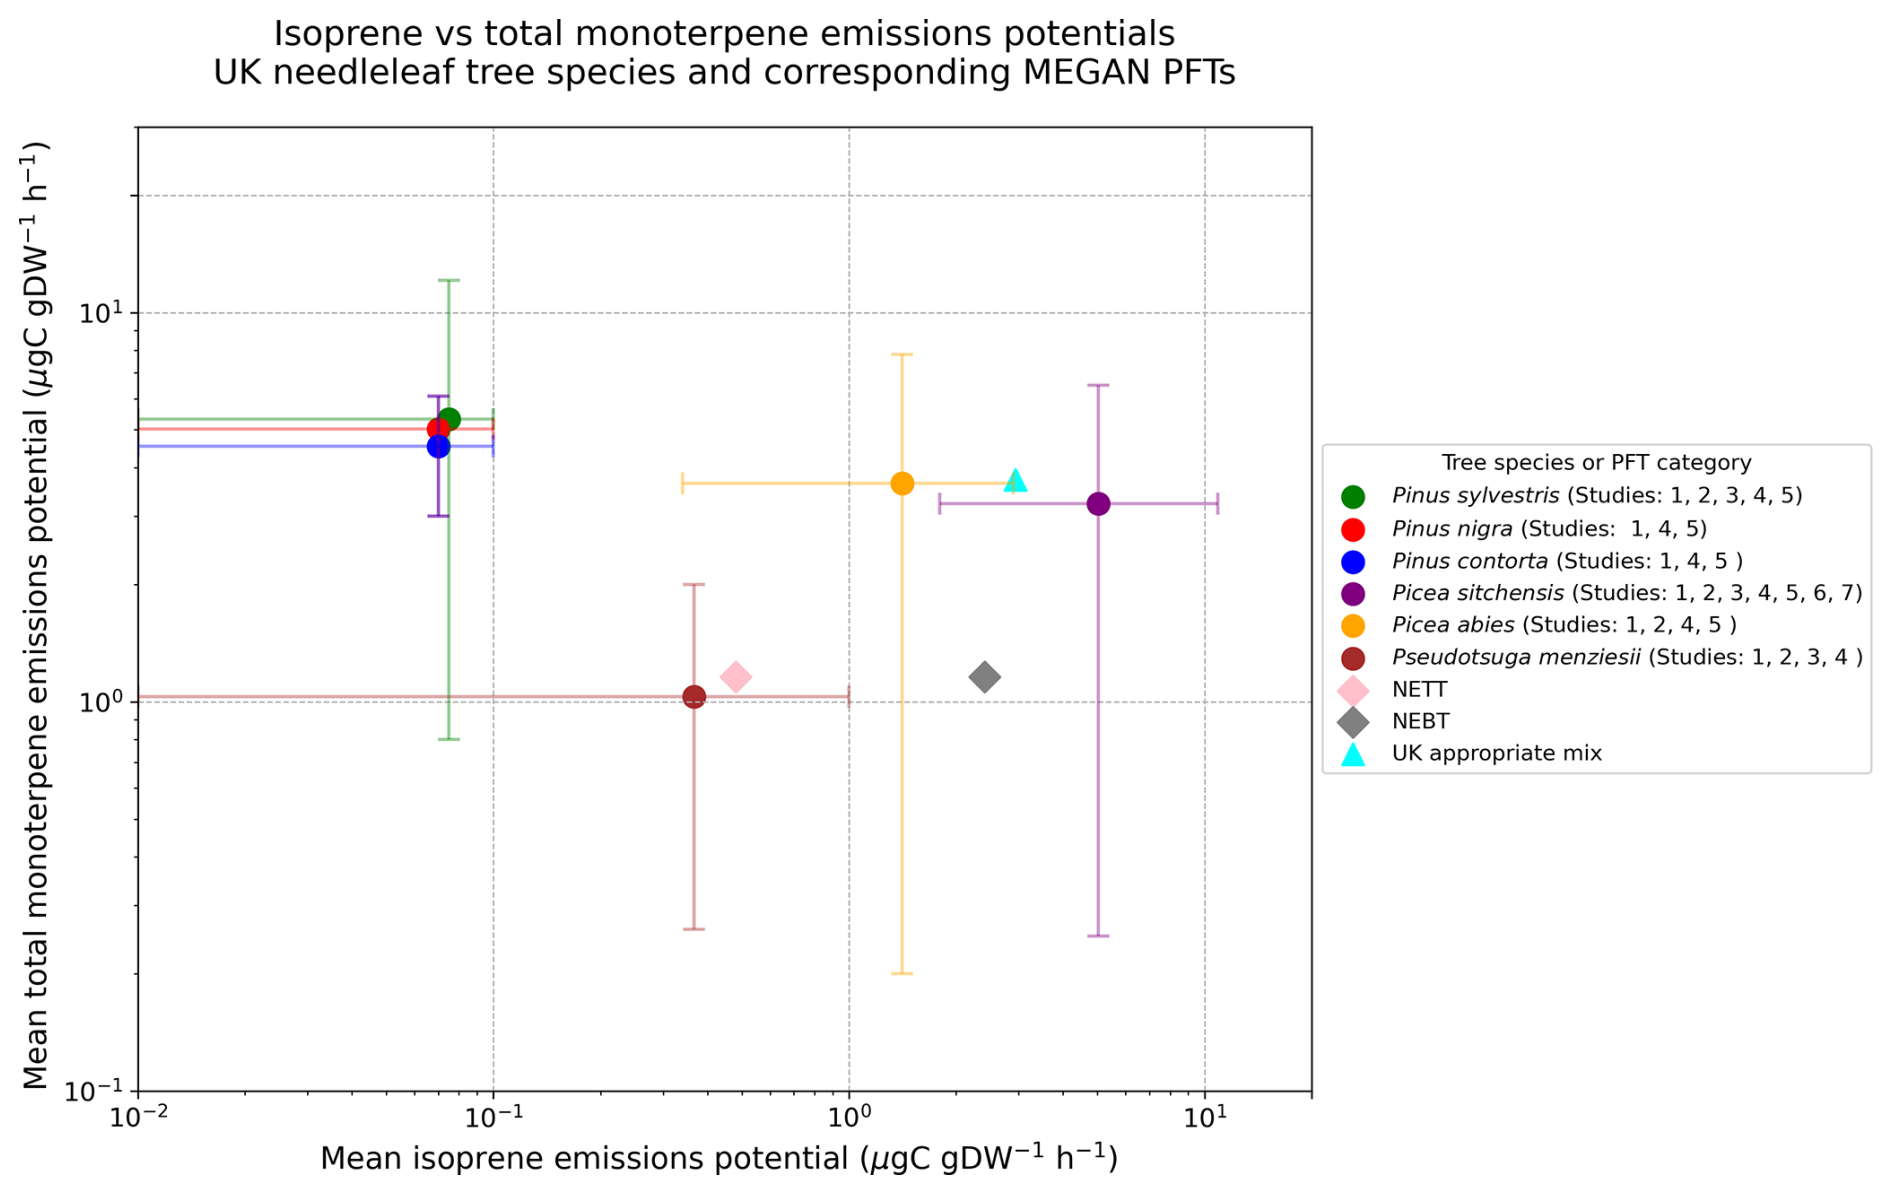
Figure 4Relationship between the mean isoprene and mean total monoterpene emissions potentials for UK appropriate needleleaf tree species. Circular markers represent the mean of values obtained for a given needleleaf tree species from the literature (see Table 2). Triangular markers represent a UK appropriate value calculated as a mean of needleleaf species emissions potentials weighted according to their present-day abundance in the UK (Forest Research, 2023). Diamond markers represent the emissions potentials of corresponding PFT categories within the default release version of MEGANv2.1 (NETT and NEBT). Numbers in the figure legend correspond to the study number detailed in Table 2. Error bars indicate the minimum and maximum values obtained from the literature.
The emissions potentials values obtained from different studies were used to calculate a mean emission potential for isoprene and total monoterpenes for each tree species. Figures 3 and 4 show the relationship between isoprene and total monoterpene emissions potentials for broadleaf (Fig. 3) and needleleaf (Fig. 4) tree species and the emissions potential of corresponding PFTs from MEGAN (namely BDTT and BDBT for broadleaf species and NETT and NEBT for needleleaf species) (Guenther et al., 2012). MEGAN provides values as emissions factors. To enable comparison, we converted emissions factors from MEGAN (Guenther et al., 2012) to emissions potentials using the Eq. (1), where Ef= emissions factor (), Ep= emissions potential () and Fd= foliar density, given as 560 g DW m−2 for deciduous trees and 1100 g DW m−2 for conifer trees (Guenther et al., 1995).
Table 2Overview of tree emissions potential studies reviewed, including the number of tree species that data were presented for, and the number of tree species incorporated into this study.
In the case of broadleaf species (Fig. 3), emissions potentials suggest three broad categories, where higher emitters of monoterpenes are generally lower emitters of isoprene (e.g. Fagus sylvatica and Betula pendula), higher emitters of isoprene are generally lower emitters of monoterpenes (e.g. Quercus spp.) and some are low emitters of both (e.g. Fraxinus excelsior). To reflect these groupings, we designed two broadleaf emissions scenarios, BL_highMono_lowIso and BL_lowMono_highIso (described in Table 3). Needleleaf tree species (Fig. 4) seem to be generally high emitters of monoterpenes, but either lower emitters of isoprene (e.g. Pinus spp.) or higher emitters of isoprene (e.g. Picea spp.). To reflect these groupings, we designed two needleleaf emissions scenarios: NL_highMono_lowIso and NL_highMono_highIso. The emission potentials used in each scenario are calculated as a mean of the tree species in that group, based on the mean of values presented in the literature. We developed a fifth emissions scenario, UK_appropriate_mix, with values calculated as a mean of species emission factors weighted according to their present-day abundance in the UK, based on the 2023 Woodland Statistics (Forest Research, 2023). A scenario using the existing emissions factors for these PFTs in MEGAN is referred to as the Default_MEGAN scenario. Emissions potentials for each scenario are illustrated in Fig. 5. For use in MEGAN, emissions potentials are converted to emissions factors. The emissions factors of each scenario are detailed in Table 3 for isoprene and total monoterpenes. For use in MEGAN, values for total monoterpene emissions factors were allocated to compound classes according to the ratio of those classes in default MEGAN emissions factors. Emissions factors are combined with information on vegetation type and distribution (PFTs), LAI, solar radiation and atmospheric CO2 concentration and (calculated by the CLM) soil moisture, soil temperature, leaf temperature and the canopy environment coefficient for calculating emissions in MEGAN.
Table 3Emission scenario short name and description, related PFT, example representative UK tree species informing the scenario, and emissions factors by BVOC compound class for isoprene and total monoterpene. The emissions scenarios are: Default_MEGAN, UK_appropriate_mix, NL_highMono_lowIso, NL_highMono_highIso, BL_lowMono_highIso and BL_highMono_lowIso. Where PFT is specified as broadleaf, this includes BDTT and BDBT PFTs. Where PFT is specified as needleleaf, this includes NETT and NEBT PFTs.
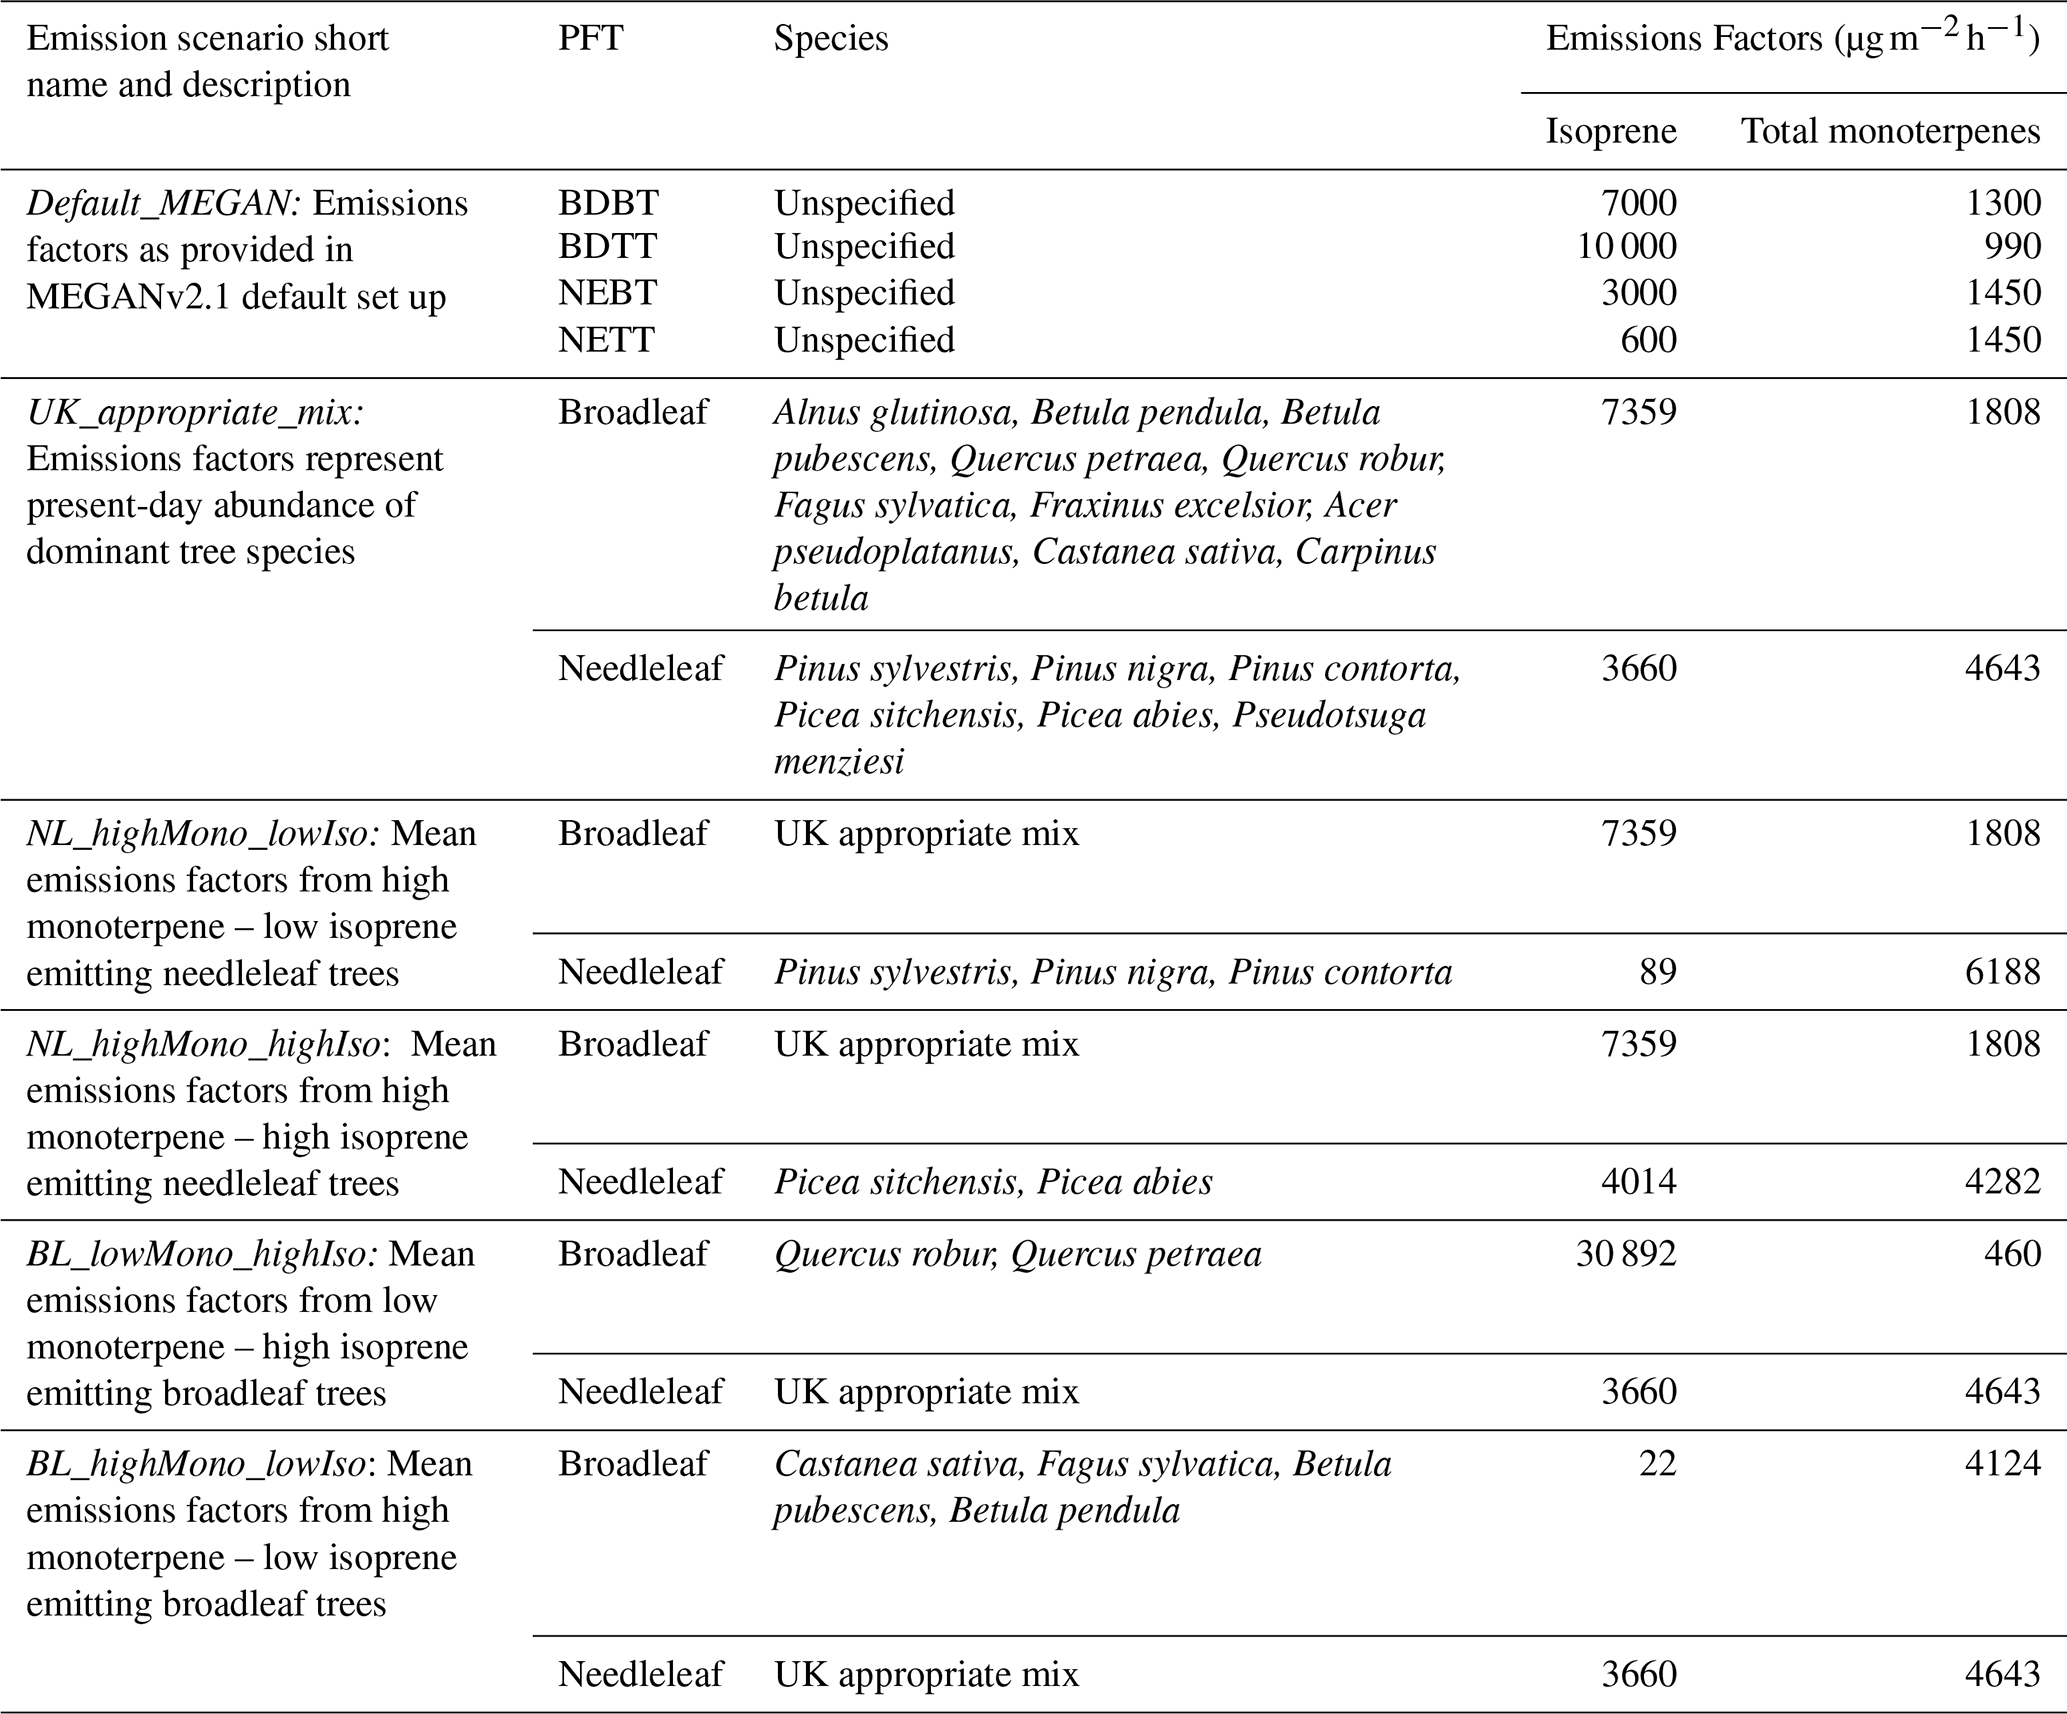
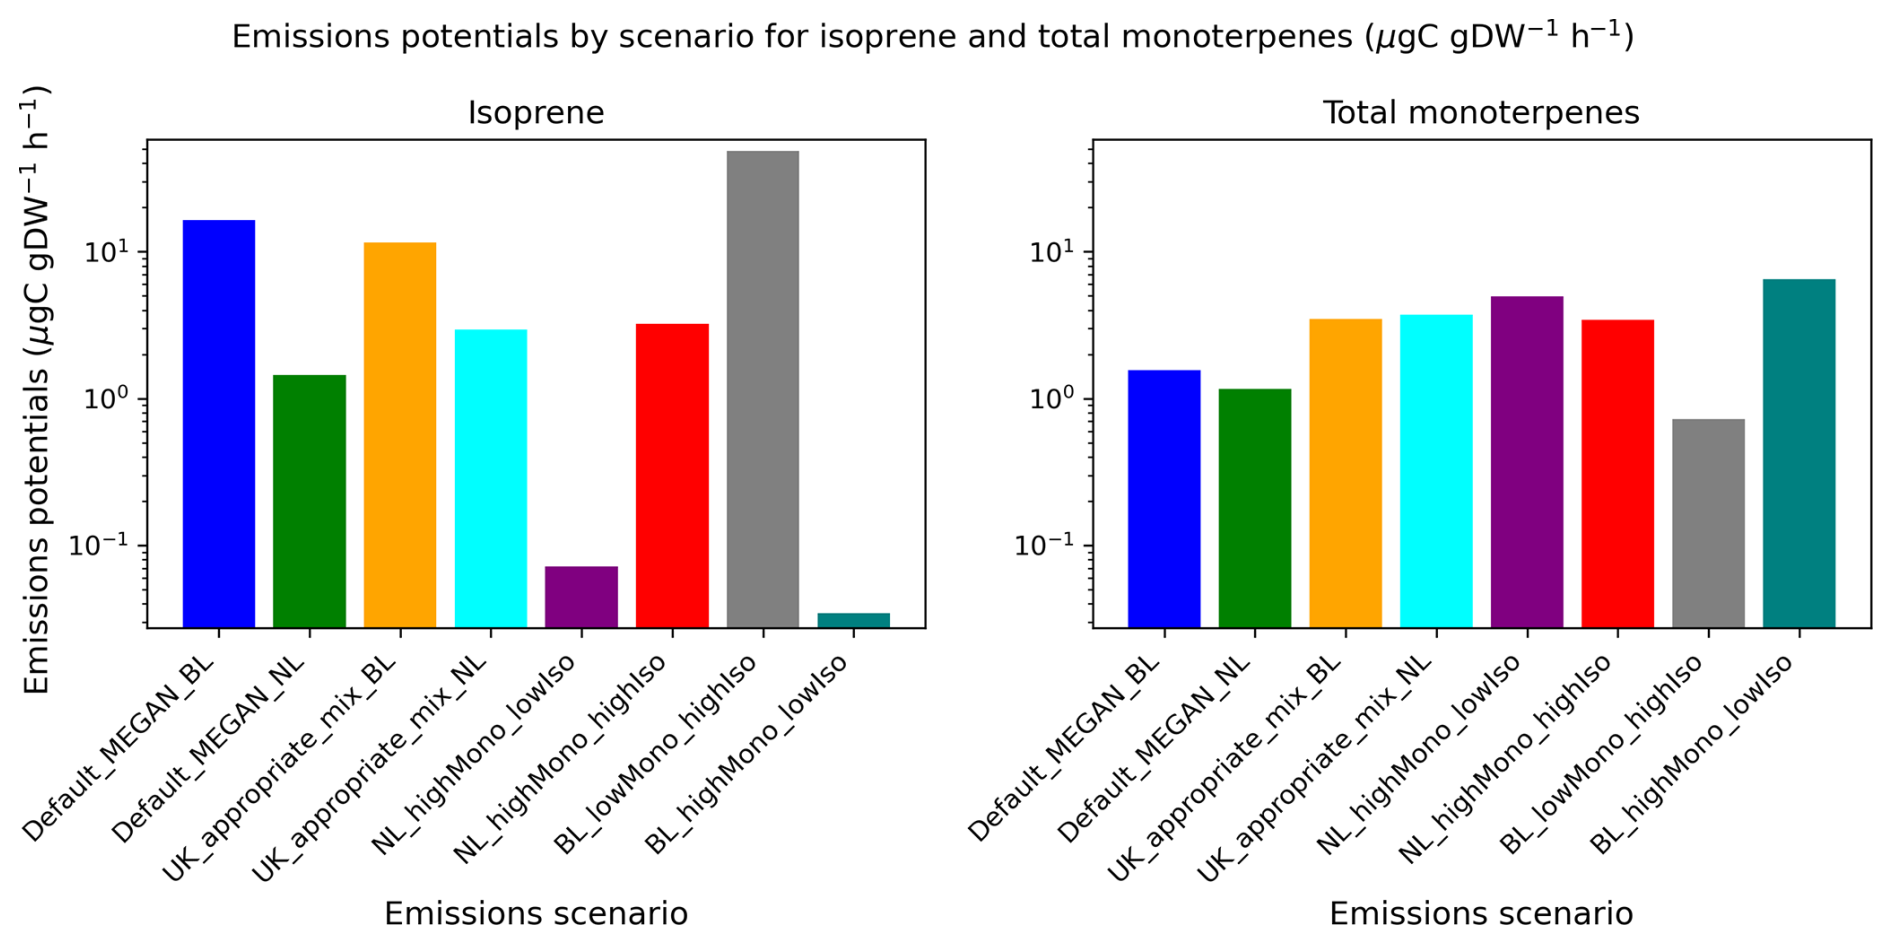
Figure 5Emissions potentials for isoprene and total monoterpene compound classes, across the emissions scenarios described in Table 3. For Default_MEGAN and UK_appropriate_mix scenarios, values are provided for both broadleaf (BL) and needleleaf (NL). For all other scenarios, when broadleaf or needleleaf is unspecified, UK appropriate mix values have been used.
2.5 Model set up
Simulations were undertaken at 0.47° × 0.63° resolution with the CLM component of Community Earth System Model (CESM) version 2.2.0 (Danabasoglu et al., 2020; Oleson et al., 2013). BVOC emissions are calculated by MEGAN (Guenther et al., 1993, 2012). Land surface input data for CLM was modified to reflect the CEH-LCM distribution of PFTs over the UK, generating the land surface dataset CEH-CLM used in this study, as detailed in Sect. 2.1. Meteorological data is from the Global Soil Wetness Project (see Dirmeyer et al., 2006), for the year 2003. Values of LAI are those developed for the CLM from the 1 km MODIS product as detailed in Lawrence and Chase (2007). Detailed information on model component sets for CESM2.2.0 is available from NCAR (https://docs.cesm.ucar.edu/models/cesm2/config/compsets.html, last access: 5 August 2025). An initial experiment to estimate present-day BVOC emissions uses an atmospheric CO2 concentration of 375 ppm, appropriate for the year 2003. We modify input CO2 concentration data in all other simulations to 500 ppm based on the projected atmospheric CO2 concentration in 2050 under SSP2-4.5 (Intergovernmental Panel on Climate Change, 2023). Previous studies have explored the impact of drought on BVOC emissions (e.g. Potosnak et al., 2014) and developed parameterisations to improve the representation of this process in MEGAN (e.g. Jiang et al., 2018; Wang et al., 2022). To enable quantification of the sensitivity of our results to the representation of the impact of drought on isoprene emissions, extra simulations were run with a modification to the soil moisture activity factor algorithm following Wang et al. (2022), see Table S2.
2.6 Meteorology
The controls on BVOC emission include temperature, atmospheric CO2 concentration and soil moisture (Guenther et al., 1993; Sharkey, 1996). To determine the appropriate meteorological data for simulating likely conditions in the year 2050, we compared observed and projected UK temperatures from the UK Climate Projections (UKCP) project (UKCP, 2018, 2021). Based on examination of HadUK-Grid daily observations of maximum air temperature at 1.5 m averaged for the UK for the years 2000–2021 (UKCP, 2021) and global projections of daily maximum temperatures at 1.5 m for the years 2045–2054 (UKCP, 2018), we determined that meteorology for the year 2003 was the best representation of projected 2050 temperatures in the historical dataset. The heatwave periods of the year 2003 have previously been studied for impacts on air quality, so this period provides the opportunity for comparison of modelled data to observations (Lee et al., 2006; Stedman, 2004; Vautard et al., 2005).
2.7 Model simulations
Table 4 describes the configurations used in 12 experiments to explore changes in UK BVOC emissions with and without additional forests. We carry out seven experiments without any additional forest, and five with afforestation aligned with achievement of approximately 19 % UK woodland coverage. At this resolution, the resulting level of afforestation in model experiments from which emissions are estimated is equivalent to the achievement of 18.65 % woodland cover by the year 2050.
Table 4Summary of model run configurations: afforestation experiment short name, experiment description and input data: land cover, emission scenario short name and associated emission factors and atmospheric CO2 concentration data. In experiment names “Present_day…” refers to the land cover. The latter half of the name refers to the emissions potentials.
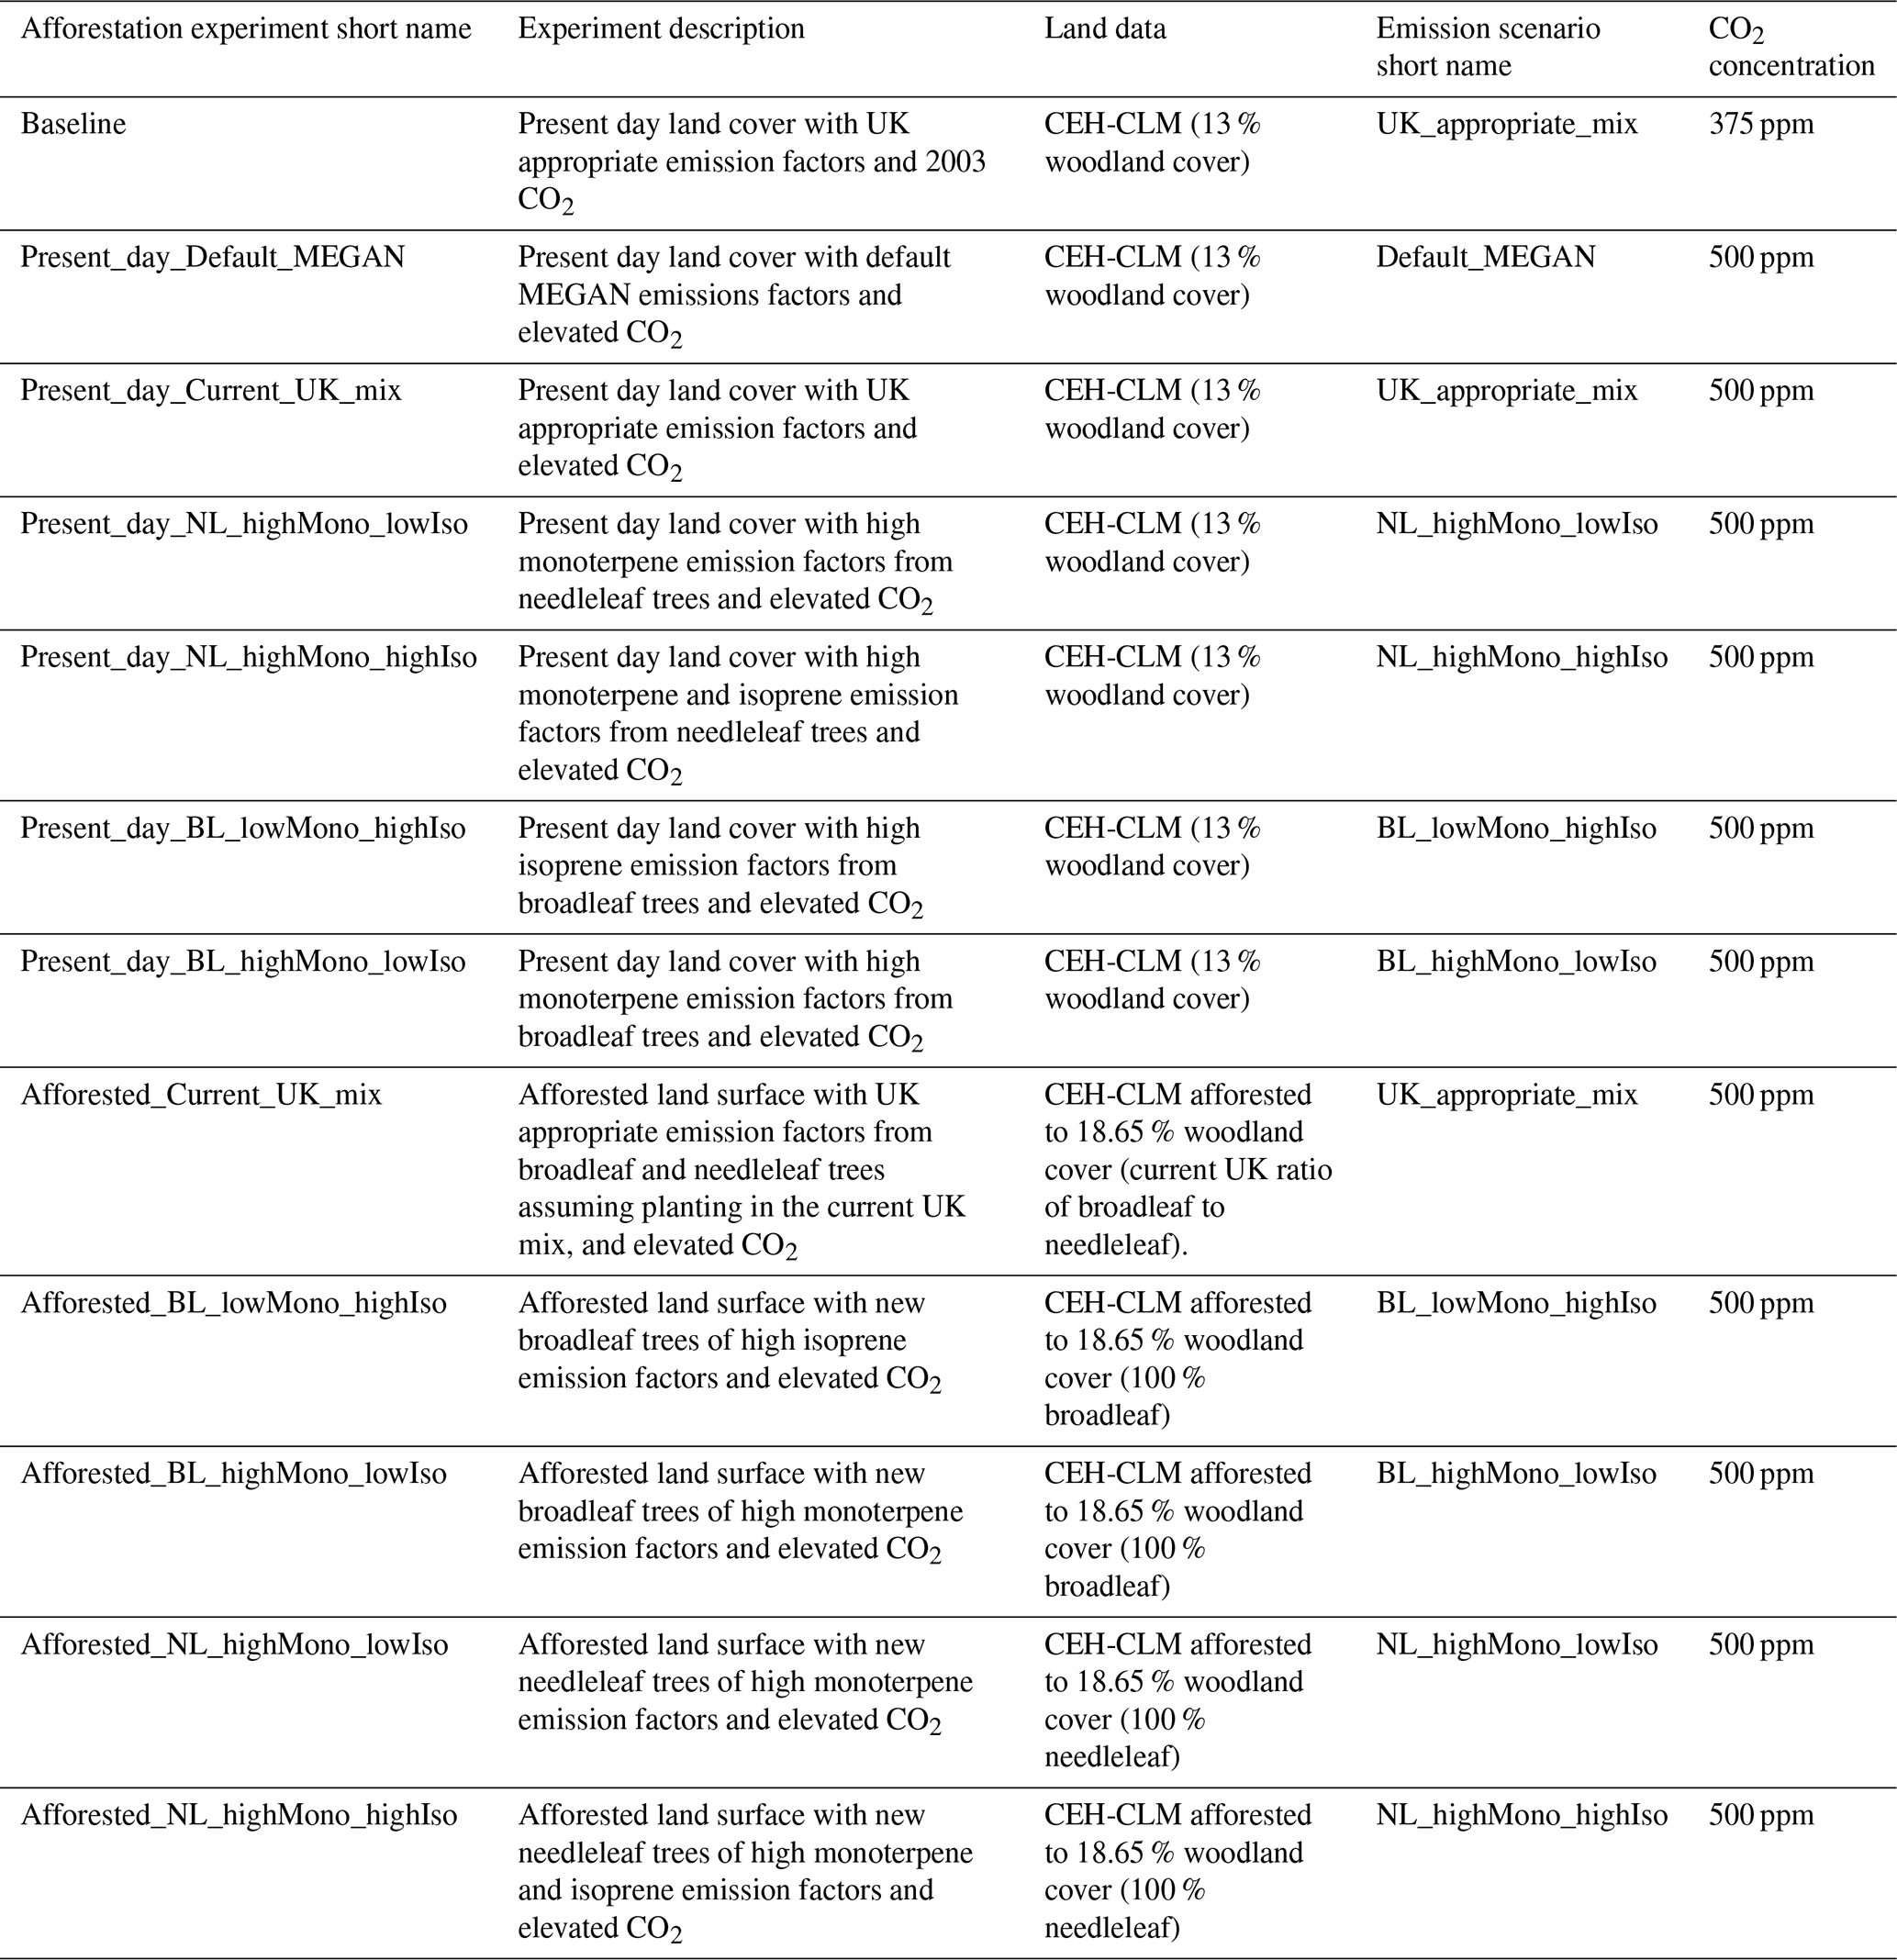
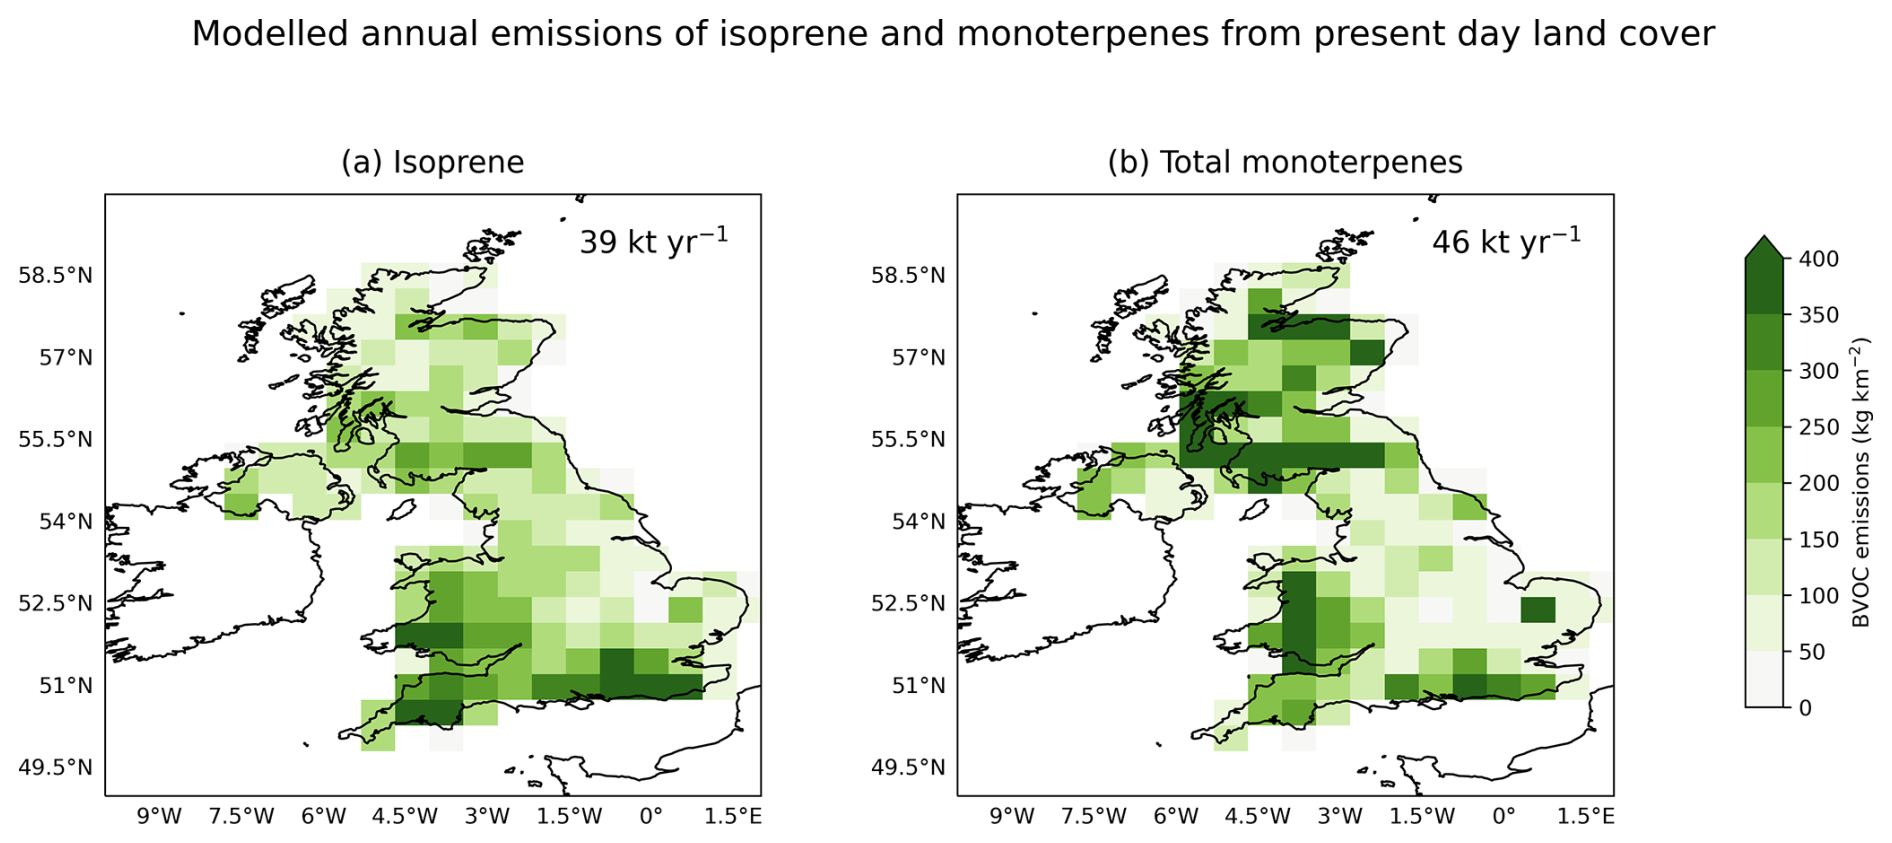
Figure 6Modelled distribution of emissions of isoprene (kg km−2) and total monoterpene (kg km−2) from present day UK land cover. Panels (a) and (b) show the emissions generated from the Baseline experiment. The UK total (thousand tonnes) is given in the text overlay.
3.1 Estimating present-day annual UK emissions of isoprene and total monoterpenes
Figure 6 illustrates the distribution of annual UK emissions for isoprene and total monoterpene compound classes from our Baseline experiment (Table 4). We present an estimate of present-day UK annual isoprene emission of 39 kt yr−1 and total monoterpene emission of 46 kt yr−1. Our estimates of BVOC emissions with present-day land cover fall within the range of values presented in previous studies for the UK or Great Britain, i.e. 8–110 kt yr−1 for isoprene and 31–145 kt yr−1 for total monoterpenes (Guenther et al., 1995; Hayman et al., 2017; Purser et al., 2023; Simpson et al., 1999; Stewart et al., 2003). The spatial distribution of emissions is similar to that illustrated in previous UK studies, such as Purser et al. (2023) and Stewart et al. (2003), with the greatest isoprene emission rates located in the southern-most parts of England and around the Scotland-England border, whilst monoterpene emissions are concentrated in Scotland, and parts of Wales.
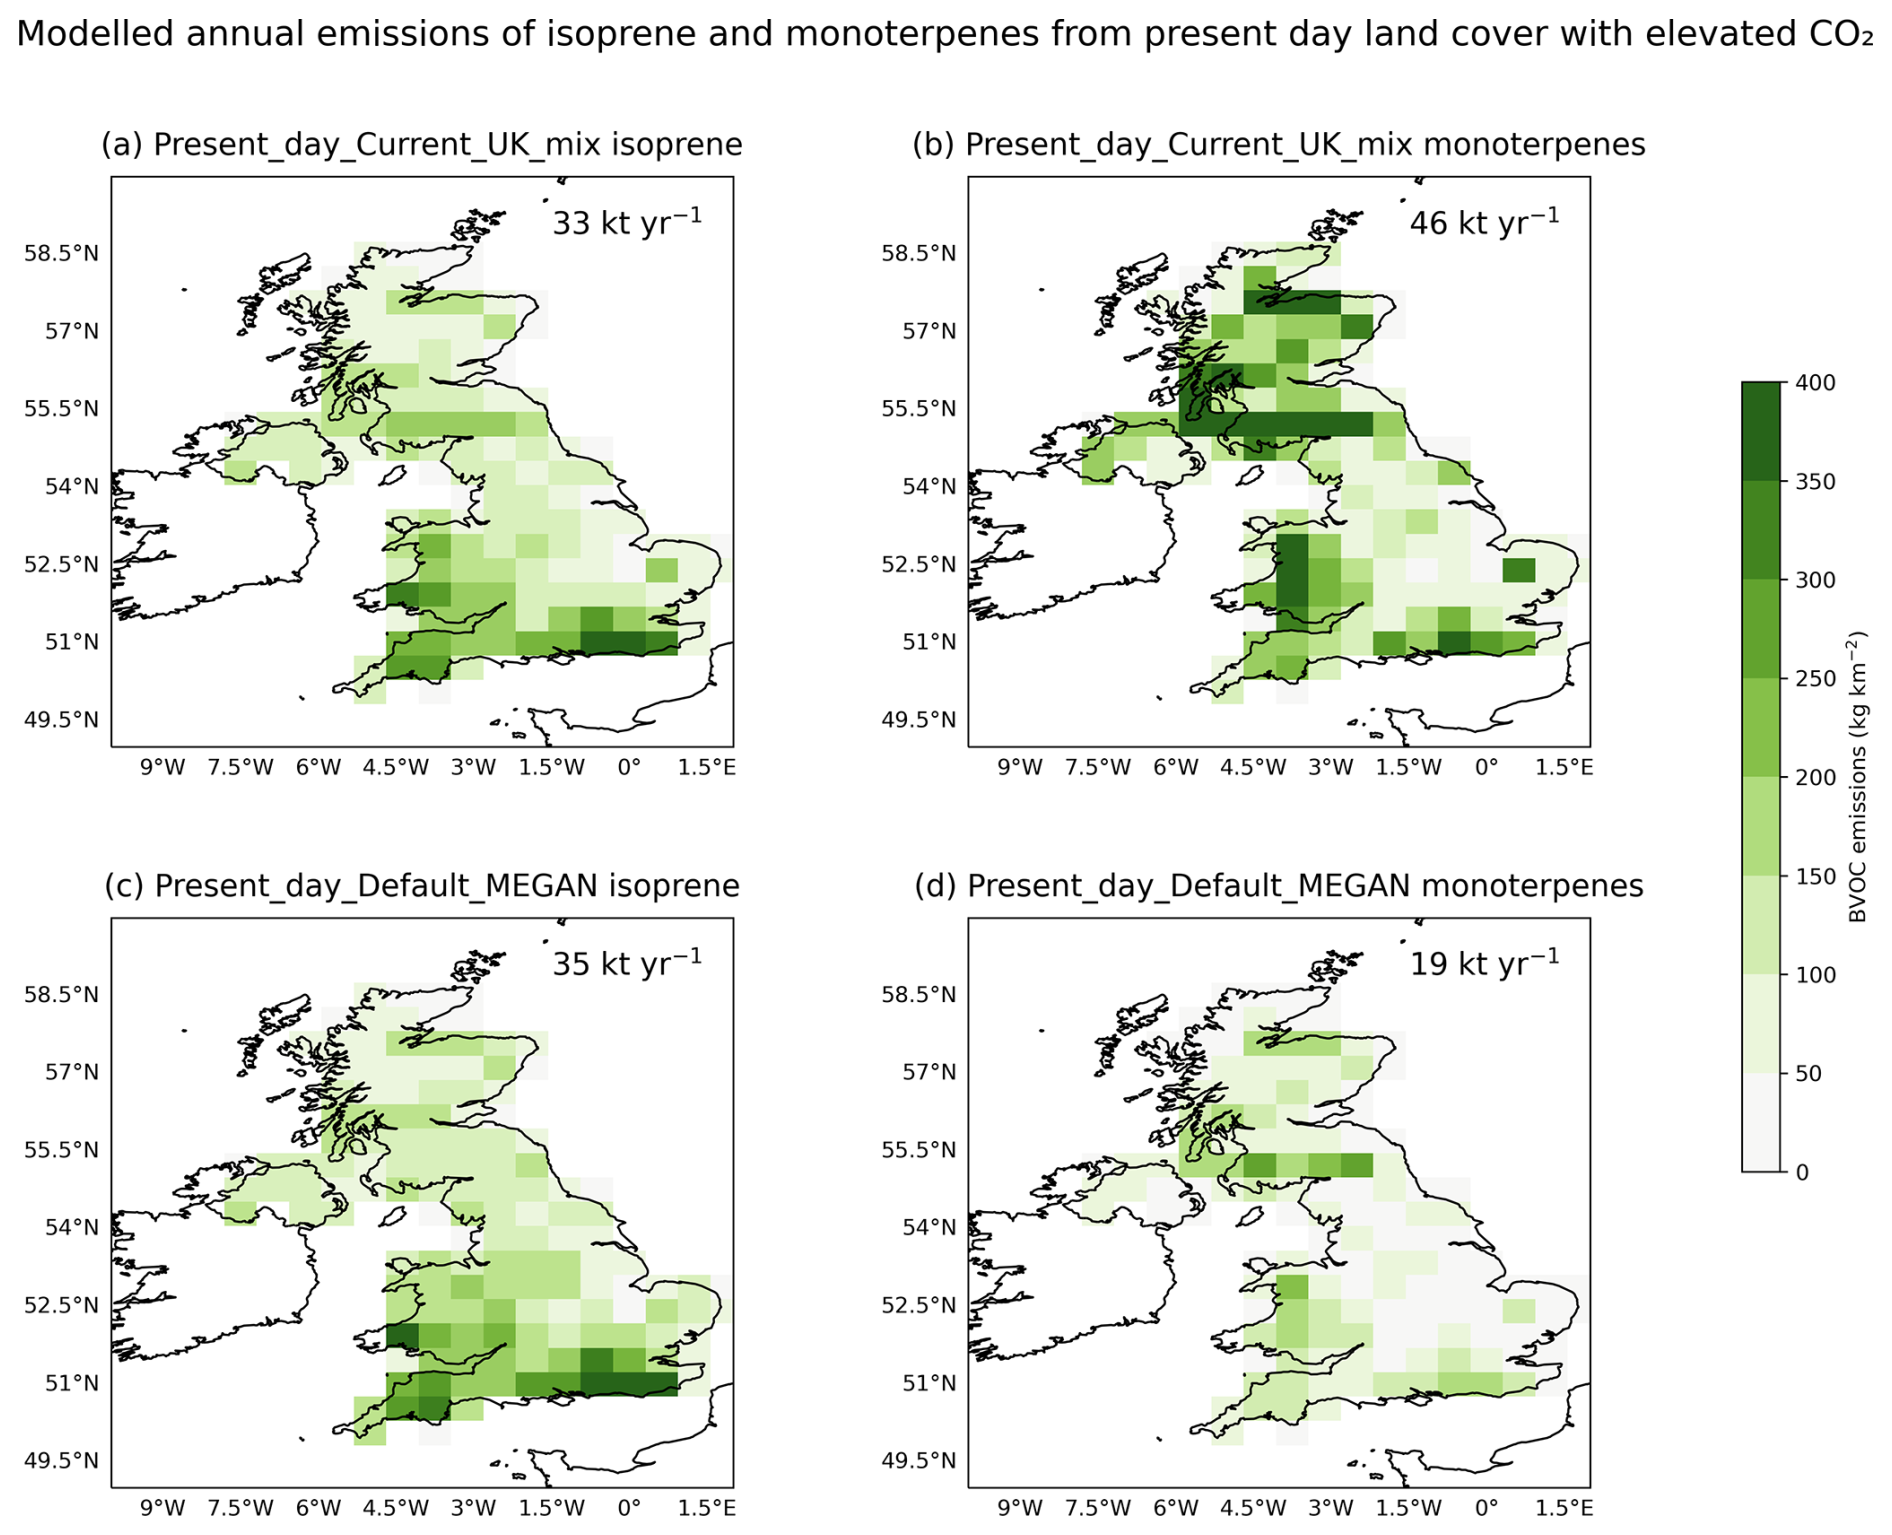
Figure 7Modelled distribution of emissions of isoprene (kg km−2) and total monoterpene (kg km−2) from present day UK land cover. Panels (a) and (b) show the emissions generated from the Present_day_UK_appropriate_mix experiment. Panels (c) and (d) show the emissions generated with the Present_day_Default_MEGAN experiment. The UK total (thousand tonnes) is given in the text overlay.
3.2 Investigating the impact of emissions factors and CO2 concentration
Figure 7 illustrates the distribution of annual UK emissions for isoprene and total monoterpenes from present day land cover for experiments Present_day_Current_UK_mix (Fig. 7a and b) and Present_day_Default_MEGAN (Fig. 7c and d). In these experiments CO2 concentrations are elevated to those projected for the year 2050 to enable calculation of the estimated change in emissions attributed to afforestation only in afforested experiments (Sect. 3.3). Experiment Present_day_Current_UK_mix simulates isoprene emissions lower than our Baseline experiment, at 33 kt yr−1, whilst emissions of total monoterpene are unchanged. The decline of 15 % in isoprene emissions, in the absence of any change to woodland coverage, can be attributed to the CO2 inhibition effect on the rate of isoprene emission from trees.
Estimates of BVOCs have been made on the global scale and continental scale (Guenther et al., 1995; Simpson et al., 1999), but few estimates have been made for the UK (e.g. Purser et al., 2023; Simpson et al., 1999; Stewart et al., 2003). Further, studies have demonstrated the impact of providing localised tree species information on estimates of BVOCs for a given location, compared to coarser resolution forest data. For example, Luttkus et al. (2022) examined the impact of detail in land use data on air quality predictions, showing substantial differences between estimates of BVOC emissions, and their distribution, when detail on tree species distribution was improved. The review of emissions potential data presented in Sect. 2.4 illustrated that emissions potentials of isoprene from broadleaf PFTs in our UK_appropriate_mix scenario are lower than those in the Default_MEGAN scenario, whilst values for needleleaf PFTs were slightly higher in the UK_appropriate_mix scenario than those in the Default_MEGAN scenario (Fig. 5). Combined, these variations result in the small decrease of 6 % in isoprene overall in our experiment (to 33 kt yr−1) when emissions data is adapted to reflect UK tree species (Fig. 7). In contrast, the emissions potentials data found values for monoterpenes in both broadleaf and needleleaf PFTs to be largely underestimated in MEGAN when compared to a range of UK tree species (Fig. 7). This is reflected in the estimate of total monoterpene emissions from our Present_day_Current_UK_mix experiment (at 46 kt yr−1) being more than twice that of our Present_day_Default_MEGAN experiment. Adjusting emissions factors to represent the current relative abundance of tree species in the UK delivers approximately 142 % extra monoterpene emissions. This demonstrates the importance of preparing bespoke input data for examining BVOC emissions, where regionally appropriate emissions factors can be applied.
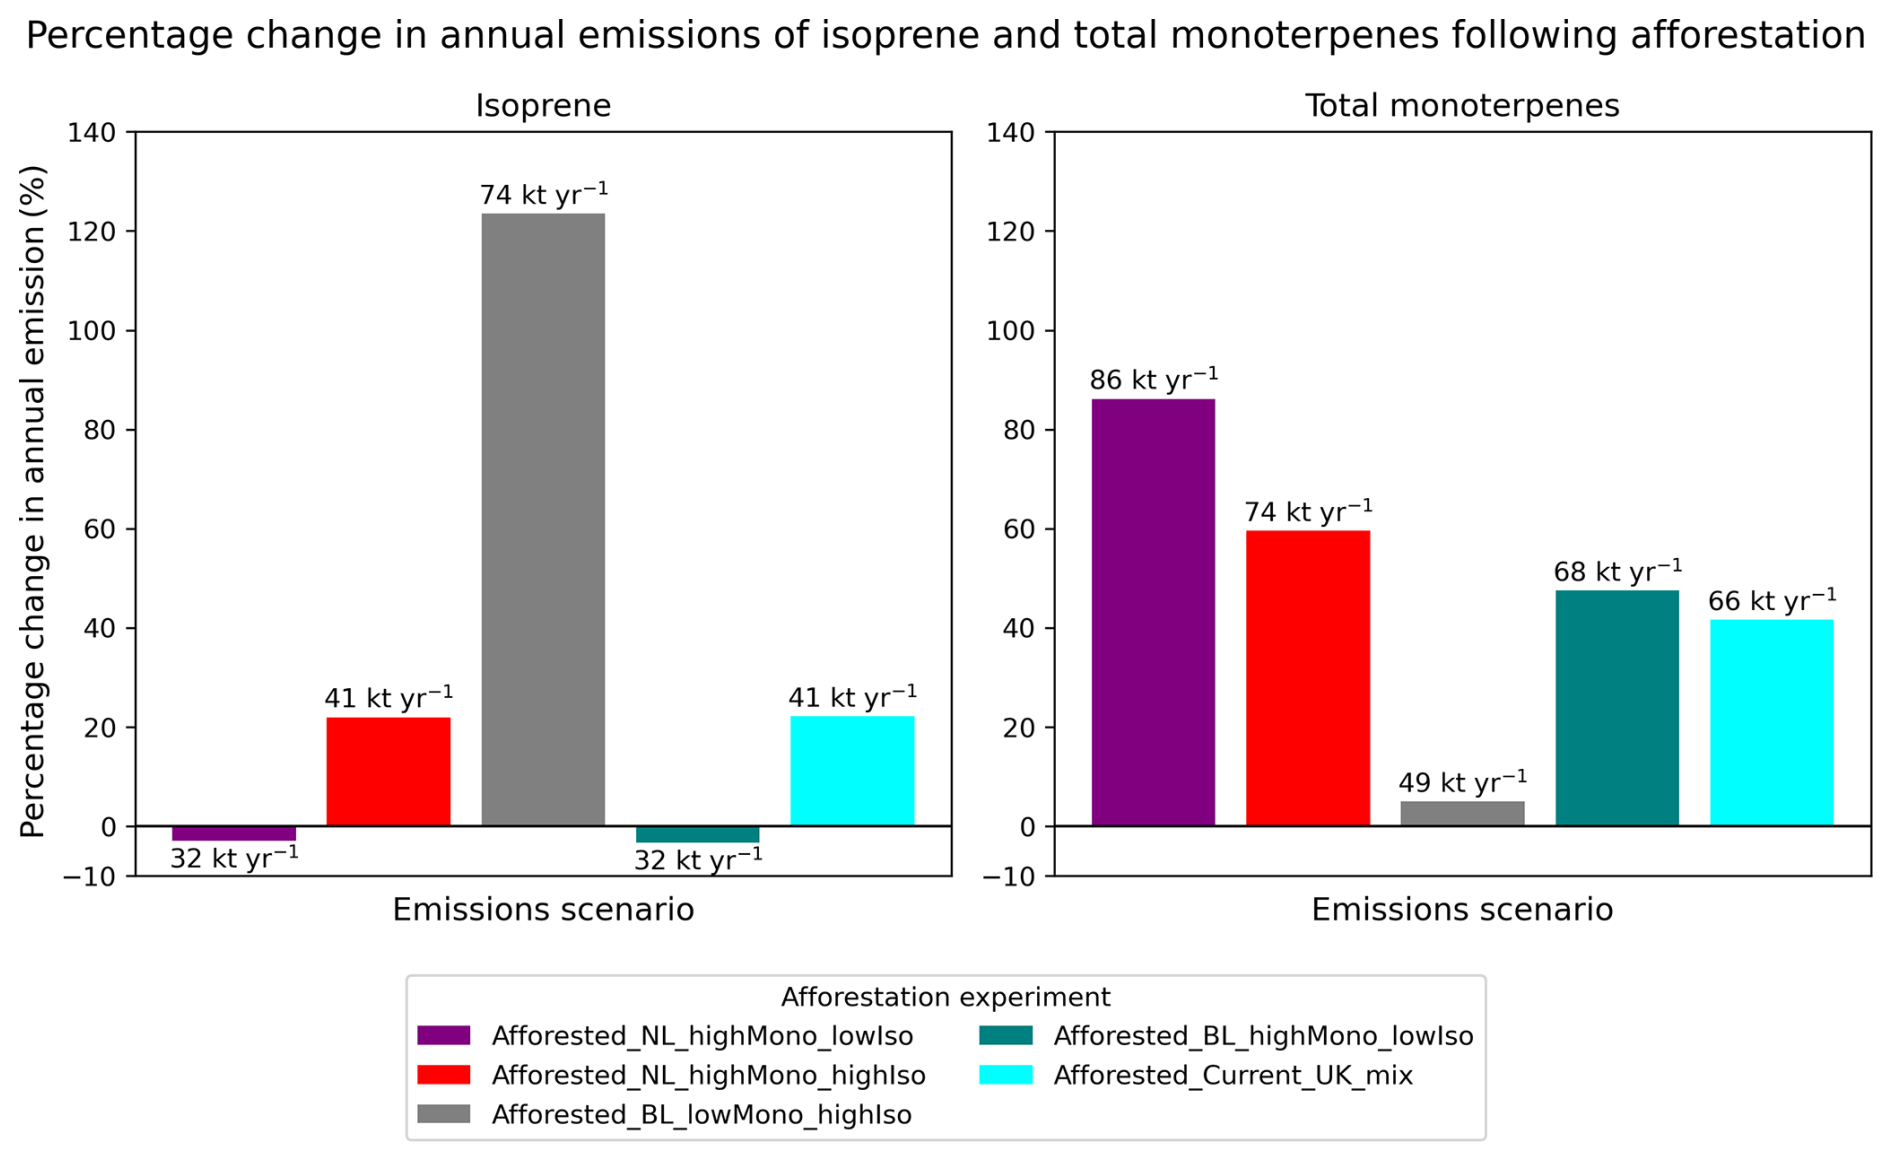
Figure 8Percentage change in modelled annual UK emissions of isoprene and total monoterpene following afforestation to 19 % woodland cover for five afforestation experiments: Afforested_BL_lowMono_highIso, Afforested_BL_highMono_lowIso, Afforested_NL_highMono_lowIso, Afforested_NL_highMono_highIso and Afforested_Current_UK_mix as detailed in Table 5. The total annual UK emissions of isoprene and total monoterpenes of each experiment are given in the text overlay. The percentage change reported here is relative to our Present_day_Current_UK_mix experiment, with the change attributed to the difference in forest cover (all experiments using elevated CO2 at 500 ppm).
3.3 Estimating BVOC emissions attributed to UK afforestation
Figure 8 illustrates the percentage change in annual UK emissions of isoprene and total monoterpenes across the five afforestation experiments relative to present day land cover. All experiments used to estimate percentage change in emissions use elevated CO2 as projected for 2050, therefore all percentage changes in emissions are attributed to afforestation alone. Modelled estimates of total annual UK emissions of isoprene and total monoterpene compound classes are given in the text overlay. Values of percentage change in annual UK emissions and total annual estimates are also summarised in Table 5.
In all scenarios, the larger increases in emissions are concentrated in Scotland (see Figs. S3 and S4 for maps of percentage change in emissions) due to the scale of planting introduced there relative to the other UK nations (Table 1). The greatest increase in isoprene was observed in the experiment Afforested_BL_lowMono_highIso, where individual grid cells experienced up to a 250 % increase in emissions, and total emissions increased by 123 %. In experiments Afforested_BL_highMono_lowIso and Afforested NL_highMono_lowIso, the replacement of grassland with tree cover results in a reduction of isoprene emissions, of −3 %, and as much as −50 % on an individual grid cell level. This is attributed to the lower emission factors applied to tree PFTs relative to those representing grass PFTs. The adaptations to prepare bespoke UK appropriate emissions potential values were not also made for non-tree PFTs. Therefore, our study may not present the best possible representation of UK non-tree PFTs, and so the decline in emissions attributed to replacement of grassland with woodland may not accurately reflect the case of UK grasses. The potential change in BVOC emissions from afforestation would vary with the type of land cover replaced, bringing some uncertainty to the direction of change in emissions in the future. However, similar outcomes were found by Purser et al. (2023) where afforestation was focused on short rotation forestry, with a decline in isoprene emissions of 14 % when examining the impact of large-scale planting of alder. In Fig. 8, we see an increase in monoterpene emissions under all scenarios. The greatest changes are observed in the Afforested_NL_highMono_lowIso scenario where some grid cells experience an increase above 250 %, and total monoterpene emissions increased by 86 %. Experiments Afforested_NL_highMono_highIso, Afforested_BL_highMono_lowIso and Afforested_Current_UK_mix demonstrate moderate increases in monoterpene emissions, between 42 % and 60 %. The smallest change in monoterpene emissions is observed in our Afforested_BL_lowMono_highIso experiment, where a 5 % increase is simulated.
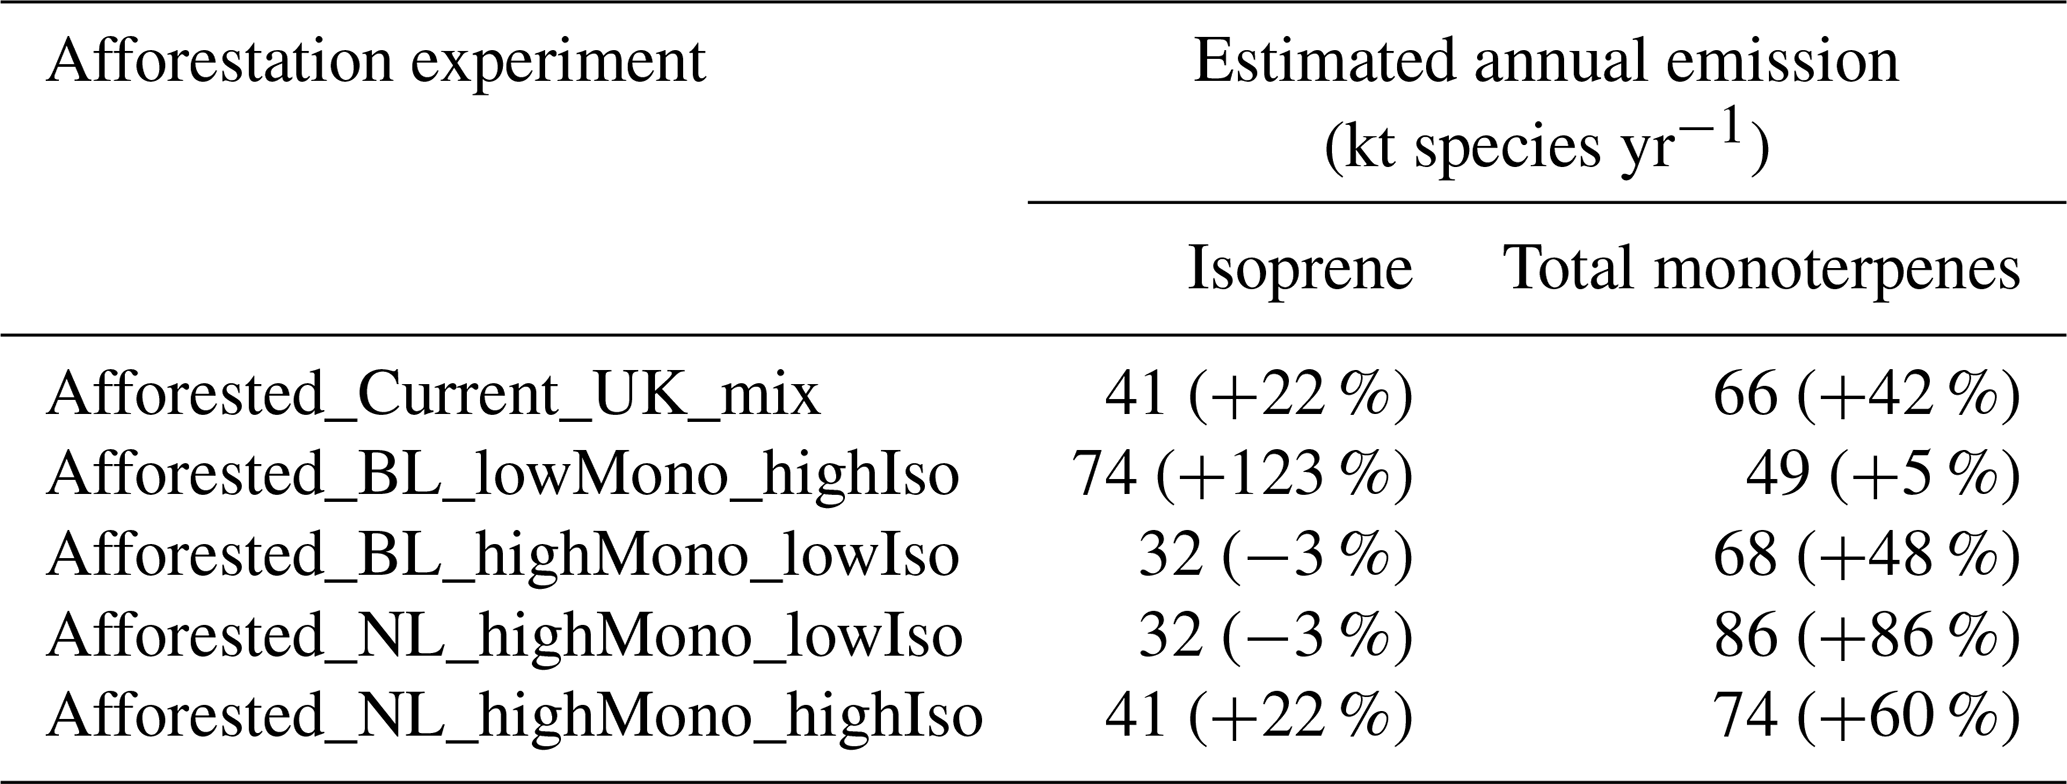
Our modelled estimates of isoprene emission for the UK with 19 % woodland coverage vary between 32 and 74 kt yr−1 across the experiments; modelled estimates of total monoterpene emission are between 49 and 86 kt yr−1. Overall, our results indicate that emission factors and tree species mixture substantially change estimates of BVOC emissions from the UK's future forests.
Table 5Modelled estimates of annual UK isoprene and total monoterpene emissions (thousand tonnes) and percentage change (relative to Present_day_UK_appropriate_mix) following afforestation to 19 % woodland cover for five afforestation experiments.
To isolate the impact of afforestation, the BVOC emissions changes presented in Table 5 are all calculated from pairs of simulations with elevated atmospheric CO2 concentration. It should be noted that in the absence of any additional woodlands in our simulations, CO2 inhibition leads to a 15 % decrease in isoprene emissions from 39 kt yr−1 in our Baseline experiment to 33 kt yr−1 in our Present_day_Current_UK_mix experiment. When comparing the emissions from our Baseline experiment to our Afforested_Current_UK_mix experiment with additional woodland and elevated CO2 (41 kt yr−1), we see only a 5 % increase in isoprene emissions because the CO2 inhibition effect offsets a portion of the increase in emission due to additional woodlands.
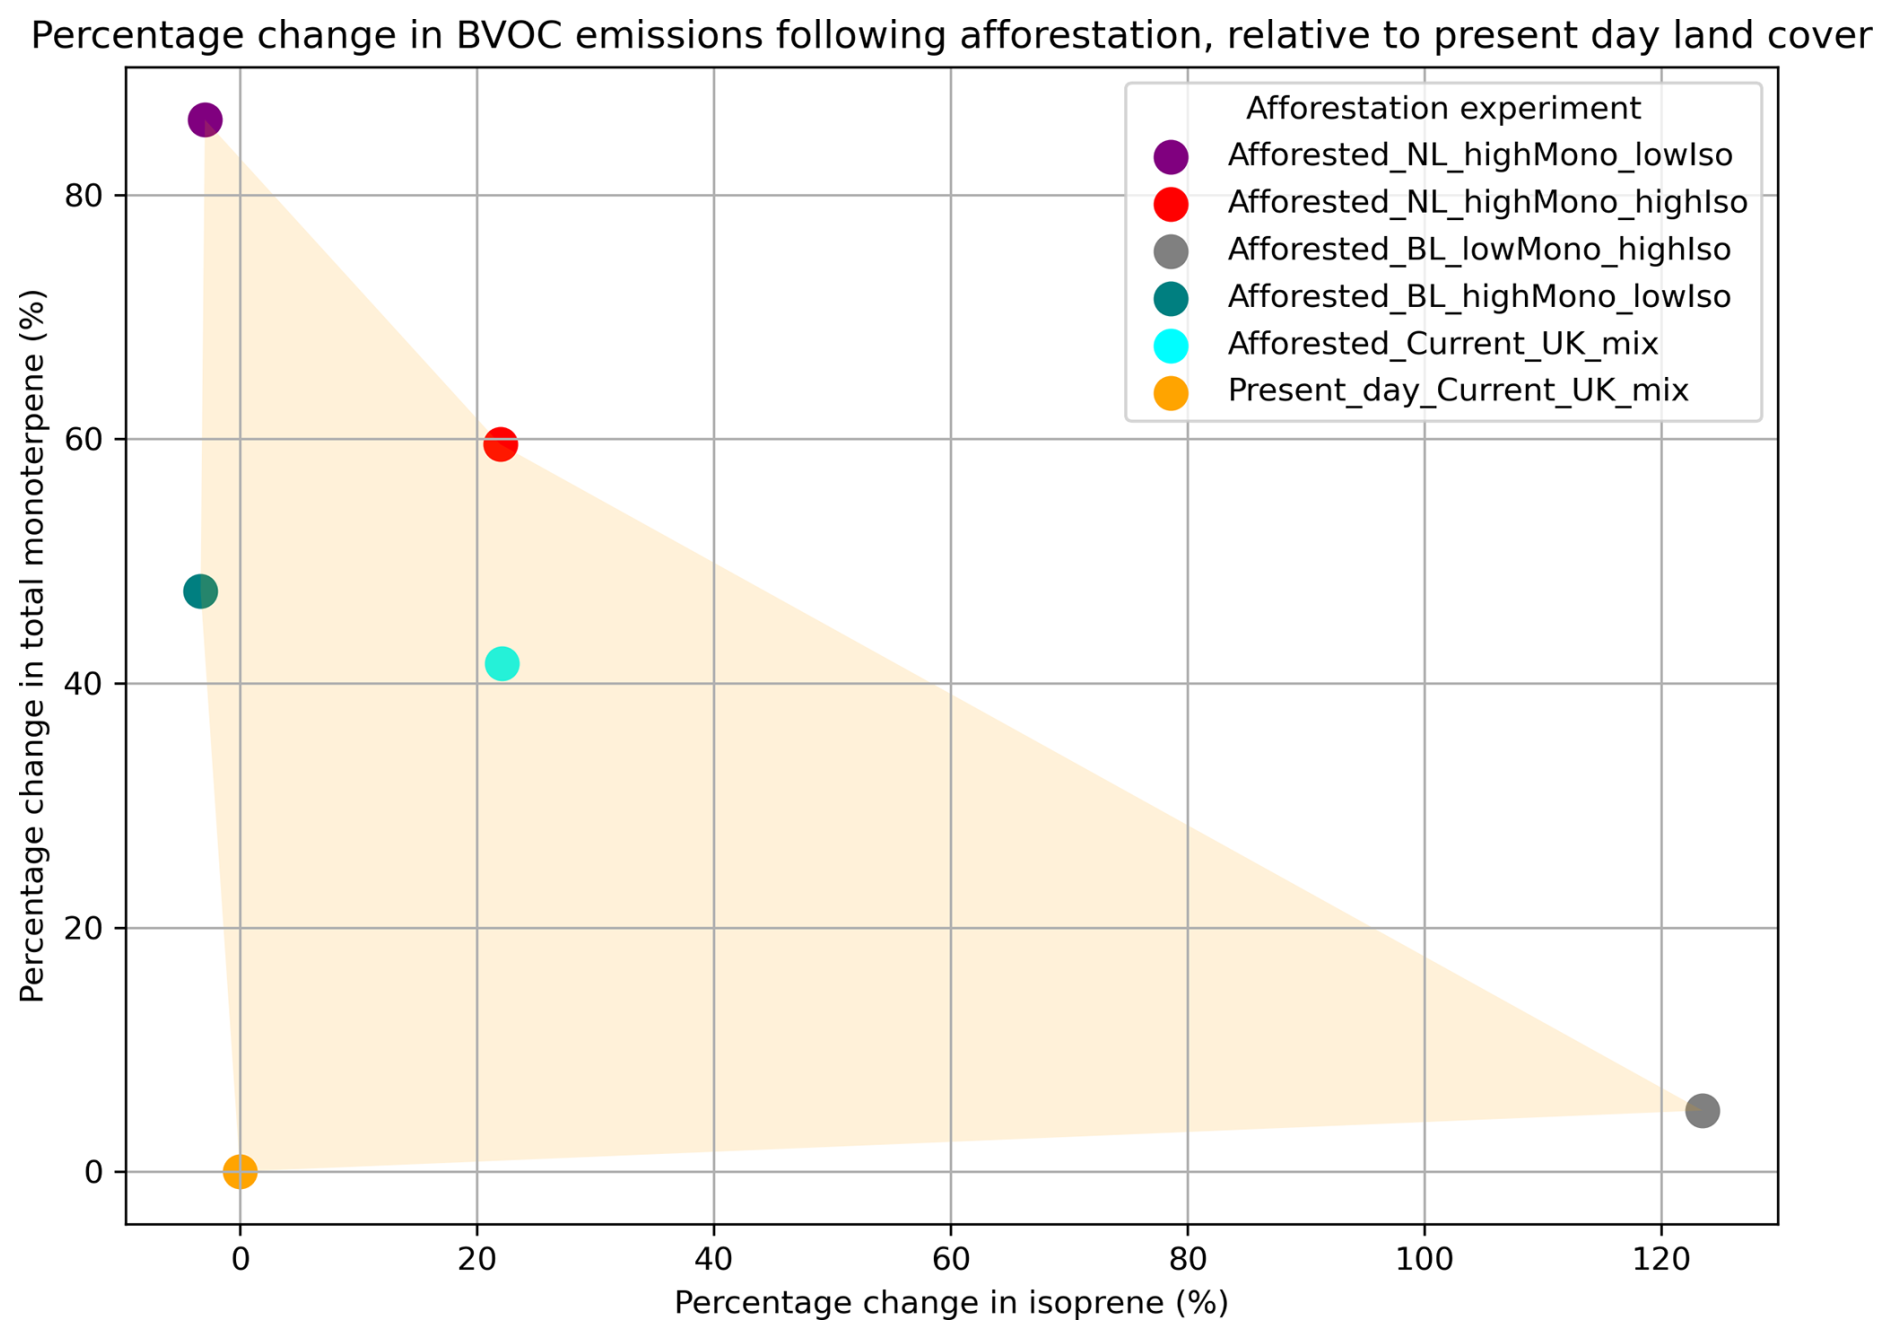
Figure 9Relationship between the percentage change in modelled estimates of annual UK isoprene and total monoterpene emissions by afforestation experiment, compared to present day land cover.
Figure 9 illustrates the relationship between changes in isoprene and total monoterpene emissions across the five afforestation experiments. With the combination of species mixtures examined, we demonstrate the possibility for isoprene emission to be reduced whilst delivering ambitious afforestation by 2050. However, in experiments where isoprene is reduced (by as much as −3 %), monoterpenes increase by at least 48 %. All experiments result in an increase in monoterpenes. This reflects the fact that all afforestation scenarios include tree PFTs that are higher emitters of monoterpenes than the grassland that has been replaced. Our experiment Afforested_BL_lowMono_highIso demonstrates the potential to minimise the increase in monoterpenes, with an increase of just 5 %, however this is estimated to deliver the most extreme change across all experiments in relation to isoprene, which increases by over 120 %. Our experiments demonstrate the range of futures that net-zero aligned UK afforestation could deliver for BVOC emission from natural vegetation. We compare our rates of change to estimates of BVOC emissions from Purser et al. (2023) for the UK. When scaled to the same level of afforestation, their scenarios estimate changes in isoprene between −4 % and +53 %, whilst the change in monoterpenes in their scenarios is between approximately −3 and +42 % (Purser et al., 2023). The range of UK tree species explored in our paper captures greater extremes in emission potentials for both monoterpenes and isoprene than Purser et al. (2023) and we therefore estimate that more substantial relative changes in emissions are possible. However, the scale of change also depends on the land cover, and therefore emissions, that have been replaced, contributing uncertainty to estimates of relative change.
Estimates of BVOC emissions used in this study are limited by assumptions regarding the age of trees and therefore the calculation of rate of emission in MEGAN (Guenther et al., 1993, 2012). The trees contributing to the achievement of 19 % woodland cover by 2050 would be planted gradually over decades rather than all being one age. MEGAN makes assumptions about the age of trees based on information regarding biomass, PFT distribution and leaf age activity factors which inform the values estimated here (Guenther et al., 1993, 2012). In addition, the specific location of new woodlands which is unknown is an additional source of uncertainty in BVOC emissions.
Further, estimates of BVOC emissions will be impacted by localised variations, such as tree health, leaf area index, exposure to stress such as drought, and infestation with tree pests or disease. These unknowns will further impact the overall change in emissions that are observed in the future from increased woodland cover. Comparing simulated concentrations from our emissions to observations would help to understand the ability of the model to capture these sensitivities.
Studies have demonstrated that models, including MEGAN, represent emissions of isoprene during episodes of drought poorly, both underestimating and over-estimating depending on the severity and longevity of drought episodes (Jiang et al., 2018; Otu-Larbi et al., 2020; Potosnak et al., 2014; Seco et al., 2015). For example, using the FORCAsT model Otu-Larbi et al. (2020) demonstrated isoprene emissions could be underestimated by as much as 40 % during a drought episode. Modifications to account for drought have been found to reduce residuals between simulated and observed emissions of BVOCs when estimated using MEGAN. Jiang et al. (2018) found isoprene emissions could be as much as 17 % lower when MEGAN was modified to better capture the physiological effects of drought on emissions and Wang et al. (2022) found that global total isoprene emissions simulated by the CLM reduced by 10 %–11 % with a representation of water stress based on wilting factors. We quantify the sensitivity of our Baseline and Afforested_Current_UK_mix experiments to the algorithm of Wang et al. (2022). In both cases, total annual emissions of isoprene are reduced, by 0.81 kt yr−1 (2 %; Afforested_Current_UK_mix) and 1.06 kt yr−1 (2.74 %; Baseline) compared to our original estimates. When we consider how the Wang et al. (2022) algorithm affects the change in emissions due to afforestation and an increase in atmospheric CO2 concentration (for this particular pair of experiments), we find that it increases in magnitude from 1.99 kt yr−1 (5.14 %) to 2.24 kt yr−1 (5.95 %; Table S2). This suggests that despite the overall impact of the algorithm being a lowering of isoprene emissions in individual scenarios, the emissions changes we present in Table 5 could all be slightly higher with the updated algorithm.
Two of our experiments (Afforested_NL_highMono_lowIso and Afforested_BL_highMono_lowIso) suggest that a reduction in isoprene emissions is possible with an increase in woodland cover of around 50 % (or 6 % absolute additional woodland cover), when the increase is achieved through planting of either broadleaf or needleleaf species. This is attributed to the lower isoprene emission factors applied to tree PFTs in these experiments than those of the land cover that was replaced.
This study presents, for the first-time, estimates of BVOC emissions that are consistent with net-zero aligned afforestation in the UK using tree species suitability information coupled with regionally appropriate emissions data. Using the CLMv4.5 and MEGANv2.1, we estimate present-day emissions of isoprene and total monoterpenes, and examine changes to emissions that may occur with around a 50 % increase in woodland cover, delivering absolute woodland cover of approximately 19 %. We present a new estimate for present-day emissions of isoprene at 39 kt yr−1, and 46 kt yr−1 for monoterpenes, which is within the range of previous estimates for this region.
Whilst recommendations for afforestation within pathways to net-zero GHG emissions vary between 30 000 and 50 000 ha yr−1, this study chooses to investigate the potential impact on BVOCs associated with the higher rate of planting, equivalent to delivering UK woodland cover of 19 % by the year 2050. This enables us to present an estimate of the potential greatest change in BVOCs relevant to the UK and representative of the greatest ambition for planting referenced in literature and policy published to date. The Royal Society report “Effects of Net-Zero Polices and Climate Change on Air Quality” noted planting high BVOC emitting tree species as part of net-zero policies as one of several areas of concern for trade-offs between climate change mitigation and air quality (The Royal Society, 2021). Our experiments illustrate the potential to minimise the increase of specific BVOC emissions whilst delivering net-zero aligned afforestation through species selection. Our results show that under elevated atmospheric CO2 concentration, and in a warmer and drier climate, afforestation leads to changes in UK emissions of isoprene between −3 % and 123 %, and between 5 % and 86 % for total monoterpene emissions, with the outcome depending on the species mixtures selected for planting. However, limiting the increase in one type of BVOC (e.g. isoprene) appears to correlate with greater increase in others (e.g. monoterpenes) as shown in Fig. 9. Afforestation in the UK should be informed by best-available knowledge on the resilience of different tree species to climate change and pests and diseases, as well as their potential to deliver co-benefits in the landscape. Our study demonstrates how emissions of BVOCs from the UK's future forests will vary with species selection, by examining variation within and between broadleaf and needleleaf tree species mixtures.
Our experiments assume large scale conversion of grasslands to woodlands to achieve afforestation targets. We apply this conversion as a simplified approach to sourcing sufficient land cover for delivering afforestation to estimate the impact on BVOC emissions, and this should not be used to infer the suitability of any specific location. We recognise that in reality, afforestation will occur following decisions around land use and the environmental, social and economic impact of the changes. The land cover that trees replace ultimately will determine the change in emissions that occurs; as demonstrated here, a decrease in emissions may be seen if woodland cover replaces a land cover type with greater potential to emit BVOCs. We show that incorporating regionally appropriate emissions factors, information about present day abundance of tree species, and the likely role of different species in the UK's future forests, can substantially alter estimates of emissions. Our study will support future work to estimate the complex interactions between afforestation and atmospheric composition, including changes in concentrations of atmospheric pollutants.
The CESM source code can be obtained from the National Center for Atmospheric Research (NCAR) at https://github.com/ESCOMP/CESM (last access: 5 August 2025), with documentation at https://escomp.github.io/CESM/versions/cesm2.2/html/introduction.html (last access: 5 August 2025) and https://www.cesm.ucar.edu/ (last access: 5 August 2025). Details of CESM compsets are provided at https://docs.cesm.ucar.edu/models/cesm2/config/compsets.html (last access: 5 August 2025), and information on the CLM component is available at https://www.cesm.ucar.edu/models/clm (last access: 5 August 2025).
For information specifically about the Model of Emissions of Gases and Aerosols from Nature (MEGAN) version 2.1, guidance and access to model code are available at https://sites.google.com/uci.edu/bai/megan/data-and-code (last access: 5 August 2025).
Currently available data used to generate figures in this study can be downloaded from Zenodo at version DOI: https://doi.org/10.5281/zenodo.16881746 (Mooney et al., 2025a). These include the emissions potential data underpinning all experiments presented, total annual emissions estimates, and percentage change data.
The concept DOI: https://doi.org/10.5281/zenodo.16881745 (Mooney et al., 2025b), provides access to the most recent versions of the dataset. The spatial emissions data generated from each experiment will be added to the same Zenodo record by 31 January 2026 at the latest. For early access or further information, please contact the corresponding author.
The UKCEH land cover maps are available at https://www.ceh.ac.uk/data/ukceh-land-cover-maps (last access: 5 August 2025).
The supplement related to this article is available online at https://doi.org/10.5194/bg-22-5309-2025-supplement.
Conceptualization of the study was led by HM, with supervision from CES, SA and PMF. HM developed the methodology, curated input data and model configurations and carried out all programming and formal data analysis. BS supported HM with elements of input data preparation. HM prepared the paper with editorial contributions from CES, SA, BS and PMF.
At the time of initial submission, Piers M. Forster was the interim Chair of the UK's Climate Change Committee. All other authors have no competing interests to declare.
Publisher's note: Copernicus Publications remains neutral with regard to jurisdictional claims made in the text, published maps, institutional affiliations, or any other geographical representation in this paper. While Copernicus Publications makes every effort to include appropriate place names, the final responsibility lies with the authors. Also, please note that this paper has not received English language copy-editing. Views expressed in the text are those of the authors and do not necessarily reflect the views of the publisher.
This study was supported by the United Bank of Carbon, who provide CASE award funding to Hazel Mooney. The authors also acknowledge the contributions of Peter Coleman of the Department for Energy Security and Net Zero to the design of this work, and Alicia Hoffman for editorial contributions.
This research has been supported by the Natural Environment Research Council (grant nos. NE/S007458/1 and NE/S015396/1).
This paper was edited by Ivonne Trebs and reviewed by Jing Tang and two anonymous referees.
Atkinson, R.: Gas-phase tropospheric chemistry of organic compounds: A review, Atmospheric Environ. Part Gen. Top., 24, 1–41, https://doi.org/10.1016/0960-1686(90)90438-S, 1990.
Bao, H., Kondo, A., Kaga, A., Tada, M., Sakaguti, K., Inoue, Y., Shimoda, Y., Narumi, D., and Machimura, T.: Biogenic volatile organic compound emission potential of forests and paddy fields in the Kinki region of Japan, Environ. Res., 106, 156–169, https://doi.org/10.1016/j.envres.2007.09.009, 2008.
Bolund, P. and Hunhammar, S.: Ecosystem services in urban areas, Ecol. Econ., 29, 293–301, https://doi.org/10.1016/S0921-8009(99)00013-0, 1999.
Byron, J., Kreuzwieser, J., Purser, G., van Haren, J., Ladd, S. N., Meredith, L. K., Werner, C., and Williams, J.: Chiral monoterpenes reveal forest emission mechanisms and drought responses, Nature, 609, 307–312, https://doi.org/10.1038/s41586-022-05020-5, 2022.
Chameides, W. L., Lindsay, R. W., Richardson, J., and Kiang, C. S.: The Role of Biogenic Hydrocarbons in Urban Photochemical Smog: Atlanta as a Case Study, Science, 241, 1473–1475, https://doi.org/10.1126/science.3420404, 1988.
Churkina, G., Kuik, F., Bonn, B., Lauer, A., Grote, R., Tomiak, K., and Butler, T. M.: Effect of VOC Emissions from Vegetation on Air Quality in Berlin during a Heatwave, Environ. Sci. Technol., 51, 6120–6130, https://doi.org/10.1021/acs.est.6b06514, 2017.
Climate Change Committee: Net-Zero: The UK's contribution to stopping global warming, Climate Change Committee, UK, https://www.theccc.org.uk/wp-content/uploads/2019/05/Net-Zero-The-UKs-contribution-to-stopping-global-warming.pdf (last access: 6 October 2025), 2019.
Committee on the Medical Effects of Air Pollutants: Quantification of Mortality and Hospital Admissions Associated with Ground-level Ozone, Public Health England, ISBN 978-0-85951-776-8, 2015.
Costanza, R., d'Arge, R., de Groot, R., Farber, S., Grasso, M., Hannon, B., Limburg, K., Naeem, S., O'Neill, R. V., Paruelo, J., Raskin, R. G., Sutton, P., and van den Belt, M.: The value of the world's ecosystem services and natural capital, Nature, 387, 253–260, https://doi.org/10.1038/387253a0, 1997.
D'Alessandro, D., Buffoli, M., Capasso, L., Fara, G. M., Rebecchi, A., Capolongo, S., and Hygiene on Built EnvironmentWorking Group on Healthy Buildings of the Italian Society of Hygiene, Preventive Medicine and Public Health (SItI): Green areas and public health: improving wellbeing and physical activity in the urban context, Epidemiol. Prev., 39, 8–13, 2015.
Danabasoglu, G., Lamarque, J.-F., Bacmeister, J., Bailey, D. A., DuVivier, A. K., Edwards, J., Emmons, L. K., Fasullo, J., Garcia, R., Gettelman, A., Hannay, C., Holland, M. M., Large, W. G., Lauritzen, P. H., Lawrence, D. M., Lenaerts, J. T. M., Lindsay, K., Lipscomb, W. H., Mills, M. J., Neale, R., Oleson, K. W., Otto-Bliesner, B., Phillips, A. S., Sacks, W., Tilmes, S., van Kampenhout, L., Vertenstein, M., Bertini, A., Dennis, J., Deser, C., Fischer, C., Fox-Kemper, B., Kay, J. E., Kinnison, D., Kushner, P. J., Larson, V. E., Long, M. C., Mickelson, S., Moore, J. K., Nienhouse, E., Polvani, L., Rasch, P. J., and Strand, W. G.: The Community Earth System Model Version 2 (CESM2), J. Adv. Model. Earth Sy., 12, e2019MS001916, https://doi.org/10.1029/2019MS001916, 2020.
Department for Agriculture, Environment and Rural Affairs: Northern Ireland planting pledge, Department of Agriculture, Environment and Rural Affairs, https://www.daera-ni.gov.uk/news/poots-planting-pledge (last access: 6 October 2025), 2020.
Department for Business, Energy and Industrial Strategy: Net Zero Strategy: Build Back Greener, Department for Business, Energy and Industrial Strategy, ISBN 978-1-5286-2938-6, 2021.
Department for Environment, Food and Rural Affairs: Air Quality Expert Group: Impacts of Vegetation on Urban Air Pollution, Department for Environment, Food and Rural Affairs, https://uk-air.defra.gov.uk/library/reports.php?report_id=966 (last access: 6 October 2025), 2018.
Department for Environment, Food and Rural Affairs: England Trees Action plan, Department for Environment, Food and Rural Affairs, https://assets.publishing.service.gov.uk/media/60a3ddd1d3bf7f2886e2a05d/england-trees-action-plan.pdf (last access: 6 October 2025), 2021.
Dicke, M.: Behavioural and community ecology of plants that cry for help, Plant Cell Environ., 32, 654–665, https://doi.org/10.1111/j.1365-3040.2008.01913.x, 2009.
Dirmeyer, P. A., Gao, X., Zhao, M., Guo, Z., Oki, T., and Hanasaki, N.: GSWP-2: Multimodel Analysis and Implications for Our Perception of the Land Surface, B. Am. Meteorol. Soc, 87, 1381–1398, https://doi.org/10.1175/BAMS-87-10-1381, 2006.
Dudareva, N., Negre, F., Nagegowda, D. A., and Orlova, I.: Plant Volatiles: Recent Advances and Future Perspectives, Crit. Rev. Plant Sci., 25, 417–440, https://doi.org/10.1080/07352680600899973, 2006.
Feng, Z., Yuan, X., Fares, S., Loreto, F., Li, P., Hoshika, Y., and Paoletti, E.: Isoprene is more affected by climate drivers than monoterpenes: A meta-analytic review on plant isoprenoid emissions, Plant Cell Environ., 42, 1939–1949, https://doi.org/10.1111/pce.13535, 2019.
Fitzky, A. C., Sandén, H., Karl, T., Fares, S., Calfapietra, C., Grote, R., Saunier, A., and Rewald, B.: The Interplay Between Ozone and Urban Vegetation – BVOC Emissions, Ozone Deposition, and Tree Ecophysiology, Front. For. Glob. Change, 2, https://doi.org/10.3389/ffgc.2019.00050, 2019.
Forest Research: Forestry Statistics 2023, Forest Research, Roslin Scotland, https://cdn.forestresearch.gov.uk/2023/09/Ch1_Woodland.pdf (last access: 6 October 2025), 2023.
Forest Research: Tree Species Database, https://www.forestresearch.gov.uk/tools-and-resources/tree-species-database/, last access: 24 October 2024a.
Forest Research: Woodland Statistics, https://cdn.forestresearch.gov.uk/2024/06/PWS-statsnotice-20jun24-FINAL.pdf (last access: 6 October 2025), 2024b.
Fortunati, A., Barta, C., Brilli, F., Centritto, M., Zimmer, I., Schnitzler, J.-P., and Loreto, F.: Isoprene emission is not temperature-dependent during and after severe drought-stress: a physiological and biochemical analysis, Plant J., 55, 687–697, https://doi.org/10.1111/j.1365-313X.2008.03538.x, 2008.
Gai, Y., Sun, L., Fu, S., Zhu, C., Zhu, C., Li, R., Liu, Z., Wang, B., Wang, C., Yang, N., Li, J., Xu, C., and Yan, G.: Impact of greening trends on biogenic volatile organic compound emissions in China from 1985 to 2022: Contributions of afforestation projects, Sci. Total Environ., 929, 172551, https://doi.org/10.1016/j.scitotenv.2024.172551, 2024.
Ghimire, R. P., Silfver, T., Myller, K., Oksanen, E., Holopainen, J. K., and Mikola, J.: BVOC Emissions From a Subarctic Ecosystem, as Controlled by Insect Herbivore Pressure and Temperature, Ecosystems, 25, 872–891, https://doi.org/10.1007/s10021-021-00690-0, 2022.
Ghirardo, A., Koch, K., Taipale, R., Zimmer, I., Schnitzler, J.-P., and Rinne, J.: Determination of de novo and pool emissions of terpenes from four common boreal/alpine trees by 13CO2 labelling and PTR-MS analysis, Plant Cell Environ., 33, 781–792, https://doi.org/10.1111/j.1365-3040.2009.02104.x, 2010.
Gougherty, A. V.: Emerging tree diseases are accumulating rapidly in the native and non-native ranges of Holarctic trees, NeoBiota, 87, 143–160, https://doi.org/10.3897/neobiota.87.103525, 2023.
Gu, S., Guenther, A., and Faiola, C.: Effects of Anthropogenic and Biogenic Volatile Organic Compounds on Los Angeles Air Quality, Environ. Sci. Technol., 55, 12191–12201, https://doi.org/10.1021/acs.est.1c01481, 2021.
Guenther, A. B., Zimmerman, P. R., Harley, P. C., Monson, R. K., and Fall, R.: Isoprene and monoterpene emission rate variability: Model evaluations and sensitivity analyses, J. Geophys. Res.-Atmos., 98, 12609–12617, https://doi.org/10.1029/93JD00527, 1993.
Guenther, A., Hewitt, C. N., Erickson, D., Fall, R., Geron, C., Graedel, T., Harley, P., Klinger, L., Lerdau, M., Mckay, W. A., Pierce, T., Scholes, B., Steinbrecher, R., Tallamraju, R., Taylor, J., and Zimmerman, P.: A global model of natural volatile organic compound emissions, J. Geophys. Res.-Atmos., 100, 8873–8892, https://doi.org/10.1029/94JD02950, 1995.
Guenther, A. B., Jiang, X., Heald, C. L., Sakulyanontvittaya, T., Duhl, T., Emmons, L. K., and Wang, X.: The Model of Emissions of Gases and Aerosols from Nature version 2.1 (MEGAN2.1): an extended and updated framework for modeling biogenic emissions, Geosci. Model Dev., 5, 1471–1492, https://doi.org/10.5194/gmd-5-1471-2012, 2012.
Hayman, G., Comyn-Platt, E., Langford, B., and Vieno, M.: Performance of the JULES land surface model for UK Biogenic VOC emissions, In Proceedings from the 19th EGU General Assembly, Vienna, Austria, April 2017, p13911, 2017.
Heald, C. L., Wilkinson, M. J., Monson, R. K., Alo, C. A., Wang, G., and Guenther, A.: Response of isoprene emission to ambient CO2 changes and implications for global budgets, Glob. Change Biol., 15, 1127–1140, https://doi.org/10.1111/j.1365-2486.2008.01802.x, 2009.
Hewitt, C. N.: BVOC emissions potential inventory, Lancaster University [data set], http://www.es.lancs.ac.uk/cnhgroup/iso-emissions.pdf (last access: 6 October 2025), 2003.
Intergovernmental Panel on Climate Change (IPCC) (Ed.): Technical Summary, in: Climate Change 2021 – The Physical Science Basis: Working Group I Contribution to the Sixth Assessment Report of the Intergovernmental Panel on Climate Change, Cambridge University Press, Cambridge, 35–144, https://doi.org/10.1017/9781009157896.002, 2023.
Irmisch, S., Jiang, Y., Chen, F., Gershenzon, J., and Köllner, T. G.: Terpene synthases and their contribution to herbivore-induced volatile emission in western balsam poplar (Populus trichocarpa), BMC Plant Biol., 14, 270, https://doi.org/10.1186/s12870-014-0270-y, 2014.
Jaakkola, E., Gärtner, A., Jönsson, A. M., Ljung, K., Olsson, P.-O., and Holst, T.: Spruce bark beetles (Ips typographus) cause up to 700 times higher bark BVOC emission rates compared to healthy Norway spruce (Picea abies), Biogeosciences, 20, 803–826, https://doi.org/10.5194/bg-20-803-2023, 2023.
Jardine, A. B., Jardine, K. J., Fuentes, J. D., Martin, S. T., Martins, G., Durgante, F., Carneiro, V., Higuchi, N., Manzi, A. O., and Chambers, J. Q.: Highly reactive light-dependent monoterpenes in the Amazon, Geophys. Res. Lett., 42, 1576–1583, https://doi.org/10.1002/2014GL062573, 2015.
Jiang, X., Guenther, A., Potosnak, M., Geron, C., Seco, R., Karl, T., Kim, S., Gu, L., and Pallardy, S.: Isoprene emission response to drought and the impact on global atmospheric chemistry, Atmos. Environ., 183, 69–83, https://doi.org/10.1016/j.atmosenv.2018.01.026, 2018.
Karl, M., Guenther, A., Köble, R., Leip, A., and Seufert, G.: A new European plant-specific emission inventory of biogenic volatile organic compounds for use in atmospheric transport models, Biogeosciences, 6, 1059–1087, https://doi.org/10.5194/bg-6-1059-2009, 2009.
Lawrence, P. J. and Chase, T. N.: Representing a new MODIS consistent land surface in the Community Land Model (CLM 3.0), J. Geophys. Res.-Biogeo., 112, https://doi.org/10.1029/2006JG000168, 2007.
Lee, J. D., Lewis, A. C., Monks, P. S., Jacob, M., Hamilton, J. F., Hopkins, J. R., Watson, N. M., Saxton, J. E., Ennis, C., Carpenter, L. J., Carslaw, N., Fleming, Z., Bandy, B. J., Oram, D. E., Penkett, S. A., Slemr, J., Norton, E., Rickard, A. R., K Whalley, L., Heard, D. E., Bloss, W. J., Gravestock, T., Smith, S. C., Stanton, J., Pilling, M. J., and Jenkin, M. E.: Ozone photochemistry and elevated isoprene during the UK heatwave of august 2003, Atmos. Environ., 40, 7598–7613, https://doi.org/10.1016/j.atmosenv.2006.06.057, 2006.
Luttkus, M. L., Hoffmann, E. H., Poulain, L., Tilgner, A., and Wolke, R.: The Effect of Land Use Classification on the Gas-Phase and Particle Composition of the Troposphere: Tree Species Versus Forest Type Information, J. Geophys. Res.-Atmos., 127, e2021JD035305, https://doi.org/10.1029/2021JD035305, 2022.
Marston, C., Rowland, C. S., O'Neil, A. W., and Morton, R. D.: Land Cover Map 2021 (1 km summary rasters, GB and N. Ireland), NERC EDS Environmental Information Data Centre, https://doi.org/10.5285/A3FF9411-3A7A-47E1-9B3E-79F21648237D, 2022.
Martin, M. J., Stirling, C. M., Humphries, S. W., and Long, S. P.: A process-based model to predict the effects of climatic change on leaf isoprene emission rates, Ecol. Model., 131, 161–174, https://doi.org/10.1016/S0304-3800(00)00258-1, 2000.
Mauri, A., Girardello, M., Strona, G., Beck, P. S. A., Forzieri, G., Caudullo, G., Manca, F., and Cescatti, A.: EU-Trees4F, a dataset on the future distribution of European tree species, Sci. Data, 9, 37, https://doi.org/10.1038/s41597-022-01128-5, 2022.
Monger, F., V Spracklen, D., J Kirkby, M., and Schofield, L.: The impact of semi-natural broadleaf woodland and pasture on soil properties and flood discharge, Hydrol. Process., 36, e14453, https://doi.org/10.1002/hyp.14453, 2022.
Monson, R. K., Jaeger, C. H., Adams, W. W., Driggers, E. M., Silver, G. M., and Fall, R.: Relationships among Isoprene Emission Rate, Photosynthesis, and Isoprene Synthase Activity as Influenced by Temperature, Plant Physiol., 98, 1175–1180, https://doi.org/10.1104/pp.98.3.1175, 1992.
Mooney, H., Arnold, S., Silver, B., Forster, P., and Scott, C.: Future Forests: estimating biogenic emissions from net-zero aligned afforestation pathways in the UK, Zenodo [data set], https://doi.org/10.5281/zenodo.16881746, 2025a.
Mooney, H., Arnold, S., Silver, B., Forster, P., and Scott, C.: Future Forests: estimating biogenic emissions from net-zero aligned afforestation pathways in the UK, Zenodo [data set], https://doi.org/10.5281/zenodo.16881745, 2025b.
Niinemets, Ü., Tenhunen, J. D., Harley, P. C., and Steinbrecher, R.: A model of isoprene emission based on energetic requirements for isoprene synthesis and leaf photosynthetic properties for Liquidambar and Quercus, Plant Cell Environ., 22, 1319–1335, https://doi.org/10.1046/j.1365-3040.1999.00505.x, 1999.
Nowak, D. J.: Quantifying and valuing the role of trees and forests on environmental quality and human health, in: Nature and Public Health, edited by: van den Bosch, M. and Bird, W., Oxford textbook of nature and public health, Oxford University Press, Oxford, UK, 312–316, Chap. 10.4, 2022.
Oleson, K., Lawrence, D., Bonan, G., Drewniak, B., Huang, M., Koven, C., Levis, S., Li, F., Riley, W., Subin, Z., Swenson, S., Thornton, P., Bozbiyik, A., Fisher, R., Heald, C., Kluzek, E., Lamarque, J.-F., Lawrence, P., Leung, L., Lipscomb, W., Muszala, S., Ricciuto, D., Sacks, W., Sun, Y., Tang, J., and Yang, Z.-L.: Technical description of version 4.5 of the Community Land Model (CLM), UCAR/NCAR, https://doi.org/10.5065/D6RR1W7M, 2013.
Otu-Larbi, F., Bolas, C. G., Ferracci, V., Staniaszek, Z., Jones, R. L., Malhi, Y., Harris, N. R. P., Wild, O., and Ashworth, K.: Modelling the effect of the 2018 summer heatwave and drought on isoprene emissions in a UK woodland, Glob. Change Biol., 26, 2320–2335, https://doi.org/10.1111/gcb.14963, 2020.
Pegoraro, E., Rey, A., Bobich, E. G., Barron-Gafford, G., Grieve, K. A., Malhi, Y., and Murthy, R.: Effect of elevated CO2 concentration and vapour pressure deficit on isoprene emission from leaves of Populus deltoides during drought, Funct. Plant Biol. FPB, 31, 1137–1147, https://doi.org/10.1071/FP04142, 2004.
Potosnak, M. J., LeStourgeon, L., Pallardy, S. G., Hosman, K. P., Gu, L., Karl, T., Geron, C., and Guenther, A. B.: Observed and modeled ecosystem isoprene fluxes from an oak-dominated temperate forest and the influence of drought stress, Atmos. Environ., 84, 314–322, https://doi.org/10.1016/j.atmosenv.2013.11.055, 2014.
Purser, G., Drewer, J., Heal, M. R., Sircus, R. A. S., Dunn, L. K., and Morison, J. I. L.: Isoprene and monoterpene emissions from alder, aspen and spruce short-rotation forest plantations in the United Kingdom, Biogeosciences, 18, 2487–2510, https://doi.org/10.5194/bg-18-2487-2021, 2021.
Purser, G., Heal, M. R., Carnell, E. J., Bathgate, S., Drewer, J., Morison, J. I. L., and Vieno, M.: Simulating impacts on UK air quality from net-zero forest planting scenarios, Atmos. Chem. Phys., 23, 13713–13733, https://doi.org/10.5194/acp-23-13713-2023, 2023.
Pyatt, D. G., Ray, D., and Fletcher, J.: An ecological site classification for forestry in Great Britain, Forestry Commission, Edinburgh, 74 pp., ISBN 0-85538-418-2, 2001.
Rasmussen, R. A.: What do the hydrocarbons from trees contribute to air pollution, J. Air Pollut. Control Assoc., 22, 537–543, https://doi.org/10.1080/00022470.1972.10469676, 1972.
Sahu, A., Mostofa, M. G., Weraduwage, S. M., and Sharkey, T. D.: Hydroxymethylbutenyl diphosphate accumulation reveals MEP pathway regulation for high CO2-induced suppression of isoprene emission, P. Natl. Acad. Sci. USA, 120, e2309536120, https://doi.org/10.1073/pnas.2309536120, 2023.
Scott, C. E., Monks, S. A., Spracklen, D. V., Arnold, S. R., Forster, P. M., Rap, A., Äijälä, M., Artaxo, P., Carslaw, K. S., Chipperfield, M. P., Ehn, M., Gilardoni, S., Heikkinen, L., Kulmala, M., Petäjä, T., Reddington, C. L. S., Rizzo, L. V., Swietlicki, E., Vignati, E., and Wilson, C.: Impact on short-lived climate forcers increases projected warming due to deforestation, Nat. Commun., 9, 157, https://doi.org/10.1038/s41467-017-02412-4, 2018.
Scottish Government: Draft climate change plan: draft third report on policies and proposals 2017–2032, ISBN 9781786527431, 2017.
Seco, R., Karl, T., Guenther, A., Hosman, K. P., Pallardy, S. G., Gu, L., Geron, C., Harley, P., and Kim, S.: Ecosystem-scale volatile organic compound fluxes during an extreme drought in a broadleaf temperate forest of the Missouri Ozarks (central USA), Glob. Change Biol., 21, 3657–3674, https://doi.org/10.1111/gcb.12980, 2015.
Sharkey, T. D.: Isoprene synthesis by plants and animals, Endeavour, 20, 74–78, https://doi.org/10.1016/0160-9327(96)10014-4, 1996.
Shukla, P. R., Skea, J., Reisinger, A., and IPCC (Eds.): Climate change 2022: mitigation of climate change, IPCC, Geneva, 1 pp., https://doi.org/10.1017/9781009157926.001, 2022.
Sillman, S., Logan, J. A., and Wofsy, S. C.: The sensitivity of ozone to nitrogen oxides and hydrocarbons in regional ozone episodes, J. Geophys. Res.-Atmos., 95, 1837–1851, https://doi.org/10.1029/JD095iD02p01837, 1990.
Simpson, D., Winiwarter, W., Börjesson, G., Cinderby, S., Ferreiro, A., Guenther, A., Hewitt, C. N., Janson, R., Khalil, M. A. K., Owen, S., Pierce, T. E., Puxbaum, H., Shearer, M., Skiba, U., Steinbrecher, R., Tarrasón, L., and Öquist, M. G.: Inventorying emissions from nature in Europe, J. Geophys. Res.-Atmos., 104, 8113–8152, https://doi.org/10.1029/98JD02747, 1999.
Stedman, J. R.: The predicted number of air pollution related deaths in the UK during the August 2003 heatwave, Atmos. Environ., 38, 1087–1090, https://doi.org/10.1016/j.atmosenv.2003.11.011, 2004.
Stewart, H. E., Hewitt, C. N., Bunce, R. G. H., Steinbrecher, R., Smiatek, G., and Schoenemeyer, T.: A highly spatially and temporally resolved inventory for biogenic isoprene and monoterpene emissions: Model description and application to Great Britain, J. Geophys. Res.-Atmos., 108, https://doi.org/10.1029/2002JD002694, 2003.
The Royal Society: The Effects of Net-Zero Policies and Climate Change on Air Quality, The Royal Society, ISBN 978-1-78252-558-5, 2021.
Tingey, D. T., Manning, M., Grothaus, L. C., and Burns, W. F.: Influence of Light and Temperature on Monoterpene Emission Rates from Slash Pine, Plant Physiol., 65, 797–801, https://doi.org/10.1104/pp.65.5.797, 1980.
Trowbridge, A. M. and Stoy, P. C.: BVOC-Mediated Plant-Herbivore Interactions, in: Biology, Controls and Models of Tree Volatile Organic Compound Emissions, edited by: Niinemets, Ü. and Monson, R. K., Springer Netherlands, Dordrecht, 21–46, https://doi.org/10.1007/978-94-007-6606-8_2, 2013.
UKCP: Variables for global projections over UK daily data: maximum air temperature at 1.5 m, Met Office [data set], https://catalogue.ceda.ac.uk/uuid/854bb0de8a5e4bfaafe322bbfc57ea57/ (last access: 5 August 2025), 2018.
UKCP: Variables from HadUK-Grid over UK for daily data: maximum air temperature at 1.5 m, Met Office [data set], https://doi.org/10.5285/6f4ac352b19341eb8c5b26644845ac35, 2021.
Vautard, R., Honoré, C., Beekmann, M., and Rouil, L.: Simulation of ozone during the August 2003 heat wave and emission control scenarios, Atmos. Environ., 39, 2957–2967, https://doi.org/10.1016/j.atmosenv.2005.01.039, 2005.
Wang, H., Lu, X., Seco, R., Stavrakou, T., Karl, T., Jiang, X., Gu, L., and Guenther, A. B.: Modeling Isoprene Emission Response to Drought and Heatwaves Within MEGAN Using Evapotranspiration Data and by Coupling With the Community Land Model, J. Adv. Model. Earth Sy., 14, e2022MS003174, https://doi.org/10.1029/2022MS003174, 2022.
Wang, X., Scott, C. E., and Dallimer, M.: High summer land surface temperatures in a temperate city are mitigated by tree canopy cover, Urban Clim., 51, 101606, https://doi.org/10.1016/j.uclim.2023.101606, 2023.
Weber, J., King, J. A., Abraham, N. L., Grosvenor, D. P., Smith, C. J., Shin, Y. M., Lawrence, P., Roe, S., Beerling, D. J., and Martin, M. V.: Chemistry-albedo feedbacks offset up to a third of forestation's CO2 removal benefits, Science, 383, 860–864, https://doi.org/10.1126/science.adg6196, 2024.
Welsh Government: Woodlands for Wales, Welsh Government, ISBN 978-1-78937-032-4, 2018.
Wennberg, P. O., Bates, K. H., Crounse, J. D., Dodson, L. G., McVay, R. C., Mertens, L. A., Nguyen, T. B., Praske, E., Schwantes, R. H., Smarte, M. D., St Clair, J. M., Teng, A. P., Zhang, X., and Seinfeld, J. H.: Gas-Phase Reactions of Isoprene and Its Major Oxidation Products, Chem. Rev., 118, 3337–3390, https://doi.org/10.1021/acs.chemrev.7b00439, 2018.
Zeng, J., Zhang, Y., Mu, Z., Pang, W., Zhang, H., Wu, Z., Song, W., and Wang, X.: Temperature and light dependency of isoprene and monoterpene emissions from tropical and subtropical trees: Field observations in south China, Appl. Geochem., 155, 105727, https://doi.org/10.1016/j.apgeochem.2023.105727, 2023.