the Creative Commons Attribution 4.0 License.
the Creative Commons Attribution 4.0 License.
 | 15 Oct 2025
Human activities caused hypoxia expansion in a large eutrophic estuary: non-negligible role of riverine suspended sediments
Yue Nan
Zheng Chen
Bo Liang
Jiatang Hu
An increase in riverine nutrient loads has generally been recognized as the primary cause of coastal deoxygenation, whereas the role of other riverine factors, especially suspended sediments, has received less attention. This study aims to discern the impacts of anthropogenic alterations in various riverine inputs on the subsurface deoxygenation over the past three decades in a large river-dominated estuary, the Pearl River estuary (PRE). Using a physical–biogeochemical model, we reproduced the observed dissolved oxygen (DO) conditions off the PRE in the historical period (the 1990s, with a high suspended sediment concentration (SSC), high DO, and low nutrients) and the present period (the 2010s, with low SSC, low DO, and high nutrients). In the 2010s, the PRE exhibited more extensive and persistent summer hypoxia, with the low-oxygen area () expanding by ∼148 % (to ∼2926 km2) and the hypoxia area () increasing by 192 % (to ∼617 km2). Low-oxygen durations extended to 15–35 d, and three distinct hypoxic centers formed under different controlling factors. Single-factor experiments suggested that the decreased riverine DO content (46 %) alone expanded low-oxygen areas in the upper estuarine regions by 44 %, the decreased SSC (by 60 %) alone caused a 47 % expansion in the lower reaches of the PRE, and the increased nutrients alone (100 % in dissolved inorganic nitrogen and 225 % in phosphate) drove a 31 % expansion. In comparison, the combined nutrient increases and the SSC declines synergistically enhanced primary production and bottom oxygen consumptions (dominated by sediment oxygen uptake), amplifying low-oxygen (104 %) and hypoxic (192 %) area growth in lower estuaries. Our results revealed that, by improving light availability for productivity, SSC declines play a larger role than nutrient increases in exacerbating deoxygenation off the PRE. This synergy complicates hypoxia mitigation efforts focused solely on nutrient controls. Given the widespread global declines in riverine suspended sediments, our findings underscore the importance of incorporating sediment-mediated processes, a relatively overlooked factor, in coastal deoxygenation studies.
- Article
(8327 KB) - Full-text XML
-
Supplement
(470 KB) - BibTeX
- EndNote


Hypoxia emerges when the dissolved oxygen (DO) concentration drops below 3 mg L−1 in aquatic systems. It is an undesirable phenomenon that can lead to a series of biological and ecological consequences, such as damaging the habitat for aquatic organisms and imposing detrimental effects on the ecosystem community structure (Diaz and Rosenberg, 2008; Roman et al., 2019). Due to the substantial impacts from human socioeconomic activities, coastal regions have become a hotspot for hypoxia (Breitburg et al., 2018; Pitcher et al., 2021). Moreover, long-term exacerbation of hypoxia with spatial expansion and increased frequency has been frequently reported in estuarine and coastal regions worldwide during the past decades, including the Baltic Sea (Carstensen et al., 2014), the northern Gulf of Mexico (Bianchi et al., 2010), Chesapeake Bay (Murphy et al., 2011), the Yangtze River estuary (Chen et al., 2017), and the Pearl River estuary (Hu et al., 2021).
Many studies have been conducted that reveal the mechanism of hypoxia formation and evolution in coastal regions. It has been widely recognized that coastal deoxygenation is largely attributed to the eutrophication-driven production of organic matter (Su et al., 2017; Wang et al., 2016; Howarth et al., 2011), which sinks to the subsurface waters and bottom sediments, leading to intense oxygen depletion (Wang et al., 2014; Hagy et al., 2005). This would induce hypoxia when the density stratification restricts DO replenishment from the surface waters (Wang et al., 2018; Murphy et al., 2011). One important reason underlying eutrophication and hypoxia is the excessive nutrients that are discharged into the water column, stimulating phytoplankton blooms (Cullen, 2015; Wang et al., 2021; Cormier et al., 2023). In addition, human activities, such as dam construction (Bussi et al., 2021) and soil-water conservation measures (Yang et al., 2024), can significantly reduce suspended sediments in estuaries. Hence, an improved light condition, e.g., due to the decreased suspended sediment loads, could also favor the enhancement of local production and hence hypoxia (Ge et al., 2020; Huang et al., 2022). The effects of nutrient and light conditions vary in coastal systems due to different hydrodynamic and topographic features, which makes the formulation of hypoxia mitigation strategies more challenging. Therefore, a quantitative assessment of the importance of these factors in generating hypoxia is crucial for understanding the primary drivers of hypoxia evolution and for proposing effective countermeasures.
A case in point is the Pearl River estuary (PRE), which is situated in the northern South China Sea, close to the Guangdong–Hong Kong–Macao Great Bay Area (Fig. 1a). Owing to the relatively large nutrient inputs and vertical stratification formed by freshwater plumes, hypoxia typically occurs during summer in the bottom waters of the PRE. Before the 2000s, it was an episodic and small-scale issue because of the synergetic effect of shallow topography, high turbidity (Ma et al., 2022), and the intermittent stratification due to periodic disturbance by the tides. However, large-scale occurrences of low oxygen (when ) and hypoxia have been frequently reported in recent years. For example, it was estimated that the low-oxygen area in the PRE reached 1000 and 1500 km2 during summer in 2010 (Wen et al., 2020) and 2015 (Li et al., 2018), respectively – nearly double that recorded before the 2000s (Li et al., 2020). Hu et al. (2021) compiled historical observations over four decades to investigate the long-term deoxygenation trend and its spatial expansion in the PRE. They highlighted the significant contributions of increased nutrient and decreased sediment fluxes from the Pearl River to the exacerbation of low-oxygen conditions in the region. Besides, the low-oxygen inflows from the Pearl River could also contribute to the low-oxygen area in the upper estuary (Hu et al., 2021). Nevertheless, a quantitative understanding of their relative contributions to the low-oxygen expansion in the PRE is lacking, particularly in different subregions (Fig. 1b) where the mechanisms controlling the low-oxygen conditions are different. In the upper part of the PRE (Lingdingyang waters), the aerobic respiration of terrestrial organic matter plays a greater role (Su et al., 2017; Yu et al., 2020); in the downstream regions of the PRE, deoxygenation is primarily controlled by eutrophication (Yu and Gan, 2022; Chen et al., 2024).
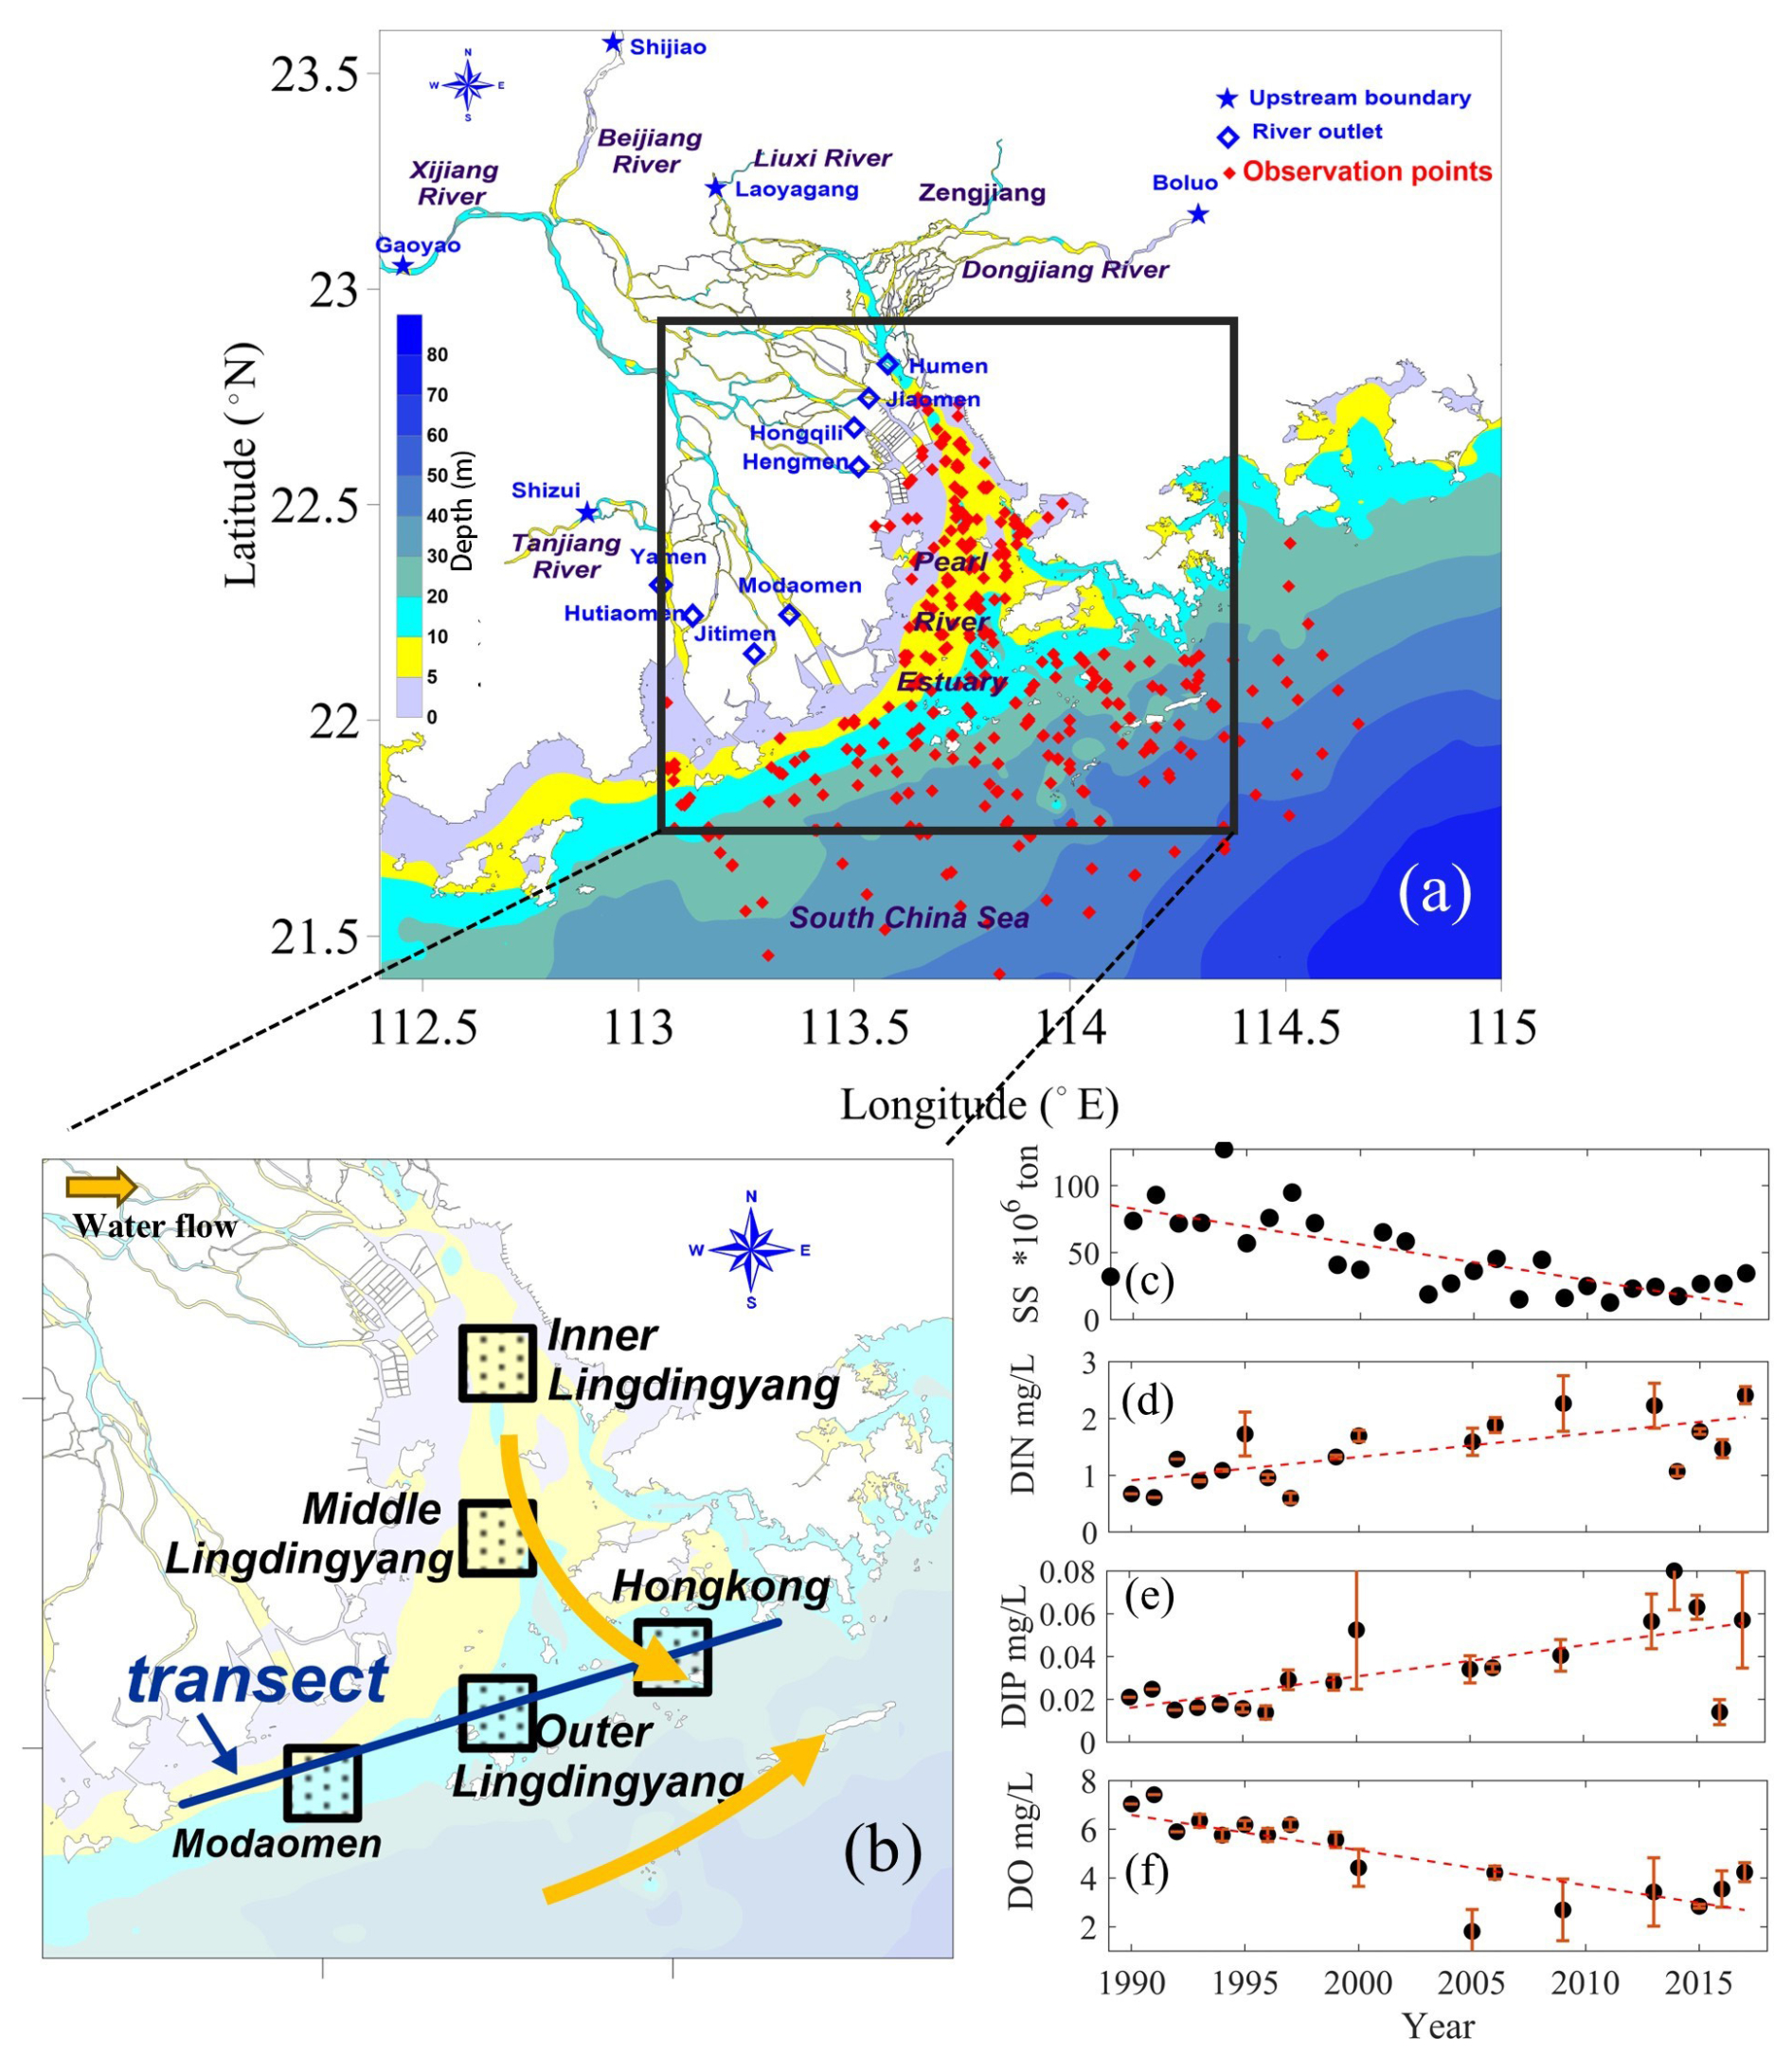
Figure 1(a) Study area of the PRE and sampling sites during 1985–2017. (b) The five subregions and a transect along the coastal transition zone used for analysis and the surface water flow direction. (c) Annual loads of suspended sediments from the Pearl River. (d–f) Summer-averaged (June to August) surface-layer (within the upper 2 m of water column) concentrations of nutrients (DIN, DIP) and dissolved oxygen (DO) at the Humen outlet (the primary monitoring site). Error bars indicate intra-summer variability across sampling dates.
In this study, we used a coupled physical–biogeochemical model to investigate the decadal changes (the 1990s versus the 2010s) in summertime DO contents and related biogeochemical processes in the PRE and to quantify the relative contributions of the changing riverine inputs (including nutrients, suspended sediments, and oxygen content; Fig. 1c–f) to the long-term expansion of low oxygen () and hypoxia () in the region.
2.1 Study area
The PRE and its adjacent shelf waters (Fig. 1a) represent an estuarine system under intensive human activity. One major anthropogenic impact in the PRE is the terrestrial substances fed by the Pearl River, which is the third-largest river in China with an average annual runoff of (Wei et al., 2020), through eight river outlets: the Humen, Jiaomen, Hongqili, Hengmen, Modaomen, Jitimen, Hutiaomen, and Yamen (Fig. 1a). The long-term DO and water quality data used here were collected from open sources (e.g., government websites) and published studies (detailed in the “Data availability” section and Table S1 in the Supplement). Over the past few decades, the terrestrial inputs from the Pearl River have experienced remarkable changes in oxygen content, sediment loads, and nutrients, including dissolved inorganic nitrogen (DIN) and dissolved inorganic phosphorus (DIP) (Fig. 1c–f). Consequently, the ecological environments of the PRE have changed significantly.
During the 1990s, the Pearl River estuary (PRE) experienced low eutrophication levels, consistent with limited upstream urbanization and relatively high sediment loads. This period saw the extensive construction of water infrastructure, mostly completed by 2000, including over 8636 reservoirs in the Pearl River basin (Wu et al., 2016), which drove a significant decline in riverine suspended sediment concentration (SSC) (Zhang et al., 2008). After 2000, accelerated urbanization and continued hydraulic development further altered river inputs, with monitoring data showing decreased sediment loads (Fig. 1c) and increased nutrient concentrations (Fig. 1d–e). These changes collectively enhanced the potential for phytoplankton blooms, exacerbating eutrophication and hypoxia. These long-term variations of riverine substances have also been reported by Lai et al. (2022) and Hu et al. (2021). In the meantime, the oxygen content in the PRE has exhibited a notable drawdown with significant expansions in low-oxygen extents in recent summers (Fig. 2), which has been revealed by cruise observations in the PRE (Li et al., 2021; Su et al., 2017; Hu et al., 2021; Lu et al., 2018).
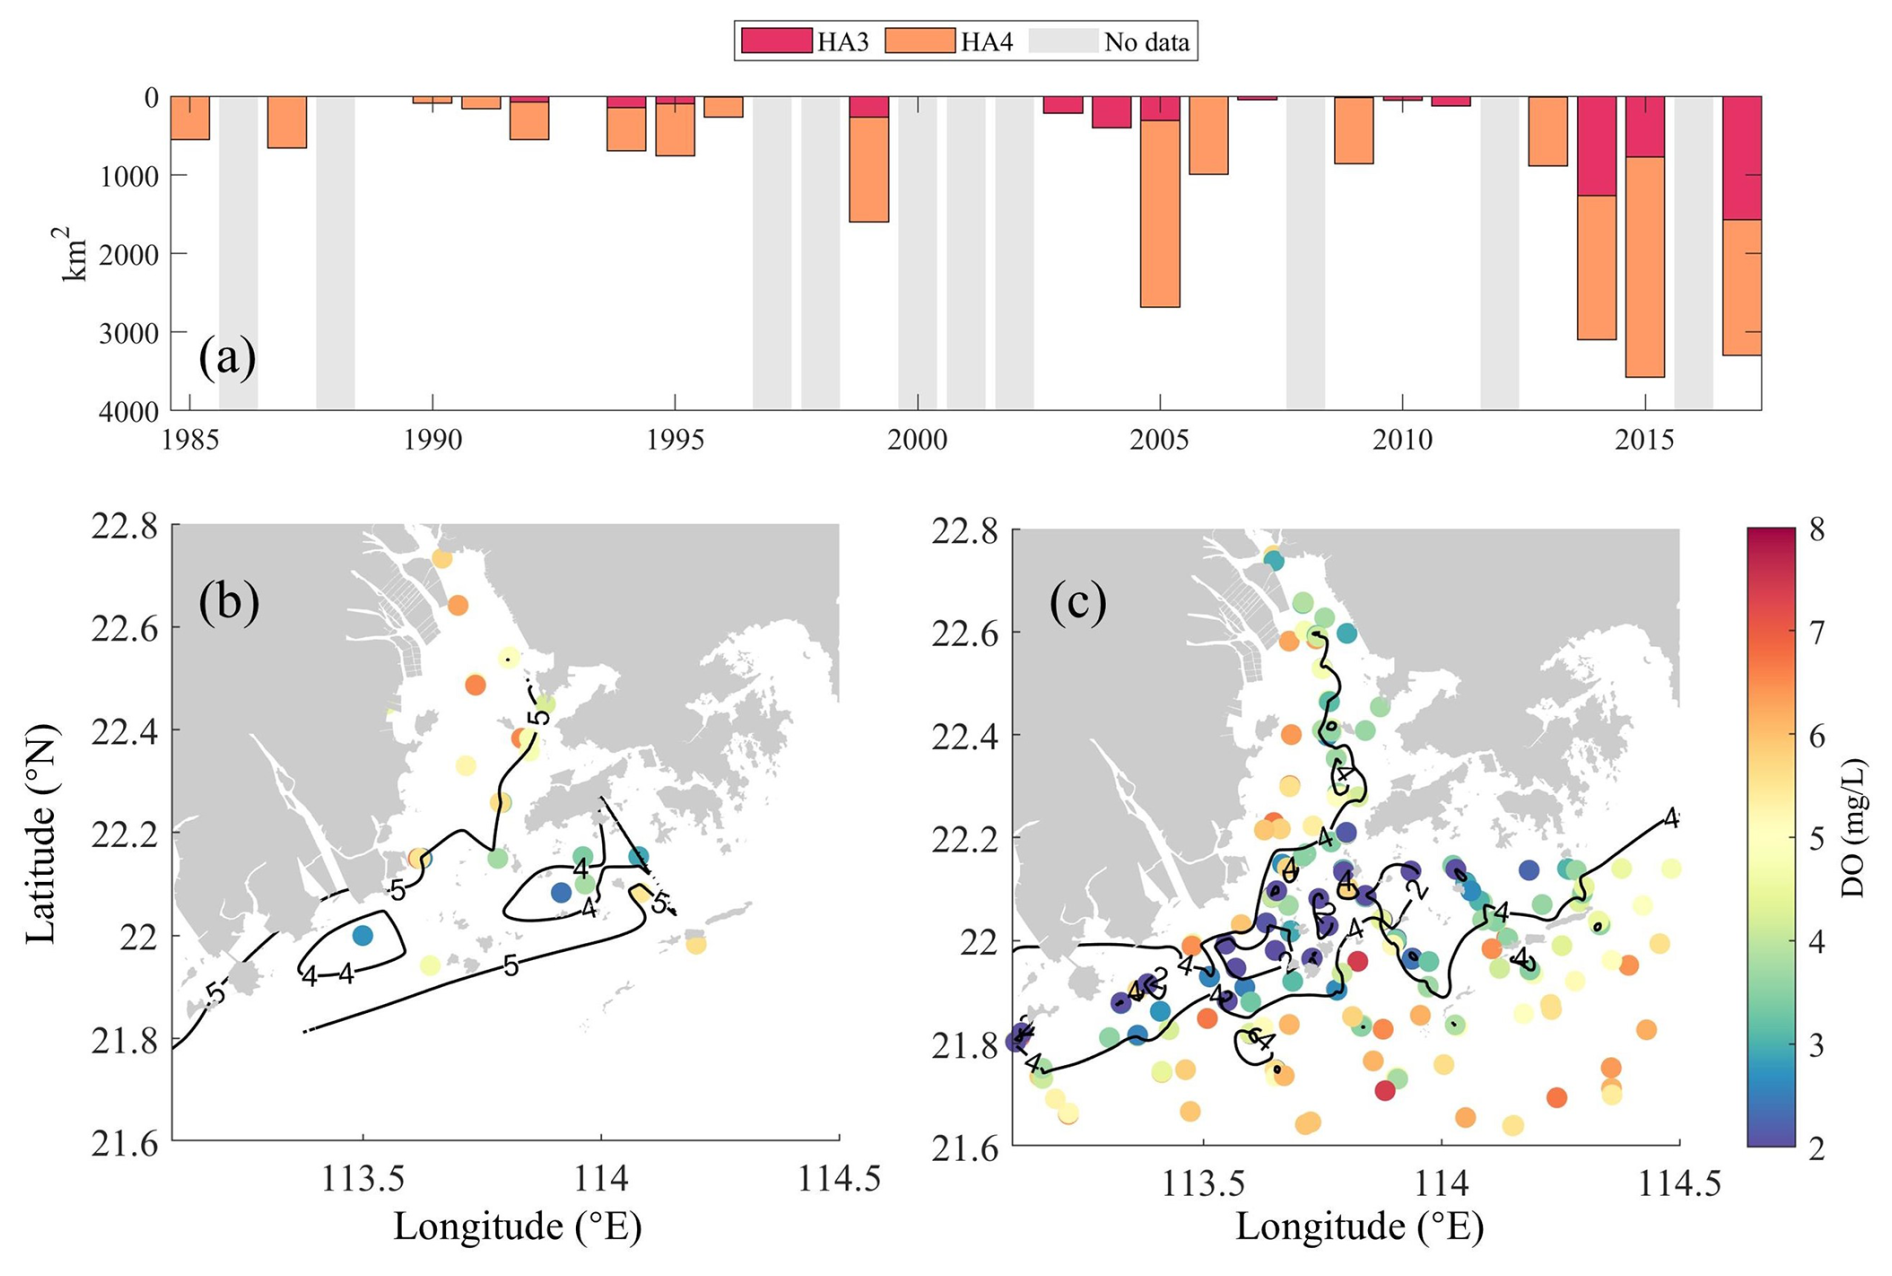
Figure 2(a) Interannual variations of the low-oxygen area (HA4, ) and hypoxic area (HA3, ) in the bottom waters (∼1–2 m above sediments) of the PRE, calculated via linear interpolation on a 0.01°×0.01° grid using summer cruise observations (note that the gray patches indicate data gaps). Spatial distributions of summer-averaged bottom DO concentrations during (b) 1991–1996 and (c) 2013–2017.
2.2 Model settings and validation
2.2.1 Model descriptions and settings
An online 1D–3D coupled physical–biogeochemical model, which has been extensively verified and applied in the PRE (Wang et al., 2017, 2018; Hu et al., 2011; Zhang et al., 2022), was utilized here to reproduce the oxygen dynamics under the long-term changes in riverine nutrients, suspended sediment concentration (SSC), and oxygen content (Fig. 1c–f). This 1D–3D modeling framework integrates a 1D representation of the Pearl River network with a 3D simulation of the Pearl River estuary and adjacent shelf region, operating in an online coupling mode. The 1D component numerically solves the Saint-Venant equations using a Preissmann scheme, discretizing the river network into 299 sections with five upstream boundaries (specified as either discharge or water-level inputs). The 3D component employs the ECOM model with 16 vertical layers and an adaptive horizontal resolution (400 m–3 km), forced by tides, atmospheric forcing, and open boundary conditions. The two components exchange fluxes at eight river outlets: the 3D model incorporates river discharge from the 1D model as upstream boundary conditions, while the 1D model uses water levels computed by the 3D model as its downstream boundaries at each time step. This 1D–3D modeling framework was initially developed to investigate nutrient fluxes to the PRE and has been extended and validated to simulate oxygen dynamics and hypoxia in the PRE (Wang et al., 2017, 2018; Hu et al., 2011; Zhang et al., 2022; Chen et al., 2024). For the sake of conciseness in the main text, detailed descriptions of the physical and suspended sediment modules are provided in Text S1 in the Supplement. Regarding the biogeochemical module, it is based on the Row–Column AESOP (RCA), which simulates interactive cycles of oxygen, carbon, nitrogen, phosphorus, and silicon in the water column. The schemes for DO dynamics and phytoplankton growth in the model can be found in previous studies (Wang et al., 2017, 2018). The nutrient limitation factor (GN(N)) is parameterized as
where DIN, DIP, and Si are concentrations (mg L−1) of dissolved inorganic nitrogen (, ), phosphorus (), and silicon (), respectively. KmN,KmP, and KmSi are their corresponding half-saturation constants. A higher GN(N) indicates weaker nutrient limitation. Given the stronger N and P limitation compared to Si in the PRE, this study emphasizes N and P.
The light limitation factor GI(I) is parameterized as
with the light extinction coefficient,
and the surface light at depth,
Here, H is the water depth (m), Is is the saturation light intensity (ly d−1), Isurf is the surface light (ly d−1), and the k terms are the light attenuation coefficients due to water, Chl a, SSC, and POC.
To assess the light conditions, the eutrophic depth HE is computed as the depth, where light is 1 % of surface intensity:
A deeper HE implies better light conditions for phytoplankton growth.
2.2.2 Model validation
The coupled physical–biogeochemical model mentioned above has already been validated against a variety of observations for several periods, which showed good performance in reproducing the physical conditions, suspended sediment dynamics, and biogeochemical cycles in the PRE. We briefly summarize the validation results here. For the physical and suspended sediment modules, Hu and Li (2009) have applied the 1D–3D coupled model to establish 30 d realistic simulations for July 1999 and February 2001. The simulated water levels, discharges, salinity, and SSC agreed well with the observations in the Pearl River network and the PRE for both periods, with correlation coefficients all greater than 0.65 in summer. The simulated SSC at the surface was also compared to satellite remote sensing data, which showed a fairly close spatial pattern and comparable concentration magnitude. Furthermore, Wang et al. (2017) provided an extensive model validation using field data collected from four seasonal cruises in 2006, with high correlations for water levels (>0.95), salinity (>0.90), and temperature (>0.80) and low root mean standard errors between the simulation and observations in summer.
Then, the biogeochemical module was established and used to explore the nutrient and oxygen dynamics off the PRE in July 1999 and January–December 2006 (Hu and Li, 2009; Wang et al., 2017). Detailed model settings and parameters can be found in Wang et al. (2017). For validation, comparisons with the water quality data from cruise surveys indicated that the biogeochemical module was robust to reproduce the spatial distributions of nutrient, chlorophyll a, and oxygen concentrations in the PRE (Figs. 3 and 5). To further assess light attenuation dynamics, we obtained a diffuse attenuation coefficient at 490 nm (Kd(490)) for the PRE from the EUMETSAT Ocean Colour Thematic Assembly Centre (https://www.oceancolour.org/, last access: October 2025). We converted Kd(490) to a photosynthetically active radiation attenuation coefficient (Kpar) using the empirical formula proposed by Lee et al. (2005) and then calculated the euphotic depth using Eq. (5) in Sect. 2.2.1. Model-simulated and satellite-derived euphotic depths show close agreement in both the 1990s and 2010s (Fig. 4b and d), demonstrating consistent model performance across decades.
For hypoxia simulation, the model accurately captured the observed temporal expansion of hypoxia, transitioning from localized bottom hypoxia in the 1990s (Fig. 2b and c) to widespread occurrences in the 2010s (Fig. 5d and e). Initial validation against the 1994–1999 summer observations showed close agreement, with simulated low-oxygen (HA4=1179.7 km2) and hypoxic (HA3=211.3 km2) areas matching observational estimates (802±437 and 131±84 km2; Fig. 2a and Table 3). For the 2013–2017 period, the model successfully replicated hypoxia intensification, as evidenced by HA4 expansion to 2925.5 km2, aligning with the observed 2715±1068 km2. For the 2010s, simulated HA3 doubled to 617.2 km2, consistent with observational uncertainty ranges (901±591 km2; 2013–2017 data). These results collectively confirm the model's robustness in simulating both historical patterns and emerging hypoxia dynamics. In addition, Wang et al. (2017) have compared the simulated oxygen kinetic terms (including the air–sea re-aeration rate, water-column respiration and production rates, and sediment oxygen demand) with observations in summer, which demonstrated the model's capability in representing the important oxygen source–sink processes (e.g., oxygen consumption across the sediment–water interface) in the PRE. Detailed model settings and parameters can be found in Wang et al. (2017).
2.3 Model experiments
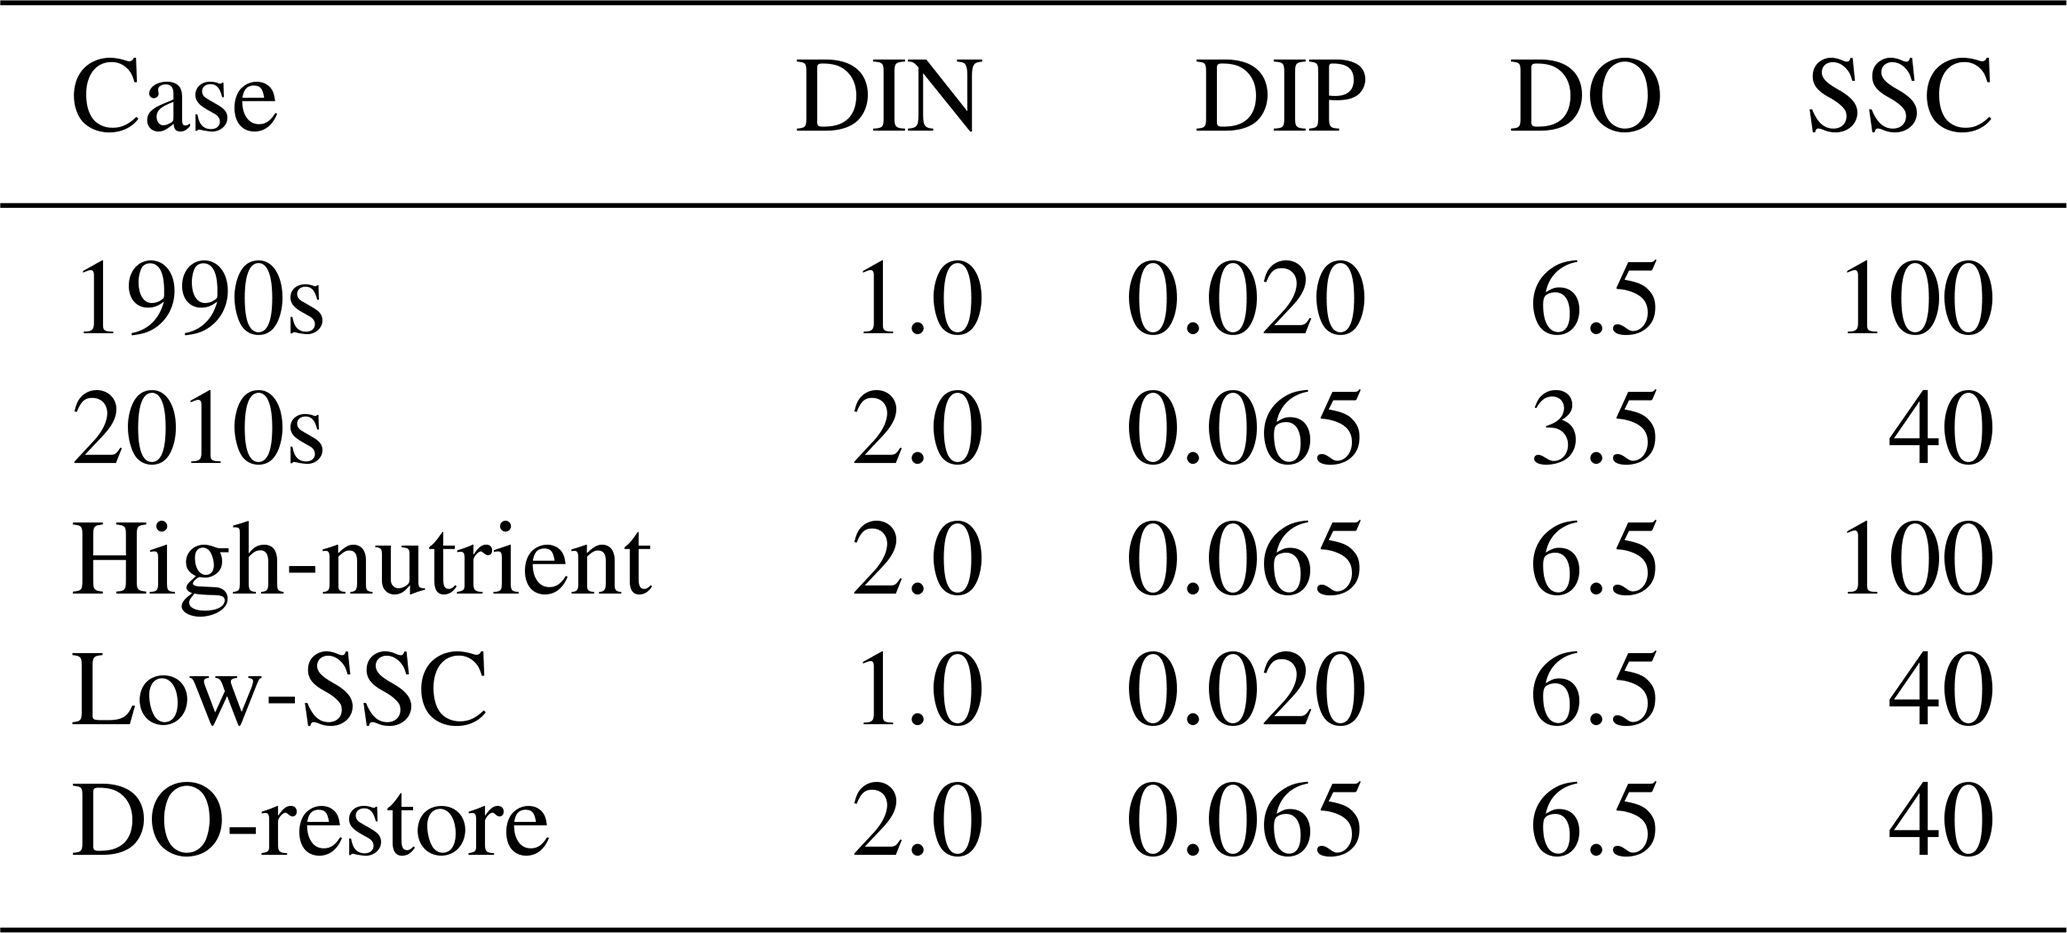
Based on the well-validated model run in 2006 (Wang et al., 2017), the present study performed diagnostic simulations for two representative periods, characterized by low nutrients and high suspended sediments and oxygen content during 1991–1996 (referred to as the “1990s case”; Table 1) versus high nutrients and low suspended sediments and oxygen content during 2013–2017 (referred to as the “2010s case”). Each case was run from 1 January to 31 August, driven by climatological physical conditions (freshwater discharges and wind speeds detailed in Text S1), averaged over 1990–2017 and by mean observed values of riverine water quality components in the corresponding period. The riverine boundary conditions for DIN, DIP, DO, and SSC during summertime are listed in Table 1 for both the 1990s and 2010s. Notably, the 2010s SSC was set based on field data (Chen et al., 2020), whereas the 1990s SSC was back-calculated from the 2.5-fold difference in sediment loads. Long-term monitoring at river outlets showed no significant temporal trend in chemical oxygen demand (COD) compared to the marked increases in nutrients and decreases in DO (Lai et al., 2022), indicating stable oxygen-consuming organic matter (OM) inputs. We therefore maintained constant OM concentrations between study periods (organic carbon: 2 mg L−1; organic nitrogen: 0.2 mg L−1; organic phosphorus: 0.03 mg L−1), consistent with published historical observations (Wang et al., 2018). Furthermore, three additional model scenario simulations were conducted in order to disentangle the individual impact of each varying riverine input on the summer deoxygenation off the PRE. The setting of each scenario was identical to that of the 1990s case except that the riverine nutrients, SSC, and DO were separately replaced by the representative value in the 2010s (referred to as the “High-nutrient case”, “Low-SSC case”, and “DO-restore case”, respectively; Table 1).
Table 1Riverine inputs (in units of mg L−1) for model experiments.
3.1 Responses of eutrophication to human-induced changes in the PRE
3.1.1 Long-term variations in water quality distributions
To examine changes in eutrophication (a key process affecting DO dynamics) and its influential factors during summer in the PRE, we compared the simulated distributions of SSC, nutrients, Chl a, and POC in the surface waters between the 1990s and the 2010s cases (Fig. 3) as well as their vertical integrations in subregions (Table 2). Model results showed that the surface SSC in the PRE largely declined during the two periods. In the 1990s, SSC was maintained at a high level in the inner Lingdingyang Bay (see its location in Fig. 1b), ranging from 70.0 to 100.0 mg L−1 (Fig. 3a). Due to the particle sinking as waters were advected downstream, SSC decreased to in the lower reaches of the PRE in the 1990s. Meanwhile, in the 2010s, the riverine sediment loads remarkably decreased, resulting in a corresponding drawdown in SSC downstream (Fig. 3b and c). Overall, the vertically integrated SSC content in the inner Lingdingyang Bay and lower PRE dropped by 56.1 % and 45.6 %–47.3 % to 244.5 mg m−2 and 38.4–69.2 mg m−2, respectively (Table 2).
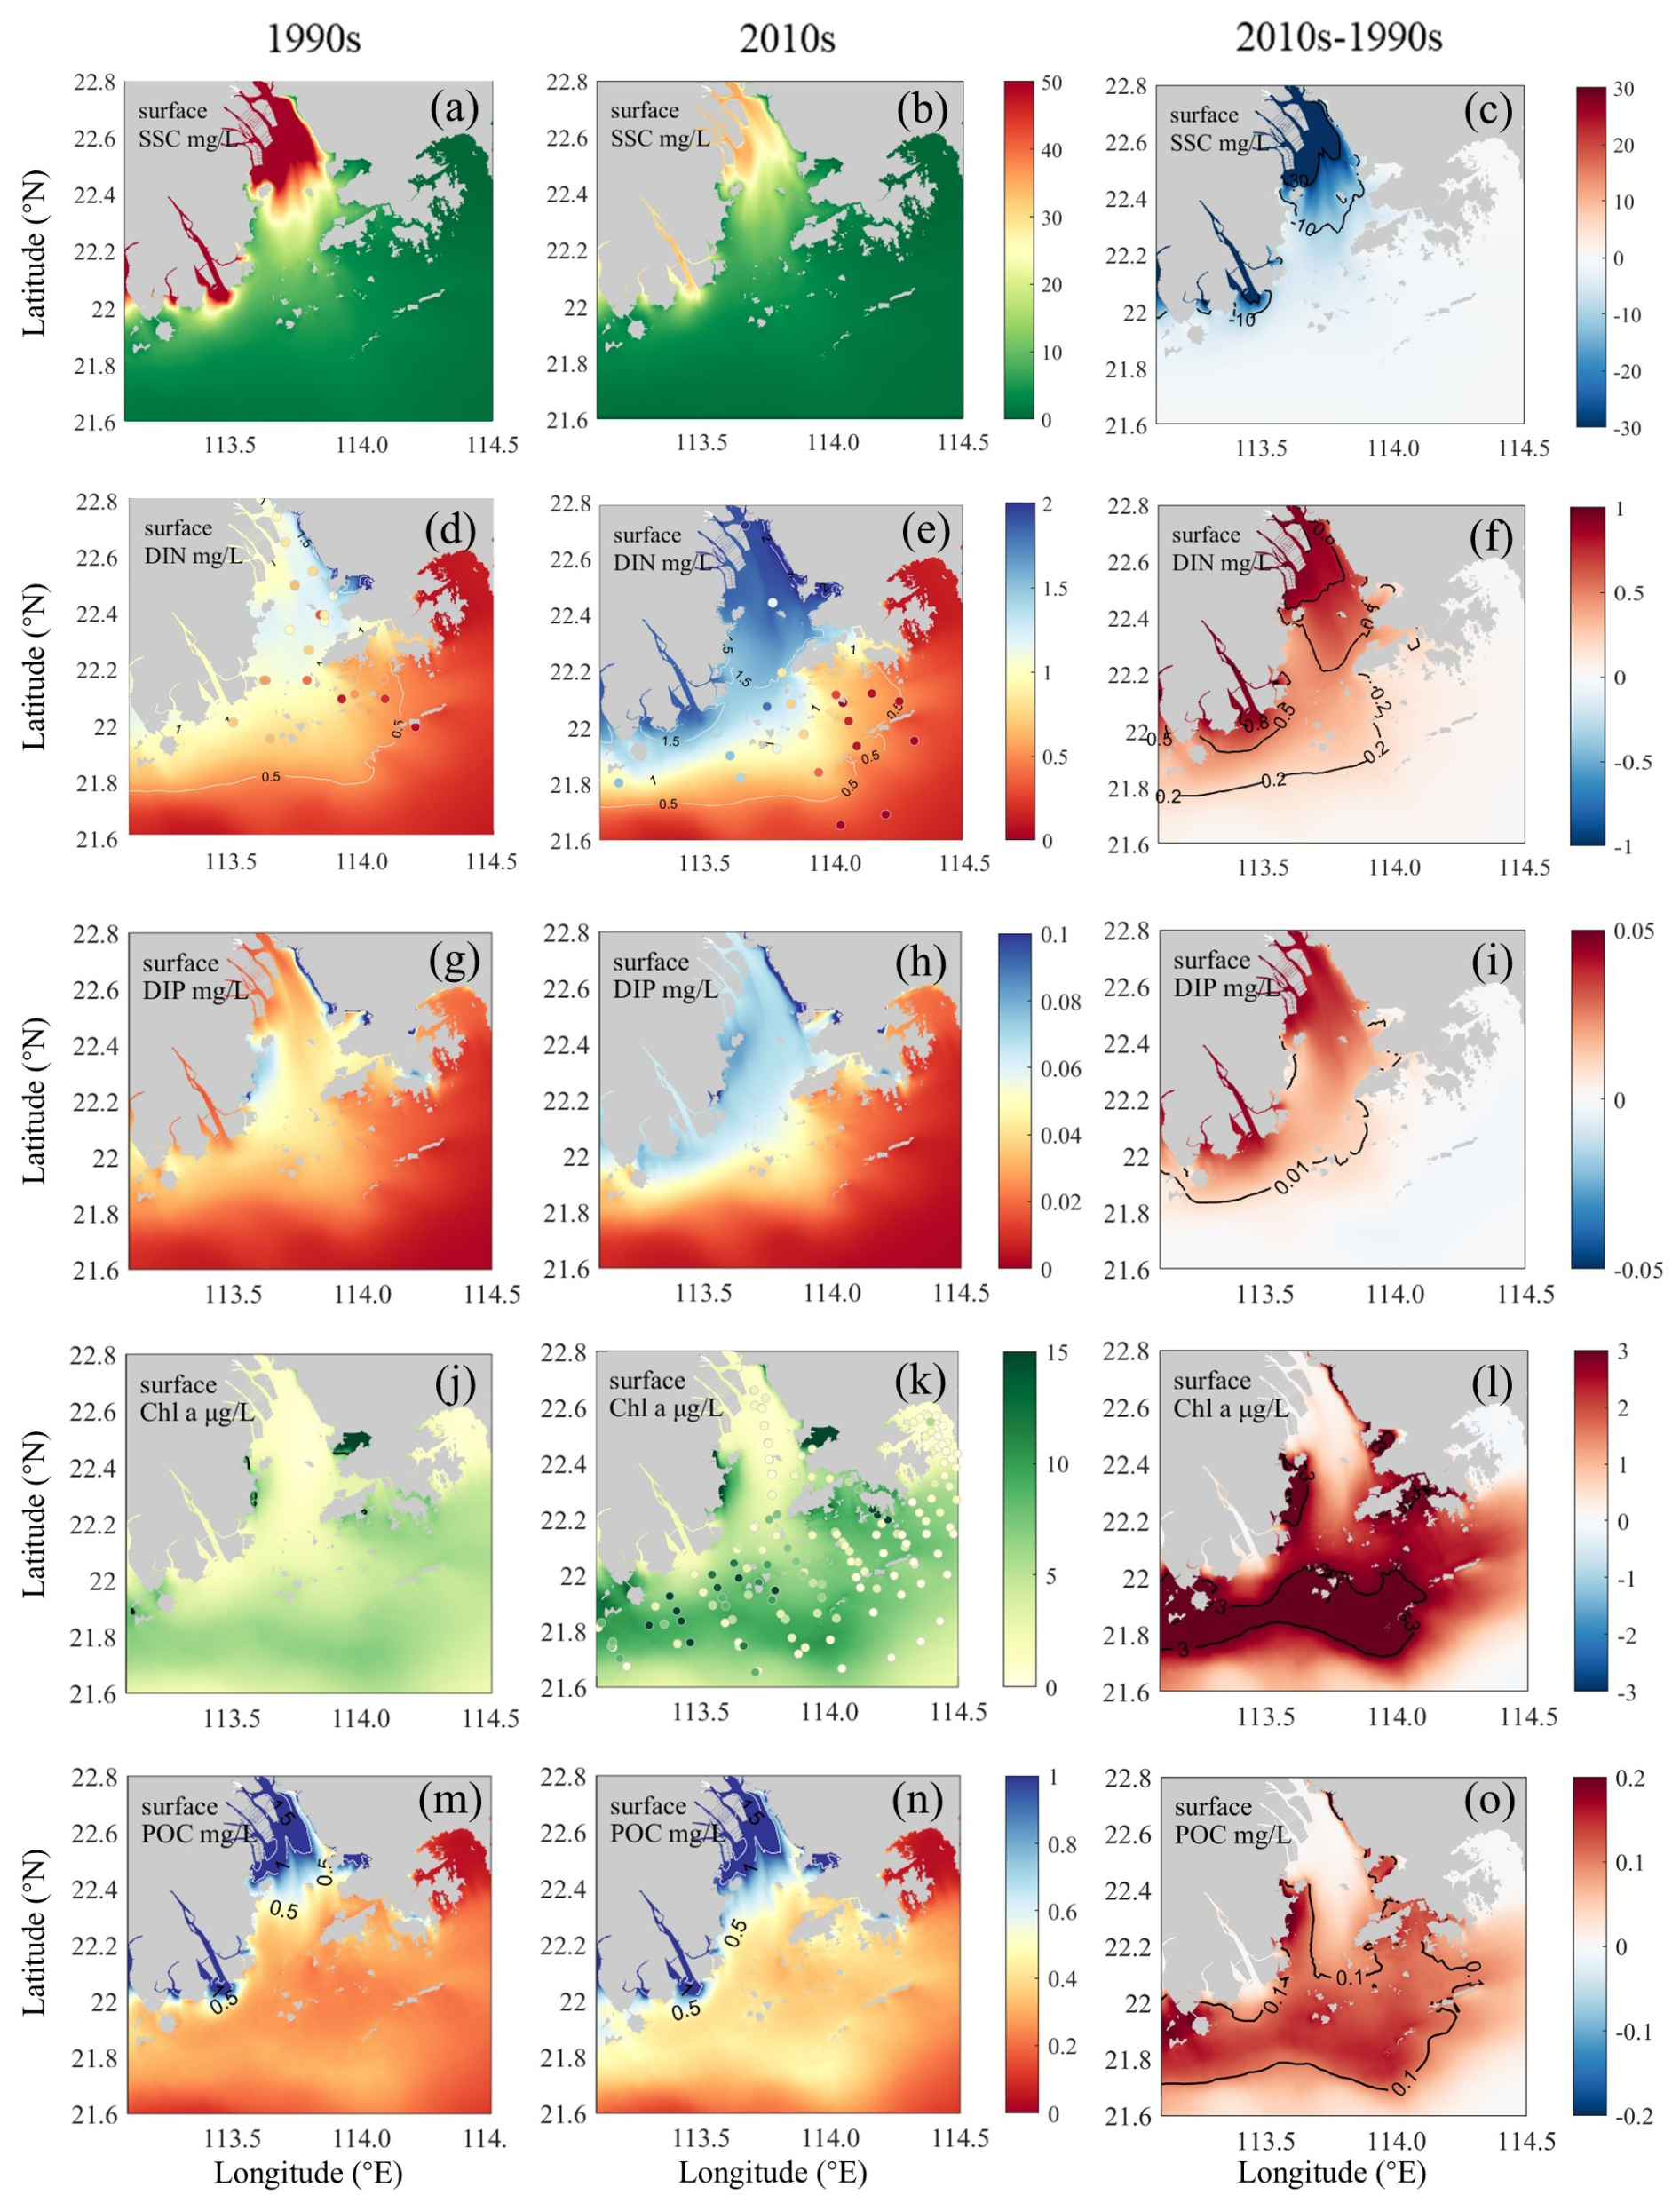
Figure 3Simulated surface water distributions in the PRE for (a–c) SSC, (d–f) DIN, (g–i) DIP, (j–l) Chl a, and (m–o) POC concentrations. Left panels (a, d, g, j, m) show 1990s conditions, middle panels (b, e, h, k, n) show 2010s conditions, and right panels (c, f, i, l, o) show their differences (2010s–1990s). Corresponding observations are indicated by colored dots in the DIN (d, e) and Chl a (j, k) panels.
Table 2Vertical integrations of DIN, DIP, SSC, Chl a, and POC contents; nutrient limitation index and euphotic depth; and DO concentrations, low-oxygen frequency (HF4), hypoxia frequency (HF3), and oxygen consumption rates in the bottom waters for subregions of the PRE (see locations in Fig. 1b) during the 1990s and the 2010s.
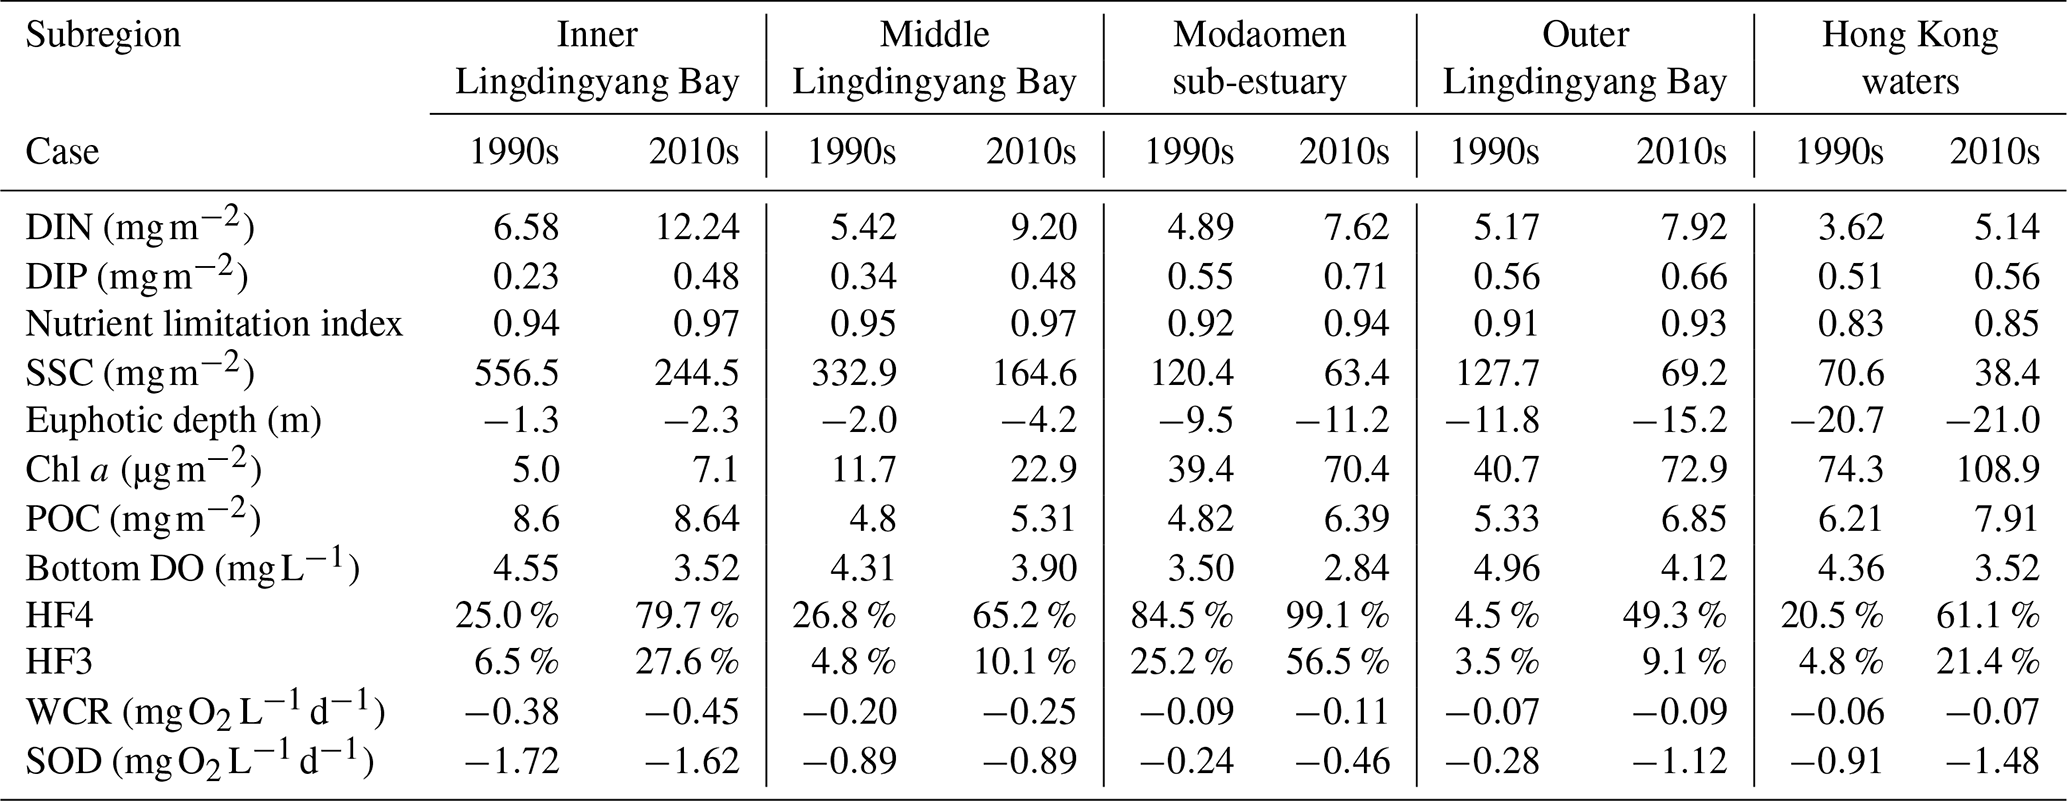
Note: HF4 (frequency of ); HF3 (frequency of ). The euphotic depth is measured as negative values increasing downward from the sea surface.
In terms of nutrients, the variation induced by riverine inputs was also evident during the two periods, acting on the main estuary in association with the spreading of the river plume. As shown, the DIN content in the 1990s was mostly below 1.5 mg L−1 in the entire PRE (Fig. 3d). With respect to the 2010s, the DIN concentration increased by 0.8 and 0.2 mg L−1 in the surface waters of the upper Lingdingyang Bay and the lower PRE, respectively (Fig. 3e and f). The vertically integrated DIN mass increased by 41.9 %–102 % in the PRE (Table 2). A similar situation occurred with respect to DIP, with its content increasing from 0.04 mg L−1 in the 1990s to 0.07 mg L−1 in the 2010s in the high-DIP area adjacent to the middle Lingdingyang Bay (Fig. 3g–i). In terms of vertical integration, DIP increased by 9 %–108 %, with the lowest increases located in the Hong Kong waters downstream of the estuary (Table 2).
In response to changes in light (affected by the SSC content) and nutrient conditions, phytoplankton biomass grew substantially in the 2010s, indicated by the increased Chl a concentration. In the 1990s, the phytoplankton biomass was at a low level, with Chl a generally below 8.0 µg L−1 in the surface waters (Fig. 3j). As for the 2010s, significant phytoplankton blooms were found along the Modaomen sub-estuary, outer Lingdingyang Bay, and Hong Kong waters (Fig. 3k and l), with the vertically integrated Chl a content rising by 31.0 µg m−2 (by 78.7 % compared to the 1990s), 32.2 µg m−2 (79.1 %), and 34.6 µg m−2 (46.6 %), respectively (Table 2). As a result of the elevated primary production, a great amount of organic matter was produced in the PRE. Spatially coupled to the growth of Chl a (Fig. 3l), the POC content significantly increased in the 2010s, especially in the lower PRE (Fig. 3m–o), with the vertically integrated concentration increasing by 1.5–2.0 mg m−2 (by 27.4 %–32.6 % compared to the 1990s) over the water column (Table 2).
3.1.2 Long-term variations in nutrient and light limitations
The primary production in the PRE was controlled by the synergistic effects of nutrient and light conditions. We calculate the nutrient limitation factor and the eutrophic depth to quantify the intensity of nutrient limitation and light limitation in relation to algae growth. It should be noted that a smaller nutrient limitation index and a shallower eutrophic depth represent a stronger nutrient limitation and a stronger light limitation, respectively. Results showed that the nutrient limitation exhibited a distinct estuary–shelf gradient, in which the Hong Kong waters experienced a more severe nutrient limitation than the Modaomen sub-estuary and Lingdingyang Bay (Fig. 4a and c). Specifically, the nutrient limitation index decreased from the upper estuary (0.94) to the Hong Kong waters (0.83) in the 1990s. In contrast, light limitation attenuated along the river plume transport pathway (Fig. 4b), largely ascribed to the decreasing SSC (Fig. 3a and b). Both observations and model simulations revealed consistent spatial patterns, with the eutrophic depth progressively increasing from severely light-limited regions near river outlets (Lingdingyang Bay: 1.3 m; Modaomen sub-estuary: 9.5 m) to the less-limited Hong Kong waters (20.7 m; Fig. 4b).
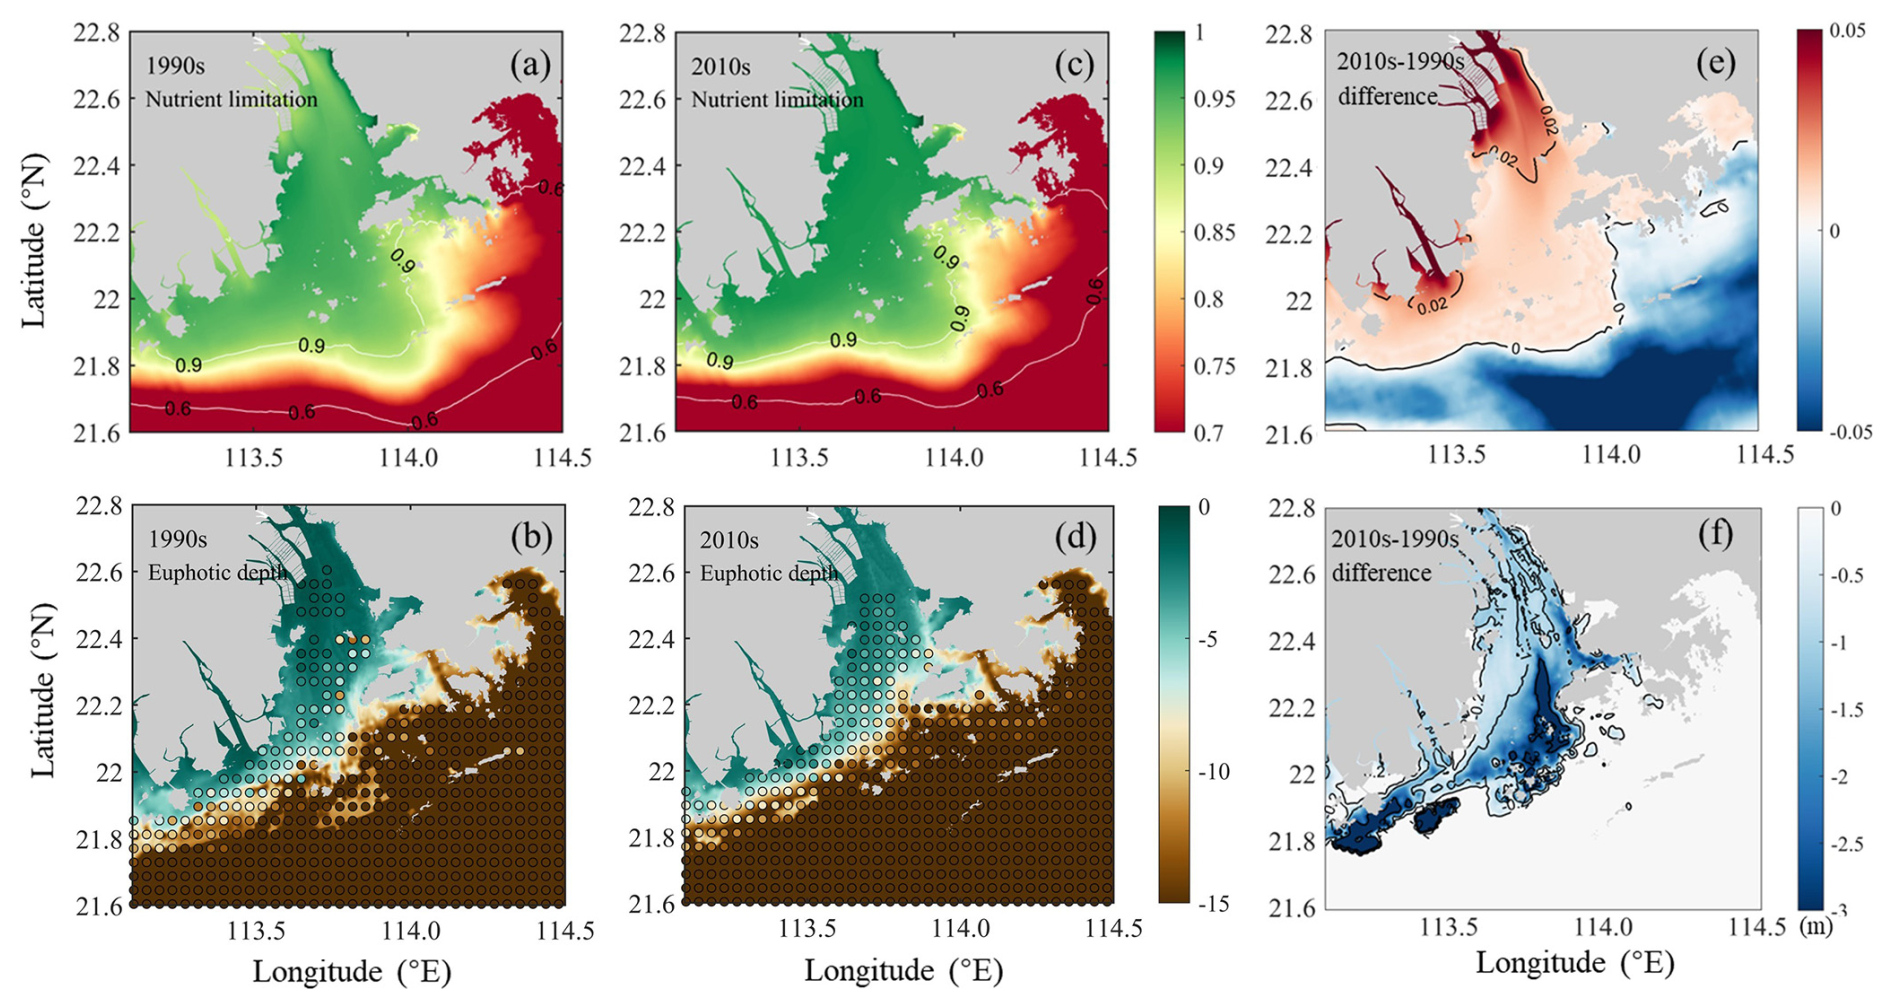
Figure 4Comparisons of (a, c) simulated nutrient limitation index for phytoplankton growth and (b, d) euphotic depths (in meters) between the 1990s and the 2010s, with their differences shown in (e, f), respectively. Colored dots in (b, d) represent corresponding euphotic depth observations. Note: euphotic depth is measured as negative values increasing downward from the sea surface; thus, more negative differences in (f) indicate deeper light penetration in the 2010s.
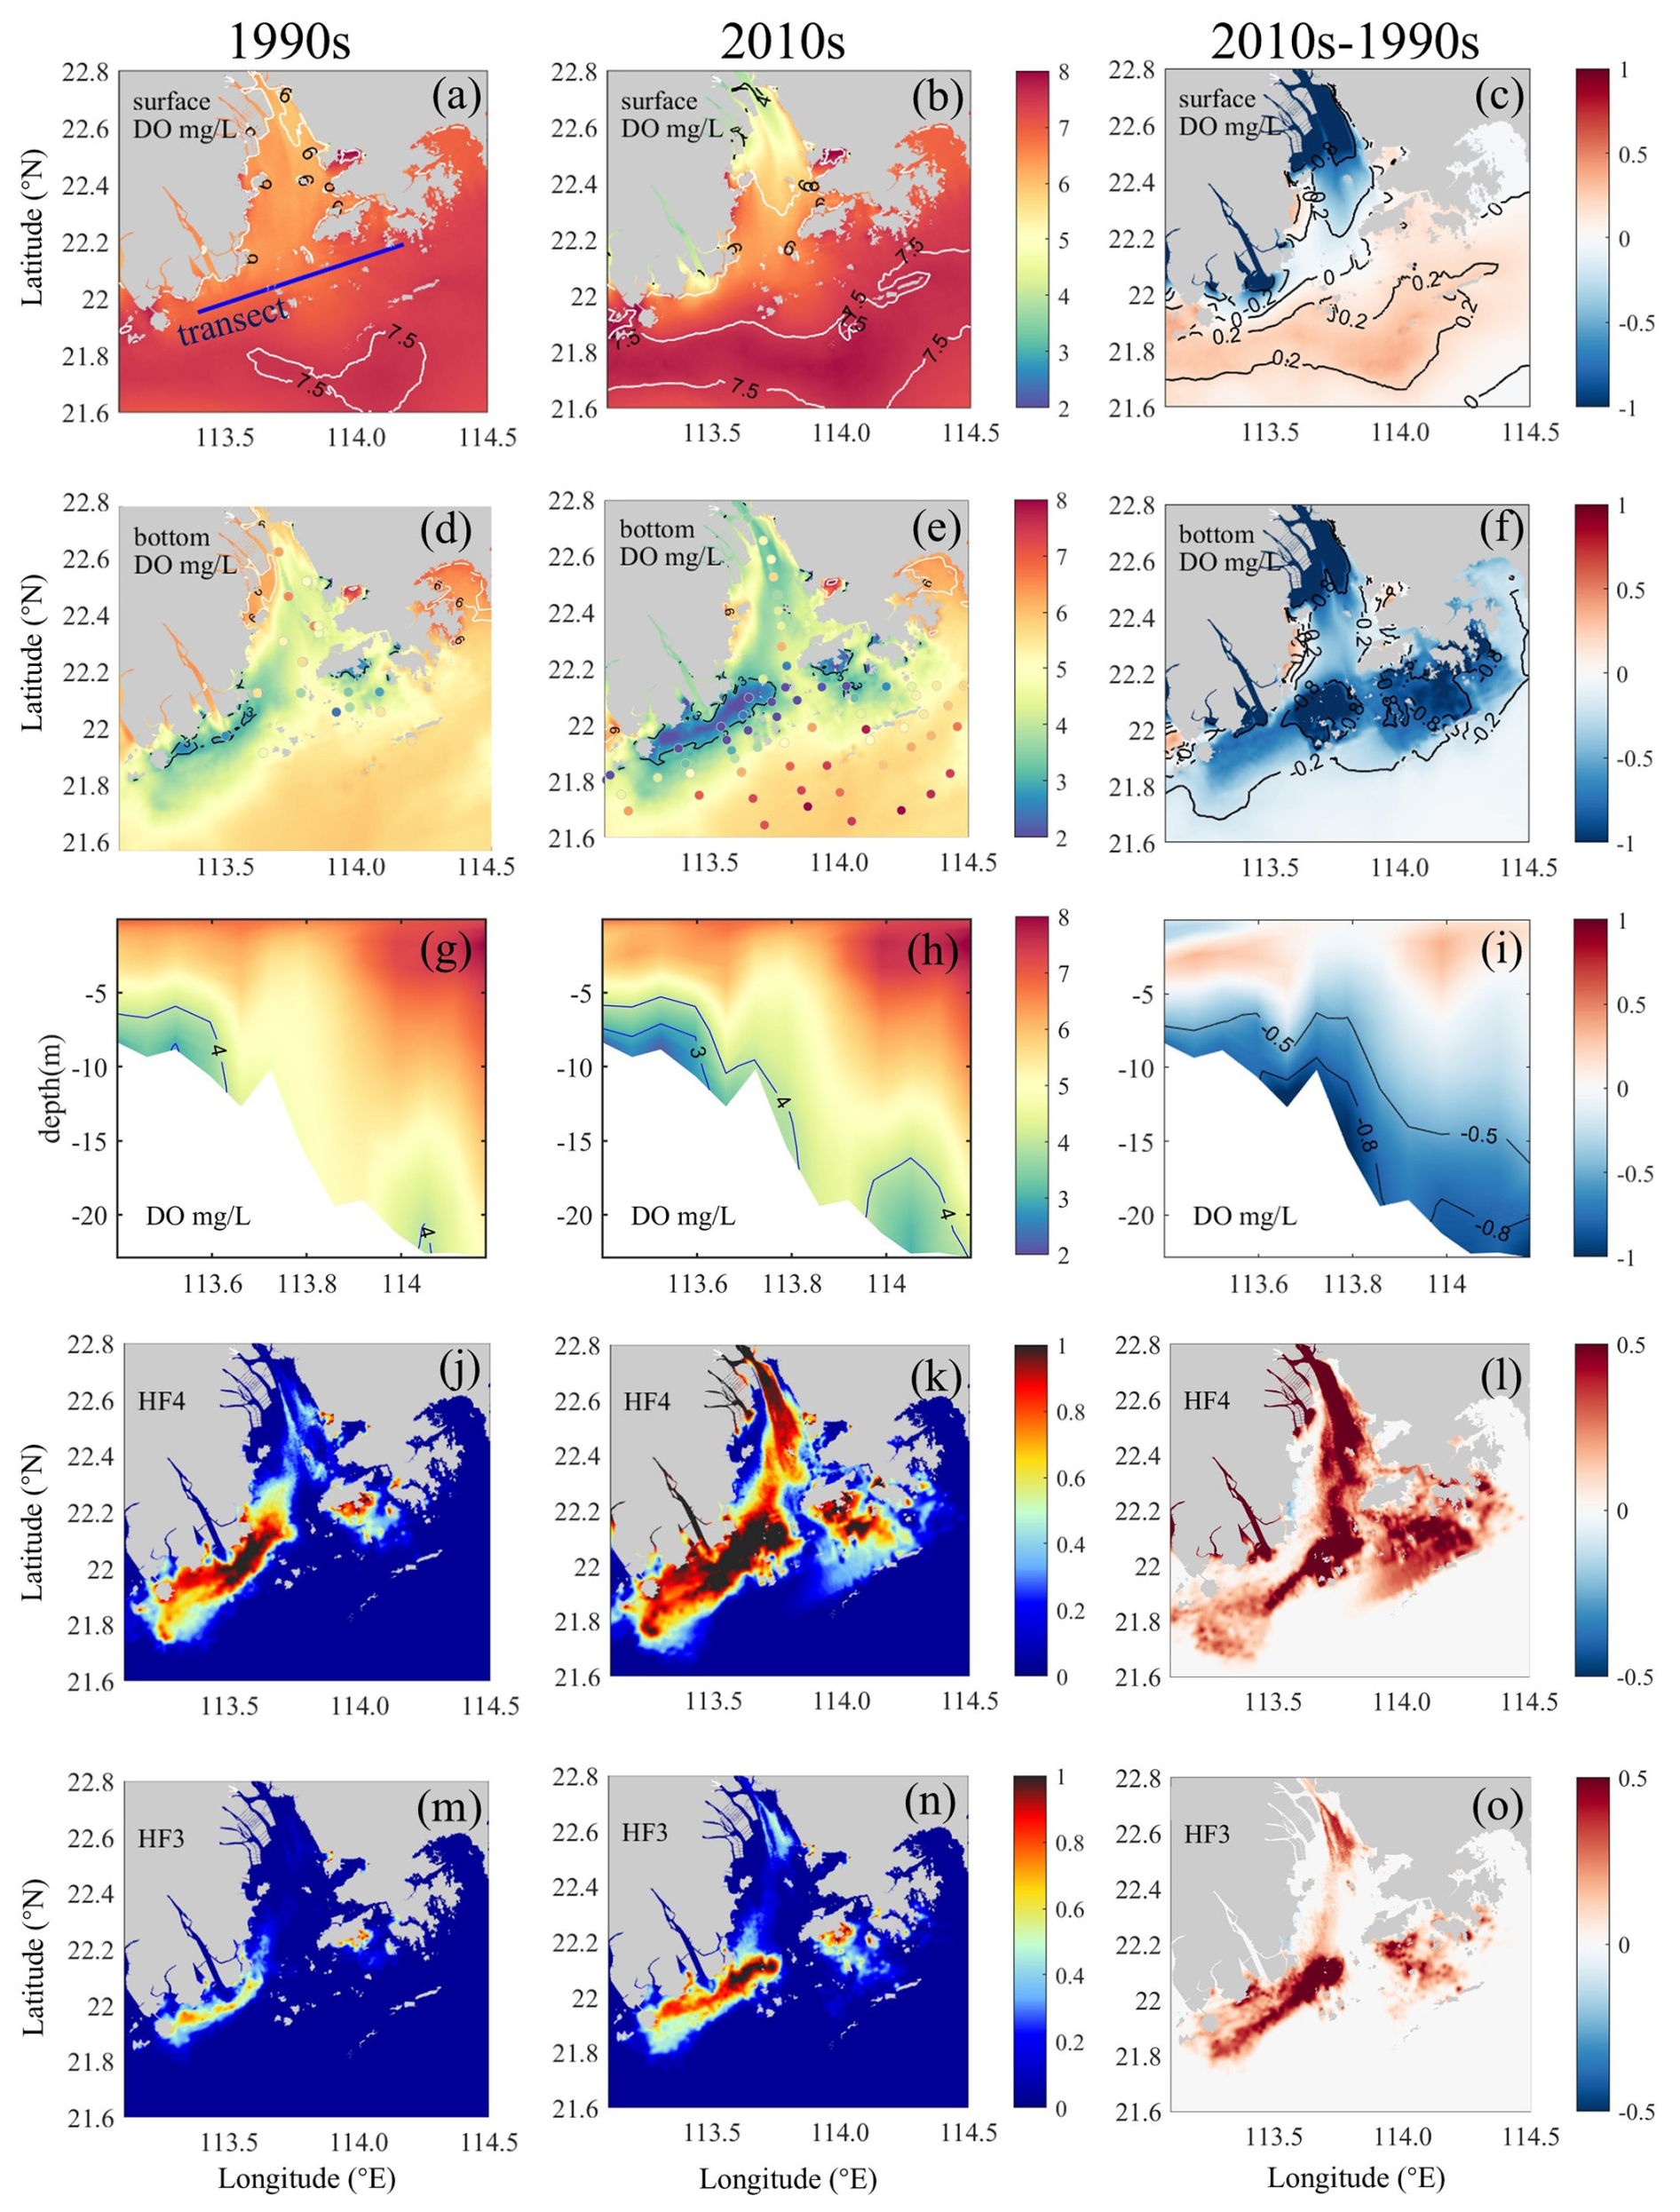
Figure 5(a–c) Surface DO and (d–f) bottom DO distributions, (g–i) vertical DO distributions along the transect (see its location in panel a), and (j–l) low-oxygen frequency (HF4, ) and (m–o) hypoxia frequency (HF3, ) in the bottom waters of the PRE for the 1990s (left panels) and the 2010s (middle panels) as well as their differences (right panels). Note that hypoxia frequency is calculated as the number of hypoxic days divided by the total number of days in the study period, yielding a dimensionless ratio (range: 0–1).
The increased nutrient loads in the 2010s alleviated nutrient limitation. For instance, the nutrient limitation index in Hong Kong waters increased to 0.85 (a 2.4 % increase from the 1990s levels; Table 2). By contrast, the relief of light limitation due to the reduced riverine suspended sediments was more evident. Both model simulations and observations revealed significantly greater deepening of the euphotic depth in the Lingdingyang Bay compared to the lower estuary (Fig. 4b, d, f). In the inner and middle Lingdingyang Bay, the euphotic depth increased by 1.0 and 2.2 m (by 76.9 % and 110.0 % relative to the 1990s, Table 2), respectively. The alterations in light conditions in the remaining area were relatively minor, with the eutrophic depth increasing to 11.2 m (by 17.9 %) in the Modaomen sub-estuary and to 21 m (by 1.4 %) in the Hong Kong waters during the 2010s (Table 2).
3.2 Responses of DO dynamics to human-induced changes in the PRE
3.2.1 Variations in DO distributions and hypoxia occurrences
Our model revealed distinct shifts in summertime DO patterns and hypoxia distribution (Fig. 5). The 1990s surface waters generally maintained , increasing toward the shelf regions (Fig. 5a). By the 2010s, surface DO increased by 0.2–0.3 mg L−1 (Fig. 5b and c), with an oxygen-enriched zone in the lower PRE correlating with high Chl a (Fig. 3k), although new low-oxygen zones () emerged near river outlets due to a reduced Pearl River DO influx.
Bottom-water simulations captured the hypoxia expansion from localized 1990s events (Fig. 2b and c) to widespread 2010s occurrences (Fig. 5d and e). Initial hypoxia clustered along the western PRE (Modaomen sub-estuary; Fig. 5d), with simulated HA4 (1179.7 km2) and HA3 (211.3 km2; Table 3) matching observations (802±437 and 131±84 km2; 1994–1999 summers; Fig. 2a). By the 2010s, hypoxia intensified throughout Lingdingyang Bay and Hong Kong waters, with bottom DO declining to 2.8–4.1 mg L−1 (Table 2). Simulated HA4 expanded 1.5-fold to 2925.5 km2 (Table 3), consistent with the observed 2715±1068 km2 (2013–2017; Fig. 2a). HA3 doubled to 617.2 km2 by the 2010s, comparable to the observed 901±591 km2 (2013–2017).
Table 3Simulated low-oxygen (HA4, ) and hypoxic (HA3, ) areas in the bottom waters of the PRE and their changes relative to the 1990s.
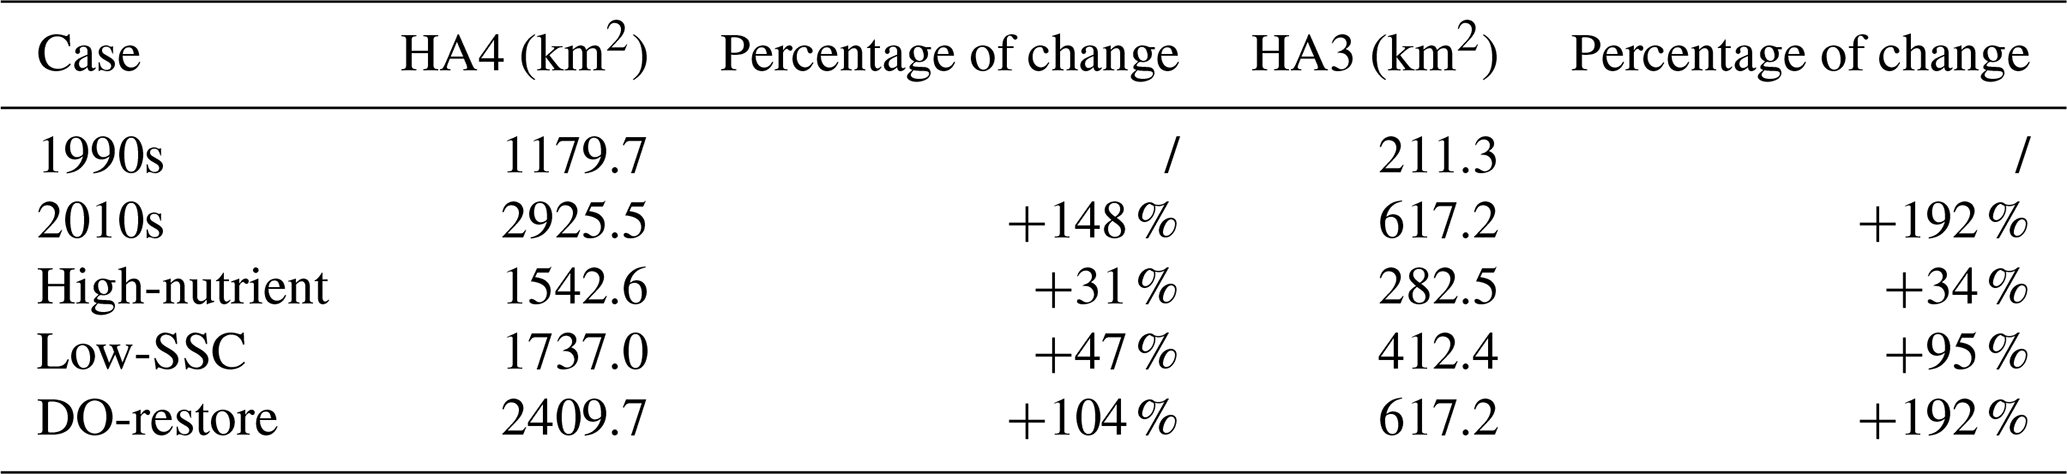
Note: the calculation in percentage of change is , where x represents each case.
In addition, our model accurately reproduced the two observed hypoxic centers along the coastal transition zone (Modaomen sub-estuary and Hong Kong waters; Fig. 2b and c), revealing distinct spatiotemporal deoxygenation patterns (Fig. 5g–o). During the 1990s, both centers exhibited limited low-oxygen zones, with Hong Kong waters showing<1 m thick layers (Fig. 5g). Low-oxygen (HF4) and hypoxic (HF3) conditions persisted for 18–76 d (20.5 %–84.5 % frequency) and 4–23 d (4.8 %–25.2 %), respectively, during the summer months (Fig. 5j and m and Table 2).
By the 2010s, the hypoxic thickness increased substantially to ∼1.5 m at Modaomen and ∼5 m (∼4 m thicker than the 1990s) in the Hong Kong waters (Fig. 5h). Event durations were prolonged to 55–89 d (61.0 %–99.1 % HF4) and 19–51 d (21.4 %–56.5 % HF3), respectively (Fig. 5k and n and Table 2), demonstrating intensified and prolonged hypoxia.
3.2.2 Variations in bottom oxygen consumption
To further explore the mechanism of long-term deoxygenation off the PRE, we investigated the oxygen consumption rates and their changes during the two periods (the 1990s versus the 2010s). We specifically focused on the oxygen consumption at the bottom layers covering the 20 % of the water depth above the sediments, where the majority of hypoxic events in the PRE occurred (Fig. 5).
As shown in Table 2, the predominant oxygen sink in the bottom waters of the PRE was sediment oxygen demand (SOD), induced largely by the remineralization of organic matter in sediments, whereas water-column respiration (WCR) accounted for only 15.2 % of the bottom oxygen consumption on average. Over the past three decades, both the WCR and SOD have generally increased in the PRE, primarily attributed to the growth in local production of organic matter associated with aggravated eutrophication (Fig. 3j–o). In particular, the SOD in the outer Lingdingyang Bay and Hong Kong waters remarkably increased from 0.28–0.92 in the 1990s to 1.12–1.48 in the 2010s (Table 2), which contributed to of the increment in total oxygen consumption. Although the absolute increase of SOD in the Modaomen sub-estuary was comparatively small, the SOD in the 2010s has almost doubled compared to the 1990s, leading to a substantial increase in the occurrence of hypoxic events in this region (Fig. 5d–o).
3.2.3 Disentangling contributions of riverine oxygen, suspended sediments, and nutrient changes to deoxygenation
As detailed in Sect. 2.3, three scenario simulations were performed to quantify the relative contributions of riverine changes to the decadal low-oxygen expansion in the PRE (Table 1). In general, the riverine impacts on DO and related biogeochemical factors varied significantly between subregions (Figs. 6 and 7). Specifically, increasing the riverine nutrient levels from the 1990s to the 2010s alone (High-nutrient case) led to a marked drawdown in the bottom DO around the lower PRE (by over 0.2 mg L−1 relative to the 1990s; Fig. 6a). The DO decline, extending from the Modaomen sub-estuary to the Hong Kong waters, was ascribed to the elevated phytoplankton biomass (Fig. 7b) facilitated by better nutrient conditions, which subsequently sustained stronger bottom oxygen depletions compared to the 1990s (Fig. 7c). Among the subregions, the Hong Kong waters were more susceptible to the changes in riverine nutrients as they were subject to a comparatively severe nutrient limitation (Table 2). Therefore, with the improvement of nutrient utilization, this region experienced more pronounced deoxygenation in association with significant alterations in Chl a content and SOD (an increase of 14.2 µg m−2 and 0.26 , respectively, equivalent to 47.1 % and 46.4 % of their total increments over the past three decades; Fig. 7). Meanwhile, in the inner Lingdingyang Bay, the increased nutrient inputs caused only a slight change in Chl a content because the phytoplankton growth in this region was mostly light limited due to high water turbidity (Table 2). The concomitant changes in SOD and bottom DO were fairly small as well. Collectively, the high-nutrient scenario alone resulted in a 31 % and 34 % growth in the area affected by low oxygen (HA4) and hypoxia (HA3), respectively, relative to the 1990s (Table 3).
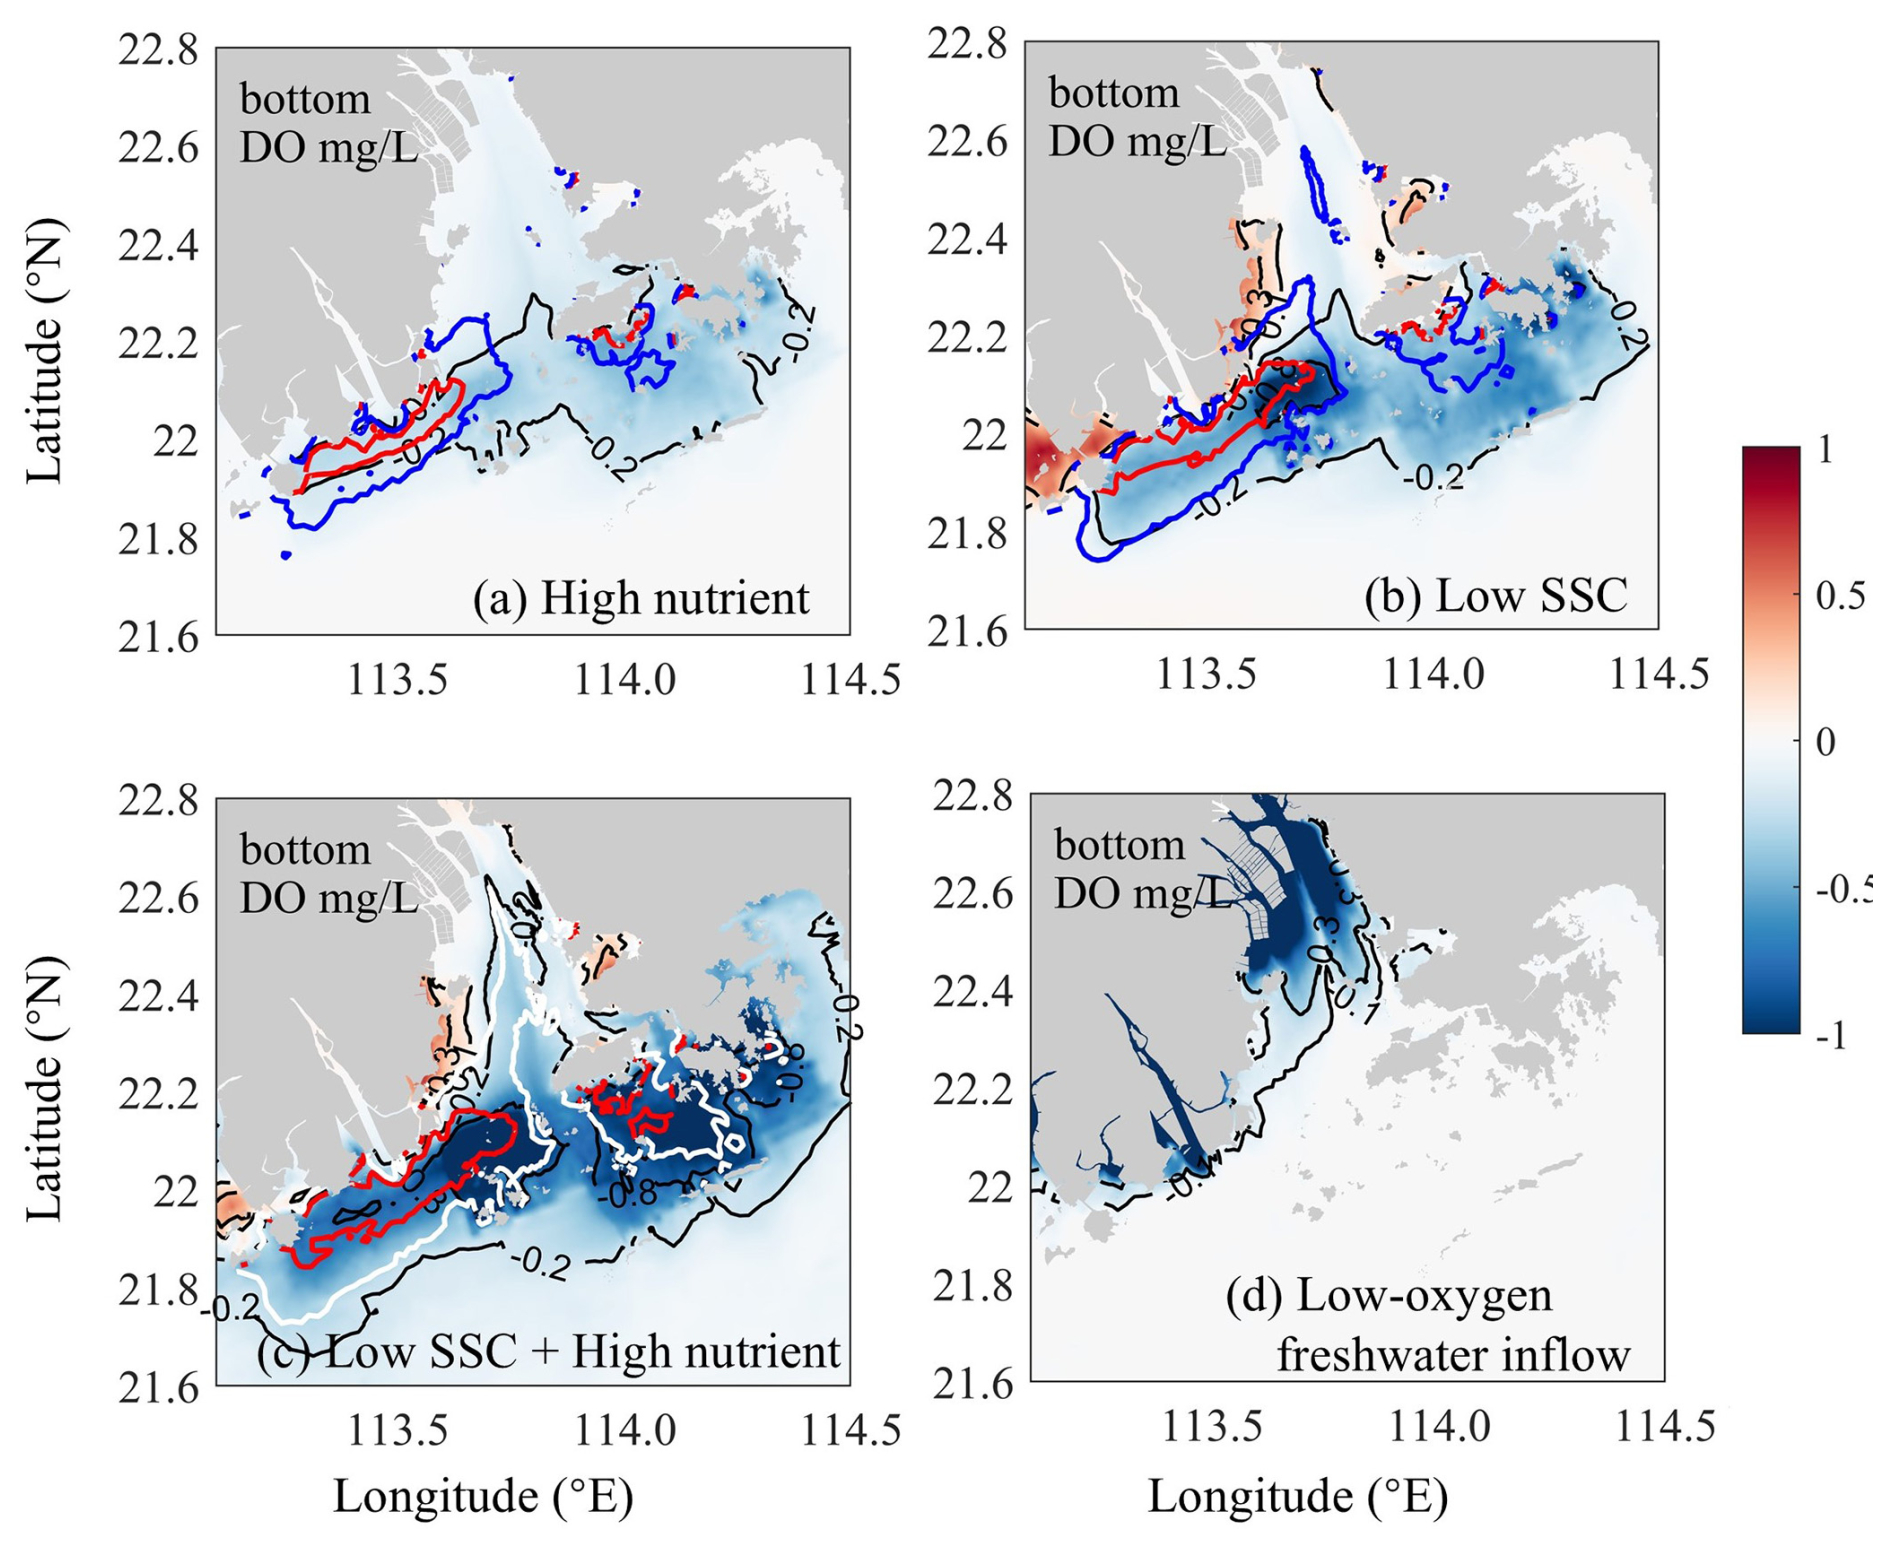
Figure 6Bottom DO changes induced by (a) riverine nutrient increases (the High-nutrient case minus the 1990s case), (b) riverine SSC declines (the Low-SSC case minus the 1990s case), (c) the combined effects of nutrient increases and SSC declines (the DO-restore case minus the 1990s case), and (d) riverine DO declines (the DO-restore case minus the 2010s case). The blue and white contour lines represent for the respective cases, and the red contour lines represent .

Figure 7Changes of (a) bottom DO concentration, (b) vertically integrated Chl a content, and (c) SOD in subregions of the PRE for the High-nutrient, Low-SSC, and 2010s cases relative to the 1990s case.
Compared with the High-nutrient case, reducing the riverine suspended sediment loads from the 1990s to the 2010s alone (Low-SSC case) had a greater impact on the DO conditions, causing more extensive and intense deoxygenation through the PRE (Fig. 6b). An apparent DO decline (exceeding 0.3 mg L−1 relative to the 1990s) occurred in the lower PRE, similar to that of the changing riverine nutrients described above. This is also attributed to the intensified SOD (with an increment of 0.17–0.62 , accounting for 57.1 %–77.3 % of the total increment during the two periods; Fig. 7c), accompanied by a prominent increase in Chl a content (by 21.9–29.1 µg m−2, accounting for 72.4 %–90.3 % of the total increment; Fig. 7b) due to the improved light condition (the relief of light limitation; Table 2). The SSC-induced changes in these biogeochemical factors were more pronounced in the outer Lingdingyang Bay and Modaomen sub-estuary than in other regions including the Hong Kong waters, which coincided with the alterations in deoxygenation among the subregions (Fig. 7). Overall, under the low-SSC scenario, the low-oxygen area (HA4) and hypoxic area (HA3) expanded by 47 % and 95 %, respectively, compared to the 1990s, (Table 3). As shown in Fig. 7 and Table 3, the combined effect of reducing SSC and increasing nutrient inputs (DO-restore case) led to a significant expansion of low-oxygen conditions, with hypoxic areas (HA4) and low-oxygen areas (HA3) reaching 2409.7 and 617.2 km2, respectively. This combined effect exceeded the sum of changes induced by individual river inputs, highlighting the non-linear interaction between SSC and nutrient loading. In regions such as the outer Lingdingyang Bay and Hong Kong waters, the combined effect was amplified, while in regions such as the inner and middle Lingdingyang Bay, the combined effect was less than the sum of the individual effects. The growth of phytoplankton is not a linear process in response to various influencing factors; instead, these factors interact cumulatively. Therefore, when different factors are combined, their combined effect can exceed the impact of the individual factors acting alone.
With respect to the influence of altered riverine DO influx, it could be deduced from the difference between the 2010s and the DO-restore cases (Fig. 6d). There was a considerable DO decrease (of over 0.8 mg L−1) in the bottom waters adjacent to the river outlets (also in the surface waters) owing to the low-oxygen inflows from the upstream river channels. The impact of these low-oxygen waters was largely restricted in the upper Lingdingyang Bay under the effects of air–sea reoxygenation and water-column mixing, along with the river plume transport. Collectively, reducing the riverine DO content from the 1990s to the 2010s alone resulted in an enlargement of the low-oxygen area by nearly 515.8 km2 (derived by subtracting the HA4 of the 2010s case from that of the DO-restore case; Table 3).
4.1 Impacts of decadal changes in riverine inputs on deoxygenation off the PRE
By integrating long-term observations with physical–biogeochemical model simulations, we revealed significant bottom-water deoxygenation in the Pearl River estuary over the past three decades, driven by changes in riverine inputs. From the 1990s to the 2010s, summer inflows of DIN and DIP increased by ∼100 % and ∼225 %, while SSC decreased by ∼60 % due to human activities like dam construction (Liu et al., 2022) and reforestation (Cao et al., 2023). Concurrently, oxygen depletion from terrestrial pollutants reduced riverine DO concentrations by 46 % (Ma et al., 2024). These shifts collectively intensified bottom-water low-oxygen conditions in the PRE (Fig. 5), with model simulations showing a 148 % expansion in summer low-oxygen areas () and a 192 % increase in hypoxic areas (). Low-oxygen events also become more persistent, lasting longer (∼15–35 d during June–August) and expanding vertically by ∼1–4 m (Fig. 5g and h).
More interestingly, the PRE has developed three distinct hypoxic centers (including the inner Lingdingyang Bay, Modaomen sub-estuary, and Hong Kong waters) controlled by different dominant factors, which renders the deoxygenation problem in this region a great reference for estuaries and coastal systems worldwide. Specifically, the impact of riverine low-oxygen waters was confined in the upper estuary close to the river outlets, leading to a ∼44 % increase in the low-oxygen area relative to the 1990s. Such a local low-oxygen issue could be mitigated to a large extent if the riverine DO recovered to a comparatively higher level (e.g., in the 1990s) according to the DO-restore scenario (Fig. 6d). Reduced water turbidity downstream facilitates the upstream transport of nutrients, promoting eutrophication and oxygen depletion in the lower reaches, which is highly sensitive to changes in riverine nutrient and sediment inputs. As indicated in the High-nutrient and the Low-SSC cases, the increased nutrient inputs and declined suspended sediment loads have separately alleviated the nutrient and light limitations on algae growth in the region, thereby stimulating phytoplankton blooms and the local production of organic matter to support subsurface oxygen consumption (dominated by sediment oxygen demand, SOD; Fig. 7).
While previous studies have primarily examined the impacts of riverine inputs of freshwater, nutrients, and organic matter, this study provides a comprehensive investigation of how suspended sediment reduction influences estuarine dissolved oxygen dynamics. In the PRE, the riverine SSC reduction played a more important role in driving the long-term low-oxygen expansion than the nutrient increase. Its synergistic effect with the riverine nutrient changes could further amplify the exacerbation of eutrophication and subsequent deoxygenation, resulting in enlarged growth in the low-oxygen area (by 104 %) and hypoxic area (by 192 %) that was notably larger than the total of their partial contributions (Table 3), reaching 70 % of the total impact from combined SSC, nutrient, and low-oxygen changes (148 % low-oxygen expansion).
It is worth mentioning that the relative importance of the riverine nutrient and that of the SSC changes were different between the two hypoxic centers in the lower PRE, depending upon their distances and water flow conditions from the river outlets. Closer to the river outlets, the Modaomen sub-estuary and its surrounding waters (located on the western side of the coastal transition zone off the PRE) possessed a fairly high SSC level, which imposed a stronger light limitation on the growth of phytoplankton in the region, ultimately making the oxygen dynamics more susceptible to the decline in riverine SSC. This non-additive characteristic underscores the need for integrated management approaches that simultaneously address both nutrient loads and suspended sediment-mediated light conditions.
Suspended sediments were confined to the coastal area of Modaomen by water currents (Fig. 1b), resulting in a significant decrease in sediment deposition in this region, which greatly improved light availability, ultimately making the oxygen dynamics more susceptible to the decline in riverine SSC. On the contrary, the Hong Kong waters and adjacent coastal areas (located on the eastern side of the coastal transition zone), far from the river outlets, were less affected by the riverine inputs, where the relatively low nutrient levels promoted more sensitive responses of biogeochemical processes (e.g., primary production and SOD) and hypoxia occurrences to nutrient variations. Besides, the complex island topography near Hong Kong (Fig. 1b) creates hydrodynamic barriers that restrict the offshore transport of suspended sediments.
4.2 Nutrient control and hypoxia mitigation in the context of sediment declines
Our results highlight the substantial spatial variability in how riverine inputs influence deoxygenation, emphasizing the need for more targeted strategies to mitigate hypoxia. While the effects of riverine nutrients on hypoxia have been widely studied, the role of SSC in modulating eutrophication and hypoxia has received comparatively less attention. This is particularly relevant in systems like the PRE, which has experienced a dramatic 60 % decline in sediment since the 1980s due to dam construction and land-use changes.
In the PRE, our model simulations demonstrate that the SSC-mediated light limitation critically influences deoxygenation dynamics. When SSC declines are omitted, model simulations overestimate nutrient-driven productivity and underestimate hypoxia expansion. This suggests that for systems experiencing pronounced sediment reductions, overlooking SSC effects could lead to overly optimistic assessments of nutrient control efficacy. It is therefore critical to disentangle the relative contributions of riverine nutrients versus SSC changes to the coastal deoxygenation trend. As demonstrated in the PRE, the current low-SSC environment suggests that more stringent nutrient reductions might be required to effectively curb deoxygenation compared to conditions with a higher SSC.
Although dam constructions in the Pearl River basin, mostly completed before the 2000s, have driven significant declines in SSC, the future trends of riverine SSC remain uncertain. For instance, recent reforestation efforts have effectively reduced summer freshwater discharge and sediment load in the Pearl River basin (Cao et al., 2023). This evolving situation underscores the fact that changes in SSC will continue to shape future oxygen dynamics, introducing compounding uncertainties for hypoxia mitigation.
Similar relationships between SSC and eutrophication or hypoxia have been observed in other systems facing rapid anthropogenic changes. For example, the Yangtze River estuary has seen a ∼56 % decrease in SSC over the past decades, which has been linked to a 61 % increase in Chl a concentration, indicating intensified eutrophication (Wang et al., 2019). In addition, several modeling studies have shown that dam constructions in the upper regions of the Guadiana estuary have led to reduced water turbidity and have exacerbated eutrophication in the lower estuary (Domingues et al., 2012; Barbosa et al., 2010). A global survey revealed that sediment loads in 414 major rivers have decreased by approximately 51 % since the 2000s due to human activities (Dethier et al., 2022). This trend highlights the need for further investigation into how sediment declines impact eutrophication and deoxygenation on a global scale.
It is also important to recognize that human activities can increase sediment loads in estuaries. For example, land-use changes such as deforestation (Kasai et al., 2005) and industrialization (Syvitski and Kettner, 2011) can exacerbate soil erosion and sediment transport, leading to higher suspended sediment concentrations in the water. In such cases, light attenuation due to increased turbidity may suppress phytoplankton growth and reduce primary production, potentially mitigating hypoxia. Therefore, the effects of SSC are system specific and depend on the direction and magnitude of sediment trends.
Some caveats in our work require further investigation. First, our light attenuation parameterization is based on the empirical formulation of DiToro (2001), which has been validated for the PRE through biogeochemical consistency checks (Wang et al., 2018). While this approach successfully captured observed oxygen dynamics in our simulations, it explicitly resolves only the chlorophyll and suspended sediment effects on light attenuation. Previous studies have shown that colored dissolved organic matter (CDOM) also plays a significant role in light attenuation in the PRE (Wang et al., 2010), particularly during algal bloom periods. The model's calibration to observed biogeochemical variables may partially compensate for CDOM's influence, but future work should explicitly parameterize CDOM's optical properties through both modeling refinements and sustained monitoring to better quantify its role in oxygen dynamics. In addition to anthropogenic influences, changes in regional physical conditions due to climate change, such as wind speed and freshwater discharge, could also affect the long-term deoxygenation trends in coastal regions (Yu et al., 2015; Chen et al., 2024). The impacts of ocean warming on deoxygenation (Laurent et al., 2018) remain unclear in the PRE despite evidence of warming (Cheung et al., 2021). The compounding factors of warming, such as sea-level rise (Hong et al., 2020), may introduce further complexity into hypoxia dynamics through cascading ecosystem effects. While these factors were not considered in this study, understanding the interplay between human activities and climate change is crucial for future research on oxygen dynamics and hypoxia development in estuaries and coastal systems.
We applied a well-validated physical–biogeochemical model to reconstruct the summertime oxygen distributions in the PRE during two representative periods (the 1990s and the 2010s) and to disentangle the contribution of alterations in riverine inputs (i.e., suspended sediments, nutrients, and oxygen concentrations) to the long-term deoxygenation off the PRE based on a suite of model experiments. We found that, owing to the changes of riverine inputs over the past three decades, the low-oxygen and hypoxic areas in the bottom waters of the PRE have expanded by about 1.5 times and 2-fold, respectively, with the duration time prolonged by ∼15–35 d in summer. Concurrently, three hypoxic centers dominated by distinct factors were identified: single-factor experiments suggested that a 46 % decrease in riverine DO alone expanded low-oxygen areas by ∼44 % in the upper PRE, a 60 % SSC reduction alone caused a 47 % expansion in the lower PRE, and nutrient increases alone (100 % DIN, 225 % phosphate) drove a 31 % expansion. By comparison, the alterations in riverine nutrients and suspended sediments have separately provided better nutrient and light conditions to promote a higher production of labile organic matter, which jointly maintained considerable oxygen depletions and exacerbated the low-oxygen conditions in the lower PRE. The relative importance of the changing riverine nutrients and suspended sediments to deoxygenation varied between subregions. The suspended sediment reduction was the predominant factor in the downstream regions close to the river outlets (e.g., the Modaomen sub-estuary), while the nutrient increase exerted a more substantial influence in the regions far from the river outlets (e.g., the Hong Kong waters). Our study demonstrates that declining suspended sediments have significantly exacerbated low-oxygen conditions off the PRE, with effects that synergistically intensify when combined with increasing nutrient loads. These findings highlight the need for dual-control strategies addressing both nutrient inputs and sediment-mediated light availability in coastal management. Given the global declines in riverine suspended sediments, we emphasize that effective hypoxia mitigation requires integrated approaches to account for these interacting drivers.
The dissolved oxygen observation datasets off the Pearl River estuary were obtained from published studies (Hu et al., 2021; Su et al., 2017; Li et al., 2021; Chen et al., 2020) and the Hong Kong Environmental Protection Department (https://cd.epic.epd.gov.hk/EPICRIVER/marine/, last access: October 2025). The observed nutrient, oxygen, and suspended sediment data in the Pearl River are available from Hu et al. (2021) and publicly accessible databases maintained by the Department of Ecology and Environment of Guangdong Province (https://gdee.gd.gov.cn/hjjce/jahy/index.html, last access: October 2025) and the China River Sediment Bulletin (http://www.mwr.gov.cn/sj/tjgb/zghlnsgb/, last access: October 2025).
The supplement related to this article is available online at https://doi.org/10.5194/bg-22-5573-2025-supplement.
YN: investigation, model experiments, formal analysis, visualization, and writing of the original draft. ZC: model experiments and writing (review). BW: writing (review). BL: writing (review). JH: project administration, supervision, conceptualization, and writing (review and editing).
The contact author has declared that none of the authors has any competing interests.
Publisher's note: Copernicus Publications remains neutral with regard to jurisdictional claims made in the text, published maps, institutional affiliations, or any other geographical representation in this paper. While Copernicus Publications makes every effort to include appropriate place names, the final responsibility lies with the authors.
This work was supported by the National Natural Science Foundation of Guangdong Province (grant no. 2025A1515010991), a grant from the Southern Marine Science and Engineering Guangdong Laboratory (Zhuhai) (Project SML2024SP024) to Jiatang Hu, and a grant from the National Natural Science Foundation of China (grant no. 42206141) to Bo Liang.
This paper was edited by Huixiang Xie and reviewed by three anonymous referees.
Barbosa, A. B., Domingues, R. B., and Galvão, H. M.: Environmental Forcing of Phytoplankton in a Mediterranean Estuary (Guadiana Estuary, South-western Iberia): A Decadal Study of Anthropogenic and Climatic Influences, Estuar. Coast., 33, 324–341, https://doi.org/10.1007/s12237-009-9200-x, 2010.
Bianchi, T. S., DiMarco, S. F., Cowan, J. H., Hetland, R. D., Chapman, P., Day, J. W., and Allison, M. A.: The science of hypoxia in the Northern Gulf of Mexico: A review, Sci. Total Environ., 408, 1471–1484, https://doi.org/10.1016/j.scitotenv.2009.11.047, 2010.
Breitburg, D., Levin, L. A., Oschlies, A., Grégoire, M., Chavez, F. P., Conley, D. J., Garçon, V., Gilbert, D., Gutiérrez, D., Isensee, K., Jacinto, G. S., Limburg, K. E., Montes, I., Naqvi, S. W. A., Pitcher, G. C., Rabalais, N. N., Roman, M. R., Rose, K. A., Seibel, B. A., Telszewski, M., Yasuhara, M., and Zhang, J.: Declining oxygen in the global ocean and coastal waters, Science, 359, eaam7240, https://doi.org/10.1126/science.aam7240, 2018.
Bussi, G., Darby, S. E., Whitehead, P. G., Jin, L., Dadson, S. J., Voepel, H. E., Vasilopoulos, G., Hackney, C. R., Hutton, C., Berchoux, T., Parsons, D. R., and Nicholas, A.: Impact of dams and climate change on suspended sediment flux to the Mekong delta, Sci. Total Environ., 755, 142468, https://doi.org/10.1016/j.scitotenv.2020.142468, 2021.
Cao, Z., Duan, H., Ma, R., Shen, M., and Yang, H.: Remarkable effects of greening watershed on reducing suspended sediment flux in China's major rivers, Science Bulletin, 68, 2285–2288, https://doi.org/10.1016/j.scib.2023.08.036, 2023.
Carstensen, J., Andersen, J. H., Gustafsson, B. G., and Conley, D. J.: Deoxygenation of the Baltic Sea during the last century, P. Natl. Acad. Sci. USA, 111, 5628–5633, https://doi.org/10.1073/pnas.1323156111, 2014.
Chen, J. Y., Pan, D. L., Liu, M. L., Mao, Z. H., Zhu, Q. K., Chen, N. H., Zhang, X. Y., and Tao, B. Y.: Relationships Between Long-Term Trend of Satellite-Derived Chlorophyll-a and Hypoxia Off the Changjiang Estuary, Estuaries and Coasts, 40, 1055–1065, https://doi.org/10.1007/s12237-016-0203-0, 2017.
Chen, L., Zhang, X., He, B., Liu, J., Lu, Y., Liu, H., Dai, M., Gan, J., and Kao, S.-J.: Dark Ammonium Transformations in the Pearl River Estuary During Summer, J. Geophys. Res.-Biogeo., 125, e2019JG005596, https://doi.org/10.1029/2019JG005596, 2020.
Chen, Z., Yu, L., and Hu, J.: Disentangling the contributions of anthropogenic nutrient input and physical forcing to long-term deoxygenation off the Pearl River Estuary, China, Water Res., 265, 122258, https://doi.org/10.1016/j.watres.2024.122258, 2024.
Cheung, Y. Y., Cheung, S., Mak, J., Liu, K., Xia, X., Zhang, X., Yung, Y., and Liu, H.: Distinct interaction effects of warming and anthropogenic input on diatoms and dinoflagellates in an urbanized estuarine ecosystem, Glob. Change Biol., 27, 3463–3473, https://doi.org/10.1111/gcb.15667, 2021.
Cormier, J. M., Coffin, M. R. S., Pater, C. C., Knysh, K. M., Gilmour, R. F., Guyondet, T., Courtenay, S. C., and van den Heuvel, M. R.: Internal nutrients dominate load and drive hypoxia in a eutrophic estuary, Environ. Monit. Assess., 195, 1211, https://doi.org/10.1007/s10661-023-11621-y, 2023.
Cullen, J. J.: Subsurface Chlorophyll Maximum Layers: Enduring Enigma or Mystery Solved?, in: Annual Review of Marine Science, vol. 7, edited by: Carlson, C. A. and Giovannoni, S. J., 207–239, https://doi.org/10.1146/annurev-marine-010213-135111, 2015.
Dethier, E. N., Renshaw, C. E., and Magilligan, F. J.: Rapid changes to global river suspended sediment flux by humans, Science, 376, 1447–1452, https://doi.org/10.1126/science.abn7980, 2022.
Diaz, R. J. and Rosenberg, R.: Spreading dead zones and consequences for marine ecosystems, Science, 321, 926–929, https://doi.org/10.1126/science.1156401, 2008.
DiToro, D. M.: Sediment flux modeling, John Wiley & Sons, 656 pp., ISBN 9780471135357, 2001.
Domingues, R. B., Barbosa, A. B., Sommer, U., and Galvão, H. M.: Phytoplankton composition, growth and production in the Guadiana estuary (SW Iberia): Unraveling changes induced after dam construction, Sci. Total Environ., 416, 300–313, https://doi.org/10.1016/j.scitotenv.2011.11.043, 2012.
Ge, J., Torres, R., Chen, C., Liu, J., Xu, Y., Bellerby, R., Shen, F., Bruggeman, J., and Ding, P.: Influence of suspended sediment front on nutrients and phytoplankton dynamics off the Changjiang Estuary: A FVCOM-ERSEM coupled model experiment, J. Marine Syst., 204, 103292, https://doi.org/10.1016/j.jmarsys.2019.103292, 2020.
Hagy, J. D., Boynton, W. R., and Jasinski, D. A.: Modelling phytoplankton deposition to Chesapeake Bay sediments during winter-spring: interannual variability in relation to river flow, Estuar. Coast. Shelf S., 62, 25–40, https://doi.org/10.1016/j.ecss.2004.08.004, 2005.
Hong, B., Liu, Z., Shen, J., Wu, H., Gong, W., Xu, H., and Wang, D.: Potential physical impacts of sea-level rise on the Pearl River Estuary, China, J. Marine Syst., 201, 103245, https://doi.org/10.1016/j.jmarsys.2019.103245, 2020.
Howarth, R., Chan, F., Conley, D. J., Garnier, J., Doney, S. C., Marino, R., and Billen, G.: Coupled biogeochemical cycles: eutrophication and hypoxia in temperate estuaries and coastal marine ecosystems, Front. Ecol. Environ., 9, 18–26, https://doi.org/10.1890/100008, 2011.
Hu, J. and Li, S.: Modeling the mass fluxes and transformations of nutrients in the Pearl River Delta, China, J. Marine Syst., 78, 146–167, https://doi.org/10.1016/j.jmarsys.2009.05.001, 2009.
Hu, J., Li, S., and Geng, B.: Modeling the mass flux budgets of water and suspended sediments for the river network and estuary in the Pearl River Delta, China, J. Marine Syst., 88, 252–266, https://doi.org/10.1016/j.jmarsys.2011.05.002, 2011.
Hu, J., Zhang, Z., Wang, B., and Huang, J.: Long-term spatiotemporal variations in and expansion of low-oxygen conditions in the Pearl River estuary: a study synthesizing observations during 1976–2017, Biogeosciences, 18, 5247–5264, https://doi.org/10.5194/bg-18-5247-2021, 2021.
Huang, Y.-G., Yang, H.-F., Jia, J.-J., Li, P., Zhang, W.-X., Wang, Y. P., Ding, Y.-F., Dai, Z.-J., Shi, B.-W., and Yang, S.-L.: Declines in suspended sediment concentration and their geomorphological and biological impacts in the Yangtze River Estuary and adjacent sea, Estuar. Coast. Shelf S., 265, 107708, https://doi.org/10.1016/j.ecss.2021.107708, 2022.
Kasai, M., Brierley, G. J., Page, M. J., Marutani, T., and Trustrum, N. A.: Impacts of land use change on patterns of sediment flux in Weraamaia catchment, New Zealand, Catena, 64, 27–60, https://doi.org/10.1016/j.catena.2005.06.014, 2005.
Lai, Y., Jia, Z., Xie, Z., Li, S., and Hu, J.: Water quality changes and shift in mechanisms controlling hypoxia in response to pollutant load reductions: A case study for Shiziyang Bay, Southern China, Sci. Total Environ., 842, 156774, https://doi.org/10.1016/j.scitotenv.2022.156774, 2022.
Laurent, A., Fennel, K., Ko, D. S., and Lehrter, J.: Climate change projected to exacerbate impacts of coastal eutrophication in the northern Gulf of Mexico, J. Geophys. Res.-Oceans, 123, 3408–3426, https://doi.org/10.1002/2017JC013583, 2018.
Lee, Z.-P., Du, K.-P., and Arnone, R.: A model for the diffuse attenuation coefficient of downwelling irradiance, J. Geophys. Res.-Oceans, 110, https://doi.org/10.1029/2004JC002275, 2005.
Li, D., Gan, J., Hui, C., Yu, L., Liu, Z., Lu, Z., Kao, S.-J., and Dai, M.: Spatiotemporal Development and Dissipation of Hypoxia Induced by Variable Wind-Driven Shelf Circulation off the Pearl River Estuary: Observational and Modeling Studies, J. Geophys. Res.-Oceans, 126, e2020JC016700, https://doi.org/10.1029/2020JC016700, 2021.
Li, G., Liu, J., Diao, Z., Jiang, X., Li, J., Ke, Z., Shen, P., Ren, L., Huang, L., and Tan, Y.: Subsurface low dissolved oxygen occurred at fresh- and saline-water intersection of the Pearl River estuary during the summer period, Mar. Pollut. Bull., 126, 585–591, https://doi.org/10.1016/j.marpolbul.2017.09.061, 2018.
Li, X., Lu, C., Zhang, Y., Zhao, H., Wang, J., Liu, H., and Yin, K.: Low dissolved oxygen in the Pearl River estuary in summer: Long-term spatio-temporal patterns, trends, and regulating factors, Mar. Pollut. Bull., 151, 110814, https://doi.org/10.1016/j.marpolbul.2019.110814, 2020.
Liu, Z., Fagherazzi, S., Liu, X., Shao, D., Miao, C., Cai, Y., Hou, C., Liu, Y., Li, X., and Cui, B.: Long-term variations in water discharge and sediment load of the Pearl River Estuary: Implications for sustainable development of the Greater Bay Area, Front. Mar. Sci., 9, 983517, https://doi.org/10.3389/fmars.2022.983517, 2022.
Lu, Z., Gan, J., Dai, M., Liu, H., and Zhao, X.: Joint Effects of Extrinsic Biophysical Fluxes and Intrinsic Hydrodynamics on the Formation of Hypoxia West off the Pearl River Estuary, J. Geophys. Res.-Oceans, 123, 6241–6259, https://doi.org/10.1029/2018jc014199, 2018.
Ma, C., Zhao, J., Ai, B., Sun, S., and Yang, Z.: Machine Learning Based Long-Term Water Quality in the Turbid Pearl River Estuary, China, J. Geophys. Res.-Oceans, 127, e2021JC018017, https://doi.org/10.1029/2021JC018017, 2022.
Ma, R., Chen, Z., Wang, B., Xu, C., Jia, Z., Li, L., and Hu, J.: Spatiotemporal variations and controlling mechanism of low dissolved oxygen in a highly urbanized complex river system, J. Hydrol.: Reg. Stud., 52, 101691, https://doi.org/10.1016/j.ejrh.2024.101691, 2024.
Murphy, R. R., Kemp, W. M., and Ball, W. P.: Long-Term Trends in Chesapeake Bay Seasonal Hypoxia, Stratification, and Nutrient Loading, Estuaries and Coasts, 34, 1293–1309, https://doi.org/10.1007/s12237-011-9413-7, 2011.
Pitcher, G. C., Aguirre-Velarde, A., Breitburg, D., Cardich, J., Carstensen, J., Conley, D. J., Dewitte, B., Engel, A., Espinoza-Morriberón, D., Flores, G., Garçon, V., Graco, M., Grégoire, M., Gutiérrez, D., Hernandez-Ayon, J. M., Huang, H.-H. M., Isensee, K., Jacinto, M. E., Levin, L., Lorenzo, A., Machu, E., Merma, L., Montes, I., Swa, N., Paulmier, A., Roman, M., Rose, K., Hood, R., Rabalais, N. N., Salvanes, A. G. V., Salvatteci, R., Sánchez, S., Sifeddine, A., Tall, A. W., Plas, A. K. v. d., Yasuhara, M., Zhang, J., and Zhu, Z. Y.: System controls of coastal and open ocean oxygen depletion, Prog. Oceanogr., 197, 102613, https://doi.org/10.1016/j.pocean.2021.102613, 2021.
Roman, M. R., Brandt, S. B., Houde, E. D., and Pierson, J. J.: Interactive effects of Hypoxia and temperature on coastal pelagic zooplankton and fish, Front. Mar. Sci., 6, https://doi.org/10.3389/fmars.2019.00139, 2019.
Su, J., Dai, M., He, B., Wang, L., Gan, J., Guo, X., Zhao, H., and Yu, F.: Tracing the origin of the oxygen-consuming organic matter in the hypoxic zone in a large eutrophic estuary: the lower reach of the Pearl River Estuary, China, Biogeosciences, 14, 4085–4099, https://doi.org/10.5194/bg-14-4085-2017, 2017.
Syvitski, J. P. M. and Kettner, A.: Sediment flux and the Anthropocene, Philos. T. R. Soc. A, 369, 957–975, https://doi.org/10.1098/rsta.2010.0329, 2011.
Wang, B., Hu, J., Li, S., and Liu, D.: A numerical analysis of biogeochemical controls with physical modulation on hypoxia during summer in the Pearl River estuary, Biogeosciences, 14, 2979–2999, https://doi.org/10.5194/bg-14-2979-2017, 2017.
Wang, B., Hu, J., Li, S., Yu, L., and Huang, J.: Impacts of anthropogenic inputs on hypoxia and oxygen dynamics in the Pearl River estuary, Biogeosciences, 15, 6105–6125, https://doi.org/10.5194/bg-15-6105-2018, 2018.
Wang, G., Cao, W., Yang, Y., Zhou, W., Liu, S., and Yang, D.: Variations in light absorption properties during a phytoplankton bloom in the Pearl River estuary, Cont. Shelf. Res., 30, 1085–1094, https://doi.org/10.1016/j.envres.2021.111579, 2010.
Wang, H., Dai, M., Liu, J., Kao, S.-J., Zhang, C., Cai, W.-J., Wang, G., Qian, W., Zhao, M., and Sun, Z.: Eutrophication-Driven Hypoxia in the East China Sea off the Changjiang Estuary, Environ. Sci. Technol., 50, 2255–2263, https://doi.org/10.1021/acs.est.5b06211, 2016.
Wang, J. J., Bouwman, A. F., Liu, X. C., Beusen, A. H. W., Van Dingenen, R., Dentener, F., Yao, Y. L., Glibert, P. M., Ran, X. B., Yao, Q. Z., Xu, B. C., Yu, R. C., Middelburg, J. J., and Yu, Z. G.: Harmful Algal Blooms in Chinese Coastal Waters Will Persist Due to Perturbed Nutrient Ratios, Environ. Sci. Tech. Let., 8, 276–284, https://doi.org/10.1021/acs.estlett.1c00012, 2021.
Wang, K., Chen, J., Jin, H., Li, H., Gao, S., Xu, J., Lu, Y., Huang, D., Hao, Q., and Weng, H.: Summer nutrient dynamics and biological carbon uptake rate in the Changjiang River plume inferred using a three end-member mixing model, Cont. Shelf. Res., 91, 192–200, https://doi.org/10.1016/j.csr.2014.09.013, 2014.
Wang, Y., Wu, H., Lin, J., Zhu, J., Zhang, W., and Li, C.: Phytoplankton Blooms off a High Turbidity Estuary: A Case Study in the Changjiang River Estuary, J. Geophys. Res.-Oceans, 124, 8036–8059, https://doi.org/10.1029/2019jc015343, 2019.
Wei, X., Cai, S., Ni, P.and Zhan, W.: Impacts of climate change and human activities on the water discharge and sediment load of the Pearl River, southern China, 10, https://doi.org/10.1038/s41598-020-73939-8, 2020.
Wen, G., Liang, Z., Xu, X., Cao, R., Wan, Q., Ji, G., Lin, W., Wang, J., Yang, J., and Huang, T.: Inactivation of fungal spores in water using ozone: Kinetics, influencing factors and mechanisms, Water Res., 185, 116218, https://doi.org/10.1016/j.watres.2020.116218, 2020.
Wu, C. S., Yang, S., Huang, S., and Mu, J.: Delta changes in the Pearl River estuary and its response to human activities (1954–2008), Quatern. Int., 392, 147–154, https://doi.org/10.1016/j.quaint.2015.04.009, 2016.
Yang, H., Wang, T., Yang, D., Yan, Z., Wu, J., and Lei, H.: Runoff and sediment effect of the soil-water conservation measures in a typical river basin of the Loess Plateau, Catena, 243, 108218, https://doi.org/10.1016/j.catena.2024.108218, 2024.
Yu, L. and Gan, J.: Reversing impact of phytoplankton phosphorus limitation on coastal hypoxia due to interacting changes in surface production and shoreward bottom oxygen influx, Water Res., 118094 https://doi.org/10.1016/j.watres.2022.118094, 2022.
Yu, L., Fennel, K., and Laurent, A.: A modeling study of physical controls on hypoxia generation in the northern Gulf of Mexico, J. Geophys. Res.-Oceans, 120, 5019–5039, https://doi.org/10.1002/2014JC010634, 2015.
Yu, L., Gan, J., Dai, M., Hui, C., Lu, Z., and Li, D.: Modeling the role of riverine organic matter in hypoxia formation within the coastal transition zone off the Pearl River Estuary, Limnol. Oceanogr., 66, 1–17, https://doi.org/10.1002/lno.11616, 2020.
Zhang, S., Lu, X. X., Higgitt, D. L., Chen, C.-T. A., Han, J., and Sun, H.: Recent changes of water discharge and sediment load in the Zhujiang (Pearl River) Basin, China, Global Planet. Change, 60, 365–380, https://doi.org/10.1016/j.gloplacha.2007.04.003, 2008.
Zhang, Z., Wang, B., Li, S., Huang, J., and Hu, J.: On the Intra-annual Variation of Dissolved Oxygen Dynamics and Hypoxia Development in the Pearl River Estuary, Estuar. Coast., 45, 1305–1323, https://doi.org/10.1007/s12237-021-01022-0, 2022.