the Creative Commons Attribution 4.0 License.
the Creative Commons Attribution 4.0 License.
 | 24 Oct 2025
Quantifying the agricultural footprint on the silicon cycle: insights from silicon isotopes and Ge∕Si ratios
Louis Derry
Julien Bouchez
Silicon (Si) is essential for ecosystem function, supports primary productivity, and is intricately linked to the carbon cycle, which regulates Earth's climate. However, anthropogenic activities, such as agriculture, deforestation, and river damming, have disrupted the natural Si cycle, altering biogenic and dissolved Si fluxes in soils and rivers. Despite the importance of understanding and quantifying human impacts on Si cycling at local and global scales, few studies address these disruptions, leaving a critical knowledge gap. Here, we analyzed the Si isotope composition (δ30Si) and germanium-silicon () ratio dynamics across various Critical Zone compartments – soil, bedrock, water and plants – within the Kervidy-Naizin agricultural catchment observatory, France. Our findings reveal a vertical gradient in δ30Si across the water pool in the Critical Zone, from lighter groundwater (δ30Si = 0.56±0.25 ‰) to heavier soil solutions (δ30Si = 1.50±0.22 ‰). This gradient reflects distinct processes: in deep groundwater, weathering and clay precipitation control δ30Si signatures, while at shallower depths, progressive plant uptake and crop removal further enrich δ30Si in soil solutions. Using a mass balance combining δ30Si and ratios, we quantified Si export from the catchment as plant material, both natural and harvested. Additionally, we assessed Si export from agricultural harvesting using two independent approaches: an elemental mass balance based on riverine chemistry and suspended sediments, and a method incorporating Si isotopic fractionation and soil Si loss indices. The export of plant material, including natural and harvested material, emerged as the largest Si export flux from the catchment, accounting for ∼56 % of the Si solubilized from rock and exceeding dissolved Si export by 3.5 to 5.4 times. Through two independent approaches, we estimated that 30±18 % to 50±19 % of total Si export occurs through harvesting, depending on crop species, with the harvesting flux being 1 to 4 times greater than the dissolved Si flux. Reduction in dissolved Si exports because of agriculture may have significantly impacted downstream ecosystems, where Si availability directly influences primary productivity. Our study highlights how human activities have reshaped the Si cycle in agricultural landscapes.
- Article
(3024 KB) - Full-text XML
-
Supplement
(617 KB) - BibTeX
- EndNote


Silicon (Si) is the second most abundant element in the Earth's crust (28 %) and plays a crucial role in both geochemical and biological systems. In the geosphere, Si is a fundamental component of minerals, while in the biosphere, it serves as a vital nutrient for many organisms. In its dissolved form as ortho-silicic acid (H4SiO4), Si supports both marine and terrestrial ecosystems. In the ocean, dissolved Si (DSi) is absorbed by diatoms to construct their siliceous frustules (Yool and Tyrrell, 2003). On land, Si provides physiological and structural benefits to vascular plants (Epstein, 1999; Guntzer et al., 2012; Ma et al., 2001). DSi is absorbed by roots from soil solutions, transported through the xylem via transpiration, and eventually precipitated as opal phytoliths, primarily in leaves but also distributed throughout other tissues (Hodson et al., 2005; Strömberg et al., 2016; Trembath-Reichert et al., 2015).
Anthropogenic activities, such as land use, deforestation, and river damming, have significantly altered the natural Si cycle, introducing new and complex feedback loops (Vandevenne et al., 2012). In coastal zones, the biogeochemical cycling of Si is highly sensitive to human pressure, particularly river damming and global temperature rise (Laruelle et al., 2009). Empirical evidence from deforestation experiments at the Hubbard Brook Experimental Forest supports these findings, showing that land clearance can elevate dissolved Si levels, which is coupled with increased losses of amorphous silica (ASi) contained in phytoliths through erosion (Conley et al., 2008).
The conversion of natural ecosystems to agricultural land and the subsequent harvesting of crops significantly alters the Si cycle, as land use influences Si mobilization and storage. For instance, in European temperate forests that have been cultivated for over 250 years, land use is identified as the most significant factor controlling Si mobilization, reducing baseflow Si delivery by two- to threefold (Struyf et al., 2010). Similarly, Clymans et al. (2011) showed that forests exhibit approximately double the ASi levels compared to disturbed land, such as arable fields, pastures, and grazed forests. They estimated that human disturbance has caused a 10 % decline in total ASi storage in soils since the onset of agricultural development around 3000 BCE.
Terrestrial plants produce approximately 84 Tmol of biogenic Si (BSi) annually, with agricultural crops accounting for about 35 % of this production due to their large biomass and high Si concentrations (Carey and Fulweiler, 2016). Crop plants such as rice, maize, wheat, barley, and sugarcane (all in the Poacea family) accumulate significant Si, exceeding concentrations of 10 mg Si g−1 (of dry weight; Datnoff et al., 2001). Consequently, cultivation and harvest lead to the rapid depletion of the phytolith pool (Keller et al., 2012), and the export of straw can deplete the soil phytolith pool within a decade (Ma and Takahashi, 2002). Global agricultural activities are estimated to remove approximately 7.8 Tmol of Si per year from landscapes (Matichenkov and Bocharnikova, 2001), a quantity almost equivalent to the 8.1 Tmol of dissolved Si and dissolvable amorphous silica transferred from continents to oceans via rivers (Beusen et al., 2009; Dürr et al., 2011; Frings et al., 2016; Tréguer et al., 2021). Over recent decades, the annual production of BSi by the top 10 global crops has tripled, adding 39 Gmol of Si each year. This increase, referred to as human-appropriated biogenic Si (HABSi), is projected to rise by 22 %–35 % by 2050 due to population growth and land cover changes (Carey and Fulweiler, 2016). Therefore, understanding how land use influences the Si cycle – by locally increasing or decreasing the dissolved Si flux in rivers – is crucial for predicting repercussions in phytoplankton proliferation, carbon cycling, and availability of Si for ecosystem.
Technological advancements in the measurement of stable Si isotopes (δ30Si) and germanium-to-silicon () ratios have significantly improved our understanding of the Si dynamics in terrestrial and aquatic ecosystem (Blecker et al., 2007; Cornelis et al., 2010, 2011; Derry et al., 2005; Ziegler et al., 2005a). Si isotopes are now widely used as tracers in Critical Zone research to quantify the effects of chemical weathering and nutrient cycling (Frings et al., 2021a, b; Guertin et al., 2024). Silicon has three naturally occurring stable isotopes – 28Si (92.23 %), 29Si (4.67 %) and 30Si (3.10 %) – whose fractionation at low temperatures is mainly driven by water-rock interactions and biological processes. Significant Si fractionation occurs during secondary mineral formation (Ziegler et al., 2005a, b), the adsorption of Si to Fe and Al oxides (Delstanche et al., 2009; Oelze et al., 2014; Opfergelt et al., 2009), and the precipitation of amorphous silica (Fernandez et al., 2019; Roerdink et al., 2015; Stamm et al., 2019). Vascular plants absorb Si through specialized root transporters, such as Lsi1 and Lsi2 (Ma et al., 2007; Ma and Yamaji, 2006), with lighter Si isotopes preferentially incorporated into the plant (Ding et al., 2005; Frick et al., 2020). A second fractionation step occurs during phytolith formation through silica polymerization, where lighter isotopes are again preferentially incorporated. This selective uptake leads to further fractionation within plant tissues, with the extent of fractionation varying among species, as demonstrated by studies on banana (Opfergelt et al., 2006), rice (Ding et al., 2005), bamboo (Ding et al., 2008), or wheat (Frick et al., 2020; Ziegler et al., 2005a).
Because of the similar directions of Si isotope fractionation during water-rock interactions and biological cycling, other tracers are required to resolve potential ambiguity during identification of processes through which Si isotope fractionate. ratios can serve as such an additional tracer (Derry et al., 2005; Fernandez et al., 2022; Kurtz et al., 2002; Scribner et al., 2006). During secondary mineral formation, Ge is preferentially incorporated relative to Si, resulting in high ratios in the mineral phase (Kurtz et al., 2002; Murnane and Stallard, 1990). Additionally, Ge partitioning is influenced by its adsorption onto hydrous iron oxides and Al oxyhydroxides (Anders et al., 2003; Pokrovsky et al., 2006). ratios have been also used to trace biological processes. While some studies suggest that Ge is discriminated against Si during vascular plant uptake (Blecker et al., 2007; Derry et al., 2005; Lugolobi et al., 2010; Meek et al., 2016), other research indicates that plant biomass as a whole does not exhibit as strong a discrimination (Delvigne et al., 2009; Frings et al., 2021b; Kaiser et al., 2020; Rains et al., 2006; Sparks et al., 2011).
Hence, combining measurements of ratios and δ30Si offers a powerful tool for investigating the impact of agriculture on the Si cycle. Studies using these tracers have reached significant findings: Vandevenne et al. (2015) documented a depletion of light Si isotopes in soil water from intensive croplands and managed grasslands (δ30Si = 1.3 ‰–1.8 ‰) compared to native forests (δ30Si = −0.1 ‰–1.4 ‰). In the Kaveri River basin (India), Sarath et al. (2022) attributed an enrichment of approximately +1.06 ‰ in the δ30Si river signature to uptake by plants and the return of Si-depleted flow from irrigated agriculture. In the Amazon, the conversion of forest to cropland was found to increase water percolation in the soil, leading to enhanced weathering of deeper soil layers and a greater contribution of mineral weathering to stream waters (Ameijeiras-Mariño et al., 2018).
Despite the significance of these findings, quantitative studies on the impact and quantification of land use on the Si cycle remain scarce, and there is still a substantial gap in our understanding and quantification on how land use, particularly agriculture, affects Si cycling on a local and global scale. This study aims to address this gap by investigating Si isotopes and ratios in a small agricultural catchment in Brittany, France. We aim to quantify the fraction of silica removed from the catchment through crop harvesting. By integrating Si concentration, ratio, and δ30Si data from different compartments of the Critical Zone, we employ an elemental and isotopic mass balance model to determine the fractions of Si exported through soil erosion, chemical weathering as dissolved Si, and agricultural harvesting. This study offers critical insight into the broader implications of land use on the Si cycle, enhancing our understanding of how these processes influence Si availability, ecosystem health, and global biogeochemical cycles.
2.1 The agricultural Kervidy-Naizin catchment
Located in Brittany, France, the study site encompasses the 4.8 km2 headwater Kervidy-Naizin catchment, which is part of the ORE ArgHys observatory (Fovet et al., 2018). The ORE ArgHys observatory is integrated into the National Research Infrastructure (RI) of the French Critical Zone initiative, OZCAR-RI (Observatoires de la Zone Critique–Application et Recherche; Gaillardet et al., 2018). This catchment is characterized by intensive agriculture, including mixed cropping systems primarily consisting of maize and wheat, as well as indoor dairy and pig farming. The climate is temperate and humid, with an average annual temperature of 11.2±0.6 °C and 853±210 mm which fall exclusively as rain. Penman potential evapotranspiration is estimated at 697±57 mm yr−1 and the runoff is about 340±169 mm yr−1 (Fovet et al., 2018).
The catchment is situated on fissured and fractured Brioverian schist (530 Ma), comprising a monotonous and rhythmically bedded succession of dominant siltstones and sandstones (Thomas et al., 2009, Pellerin et al., 1994, Van Vliet-Lanoë et al., 1998). The schist is primarily composed of quartz, muscovite, chlorite, and, to a lesser extent, K-feldspar and plagioclase. Pyrite is the main accessory mineral below a depth of 7 m, with secondary solid phases including illite, smectite, and Fe(II) hydroxides (Pauwels et al., 1998). Regional catchment-scale (829 km2) denudation rates, estimated through measurements of beryllium-10 (10Be), are 10±1.7 m Ma−1 (Evel catchment; Malcles et al., 2025).
An unconsolidated layer of weathered material, up to 30 m thick, overlays the bedrock and supports a shallow aquifer. Three pools of groundwater are identified in the catchment (Dia et al., 2000; Molenat et al., 2008). Deep Groundwater (DGW), flowing through the fissured schist below the 30 m of unconsolidated and weathered material, is characterized by low nitrate and dissolved organic carbon (DOC), eventually emerging near the stream. Shallow Groundwater (SGW), hosted in the unconsolidated material and weathered schist, occupies depths between 0 and 30 m and exhibits high nitrate concentrations. Finally, Wetland Groundwater (WGW), also hosted in the in the weathered schist and the unconsolidated layer but closer to the stream and wetland is distinguished by its high DOC concentrations.
Soils in the study area can be categorized into three distinct systems following the classification by Walter and Curmi (1998): (i) well-drained soils, (ii) intermediate soils and iii) hydromorphic soils (Fig. 1). The upland regions are characterized by well-drained soils (Brunisols and luvisolic Brunisols) typically exhibiting depths of 60 to 80 cm. There, the water table usually remains a few meters below the surface. Downslope, the water level rises to just a few centimetres below the surface, producing intermediate soils. In the riparian zone, soils are highly hydromorphic, and the water table usually reaches the surface during the wet season, resulting in the development of redoxisols and reductisols. These hydromorphic soils are characterized by a depletion of Fe-oxyhydroxides, high organic matter content, and hydrolytic degradation of clays (Duchaufour, 1982).
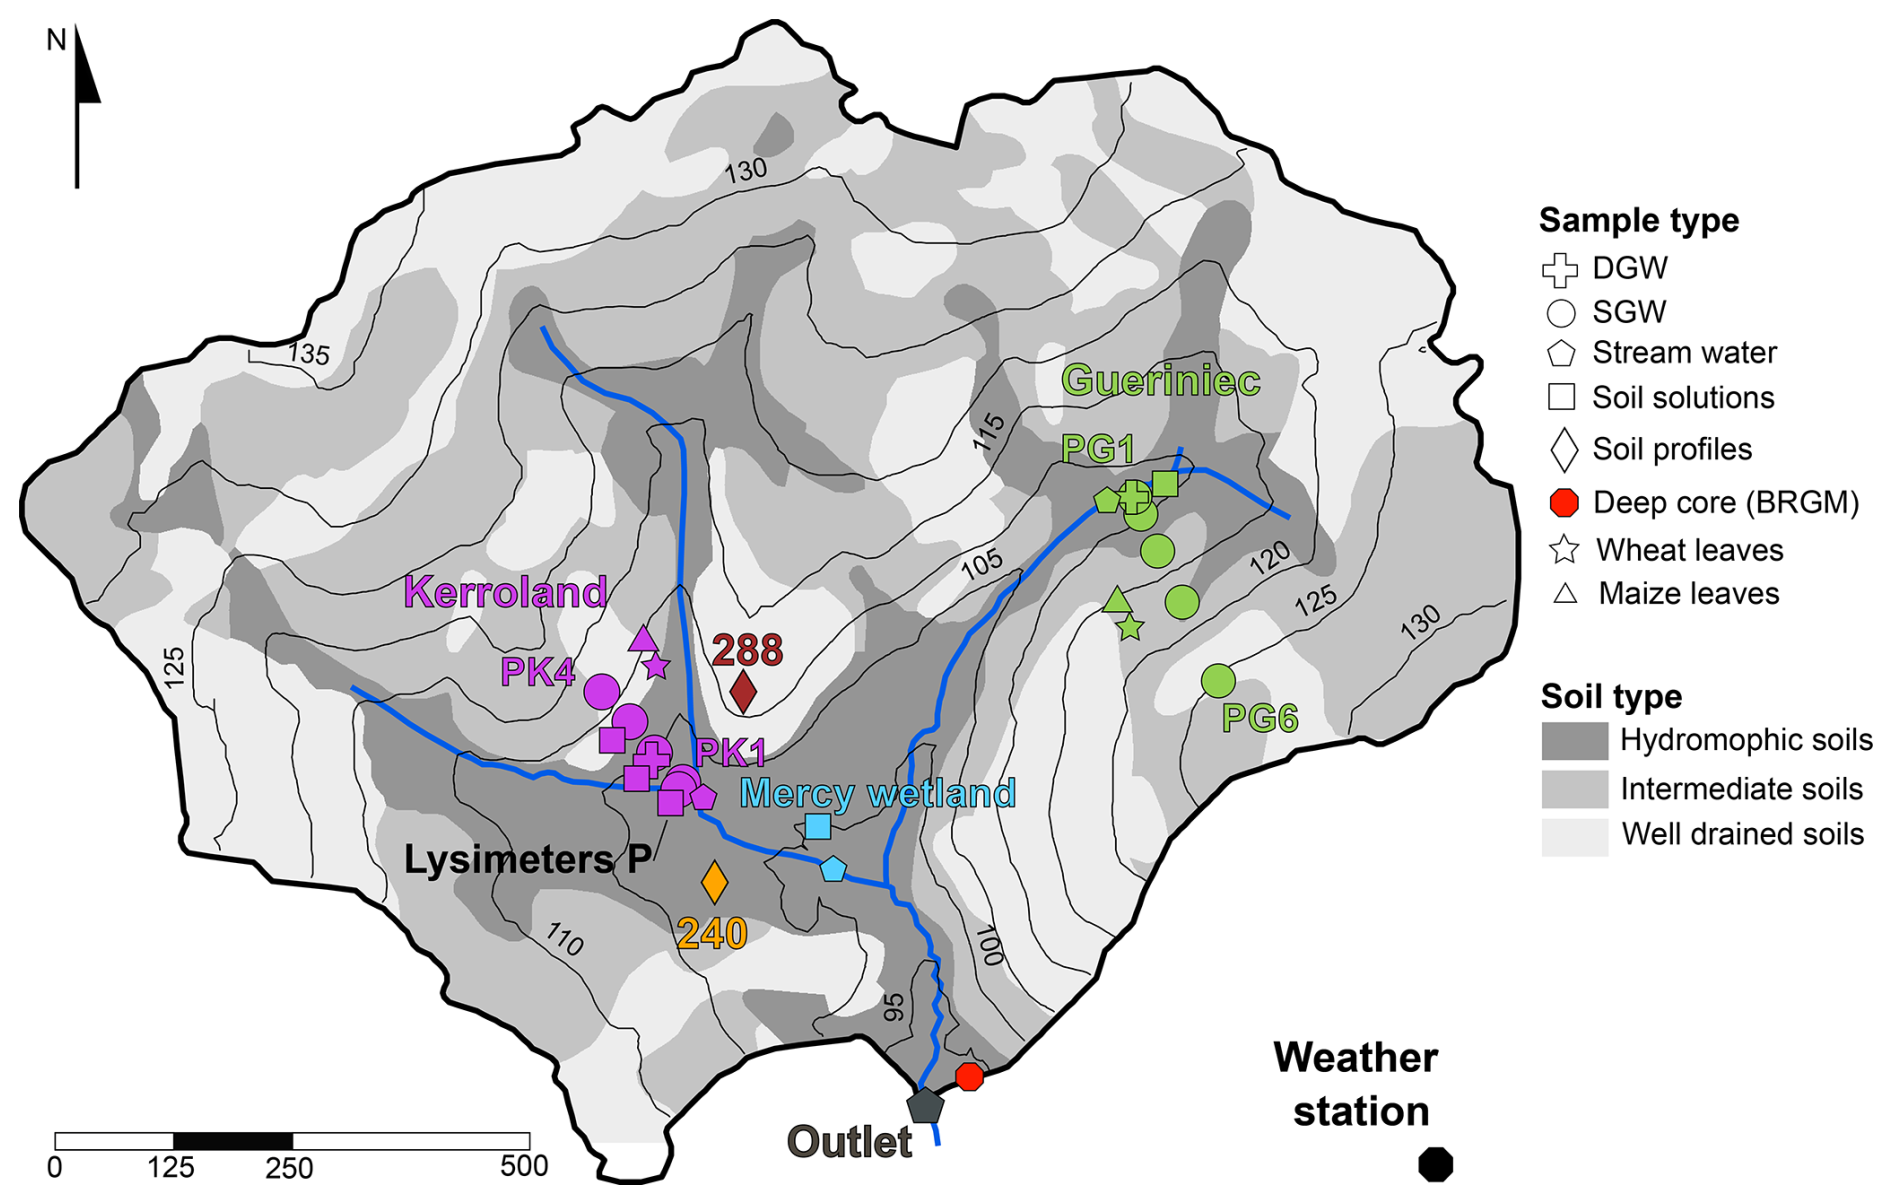
Figure 1Soil map of the Kerdivy-Naizin catchment showing sampling site locations. Symbols denote sample types, including deep groundwater (DGW), shallow groundwater (SGW), stream water, soil solutions, soil profiles, deep core “BRGM” (in red), maize leaves, and wheat leaves. Sample colours indicate specific locations: purple (Kerroland), green (Guériniec), cyan (Mercy Wetland), and gray (outlet). Soil profiles are color-coded: orange for hydromorphic soils and burgundy for well-drained soils. Black lines represent elevation contours (in meters), and blue lines show the stream network.
Pig farming, followed by dairy farming, is the most widespread agricultural operation in the basin (Akkal-Corfini et al., 2014). The crops produced in the basin are intended for bovine and porcine animal feed. In 2020, the most abundant crops, representing 70 % of the agricultural area, were maize (35.8 %), cereals (wheat and barley; 22.6 %), and pastures grasses (11.9 %). There is no irrigation in the catchment, and crop production relies entirely on natural rainfall. Generally, bovine manure is used on site to fertilize the fields. However, pig slurry and poultry manure are partly exported off the farms. The management of crop residues depends on each type. During the harvest of grain maize, the stalks and roots are returned to the soil. In the case of silage maize and cereal straw, the entire above-ground part of the plant is exported out of the basin, and only the roots are left in place.
2.2 Sampling
Sampling was conducted over a period of nine years from different compartments of the Critical Zone, including soil solutions, groundwater, stream water, bedrock, soil, and plants. The catchment is equipped with piezometers and lysimeters along two transects (Figs. 1 and A1 in Appendix A). The “Guériniec transect” (PG), situated in the eastern part of the catchment is equipped with six piezometers and one lysimeter at 50 cm depth. The “Kerroland transect” (PK), located in the southwest part and at a lower elevation than PG, is equipped with six piezometers and six lysimeters for sampling soil solution at different depths from 10 to 100 cm. The Mercy wetland is equipped with a lysimeter sampling pore water at depths of 10 and 50 cm depth. Stream water was collected from four locations: at the outlet (“Riv Ex”), near the Mercy wetland (“Riv M”), and at the foot of each transect (“Riv K” and “Riv G”). Additionally, in 2023 a new set of lysimeters, named “P”, was temporarily installed at the bottom of the Kerroland transect near the stream. Depending on the field campaign, soil solutions, groundwater, and stream samples were collected to cover different hydrological periods.
Regolith and soil samples were taken from two soil profiles, named “240” and “288” (Fig. 1). The profile 240 was excavated to a depth of 100 cm in hydromorphic soils, while the profile 288, located in the well-drained soils, reached a depth of 90 cm. Four samples, each corresponding to a soil horizon, were collected in each profile. It was not possible to access the drill cuttings form the installation of the piezometers in the catchment. As a proxy for local bedrock composition, a fresh schist fragment found in the vicinity of the Gueriniec transect was collected and analyzed. Additional data on bedrock chemistry reported in Dia et al. (2000) was used in this study. The data includes major and trace element concentrations from drill cuttings of a deep core within the catchment, named “BRGM”, which intercepted fresh schist at a depth of 28 m.
Finally, maize and wheat leaves were collected near both transects, with one sample of each species taken from each transect.
3.1 Elemental analyses
The chemical composition of soil and regolith samples was determined by X-ray fluorescence spectrometry using an X Epsilon 3XL Panalytical spectometer equipped with a silver anticathode, with uncertainties for Al, Si, Ti, and Fe concentrations ≈1 %. The mineralogy of soil and bedrock samples was determined through X-Ray Diffraction (XRD) using an Empyrean Panalytical diffractometer equipped with a copper anticathode (wavelength Cu Å; 45 keV) at the Chemistry Department of Université Paris Cité. Quantitative mineral analysis was conducted using Maud software (Lutterotti, 2000). Organic matter content in soil samples was determined using the dry combustion method, which converts all carbon present in the sample into carbon dioxide. The sample is heated to approximately 1000 °C in the presence of oxygen, and after chromatographic separation, the amount of carbon dioxide produced is quantified using a catharometer (thermal conductivity detector). The organic matter content is then calculated by multiplying the organic carbon by 1.72, based on the assumption that soil organic matter contains 58 % carbon (Pribyl, 2010). The measurements were conducted at the Laboratoire d'Analyses des Sols, INRAE, France.
Water samples were analyzed for major cations, anions, dissolved silica, dissolved organic carbon (DOC), and trace metals. Anion (Cl−, NO, SO42−) concentrations were analyzed by ion chromatography (DIONEX DX 100) with uncertainties ≈1 %. Major cations, trace metals, and total dissolved Si concentrations were measured using an Agilent 7900 Inductively Coupled Plasma Mass Spectrometer (ICP-MS); spectral interferences on mass 28 for Si were mitigated by the use of an integrated collision cell with He. The analytical precision for elemental analysis is <5 % based on the long-term measurement of the SLRS-5 reference material (National Research Council, Canada). DOC concentrations were determined with a Shimadzu TOC-VCSH Total Organic Carbon analyzer. All the measurements of dissolved species were performed at the PARI platform of the Institut de Physique du Globe de Paris (IPGP).
3.2 Extraction of oxide phases
We measured the presence of iron, aluminum (Al), and Si in both amorphous and crystalline oxide forms to assess the absorption of Si into oxide minerals, as this process induces Si isotopic fractionation. These extractions were carried out following two specific protocols, at the Laboratoire d'Analyses des Sols, INRAE. Amorphous Al-Si phases were assessed using extraction by oxalic acid and ammonium oxalate solution buffered to pH 3 (Tamm, 1932). Approximately 1.25 g of soil ground to 250 µm was agitated for 4 h in the presence of 50 mL of reagent, at 20 °C in the dark. Crystalline Fe and Al oxides were extracted using a sodium citrate-bicarbonate-dithionite (CBD) solution at elevated temperatures (Mehra and Jackson, 2015). This method targets Fe oxides and oxyhydroxides, with minimal dissolution (<5 %) of Fe present in silicate minerals (Jeanroy, 1983). Approximately 0.5 g of soil ground to 250 µm was mixed with 25 mL of the extraction solution. After adding 1.5 mL of the reducing solution, the mixture was heated to 80 °C in a water bath for 30 min with intermittent agitation. After cooling, the volume was adjusted to 50 mL, homogenized, and filtered. For both extraction methods, the quantities of Al, Si, and Fe in the filtered extracts were measured by Inductively Coupled Plasma Atomic Emission Spectrometry (ICP-AES) at the Laboratoire des Analyses de Sols, INRAE.
3.3 Digestion
Before digestion, separation of the clay fraction for two samples was achieved through a centrifugation method, which followed the procedure outlined by the US Geological Survey (USGS) based on Stokes' Law (U.S. Geological Survey, 2001).
To digest clays, soil, rocks, and leaf samples, we followed an alkaline fusion method adapted from Georg et al. (2006). Prior to alkaline fusion, soil and leaf samples were ashed to eliminate organic matter. The samples were heated in ceramic crucibles at 200 °C for 2 h, followed by an additional heating for 4 h at 600 °C.
For each sample we weighed between 5 and 10 mg of powdered material in Ag crucibles and added NaOH pellets (analytical grade, Merck) while maintaining a sample NaOH weight ratio. The crucibles were heated at 720 °C for 12 min in a muffle furnace, and left to cool down to 300 °C. Subsequently, the content of the crucibles was transferred into a Teflon vial with 15 mL of MilliQ® water, closed and left for 24 h at room temperature. The solution was then transferred into LDPE bottles, and the Teflon vial containing the crucible was filled with 10 mL of MilliQ® water and sonicated for 15 min before transferring the solution into the same bottle. This step was repeated three times to ensure complete recovery from the crucible. Finally, the sample was diluted to a Si concentration of less than 30 ppm (to avoid precipitation of silica) and adjusted to a matrix of 0.2N HNO3, ready for Si purification. For clay fractions, elemental chemistry was determined after alkaline fusion using an Agilent 7900 Inductively Coupled Plasma Mass Spectrometer (ICP-MS).
3.4 Si isotopes
We employed a Si purification column chemistry protocol described in detail in López-Urzúa et al. (2024). Prior to Si purification, samples with a were subject to UV photolysis to decompose DOC and prevent matrix effects during Si isotope measurements (López-Urzúa et al., 2024).
The Si isotope composition was measured with a Thermo Finnigan Neptune Plus MC-ICP-MS (IPGP, France). Measurements were performed in “wet” plasma mode using a Stable Introduction System (SIS) composed of a quartz spray chamber, with an uptake rate of ∼100 µL min−1. Isotopes 28Si, 29Si and 30Si were simultaneously collected in three Faraday cups (L4, L1 and H2, respectively) equipped with 1011Ω amplifiers. The “medium” resolution entrance slit ( 5 %–95 % peak height ) was employed to effectively separate polyatomic interferences. The samples were analyzed at a Si concentration of 1 ppm, with typical signal intensities for 28Si+ ranging from 9 to 11 V. Si isotopic compositions are reported in the standard per mil notation. δ30Si (‰) and δ29Si (‰) were calculated by standard-sample bracketing using NBS-28 as the bracketing standard. One measurement consisted of 25 cycles of 4.194 s integration time. Each sample was measured multiple times and the reported delta values correspond to the average of the n consecutive measurements (n= 4 to 8). Uncertainties on the δ30Si values are reported as the 95 % confidence interval (CI 95 %) using Student's law.
The three-isotope plot of Si shows that all the data obtained in the present study plot along the mass-dependent fractionation line (Fig. S1 in the Supplement). The long-term accuracy and precision were checked with routine measurements of the certified USGS basalt standard (BHVO-2), as well as the Diatomite and Big Batch standards during the different analytical sessions. The δ30Si obtained on BHVO-2 ( ‰, 2 SD, n=237), Diatomite (1.30±0.17 ‰, 2 SD, n=155) and Big Batch ( ‰, 2 SD, n=69) agree with previously published values (BHVO-2: Delvigne et al., 2021; Jochum et al., 2005; Big Batch and Diatomite: Reynolds et al., 2007).
3.5 ratios
Ge concentrations were measured using isotope-dilution hydride generation ICP-MS. Samples were prepared by mixing approximately 10 mL of sample with an enriched solution of 70Ge spike () to target a ratio near 9.5. Spiked samples were left to sit at room temperature for at least 24 h to allow sufficient equilibration of the spike with the sample. Germanium was analyzed using a CETAC HGX200 hydride generation system coupled online to a HR-ICP-MS Element II (ThermoScientific) at IPGP. Quantification was performed by isotope dilution using the ratio with corrections for mass bias and signal drift from sample-standard bracketing. At the same time, response curves were established by analysis of Ge standards at 2, 5, 10, 20, 50, 100, and 200 ng L−1. Results from isotope dilution calculations were cross-checked against the standard response curves measured at . ratios for the reference materials NBS-28 and Diatomite are consistent with published values. The ratio obtained for Diatomite (0.70±0.02 µmol mol−1 n=3) and NBS-28 (0.36±0.01 µmol mol−1, n=3) agree with values reported by Frings et al. (2021b) (0.66±0.02 and 0.38±0.05 µmol mol−1, respectively).
A summary of Si concentration, δ30Si and for bedrock, bulk soil, clay fraction, plants, and water samples are given in Table 1 and Fig. 2. Detailed data for individual samples, including water, soil, bedrock, and plants, are available at https://doi.org/10.5281/zenodo.14615156 (López-Urzúa et al., 2025).
To ascertain the provenance of the fresh schist fragment, we compared the insoluble elemental ratio in our sample with those reported for the deep BRGM core (Dia et al., 2000). The ratio for the deep schist (0.044) from the core and the rock fragment (0.053) are similar, indicating that the sampled fragment may indeed be representative of the fresh bedrock. The schist bedrock displays a δ30Si value of ‰ (Table 1), and a ratio of 1.33 µmol mol−1, consistent with abundant quartz (66 %, with µmol mol−1) and muscovite (22 % with to 3.0 µmol mol−1) (Aguirre et al., 2017; Evans and Derry, 2002).
Table 1Summary of Si concentration, δ30Si, , and ratios for the different Critical Zone compartments of the Kervidy-Naizin catchment.
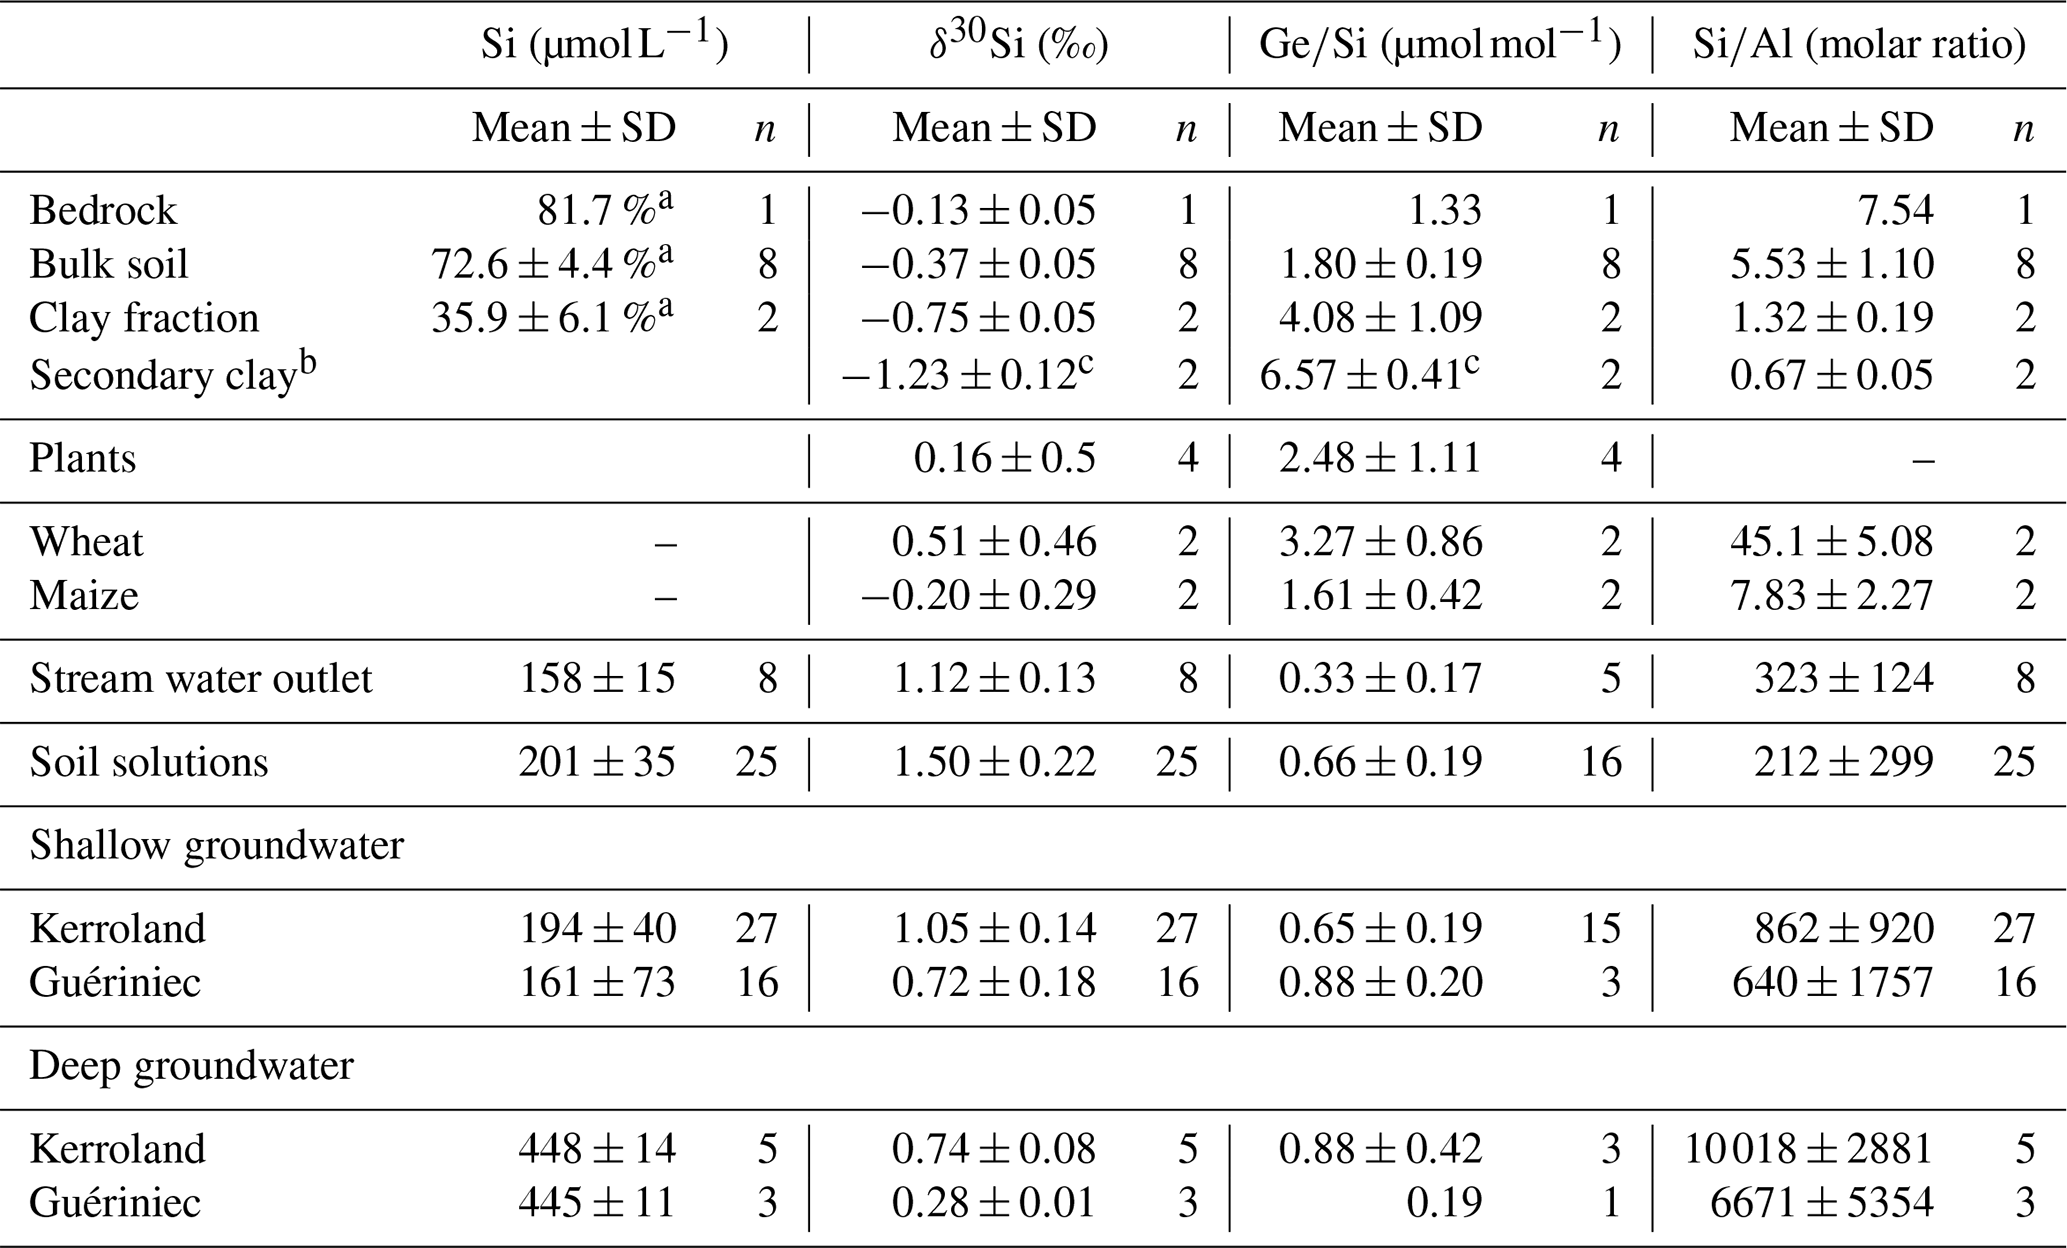
a SiO2 (%), b clay fraction corrected by the contents of primary minerals (muscovite, microcline and quartz), refer to Appendix B, c Uncertainty obtained through gaussian error propagation.
The bulk soil samples displayed consistent values across both soil profiles. Soil δ30Si values are consistently low ( ‰), while soil ratios are relatively high (1.80±0.19 µmol mol−1) compared to the bedrock (Table 1), both signatures being consistent with weathering and formation of secondary clays.
The clay fractions show even lighter δ30Si values and higher ratios than the bulk soil, with mean δ30Si values of ‰ and ratios of 4.08±1.09 µmol mol−1 in both soil profiles the well-drained and hydromorphic soil profiles. As the bedrock contains muscovite, it is likely that the separated clay fraction includes primary minerals in addition to secondary clays. The high ratio (0.14–0.15, Table B1) in the clay fraction indicates the presence of muscovite ( = 0.33) alongside with secondary minerals.
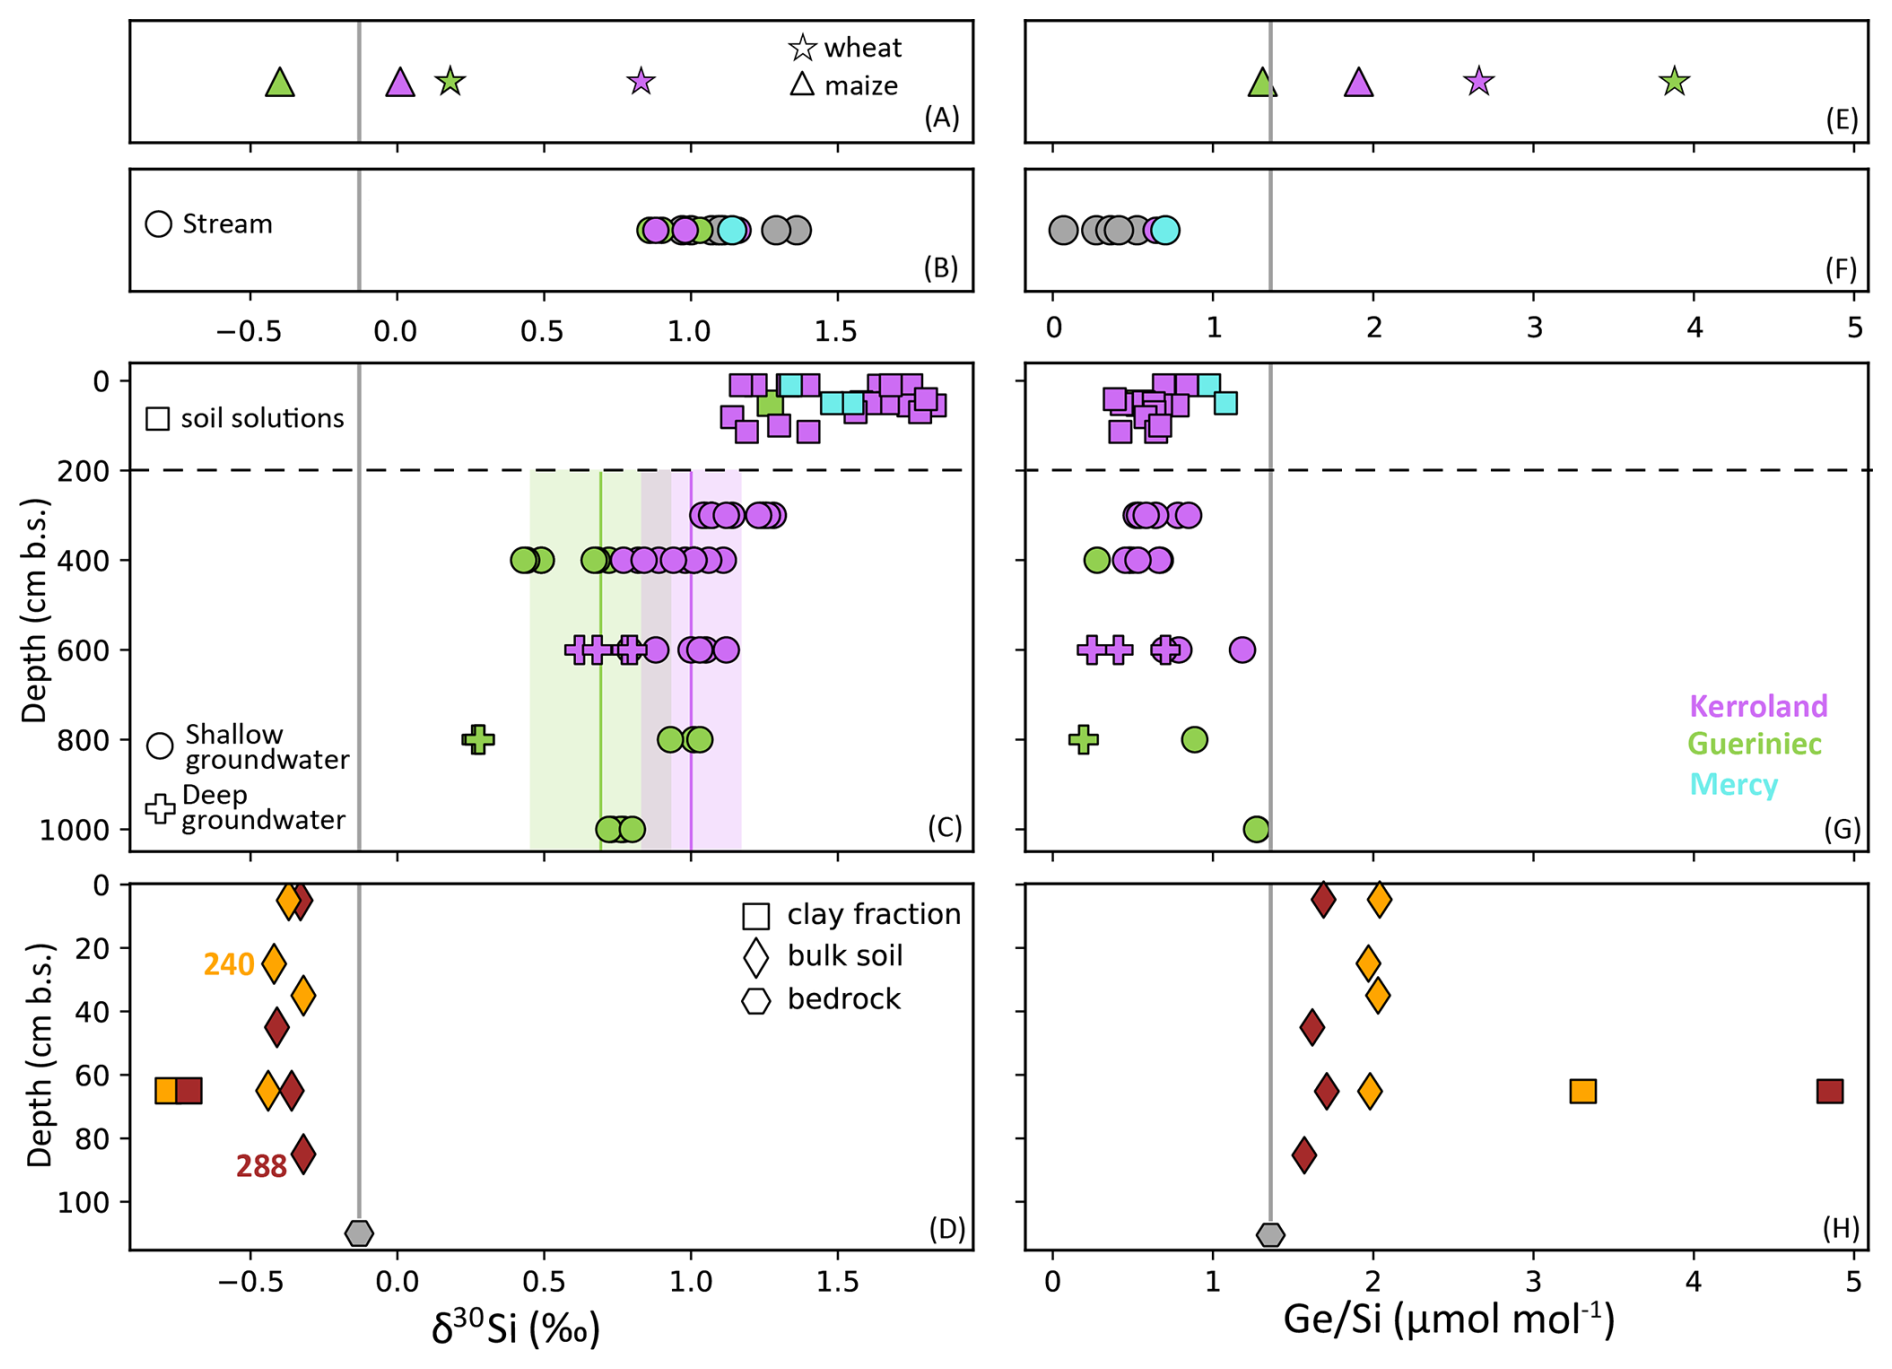
Figure 2Data of δ30Si and ratios across different Critical Zone compartments of the Kervidy-Naizin catchment. Sampling sites are color-coded as follows: Kerroland (purple), Gueriniec (green), Mercy wetland (cyan), and the stream outlet (grey). Samples from soil profiles 288 and 240 are highlighted in burgundy and yellow, respectively. Panels (A) and (E) present data from plant leaves, panels (B) and (F) from stream water, panels (C) and (G) from soil solutions and groundwater, and panels (D) and (H) for rock and regolith samples. In panel (C), vertical lines and shaded areas in purple and green denote the mean and one standard deviation (1 SD) of groundwater data for each transect.
To correct the values obtained for the clay fraction from the presence of primary minerals and isolate the δ30Si and signatures of secondary minerals (kaolinite), we used a simple mixing model (Appendix B). This model assumes that the mineralogy of the clay fraction is composed of quartz (SiO2), kaolinite (Al2Si2O5(OH)4), muscovite (KAl2(AlSi3O10)(OH)2) and microcline (KAlSi3O8) (see details Appendix B). After correction, the values for secondary minerals show a mean δ30Si values of ‰ and a ratios of 6.55±2.50 µmol mol−1, which are comparable to those reported for clays in other catchments, such as tropical granitic (4.8–6.1 µmol mol−1) and temperate humid granitic (6.1–6.3 µmol mol−1) environments (Cornelis et al., 2010; Lugolobi et al., 2010).
Water samples exhibit a broad range of Si concentrations (95 to 465 µmol L−1), with the highest concentrations found in deep groundwater (429 to 464 µmol L−1). In contrast, shallow groundwater, stream, and soil solutions display similar average Si concentrations, which fall between 161 to 201 µmol L−1, without clear differentiation among these types of water.
The δ30Si signatures in water samples exhibit significant variability, ranging from 0.27 ‰ to 1.83 ‰. Two notable trends in δ30Si signatures emerge. First, groundwater from the Guériniec transect consistently exhibits lighter δ30Si values, with a mean of 0.64 ‰, compared to the Kerroland transect, which has heavier signatures averaging 0.99 ‰. Second, a vertical gradient in δ30Si is observed across both groundwater and soil solutions (Fig. 2). δ30Si values progressively increase from deeper to shallower piezometers, reaching their highest values in soil solutions. Deep groundwater (samples PG1 and PK6) display the lightest δ30Si values, with a mean of 0.56 ‰, while shallow groundwater averages 0.92 ‰. Soil solutions exhibit the heaviest δ30Si values, averaging 1.50 ‰. These depth gradients are consistently observed within a given location when comparing nested piezometers and soil solutions (Appendix C; Fig. C1).
The ratios in water samples exhibit a broad range, from 0.07 to 1.27 µmol mol−1. However, unlike for δ30Si, no clear vertical gradient in groundwater ratio is observed. The highest values are found in groundwater from PG5 (mean: 1.27 µmol mol−1) and soil solutions from the Mercy wetland (mean: 1.02 µmol mol−1). Stream samples at the outlet exhibit the lowest ratios, with a mean of 0.33±0.17 µmol mol−1.
Plant samples reveal contrasting patterns in δ30Si signatures and ratios between maize and wheat leaves across the two transects. Maize leaves from both Kerroland and Guériniec transects exhibit lighter δ30Si values and lower ratios compared to wheat leaves (Fig. 2, Table 1). A consistent difference in δ30Si signatures between the transects is observed, with leaves from Kerroland – regardless of the plant species – showing heavier δ30Si values compared to those from Guériniec.
5.1 Controls on δ30Si and dynamics in the Kervidy-Naizin catchment
The three main processes affecting δ30Si and signatures in the Critical Zone are mineral dissolution and/or neoformation of clays (Froelich et al., 1992; Kurtz et al., 2002; Ziegler et al., 2005a, b); Si incorporation into Fe and Al oxyhydroxides (Anders et al., 2003; Delstanche et al., 2009; Oelze et al., 2014; Opfergelt et al., 2009; Pokrovsky et al., 2006); and plant uptake and phytolith formation (Blecker et al., 2007; Delvigne et al., 2009; Derry et al., 2005; Ding et al., 2005; Frick et al., 2020; Ma et al., 2007; Ma and Yamaji, 2006; Meek et al., 2016; Opfergelt et al., 2006). In the following subsections, we investigate the influence of these three processes on Si dynamics within the Kervidy-Naizin catchment.
5.1.1 Mineral dissolution and neoformation of clays in groundwater
The combined analysis of δ30Si, and ratios enables the tracking of clay formation and dissolution processes (Fig. 3). Assuming incongruent dissolution of the bedrock – where silicon is preferentially released from more reactive minerals such as plagioclase, muscovite, and chlorite, while quartz is considered inert – and after correcting for quartz content, the initial water composition resulting from primary mineral dissolution is expected to reflect the non-quartz fraction of the rock. This is characterized by a ratio (1.80), δ30Si ( ‰), and a ratio (2.80±0.43 µmol mol−1), detailed quartz correction in Appendix B. However, groundwaters consistently exhibits higher and δ30Si values, along with lower ratios, compared to the presumed initial compositions (Fig. 3 and Table 1), reflecting fractionation driven by clay mineral formation.
Deep groundwater shows the highest ratio (mean = 8762) consistent with clay precipitation. However, samples from the shallow groundwater exhibit lower and higher δ30Si values, suggesting the influence of additional processes, such as plant uptake or precipitation of iron oxyhydroxides. The observed decrease in in the SGW is attributed to a sharp reduction in Si concentration, dropping from a mean value of 446 µmol L−1 in DGW to 181 µmol L−1 in SGW, while Al concentrations exhibit only minor variations. The higher Si concentration in the DGW may be due to its transit through plagioclase- and primary mineral-rich schist, which are prone to weathering.
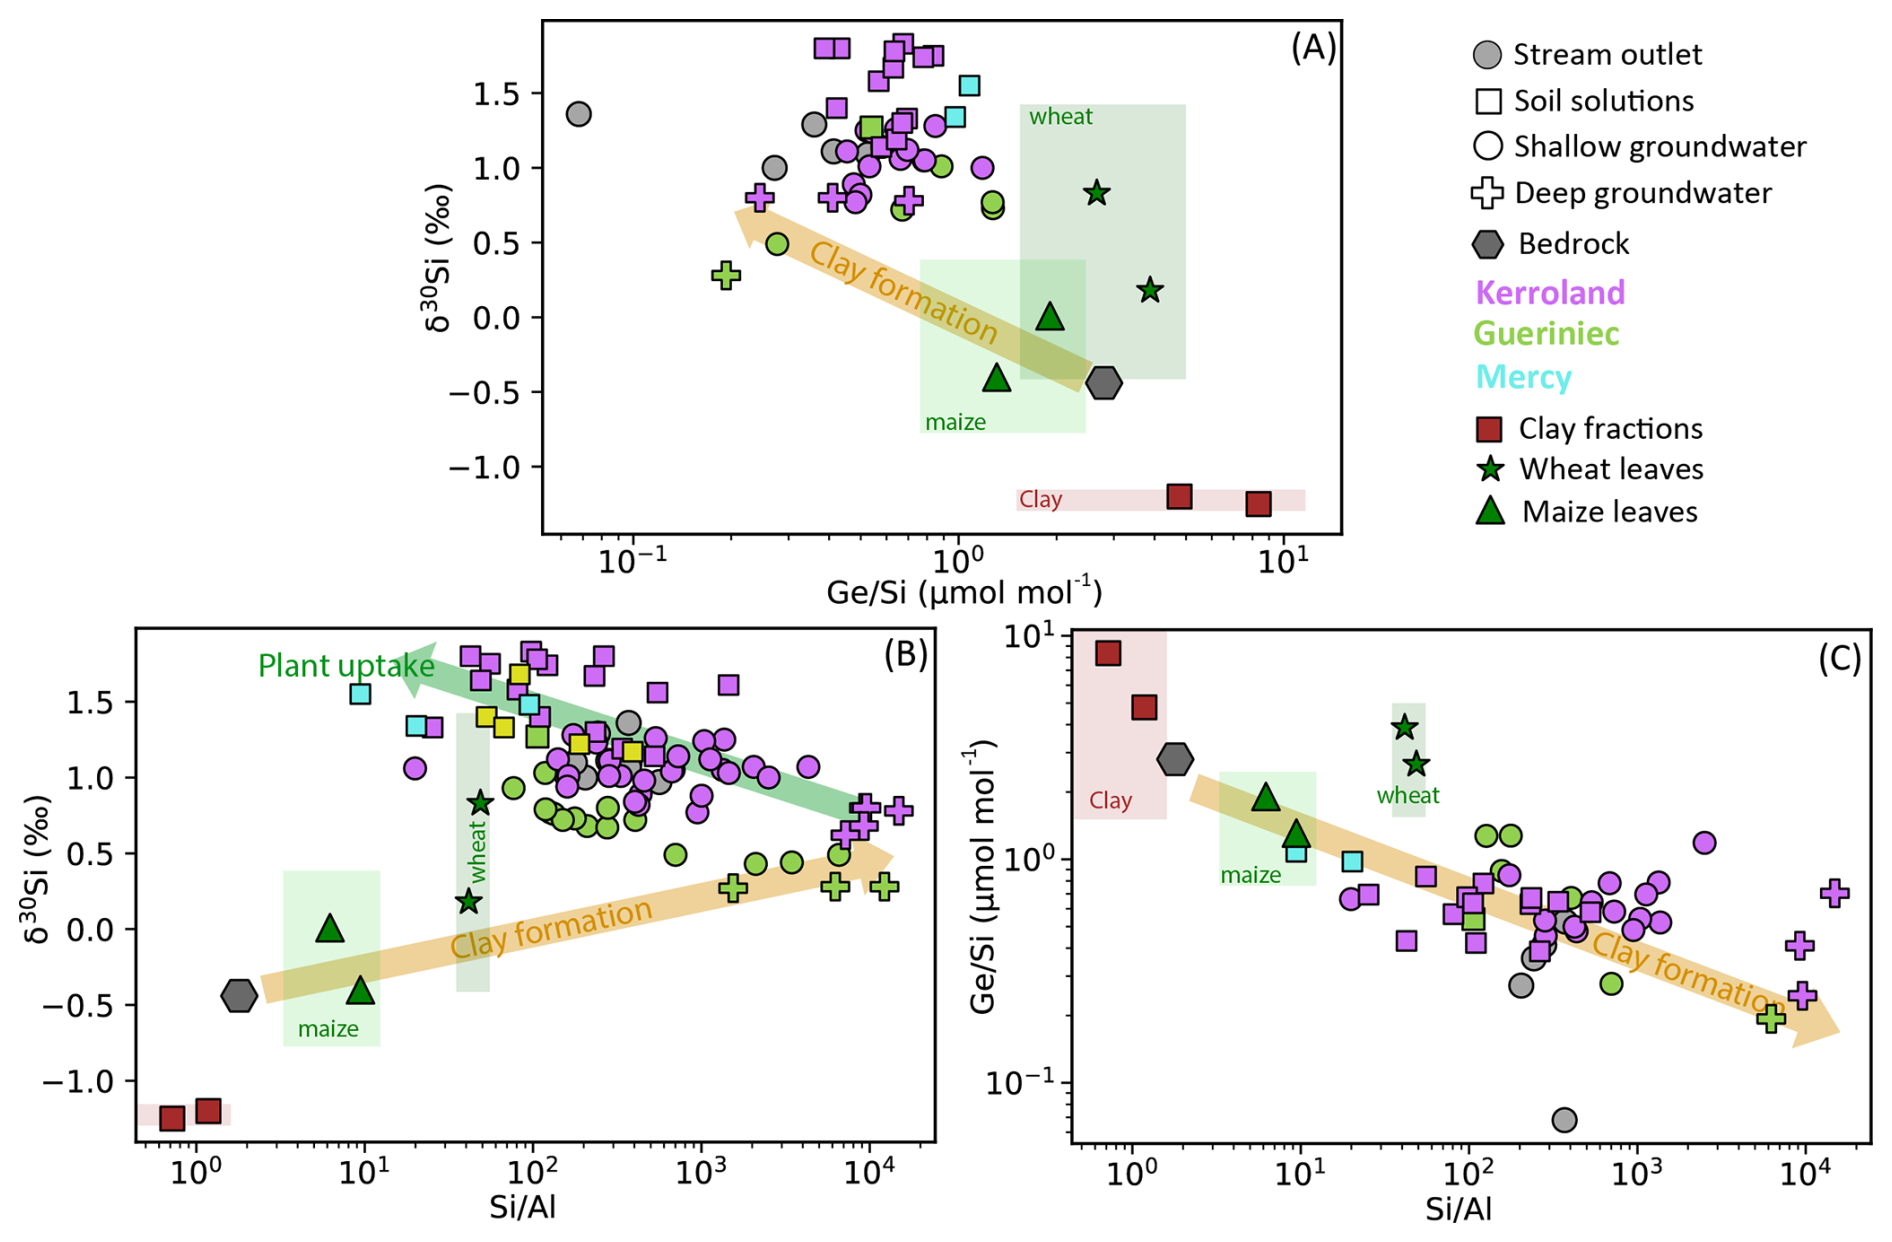
Figure 3Cross plots of dissolved (A) δ30Si and (B) δ30Si and ratios (C) and ratios. Coloured arrows illustrate the presumed trends for clay formation and plant uptake. The slopes of the arrows represent general trends and are not meant to indicate precise relationships. Shaded boxes indicate representative endmembers from the Critical Zone, including measured values of clay fractions (red) and plant leaves – maize (green) and wheat (light green). Each box is centered on the mean value and extends ±2 SD to represent the typical range of variation for each end member.
The lower Si concentration in the SGW may result from the depletion of easily weatherable minerals in the upper horizons. Saturation index calculations show oversaturation of kaolinite and muscovite, and near-equilibrium for quartz, pointing to the absence of easily weatherable minerals in these shallow horizons. A potential source of Si in SGW could be the dissolution of clay minerals facilitated by organic ligands (Berggren and Mulder, 1995; Cama and Ganor, 2006; Drever and Stillings, 1997; Wieland and Stumm, 1992). However, given the relatively low DOC content in SGW and DGW (0–6.2 ppm) this process is unlikely. Additionally, clay dissolution would likely decrease δ30Si in SGW, which contradicts the observed increase (Fig. 3).
In addition to vertical gradients, systematic differences between transects are observed, with groundwater from the Kerroland transect consistently exhibiting heavier δ30Si values and higher ratios than Guériniec (Fig. 2, Table 1). Several factors may contribute to this contrast. The steeper slope in Guériniec likely results in shorter water residence times, limiting the extent of clay precipitation and associated isotopic fractionation. Additionally, subtle differences in bedrock composition between the transects – such as variations in muscovite and chamosite content – may influence the initial isotopic signature of the dissolved Si pool. While current data does not allow us to fully disentangle these factors, both Kerroland and Guériniec display consistent vertical trends in δ30Si and ratios. This indicates that the same underlying processes are operating across the catchment, despite spatial variability in δ30Si values.
5.1.2 Si adsorption onto Fe and Al oxyhydroxides in the soil
In the Kervidy–Naizin catchment, fluctuations in water levels lead to a series of redox processes in the soils of the riparian area (Walter and Curmi, 1998). The catchment exhibits marked seasonal variability, characterized by distinct hydrological periods (Humbert et al., 2015; Molenat et al., 2008). Period B (high flow) is associated with heavy rainfall and rising water tables, which enhance hydrological connectivity across the catchment. In contrast, Period C (recession) marks the onset of drier conditions, with progressively falling water levels. These seasonal dynamics are shown in Fig. A1. δ30Si values in deep groundwater remain relatively stable (±0.2 ‰ over 8 years), indicating limited seasonal influence, while shallow groundwater shows more variability, likely due to stronger coupling with surface processes. During the dry season, oxidizing conditions promote the precipitation of iron oxides, while the wet season reducing conditions lead to the release of Fe. During Si adsorption onto Fe and Al oxyhydroxides, lighter isotopes are preferentially removed, resulting in an increase in the δ30Si in the solution (Delstanche et al., 2009; Oelze et al., 2014; Opfergelt et al., 2009). A similar pattern is observed for ratios, with previous studies reporting the preferential adsorption of Ge onto Al and Fe oxyhydroxides (Anders et al., 2003; Pokrovsky et al., 2006).
If redox processes explained the δ30Si and dynamics in soil solutions, a correlation between Fe and the tracers would be expected. However, for the full dataset of soil solutions (n=25), no significant correlation between δ30Si values and Fe concentrations (R2=0.002) is observed (Appendix C; Fig. C2). In contrast, when analyzing a subset of lysimeters P (n=4) collected simultaneously on the same day, a negative correlation emerges between δ30Si values and Fe concentrations (R2=0.85, after excluding one outlier with the highest δ30Si value). This observation suggests the dissolution of iron oxides and the subsequent release of adsorbed Si may be occurring at this site. Similarly, for the full dataset of soil solutions, ratios are positively correlated with Fe concentrations (R2=0.72), indicating that Ge concentrations in the soil solutions may be influenced by adsorption/desorption onto Fe-oxyhydroxides, followed by subsequent dissolution (Appendix C; Fig. C2).
However, the contribution of a lighter δ30Si pool from poorly crystalline silica and iron oxides is expected to be negligible, as our leaching experiments indicate that these pools account for less than 0.6 % of total Si (Table 2; López-Urzúa et al., 2025). Similarly, the contribution of a high-Ge oxide pool is expected to be minimal, as observed by Scribner et al. (2006) in their study along a climate gradient in Hawaii. The authors concluded that Al-Si phases are the primary host for soil Ge, rather than Fe oxyhydroxides, which do not significantly impact the mass balance.
5.1.3 Plant uptake and removal of crops
The heavy δ30Si signatures observed in our soil solutions as well as in SGW may result from the prolonged uptake of lighter Si isotopes by plants, followed by their removal through harvesting, as in agricultural catchments. This biomass removal prevents the recycling of the phytoliths, unlike in unaltered systems (Derry et al., 2005). In the Kervidy-Naizin catchment, water levels are generally shallow (30–100 cm depth), especially near the riparian zone (PK1-2-5-6 and PG1-2-3) during the growing season, allowing plant root access to groundwater (water level database: https://agrhys.fr/BVE/vidae/, last access: March 2024). The vertical gradient for δ30Si values from DGW to SGW to soil solutions suggests that plants have direct access to groundwater, leading to in situ fractionation of Si isotopes. Alternatively, this trend may reflect the percolation of δ30Si-depleted soil solutions into the saturated zone. While simple mixing between Si-depleted rainwater and Si-rich weathering-derived water could contribute to the observed [Si] gradients, it is unlikely to explain the δ30Si enrichment in soil solutions. This would require rainwater to have a significantly heavier δ30Si signature, which is implausible regarding rain chemical datasets, and difficult to support given the absence of local rain data. Further evidence of plant uptake and harvesting is the low Si concentration in soil solutions and SGW. This decrease in concentration, compared to DGW, could be attributed to crop harvesting and the subsequent removal from the system, resulting in reduced DSi levels (Conley et al., 2008).
The current understanding of Ge-Si during plant uptake suggests that plants generally discriminate against Ge, resulting in lower ratios in plants compared to soil solutions (Blecker et al., 2007; Cornelis et al., 2010; Delvigne et al., 2009; Derry et al., 2005; Lugolobi et al., 2010; Meek et al., 2016). However, our analyses of whole leaf tissue from maize and wheat do not show the expected discrimination of Ge over Si. On the contrary, the ratios measured in the leaves of both crops were higher than those found in groundwater, soil solution and stream water, implying a lack of Ge discrimination during maize and wheat uptake. This finding aligns with the observation from recent studies indicating that when analyzing bulk plant material, plants do not consistently discriminate against Ge during uptake (Frings et al., 2021b; Kaiser et al., 2020). For instance, Delvigne et al. (2009) reported elevated ratios in bulk plant biomass following lithium-borate fusion. Similarly, Frings et al. (2021b) found high ratios in bulk plants (including grasses, spruce and pine trees) from three catchment following NaOH alkaline fusion. Furthermore, experiments tracking Ge and Si in hydroponic growth solutions for horsetail, banana and wheat found no resolvable discrimination during plant uptake (Delvigne et al., 2009; Rains et al., 2006) while in situ imaging studies showed that Ge is often more localized in roots compared to shoots (Sparks et al., 2011). However, in a temperate forest, Meek et al. (2016) observed low ratios in both leaves and sap water of maples (Acer) and oaks (Quercus), along with enriched ratios in soil solutions during the growing season. These contrasting findings indicate that Ge discrimination during plant uptake may vary significantly depending on plant type and environmental conditions. Our results further support the notion that plant uptake of Ge relative to Si is more complex than previously thought and may vary significantly between plant species or functional type.
5.2 Determining Si export from the catchment as biomass using an isotopic mass balance of and δ30Si:
Assuming steady state and incongruent weathering of bedrock, a set of mass balance equations can be formulated for any element and tracer within the weathering zone. This mass balance approach requires a steady state assumption. We recognize that in a human-impacted catchment, internal Si reservoirs – such as amorphous silica, phytoliths, and secondary clays – may experience transient shifts in response to land-use changes. While these changes could impact short-term fluxes, the isotopic coherence observed over multiple hydrological years and seasons (2015, 2017, 2021, 2022, 2023) in the water samples indicates that the system is buffered against such variations in dissolved flux signatures. Additionally, the integration of time-averaged measurements from stream water, groundwater, and soil solutions captures long-term system dynamics, supporting the validity of this assumption (Bouchez et al., 2013). Over longer time scales, the continuous export of Si through biomass harvesting likely depletes solid-phase pools in the lighter isotopes, leading to progressively heavier δ30Si values in soil solutions. However, the solid phases currently present (e.g., clays, soil organic matter) formed at least partly under pre-disturbance conditions, and thus retain isotopically lighter signatures that are out of equilibrium with today's heavier waters. This legacy effect contributes to the observed isotopic contrast between solids and dissolved Si. If this effect were fully corrected for, the dissolved Si pool would appear even heavier, further supporting our interpretation that harvesting drives light Si isotope export. We therefore consider the quasi-steady-state framework a reasonable and robust approximation for interpreting catchment-scale Si fluxes.
The fraction of Si solubilized from the rock can follow three pathways: particulate erosion as secondary mineral, particulate erosion in biogenic material (including natural and harvested biomass), or exported as dissolved Si in the stream. This approach, previously applied for both Si isotopes and ratios (Baronas et al., 2018; Bouchez et al., 2013; Frings et al., 2021a, b; Steinhoefel et al., 2017), is used here to determine the proportions of Si exported as dissolved species (), as secondary minerals (), and as organic material () as shown in the three following catchment-scale mass balance equations:
In these equations, the subscripts “rock-qtz”, “sec”, “org”, and “diss” refer to the ratios and δ30Si signatures of bedrock corrected from quartz content, secondary clay minerals, organic material, and stream, respectively. The term “iso” in the parameters (, , and ) indicates that these values were determined using isotopic signatures of δ30Si and in the mass balance. This system of three equations allows us to solve for the three unknowns: , , and . We used a Monte Carlo approach to account for uncertainties in Si isotopes and ratios. One limitation of our dataset is the small number of total plants (n=4) and clay fractions (n=2) and that the samples are limited to only the leaves and not the full plant biomass. To integrate these uncertainties and ensure interpretations remain robust, particularly regarding plant Si isotope signatures, we implemented three scenarios. For each scenario, normal distributions were assigned to ratios and δ30Si, for secondary clays, bedrock and stream (Table 1). The organic fraction was treated differently across scenarios: in Scenario 1, we applied a uniform distribution based on the whole range of measured plant isotopic signatures to capture their high variability for the dominant crop species (maize and wheat); in Scenario 2, we used a normal distribution based on measurements made on wheat leaves only; and in Scenario 3, we applied a normal distribution derived from measurements on maize only (details in Appendix D). For the clay end member, the consistent δ30Si values observed across contrasting soil types support the representativeness of our values. Although expanding the dataset would further improve these estimates, our modeling framework ensures that the results encompass the full range of plausible variability.
The results of the three scenarios show similar trends in Si partitioning (Table 2 and Fig. 4; see Table D1 for detailed results). In all scenarios, the fraction represents the least significant pool, with values ranging from 0.11 to 0.16. The fraction of presents values around 0.28 to 0.31. The most significant pool of exported Si is found in organic material. The three scenarios produced comparable values within the respective uncertainty ranges, with a mean of 0.59±0.18 for Scenario 1. Scenarios 2 and 3, which use the isotopic signature only from wheat and maize leaves, respectively yielded values of 0.76±0.24, and 0.54±0.17.
Table 2Summary of Si export estimates from three independent approaches. Values are reported as mean ± standard deviation. The isotopic mass balance and soil-based methods are presented across three scenarios based on plant-specific or isotopic fractionation assumptions. The river flux method includes two scenarios: one based on turbidity-derived suspended sediment estimates, and a sensitivity test assuming full quartz erosion. See Tables D1 and F1 for full model parameters and distributions.
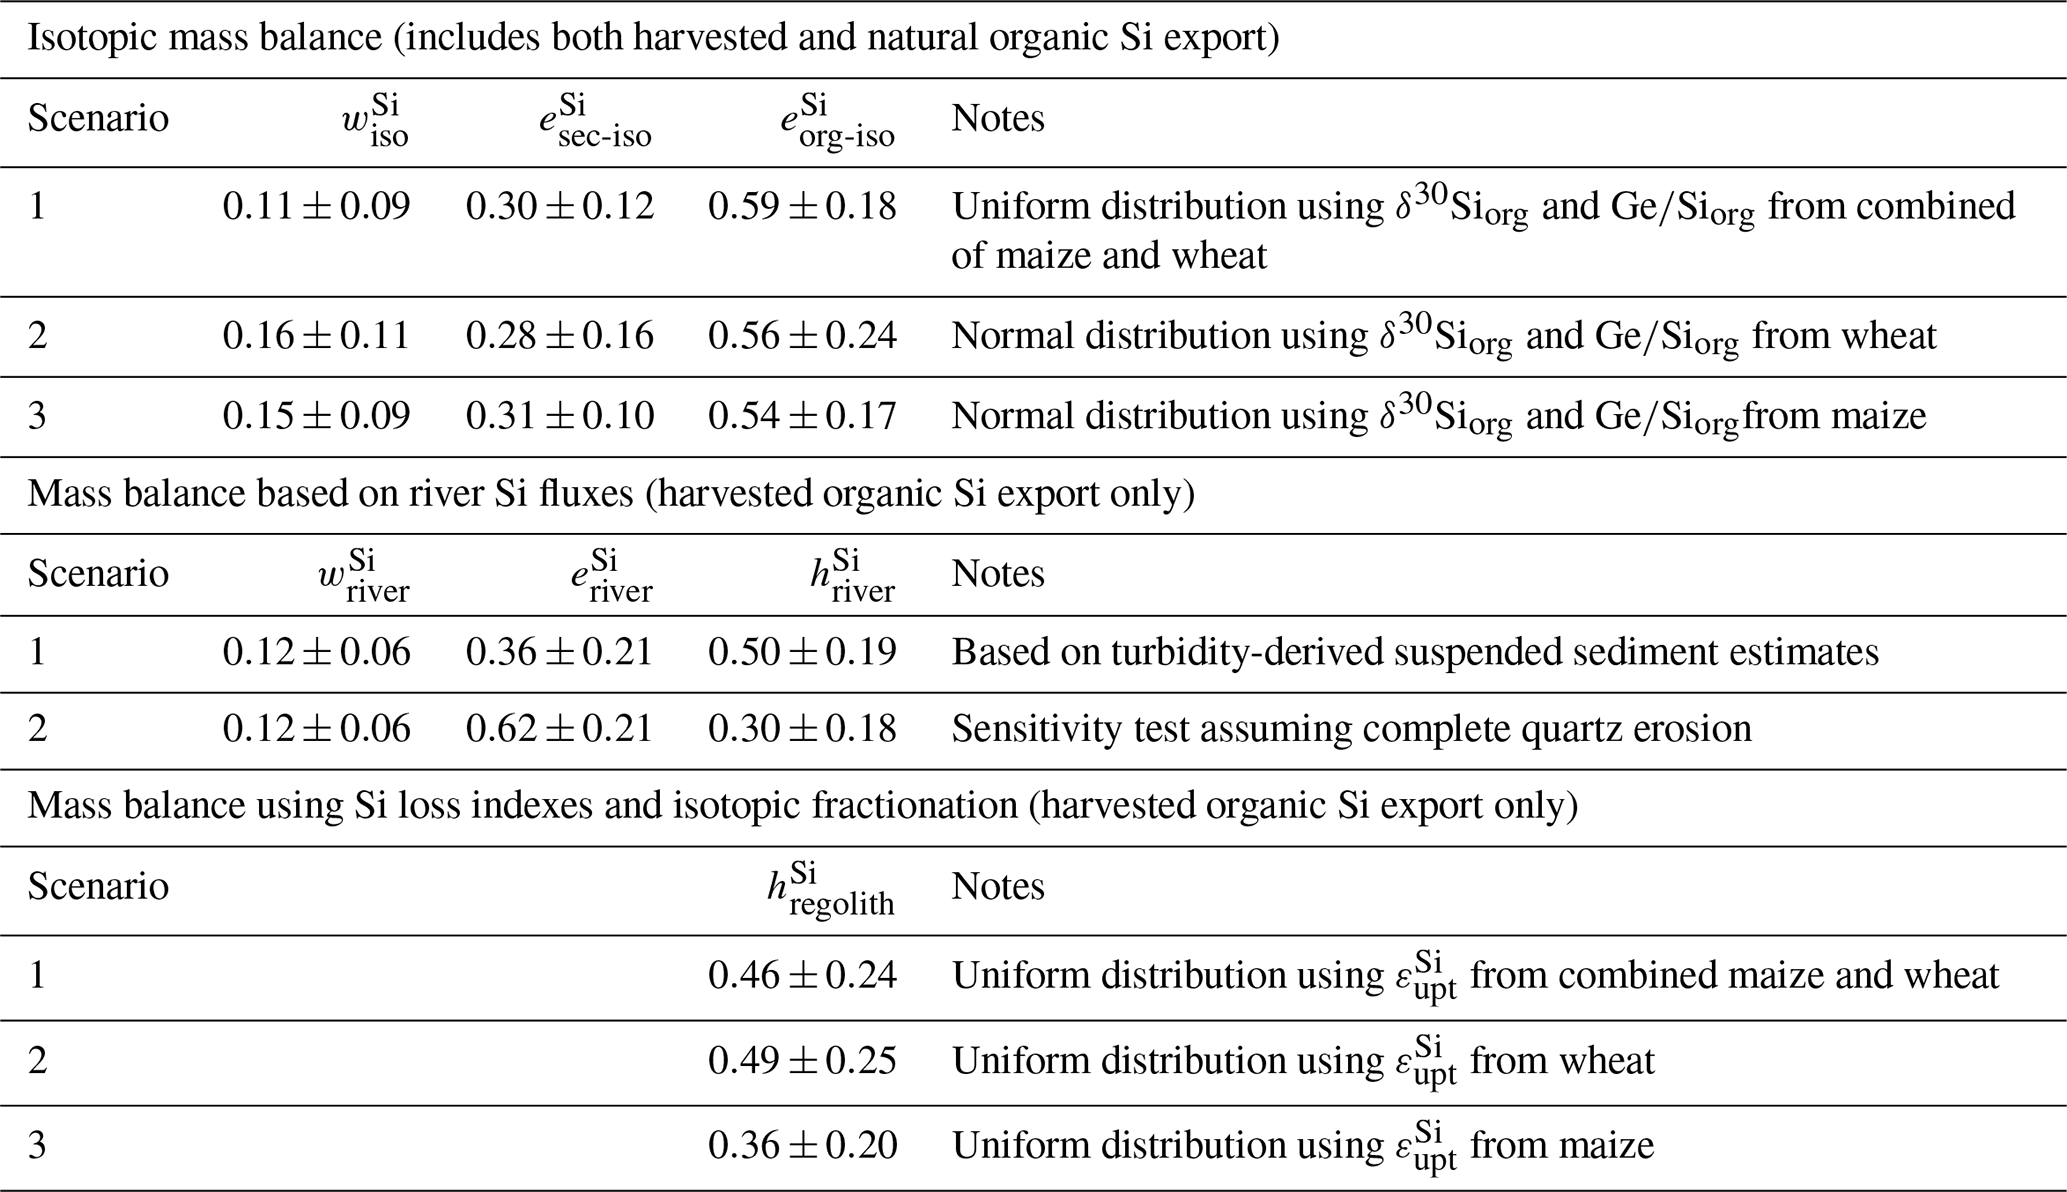
Our calculations indicate that particulate Si export via plant material (natural and anthropogenic) is the largest contributor to Si export from the catchment, with estimated fractional losses approximately from 0.54±0.17 to 0.59±0.18. This represents values 3.5 to 5.3 times greater than the total dissolved Si export. These contributions are also higher than those observed in four other non-agricultural catchments, where ranged from 0.20±0.1 to 0.42±0.23 (Baronas et al., 2020; Frings et al., 2021b) and in a global river compilation with of 0.32±0.12 (Baronas et al., 2018). These findings highlight the significant impact of harvesting on the Si cycle, which can thus sharply reduce dissolved Si fluxes in streams.
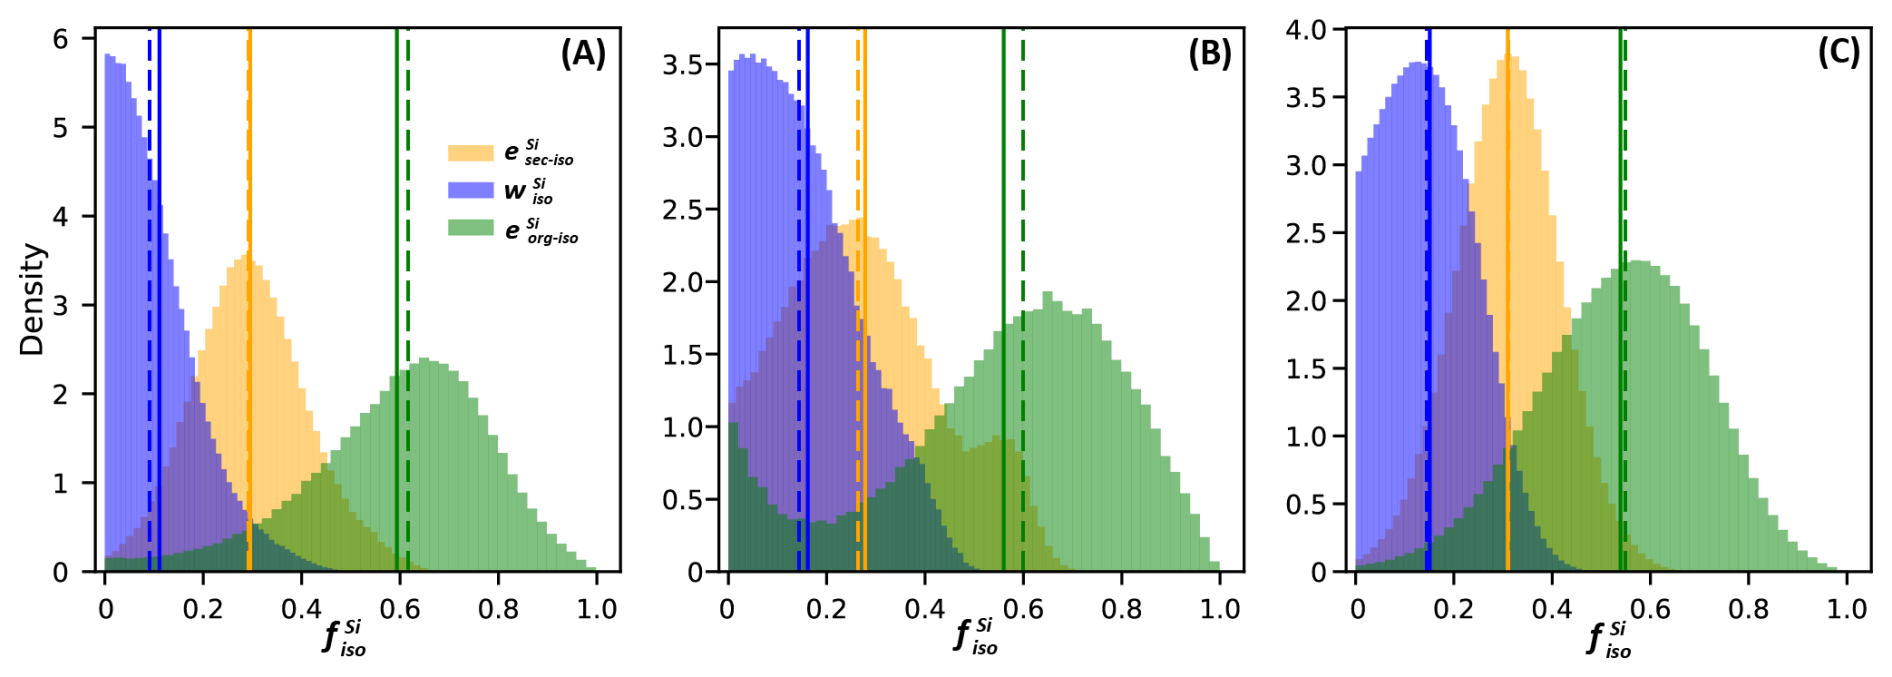
Figure 4Distribution of the fraction of Si export as , , and calculated using the combined δ30Si and isotopic mass balance for three scenarios with varying signatures in the organic fraction. Solid lines represent the mean of each fraction, while dashed lines indicate the median. (A) Scenario 1 uses a uniform distribution for the plant signatures, incorporating all measured leaf values. (B) Scenario 2 uses a normal distribution using only the wheat signatures. (C) Scenario 3 uses a normal distribution using only the maize signatures.
5.3 Quantifying Si removal from the system by harvesting
Silica harvest estimation can be determined by assessing the biomass and type of grain exported by each farmer, following the global estimation methodologies of Carey and Fulweiler (2016) and Matichenkov and Bocharnikova (2001). However, in our study area, robust estimates are unavailable, and a portion of the harvested biomass is reincorporated into the watershed as manure. This recycling complicates the calculation of net Si export, as Si cycling between crops and manure varies depending on farming practices and crop type. In the following sections, we estimate silica harvest from the catchment using two independent approaches based on the framework developed by Bouchez et al. (2013). This approach has been used to quantify nutrient uptake with a variety of metal stable isotope systems (Charbonnier et al., 2020, 2022; Schuessler et al., 2018; Uhlig et al., 2017) and more specifically with Si isotopes (Baronas et al., 2018; Frings et al., 2021a). To determine the export of Si by harvesting we first perform an elemental mass balance using direct flux estimates based on riverine chemistry and suspended sediments (); second, we use an estimate of the Si isotopic fractionation associated to plant uptake together with indexes of Si depletion in soils ().
5.4 Quantifying Si export through harvesting using riverine Si concentrations and suspended sediments:
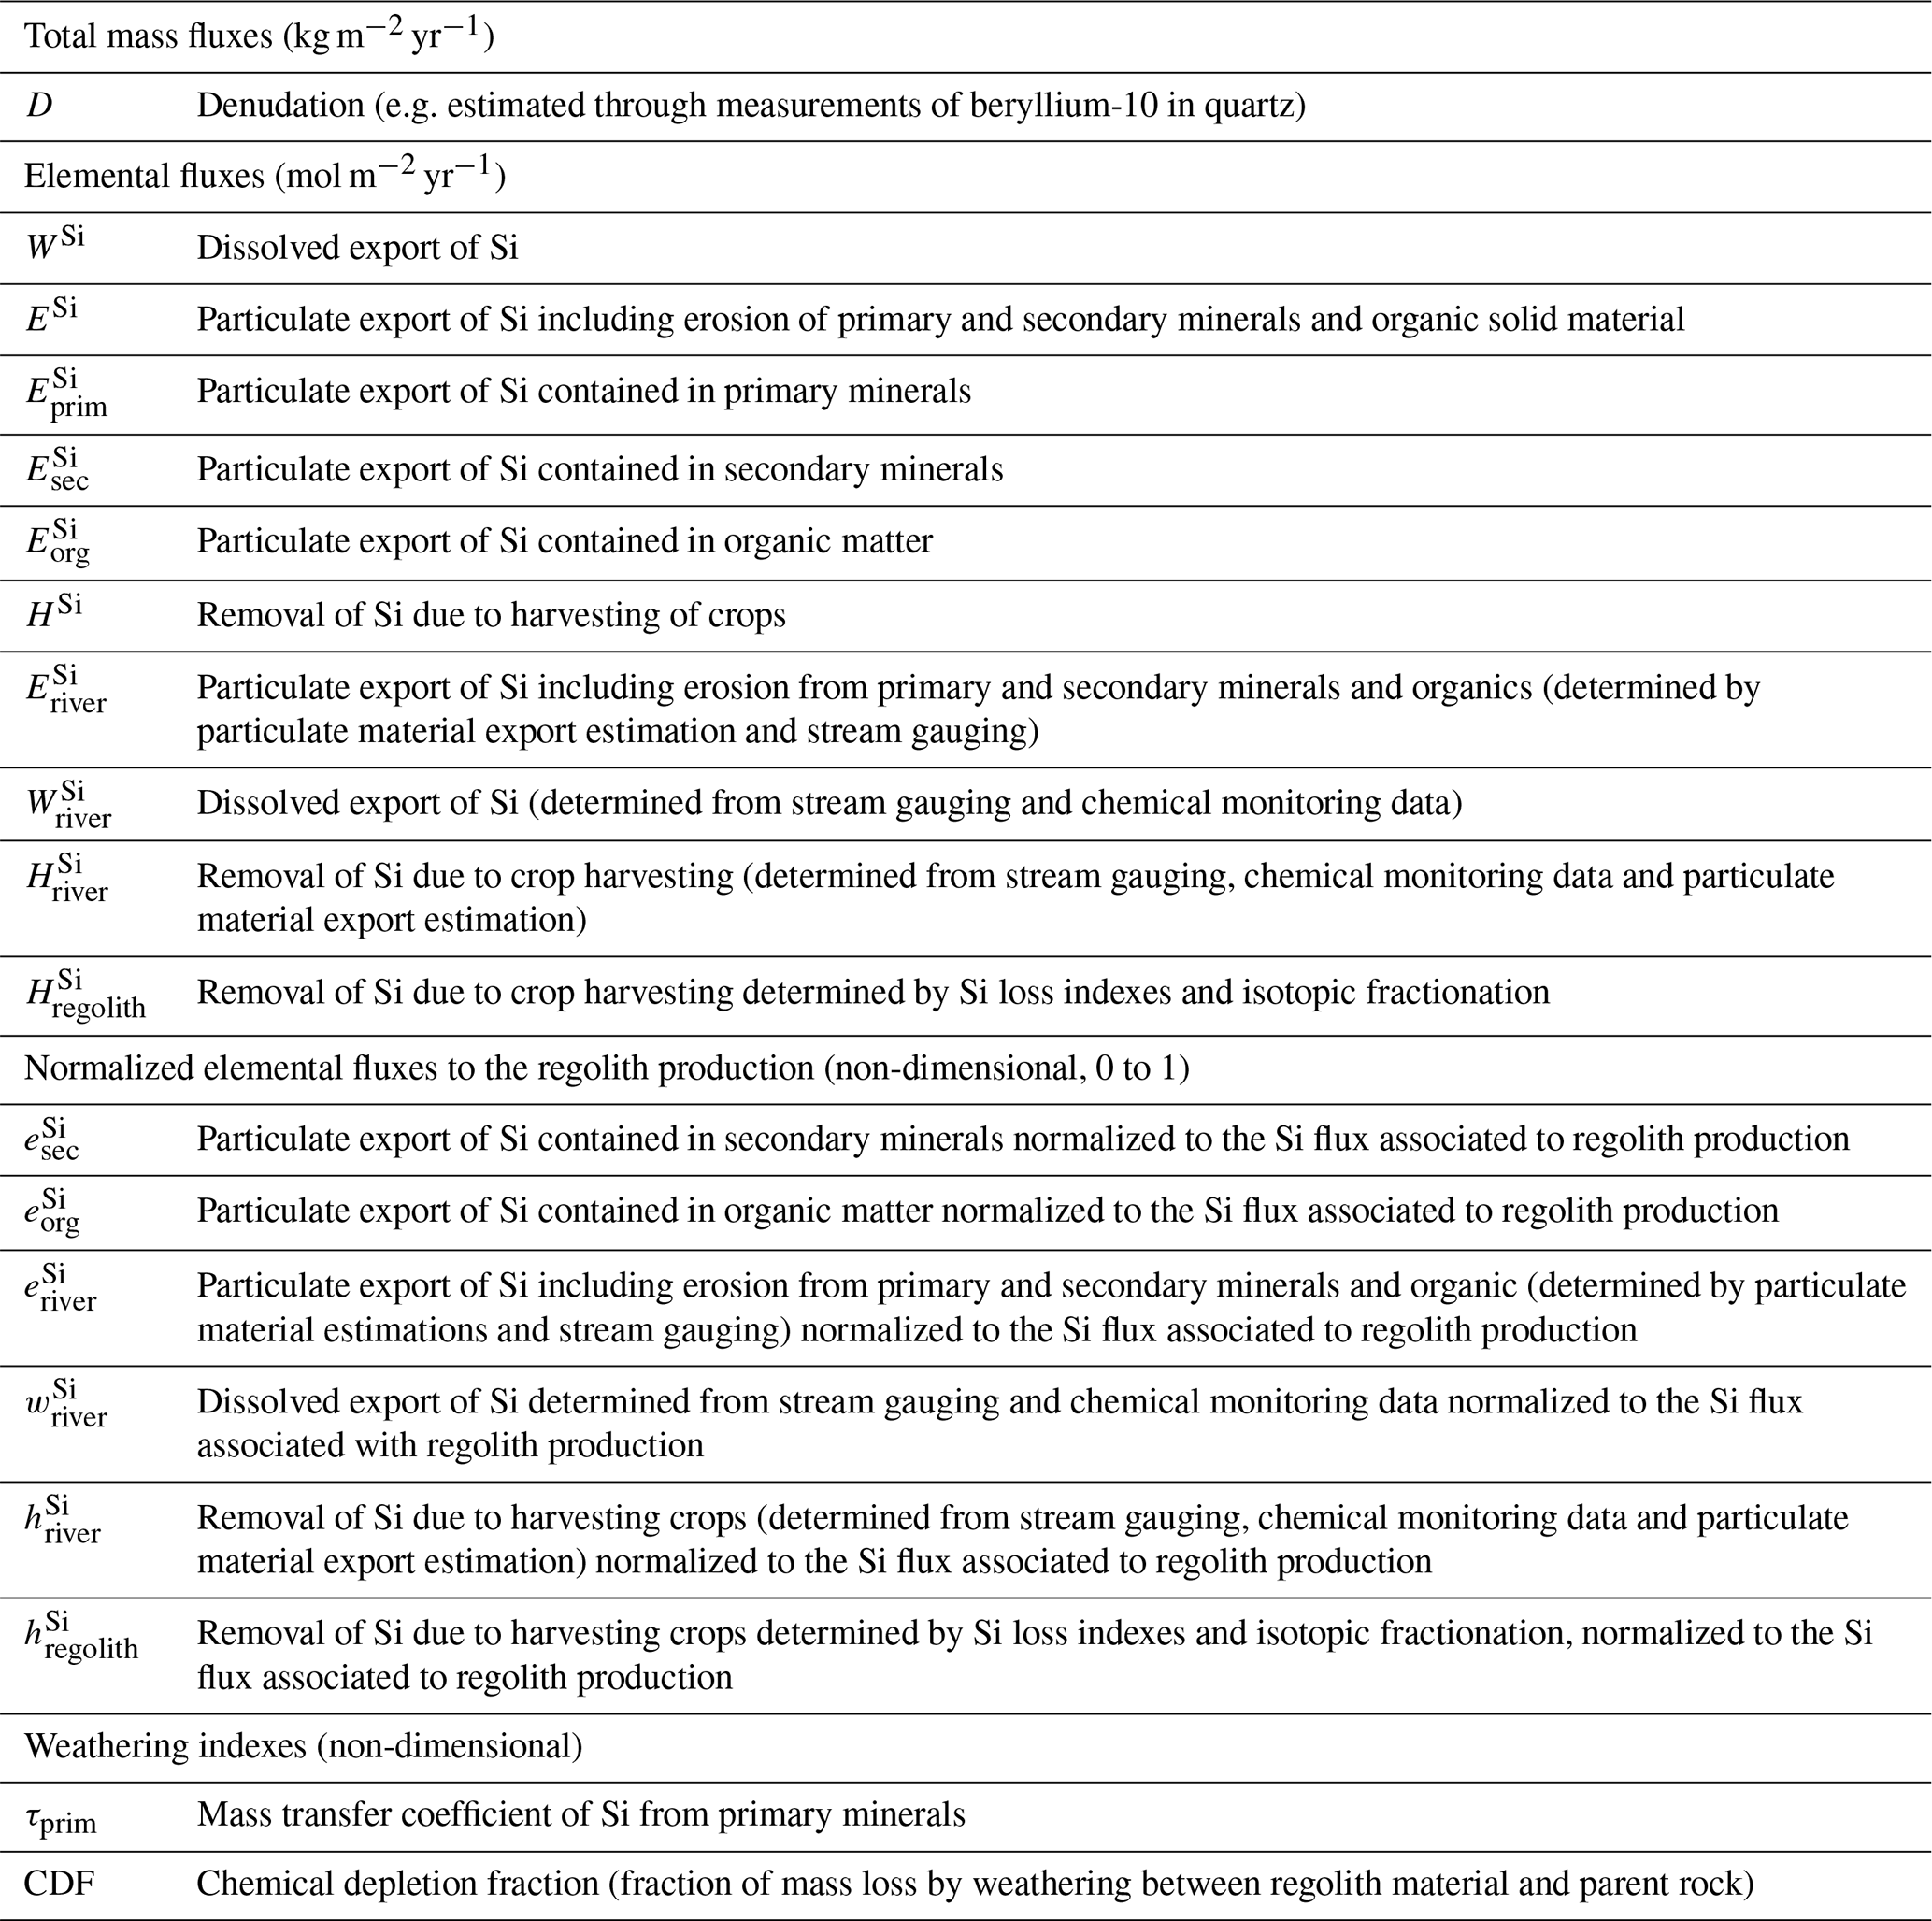
In this approach, the catchment is considered as a steady-state open flow-through reactor, where dissolved Si is derived from partial rock dissolution and subsequently partitioned into various compartments. Figure 5 shows a schematic diagram representing the compartments and fluxes of the model and Table 3 presents the definitions of all the parameters and symbols used. At steady state, the total Si denudation rate accounts for the export of both dissolved and particulate Si, expressed as:
where D is the total denudation rate (kg m−2 yr−1) equal at steady-state to the conversion of rock into regolith material, [Si]rock is the Si concentration in the bedrock (mol kg−1), WSi is the dissolved Si exported from the system (mol m−2 yr−1), and ESi is the export of Si contained in river solid particles (mol m−2 yr−1). The solid-phase export of Si, ESi includes Si located in secondary minerals , organic matter and primary minerals :
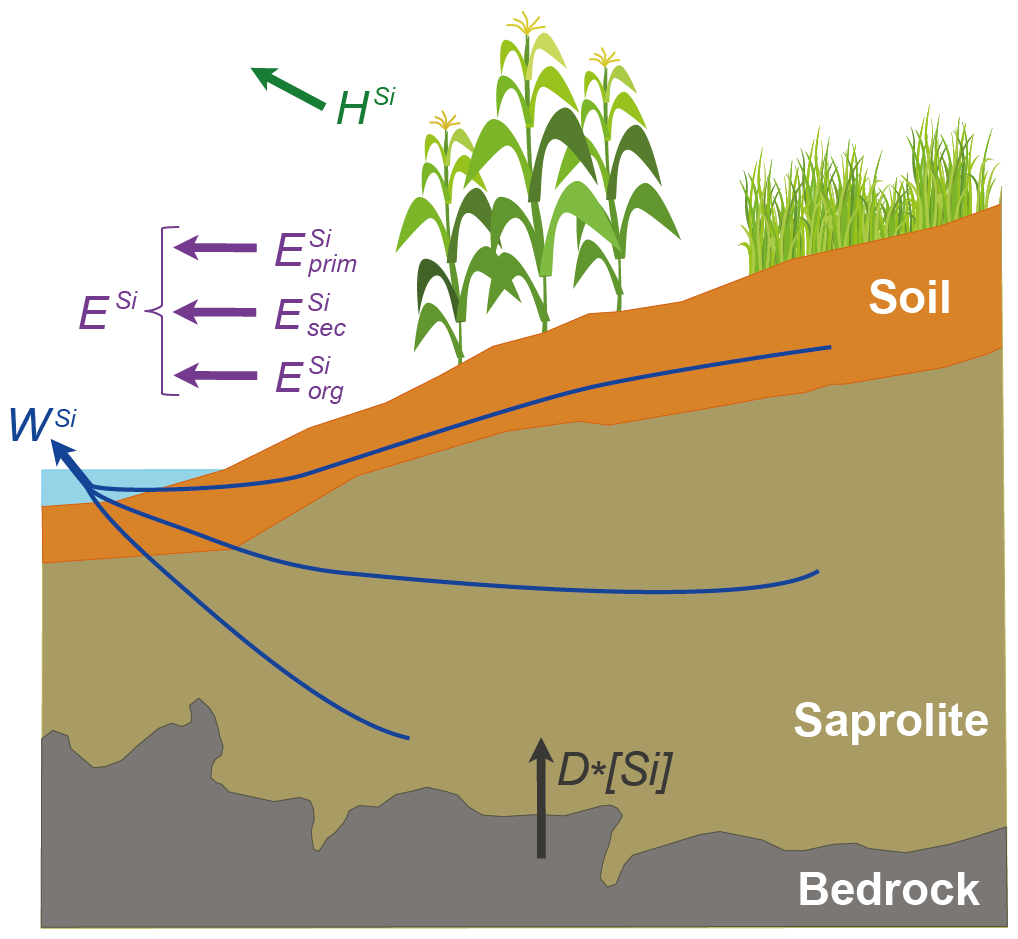
Figure 5Schematic diagram representing the compartments and fluxes in the mass balance model.
In a natural system, the Si removed by plants returns to the weathering zone as litter and then can be redissolved or exported as particulate organic matter. However, in an agricultural catchment, a fraction of the Si removed by plants does not return as litter but is removed due to harvesting HSi (mol m−2 yr−1). Thus Eq. (4) becomes:
where HSi is the flux of Si exported in plants from the catchment due to agriculture (mol m−2 yr−1). Dividing both sides of Eq. (6) by D⋅[Si]rock, we obtain the relative proportion of all fluxes with respect to the denudation flux:
If wSi and eSi are known, we can estimate the fraction of Si being exported due to harvesting.
In the following sections, we determine wSi leveraging stream gauging and chemical data () and estimate based on suspended sediments data from the stream (Vongvixay et al., 2018).
Table 3Summary of symbols used in the equations of the mass balance model.
5.4.1 Si dissolved fluxes based on riverine dissolved Si:
We determined the annual wSi over a period of 22 years using the measured dissolved Si river flux at the catchment (). The dissolved annual river fluxes were calculated as:
where [Si]riv represents hourly Si concentration in the stream, i refer to the hours within a hydrological year, Q is the stream water hourly discharge, and A is the catchment area (m2). Hourly discharge data are available from 2001 to 2022 at https://agrhys.fr/BVE/vidae/ (last access: March 2024). Daily Si concentration measurements are available from fall 1999 until summer 2000, with additional samples in 2003, 2006, 2007, and during three flood events in 2021 and 2022 at an hourly resolution. This dataset includes 844 samples, covering various seasons and hydrological conditions (Table 4; López-Urzúa et al., 2025).
To better estimate an average stream dissolved Si concentrations over 22 years using a more continuous (hourly) discharge record (Appendix E), we derived a relationship between Si concentration and discharge in a logarithmic space (C-Q relationship). We used IsoplotR's maximum likelihood estimator (Vermeesch, 2018) to determine best parameters of a power law equation describing the relationship between Si (µmol L−1) and Q (L s−1) as follows:
yielding (SE, standard error) and (SE). Using Eq. (9), we estimated hourly Si concentrations for each hour over the 22-year period. We then calculated the annual for each hydrological year from 2000 to 2022 (Table 5; López-Urzúa et al., 2025) using Eq. (8). For additional details on the estimation of riverine Si flux and the calculation of see Appendix E.
The average over the 22-year period is 0.042±0.02 mol m−2 yr−1 (SD) (Table S2 in the Supplement). The non-dimensional dissolved Si flux (; Table S2 in the Supplement) is derived by dividing this value by the total Si denudation rate ([Si]rock⋅D). Using a denudation rate of 10±1.7 m Ma−1 (Malcles et al., 2025) and a bedrock Si concentration of 82 wt % SiO2 (Table 1), the total Si denudation rate yields a value of 0.345±0.059 mol m−2 yr−1. The mean fraction of Si exported from the catchment in the dissolved form is 0.12±0.06, which is consistent with the values calculated using the isotopic mass balance when considering their respective uncertainties (0.15±0.08 to 0.22±0.11). This fraction represents only a small proportion of the total Si export and suggests that particulate erosion and harvesting are major contributors to Si export.
5.4.2 Si particulate erosion flux:
To estimate , we used the correlation between annual suspended sediments concentration and annual water specific flux at the Kervidy-Naizin catchment of Vongvixay et al. (2018). This relationship is based on a study period spanning 9 hydrological years (2005 to 2014) during which turbidity was recorded every 10 min. Subsequently, suspended sediment concentration (SSC) was computed using corrected turbidity values as an index data, alongside an SSC–turbidity rating curve with a correlation coefficient of approximately 0.75 established from over 300 stream samples. Vongvixay et al. (2018) established a linear relationship between suspended sediment concentrations and the annual water specific flux. The regression equation describing their relationship is SSC = 0.036Q−1.72 with R2 value of 0.787, where SSC is the annual suspended sediment flux (t km−2) and Q is the annual runoff (mm). Leveraging these established relationships, we calculated the annual suspended sediment for our 22 years with discharge data. Subsequently we calculated the annual value of eSi by multiplying the particulate erosion flux by the Si concentration we measured in the topsoil. Our calculations show that the fraction of Si exported as solid particles averaged 0.12±0.07 mol m−2 yr−1 (SD) corresponding to a mean estimated fraction of 0.36±0.21.
It is important to note that we assume quartz to be inert; therefore, the minimum theoretical value for should reflect the quartz fraction of the bedrock, which is 0.62 (Table S3), suggesting a lower bound for of approximately 0.62. The lower value we obtained () likely reflects methodological limitations associated with the estimation of suspended sediment fluxes. Specifically, the approach based on turbidity-derived suspended sediment concentrations predominantly captures the fine sediment fraction. Coarse and dense minerals such as quartz are preferentially transported as bedload and are underrepresented in turbidity-based estimates, a known grain-size bias in suspended sediment sampling (Bouchez et al., 2011; Lupker et al., 2012). Additionally, a portion of the quartz may be retained within the soil profile, as quartz is highly resistant to weathering and can accumulate over time in the regolith if not mobilized either in dissolved form or as suspended or bedload particles. These factors likely contribute to an underestimation of the total solid-phase Si export from primary minerals.
5.4.3 Fraction of Si exported by harvesting:
After determining the mean and over the 22-year river gauging observational period, we calculated the fraction of Si exported from the catchment hSi for each year using Eq. (7) (Table S2 in the Supplement). To derive the mean and account for uncertainties, we performed a Monte Carlo approach with 1 000 000 simulations assuming normal distributions for the three parameters (Fig. 6a). The mean from this simulation is 0.50±0.19 (SD), indicating that between 20 % to 70 % of the Si release from bedrock is exported from the catchment through harvesting practices. As the uncertainty on the input parameters partially stems from the temporal variability in river fluxes, the resulting uncertainty in is closely related to annual flux variations. Years with significant rainfall increase erosion, leading to increased export of Si as sediments. In this context, the mean over 22 years serves as a valuable estimator, as it integrates data across diverse hydrological conditions, making it more comparable to denudation estimates that relate for longer time scales.
To further test the sensitivity of this result to assumptions regarding we conducted an additional Monte Carlo simulation in which was set to 0.62±0.21, corresponding to the quartz fraction of the bedrock under the assumption that quartz is inert. In this conservative scenario, the resulting mean is 0.30±0.18 (Fig. 6b and Table 2). Importantly, even under this assumption of higher particulate Si export, harvesting remains a major Si flux in the catchment, exceeding the dissolved export fraction (). These results reinforce the conclusion that agricultural harvesting plays a dominant role in the overall Si export from this system.
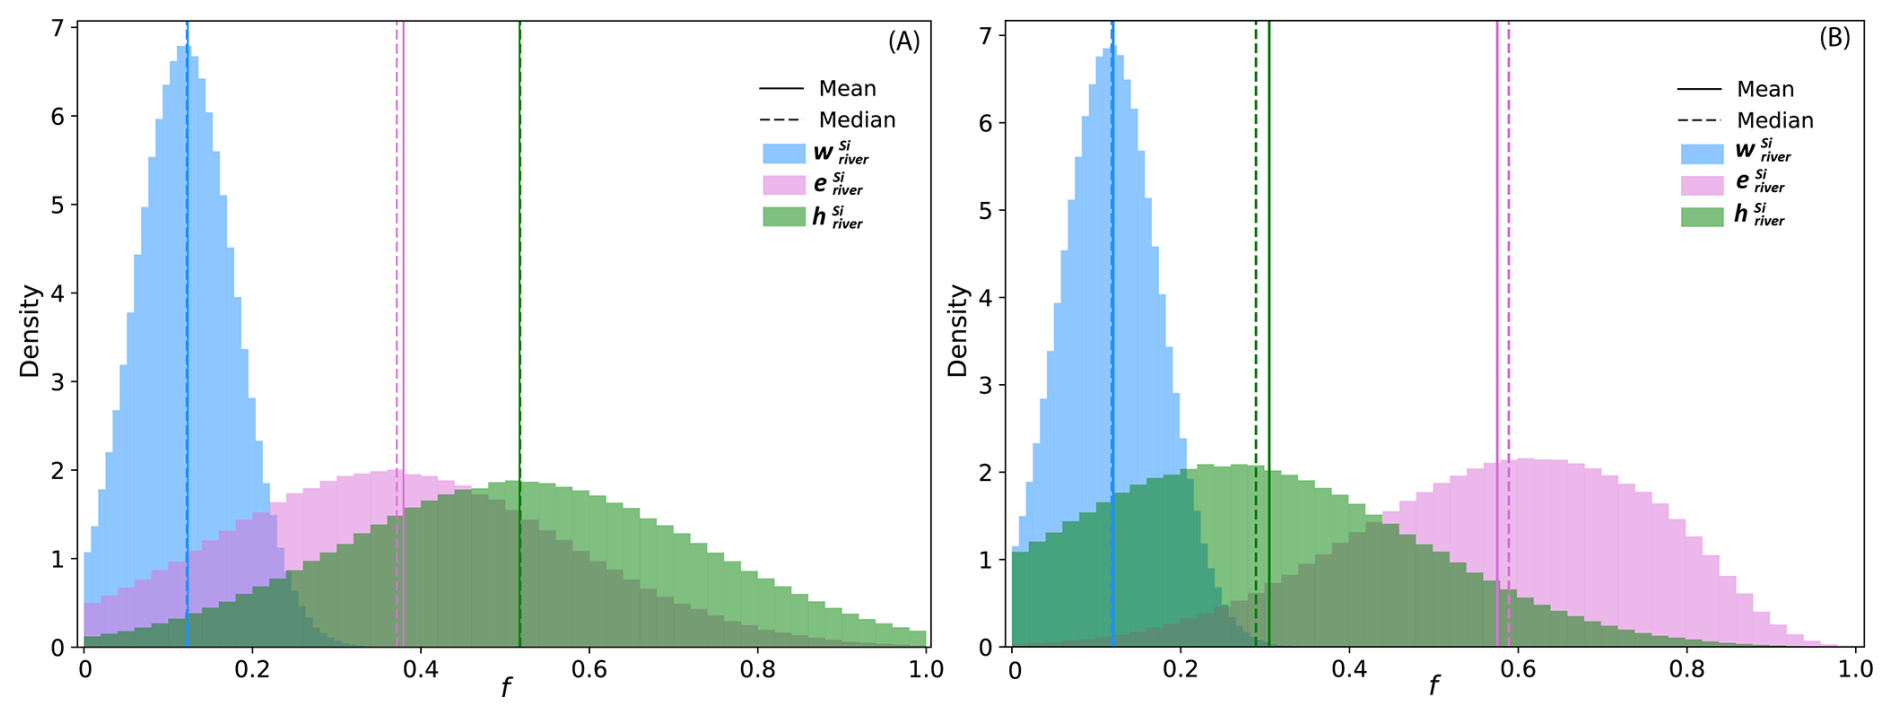
Figure 6Distribution of the fraction of Si export as , , and , calculated using riverine Si concentrations, suspended sediments and the mass balance. The solid line represents the mean, while the dashed line indicates the median. (A) Results based on the mean estimated derived from turbidity-based suspended sediment estimates. (B) Sensitivity analysis assuming , corresponding to the quartz fraction of the bedrock, under the assumption that quartz is inert.
5.5 Quantifying Si export through harvesting using Si loss indexes and isotopic fractionation:
The isotopic composition of each compartment within the Critical Zone can be related to elemental fluxes and isotopic fractionation. Because at Kervidy-Naizin a portion of organic particulate erosion originates from harvesting, we reformulate Eqs. (5e) and (15) from Bouchez et al. (2013). Then by normalizing to the total Si flux (detailed derivation is provided in Appendix F), we determined the fraction of Si harvested as:
Here, represents the fraction of Si harvested, calculated as a function of normalized Si fluxes ( and ; Table 3), isotopic fractionation for secondary mineral precipitation () and plant uptake (), and the mass transfer coefficient of Si from primary minerals () defined as:
where and represents the Si concentration associated with primary mineral in the regolith and rock, respectively, and the [Ti]reg and [Ti]rock terms corresponds to the Ti concentration in the rock and regolith.
5.5.1 Si isotopic fractionation associated with vegetation and clay formation: and
To estimate the isotopic fractionation for secondary mineral precipitation and plant uptake, we used the isotopic signatures from the stream (), plants () and secondary minerals (). Stream was used instead of soil solutions, because the former integrates contributions from the entire catchment, providing a more representative estimate of at the catchment scale, rather than reflecting local variations. The isotopic fractionation were determined as follows (Bouchez et al., 2013):
Using the mean δ30Si from the stream and the clay-corrected fraction (Table 1), we calculated of ‰ (Table 4). This clay neoformation isotopic fractionation is similar to that estimated for other environments dominated by kaolinite as the secondary mineral (Frings et al., 2021a).
Table 4Si isotopic fractionation determined for secondary clay precipitation and plant uptake. Uncertainty obtained through gaussian error propagation.
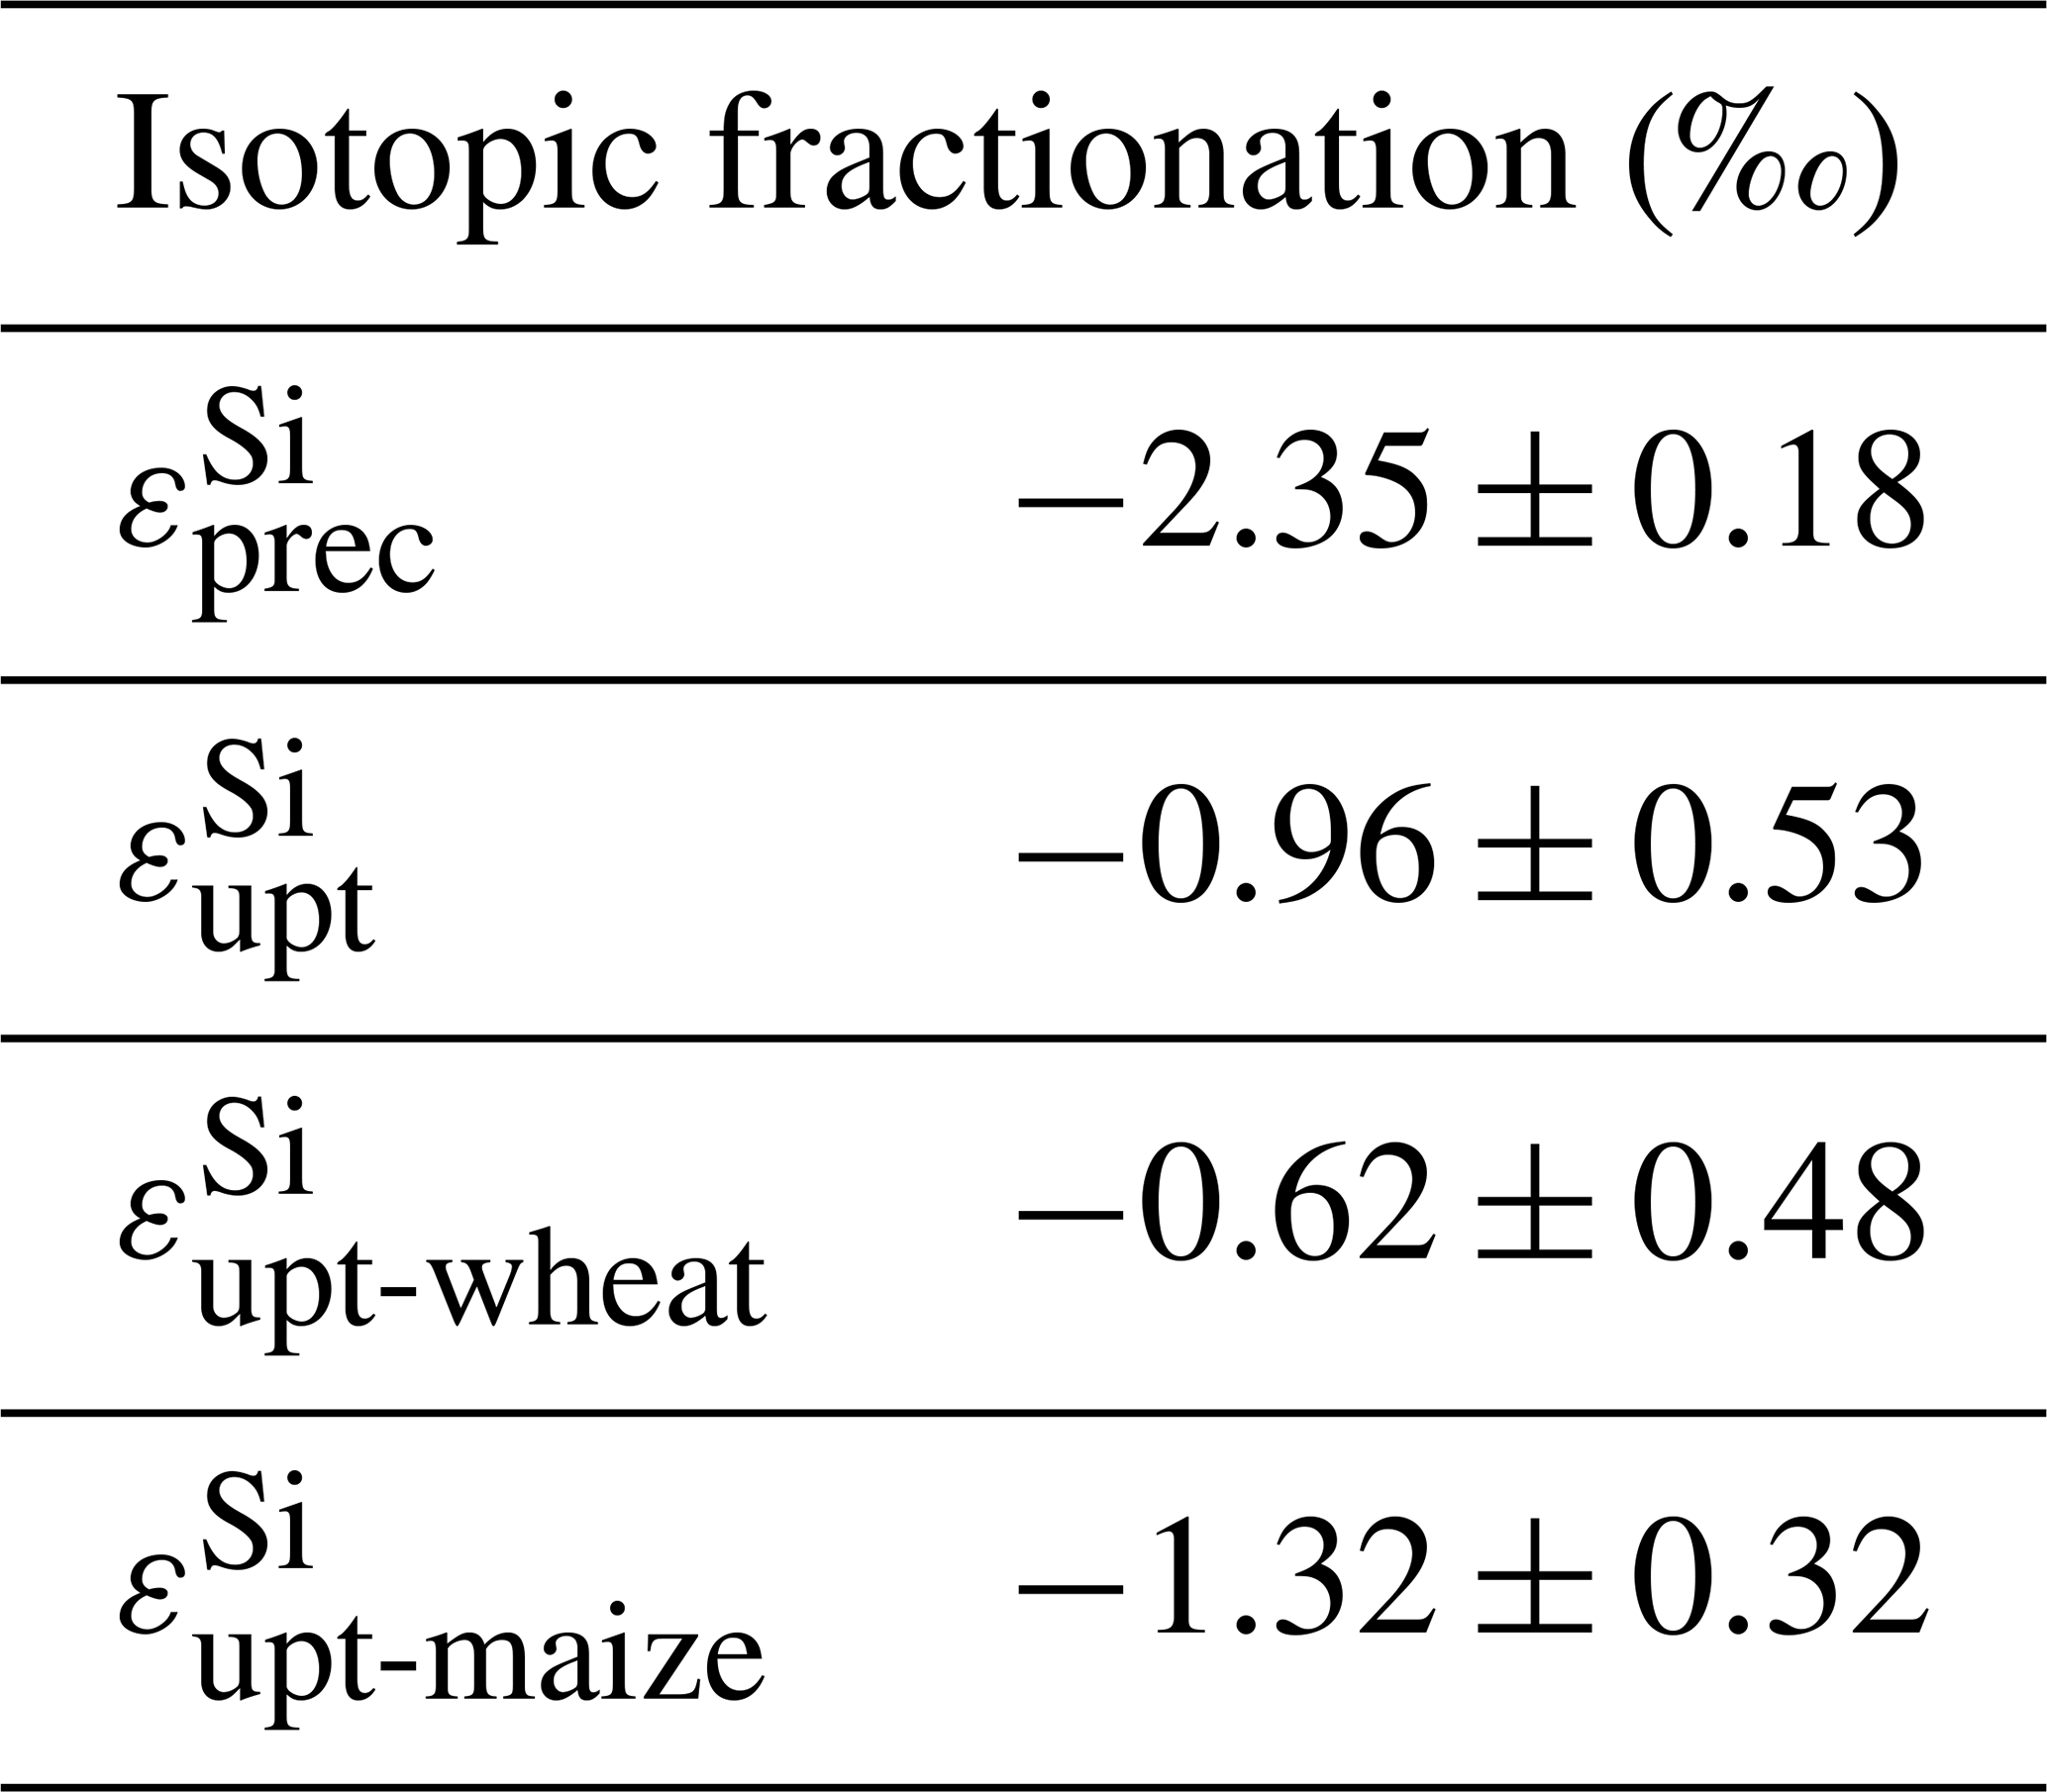
For the plant uptake isotopic fractionation (), we derived a value of ‰ using the mean δ30Si from dissolved Si in the stream and leaf samples. We further assessed the isotopic fractionation specific to each crop species, maize and wheat. is ‰ , similar to values reported by Frick et al. (2020) for spring wheat (−0.43 ‰). is ‰, consistent with previously documented values by Ziegler et al. (2005a) and Sun et al. (2017), who found −1.0 ‰ and −1.1 ‰ respectively.
5.5.2 Si loss index:
We first performed a quartz correction to the Si concentrations in bedrock and soil samples to account for the non-stoichiometric dissolution of the primary mineral assemblage where Si is preferentially released from more reactive plagioclase, muscovite and chlorite whereas quartz is assumed to be inert.
To calculate , we assessed the content of Si located in primary minerals based on the mineralogical composition and stoichiometry derived from our bedrock and soil profiles (Table S3 in the Supplement). The Si associated with each mineral was calculated using stoichiometry, and τprim was determined as follows:
where the concentrations on Ti in soil samples were corrected from quartz. The Si concentration terms [Si]i in Eq. (14) represents the Si content associated with each primary mineral i identified by XRD and were calculated based on their mineralogical abundance and stoichiometry for each horizon sample (Table S3 in the Supplement). From our analysis across both profiles (Table S3 in the Supplement), we calculated an average value of (SD, n=6).
Relying on a single bedrock sample may not fully capture potential lithological heterogeneity in the parent rock, especially regarding Ti concentrations. To address this, we performed a sensitivity test using the dataset of Denis and Dabard (1988), which includes nine bedrock samples from the same geological unit as the one underlying the Kervidy-Naizin catchment. The results of this sensitivity test (Appendix G) demonstrate that the estimated values are robust to this source of variability, with the same mean value obtained when incorporating this broader dataset.
5.5.3 Particulate erosion fluxes: and
The particulate erosion fluxes, and , can be expressed as follows (Bouchez et al., 2013):
Here, [Si]sec and [Si]org represents the Si concentrations associated to secondary minerals and particulate organic material in the sediments, respectively, while [Si]rock-qtz is the Si concentration in the rock corrected for quartz. The chemical depletion fraction (CDF) (Riebe et al., 2001), is given by:
The CDF represents the overall fractional mass loss occurring during weathering and export of dissolved elements. Across our profiles (Table S3 in the Supplement), we calculated an average CDF value of 0.29±0.13 (SD, n=6).
To determine the Si concentration associated with secondary minerals [Si]sec we followed a similar approach as for τprim, focusing on the percentage and stoichiometry of kaolinite and vermiculite in each sample. For estimating the Si concentration in organic matter [Si]org, we relied on measured organic matter content in the upper soil horizons (0 to 30 cm of each profile, Table S3 in the Supplement). We assumed that the soil organic matter primarily originates from plant material – specifically, in this agricultural context, from wheat residues – and therefore assumed that 2.3 % of this organic matter consists of Si, as reported for wheat (Hodson et al., 2005). The term yielded a value of 0.087±0.042 (SD, n=6), and the term a value of 0.0064±0.00032 (SD, n=2). It is worth noting that, although these values ( and ) are lower than those obtained from the isotopic mass balance (e.g., and ), they reflect different processes. Specifically, quantifies the fraction of Si retained in soil organic matter after harvest (i.e., residual phytoliths), rather than total plant export. Similarly, represents the estimated soil Si pool contained in secondary minerals, which can be biased low due to the unaccounted loss of fine, clay-rich material during erosion. This conceptual distinction, as well as differences in methodological approaches, explains the lower magnitude of these values relative to the isotopically derived fluxes.
5.5.4 Determining
After determining all the parameters in Eq. (10), we calculated for three different scenarios, each one applying a different isotopic fractionation for plant uptake. To solve Eq. (10) and obtain associated uncertainties, we conducted a Monte Carlo simulation for each scenario (Table 2 and Fig. 7; see Table F1 for detailed results). In Scenario 1, we adopted a uniform distribution for using the minimum and maximum values of the isotopic fractionation using all plant samples (n=4). The overall isotopic fractionation of harvested plants will vary from year to year depending on the species grown and is calculated as the weighted mean of the different crop isotopic fractionation, proportionate to their prevalence in the basin. By assuming a uniform distribution, we attribute the same probability to each plant species across the range of possible isotopic fractionation, from the minimum to the maximum values derived from our samples. This approach allows us to capture the full spectrum of potential isotopic fractionation, ultimately providing a more comprehensive assessment of Si export due to harvesting practices in the catchment. In contrast, for Scenarios 2 and 3 we employed a normal distribution for each species, characterized by their respective average and standard deviation. Specifically, in Scenario 2, we used the wheat isotopic fractionation while in Scenario 3, we use the maize isotopic fractionation . As previously discussed, (Sect. 5.2), while our dataset includes only two maize and two wheat samples, these represent the dominant crops cultivated in the catchment, and Si isotopic fractionation is generally more strongly influenced by plant functional type than by intraspecific variability (Frick et al., 2020). We therefore consider that the selected species capture the relevant functional variability for this analysis.
The results show averages values of ranging from 0.36 to 0.49 depending on the scenario (Table 2 and Fig. 7). The highest fraction of harvested Si is reached using the wheat isotopic fractionation, yielding a mean of 0.49±0.25, while the lowest value is observed in Scenario 3, using the maize isotopic fractionation with a value of 0.36±0.20. Scenario 1 yielded an intermediate value of 0.46±0.24.
Given that maize and wheat are the most prevalent cultivars in the catchment, Scenario 1 appears to be the most suitable for estimating Si export due to harvesting. However, our plant sampling strategy, which focused solely on leaves, restricts our ability to accurately determine the overall plant isotopic fractionation. During transpiration, lighter isotopes are incorporated into phytoliths, resulting in an enrichment of the remaining solution with heavier isotopes. As a result, the phytoliths in the upper parts of the plant (leaves) may exhibit a heavier isotopic signature than those in lower parts, such as stems and roots. As we only measured leaves, the overall plant isotopic fractionation is likely to show a larger magnitude. Therefore, the most accurate estimate of is likely between Scenario 1 (0.46), which accounts for the presence of different crops and Scenario 3 (0.36), which reflects an isotopic fractionation of larger magnitude.
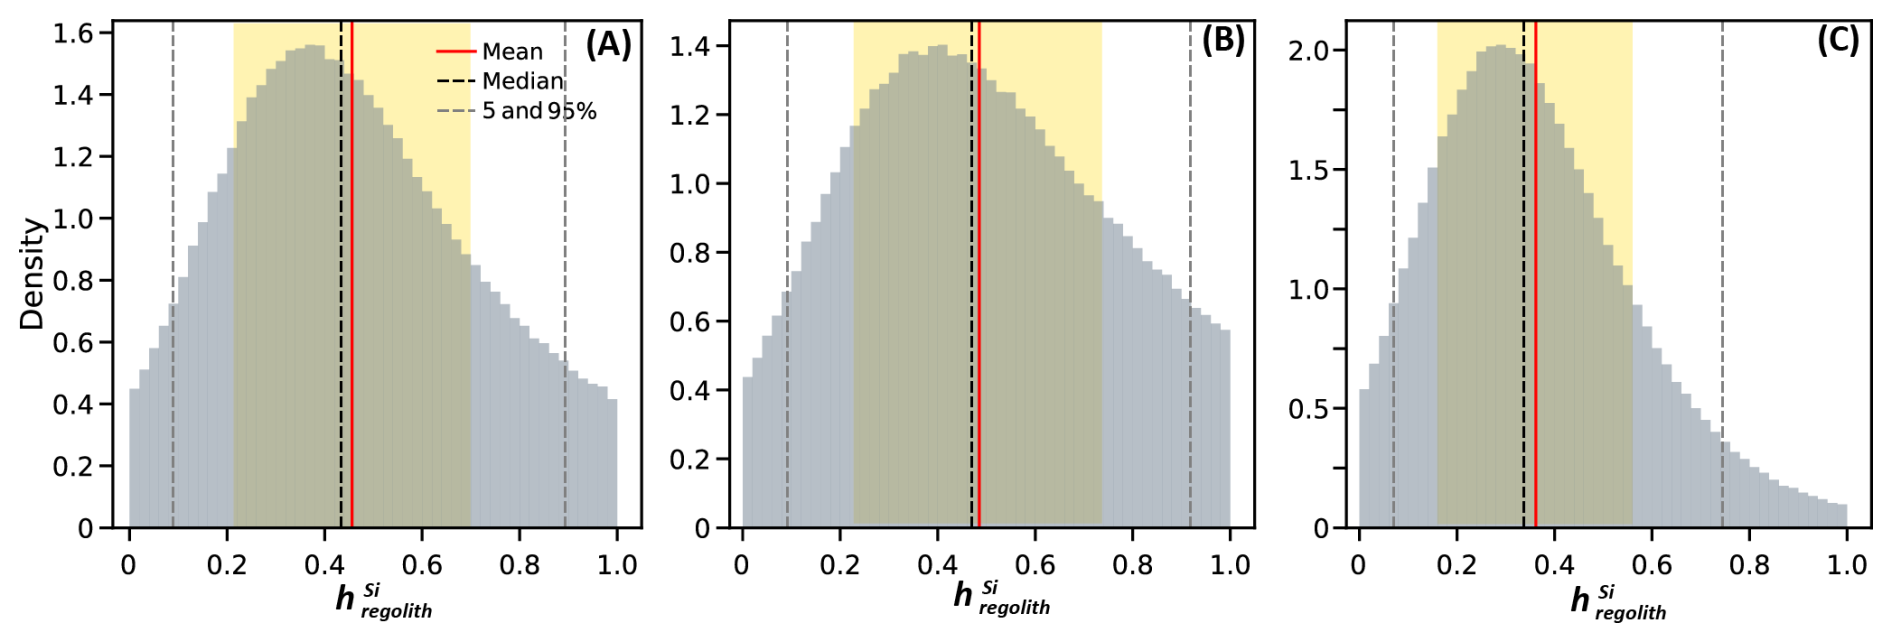
Figure 7Distribution of the fraction of harvested Si () calculated using Si loss indexes and isotopic fractionation for three scenarios with varying plant isotopic fractionation. Red lines indicate the mean, black dashed lines represent the median, and grey dashed lines mark the 5th and 95th percentiles. Yellow shaded areas denote the mean ± one standard deviation (1 SD). (A) Scenario 1 uses a uniform distribution for the plants isotopic fractionation, incorporating all isotopic fractionations determined in leaves. (B) Scenario 2 uses a normal distribution based only on wheat isotopic fractionation. (C) Scenario 3 uses a normal distribution based only on the maize isotopic fractionation.
5.6 Uncertainties in HSi and implications of harvesting on the Si cycle
Our estimates indicate that Si flux from harvesting, depending on crop type, accounts for 1 to 4 times the dissolved Si flux at the agricultural catchment of Kervidy-Naizin, highlighting the strong impact that harvesting can have on the biogeochemical cycle of Si.
Our two independent methods for quantifying Si export due to harvesting produced consistent results. Using the first method, based on an elemental mass balance of riverine solute chemistry and suspended sediments over a 22-year period, we estimated that the highest fraction of Si exported through harvesting, was 50±20 % of the total Si exported of the catchment, amounting to 0.179±0.076 mol m−2 yr−1 of Si losses. We assume that the imbalance between denudation and particulate erosion and weathering represents the Si exported by harvesting. However, this approach has two limitations.
The first limitation is the mismatch between the short time scale of flux measurements (22 years for particulate erosion and weathering) and the much longer integration time (20 and 200 kyr) associated with the estimation of denudation rates based on beryllium isotopes (Malcles et al., 2025). The beryllium-based denudation used in this study reflects an average value and may not have remained constant throughout the Late Pleistocene-Holocene. Instead, it likely fluctuated in response to climatic changes. As we are comparing short-term data with a long-term average, the actual differences from the onset of agriculture at the site could be either larger or smaller, depending on whether the current denudation rate is higher or lower than its historical mean over the past ∼200 kyr. If confirmed, this discrepancy could affect our calculated . The second limitation is the potential omission of unaccounted Si pools, such as large plant debris (Uhlig et al., 2017), which were not sampled in this study. This limitation is particularly relevant during flood events, when large amounts of organic material, including plant debris, are mobilized and contribute to the overall Si flux. Consequently, our estimate may be an overestimate due to the exclusion of these Si pools.
Our second approach based on isotopic mass balance using isotopic fractionation and Si loss indices () estimated that Si export by harvesting represents 46±24 % of the total Si export, equating to 0.159±0.083 mol m−2 yr−1 of Si losses. The primary limitation of this method is the heterogeneity of the catchment soils and bedrock. The bedrock is characterized by a succession of siltstones and sandstones of varying composition, complicating efforts to determine the parent material of soil profiles accurately. For instance, rocks sampled near the regolith profile may not accurately represent those drained by the stream (Bouchez and Von Blanckenburg, 2021), introducing uncertainty in our calculations.
Another potential limitation of our approach involves the geochemistry of manure. A considerable portion of harvested biomass is used for livestock feed, with some manure returned to catchment. Grazing animals can influence Si cycling by accelerating the return of biogenic Si to the soil through feces, thereby enhancing its reactivity and dissolvability (Vandevenne et al., 2013). In both isotopic methods, we assumed that the isotopic signatures (δ30Si and ratios) of manure match those of plants. However, Si fractionation may occur in grazers since Si plays a role in connective tissues, especially in bone and cartilage, in warm-blooded animals (Carlisle, 1988). Nevertheless, studies indicate that the amount of Si retained in animals after plant ingestion is negligible (Jones and Handreck, 1967). Research on hippos found no significant difference between δ30Si in plant forage ( ‰) and their feces ( ‰) (Schoelynck et al., 2019), suggesting minimal isotopic fractionation in grazers. Still, if fractionation occurs, the large isotopic fractionation used in our scenarios could also account for potential differences between manure and plant isotopic signatures. Regarding germanium, as its behavior closely mirrors that of Si, the signature in manure is expected to largely reflect the original ratio of the plants consumed by animals. However, further research is needed to support this assumption.
Nevertheless, despite these limitations, our estimates remain robust, providing valuable insights into the role of harvesting in Si export and its implications for the biogeochemical cycle of Si in the catchment.
This study demonstrates that agricultural activities significantly alter the Si cycle in terrestrial landscapes, particularly within the Critical Zone of agricultural catchments. Our analysis of δ30Si and ratios across soil, bedrock, water, and plants in the Kervidy-Naizin catchment revealed a vertical gradient in δ30Si, influenced by distinct weathering and biological processes. In deeper groundwater, δ30Si is regulated by weathering and clay precipitation, while in shallower soils, biological uptake and agricultural harvesting lead to a progressive enrichment in δ30Si and decrease on Si concentrations.
Notably, our analyses challenge the conventional view of Ge discrimination during plant uptake for the specific crops examined, as we found no significant Ge discrimination relative to Si in bulk maize and wheat tissue. Instead, elevated ratios in maize and wheat leaves, compared to groundwater, soil solutions, and stream water, align with recent studies suggesting that plants do not consistently discriminate against Ge in bulk material. Our findings suggest that Ge discrimination likely varies significantly among plant types, emphasizing the need for caution when generalizing fractionation patterns. Grass, such as maize and wheat, may exhibit different fractionation behaviors compared to woody plants.
The quantification of Si export as harvested plant material underscores the substantial impact of agricultural harvesting, which accounted for a significant fraction of the Si export catchment, ranging from approximately 3 to 5 times the dissolved Si flux. Our findings reveal that agricultural harvesting alone represents a primary pathway for Si removal from terrestrial ecosystems, emphasizing its role in reducing Si availability downstream. The two independent approaches we employed – an elemental mass balance based on riverine chemistry and suspended sediments, which estimated Si export at 50±19 % of the total Si, equivalent to 0.179±0.076 mol m−2 yr−1, and an isotopic mass balance integrating isotopic fractionation, which estimated 36±20 % or 0.123±0.068 mol m−2 yr−1 – produced consistent values, supporting the robustness of these methods in assessing Si fluxes.
Overall, this study underscores the extent to which human activities reshape the natural Si cycle in agricultural settings. As anthropogenic influence over terrestrial ecosystems continues to expand, further research is essential to identify and quantify unforeseen ways in which human actions alter global Si biogeochemistry.
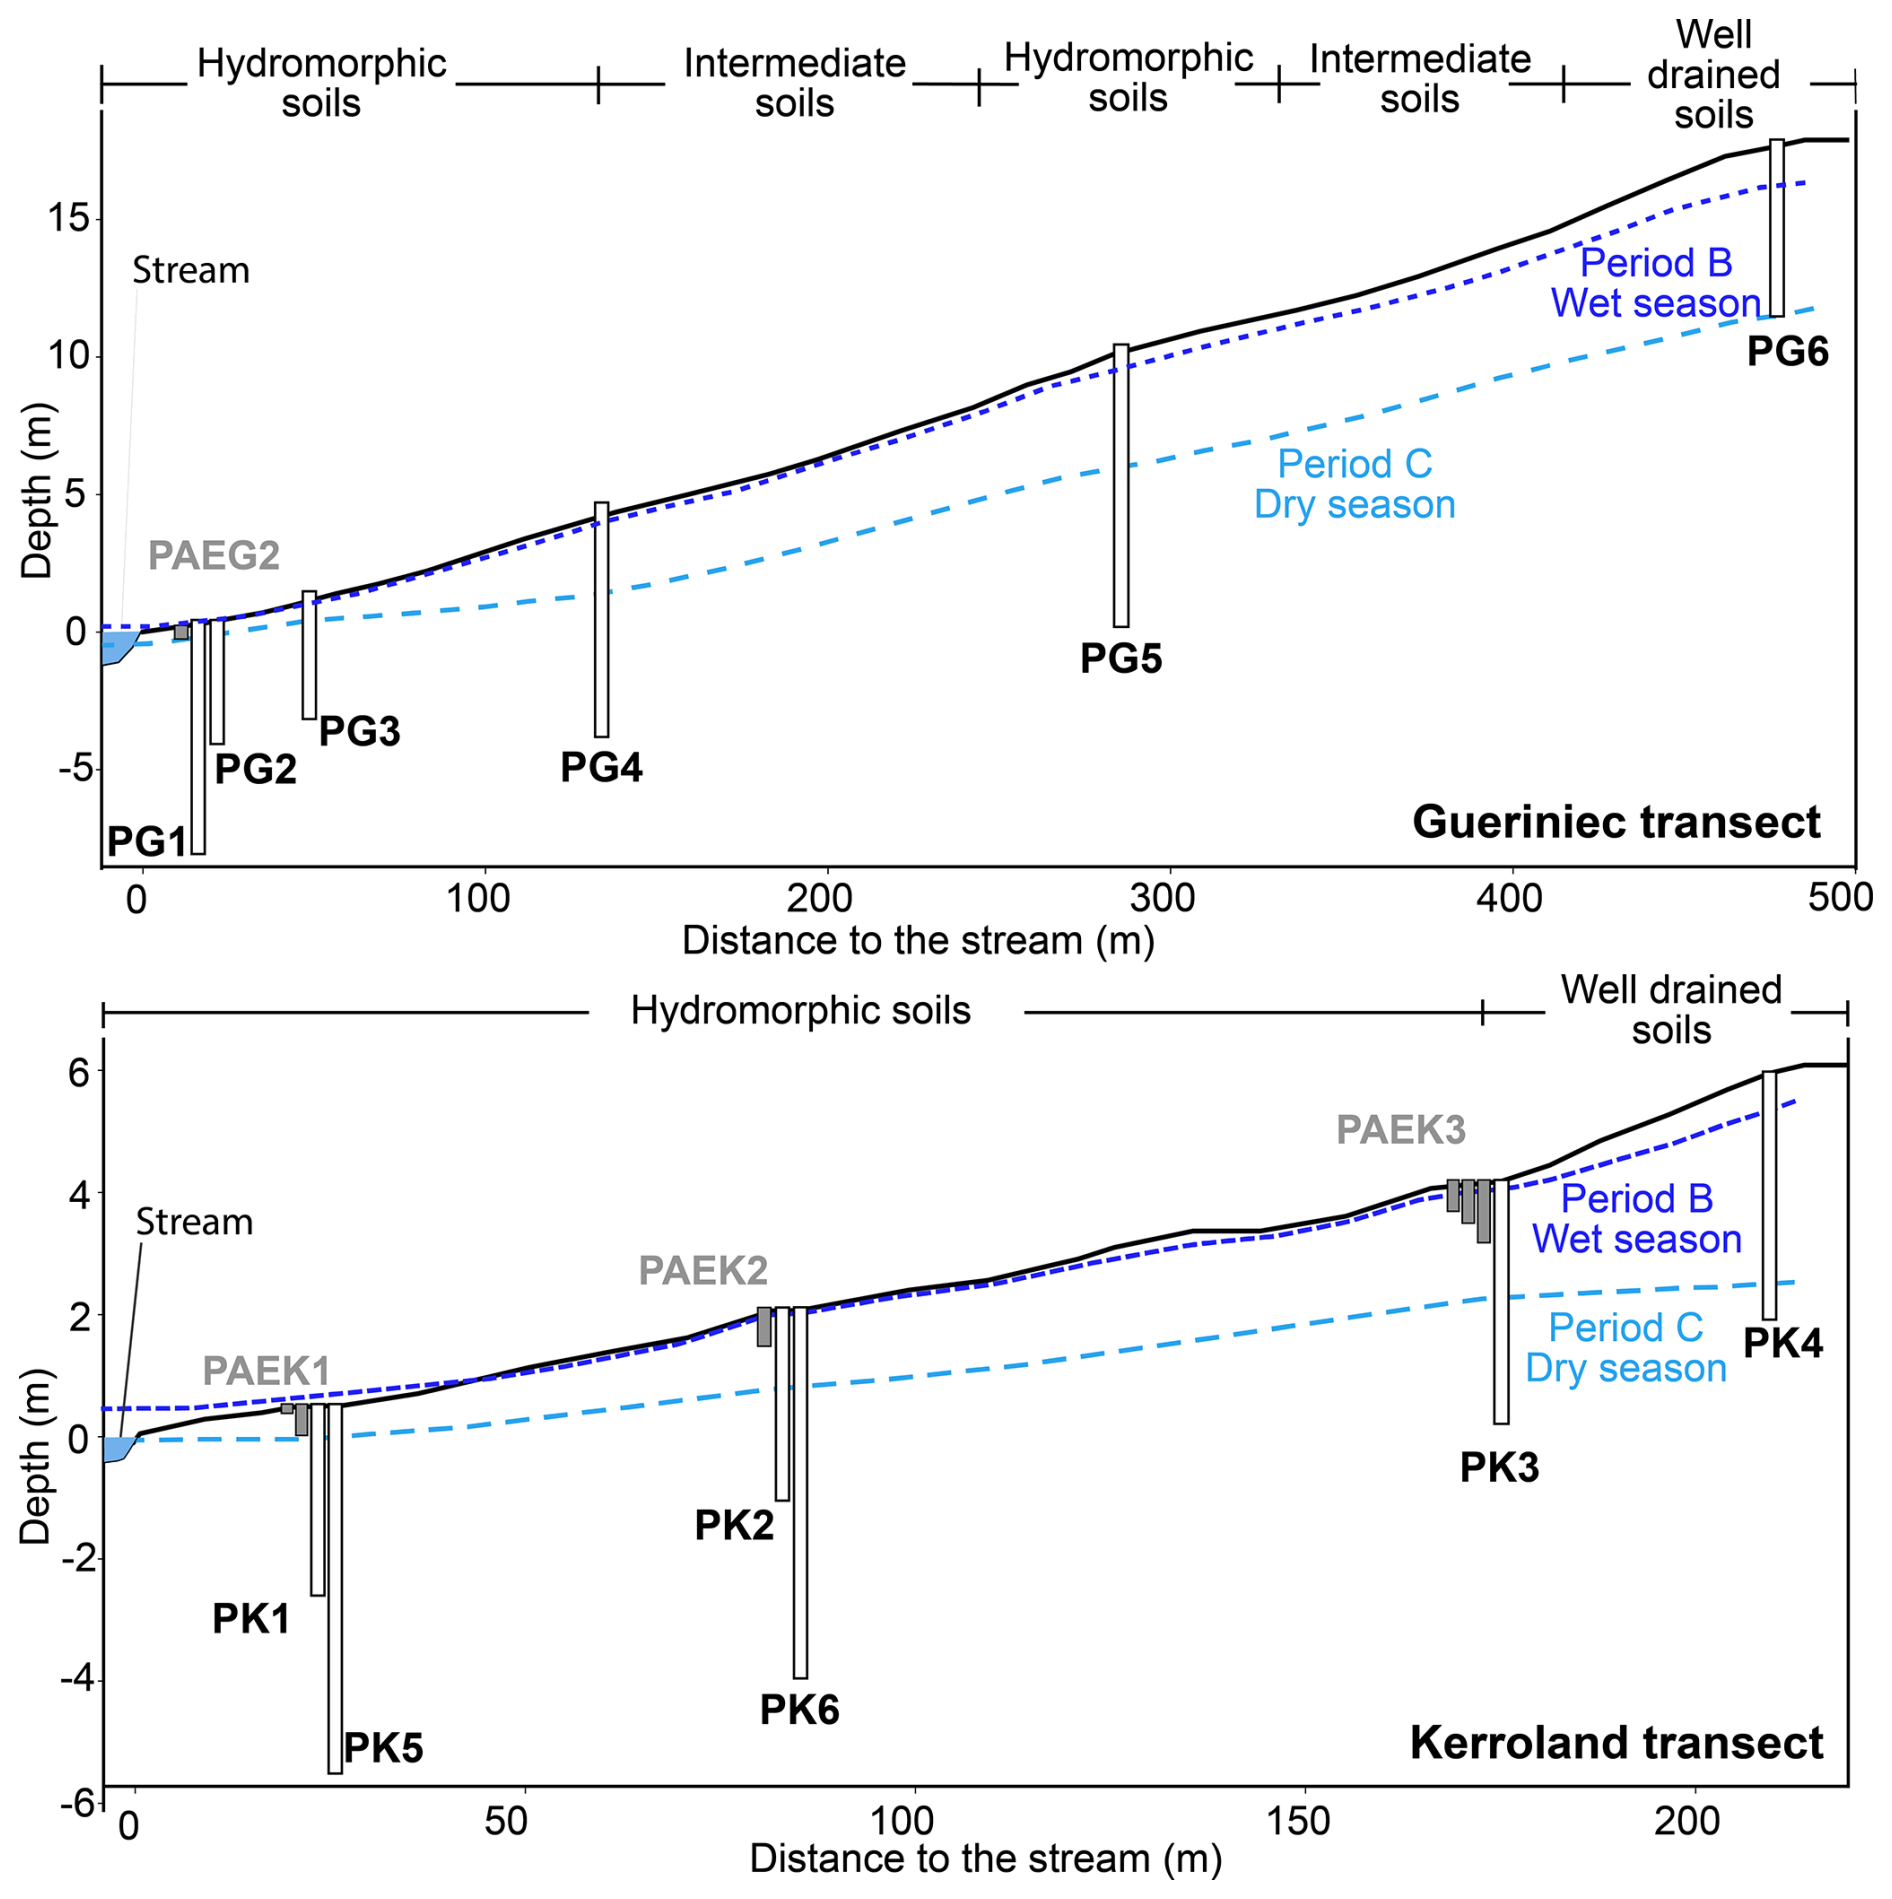
Figure A1Cross sections of the Guériniec and Kerroland transects. Black rectangles represent piezometers and grey rectangles lysimeters. The dark blue dotted line represents the piezometer level during high flow in the wet season (Period B, Humbert et al., 2015; Molenat et al., 2008) and the light blue dashed line the water level during recession in the dry season (Period C) for one hydrological year.
To isolate the composition of secondary phases in the clay sized fraction, we applied a correction to account for contamination by clay-sized primary minerals. First, we determined the mineralogy of the clay fraction by inverting a simple mixing model (Aguirre et al., 2017), assuming that the mineral composition consists of quartz (SiO2), kaolinite (Al2Si2O5(OH)4), muscovite (KAl2(AlSi3O10)(OH)2) and microcline (KAlSi3O8). This can be represented in matrix form as: Ax=b, where A is the matrix of mineral chemistry, b is the composition clay fraction (Table B1), and x is the vector of mineral fractions, such that . To solve this system, we employed a Monte Carlo simulation with 100 000 iterations, using normal distributions for Si, Al, and K concentrations, with a standard deviation of 5 % of the concentration values, consistent with the long-term analytical precision of elemental analysis (<5 %). For both samples we found that approximately 50 % of the clay fraction is composed of kaolinite, with the remainder attributed to primary minerals (Table B1). Once the mineral fractions were determined, we correct the Si and Al concentration to account for the contribution from kaolinite using Gaussian propagation of uncertainty.
Because direct measurements of δ30Si and ratios in individual minerals are not available for our samples, we estimated their values using a compilation of published data (Table S1 in the Supplement). Representative values were selected for each mineral present in the bedrock and clay fractions (Table B2). These estimates were necessary to isolate the δ30Si and ratios specific to kaolinite.
Table B1Mineral fractions in the clay fraction as determined by the inversion of a mixing model. Corrected Si and Al concentrations, along with δ30Si and ratios, reflect only the secondary mineral content, specifically kaolinite.
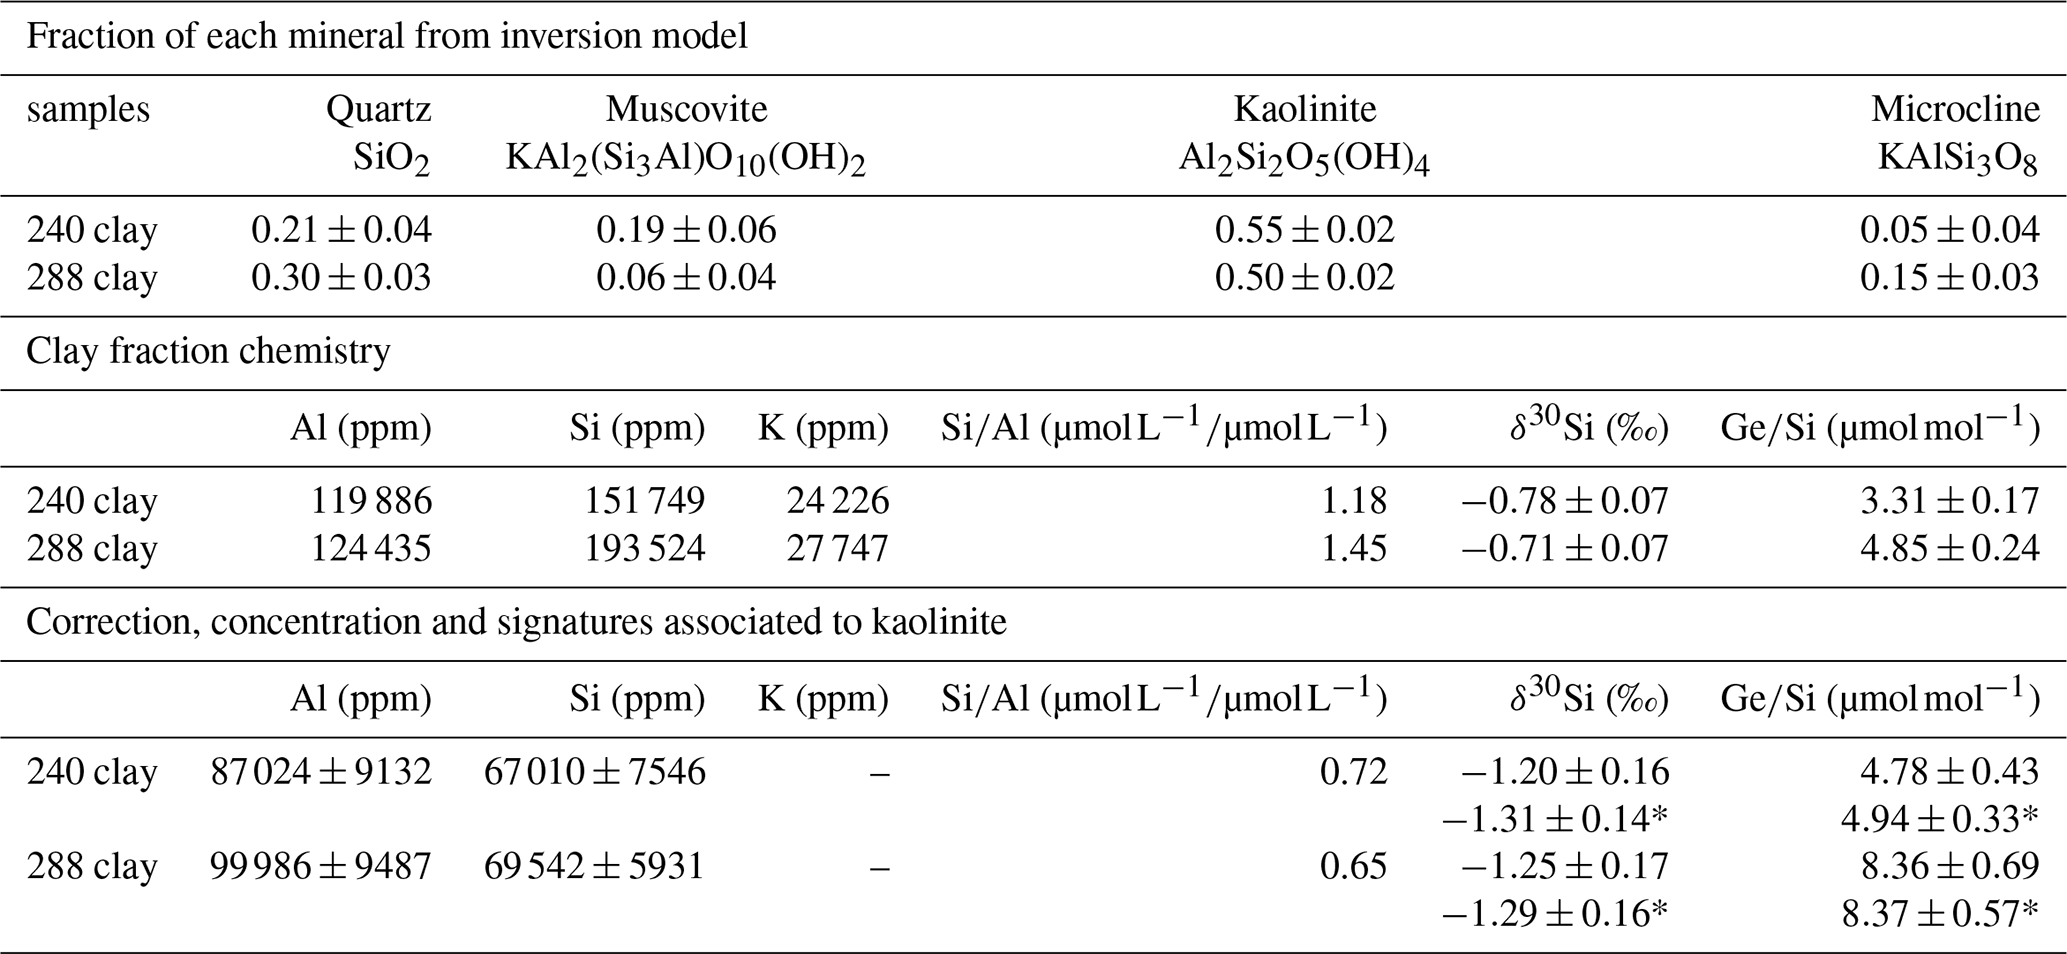
* Assuming that all primary minerals retain the bedrock signature
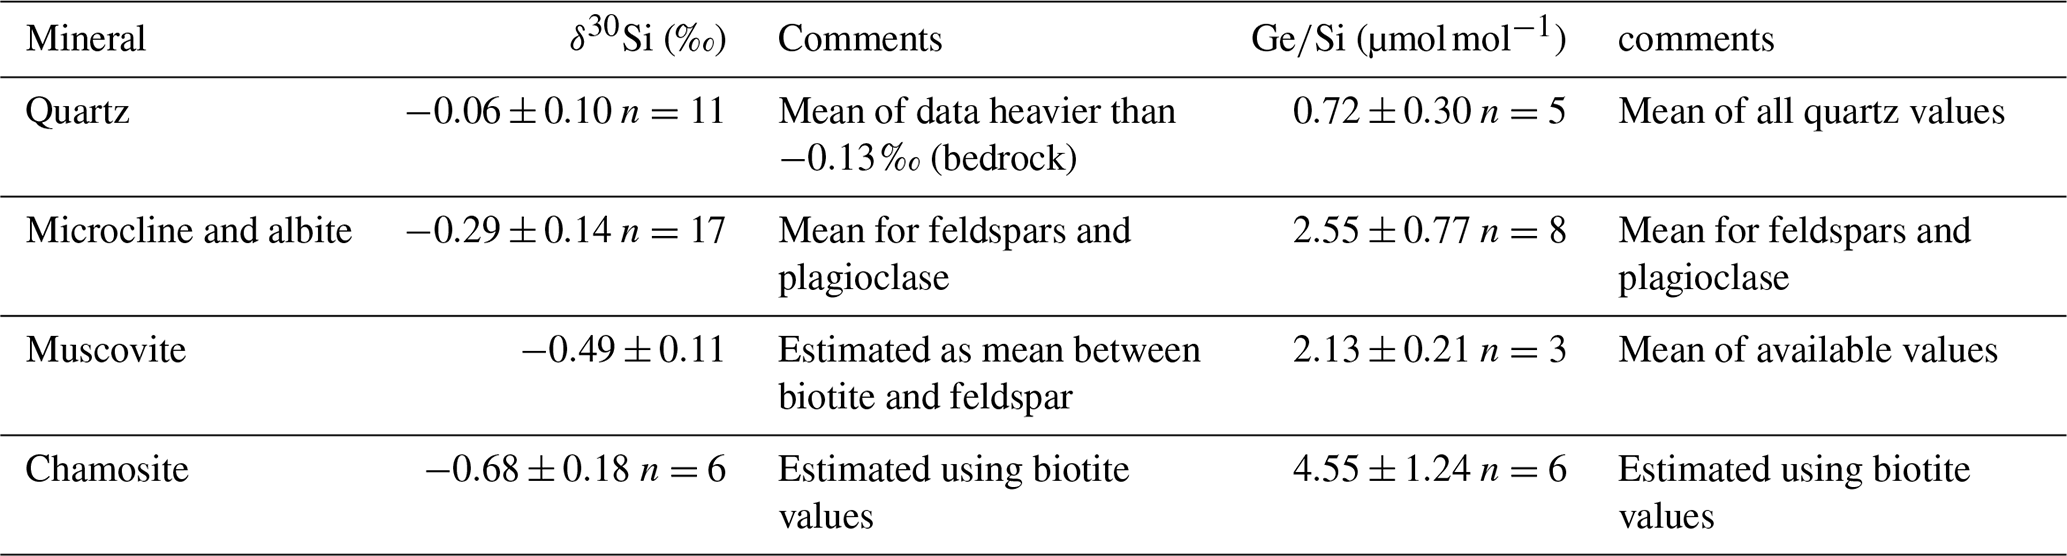
For silicon isotopes, we selected only quartz data with heavier δ30Si values than the bedrock average of ‰. Including lighter quartz data would not reproduce the bulk bedrock signature, as the other minerals exhibit even lighter δ30Si values. This filtering resulted in a quartz δ30Si of ‰. For microcline and albite, we used the average value for plagioclases and feldspar ( ‰). Although no direct data are available for muscovite, fractionation in silicates is known to increase with polymerization (Douthitt, 1982; Savage et al., 2014) and is influenced by the nature of the interlayer cations (Méheut et al., 2009; Méheut and Schauble, 2014). We therefore selected the mean between feldspar and biotite: ‰. For ratios, we used 0.72±0.30 µmol mol−1 for quartz, 2.55±0.77 µmol mol−1 for albite and microline, and 2.13±0.21 µmol mol−1 for muscovite.
Based on the mineral fractions and their respective isotopic and elemental compositions, we isolated the kaolinite δ30Si and signatures via Monte Carlo simulation. The resulting δ30Si values for kaolinite were ‰ and ‰ for the 240 and 288 soil profiles, respectively, with corresponding ratios of 4.78±0.41 and 8.31±0.74 µmol mol−1.
We acknowledge that the estimated δ30Si and signatures for individual minerals may be uncertain. To test the sensitivity of our results, we also calculated kaolinite signatures under the assumption that all primary minerals retain the bedrock signature. This yielded similar values within uncertainty: ‰ and µmol mol−1 for the 240 clay sample, and ‰ and µmol mol−1 for the 288 sample.
Using the values form Table B2 we have calculated the bedrock δ30Si and ratios corrected for quartz, which is assumed to be inert. To account for the water signature resulting from incongruent dissolution, and assuming a silicon mass balance with contributions solely from muscovite, albite, and chamosite (based on the values in Table B2), a Monte Carlo simulation yielded δ30Si ‰ and µmol mol−1.
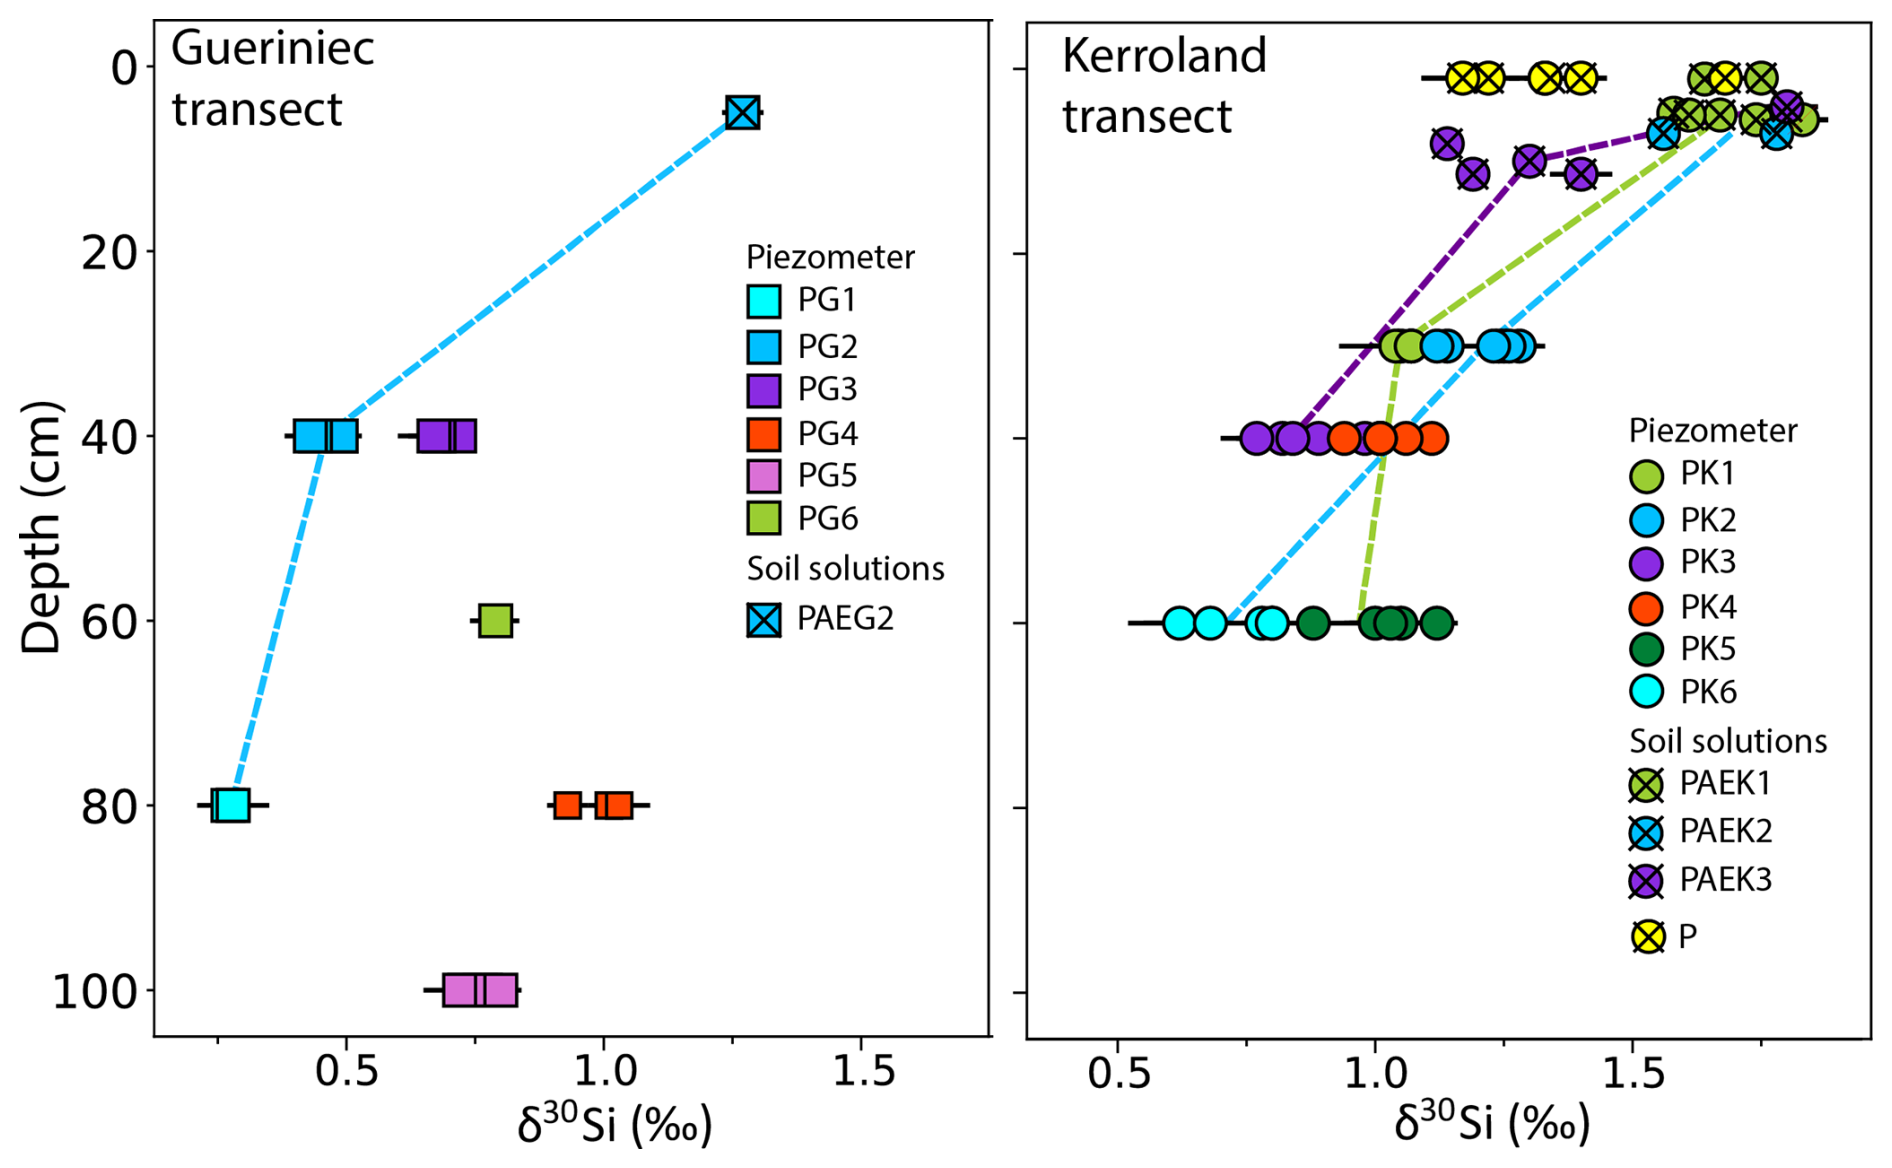
Figure C1Subsurface water δ30Si signature vs. sampling depth for the Gueriniec (left) and Kerroland (right) transects. The colored lines join the samples collected at the same location but at different depths.
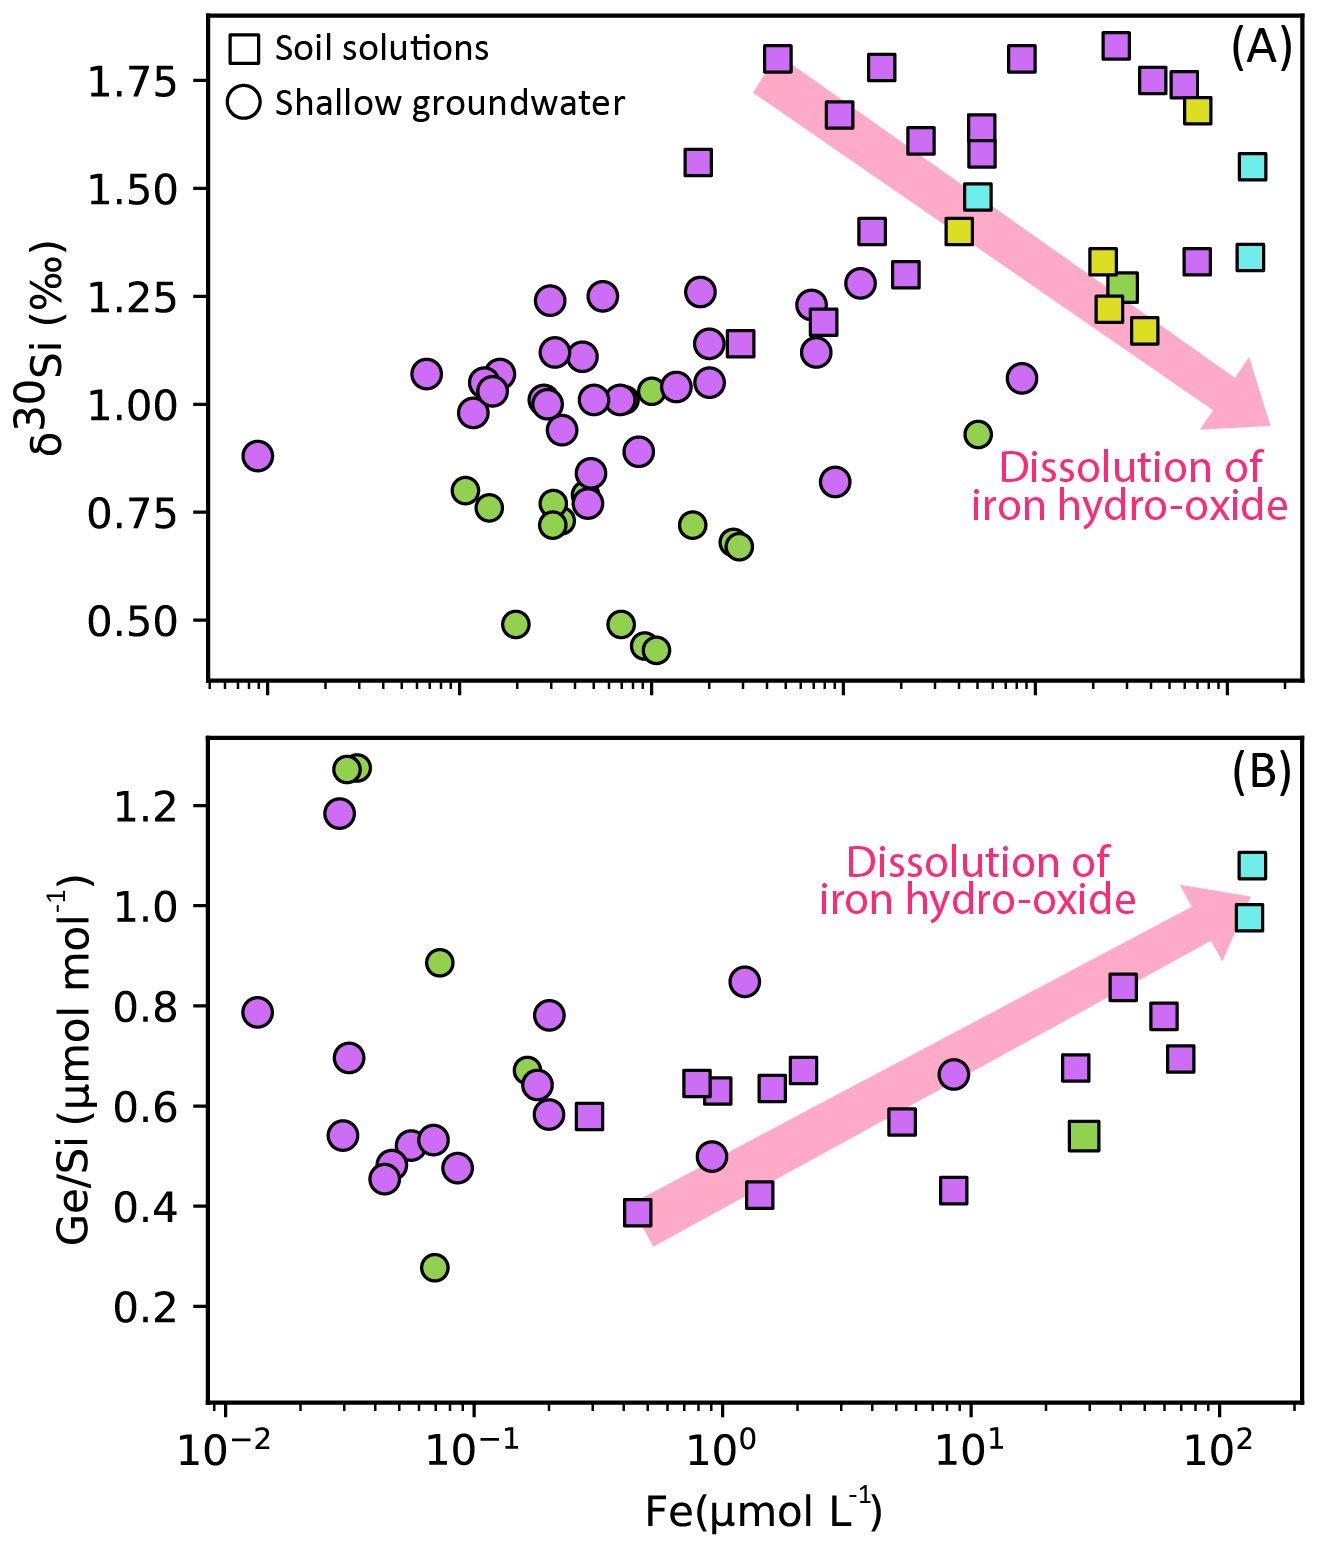
Figure C2Cross plots of dissolved (A) δ30Si and Fe concentration and (B) and Fe concentration. Arrows illustrate the trends expected for iron oxyhydroxide precipitation. Sampling sites are color-coded as follows: Kerroland (purple), Gueriniec (green), Mercy wetland (cyan), and P lysimeters (yellow).
To solve Eqs. (1), (2), and (3), we expressed them in matrix form and used Gaussian elimination to calculate , and . To account for uncertainties in the measured Si isotopes and ratios, we applied a Monte Carlo approach across three distinct scenarios. Normal distributions were assigned in all scenarios using the mean and standard deviations of the ratios and δ30Si measured in secondary clays (n=2), bedrock (n=1) and stream samples (n=8 for δ30Si and n=5 for ratios), except for the leaf samples (Table 1). It should be noted that for the clay fraction, the reported and δ30Si values represent the mean and the propagated analytical uncertainty, rather than the standard deviation of replicate measurements.
In Scenario 1, we applied a uniform distribution to and , using the minimum and maximum isotopic signatures from plant samples (n=4) to capture the high variability in the plant data. In Scenario 2, we used a normal distribution based solely on wheat leaves (n=2), while in Scenario 3 we applied parameters obtained from measurements on maize (n=2).
Model solutions where , and exceeded 1 or were less than 0 were excluded. Additionally, iterations with negatives ratios or secondary clay values below 3.31 (the minimum measured clay fraction) were also removed. Out of the 6 million iterations, 7.27 % were valid for Scenario 1, 1.92 % for Scenario 2, and 51,59 % for Scenario 3.
Table D1Parameters and results of the Si isotopic and mass balance used to determine , , and under the three scenarios. SD represents the standard deviation, while Q1 and Q3 indicate the first (25th percentile) and third (75th percentile) quartiles of the data distribution.
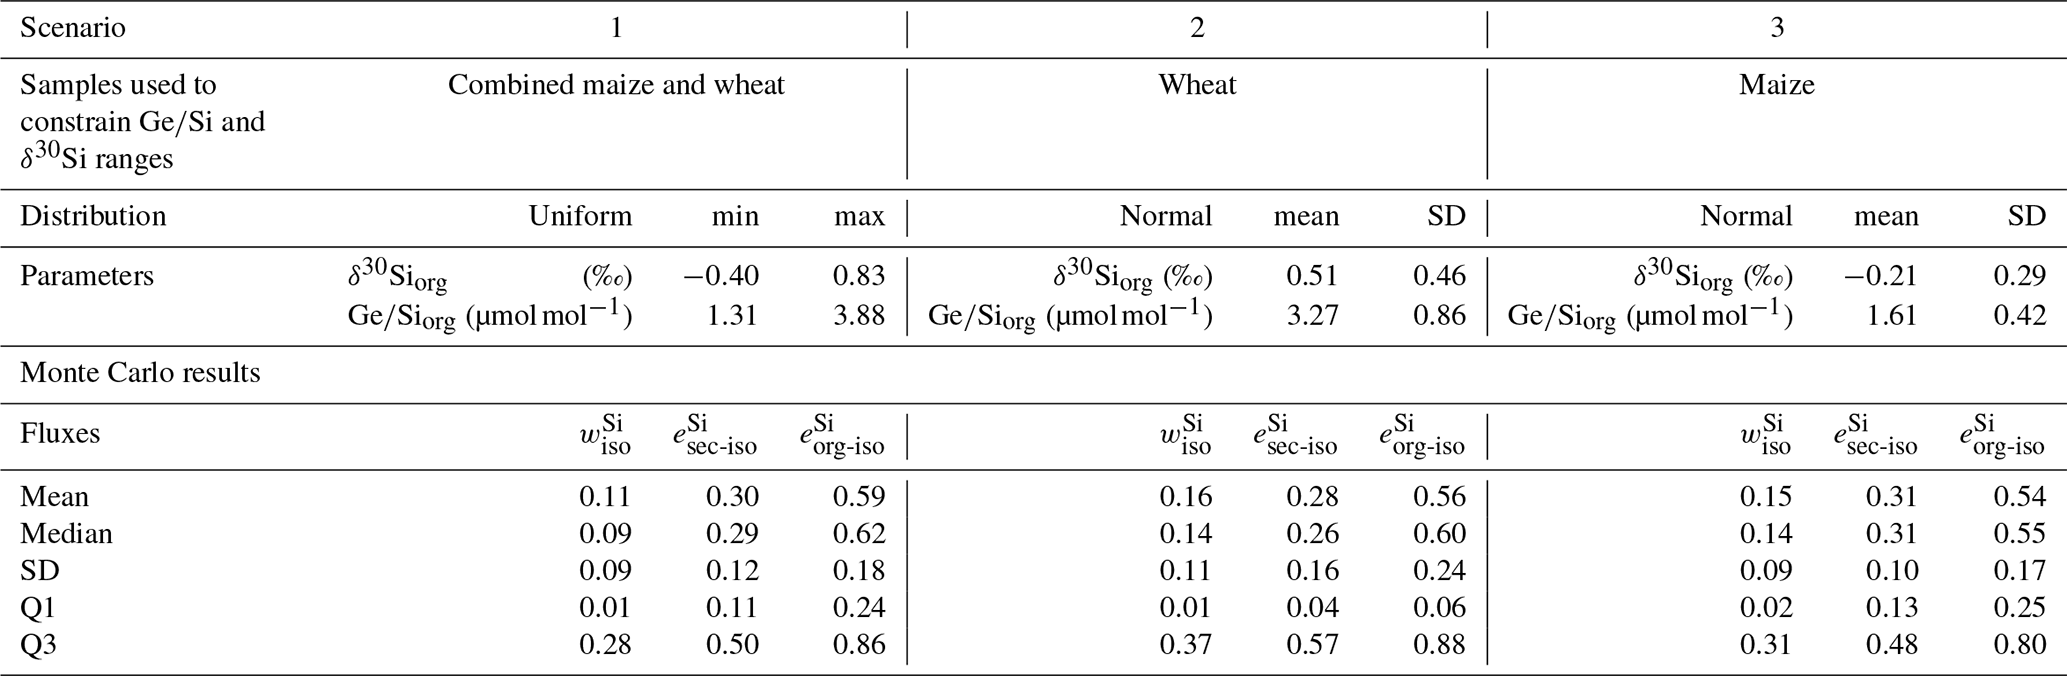
To determine the export of dissolved Si (WSi) by the stream, we used Si concentration data alongside discharge measurements at the catchment outlet. The discharge data, spanning from 2000 to 2023, enabled the estimation of annual fluxes over 22 years. This data set is available in https://agrhys.fr/BVE/vidae/ (last access: March 2024), recorded in liter per second (L s−1), which we have recalculated to liter per hour (L h−1). During this period, there were 536 d with missing discharge data, averaging 24 d per year, with a peak of 59 total missing days in one year. This absence of data could potentially lead to an underestimation of Si fluxes.
Daily Si concentration measurements are available from fall 1999 until summer 2000, with additional samples collected in 2003, 2006, 2007, and during three flood events in 2021 and 2022 at an hourly resolution. This dataset includes 844 samples, covering various seasons and hydrological conditions (Table 4; López-Urzúa et al., 2025). Daily samples (from 1999 to 2007) were collected during the daytime hours of 15:00 to 18:00 local time (LT; CET/CEST), and the corresponding discharge values were calculated as the average discharge during these hours.
To estimate Si concentrations over the 22 years with discharge data, we fitted a linear relationship between Si concentration [Si] and discharge (Q) in logarithmic space. Assuming a 5 % independent error for both Si concentration (µmol L−1) and discharge (L s−1) measurements, we utilized IsoplotR's maximum likelihood estimator (Vermeesch, 2018) to determine the power law-equation describing the relationship between Si and Q yielding b being (SE, standard error) and the constant k being 195.9±1.06 SE.
We estimate the Si concentration and associated standard error for each hour using the following criteria: if Q (L s−1) <3: [Si] = 154.77 (µmol L−1); otherwise, [Si] = . This approach is used because, at very low Q values, the calculation can yield unrealistically high Si concentrations that have never been measured in the stream. Once the Si concentration was estimated for each hour, we calculate the annual the Si flux and its associated error for each hydrological year from 2000 to 2022 (Table 5; López-Urzúa et al., 2025). Then to calculate we divided in mol m−2 yr−1 by the Si concentration of the bedrock multiplied by denudation.
The isotopic composition of each compartment within the Critical Zone can be related to elemental fluxes and isotopic fractionation (Bouchez et al., 2013). Because at Kervidy-Naizin a portion of organic particulate erosion originates from harvesting, we reformulate Eq. (5e) from (Bouchez et al., 2013) as follows:
Here, represents the flux of Si harvested, determined as a function of Si fluxes and isotopic fractionation for secondary mineral precipitation () and plant uptake (). The terms and represents the flux of Si released during primary mineral dissolution prior to secondary mineral formation, occurring at the weathering front and in the regolith, respectively, expressed in mol m−2 yr−1. This dissolution is assumed to be congruent. These terms can be calculated using Eq. (15) from Bouchez et al. (2013):
represents the loss of Si through the primary mineral dissolution between rock and erodible material. This is distinct from the definition of τ by Chadwick et al. (1990), which is a net loss and thus includes the effects of both the dissolution of primary minerals and the precipitation of secondary minerals. By combining Eqs. (F1) and (F2), and normalizing to the total Si flux, we can determine the fraction of Si harvested () as:
Table F1Parameters and results of the isotopic fractionation used to determine under the three scenarios. SD represents the standard deviation, while 5 % and 95 % indicate the 5th and 95th percentiles of the data distribution.
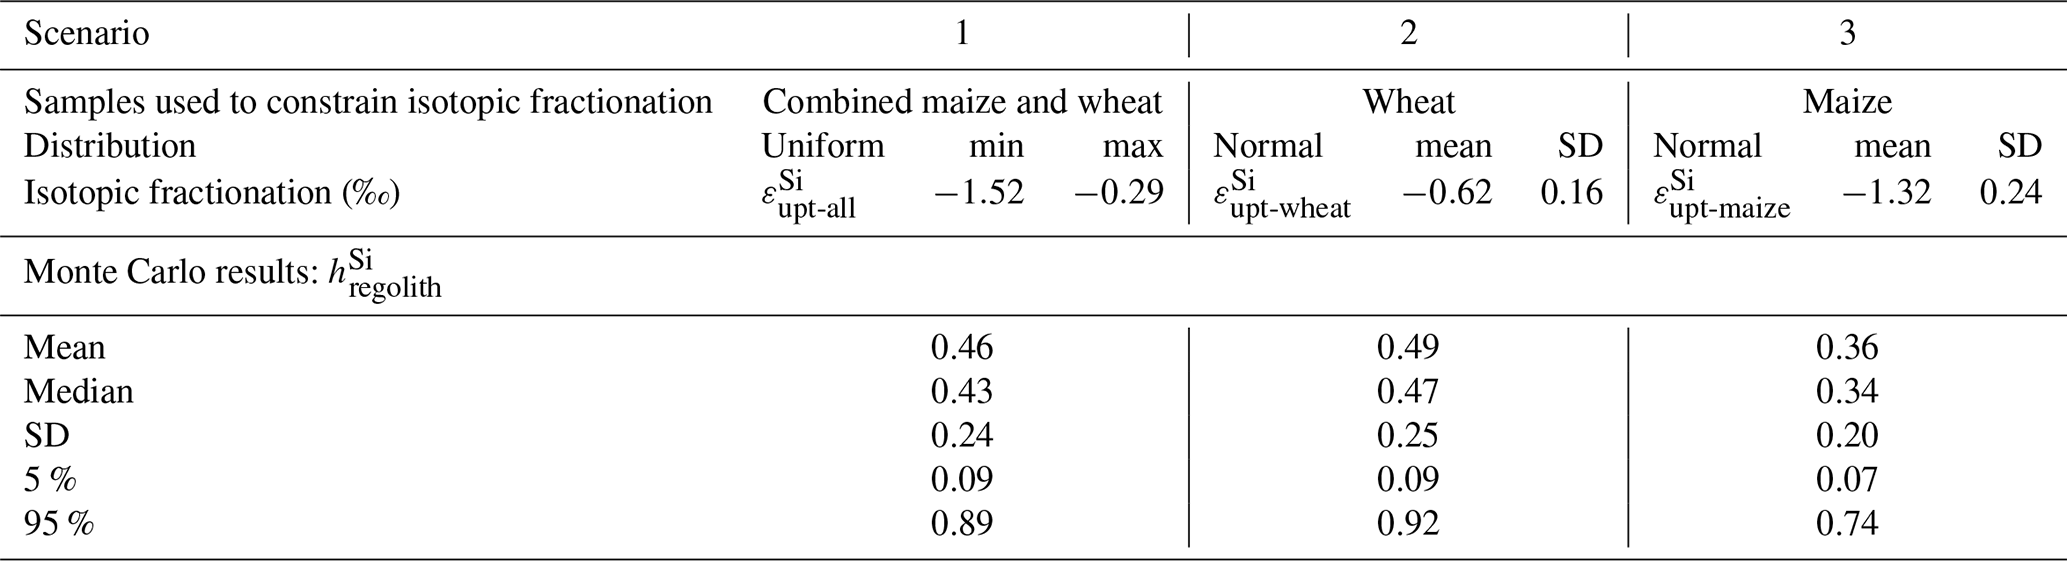
A single bedrock sample may not fully capture potential lithological heterogeneity of the parent material, particularly for relatively immobile elements such as Ti. To assess the impact of this variability on our mass-balance calculations, we conducted a sensitivity analysis using the dataset of Denis and Dabard (1988), who reported chemical analyses for nine samples from the same schist unit that underlies our study basin. These samples, collected along a transect approximately 32 km southeast of our site, exhibit TiO2 concentrations with a mean of 0.71±0.19 wt % (SD), closely matching the TiO2 concentration measured in our local bedrock sample (0.74±0.04 wt %).
To incorporate both natural variability and analytical uncertainty, we performed a Monte Carlo simulation for the calculation of τprim, and . In this simulation, the bedrock Ti concentration was modeled as a normal distribution with a mean of 0.74 wt % and a standard deviation of 0.19 wt %. For the soil samples, a 5 % relative uncertainty was assigned to the Ti concentrations. Despite this more rigorous treatment of uncertainty, the resulting values are nearly identical to those reported in Sect. 5.5. This is because τprim, and in Eq. (10) were already calculated using the mean values across all soil profile samples, which inherently incorporate substantial natural variability – likely reflecting, in part, variability in bedrock composition. The Monte Carlo-derived estimates are , , and . These consistent results lend support to the robustness of our estimates and demonstrate that the updated method supports the same conclusions, while providing a more comprehensive representation of uncertainty.
Supplementary tables are available in the Supplement and the dataset including the hydrological data and geochemistry of water, soil, bedrock, and plants are available at https://doi.org/10.5281/zenodo.14615156 (López-Urzúa et al., 2025).
The supplement related to this article is available online at https://doi.org/10.5194/bg-22-6067-2025-supplement.
SLU: Conceptualization, data curation, formal analysis, methodology, investigation, Visualization, Writing – original draft. LD: Formal analysis, methodology, investigation, Supervision, Funding acquisition, writing – review and editing. JB: Formal analysis, methodology, investigation, writing – review and editing.
The contact author has declared that none of the authors has any competing interests.
Publisher's note: Copernicus Publications remains neutral with regard to jurisdictional claims made in the text, published maps, institutional affiliations, or any other geographical representation in this paper. While Copernicus Publications makes every effort to include appropriate place names, the final responsibility lies with the authors. Also, please note that this paper has not received English language copy-editing. Views expressed in the text are those of the authors and do not necessarily reflect the views of the publisher.
We extend our sincere gratitude to Pierre Burckel for measuring trace elements and Si concentrations by ICP-MS Agilent 7900, Caroline Gorge for anion analysis by ion chromatography, and Sophie Nowak for XRD and FRX analyses. Special thanks to Johanne Lebrun Thauront and Samuel Abiven for providing the soil samples and extraction experiments data. We are particularly grateful to Ophélie Fovet, Laurent Jeanneau, Yannick Hamon, Mikaël Faucheux, and Patrice Petitjean from the ORE ArgHys Critical Zone Observatory for their exceptional dedication and support. Their contributions, including discharge data, stream chemistry data, plant and water samples, and invaluable field assistance, were crucial to the success of this project. We also thank the handling editor, Sara Vicca, and the two anonymous reviewers for their constructive comments and suggestions that helped improve the quality of this manuscript.
This study was financially supported by the Agence Nationale de la Recherche (ANR) through the “Investissements d'avenir” program under the project CZTOP (grant no. ANR-17-MPGA-0009). Geochemical analyses presented here were supported by the IPGP multidisciplinary program PARI and the Île-de-France region SESAME (grant no. 12015908).
This paper was edited by Sara Vicca and reviewed by two anonymous referees.
Aguirre, A. A., Derry, L. A., Mills, T. J., and Anderson, S. P.: Colloidal transport in the Gordon Gulch catchment of the Boulder C reek CZO and its effect on C-Q relationships for silicon, Water Resour. Res., 53, 2368–2383, https://doi.org/10.1002/2016WR019730, 2017.
Akkal-Corfini, N., Menasseri-Aubry, S., Rieux, C., Le Naour, E., and Viaud, V.: Caractérisation des systèmes de culture du bassin versant du Coetdan (ORE AgrHys, site de Naizin), Editions INRA UMR 1069 SAS, 2014.
Ameijeiras-Mariño, Y., Opfergelt, S., Derry, L. A., Robinet, J., Govers, G., Minella, J. P. G., and Delmelle, P.: ratios point to increased contribution from deeper mineral weathering to streams after forest conversion to cropland, Appl. Geochem., 96, 24–34, https://doi.org/10.1016/j.apgeochem.2018.06.002, 2018.
Anders, A. M., Sletten, R. S., Derry, L. A., and Hallet, B.: Germanium/silicon ratios in the Copper River Basin, Alaska: Weathering and partitioning in periglacial versus glacial environments: IN GLACIAL/PERIGLACIAL ENVIRONMENTS, J. Geophys. Res.-Earth Surf., 108, https://doi.org/10.1029/2003JF000026, 2003.
Baronas, J. J., Torres, M. A., West, A. J., Rouxel, O., Georg, B., Bouchez, J., Gaillardet, J., and Hammond, D. E.: Ge and Si isotope signatures in rivers: A quantitative multi-proxy approach, Earth Planet. Sci. Lett., 503, 194–215, https://doi.org/10.1016/j.epsl.2018.09.022, 2018.
Baronas, J. J., West, A. J., Burton, K. W., Hammond, D. E., Opfergelt, S., Pogge Von Strandmann, P. A. E., James, R. H., and Rouxel, O. J.: Ge and Si Isotope Behavior During Intense Tropical Weathering and Ecosystem Cycling, Global Biogeochemical Cycles, 34, e2019GB006522, https://doi.org/10.1029/2019GB006522, 2020.
Berggren, D. and Mulder, J.: The role of organic matter in controlling aluminum solubility in acidic mineral soil horizons, Geochim. Cosmochim. Ac., 59, 4167–4180, https://doi.org/10.1016/0016-7037(95)94443-J, 1995.
Beusen, A. H. W., Bouwman, A. F., Dürr, H. H., Dekkers, A. L. M., and Hartmann, J.: Global patterns of dissolved silica export to the coastal zone: Results from a spatially explicit global model, Global Biogeochemical Cycles, 23, 2008GB003281, https://doi.org/10.1029/2008GB003281, 2009.
Blecker, S. W., King, S. L., Derry, L. A., Chadwick, O. A., Ippolito, J. A., and Kelly, E. F.: The ratio of germanium to silicon in plant phytoliths: quantification of biological discrimination under controlled experimental conditions, Biogeochemistry, 86, 189–199, https://doi.org/10.1007/s10533-007-9154-7, 2007.
Bouchez, J. and Von Blanckenburg, F.: The role of vegetation in setting strontium stable isotope ratios in the Critical Zone, Am. J. Sci., 321, 1246–1283, https://doi.org/10.2475/08.2021.04, 2021.
Bouchez, J., Gaillardet, J., France-Lanord, C., Maurice, L., and Dutra-Maia, P.: Grain size control of river suspended sediment geochemistry: Clues from Amazon River depth profiles, Geochem. Geophys. Geosyst., 12, 2010GC003380, https://doi.org/10.1029/2010GC003380, 2011.
Bouchez, J., Von Blanckenburg, F., and Schuessler, J. A.: Modeling novel stable isotope ratios in the weathering zone, Am. J. Sci., 313, 267–308, https://doi.org/10.2475/04.2013.01, 2013.
Cama, J. and Ganor, J.: The effects of organic acids on the dissolution of silicate minerals: A case study of oxalate catalysis of kaolinite dissolution, Geochim. Cosmochim. Ac., 70, 2191–2209, https://doi.org/10.1016/j.gca.2006.01.028, 2006.
Carey, J. C. and Fulweiler, R. W.: Human appropriation of biogenic silicon – the increasing role of agriculture, Funct. Ecol., 30, 1331–1339, https://doi.org/10.1111/1365-2435.12544, 2016.
Carlisle, E. M.: Silicon as a trace nutrient, Sci. Total Environ., 73, 95–106, https://doi.org/10.1016/0048-9697(88)90190-8, 1988.
Chadwick, O. A., Brimhall, G. H., and Hendricks, D. M.: From a black to a gray box – a mass balance interpretation of pedogenesis, Geomorphology, 3, 369–390, https://doi.org/10.1016/0169-555X(90)90012-F, 1990.
Charbonnier, Q., Bouchez, J., Gaillardet, J., and Gayer, É.: Barium stable isotopes as a fingerprint of biological cycling in the Amazon River basin, Biogeosciences, 17, 5989–6015, https://doi.org/10.5194/bg-17-5989-2020, 2020.
Charbonnier, Q., Bouchez, J., Gaillardet, J., Gayer, E., and Porder, S.: A global imbalance in potassium and barium river export: the result of biological uptake?, Geochem. Perspect. Lett., 21, 32–36, https://doi.org/10.7185/geochemlet.2214, 2022.
Clymans, W., Struyf, E., Govers, G., Vandevenne, F., and Conley, D. J.: Anthropogenic impact on amorphous silica pools in temperate soils, Biogeosciences, 8, 2281–2293, https://doi.org/10.5194/bg-8-2281-2011, 2011.
Conley, D. J., Likens, G. E., Buso, D. C., Saccone, L., Bailey, S. W., and Johnson, C. E.: Deforestation causes increased dissolved silicate losses in the Hubbard Brook Experimental Forest, Glob. Change Biol., 14, 2548–2554, https://doi.org/10.1111/j.1365-2486.2008.01667.x, 2008.
Cornelis, J.-T., Delvaux, B., Cardinal, D., André, L., Ranger, J., and Opfergelt, S.: Tracing mechanisms controlling the release of dissolved silicon in forest soil solutions using Si isotopes and ratios, Geochim. Cosmochim. Ac., 74, 3913–3924, https://doi.org/10.1016/j.gca.2010.04.056, 2010.
Cornelis, J.-T., Delvaux, B., Georg, R. B., Lucas, Y., Ranger, J., and Opfergelt, S.: Tracing the origin of dissolved silicon transferred from various soil-plant systems towards rivers: a review, Biogeosciences, 8, 89–112, https://doi.org/10.5194/bg-8-89-2011, 2011.
Datnoff, L. E., Snyder, G. H., and Korndörfer, G. H. (Eds.): Silicon in Agriculture, Studies in Plant Science, vol. 8, Elsevier, Amsterdam, ISBN 978-0-444-50487-3, 2001.
Delstanche, S., Opfergelt, S., Cardinal, D., Elsass, F., André, L., and Delvaux, B.: Silicon isotopic fractionation during adsorption of aqueous monosilicic acid onto iron oxide, Geochim. Cosmochim. Ac., 73, 923–934, https://doi.org/10.1016/j.gca.2008.11.014, 2009.
Delvigne, C., Opfergelt, S., Cardinal, D., Delvaux, B., and André, L.: Distinct silicon and germanium pathways in the soil-plant system: Evidence from banana and horsetail: DISTINCT SI AND GE PATHWAYS IN PLANTS, J. Geophys. Res.-Biogeosciences, 114, https://doi.org/10.1029/2008JG000899, 2009.
Delvigne, C., Guihou, A., Schuessler, J. A., Savage, P., Poitrasson, F., Fischer, S., Hatton, J. E., Hendry, K. R., Bayon, G., Ponzevera, E., Georg, B., Akerman, A., Pokrovsky, O. S., Meunier, J., Deschamps, P., and Basile-Doelsch, I.: Silicon Isotope Analyses of Soil and Plant Reference Materials: An Inter-Comparison of Seven Laboratories, Geostand. Geoanalytical Res., 45, 525–538, https://doi.org/10.1111/ggr.12378, 2021.
Denis, E. and Dabard, M. P.: Sandstone petrography and geochemistry of late proterozoic sediments of the armorican massif (France) – A key to basin development during the cadomian orogeny, Precambrian Research, 42, 189–206, https://doi.org/10.1016/0301-9268(88)90017-4, 1988.
Derry, L. A., Kurtz, A. C., Ziegler, K., and Chadwick, O. A.: Biological control of terrestrial silica cycling and export fluxes to watersheds, Nature, 433, 728–731, https://doi.org/10.1038/nature03299, 2005.
Dia, A., Gruau, G., Olivié-Lauquet, G., Riou, C., Molénat, J., and Curmi, P.: The distribution of rare earth elements in groundwaters: assessing the role of source-rock composition, redox changes and colloidal particles, Geochim. Cosmochim. Ac., 64, 4131–4151, https://doi.org/10.1016/S0016-7037(00)00494-4, 2000.
Ding, T. P., Ma, G. R., Shui, M. X., Wan, D. F., and Li, R. H.: Silicon isotope study on rice plants from the Zhejiang province, China, Chem. Geol., 218, 41–50, https://doi.org/10.1016/j.chemgeo.2005.01.018, 2005.
Ding, T. P., Zhou, J. X., Wan, D. F., Chen, Z. Y., Wang, C. Y., and Zhang, F.: Silicon isotope fractionation in bamboo and its significance to the biogeochemical cycle of silicon, Geochim. Cosmochim. Ac., 72, 1381–1395, https://doi.org/10.1016/j.gca.2008.01.008, 2008.
Douthitt, C. B.: The geochemistry of the stable isotopes of silicon, Geochim. Cosmochim. Ac., 46, 1449–1458, https://doi.org/10.1016/0016-7037(82)90278-2, 1982.
Drever, J. I. and Stillings, L. L.: The role of organic acids in mineral weathering, Colloids Surf. Physicochem. Eng. Asp., 120, 167–181, https://doi.org/10.1016/S0927-7757(96)03720-X, 1997.
Duchaufour, P.: Sesquioxide-rich soils, in: Pedology: Pedogenesis and Classification, Springer, Dordrecht, 373–425, https://doi.org/10.1007/978-94-011-6003-2_13, 1982.
Dürr, H. H., Meybeck, M., Hartmann, J., Laruelle, G. G., and Roubeix, V.: Global spatial distribution of natural riverine silica inputs to the coastal zone, Biogeosciences, 8, 597–620, https://doi.org/10.5194/bg-8-597-2011, 2011.
Epstein, E.: SILICON, Annu. Rev. Plant Physiol. Plant Mol. Biol., 50, 641–664, https://doi.org/10.1146/annurev.arplant.50.1.641, 1999.
Evans, M. J. and Derry, L. A.: Quartz control of high germanium/silicon ratios in geothermal waters, Geology, 30, 1019, https://doi.org/10.1130/0091-7613(2002)030<1019:QCOHGS>2.0.CO;2, 2002.
Fernandez, N. M., Zhang, X., and Druhan, J. L.: Silicon isotopic re-equilibration during amorphous silica precipitation and implications for isotopic signatures in geochemical proxies, Geochim. Cosmochim. Ac., 262, 104–127, https://doi.org/10.1016/j.gca.2019.07.029, 2019.
Fernandez, N. M., Bouchez, J., Derry, L. A., Chorover, J., Gaillardet, J., Giesbrecht, I., Fries, D., and Druhan, J. L.: Resiliency of Silica Export Signatures When Low Order Streams Are Subject to Storm Events, J. Geophys. Res.-Biogeosciences, 127, e2021JG006660, https://doi.org/10.1029/2021JG006660, 2022.
Fovet, O., Ruiz, L., Gruau, G., Akkal, N., Aquilina, L., Busnot, S., Dupas, R., Durand, P., Faucheux, M., Fauvel, Y., Fléchard, C., Gilliet, N., Grimaldi, C., Hamon, Y., Jaffrezic, A., Jeanneau, L., Labasque, T., Le Henaff, G., Mérot, P., Molénat, J., Petitjean, P., Pierson-Wickmann, A.-C., Squividant, H., Viaud, V., Walter, C., and Gascuel-Odoux, C.: AgrHyS: An Observatory of Response Times in Agro-Hydro Systems, Vadose Zone J., 17, 1–16, https://doi.org/10.2136/vzj2018.04.0066, 2018.
Frick, D. A., Remus, R., Sommer, M., Augustin, J., Kaczorek, D., and Von Blanckenburg, F.: Silicon uptake and isotope fractionation dynamics by crop species, Biogeosciences, 17, 6475–6490, https://doi.org/10.5194/bg-17-6475-2020, 2020.
Frings, P. J., Clymans, W., Fontorbe, G., De La Rocha, C. L., and Conley, D. J.: The continental Si cycle and its impact on the ocean Si isotope budget, Chemical Geology, 425, 12–36, https://doi.org/10.1016/j.chemgeo.2016.01.020, 2016.
Frings, P. J., Oelze, M., Schubring, F., Frick, D. A., and Von Blanckenburg, F.: Interpreting silicon isotopes in the Critical Zone, Am. J. Sci., 321, 1164–1203, https://doi.org/10.2475/08.2021.02, 2021a.
Frings, P. J., Schubring, F., Oelze, M., and Von Blanckenburg, F.: Quantifying biotic and abiotic Si fluxes in the Critical Zone with ratios along a gradient of erosion rates, Am. J. Sci., 321, 1204–1245, https://doi.org/10.2475/08.2021.03, 2021b.
Froelich, P. N., Blanc, V., Mortlock, R. A., Chillrud, S. N., Dunstan, W., Udomkit, A., and Peng, T. -H.: River Fluxes of Dissolved Silica to the Ocean Were Higher during Glacials: In Diatoms, Rivers, and Oceans, Paleoceanography, 7, 739–767, https://doi.org/10.1029/92PA02090, 1992.
Gaillardet, J., Braud, I., Hankard, F., Anquetin, S., Bour, O., Dorfliger, N., de Dreuzy, J. R., Galle, S., Galy, C., Gogo, S., Gourcy, L., Habets, F., Laggoun, F., Longuevergne, L., Le Borgne, T., Naaim-Bouvet, F., Nord, G., Simonneaux, V., Six, D., Tallec, T., Valentin, C., Abril, G., Allemand, P., Arènes, A., Arfib, B., Arnaud, L., Arnaud, N., Arnaud, P., Audry, S., Bailly Comte, V., Batiot, C., Battais, A., Bellot, H., Bernard, E., Bertrand, C., Bessière, H., Binet, S., Bodin, J., Bodin, X., Boithias, L., Bouchez, J., Boudevillain, B., Bouzou Moussa, I., Branger, F., Braun, J. J., Brunet, P., Caceres, B., Calmels, D., Cappelaere, B., Celle-Jeanton, H., Chabaux, F., Chalikakis, K., Champollion, C., Copard, Y., Cotel, C., Davy, P., Deline, P., Delrieu, G., Demarty, J., Dessert, C., Dumont, M., Emblanch, C., Ezzahar, J., Estèves, M., Favier, V., Faucheux, M., Filizola, N., Flammarion, P., Floury, P., Fovet, O., Fournier, M., Francez, A. J., Gandois, L., Gascuel, C., Gayer, E., Genthon, C., Gérard, M. F., Gilbert, D., Gouttevin, I., Grippa, M., Gruau, G., Jardani, A., Jeanneau, L., Join, J. L., Jourde, H., Karbou, F., Labat, D., Lagadeuc, Y., Lajeunesse, E., Lastennet, R., Lavado, W., Lawin, E., Lebel, T., Le Bouteiller, C., Legout, C., Lejeune, Y., Le Meur, E., Le Moigne, N., Lions, J., Lucas, A., Malet, J. P., Marais-Sicre, C., Maréchal, J. C., Marlin, C., Martin, P., Martins, J., Martinez, J. M., Massei, N., Mauclerc, A., Mazzilli, N., Molénat, J., Moreira-Turcq, P., Mougin, E., Morin, S., Ndam Ngoupayou, J., Panthou, G., Peugeot, C., Picard, G., Pierret, M. C., Porel, G., Probst, A., Probst, J. L., Rabatel, A., Raclot, D., Ravanel, L., Rejiba, F., René, P., Ribolzi, O., Riotte, J., Rivière, A., Robain, H., Ruiz, L., Sanchez-Perez, J. M., Santini, W., Sauvage, S., Schoeneich, P., Seidel, J. L., Sekhar, M., Sengtaheuanghoung, O., Silvera, N., Steinmann, M., Soruco, A., Tallec, G., Thibert, E., Valdes Lao, D., Vincent, C., Viville, D., Wagnon, P., and Zitouna, R.: OZCAR: The French Network of Critical Zone Observatories, Vadose Zone J., 17, 1–24, https://doi.org/10.2136/vzj2018.04.0067, 2018.
Georg, R. B., Reynolds, B. C., Frank, M., and Halliday, A. N.: New sample preparation techniques for the determination of Si isotopic compositions using MC-ICPMS, Chem. Geol., 235, 95–104, https://doi.org/10.1016/j.chemgeo.2006.06.006, 2006.
Guertin, A., Cunningham, C., Bouchez, J., Gelin, M., Chorover, J., Bauser, H., Kim, M., Troch, P., Derry, L. A., and Druhan, J. L.: Stable silicon isotope fractionation reflects the routing of water through a mesoscale hillslope, Earth Planet. Sci. Lett., 648, 119098, https://doi.org/10.1016/j.epsl.2024.119098, 2024.
Guntzer, F., Keller, C., and Meunier, J.-D.: Benefits of plant silicon for crops: a review, Agron. Sustain. Dev., 32, 201–213, https://doi.org/10.1007/s13593-011-0039-8, 2012.
Hodson, M. J., White, P. J., Mead, A., and Broadley, M. R.: Phylogenetic Variation in the Silicon Composition of Plants, Ann. Bot., 96, 1027–1046, https://doi.org/10.1093/aob/mci255, 2005.
Humbert, G., Jaffrezic, A., Fovet, O., Gruau, G., and Durand, P.: Dry-season length and runoff control annual variability in stream DOC dynamics in a small, shallow groundwater-dominated agricultural watershed, Water Resour. Res., 51, 7860–7877, https://doi.org/10.1002/2015WR017336, 2015.
Jeanroy, E.: Diagnostic des formes du fer dans les pédogénèses tempérées, Ph.D. thesis, Université de Nancy,France, 47–49, 1983.
Jochum, K. P., Nohl, U., Herwig, K., Lammel, E., Stoll, B., and Hofmann, A. W.: GeoReM: A New Geochemical Database for Reference Materials and Isotopic Standards, Geostand. Geoanalytical Res., 29, 333–338, https://doi.org/10.1111/j.1751-908X.2005.tb00904.x, 2005.
Jones, L. H. P. and Handreck, K. A.: Silica In Soils, Plants, and Animals, in: Advances in Agronomy, vol. 19, Elsevier, 107–149, https://doi.org/10.1016/S0065-2113(08)60734-8, 1967.
Kaiser, S., Wagner, S., Moschner, C., Funke, C., and Wiche, O.: Accumulation of germanium (Ge) in plant tissues of grasses is not solely driven by its incorporation in phytoliths, Biogeochemistry, 148, 49–68, https://doi.org/10.1007/s10533-020-00646-x, 2020.
Keller, C., Guntzer, F., Barboni, D., Labreuche, J., and Meunier, J.-D.: Impact of agriculture on the Si biogeochemical cycle: Input from phytolith studies, Comptes Rendus Geosci., 344, 739–746, https://doi.org/10.1016/j.crte.2012.10.004, 2012.
Kurtz, A. C., Derry, L. A., and Chadwick, O. A.: Germanium-silicon fractionation in the weathering environment, Geochim. Cosmochim. Ac., 66, 1525–1537, https://doi.org/10.1016/S0016-7037(01)00869-9, 2002.
Laruelle, G. G., Roubeix, V., Sferratore, A., Brodherr, B., Ciuffa, D., Conley, D. J., Dürr, H. H., Garnier, J., Lancelot, C., Le Thi Phuong, Q., Meunier, J. -D., Meybeck, M., Michalopoulos, P., Moriceau, B., Ní Longphuirt, S., Loucaides, S., Papush, L., Presti, M., Ragueneau, O., Regnier, P., Saccone, L., Slomp, C. P., Spiteri, C., and Van Cappellen, P.: Anthropogenic perturbations of the silicon cycle at the global scale: Key role of the land-ocean transition, Glob. Biogeochem. Cycles, 23, 2008GB003267, https://doi.org/10.1029/2008GB003267, 2009.
López-Urzúa, S., Luu, T.-H., and Derry, L.: Assessment of matrix effects induced by chloride, sulfate and dissolved organic carbon during Si isotope measurements by MC-ICP-MS under wet plasma conditions, J. Anal. At. Spectrom., 39, 1033–1042, https://doi.org/10.1039/D3JA00290J, 2024.
López-Urzúa, S., Derry, L., and Bouchez, J.: Hydrological and geochemical data from soils, natural waters and plants in the Kervidy-Naizin catchment, Britanny, France, Zenodo [data set], https://doi.org/10.5281/zenodo.14615156, 2025.
Lugolobi, F., Kurtz, A. C., and Derry, L. A.: Germanium–silicon fractionation in a tropical, granitic weathering environment, Geochim. Cosmochim. Ac., 74, 1294–1308, https://doi.org/10.1016/j.gca.2009.11.027, 2010.
Lupker, M., France-Lanord, C., Galy, V., Lavé, J., Gaillardet, J., Gajurel, A. P., Guilmette, C., Rahman, M., Singh, S. K., and Sinha, R.: Predominant floodplain over mountain weathering of Himalayan sediments (Ganga basin), Geochim. Cosmochim. Ac., 84, 410–432, https://doi.org/10.1016/j.gca.2012.02.001, 2012.
Lutterotti, L.: Maud: a Rietveld analysis program designed for the internet and experiment integration, Acta Crystallogr. Sect. A Found. Crystallogr., 56, s54, https://doi.org/10.1107/S0108767300021954, 2000.
Ma, J. F. and Takahashi, E.: Soil, Fertilizer, and Plant Silicon Research in Japan, Elsevier Science, Amsterdam, London, Boston, ISBN 978-0-444-51166-9, 2002.
Ma, J. F. and Yamaji, N.: Silicon uptake and accumulation in higher plants, Trends Plant Sci., 11, 392–397, https://doi.org/10.1016/j.tplants.2006.06.007, 2006.
Ma, J. F., Miyake, Y., and Takahashi, E.: Chapter 2 Silicon as a beneficial element for crop plants, in: Studies in Plant Science, vol. 8, Elsevier, 17–39, https://doi.org/10.1016/S0928-3420(01)80006-9, 2001.
Ma, J. F., Yamaji, N., Mitani, N., Tamai, K., Konishi, S., Fujiwara, T., Katsuhara, M., and Yano, M.: An efflux transporter of silicon in rice, Nature, 448, 209–212, https://doi.org/10.1038/nature05964, 2007.
Malcles, O., Mazzotti, S., Vernant, P., and Godard, V.: Late Pleistocene–Holocene denudation, uplift, and morphology evolution of the Armorican Massif (western Europe), Earth Surf. Dynam., 13, 629–645, https://doi.org/10.5194/esurf-13-629-2025, 2025.
Matichenkov, V. V. and Bocharnikova, E. A.: Chapter 13 The relationship between silicon and soil physical and chemical properties, in: Studies in Plant Science, vol. 8, Elsevier, 209–219, https://doi.org/10.1016/S0928-3420(01)80017-3, 2001.
Meek, K., Derry, L., Sparks, J., and Cathles, L.: , , and ratios as tracers of solute sources and biogeochemical cycling at a temperate forested shale catchment, central Pennsylvania, USA, Chem. Geol., 445, 84–102, https://doi.org/10.1016/j.chemgeo.2016.04.026, 2016.
Méheut, M. and Schauble, E. A.: Silicon isotope fractionation in silicate minerals: Insights from first-principles models of phyllosilicates, albite and pyrope, Geochim. Cosmochim. Ac., 134, 137–154, https://doi.org/10.1016/j.gca.2014.02.014, 2014.
Méheut, M., Lazzeri, M., Balan, E., and Mauri, F.: Structural control over equilibrium silicon and oxygen isotopic fractionation: A first-principles density-functional theory study, Chem. Geol., 258, 28–37, https://doi.org/10.1016/j.chemgeo.2008.06.051, 2009.
Mehra, O. P. and Jackson, M. L.: Iron oxide removal from soils and clays by a dithionite–citrate system buffered with sodium bicarbonate, in: Clays and Clay Minerals, Proceedings of the Seventh National Conference on Clays and Clay Minerals, Washington, D.C., 1958, edited by: Swineford, A., Elsevier, Amsterdam, 317–327, ISBN 978-0-08-009235-5, 2015.
Molenat, J., Gascuel-Odoux, C., Ruiz, L., and Gruau, G.: Role of water table dynamics on stream nitrate export and concentration in agricultural headwater catchment (France), J. Hydrol., 348, 363–378, https://doi.org/10.1016/j.jhydrol.2007.10.005, 2008.
Murnane, R. J. and Stallard, R. F.: Germanium and silicon in rivers of the Orinoco drainage basin, Nature, 344, 749–752, https://doi.org/10.1038/344749a0, 1990.
Oelze, M., Von Blanckenburg, F., Hoellen, D., Dietzel, M., and Bouchez, J.: Si stable isotope fractionation during adsorption and the competition between kinetic and equilibrium isotope fractionation: Implications for weathering systems, Chem. Geol., 380, 161–171, https://doi.org/10.1016/j.chemgeo.2014.04.027, 2014.
Opfergelt, S., Cardinal, D., Henriet, C., André, L., and Delvaux, B.: Silicon isotope fractionation between plant parts in banana: In situ vs. in vitro, J. Geochem. Explor., 88, 224–227, https://doi.org/10.1016/j.gexplo.2005.08.044, 2006.
Opfergelt, S., De Bournonville, G., Cardinal, D., André, L., Delstanche, S., and Delvaux, B.: Impact of soil weathering degree on silicon isotopic fractionation during adsorption onto iron oxides in basaltic ash soils, Cameroon, Geochim. Cosmochim. Ac., 73, 7226–7240, https://doi.org/10.1016/j.gca.2009.09.003, 2009.
Pauwels, H., Kloppmann, W., Foucher, J.-C., Martelat, A., and Fritsche, V.: Field tracer test for denitrification in a pyrite-bearing schist aquifer, Appl. Geochem., 13, 767–778, https://doi.org/10.1016/S0883-2927(98)00003-1, 1998.
Pellerin, J. and Van Vliet Lanoë, B.: Cadre géomorphologique du bassin du Coët-Dan et du Haut Evel (Morbihan): Rapport sur les travaux de cartographie et de stratigraphie, unpublished Ph.D. thesis, University of Brest, France, 1994.
Pokrovsky, O. S., Pokrovski, G. S., Schott, J., and Galy, A.: Experimental study of germanium adsorption on goethite and germanium coprecipitation with iron hydroxide: X-ray absorption fine structure and macroscopic characterization, Geochim. Cosmochim. Ac., 70, 3325–3341, https://doi.org/10.1016/j.gca.2006.04.012, 2006.
Pribyl, D. W.: A critical review of the conventional SOC to SOM conversion factor, Geoderma, 156, 75–83, https://doi.org/10.1016/j.geoderma.2010.02.003, 2010.
Rains, D. W., Epstein, E., Zasoski, R. J., and Aslam, M.: Active Silicon Uptake by Wheat, Plant Soil, 280, 223–228, https://doi.org/10.1007/s11104-005-3082-x, 2006.
Reynolds, B. C., Aggarwal, J., André, L., Baxter, D., Beucher, C., Brzezinski, M. A., Engström, E., Georg, R. B., Land, M., Leng, M. J., Opfergelt, S., Rodushkin, I., Sloane, H. J., Van Den Boorn, S. H. J. M., Vroon, P. Z., and Cardinal, D.: An inter-laboratory comparison of Si isotope reference materials, J. Anal. Spectrom., 22, 561–568, https://doi.org/10.1039/B616755A, 2007.
Riebe, C. S., Kirchner, J. W., Granger, D. E., and Finkel, R. C.: Strong tectonic and weak climatic control of long-term chemical weathering rates, Geology, 29, 511, https://doi.org/10.1130/0091-7613(2001)029<0511:STAWCC>2.0.CO;2, 2001.
Roerdink, D. L., Van Den Boorn, S. H. J. M., Geilert, S., Vroon, P. Z., and Van Bergen, M. J.: Experimental constraints on kinetic and equilibrium silicon isotope fractionation during the formation of non-biogenic chert deposits, Chem. Geol., 402, 40–51, https://doi.org/10.1016/j.chemgeo.2015.02.038, 2015.
Sarath, P. K., Mangalaa, K. R., Cardinal, D., Gurumurthy, G. P., Dapoigny, A., Sarma, V. V. S. S., and Riotte, J.: Seasonal, weathering and water use controls of silicon cycling along the river flow in two contrasting basins of South India, Chem. Geol., 604, 120883, https://doi.org/10.1016/j.chemgeo.2022.120883, 2022.
Savage, P. S., Armytage, R. M. G., Georg, R. B., and Halliday, A. N.: High temperature silicon isotope geochemistry, Lithos, 190–191, 500–519, https://doi.org/10.1016/j.lithos.2014.01.003, 2014.
Schoelynck, J., Subalusky, A. L., Struyf, E., Dutton, C. L., Unzué-Belmonte, D., Van De Vijver, B., Post, D. M., Rosi, E. J., Meire, P., and Frings, P.: Hippos (Hippopotamus amphibius): The animal silicon pump, Sci. Adv., 5, eaav0395, https://doi.org/10.1126/sciadv.aav0395, 2019.
Schuessler, J. A., Von Blanckenburg, F., Bouchez, J., Uhlig, D., and Hewawasam, T.: Nutrient cycling in a tropical montane rainforest under a supply-limited weathering regime traced by elemental mass balances and Mg stable isotopes, Chem. Geol., 497, 74–87, https://doi.org/10.1016/j.chemgeo.2018.08.024, 2018.
Scribner, A. M., Kurtz, A. C., and Chadwick, O. A.: Germanium sequestration by soil: Targeting the roles of secondary clays and Fe-oxyhydroxides, Earth Planet. Sci. Lett., 243, 760–770, https://doi.org/10.1016/j.epsl.2006.01.051, 2006.
Sparks, J. P., Chandra, S., Derry, L. A., Parthasarathy, M. V., Daugherty, C. S., and Griffin, R.: Subcellular localization of silicon and germanium in grass root and leaf tissues by SIMS: evidence for differential and active transport, Biogeochemistry, 104, 237–249, https://doi.org/10.1007/s10533-010-9498-2, 2011.
Stamm, F. M., Zambardi, T., Chmeleff, J., Schott, J., Von Blanckenburg, F., and Oelkers, E. H.: The experimental determination of equilibrium Si isotope fractionation factors among H4SiO4o, H3SiO4− and amorphous silica (SiO2⋅0.32 H2O) at 25 and 75 °C using the three-isotope method, Geochim. Cosmochim. Ac., 255, 49–68, https://doi.org/10.1016/j.gca.2019.03.035, 2019.
Steinhoefel, G., Breuer, J., Von Blanckenburg, F., Horn, I., and Sommer, M.: The dynamics of Si cycling during weathering in two small catchments in the Black Forest (Germany) traced by Si isotopes, Chem. Geol., 466, 389–402, https://doi.org/10.1016/j.chemgeo.2017.06.026, 2017.
Strömberg, C. A. E., Di Stilio, V. S., and Song, Z.: Functions of phytoliths in vascular plants: an evolutionary perspective, Funct. Ecol., 30, 1286–1297, https://doi.org/10.1111/1365-2435.12692, 2016.
Struyf, E., Smis, A., Van Damme, S., Garnier, J., Govers, G., Van Wesemael, B., Conley, D. J., Batelaan, O., Frot, E., Clymans, W., Vandevenne, F., Lancelot, C., Goos, P., and Meire, P.: Historical land use change has lowered terrestrial silica mobilization, Nat. Commun., 1, 129, https://doi.org/10.1038/ncomms1128, 2010.
Sun, Y., Wu, L., Li, X., Sun, L., Gao, J., Ding, T., and Zhu, Y.: Silicon Isotope Fractionation in Maize and its Biogeochemical Significance, Anal. Lett., 50, 2475–2490, https://doi.org/10.1080/00032719.2017.1295460, 2017.
Tamm, O.: Um bestämning ow de organiska komponenterna i markens gelkomplex, Meddelanden Fran Statens Skogsförsöksanstalt, 19, 385–404, 1932.
Thomas, E., Le Berre, P., Foucaud-Lemercier, B., Le Bris, A. L., Carn-Dheilley, A., and Naas, P.: Notice explicative de la feuille Josselin à , BRGM Éditions, Service Géologique National, 2009.
Tréguer, P. J., Sutton, J. N., Brzezinski, M., Charette, M. A., Devries, T., Dutkiewicz, S., Ehlert, C., Hawkings, J., Leynaert, A., Liu, S. M., Llopis Monferrer, N., López-Acosta, M., Maldonado, M., Rahman, S., Ran, L., and Rouxel, O.: Reviews and syntheses: The biogeochemical cycle of silicon in the modern ocean, Biogeosciences, 18, 1269–1289, https://doi.org/10.5194/bg-18-1269-2021, 2021.
Trembath-Reichert, E., Wilson, J. P., McGlynn, S. E., and Fischer, W. W.: Four hundred million years of silica biomineralization in land plants, P. Natl. Acad. Sci. USA, 112, 5449–5454, https://doi.org/10.1073/pnas.1500289112, 2015.
Uhlig, D., Schuessler, J. A., Bouchez, J., Dixon, J. L., and Von Blanckenburg, F.: Quantifying nutrient uptake as driver of rock weathering in forest ecosystems by magnesium stable isotopes, Biogeosciences, 14, 3111–3128, https://doi.org/10.5194/bg-14-3111-2017, 2017.
U.S. Geological Survey: Centrifuge extraction method, in: Methods of Analysis by the U.S. Geological Survey National Water Quality Laboratory, U.S. Geological Survey Open File Report 01-041, https://pubs.usgs.gov/of/2001/of01-041/htmldocs/methods/centrifu.htm (last access: 29 December 2024), 2001.
Vandevenne, F., Struyf, E., Clymans, W., and Meire, P.: Agricultural silica harvest: have humans created a new loop in the global silica cycle?, Front. Ecol. Environ., 10, 243–248, https://doi.org/10.1890/110046, 2012.
Vandevenne, F. I., Barão, A. L., Schoelynck, J., Smis, A., Ryken, N., Van Damme, S., Meire, P., and Struyf, E.: Grazers: biocatalysts of terrestrial silica cycling, Proc. R. Soc. B., 280, 20132083, https://doi.org/10.1098/rspb.2013.2083, 2013.
Vandevenne, F. I., Delvaux, C., Hughes, H. J., André, L., Ronchi, B., Clymans, W., Barão, L., Cornelis, J.-T., Govers, G., Meire, P., and Struyf, E.: Landscape cultivation alters δ30Si signature in terrestrial ecosystems, Sci. Rep., 5, 7732, https://doi.org/10.1038/srep07732, 2015.
Van Vliet-Lanoë, B., Laurent, M., Hallégouet, B., Margerel, J. P., Chauvel, J. J., Michel, Y., Moguedet, G., Trautman, F., and Vauthier, S.: Le mio-pliocène du massif armoricain. Données nouvelles, C.R. Acad. Sci. Paris, Sciences de la Terre et des Planètes, 326, 333–340, 1998.
Vermeesch, P.: IsoplotR: A free and open toolbox for geochronology, Geosci. Front. [software], 9, 1479–1493, https://doi.org/10.1016/j.gsf.2018.04.001, 2018.
Vongvixay, A., Grimaldi, C., Dupas, R., Fovet, O., Birgand, F., Gilliet, N., and Gascuel-Odoux, C.: Contrasting suspended sediment export in two small agricultural catchments: Cross-influence of hydrological behaviour and landscape degradation or stream bank management, Land Degrad. Dev., 29, 1385–1396, https://doi.org/10.1002/ldr.2940, 2018.
Walter, C. and Curmi, P.: Les sols du bassin versant du Coet-Dan: Organisation, variabilité spatiale et cartographie, in: Agriculture intensive et qualité des eaux, edited by: Cheverry, C., INRA Editions, La Géraudière, France, 85–108, ISBN 2-7380-0801-1, 1998.
Wieland, E. and Stumm, W.: Dissolution kinetics of kaolinite in acidic aqueous solutions at 25 °C, Geochim. Cosmochim. Ac., 56, 3339–3355, https://doi.org/10.1016/0016-7037(92)90382-S, 1992.
Yool, A. and Tyrrell, T.: Role of diatoms in regulating the ocean's silicon cycle, Glob. Biogeochem. Cycles, 17, https://doi.org/10.1029/2002GB002018, 2003.
Ziegler, K., Chadwick, O. A., Brzezinski, M. A., and Kelly, E. F.: Natural variations of δ30Si ratios during progressive basalt weathering, Hawaiian Islands, Geochim. Cosmochim. Ac., 69, 4597–4610, https://doi.org/10.1016/j.gca.2005.05.008, 2005a.
Ziegler, K., Chadwick, O. A., White, A. F., and Brzezinski, M. A.: δ30Si systematics in a granitic saprolite, Puerto Rico, Geology, 33, 817, https://doi.org/10.1130/G21707.1, 2005b.
- Abstract
- Introduction
- Study site and sampling
- Methods
- Results
- Discussion
- Conclusions
- Appendix A
- Appendix B: Mineralogy, clay fraction and bedrock correction by quartz
- Appendix C
- Appendix D: Monte Carlo simulation of Si export in biomass and results
- Appendix E: Estimation of riverine Si concentration and fluxes
- Appendix F: Derivation of equations for determining and results
- Appendix G: Sensitivity analysis on bedrock lithological variability for the calculation of
- Data availability
- Author contributions
- Competing interests
- Disclaimer
- Acknowledgements
- Financial support
- Review statement
- References
- Supplement