the Creative Commons Attribution 4.0 License.
the Creative Commons Attribution 4.0 License.
 | 28 Oct 2025
Water column respiration in the Yakima River basin is explained by temperature, nutrients, and suspended solids
Maggi M. Laan
Stephanie G. Fulton
Vanessa A. Garayburu-Caruso
Morgan E. Barnes
Mikayla A. Borton
Xingyuan Chen
Yuliya Farris
Brieanne Forbes
Amy E. Goldman
Samantha Grieger
Robert O. Hall Jr.
Matthew H. Kaufman
Xinming Lin
Erin L. M. Zionce
Sophia A. McKever
Allison Myers-Pigg
Opal Otenburg
Aaron C. Pelly
Huiying Ren
Lupita Renteria
Timothy D. Scheibe
Kyongho Son
Jerry Tagestad
Joshua M. Torgeson
Understanding aquatic ecosystem metabolism involves the study of two key processes: carbon fixation via primary production and organic C mineralization as total ecosystem respiration (ERtot). In streams and rivers, ERtot includes respiration in the water column (ERwc) and in the sediments (ERsed). While literature surveys suggest that ERsed is often a dominant contributor to ERtot, recent studies indicate that the relative influence of sediment-associated processes versus water column processes can fluctuate along the river continuum. Still, a comprehensive understanding of the factors contributing to these shifts within basins and across stream orders is needed. Here, we contribute to this need by measuring ERwc and aqueous chemistry across 47 sites in the Yakima River basin, Washington, USA. We find that ERwc rates vary throughout the basin during baseflow conditions, ranging from 0 to −7.38 g O2 m−3 d−1, and encompass the entire range of ERwc rates from previous work. Additionally, by comparing to ERtot estimates for rivers across the contiguous United States, we suggest that the contribution of ERwc rates to reach-scale ERtot rates across the Yakima River basin is likely highly variable, but we do not test this directly. We observe that ERwc is locally controlled by temperature, dissolved organic carbon, total dissolved nitrogen, and total suspended solids, which explains 49 % of ERwc variability across the basin using Least Absolute Shrinkage and Selection Operator (LASSO) regression. Our findings highlight the potential relevance of water column processes in aquatic ecosystem metabolism across the entire stream network and that these influences are likely not predictable simply by knowing the position in the stream network. Our results are generally congruent with previous work in terms of locally influential variables, suggesting that the observed variability and suite of associated environmental factors influencing ERwc are potentially transferable across basins.
- Article
(3974 KB) - Full-text XML
-
Supplement
(2147 KB) - BibTeX
- EndNote


Metabolism in streams and rivers includes both gross primary production (GPP) and ecosystem respiration (ERtot) as fundamental processes that shape energy dynamics and nutrient cycling in riverine systems (Bernhardt et al., 2018). GPP and ERtot impact biogeochemical cycling through the fixation and subsequent breakdown and processing of carbon (C) in aquatic ecosystems (Allan et al., 2021; Genzoli and Hall, 2016; Hall, 2016; Hall and Hotchkiss, 2017; Reisinger et al., 2016). Riverine metabolism is modulated by various environmental features, including physical and biogeochemical factors. Physical parameters include discharge, flow regimes, flow extremes, light availability, and temperature (Bernhardt et al., 2022; Hensley et al., 2019; Jankowski and Schindler, 2019; Nakano et al., 2022). Biogeochemical influences include the availability, amount, and composition of C and other nutrients (Bertuzzo et al., 2022; Garayburu-Caruso et al., 2020a; Mulholland et al., 2008; Reisinger et al., 2021). Additionally, watershed characteristics such as stream size or drainage area, hydrologic connectivity, watershed geomorphology, land use, and land cover further affect these metabolic processes (Bernot et al., 2010; Demars, 2019; Finlay, 2011; Jankowski and Schindler, 2019).
Reach-scale ecosystem metabolism encompasses biogeochemical processes that occur in both the water column and benthic and hyporheic sediments (Hall and Hotchkiss, 2017). Historically, metabolism studies focused on headwater streams, which are characterized by relatively large contact areas between surface water and the benthic sediments (Alexander et al., 2007; Battin et al., 2008; Findlay, 1995; Gomez-Velez et al., 2015; Mulholland et al., 2008; Peterson et al., 2001). Recent advances in computing power and the increased availability of high-resolution sensor data (e.g., dissolved oxygen, temperature, and river depth) have expanded the scope of metabolism studies beyond single small streams, enabling researchers to investigate the relative contributions of ERsed and water column respiration (ERwc) to ERtot across diverse stream networks and orders. These efforts show that the proportion of ERtot derived from ERsed varies greatly across different sites, contributing from 3 % to 96 % of ERtot (Battin et al., 2003; Fuss and Smock, 1996; Gagne-Maynard et al., 2017; Jones, 1995; Kaplan and Newbold, 2000; Naegeli and Uehlinger, 1997). This observed variability in the fraction of ERtot derived from ERsed indicates that ERwc may be important in certain places and at certain times.
Water column processes, including nutrient cycling, occur at considerable rates and become increasingly important as rivers grow in size, marking a transition from benthic-dominated to water-column-dominated processing (Gardner and Doyle, 2018; del Giorgio and Williams, 2005; Reisinger et al., 2015, 2016), and they may influence ecosystem respiration such that we would expect faster ERwc with greater GPP due to increases in C (Hall et al., 2016; Mejia et al., 2019). Additionally, greater N processing in the water column with increasing stream order (Wang et al., 2022) may suggest that water column biogeochemical processing increases along the stream network. Despite these trends, even as rivers increase in size, the relative contribution of ERwc to ERtot remains variable, likely in response to changing environmental conditions (Genzoli and Hall, 2016; Reisinger et al., 2021; Ward et al., 2018). This highlights a key knowledge gap: while the role of the water column in reach-scale processes such as GPP and ERtot likely fluctuates along the river network, this relationship remains poorly understood.
We contribute to addressing this knowledge gap by investigating the spatial variation of ERwc in the Yakima River basin, Washington, USA. The Yakima River basin is representative of the Columbia River basin, one of the largest river basins in the contiguous United States (CONUS), which spans the northwest region of CONUS. The Yakima River basin encompasses climatic regimes, biomes, physical settings, and land use conditions commonly found throughout the Columbia River basin and the western CONUS. Using the environmental diversity of the Yakima River basin, our goal is to generate knowledge of ERwc that could be transferable across the Columbia River basin and potentially beyond. We focus on ERwc during summer baseflow conditions and specifically (1) compare ERwc from the Yakima River basin to published ERwc and ERtot from other systems; (2) test the hypothesis that ERwc will be faster as one moves down the stream network; and (3) compare variables that explain the variation in ERwc to those found as explanatory in previous studies. To address these objectives, we estimate ERwc and measured surface water chemistry at 47 sites across the Yakima River basin during the summer of 2021. Our estimates of ERwc span all previously reported rates, and the most important explanatory variables align with previous studies in a way that indicates predominance of local controls.
2.1 Methods overview
Field sites in the Yakima River basin were selected to be representative of biophysical attributes of the larger Columbia River basin. For this, we grouped all catchments in the Columbia River basin into six classes sharing similar landscape characteristics using key biophysical attributes and selected sites in the Yakima River basin from each of the six classes. The final field locations spanned six Strahler stream orders and a wide range of land cover types and physical settings. We used dark bottle incubations and collected surface water chemistry samples to study the spatial variability of ERwc at the basin scale with respect to environmental conditions during summer baseflow conditions in 2021. We also compared ERwc observed in the Yakima River basin against literature ERwc and ERtot values to understand how the Yakima River basin relates to streams and rivers across the world. We used Least Absolute Shrinkage and Selection Operator (LASSO) regression to evaluate the relationship between ERwc and drainage area, stream temperature, surface water chemistry, and organic matter putative biochemical transformations as a proxy for the diversity of reactions occurring in upstream reaches to determine the primary factors influencing ERwc throughout the Yakima River basin. All analyses were performed using R Statistical Software (v4.2.0) (R Core Team, 2022). All data generated from the sampling study, including data not evaluated in this paper, are publicly available.
2.2 Watershed characterization and site selection
The Yakima River basin is the fifth-largest basin in the Columbia River basin and is located entirely within the state of Washington, USA. The basin is roughly 16 000 km2 and spans forested mountainous regions in the west to arid valleys and plains in the east. The basin has a diversity of land covers and land uses dominated by shrubland, forest, and agriculture. Annual precipitation ranges from up to 350 cm in the west to 25 cm in the east (Vano et al., 2010).
To enable further testing of the transferability of the study results to catchments throughout the Columbia River basin, we strategically selected sampling sites in the Yakima River basin based on their biophysical (e.g., hydrology, topography, vegetation type) characteristics. This was done by first grouping all National Hydrography Dataset Plus Version 2.1 (NHDPlusV2.1) catchments (U.S. Geological Survey, 2019a) in the Columbia River basin (n=181 531) into six classes sharing similar landscape characteristics using cluster analysis. To capture the variability in biophysical settings found across the Columbia River basin, we selected 16 key attributes as input variables to the cluster analysis, including climate, vegetation structure and function, topography, and wildfire potential (Table S1 in the Supplement). We then selected multiple sites within each of the six Columbia River basin classes. Existing, readily available geospatial data came from multiple sources, including the NASA Moderate Resolution Imaging Spectroradiometer (eMODIS) Remote Sensing Phenological (RSP) data (U.S. Geological Survey, 2019b); NASA MODIS land cover type (Friedl and Sulla-Menashe, 2019); NASA MODIS normalized difference vegetation index (NDVI), fraction of photosynthetically active radiation (FPAR, %), and leaf area index (LAI, m2 m−2) (Myneni et al., 2015); NASA MODIS total evapotranspiration (ET, kg H2O m2 d1) (Running et al., 2017); NASA MODIS terrestrial net primary productivity (NPP, kg C m−2 yr−1) and terrestrial net ecosystem productivity (NEP, kg C m−2 yr−1) data (Running and Zhao, 2019); PRISM precipitation data (PRISM Climate Group, Oregon State University, 2014); NHDPlusV2.1 stream length and catchment boundaries (U.S. Geological Survey, 2019a); USGS National Elevation Dataset (NED) arcsec Digital Elevation Model topography data (National Elevation Dataset (NED), 2023); USFS Wildfire Hazard Potential (WHP) data (Dillon, 2018); and Landscape Fire and Resource Management Planning Tools (LANDFIRE) existing vegetation percent cover (%) and height (m) data (Dillon and Gilbertson-Day, 2020).
We used a k-means clustering algorithm using the kmeans function within the “stats” package in base R to group NHDPlusV2.1 catchments with similar properties using the normalized, statistical moments (minimum, maximum, mean, and standard deviation (SD)) for 70 geospatial variables within each NHDPlusV2.1 catchment (Table S1 in the Supplement) as input. To calculate statistical moments for each variable, we summarized geospatial data types at the NHDPlusV2.1 catchment level using two different methods: zonal statistics for continuous raster data and tabulation for vector data. Zonal statistics calculate statistical moments by individual catchment polygon. Tabulation calculates total length or area of a particular vector feature within each individual catchment polygon. We evaluated 13 different sets of variable–statistical moment combinations for use in the cluster analysis and selected variable set 8, which included the zonal mean and zonal standard deviation for 70 variables (n=140) (Table S2). Once the data for variable set 8 were summarized at the NHDPlusV2.1 catchment level, we calculated z-scores (z) for each geospatial variable. Resultant z-scores for variable set 8 were fed into the k-means classifier, which iteratively adds each catchment to one of n clusters, with n being set by the user (n=15 in this study), using the Euclidean distance to minimize the within-cluster distance and maximize the between-cluster distance. We ran multiple iterations of the cluster analysis using 2–15 clusters with the mean and standard deviation of all variables. To visualize the reduction in within-cluster variation between iterations 1–15, we generated elbow plots by plotting the within-cluster sum of squares (WCSS) value against the total number of catchments in a cluster and selected six clusters as the suitable number of clusters that minimized map visual complexity enough to guide manual site selection while maintaining a level of variation in key biophysical characteristics representative of the Columbia River basin. Clusters 1 and 3–6 were categorized according to tree height, precipitation, and elevation (Tables 1 and S3). Cluster 2 was categorized as “Water dominated” and was not used for selecting sites. The cluster analysis results were then used to guide the selection of 47 field sites distributed across Strahler stream orders 2–7 (the highest-order stream in the Yakima River basin) that spanned the basin and captured the variation in biophysical characteristics represented by clusters 1 and 3–6 (Fig. S1 in the Supplement). First-order and other non-perennial streams were not sampled due to the lack of flow during summer baseflow or because the baseflows were too low to support sampling. We attempted to include logistical considerations in the model-based site selection, but this task proved impractical, and field-scouting trips were needed to refine site selections. Day-of-sampling changes to the sampling plan were made on-the-fly when the Schneider Springs Fire started at the Okanogan–Wenatchee National Forest. Fire activity and road closures restricted access to a large portion of the Yakima River basin, primarily in the Tieton River and American River watersheds located in the midwestern portion of the basin.
Table 1Cluster analysis results characterizing NHDPlusV2.1 catchments across the Columbia River basin and Yakima River basin with similar biophysical and hydrologic characteristics, and the number and percentage of sites in each basin.
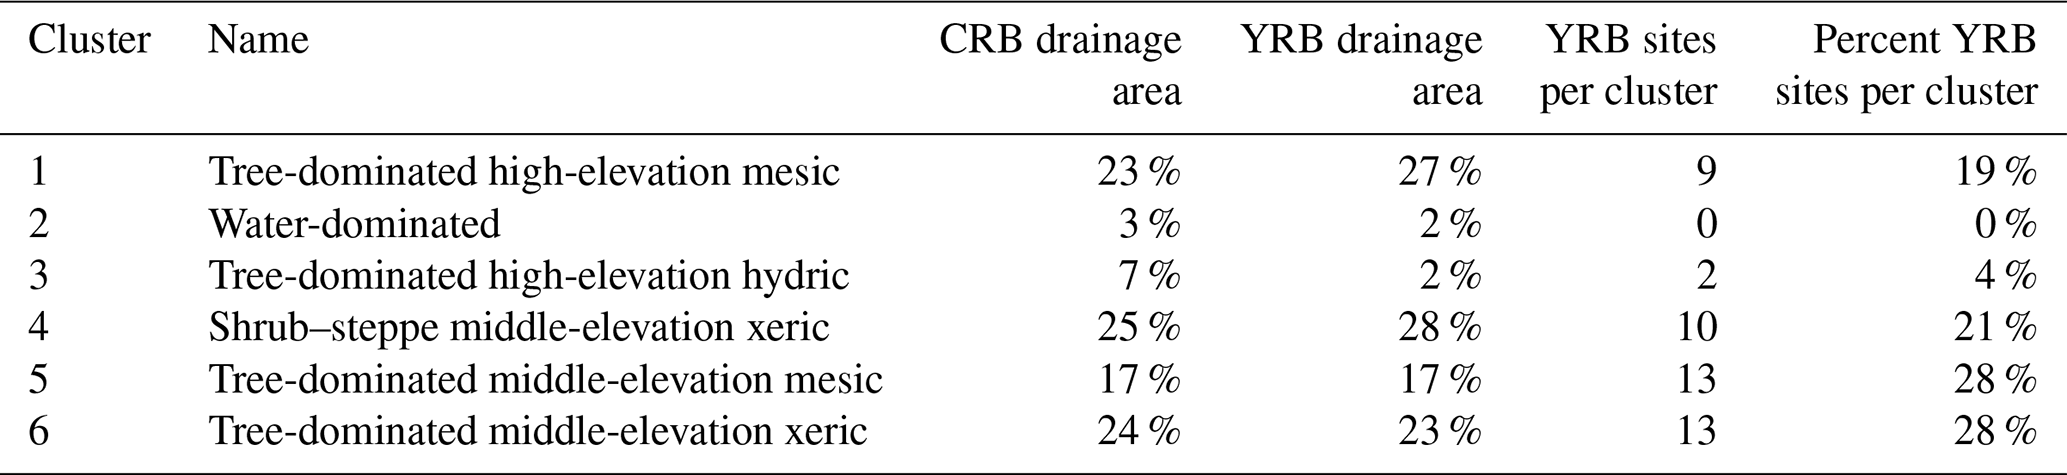
“CRB drainage area” is the percentage of the total drainage area of the Columbia River basin that was classified in each cluster. “YRB drainage area” is the percentage of the total drainage area of the Yakima River basin that was classified in each cluster. “YRB sites per cluster” is the total number of field sites in the Yakima River basin (n=47) located in each cluster. “Percent YRB sites per cluster” is the percentage of the total number of sampling sites in the Yakima River basin located in each cluster.
2.3 Water column respiration data collection
We measured ERwc (g O2 m−3 d−1) in triplicate for 2 h at each site between 30 August and 15 September 2021 using a modified “semi-in situ” dark bottle incubation (Genzoli and Hall, 2016) (Fig. 1a). Calibrated dissolved oxygen (DO) sensors (miniDOT Logger; Precision Measurement Engineering, Inc.; Vista, CA, USA) recorded DO concentration (mg L−1) and temperature (°C) at 1 min intervals in 2 L dark bottles (Nalgene™ Rectangular Amber HDPE bottles; Thermo Fisher Scientific; Waltham, Massachusetts, USA) (Fulton et al., 2022). Bottle necks were slightly widened (1 to 2 mm) to accommodate the diameter of the DO sensor.
At the start of each sampling day, the DO sensors and all sampling equipment were placed in a cooler with blue ice packs to keep them cool and minimize the time needed at each site for the sensors to equilibrate with the similarly cool river water temperatures. Upon arrival at each site, the bottles were rinsed three times with river water and then filled by wading as close to the thalweg as possible, submerging the bottles below the river surface, and rolling them 360° while held upright underwater to ensure no air bubbles were present in the bottles (Fig. 1a). The bottles were secured upright in a cooler filled with river water, placed in the shade on the streambank, and allowed to equilibrate for 20 min. Following the 20 min equilibration period, the bottles were emptied and refilled with fresh river water and a small, battery-powered mixing device (Underwater Motor, Item Number 7350; Playmobil; Shanghai, China; rechargeable AA NiMH battery; Amazon; Seattle, Washington, USA), and the DO sensor was gently inserted (sensor face-up) in the bottles to minimize the trapping of air bubbles in the bottles. The bottles were capped underwater and returned to the water-filled cooler. The bottles were incubated for 2 h, and the river water surrounding the bottles in the cooler was replenished every 20 min to maintain in situ temperature.
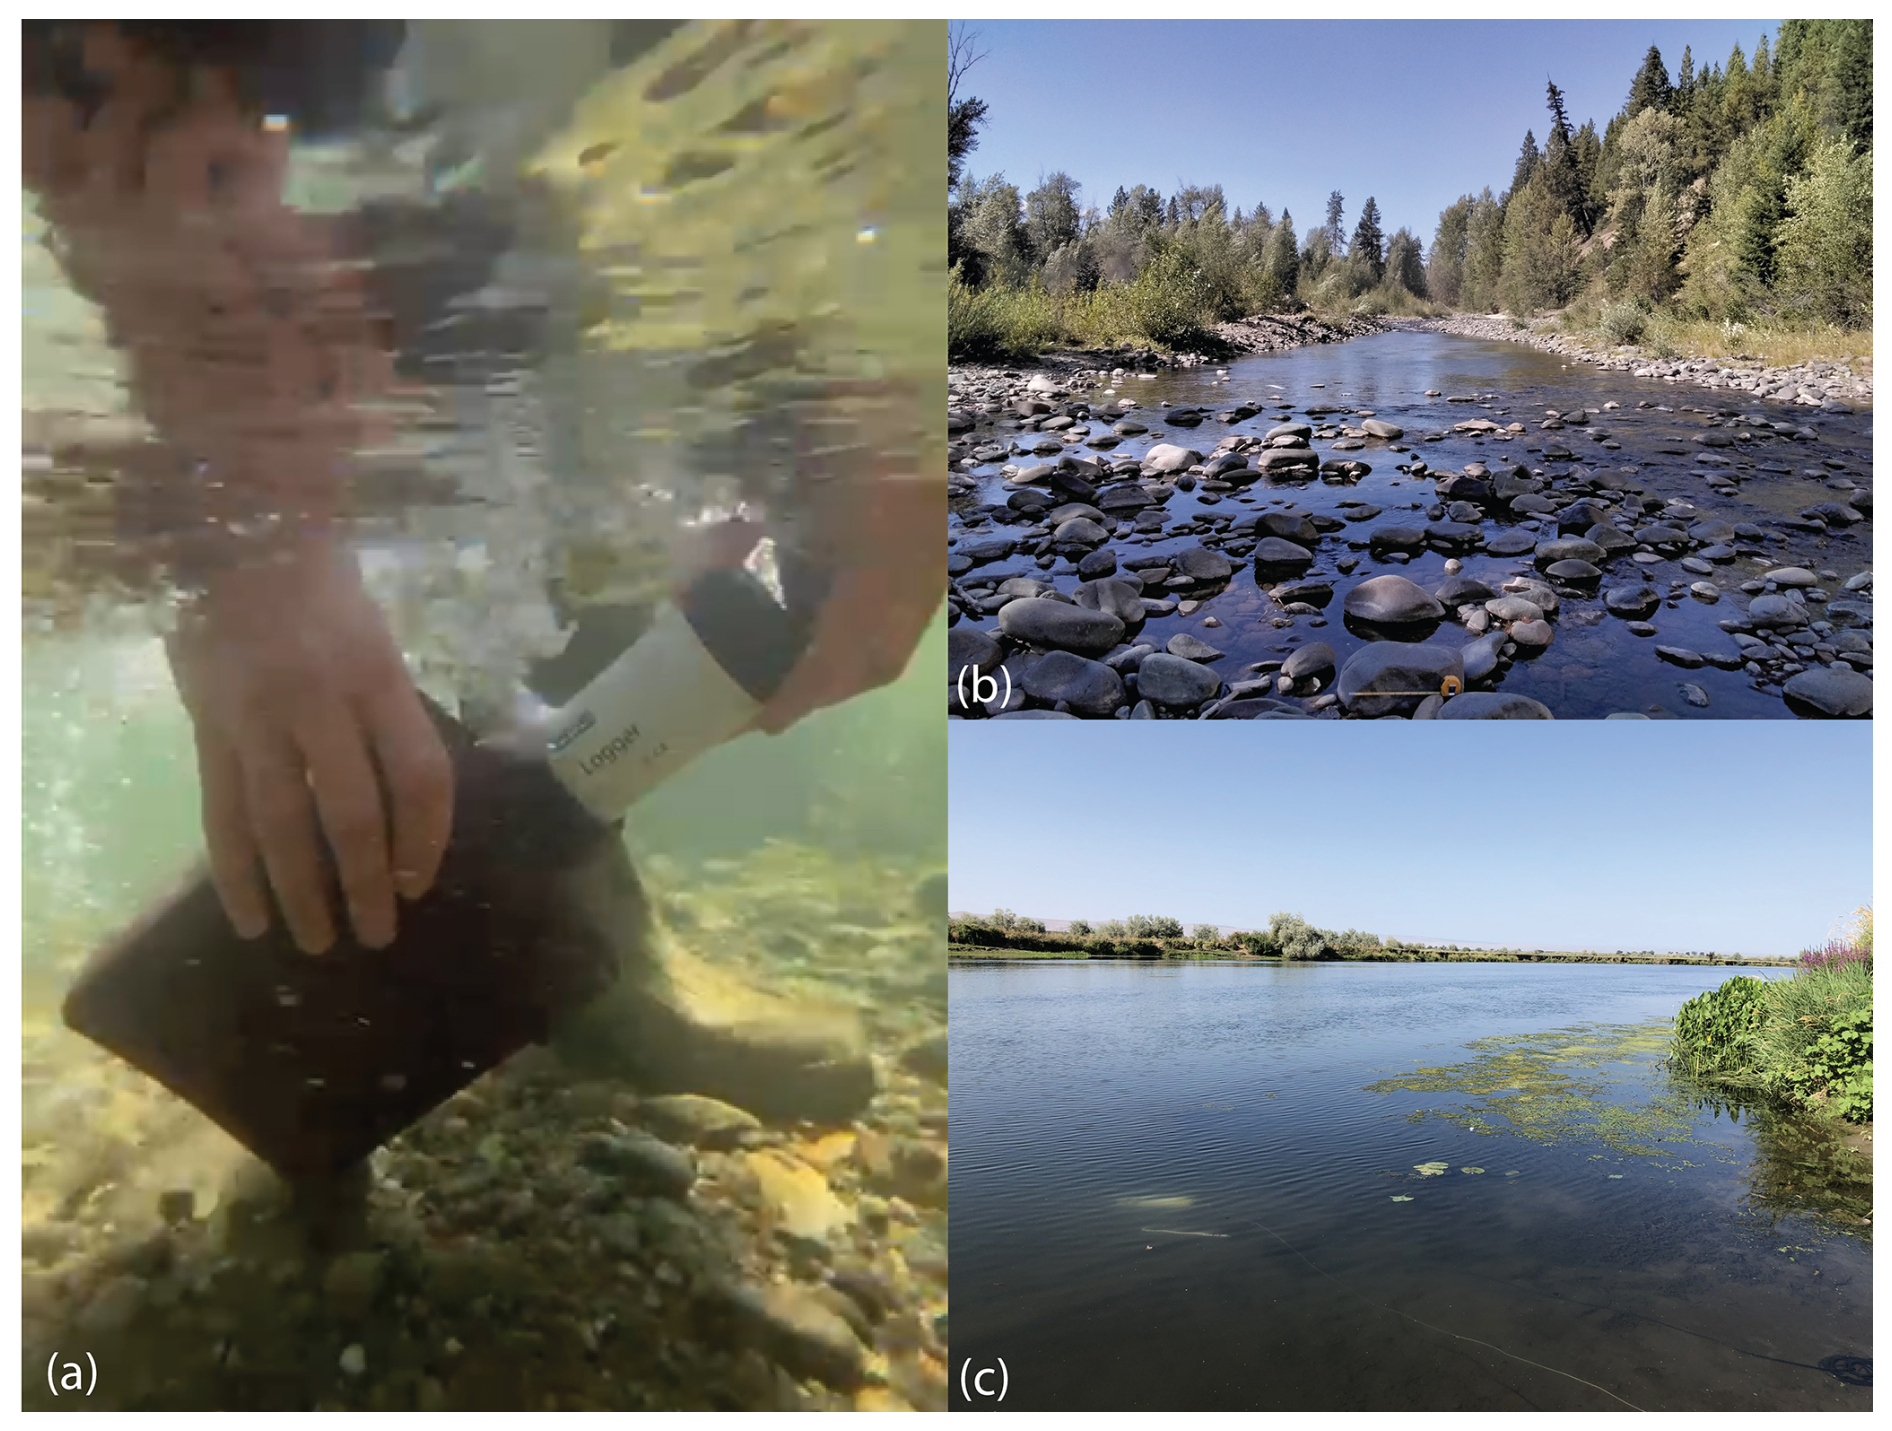
Figure 1Modified semi-in situ dark bottle incubation method and example study sites. (a) Underwater photograph of DO sensor being inserted into an incubation bottle filled with river water and the mixing device. Panels to the right emphasize the diversity of environmental settings covered in this study. (b) North Fork Teanaway River (site S19E), Kittitas County, Washington, September 2021. Site S19E is classified as a mesic, high-elevation site dominated by tree canopy (cluster 1; see Tables 1 and S3 and Fig. S1). (c) Yakima River at Mabton (site T02), Yakima County, Washington, September 2021. Site T02 is classified as a mesic, middle-elevation site dominated by tree canopy (cluster 5; see Tables 1 and S3 and Fig. S1).
2.4 Surface water chemistry sample collection and analysis
Filtered surface water samples were collected at each site for dissolved inorganic C (DIC, mg L−1); dissolved organic C (DOC, mg L−1); total dissolved N (TDN, mg L−1); anions, including nitrate (NO, mg L−1), chloride (Cl−, mg L−1), and sulfate (SO, mg L−1); and DOM chemistry using a 50 mL syringe and 0.22 µm sterivex filter (MilliporeSigma™ Sterivex™ Sterile Pressure-Driven Devices; MilliporeSigma™; Burlington, Massachusetts, USA) (Grieger et al., 2022). Samples were collected in triplicate from 50 % of the water column depth. Prior to sample collection, filter assemblies were rinsed once by pushing 5 mL of river water through the filter. DIC, DOC, and TDN samples were filtered into 40 mL amber glass vials (Amber Clean Snap Vials; Thermo Fisher Scientific; Waltham, Massachusetts, USA). DIC samples were collected by attaching a sterile 18 g needle (BD General Use and PrecisionGlide Hypodermic Needles; Becton, Dickinson, and Company; Franklin Lakes, NJ, USA) to the sterivex filter and pushing three vial-volumes of river water (∼ 150 mL) slowly through the syringe to prevent the introduction of air bubbles to the sample, allowing the vials to overflow continuously. When the final 50 mL of river water was pushed through the syringe, the vials were capped with a surface tension dome of water to ensure no headspace. Samples collected for ion analysis were filtered into a 15 mL conical tube (Olympus™ Plastics; Genesee Scientific; Morrisville, NC, USA). Samples collected for DOM chemistry were filtered into pre-acidified (85 % phosphoric acid, H3PO4) 40 mL amber vials (Amber Clean Snap Vials; Thermo Fisher Scientific; Waltham, Massachusetts, USA) (Grieger et al., 2022). One unfiltered grab sample for total suspended solids (TSS, mg L−1) was collected using a pre-washed 2 L amber bottle (Nalgene™ Rectangular Amber HDPE Bottles; Thermo Fisher Scientific; Waltham, Massachusetts, USA). TSS bottles were rinsed three times with river water prior to sample collection. All samples were stored on ice in the field and then refrigerated at 4 °C before shipping for analysis to the Pacific Northwest National Laboratory (PNNL) Marine and Coastal Research Laboratory in Sequim, Washington (DOC and DIC), and PNNL Biological Sciences Facility Laboratory in Richland, Washington (TSS, ions, and DOM). The TSS samples were analyzed within 1 week of collection, DOC and TDN were measured within 2 weeks of collection, DIC was measured within 1 month of collection, and ion and DOM samples were frozen (−20 °C) upon receiving until analysis.
DOC, TDN, and DIC were measured on a Shimadzu TOC-L total organic carbon analyzer. DOC was measured as non-purgeable organic C (NPOC). Anion concentrations were determined quantitatively on a Dionex ICS-2000 anion chromatograph with an AS40 autosampler using one replicate. An isocratic method was used with 23 mM KOH eluent at 1 mL min−1 at 30 °C. The analytical column was an IonPac AS18 (4×250 mm, Dionex catalog # 060549). The suppressor was an ADRS 600 set at 57 mA (4 mm, self-regenerating, Dionex catalog # 088666). Concentrations below the limit of detection (LOD) of the instrument, or below the standard curve, were flagged (Grieger et al., 2022). For other samples below the lowest standard value (TDN: 0.1 mg L−1, NO: 0.07 mg L−1), one-half of the lowest standard value was used (TDN: 0.05 mg L−1, NO: 0.035 mg L−1) for statistical analysis. For samples below the limit of detection (TDN LOD: 0.07 mg L−1; NO LOD: 0.07 mg L−1) but above the lowest standard, one-half of the LOD value (TDN: 0.035 mg L−1; NO: 0.035 mg L−1) was used for analysis. Phosphate (PO) was measured; however, over two-thirds of samples showed values below detection, and thus the analyte was not used in subsequent analyses. Pairwise differences between the NPOC, TDN, and DIC measurements from all replicates were calculated. The sample that had the largest difference from the other samples was removed if the coefficient of variation was greater than 30 %. This coefficient of variation threshold for sample removal is based on inspecting histograms of these data types and determining the point at which sites likely contain anomalous outlier values. Parameter mean values for each site were then calculated from the remaining replicates.
TSS samples were filtered in the laboratory through a pre-weighed and pre-combusted 4.7 cm, 0.7 µm GF/F glass microfiber filter (Whatman™ glass microfiber filters, Grade 934-AH®; MilliporeSigma; Burlington, Massachusetts, USA). After water filtration, the filter and filtration apparatus were rinsed with 30 mL of ultrapure Milli-Q water (Milli-Q® IQ Water Purification System; MilliporeSigma; Burlington, Massachusetts, USA) to ensure that all residue was captured by the filter. The filter was placed in foil and oven-dried overnight at 45 °C. TSS (mg L−1) was calculated as the difference between the weight (mg) of the filter before and after filtration of the water sample divided by the volume of water filtered (L). For samples below the LOD, one-half of the LOD value (LOD: 0.24 mg L−1) was used for analysis.
2.5 DOM chemistry via ultra-high-resolution mass spectrometry and biochemical transformations
Organic matter chemistry was characterized via ultra-high-resolution mass spectrometry using a 12 Tesla (12T) Bruker solariX Fourier transform ion cyclotron resonance mass spectrometer (FTICR-MS) at the PNNL Environmental Molecular Sciences Laboratory in Richland, Washington, following methods described in Garayburu-Caruso et al. (2020b). Measured DOC concentrations were used to normalize the DOC concentration of the sample to 1.5 mg C L−1 prior to further processing. Samples were thawed in the dark at 4 °C overnight before acidifying to pH 2 using 85 % H3PO4. Samples were then subjected to solid phase extraction (SPE) using Bond Elut PPL cartridges (Agilent; Santa Clara, CA, USA) following protocols employed by Dittmar et al. (2008). Extracted samples were run in the FTICR-MS with a standard electrospray ionization source in negative mode. Data were collected with an ion accumulation time of 0.08 s. Bruker Daltonik Data Analysis version 4.2 was used to convert raw spectra to a list of molecular compound mass-to-charge ratios () with a signal-to-noise ratio () threshold set to 7 and absolute intensity threshold to the default value of 100. Peaks were aligned (0.5 ppm threshold), and molecular formulas were assigned using the Formultitude (previously named Formularity) software, with and mass measurement error < 0.5 ppm (Tolić et al., 2017). The compound identification algorithm takes into consideration the presence of C, H, O, N, S, and P and excludes other elements. The aligned and calibrated data were further processed using ftmsRanalysis (Bramer et al., 2020). Replicate samples were merged into one site, where peaks in a sample were retained if they were present in at least one of the replicates. DOM biochemical transformations were inferred following methods previously employed by Danczak et al. (2023), Fudyma et al. (2021), Garayburu-Caruso et al. (2020a), Ryan et al. (2024), and Stegen et al. (2018). In summary, we calculated pairwise mass differences between every peak in a sample regardless of the molecular formula assigned and compared that mass difference to a list of 1255 molecular masses associated with commonly observed biochemical transformations (Table S4). Biochemical transformations allow you to infer the number of times the mass that corresponds to a specific molecule is gained or lost. For example, if a mass difference between two peaks corresponded to 128.095, that would correlate to the loss or gain of the amino acid lysine (see Table S4). We further calculated the total number of DOM transformations per site and the total number of DOM transformations normalized by the number of peaks present in the site (i.e., “normalized DOM transformations”).
2.6 DO sensor data cleaning, processing, and analysis
We extracted the raw DO concentration (mg O2 L−1) and temperature (°C) sensor data for each site and plotted DO and temperature against incubation time for each set of triplicate incubations (n=141). The plots were visually inspected to (a) confirm that the temperature sensors were at equilibrium with the river temperature when the 2 h incubation test period began and (b) identify data gaps, outliers, and other data anomalies. Following the visual inspection of plots, the first 5 min of the time series was removed, and then the data were trimmed to 90 min to account for anomalies due to emptying and refreshing river water in the bottles and to ensure that all sites had the same incubation time. The sensor data distributions were also evaluated using violin plots for each site.
ERwc rates for individual triplicate incubation samples were calculated as the slope of the linear regression between the DO sensor data and the incubation time, which was converted to units of g O2 m−3 d−1. All samples met the normalized root mean square error (NRMSE) criteria of ≤ 0.01 (Shcherbakov et al., 2013). Mean ERwc for each site and the global mean and variance were then calculated from the samples (n=141). Nearly one-fifth of the ERwc values were slightly positive. Positive respiration rates are biologically unrealistic; however, positive values less than 0.5 g O2 m−3 d−1 are difficult to distinguish from 0 (Appling et al., 2018b). Thus, we changed positive ERwc values less than 0.5 g O2 m−3 d−1 to 0 for analysis and removed values greater than 0.5 g O2 m−3 d−1 (n=2). ERwc values greater than 0.5 g O2 m−3 d−1 were observed when the DO concentration in the bottle started near 5 mg O2 L−1 and increased over the 2 h incubation period. The increase in concentration and the high, positive respiration rate are likely due to the diffusion of DO through the bottle walls. The ERwc values are reported in volumetric units (g m−3 d−1) as opposed to areal units (g m−2 d−1) due to difficulties in obtaining high-quality depth data across all field sites, spanning small headwater streams to large mainstem rivers.
2.7 Relationship of water column respiration rates to watershed characteristics and surface water chemistry
We evaluated the relationship between ERwc, watershed characteristics, physical parameters, and surface water chemistry using LASSO regression models, which perform variable selection and model regularization, to establish the suite of explanatory variables that most influence variation in ERwc across the Yakima River basin. We observed that several model input variables had skewed distributions; thus, a cube root transformation was applied to all variables to reduce the impact of high leverage points in the regression analysis. Further, all data were standardized as z-scores before analysis to ensure that all the data were in the same quantitative range. The β coefficients reported for each variable were calculated by performing LASSO regression using the glmnet function in R (Friedman et al., 2010) over 100 random seeds, normalizing to the maximum β coefficient in each regression, and averaging the normalized β coefficients across the 100 iterations. The minimum penalty parameter (λ) determined by cross validation was used in each regression. Because LASSO regression was used for exploratory analysis, not prediction, the data were not split into training and testing sets. LASSO does not inherently estimate R2, so we calculated it using the total sum of squares and residual sum of squares for each fitted model, as traditionally done with standard multiple regression. For estimation of the residual sum of squares, we used predicted values of ERwc based on the explanatory variables used in the model. The R2 estimates were used to estimate how much variation in ERwc was explained by each of the LASSO models. The standard deviations of the β coefficients were compared to the mean values of the β coefficients to confirm that the most important variables were relatively consistent across seeds. Total drainage area (km2) was defined as the total upstream drainage area from each site and was extracted for each site from the NHDPlusV2.1 stream database using site latitude and longitude. The stream order for each site was extracted as the reach attribute “StreamOrde” from the NHDPlusV2.1 stream database, which is a modified version of Strahler stream order (Blodgett and Johnson, 2022; U.S. Geological Survey, 2019a; Willi and Ross, 2023). To evaluate whether the directionality of relationships observed in the LASSO regression was consistent with univariate relationships, we used Pearson correlations between ERwc, drainage area, water chemistry, and environmental factors; these correlations were calculated using the cor function in R.
2.8 Comparison to published water column respiration rates
To contextualize the magnitude of observed ERwc rates in the Yakima River basin, we compared our results to published literature values of ERwc (n=118) (Table S5) and ERtot (n=208). Published ERwc values were converted to volumetric units (g O2 m−3 d−1) using standard unit conversions. For example, molar values (µmol O2 L−1 h−1) as in Devol et al. (1995) and Quay et al. (1995) were corrected using the molar mass of oxygen and standard time conversions. When ERwc was reported with respect to C or carbon dioxide (CO2), as in Ellis et al. (2012) and Ward et al. (2018), the conversions provided in the text were used to convert to an O2 basis. Areal estimates of ERwc (g O2 m−2 d−1), as in Genzoli and Hall (2016) and Reisinger et al. (2021), were converted to volumetric units by multiplying by 1/depth (m−1) using same-day depth data for each reach studied. We also compared our ERwc values to daily reach-averaged estimates of ERtot (n=490 907) for 356 rivers and streams across the CONUS by using the datasets published in Appling et al. (2018a, b) and Bernhardt et al. (2022), where ERtot was estimated by a single-station, open-channel approach using the streamMetabolizer package in R (Appling et al., 2018a, b). For our comparative analysis, we used the cleaned, gap-filled data from Bernhardt et al. (2022) (n=208). The Bernhardt et al. (2022) sites are a subset of the Appling et al. (2018a, b) dataset generated through a robust data quality analysis to remove sites potentially affected by process or observation error. For comparison with our ERwc values, we first averaged the Bernhardt et al. (2022) ERtot areal units (g O2 m−2 d−1) at each site. Then, the average ERtot values were converted to volumetric units by calculating the average river depth per site from the Appling et al. (2018a, b) dataset and multiplying the average ERtot by 1/depth.
3.1 Yakima River basin ERwc rates spanned literature values
At baseflow conditions, ERwc varied widely across the Yakima River basin. The linear regression models for each triplicate set of DO sensor measurements were well-fit to the data, and all sites met the criteria for NRMSE ≤ 0.01 (Figs. S2, S3). We observed consistency across triplicate measurements, illustrating that the method was effective in providing repeatable estimates of ERwc rates throughout the Yakima River basin (Figs. S2, S3). After removing positive respiration rates > 0.5 g O2 m−3 d−1, which were associated with diffusion effects on DO, and turning small positive rates to 0, the ERwc rates ranged from −7.38 to 0 g O2 m−3 d−1, with a median value of −0.58 g O2 m−3 d−1 (mean: −0.84 g O2 m−3 d−1, standard deviation = 1.23 g O2 m−3 d−1) (Fig. 2a).
The values of ERwc observed in our study spanned the range of published literature values (Fig. 2; Table S5). From 118 published measurements of ERwc across the CONUS and the Amazon River basin, ERwc ranged from −4.63 to −0.07 g O2 m−3 d−1. We compared median values, rather than means, across studies because medians are more appropriate for skewed distributions and are less sensitive to outliers in the data. The median ERwc from this study (−0.58 g O2 m−3 d−1) is slower than the median of literature-reported ERwc values (−0.96 g O2 m−3 d−1). However, the fastest ERwc rate in the Yakima River basin (−7.38 g O2 m−3 d−1) exceeded the fastest reported literature value (−4.63 g O2 m−3 d−1) (Reisinger et al., 2021). Reisinger et al. (2021) measured ERwc in 15 mid-sized rivers across basins with differing turbidity levels and nutrient concentrations, finding a similar median ERwc (−0.60 g O2 m−3 d−1) to that in this study. In the Klamath River, the median ERwc (−0.51 g O2 m−3 d−1) was also similar to that in the Yakima River basin. However, ERwc doubled following summer cyanobacteria blooms, emphasizing the temporal variability in water column processes with changing environmental conditions (Genzoli and Hall, 2016). In the Amazon basin, literature comparisons varied, with median ERwc measurements similar to those found in the Yakima River basin in some studies (Devol et al., 1995; Ellis et al., 2012; Quay et al., 1995) and faster than those in the Yakima River basin in others (Ward et al., 2018). Ward et al. (2018) highlighted the importance of mixing in large rivers, noting that previous measurements of aquatic respiration in large tropical rivers, such as those measured in Quay et al. (1995) and Devol et al. (1995), may underestimate microbial respiration contribution due to lack of mixing during rate measurements. While comparisons across study medians are variable, the observation that ERwc in the Yakima River basin spans – and exceeds – reported literature values highlights the potential for using it as a test basin for understanding and uncovering transferable principles linked to stream metabolism.
While ERtot estimates are not available across the Yakima River basin at the time of ERwc estimation for this paper, the measured ERwc rates spanned a large fraction of CONUS-scale ERtot rates estimated by Appling et al. (2018a, b) and Bernhardt et al. (2022). ERtot rates are reach-scale estimates of stream metabolism derived from time series measurements of DO. This method assumes well-mixed conditions such that sensor measurements represent homogenous reach observations. Under well-mixed conditions, ERwc measurements from dark bottle incubations are also representative of reach-scale processes (Genzoli and Hall, 2016). The median ERtot for 208 CONUS measurements was −5.25 g O2 m−3 d−1 with a range from −36.55 to −3.73 g O2 m−3 d−1. The median ERwc rate (−0.58 g O2 m−3 d−1) observed in the Yakima River basin was 11 % of the median ERtot (Fig. 2). The fastest ERwc rate in the Yakima River basin (−7.38 g O2 m−3 d−1) was faster than the median ERtot (Fig. 2). While both ERtot and ERwc measurements span a range of stream conditions, we acknowledge that we did not compare these rates directly at the same places and times. However, given the overlap of ERwc from the Yakima River basin with CONUS-scale ERtot, we suggest that ERwc could typically represent a small fraction of ERtot but may occasionally have larger contributions across the Yakima River basin. If we had observed consistently very slow ERwc across the Yakima River basin, there would be little overlap with the literature ERtot values, and we would have inferred consistently small contributions of ERwc to ERtot. In comparison, Genzoli and Hall (2016) observed that before summer cyanobacteria blooms, ERwc contributed around 10 % of ERtot in sites along the Klamath River, with the contribution of ERwc to ERtot increasing following cyanobacteria blooms. Additionally, Reisinger et al. (2021) found that ERwc was not the dominant contributor to ERtot in mid-sized rivers, except at sites with low ERtot (mean ERwc contributions to ERtot: 35 %, range 2 %–81 %). While these studies have shown spatiotemporal variability of the contributions of ERwc to ERtot, exploring these relationships in the Yakima River basin requires further research where ERtot is measured in conjunction with ERwc.
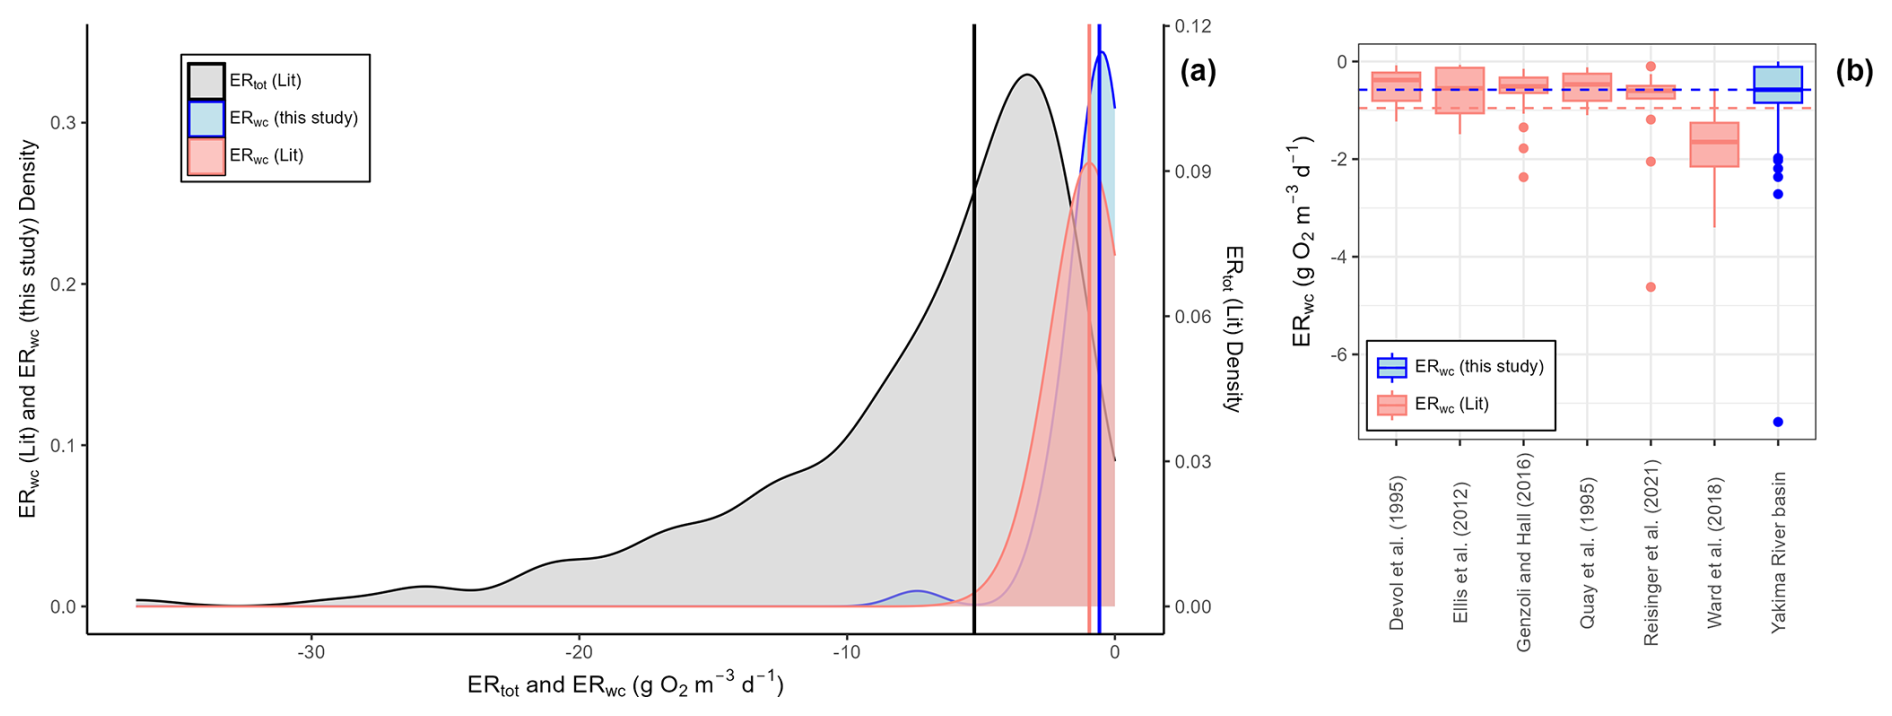
Figure 2Water column respiration data from the Yakima River basin (ERwc (this study); n=45), published water column respiration rates (ERwc (Lit); n=118), and reach-scale estimates of ecosystem respiration by Appling et al. (2018a, b) and Bernhardt et al. (2022) (ERtot; n=208). (a) Kernel density plots of ERwc from the Yakima River basin (this study), published ERwc rates (Lit) that have been converted to the same units as in this study (g O2 m−3 d−1), and published reach-scale ERtot (Lit) from Bernhardt et al. (2022) that have been converted to volumetric units using depth data from Appling et al. (2018a). The left y axis is for ERwc values. The right y axis is for ERtot values. The vertical blue line is the median ERwc observed in the Yakima River basin (−0.58 g O2 m−3 d−1). The vertical red line is the median ERwc values from studies in rivers across the CONUS and the Amazon River basin (−0.96 g O2 m−3 d−1). The vertical black line is the median ERtot value (−5.25 g O2 m−3 d−1). (b) Boxplots of published ERwc and ERwc from the Yakima River basin. The blue horizontal dashed line represents median ERwc in the Yakima River basin. The red horizontal dashed line represents median ERwc from literature values.
3.2 Water column respiration rates varied weakly with drainage area and stream order
We observed a relatively weak correlation between ERwc and drainage area across the Yakima River basin, though it does suggest that ERwc becomes faster while moving down the stream network (Fig. 3). In latter sections, we use multivariate analysis for further evaluation of the relationships between ERwc and explanatory variables, effectively competing drainage area against other variables as a way to more deeply evaluate our hypothesis. The lack of a strong connection between ERwc and drainage area is somewhat surprising, as a strong relationship could emerge from downstream C transport as well as increasing autochthonous C inputs due to increasing temperature and light availability, providing an additional substrate for microbial respiration (Finlay, 2011; Webster, 2007). The fastest observed ERwc rate in the Yakima River basin occurred in an agriculturally influenced, low gradient, fifth-order stream, as opposed to our hypothesis of ERwc being fastest in the highest stream orders (Fig. 3). The conditions at this sampling location were not representative of the whole drainage area, as areas upstream of this site are mountainous with little human influence. This finding suggests that localized factors, not upstream conditions or drainage area, provide primary controls over ERwc. Anthropogenic impacts, such as from agriculture and urbanization, can alter nutrient dynamics and flow regimes in these areas, influencing biogeochemical processes such as ERwc (Bernot et al., 2010). Additionally, while we report ERwc on a volumetric basis, we acknowledge that this approach does not account for variation in water column depth along the river continuum. As river depth increases downstream, we expect the areal contribution of water column processes to also increase because areal contributions integrate across the whole water column (Wang et al., 2022). The relatively weak correlation between volumetric-based ERwc and drainage area in the Yakima River basin likely reflects the interplay of multiple factors, including spatially variable local conditions, underscoring the complex controls on ecosystem processes in this region.
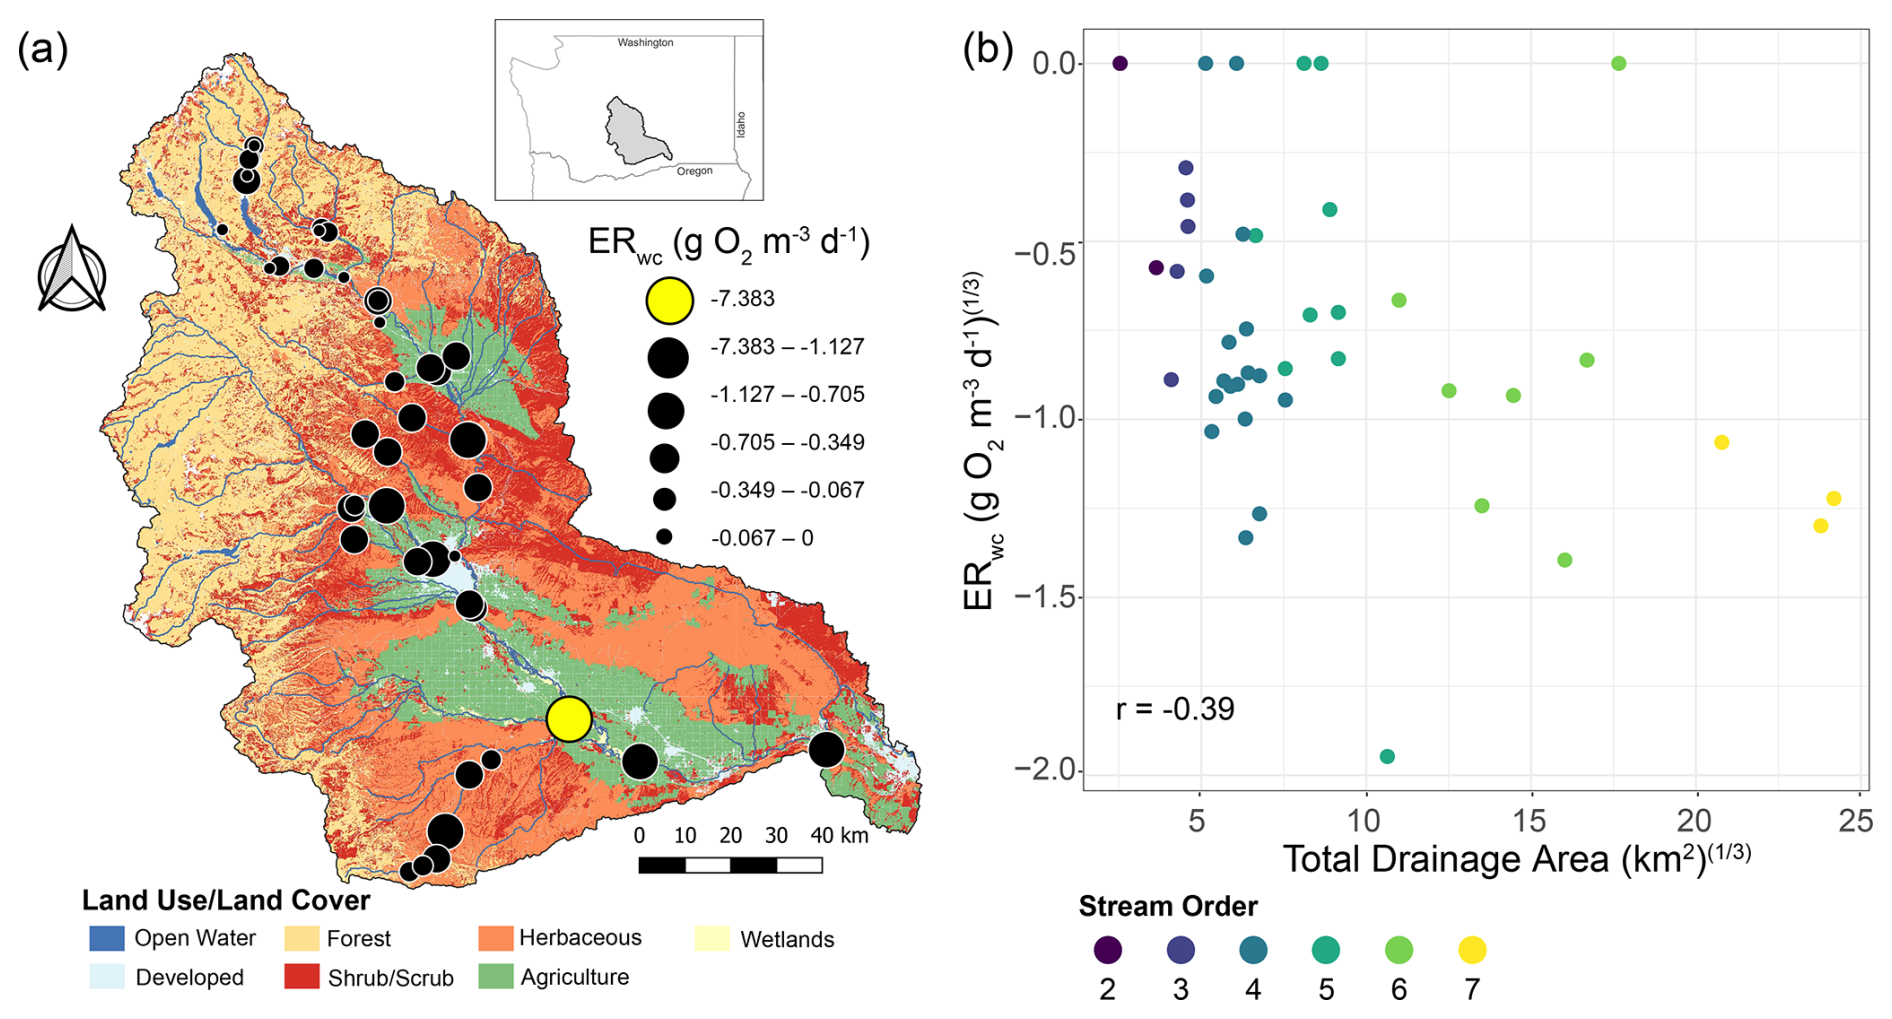
Figure 3ERwc across the Yakima River basin and its relationship with total drainage area. (a) Map of land use/land cover classes in the Yakima River basin with ERwc values (g O2 m−3 d−1) overlaid. Faster rates are indicated by larger circle diameters. The fastest rate is indicated by the yellow circle. The map was generated using the Free and Open Source QGIS (v. 3.16.1 and v. 3.26.0). Map data include catchment boundaries and hydrography from the National Hydrography Dataset Plus (NHDPlusV2.1) (U.S. Geological Survey, 2019a) and 2016 land use/land cover data from the National Land Cover Dataset (U.S. Geological Survey, 2024). (b) Scatter plot of cube-root-transformed ERwc relative to cube-root-transformed total drainage area, with points colored by stream order. The Pearson correlation coefficient (r) is provided on the panel.
3.3 Higher temperatures and nutrient concentrations are associated with faster ERwc
Regression analyses showed that ERwc in the Yakima River basin varied with chemical and physical water quality parameters. TDN, temperature, DOC, and TSS emerged as key variables in the LASSO regression, whereby ERwc was faster with higher values of all these variables (Table 2). The LASSO regression explained 49 % of the variation in ERwc (Table 2). LASSO results are similar to univariate relationships, whereby DOC, TDN, temperature, and TSS had the strongest correlations with ERwc ( to −0.63) (Figs. 4, S4) and all correlations were qualitatively in the same direction, as indicated by the LASSO β coefficients. Changing positive ERwc values less than 0.5 g O2 m−3 d−1 to 0 did not change the overall interpretation of univariate or multivariate relationships (Figs. S4, S5, Table S4). Collectively, the relative importance of these variables suggests that ERwc is not controlled by a single variable, and instead multiple factors (i.e., nutrient concentrations, suspended particles, and temperature) are simultaneously linked to ERwc.
Collinearity between LASSO variables could result in one variable being retained in the LASSO model over another. We used LASSO regressions across 100 random seeds, averaging the model coefficients, to help minimize spurious outcomes. This revealed relatively small standard deviations of β coefficients compared to mean β coefficient values, indicating that the four most important variables are consistent across seeds, even when one variable is chosen over another (Table 2). For example, total drainage area was correlated with nutrient concentrations and temperature (Fig. S4), which were retained as more directly explaining variation in ERwc in the LASSO regression. Additionally, while total drainage area showed a negative univariate correlation with ERwc (Fig. 3b), it showed a slight positive relationship with ERwc in the LASSO regression. This suggests that total drainage area likely acts as a proxy for regional watershed processes that influence ERwc directly, like nutrients and temperature, rather than a causal relationship (Caissie, 2006; Manning et al., 2020). Similarly, TDN was strongly correlated with other explanatory variables, such as NO, Cl−, and SO, likely reflecting an increase in agricultural inputs that, in turn, lead to faster ERwc through supporting microbial metabolism (Bernot et al., 2010). Including phosphorus data could further improve model performance, as phosphorus is often a limiting factor for microbial growth in freshwater rivers (Carroll, 2022). Phosphorus limitation is likely in the Yakima River basin, as more than two-thirds of the phosphorus concentrations were below instrument detection, leading to its exclusion from the analysis. These results underscore the importance of interpreting LASSO results within the context of all explanatory variables used in the model, particularly in large, heterogenous catchments.
Table 2β coefficients from LASSO analyses for explaining ERwc across the Yakima River basin. ERwc and all explanatory variables were cube-root-transformed and standardized as z-scores. LASSO was performed over 100 seeds, and β coefficients for each variable were normalized to the maximum β coefficient in each seed and averaged across all seeds for the reported values. Values of 0 indicate that, while the variable was included in the model, it was deemed not influential in predicting model outcomes and thus was not assigned a β coefficient.
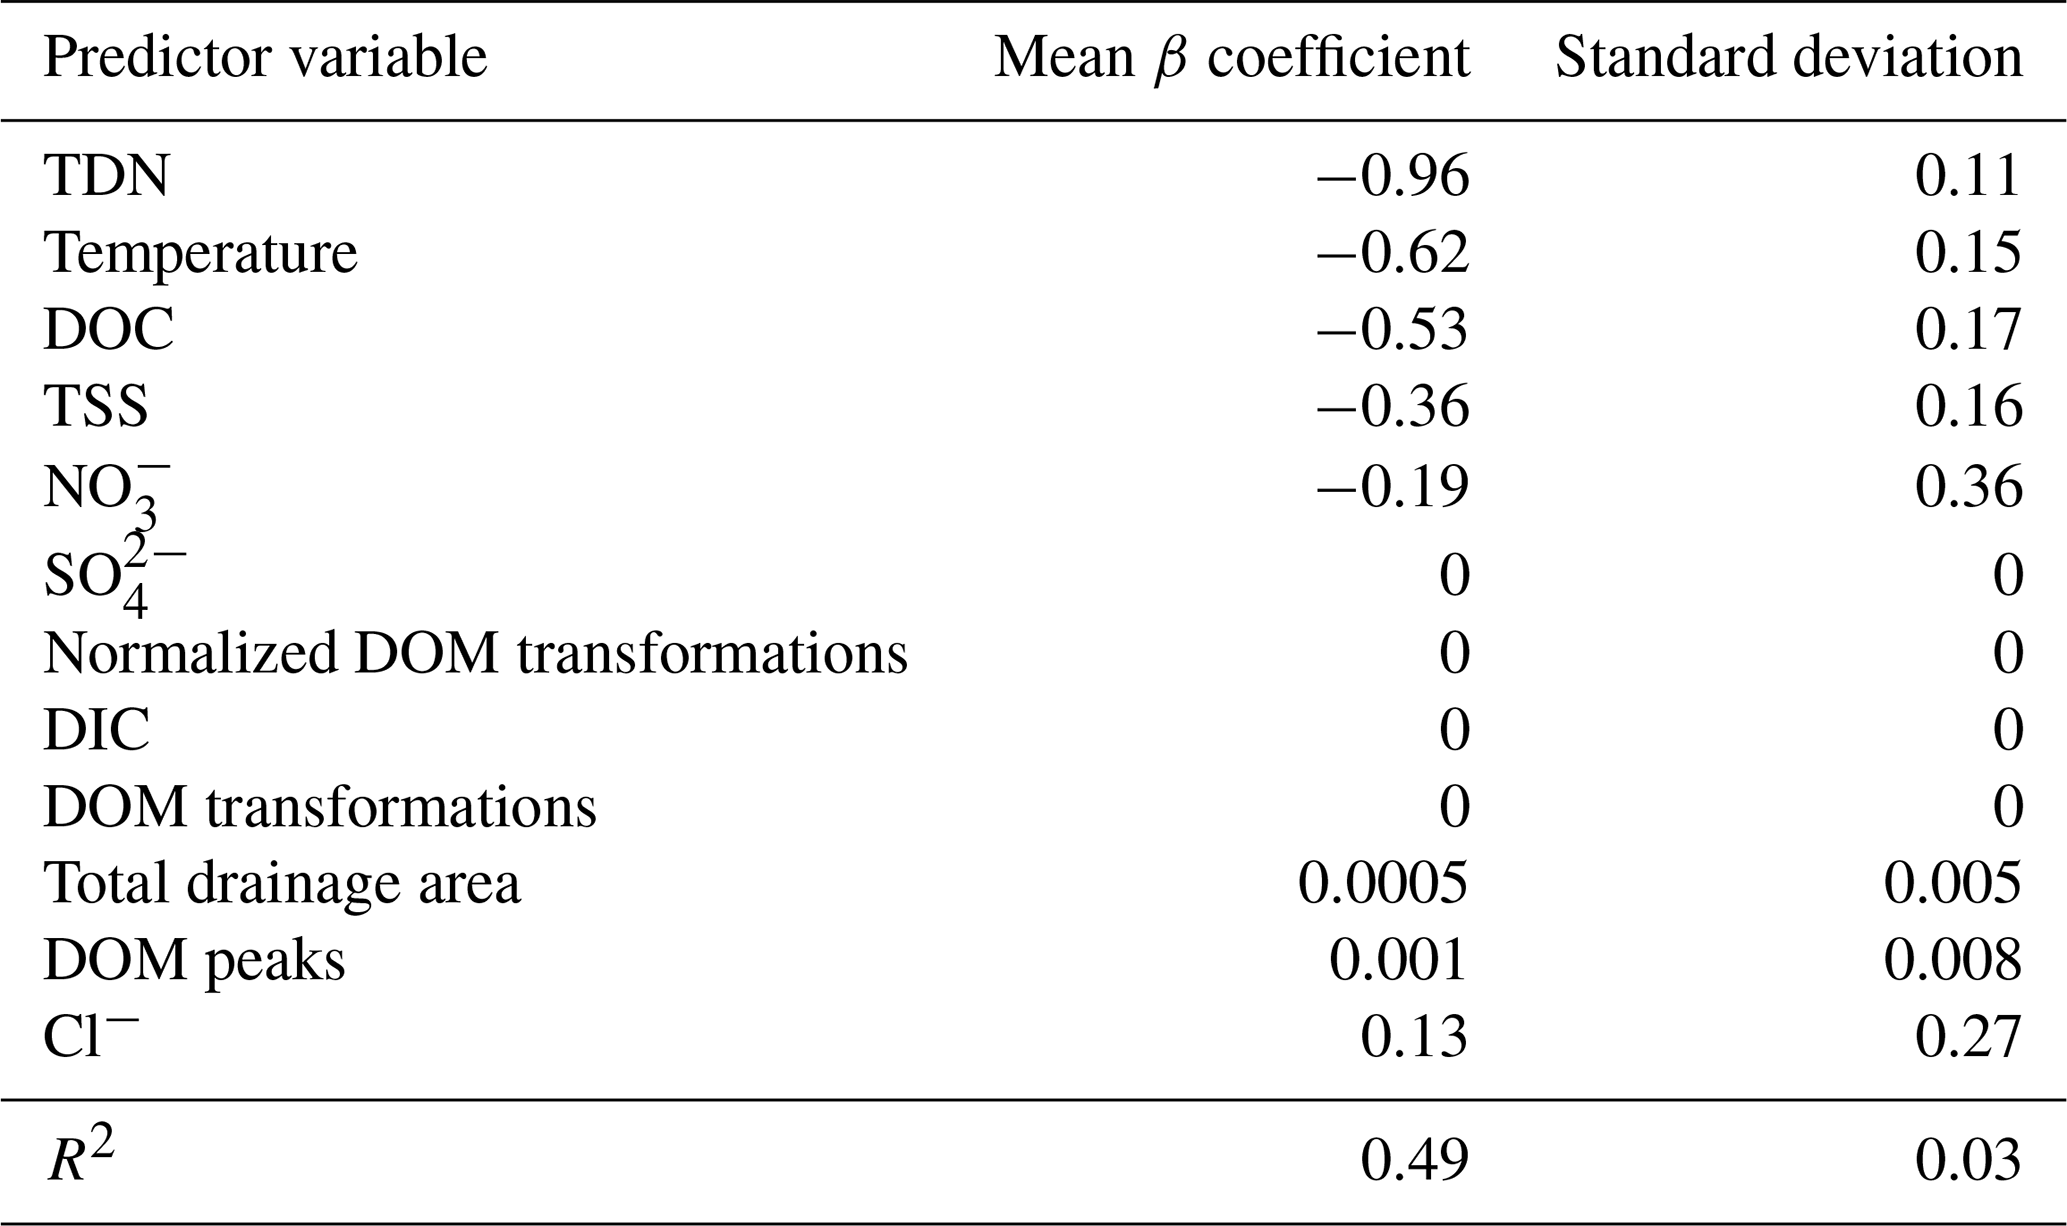
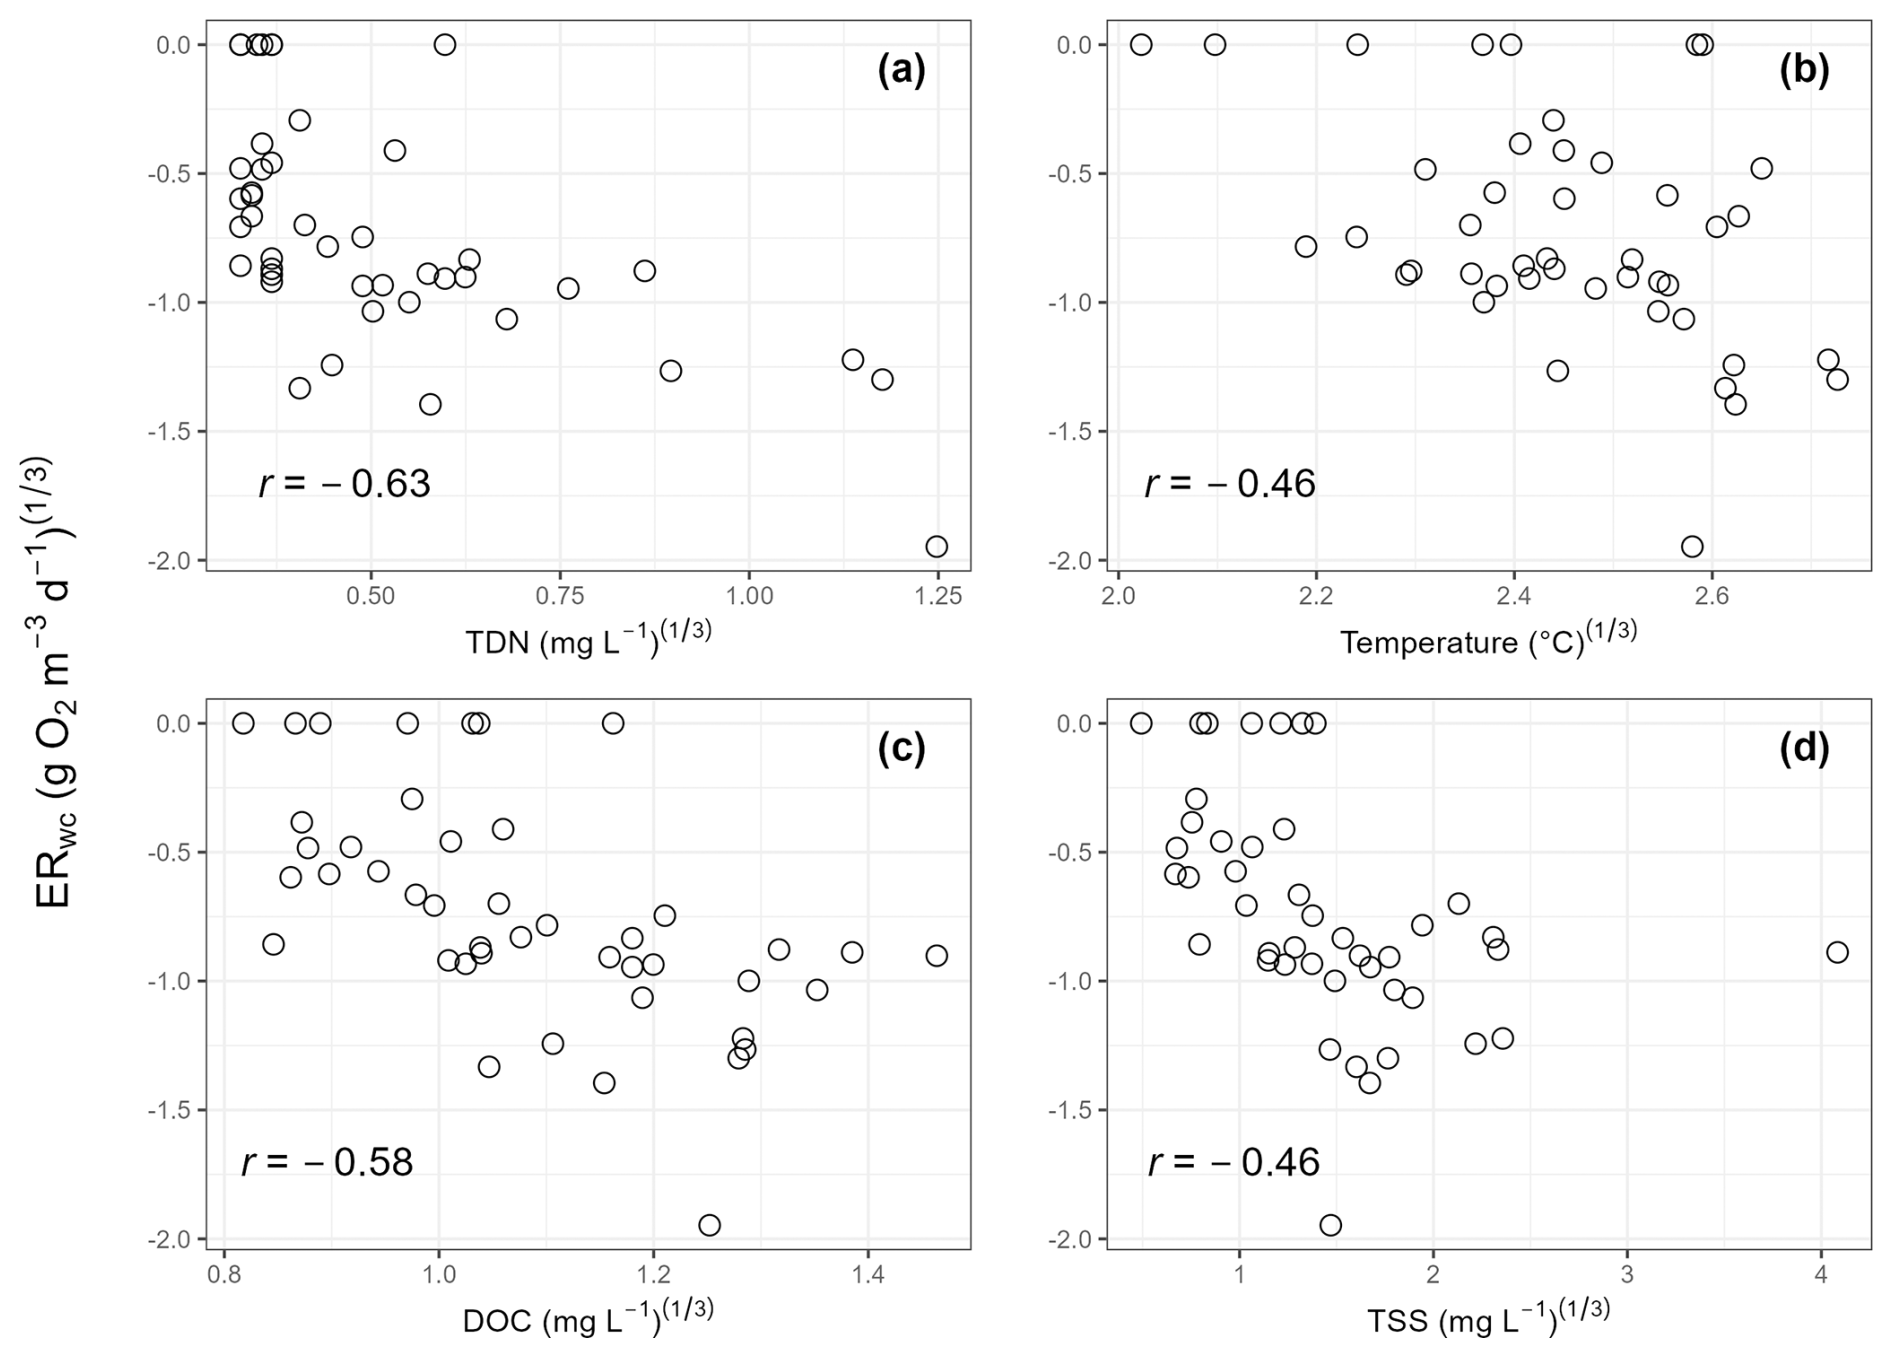
Figure 4Scatter plots of cube-root-transformed variables that were important in the LASSO regression. Cube-root-transformed ERwc is the y axis for all panels. (a) Cube-root-transformed total dissolved nitrogen (TDN); (b) cube-root-transformed temperature; (c) cube-root-transformed dissolved organic carbon (DOC); and (d) cube-root-transformed total suspended solids (TSS). Pearson correlation coefficients (r) are provided on each panel.
Faster ERwc with increasing TDN, temperature, DOC, and TSS in the Yakima River basin is expected, as nutrients and temperature can impact variation in stream metabolism (Ardón et al., 2021; Bernot et al., 2010; Honious et al., 2021; Hornbach, 2021; Nakano et al., 2022). In-stream metabolism relies on terrestrially derived and internally fixed inputs of DOC, which supports heterotrophic metabolism that degrades and removes organic C inputs through respiration (Hall et al., 2016; Hotchkiss and Hall, 2014; Plont et al., 2022). Faster ERtot and ERwc have been reported with increases in DOC (Bernot et al., 2010; Ellis et al., 2012). However, elevated DOC does not always correspond to greater ERtot, as discharge and residence time also affect C dynamics (Ulseth et al., 2018). In addition to DOC, suspended sediment can regulate ecosystem metabolism by decoupling ecosystem respiration and GPP through limiting light availability, thereby reducing autochthonous C production, and, conversely, by stimulating processing of organic matter through increased surface area (Glover et al., 2019; Honious et al., 2021). The increased surface area of suspended particles in the water column provides microsite habitats for microorganisms (Liu et al., 2013; Ochs et al., 2010), where bacterial production and enzymatic activity are concentrated, contributing substantially to material processing in the water column, particularly in rivers of the fifth order and higher (Gardner and Doyle, 2018; Reisinger et al., 2015). Nutrient dynamics, particularly N, also influence ecosystem respiration, where elevated N concentrations have been linked to increased ecosystem respiration across stream orders (Benstead et al., 2009; Reisinger et al., 2016, 2021; Rosemond et al., 2015). Nitrogen is a key nutrient for microbial growth and is often a limiting nutrient in freshwater rivers (Carroll, 2022). Consistent with this, we found the fastest ERwc at an agriculturally influenced stream with the greatest TDN and NO concentrations. Elevated nutrient levels at this site likely stimulate microbial respiration, similar to Cross et al. (2022), who found an increase in heterotrophic respiration in response to N enrichment. Moreover, respiratory processes are typically faster at higher temperatures (Pietikäinen et al., 2005), which can shift riverine ecosystems toward heterotrophy (Song et al., 2018). By stimulating microbial respiration, higher temperatures can also amplify the effects of increasing nutrients (Cross et al., 2022). Collectively, we infer that increasing temperature and nutrients, potentially from anthropogenic inputs, are the most likely drivers of ERwc in the Yakima River basin. Ultimately, our results emphasize the complex and dynamic roles of the physical, chemical, and biological factors that influence ERwc in the Yakima River basin and other similar freshwater ecosystems.
Our study shows that the ERwc rates observed in rivers and streams across the Yakima River basin span published rates from studies conducted in rivers across the CONUS and the Amazon River basin. While this study did not measure ERtot, the observed overlap between ERwc and literature ERtot shows the potential relevance of ERwc to overall stream metabolism. We pose that the high variability observed in ERwc rates across the basin will likely translate into variable contributions of ERwc to ERtot, ranging from negligible to potentially dominant. We anticipate that these influences will not vary systematically moving down the stream network, as we observed a relatively weak association between ERwc and drainage area across the Yakima River basin. Our results point to more localized control, and the LASSO regression specifically indicated that ERwc is faster with increasing TDN, stream temperature, DOC, and TSS, consistent with previous work. Overall, our findings show that the complex interactions between physical and chemical factors affect the spatial variability in ERwc across the Yakima River basin. We encourage future work to expand on our current study by collecting both ERwc and ERtot measurements at the basin scale and to consider areal rates to parse the contributions from both the water column and sediments to total ecosystem metabolism.
Data and scripts used to generate the main findings within this paper are published on the U.S. Department of Energy's Environmental System Science Data Infrastructure for a Virtual Ecosystem (ESS-DIVE) repository at https://doi.org/10.15485/2283171 (Laan et al., 2024). Other data collected during the field efforts (i.e., sensor data; surface water chemistry data; and geospatial information, metadata, and maps for the 2021 Spatial Study sampling event) can be accessed on ESS-DIVE at https://doi.org/10.15485/1898914 (Grieger et al., 2022) and https://doi.org/10.15485/1892052 (Fulton et al., 2022).
The supplement related to this article is available online at https://doi.org/10.5194/bg-22-6137-2025-supplement.
Conceptualization: JCS, MHK, ROH, SGF, VAGC, and MML. Data Curation: MML, SGF, YF, BF, VAGC, AEG, SG, MHK, XL, AMP, OO, and KS. Formal Analysis: MML, SGF, VAGC, MHK, XL, AMP, OO, and JT. Funding Acquisition: XC, TDS, and JCS. Investigation: MML, SGF, MEB, MAB, VAGC, SG, MHK, XL, SAM, AMP, OO, ACP, HR, LR, KS, JT, KS, JMT, and JCS. Methodology: MML, SGF, MHK, VAGC, ROH, XL, SAM, AMP, OO, HR, LR, KS, JT, and JCS. Project Administration: SGF, VAGC, SG, MHK, SAM, AMP, OO, LR, and JCS. Resources: MML, SGF, VAGC, SG, MHK, SAM, AMP, OO, and LR. Software: MML, SGF, VAGC, BF, MHK, XL, AMP, KS, and EM. Supervision: VAGC, XC, MHK, TDS, and JCS. Validation: MML, SGF, VAGC, SG, MHK, XL, AMP, OO, HR, and JCS. Visualization: MML, BF, SGF, MHK, XL, SAM, and JT. Writing – Original Draft Preparation: MML, SGF, VAGC, MHK, AMP, JT, and JCS. Writing – Review & Editing: MML, SGF, MEB, VAGC, BF, AEG, ROH, MHK, AMP, KS, JT, and JCS.
The contact author has declared that none of the authors has any competing interests.
Publisher’s note: Copernicus Publications remains neutral with regard to jurisdictional claims made in the text, published maps, institutional affiliations, or any other geographical representation in this paper. While Copernicus Publications makes every effort to include appropriate place names, the final responsibility lies with the authors.
FTICR-MS data were generated at the DOE BER Environmental Molecular Science Laboratory User Facility (EMSL; https://www.pnnl.gov/environmental-molecular-sciences-laboratory, last access: 6 March 2025) under user proposal 60221. We thank the Confederated Tribes and Bands of the Yakama Nation, US Forest Service (USFS), Washington Department of Natural Resources (WDNR), Washington State Parks, Cowiche Canyon Conservancy, and Washington Department of Fish and Wildlife (WDFW) for access to field locations where these samples were collected. We also thank the Yakama Nation Tribal Council and Yakama Nation Fisheries for working with us to facilitate sample collection and optimization of data usage according to their values and worldview. The authors would also like to thank Alexander J. Reisinger for providing the water column respiration data included in this study for 13 mid-sized turbid midwestern rivers and western rivers (Reisinger et al., 2021), as well as for helpful insights and discussions with the lead author on the state-of-the-science on water column respiration.
This research was supported by the U.S. Department of Energy (DOE), Office of Science, Office of Biological and Environmental Research, Environmental System Science (ESS) Program (https://ess.science.energy.gov/, last access: 11 October 2025). This contribution originates from the River Corridor Scientific Focus Area (SFA) project (grant no. 54737) at Pacific Northwest National Laboratory (PNNL). PNNL is operated by Battelle Memorial Institute for the U.S. DOE under Contract No. DE-AC05-76RL01830.
This paper was edited by Gabriel Singer and reviewed by two anonymous referees.
Alexander, R. B., Boyer, E. W., Smith, R. A., Schwarz, G. E., and Moore, R. B.: The Role of Headwater Streams in Downstream Water Quality, J. Am. Water Resour. Assoc., 43, 41–59, https://doi.org/10.1111/j.1752-1688.2007.00005.x, 2007.
Allan, J. D., Castillo, M. M., and Capps, K. A.: Carbon Dynamics and Stream Ecosystem Metabolism, in: Stream Ecology: Structure and Function of Running Waters, Springer International Publishing, Cham, 421–452, ISBN 978-3-030-61286-3, 2021.
Appling, A. P., Read, J. S., Winslow, L. A., Arroita, M., Bernhardt, E. S., Griffiths, N. A., Hall, R. O., Harvey, J. W., Heffernan, J. B., Stanley, E. H., Stets, E. G., and Yackulic, C. B.: Metabolism estimates for 356 U.S. rivers (2007–2017): U.S. Geological Survey data release [data set], https://doi.org/10.5066/F70864KX, 2018a.
Appling, A. P., Hall, R. O., Yackulic, C. B., and Arroita, M.: Overcoming Equifinality: Leveraging Long Time Series for Stream Metabolism Estimation, J. Geophys. Res.-Biogeo., 123, 624–645, https://doi.org/10.1002/2017jg004140, 2018b.
Ardón, M., Zeglin, L. H., Utz, R. M., Cooper, S. D., Dodds, W. K., Bixby, R. J., Burdett, A. S., Follstad Shah, J., Griffiths, N. A., Harms, T. K., Johnson, S. L., Jones, J. B., Kominoski, J. S., McDowell, W. H., Rosemond, A. D., Trentman, M. T., Van Horn, D., and Ward, A.: Experimental nitrogen and phosphorus enrichment stimulates multiple trophic levels of algal and detrital-based food webs: a global meta-analysis from streams and rivers, Biol. Rev., 96, 692–715, https://doi.org/10.1111/brv.12673, 2021.
Battin, T. J., Kaplan, L. A., Newbold, J. D., and Hendricks, S. P.: A mixing model analysis of stream solute dynamics and the contribution of a hyporheic zone to ecosystem function, Freshwater Biol., 48, 995–1014, https://doi.org/10.1046/j.1365-2427.2003.01062.x, 2003.
Battin, T. J., Kaplan, L. A., Findlay, S., Hopkinson, C. S., Marti, E., Packman, A. I., Newbold, J. D., and Sabater, F.: Biophysical controls on organic carbon fluxes in fluvial networks, Nat. Geosci., 1, 95–100, https://doi.org/10.1038/ngeo101, 2008.
Benstead, J. P., Rosemond, A. D., Cross, W. F., Wallace, J. B., Eggert, S. L., Suberkropp, K., Gulis, V., Greenwood, J. L., and Tant, C. J.: Nutrient enrichment alters storage and fluxes of detritus in a headwater stream ecosystem, Ecology, 90, 2556–2566, https://doi.org/10.1890/08-0862.1, 2009.
Bernhardt, E. S., Heffernan, J. B., Grimm, N. B., Stanley, E. H., Harvey, J. W., Arroita, M., Appling, A. P., Cohen, M. J., McDowell, W. H., Hall, R. O., Read, J. S., Roberts, B. J., Stets, E. G., and Yackulic, C. B.: The metabolic regimes of flowing waters, Limnol. Oceanogr., 63, S99–S118, https://doi.org/10.1002/lno.10726, 2018.
Bernhardt, E. S., Savoy, P., Vlah, M. J., Appling, A. P., Koenig, L. E., Hall, R. O., Arroita, M., Blaszczak, J. R., Carter, A. M., Cohen, M., Harvey, J. W., Heffernan, J. B., Helton, A. M., Hosen, J. D., Kirk, L., McDowell, W. H., Stanley, E. H., Yackulic, C. B., and Grimm, N. B.: Light and flow regimes regulate the metabolism of rivers, P. Natl. Acad. Sci. USA, 119, e2121976119, https://doi.org/10.1073/pnas.2121976119, 2022.
Bernot, M. J., Sobota, D. J., Hall, R. O., Mulholland, P. J., Dodds, W. K., Webster, J. R., Tank, J. L., Ashkenas, L. R., Cooper, L. W., Dahm, C. N., Gregory, S. V., Grimm, N. B., Hamilton, S. K., Johnson, S. L., McDowell, W. H., Meyer, J. L., Peterson, B., Poole, G. C., Valett, H. M., Arango, C., Beaulieu, J. J., Burgin, A. J., Crenshaw, C., Helton, A. M., Johnson, L., Merriam, J., Niederlehner, B. R., O'Brien, J. M., Potter, J. D., Sheibley, R. W., Thomas, S. M., and Wilson, K.: Inter-regional comparison of land-use effects on stream metabolism, Freshwater Biol., 55, 1874–1890, https://doi.org/10.1111/j.1365-2427.2010.02422.x, 2010.
Bertuzzo, E., Hotchkiss, E. R., Argerich, A., Kominoski, J. S., Oviedo-Vargas, D., Savoy, P., Scarlett, R., Von Schiller, D., and Heffernan, J. B.: Respiration regimes in rivers: Partitioning source-specific respiration from metabolism time series, Limnol. Oceanogr., 67, 2374–2388, https://doi.org/10.1002/lno.12207, 2022.
Blodgett, D. L. and Johnson, J. M.: nhdplusTools: Tools for accessing and working with the NHDPlus, https://doi.org/10.5066/P97AS8JD, 2022.
Bramer, L. M., White, A. M., Stratton, K. G., Thompson, A. M., Claborne, D., Hofmockel, K., and McCue, L. A.: ftmsRanalysis: An R package for exploratory data analysis and interactive visualization of FT-MS data, PLOS Comput. Biol., 16, e1007654, https://doi.org/10.1371/journal.pcbi.1007654, 2020.
Caissie, D.: The thermal regime of rivers: a review, Freshwater Biol., 51, 1389–1406, https://doi.org/10.1111/j.1365-2427.2006.01597.x, 2006.
Carroll, J.: Quality Assurance Project Plan: Lower Yakima River Monitoring for Aquatic Life Parameters to Support Water Quality Gaging, Washington State Department of Ecology, Olympia, WA, Publication #22-03-111, 2022.
Cross, W. F., Hood, J. M., Benstead, J. P., Huryn, A. D., Welter, J. R., Gíslason, G. M., and Ólafsson, J. S.: Nutrient enrichment intensifies the effects of warming on metabolic balance of stream ecosystems, Limnol. Oceanogr. Lett., 7, 332–341, https://doi.org/10.1002/lol2.10244, 2022.
Danczak, R. E., Garayburu-Caruso, V. A., Renteria, L., McKever, S. A., Otenburg, O. C., Grieger, S. R., Son, K., Kaufman, M. H., Fulton, S. G., Roebuck, J. A., Myers-Pigg, A. N., and Stegen, J. C.: Riverine organic matter functional diversity increases with catchment size, Front. Water, 5, 1087108, https://doi.org/10.3389/frwa.2023.1087108, 2023.
del Giorgio, P. A. and Williams, P. J. le B.: Respiration in Aquatic Ecosystems, Oxford University Press, Oxford, United Kingdom, 315 pp., ISBN 0-19-852708-X, 2005.
Demars, B. O. L.: Hydrological pulses and burning of dissolved organic carbon by stream respiration, Limnol. Oceanogr., 64, 406–421, https://doi.org/10.1002/lno.11048, 2019.
Devol, A. H., Forsberg, B. R., Richey, J. E., and Pimentel, T. P.: Seasonal variation in chemical distributions in the Amazon (Solimões) River: A multiyear time series, Global Biogeochem. Cy., 9, 307–328, https://doi.org/10.1029/95GB01145, 1995.
Dillon, G. K.: Wildfire Hazard Potential (WHP) for the conterminous United States (270-m GRID), version 2018 continuous, Forest Service Research Data Archive, Fort Collins, CO, https://doi.org/10.2737/RDS-2015-0047-2, 2018.
Dillon, G. K. and Gilbertson-Day, J. W.: Wildfire Hazard Potential for the United States (270-m), version 2020, Fort Collins, CO: Forest Service Research Data Archive, https://doi.org/10.2737/RDS-2015-0047-3, 2020.
Dittmar, T., Koch, B., Hertkorn, N., and Kattner, G.: A simple and efficient method for the solid-phase extraction of dissolved organic matter (SPE-DOM) from seawater, Limnol. Oceanogr. Meth., 6, 230–235, https://doi.org/10.4319/lom.2008.6.230, 2008.
Ellis, E. E., Richey, J. E., Aufdenkampe, A. K., Krusche, A. V., Quay, P. D., Salimon, C., and Da Cunha, H. B.: Factors controlling water-column respiration in rivers of the central and southwestern Amazon Basin, Limnol. Oceanogr., 57, 527–540, https://doi.org/10.4319/lo.2012.57.2.0527, 2012.
Findlay, S.: Importance of surface-subsurface exchange in stream ecosystems: The hyporheic zone, Limnol. Oceanogr., 40, 159–164, https://doi.org/10.4319/lo.1995.40.1.0159, 1995.
Finlay, J. C.: Stream size and human influences on ecosystem production in river networks, Ecosphere, 2, 87, https://doi.org/10.1890/es11-00071.1, 2011.
Friedl, M. and Sulla-Menashe, D.: MCD12Q1 MODIS/Terra+Aqua Land Cover Type Yearly L3 Global 500m SIN Grid V006, NASA EOSDIS Land Processes DAAC [data set], https://doi.org/10.5067/MODIS/MCD12Q1.006, 2019.
Friedman, J. H., Hastie, T., and Tibshirani, R.: Regularization Paths for Generalized Linear Models via Coordinate Descent, J. Stat. Softw., 33, 1–22, https://doi.org/10.18637/jss.v033.i01, 2010.
Fudyma, J. D., Chu, R. K., Graf Grachet, N., Stegen, J. C., and Tfaily, M. M.: Coupled Biotic-Abiotic Processes Control Biogeochemical Cycling of Dissolved Organic Matter in the Columbia River Hyporheic Zone, Front. Water, 2, 574692, https://doi.org/10.3389/frwa.2020.574692, 2021.
Fulton, S. G., Barnes, M., Borton, M. A., Chen, X., Farris, Y., Forbes, B., Garayburu-Caruso, V. A., Goldman, A. E., Grieger, S., Kaufman, M. H., Lin, X., McKever, S. A., Myers-Pigg, A., Otenburg, O., Pelly, A., Ren, H., Renteria, L., Scheibe, T. D., Son, K., Torgeson, J. M., and Stegen, J. C.: Spatial Study 2021: Sensor-Based Time Series of Surface Water Temperature, Specific Conductance, Total Dissolved Solids, pH, and Dissolved Oxygen from across Multiple Watersheds in the Yakima River Basin, Washington, USA (v3), ESS-DIVE repository [data set], https://doi.org/10.15485/1892052, 2022.
Fuss, C. and Smock, L.: Spatial and temporal variation of microbial respiration rates in a blackwater stream, Freshwater Biol., 36, 339–349, https://doi.org/10.1046/j.1365-2427.1996.00095.x, 1996.
Gagne-Maynard, W. C., Ward, N. D., Keil, R. G., Sawakuchi, H. O., Da Cunha, A. C., Neu, V., Brito, D. C., Da Silva Less, D. F., Diniz, J. E. M., De Matos Valerio, A., Kampel, M., Krusche, A. V., and Richey, J. E.: Evaluation of Primary Production in the Lower Amazon River Based on a Dissolved Oxygen Stable Isotopic Mass Balance, Front. Mar. Sci., 4, 26, https://doi.org/10.3389/fmars.2017.00026, 2017.
Garayburu-Caruso, V. A., Stegen, J. C., Song, H.-S., Renteria, L., Wells, J., Garcia, W., Resch, C. T., Goldman, A. E., Chu, R. K., Toyoda, J., and Graham, E. B.: Carbon Limitation Leads to Thermodynamic Regulation of Aerobic Metabolism, Environ. Sci. Technol. Lett., 7, 517–524, https://doi.org/10.1021/acs.estlett.0c00258, 2020a.
Garayburu-Caruso, V. A., Danczak, R. E., Stegen, J. C., Renteria, L., McCall, M., Goldman, A. E., Chu, R. K., Toyoda, J., Resch, C. T., Torgeson, J. M., Wells, J., Fansler, S., Kumar, S., and Graham, E. B.: Using Community Science to Reveal the Global Chemogeography of River Metabolomes, Metabolites, 10, 518, https://doi.org/10.3390/metabo10120518, 2020b.
Gardner, J. R. and Doyle, M. W.: Sediment–Water Surface Area Along Rivers: Water Column Versus Benthic, Ecosystems, 21, 1505–1520, https://doi.org/10.1007/s10021-018-0236-2, 2018.
Genzoli, L. and Hall, R. O.: Shifts in Klamath River metabolism following a reservoir cyanobacterial bloom, Freshwater Sci., 35, 795–809, https://doi.org/10.1086/687752, 2016.
Glover, H. E., Ogston, A. S., Miller, I. M., Eidam, E. F., Rubin, S. P., and Berry, H. D.: Impacts of Suspended Sediment on Nearshore Benthic Light Availability Following Dam Removal in a Small Mountainous River: In Situ Observations and Statistical Modeling, Estuar. Coasts, 42, 1804–1820, https://doi.org/10.1007/s12237-019-00602-5, 2019.
Gomez-Velez, J. D., Harvey, J. W., Cardenas, M. B., and Kiel, B.: Denitrification in the Mississippi River network controlled by flow through river bedforms, Nat. Geosci., 8, 941–945, https://doi.org/10.1038/ngeo2567, 2015.
Grieger, S., Barnes, M., Borton, M. A., Chen, X., Chu, R., Barton, R., Farris, Y., Forbes, B., Fulton, S. G., Garayburu-Caruso, V. A., Goldman, A. E., Gonzalez, B. I., Kaufman, M. H., Laan, M., McKever, S. A., Miller, M., Myers-Pigg, A., Otenburg, O., Pelly, A., Powers-McCormack, B., Renteria, L., Resch, C. T., Roebuck, A., Scheibe, T. D., Son, K., Torgeson, J. M., Toyoda, J. G., Winston, I., and Stegen, J. C.: Spatial Study 2021: Sample-Based Surface Water Chemistry and Organic Matter Characterization across Watersheds in the Yakima River Basin, Washington, USA (v3), ESS-DIVE repository [data set], https://doi.org/10.15485/1898914, 2022.
Hall, R. O.: Chapter 4 - Metabolism of Streams and Rivers: Estimation, Controls, and Application, in: Stream Ecosystems in a Changing Environment, edited by: Jones, J. B. and Stanley, E. H., Academic Press, Boston, 151–180, https://doi.org/10.1016/B978-0-12-405890-3.00004-X, 2016.
Hall, R. O. and Hotchkiss, E. R.: Chapter 34 – Stream Metabolism, in: Methods in Stream Ecology, edited by: Lamberti, G. A. and Hauer, F. R., 3rd Edn., Academic Press, 219–233, ISBN 978-0-12-813047-6, 2017.
Hall, R. O., Tank, J. L., Baker, M. A., Rosi-Marshall, E. J., and Hotchkiss, E. R.: Metabolism, Gas Exchange, and Carbon Spiraling in Rivers, Ecosystems, 19, 73–86, https://doi.org/10.1007/s10021-015-9918-1, 2016.
Hensley, R. T., Kirk, L., Spangler, M., Gooseff, M. N., and Cohen, M. J.: Flow Extremes as Spatiotemporal Control Points on River Solute Fluxes and Metabolism, J. Geophys. Res.-Biogeo., 124, 537–555, https://doi.org/10.1029/2018jg004738, 2019.
Honious, S. A. S., Hale, R. L., Guilinger, J. J., Crosby, B. T., and Baxter, C. V.: Turbidity Structures the Controls of Ecosystem Metabolism and Associated Metabolic Process Domains Along a 75-km Segment of a Semiarid Stream, Ecosystems, 5, 422–440, https://doi.org/10.1007/s10021-021-00661-5, 2021.
Hornbach, D. J.: Multi-Year Monitoring of Ecosystem Metabolism in Two Branches of a Cold-Water Stream, Environments, 8, 3, https://doi.org/10.3390/environments8030019, 2021.
Hotchkiss, E. R. and Hall, R. O.: High rates of daytime respiration in three streams: Use of δ 18 OO2 and O2 to model diel ecosystem metabolism, Limnol. Oceanogr., 59, 798–810, https://doi.org/10.4319/lo.2014.59.3.0798, 2014.
Jankowski, K. J. and Schindler, D. E.: Watershed geomorphology modifies the sensitivity of aquatic ecosystem metabolism to temperature, Sci. Rep., 9, 17619, https://doi.org/10.1038/s41598-019-53703-3, 2019.
Jones Jr., J. B.: Factors controlling hyporheic respiration in a desert stream, Freshwater Biol., 34, 91–99, https://doi.org/10.1111/j.1365-2427.1995.tb00426.x, 1995.
Kaplan, L. A. and Newbold, J. D.: 10 – Surface and Subsurface Dissolved Organic Carbon, in: Streams and Ground Waters, edited by: Jones, J. B. and Mulholland, P. J., Academic Press, San Diego, 237–258, https://doi.org/10.1016/B978-012389845-6/50011-9, 2000.
Laan, M., Fulton, S. G., Barnes, M., Borton, M. A., Chen, X., Farris, Y., Forbes, B., Garayburu-Caruso, V. A., Goldman, A. E., Grieger, S., Hall, R. O., Kaufman, M. H., Lin, X., McCann, E., McKever, S. A., Myers-Pigg, A., Otenburg, O., Pelly, A., Ren, H., Renteria, L., Scheibe, T. D., Son, K., Tagestad, J. D., Torgeson, J. M., and Stegen, J. C.: Data and Scripts Associated with the Manuscript “Water Column Respiration in the Yakima River Basin is Explained by Temperature, Nutrients and Suspended Solids”, ESS-DIVE repository [data set], https://doi.org/10.15485/2283171, 2024.
Liu, T., Xia, X., Liu, S., Mou, X., and Qiu, Y.: Acceleration of Denitrification in Turbid Rivers Due to Denitrification Occurring on Suspended Sediment in Oxic Waters, Environ. Sci. Technol., 47, 4053–4061, https://doi.org/10.1021/es304504m, 2013.
Manning, D. W. P., Rosemond, A. D., Benstead, J. P., Bumpers, P. M., and Kominoski, J. S.: Transport of N and P in U.S. streams and rivers differs with land use and between dissolved and particulate forms, Ecol. Appl., 30, e02130, https://doi.org/10.1002/eap.2130, 2020.
Mejia, F. H., Fremier, A. K., Benjamin, J. R., Bellmore, J. R., Grimm, A. Z., Watson, G. A., and Newsom, M.: Stream metabolism increases with drainage area and peaks asynchronously across a stream network, Aquat. Sci., 81, 9, https://doi.org/10.1007/s00027-018-0606-z, 2019.
Mulholland, P. J., Helton, A. M., Poole, G. C., Hall, R. O., Hamilton, S. K., Peterson, B. J., Tank, J. L., Ashkenas, L. R., Cooper, L. W., Dahm, C. N., Dodds, W. K., Findlay, S. E. G., Gregory, S. V., Grimm, N. B., Johnson, S. L., McDowell, W. H., Meyer, J. L., Valett, H. M., Webster, J. R., Arango, C. P., Beaulieu, J. J., Bernot, M. J., Burgin, A. J., Crenshaw, C. L., Johnson, L. T., Niederlehner, B. R., O'Brien, J. M., Potter, J. D., Sheibley, R. W., Sobota, D. J., and Thomas, S. M.: Stream denitrification across biomes and its response to anthropogenic nitrate loading, Nature, 452, 202–205, https://doi.org/10.1038/nature06686, 2008.
Myneni, R., Knyazikhin, Y., and Park, T.: MCD15A3H MODIS/Terra+Aqua Leaf Area Index/FPAR 4-day L4 Global 500m SIN Grid V006, NASA EOSDIS Land Processes DAAC [data set], https://doi.org/10.5067/MODIS/MCD15A3H.006, 2015.
Naegeli, M. W. and Uehlinger, U.: Contribution of the Hyporheic Zone to Ecosystem Metabolism in a Prealpine Gravel-Bed-River, J. N. Am. Benthol. Soc., 16, 794–804, https://doi.org/10.2307/1468172, 1997.
Nakano, D., Iwata, T., Suzuki, J., Okada, T., Yamamoto, R., and Imamura, M.: The effects of temperature and light on ecosystem metabolism in a Japanese stream, Freshwater Sci., 41, 113–124, https://doi.org/10.1086/718648, 2022.
National Elevation Dataset (NED): 1/3 Arc-Second Digital Elevation Model, http://nationalmap.gov/elevation.html, last access: 29 June 2023.
Ochs, C. A., Capello, H. E., and Pongruktham, O.: Bacterial production in the Lower Mississippi River: importance of suspended sediment and phytoplankton biomass, Hydrobiologia, 637, 19–31, https://doi.org/10.1007/s10750-009-9981-8, 2010.
Peterson, B. J., Wollheim, W. M., Mulholland, P. J., Webster, J. R., Meyer, J. L., Tank, J. L., Martí, E., Bowden, W. B., Valett, H. M., Hershey, A. E., McDowell, W. H., Dodds, W. K., Hamilton, S. K., Gregory, S., and Morrall, D. D.: Control of Nitrogen Export from Watersheds by Headwater Streams, Science, 292, 86–90, https://doi.org/10.1126/science.1056874, 2001.
Pietikäinen, J., Pettersson, M., and Bååth, E.: Comparison of temperature effects on soil respiration and bacterial and fungal growth rates, FEMS Microbiol. Ecol., 52, 49–58, https://doi.org/10.1016/j.femsec.2004.10.002, 2005.
Plont, S., Riney, J., and Hotchkiss, E. R.: Integrating Perspectives on Dissolved Organic Carbon Removal and Whole-Stream Metabolism, J. Geophys. Res.-Biogeo., 127, e2021JG006610, https://doi.org/10.1029/2021JG006610, 2022.
PRISM Group, Oregon State University: https://prism.oregonstate.edu (last access: 16 February 2020), 2014.
Quay, P. D., Wilbur, D., Richey, J. E., Devol, A. H., Benner, R., and Forsberg, B. R.: The 18O:16O of dissolved oxygen in rivers and lakes in the Amazon Basin: Determining the ratio of respiration to photosynthesis rates in freshwaters, Limnol. Oceanogr., 40, 718–729, https://doi.org/10.4319/lo.1995.40.4.0718, 1995.
R Core Team: R: A language and environment for statistical computing, https://www.R-project.org/ (last access: 11 October 2025)), 2022.
Reisinger, A. J., Tank, J. L., Rosi-Marshall, E. J., Hall, R. O., and Baker, M. A.: The varying role of water column nutrient uptake along river continua in contrasting landscapes, Biogeochem., 125, 115–131, https://doi.org/10.1007/s10533-015-0118-z, 2015.
Reisinger, A. J., Tank, J. L., Hoellein, T. J., and Hall, R. O.: Sediment, water column, and open-channel denitrification in rivers measured using membrane-inlet mass spectrometry, J. Geophys. Res.-Biogeo., 121, 1258–1274, https://doi.org/10.1002/2015jg003261, 2016.
Reisinger, A. J., Tank, J. L., Hall, R. O., Rosi, E. J., Baker, M. A., and Genzoli, L.: Water column contributions to the metabolism and nutrient dynamics of mid-sized rivers, Biogeochem., 153, 67–84, https://doi.org/10.1007/s10533-021-00768-w, 2021.
Rosemond, A. D., Benstead, J. P., Bumpers, P. M., Gulis, V., Kominoski, J. S., Manning, D. W. P., Suberkropp, K., and Wallace, J. B.: Experimental nutrient additions accelerate terrestrial carbon loss from stream ecosystems, Science, 347, 1142–1145, https://doi.org/10.1126/science.aaa1958, 2015.
Running, S. and Zhao, M.: MOD17A3HGF MODIS/Terra Net Primary Production Gap-Filled Yearly L4 Global 500m SIN Grid V006, NASA EOSDIS Land Processes DAAC [data set], https://doi.org/10.5067/MODIS/MOD17A3HGF.006, 2019.
Running, S., Mu, Q., and Zhao, M.: MOD16A2 MODIS/Terra Net Evapotranspiration 8-Day L4 Global 500m SIN Grid V006, NASA EOSDIS Land Processes DAAC [data set], https://doi.org/10.5067/MODIS/MOD16A2.006, 2017.
Ryan, K. A., Garayburu-Caruso, V. A., Crump, B. C., Bambakidis, T., Raymond, P. A., Liu, S., and Stegen, J. C.: Riverine dissolved organic matter transformations increase with watershed area, water residence time, and Damköhler numbers in nested watersheds, Biogeochem., 167, 1203–1224, https://doi.org/10.1007/s10533-024-01169-5, 2024.
Shcherbakov, M. V., Brebels, A., Shcherbakova, N. L., Tyukov, A. P., Janovsky, T. A., and Kamaev, V. A.: A Survey of Forecast Error Measures, World Applied Sciences Journal, 24, 171–176, https://doi.org/10.5829/idosi.wasj.2013.24.itmies.80032, 2013.
Song, C., Dodds, W. K., Rüegg, J., Argerich, A., Baker, C. L., Bowden, W. B., Douglas, M. M., Farrell, K. J., Flinn, M. B., Garcia, E. A., Helton, A. M., Harms, T. K., Jia, S., Jones, J. B., Koenig, L. E., Kominoski, J. S., McDowell, W. H., McMaster, D., Parker, S. P., Rosemond, A. D., Ruffing, C. M., Sheehan, K. R., Trentman, M. T., Whiles, M. R., Wollheim, W. M., and Ballantyne, F.: Continental-scale decrease in net primary productivity in streams due to climate warming, Nat. Geosci., 11, 415–420, https://doi.org/10.1038/s41561-018-0125-5, 2018.
Stegen, J. C., Johnson, T., Fredrickson, J. K., Wilkins, M. J., Konopka, A. E., Nelson, W. C., Arntzen, E. V., Chrisler, W. B., Chu, R. K., Fansler, S. J., Graham, E. B., Kennedy, D. W., Resch, C. T., Tfaily, M., and Zachara, J.: Influences of organic carbon speciation on hyporheic corridor biogeochemistry and microbial ecology, Nat. Commun., 9, 585, https://doi.org/10.1038/s41467-018-02922-9, 2018.
Tolić, N., Liu, Y., Liyu, A., Shen, Y., Tfaily, M. M., Kujawinski, E. B., Longnecker, K., Kuo, L.-J., Robinson, E. W., Paša-Tolić, L., and Hess, N. J.: Formularity: Software for Automated Formula Assignment of Natural and Other Organic Matter from Ultrahigh-Resolution Mass Spectra, Anal. Chem., 89, 12659–12665, https://doi.org/10.1021/acs.analchem.7b03318, 2017.
Ulseth, A. J., Bertuzzo, E., Singer, G. A., Schelker, J., and Battin, T. J.: Climate-Induced Changes in Spring Snowmelt Impact Ecosystem Metabolism and Carbon Fluxes in an Alpine Stream Network, Ecosystems, 21, 373–390, https://doi.org/10.1007/s10021-017-0155-7, 2018.
U.S. Geological Survey: National Hydrography Dataset (ver. USGS National Hydrography Dataset Best Resolution (NHD) for Hydrologic Unit (HU) 4 – 2001 (published 20191002)), https://www.usgs.gov/national-hydrography/access-national-hydrography-products (last access: 15 February 2020), 2019a.
U.S. Geological Survey: C6 Aqua 250-m eMODIS Remote Sensing Phenology Metrics across the conterminous U.S., https://doi.org/10.5066/P9ZJAFKT, 2019b.
U.S. Geological Survey (USGS): Annual NLCD Collection 1 Science Products: U.S. Geological Survey data release, [data set], https://doi.org/10.5066/P94UXNTS, 2024.
Vano, J. A., Scott, M. J., Voisin, N., Stöckle, C. O., Hamlet, A. F., Mickelson, K. E. B., Elsner, M. M., and Lettenmaier, D. P.: Climate change impacts on water management and irrigated agriculture in the Yakima River Basin, Washington, USA, Climatic Change, 102, 287–317, https://doi.org/10.1007/s10584-010-9856-z, 2010.
Wang, J., Xia, X., Liu, S., Zhang, S., Zhang, L., Jiang, C., Zhang, Z., Xin, Y., Chen, X., Huang, J., Bao, J., McDowell, W. H., Michalski, G., Yang, Z., and Xia, J.: The Dominant Role of the Water Column in Nitrogen Removal and N2O Emissions in Large Rivers, Geophys. Res. Lett., 49, e2022GL098955, https://doi.org/10.1029/2022GL098955, 2022.
Ward, N. D., Sawakuchi, H. O., Neu, V., Less, D. F. S., Valerio, A. M., Cunha, A. C., Kampel, M., Bianchi, T. S., Krusche, A. V., Richey, J. E., and Keil, R. G.: Velocity-amplified microbial respiration rates in the lower Amazon River, Limnol. Oceanogr. Lett., 3, 265–274, https://doi.org/10.1002/lol2.10062, 2018.
Webster, J. R.: Spiraling down the river continuum: stream ecology and the U-shaped curve, J. N. Am. Benthol. Soc., 26, 375–389, https://doi.org/10.1899/06-095.1, 2007.
Willi, K. and Ross, M. R. V.: Geospatial Data Puller for Waters in the Contiguous United States (Version v1), Zenodo, https://doi.org/10.5281/zenodo.8140272, 2023.