the Creative Commons Attribution 4.0 License.
the Creative Commons Attribution 4.0 License.
 | 28 Oct 2025
Savanna ecosystem structure and productivity along a rainfall gradient: the role of competition and stress tolerance mediated by plant functional traits
Prashant Paudel
Stefan Olin
Mark Tjoelker
Mikael Pontarp
Daniel Metcalfe
Environmental gradients affect vegetation structure and ecosystem productivity. Along the northern Australia tropical transect (NATT), which transitions from tropical moist conditions in the north to arid conditions in the south, vegetation composition and structure are closely tied to rainfall patterns. We hypothesise that biotic competition and abiotic stress exhibit opposing patterns along the NATT rainfall gradient and aim to disentangle these effects on vegetation structure and productivity. Using a trait-based dynamic vegetation model, we simulated vegetation responses to varying competition and stress along the NATT. The model successfully simulated spatial variations and temporal patterns in carbon and water fluxes, where evapotranspiration and gross primary productivity decrease with rainfall along the gradient. Simulation results showed that taller and medium-sized Eucalyptus had higher carbon mass, leaf area index, and foliar projective cover at the wet end of the gradient. In contrast, Acacia and grasses were dominant at the dry end. Crown coverage shows spatial and temporal variability with rainfall, with higher variability in tree plant functional types (PFTs) crown cover in the north and more uniform in the south, while grasses have maximum coverage during the wet season in the dry end of the gradient. These patterns suggest a shift in the importance of biotic versus abiotic factors, with competition playing a more significant role in the wet region and stress becoming more influential as aridity increases in the south. Overall, our study underscores water availability as a primary driver of vegetation structure and highlights the role of competition and stress in modulating ecosystem structure, composition, and productivity along the rainfall gradient.
- Article
(7957 KB) - Full-text XML
-
Supplement
(694 KB) - BibTeX
- EndNote


Vegetation structure and ecosystem productivity exhibit notable variation along environmental gradients (Asner et al., 2014; Clark et al., 2015; Hutley et al., 2011; Maharjan et al., 2021; Zhu et al., 2022). The intricate interplay between biotic (competition and facilitation) and abiotic (topography, climate, soil, and geology) factors determines patterns and dynamics of vegetation structure, composition, and productivity. These biotic and abiotic factors shape the environment by creating conditions that influence ecological processes and interactions between species. In combination with eco-evolutionary trade-offs influencing the relative performance of alternative plant strategies in different environments, the result may be that distinct phenological and morphological characteristics, niche differentiation, functional trait distributions, and competitive exclusion emerge at the community level, resulting in distinct community composition and structure (Asner et al., 2014; Muñoz Mazón et al., 2020). Understanding how vegetation patterns change across a spectrum of environments, from resource-abundant conditions characterised by competition for light, water, and nutrients, to resource-limited conditions in which stress tolerance is a viable strategy, provides a window into community ecological processes, sometimes termed “community assembly”. Mechanistic modelling approaches that combine representations of physiological plant and soil processes with demographic and compositional dynamics of plant populations offer a potential way to emulate the assumed steps involved in community assembly, and link this to plant strategies and traits. Good model performance in terms of replicating compositional patterns along environmental gradients may then provide confirmation of assumptions as to the eco-evolutionary basis of plant traits as encoded in the model. Dynamic vegetation models (DVMs) are one class of models that can be used for this purpose, providing a potential approach for analysing the interactions and relating them to observations of ecosystem composition, structure, and function in the field to unpack the eco-evolutionary basis of those observed patterns (Argles et al., 2022; Smith et al., 2001).
DVMs simulate ecosystem functioning by considering environmental conditions, traits, and biotic interactions as underpinning factors (Argles et al., 2022; Snell et al., 2014; Wang et al., 2024). The current generation of DVMs used for global and regional global change studies bring together multiple drivers (climate, soil, disturbance) and processes (carbon cycle, population dynamics, recruitment and mortality, photosynthesis and respiration) and a spectrum of complexity in representing vegetation processes and attributes, including factors like competition and vegetation succession, to simulate key energy and material fluxes of life (Falster et al., 2021a; Fisher et al., 2018; Smith et al., 2014). Distinct traits and life history strategies encoded in the parameters of different plant functional types (PFTs) influence their performance and interactions in model simulations (Sitch et al., 2003). Integrating field traits information that aligned with regional environmental conditions (Kuppler et al., 2020; Wang et al., 2024) that enhance resource acquisition in resource-abundant conditions and prioritize resource conservation or survival mechanisms (e.g., drought tolerance) under stressful conditions allows for evaluation of how competition and stress influence ecosystem dynamics in different environments.
Natural environmental gradients can serve as natural laboratories to examine the interplay of environment and species performance in governing compositional, structural, and functional variation along the gradient. Competition and abiotic stress may play contrasting roles in shaping such variations at different points along the gradient. Moisture gradients encompassing distinct wet and dry growth conditions are a case in point, transitioning from abundance to scarcity in terms of a key plant resource (soil water) as average rainfall declines along the gradient (Williams et al., 1997; Peel et al., 2005). The Northern Australia Tropical Transect (NATT) in tropical northern Australia is characterized by a sharp decrease in rainfall from north to south, with two distinct bio-climatological patterns (wet and dry conditions in north and south, respectively Fig. 1) (Hutley et al., 2011; Koch et al., 1995; Whitley et al., 2016). Along the NATT, vegetation has co-evolved with indigenous and managed fire (Bird et al., 2024; Harrison et al., 2021), where vegetation structure, composition, richness, and canopy structure are strongly correlated with rainfall (Hutley et al., 2011; Ma et al., 2020) with trees and grass coexist persistently (Holdo and Nippert, 2023). Competition in the relatively crowded tree stratum in the moister north gives way to water stress in the south, resulting in clear patterns in functional diversity along the transect. A realistic representation of the key factors shaping NATT composition, structure, and function, such as the relative abundance of different traits, plant strategies, post-fire resprouting dynamics, phenological and morphological characteristics, and the balance between resource acquisition and conservation strategies, is essential for understanding variation in ecosystem productivity.
Integrating field-derived trait information into DVMs as parameters of PFTs ensures model simulations are grounded in real processes and allows for testing and reproducing the mechanisms that govern PFT distribution, tree-grass interactions, and their transitions across the forest-to-savanna gradient (Baudena et al., 2010, 2015; Haverd et al., 2016; Nijzink et al., 2022; Whitley et al., 2017). For this study, we employed the standard version of the second-generation dynamic vegetation model LPJ-GUESS (Smith et al., 2001, 2014) to unpick structural, compositional, and functional shifts along the gradient in terms of underlying drivers, processes, and ecological interactions. Our approach leverages empirical data on vegetation traits and life history strategies, reflecting the adaptive responses and capturing local ecosystem processes to varying climatic conditions observed in the field. Our goal is not to benchmark this regionalised trait configuration against the default global LPJ-GUESS setup, but rather to test whether incorporating empirical trait data improves the model's ability to realistically simulate observed structural, compositional, and functional variation. By parameterizing the characteristic savanna PFTs embedded in the model, we aim to reproduce ecosystem productivity variations and the underlying ecological mechanisms, allowing the role of competition and stress in shaping the savanna ecosystems to be assessed. Through this process-based modelling approach, we aim to investigate the contributions of biotic and abiotic factors to vegetation structure and function, with the goal of capturing the mechanisms that shape the ecosystem and enhance our understanding of the ecological processes governing savanna ecosystems along the rainfall gradient.
2.1 Study site
This study was conducted along the NATT transect, which spans 1000 km (Rogers and Beringer, 2017) in a generally north-south direction from near the city of Darwin on the northern Australian coast to Alice Springs in the arid centre of the Australian continent. The NATT was established in the mid-1990s as part of the International Geosphere Biosphere Program (IGBP) (Hutley et al., 2011; Koch et al., 1995). This transect represents two distinct bio-climatological patterns, with rainfall decreasing sharply from north to south. In the north, the inter-tropical convergence zone dominates, characterized by the seasonal monsoon climatic system with annual rainfall up to 1500 mm. In contrast, the southern part of the gradient exhibits semi-arid climatic conditions (rainfall of around 650 mm yr−1), characterized by prolonged drought with no consistent seasonality of rainfall (Rogers and Beringer, 2017; Williams et al., 1997).
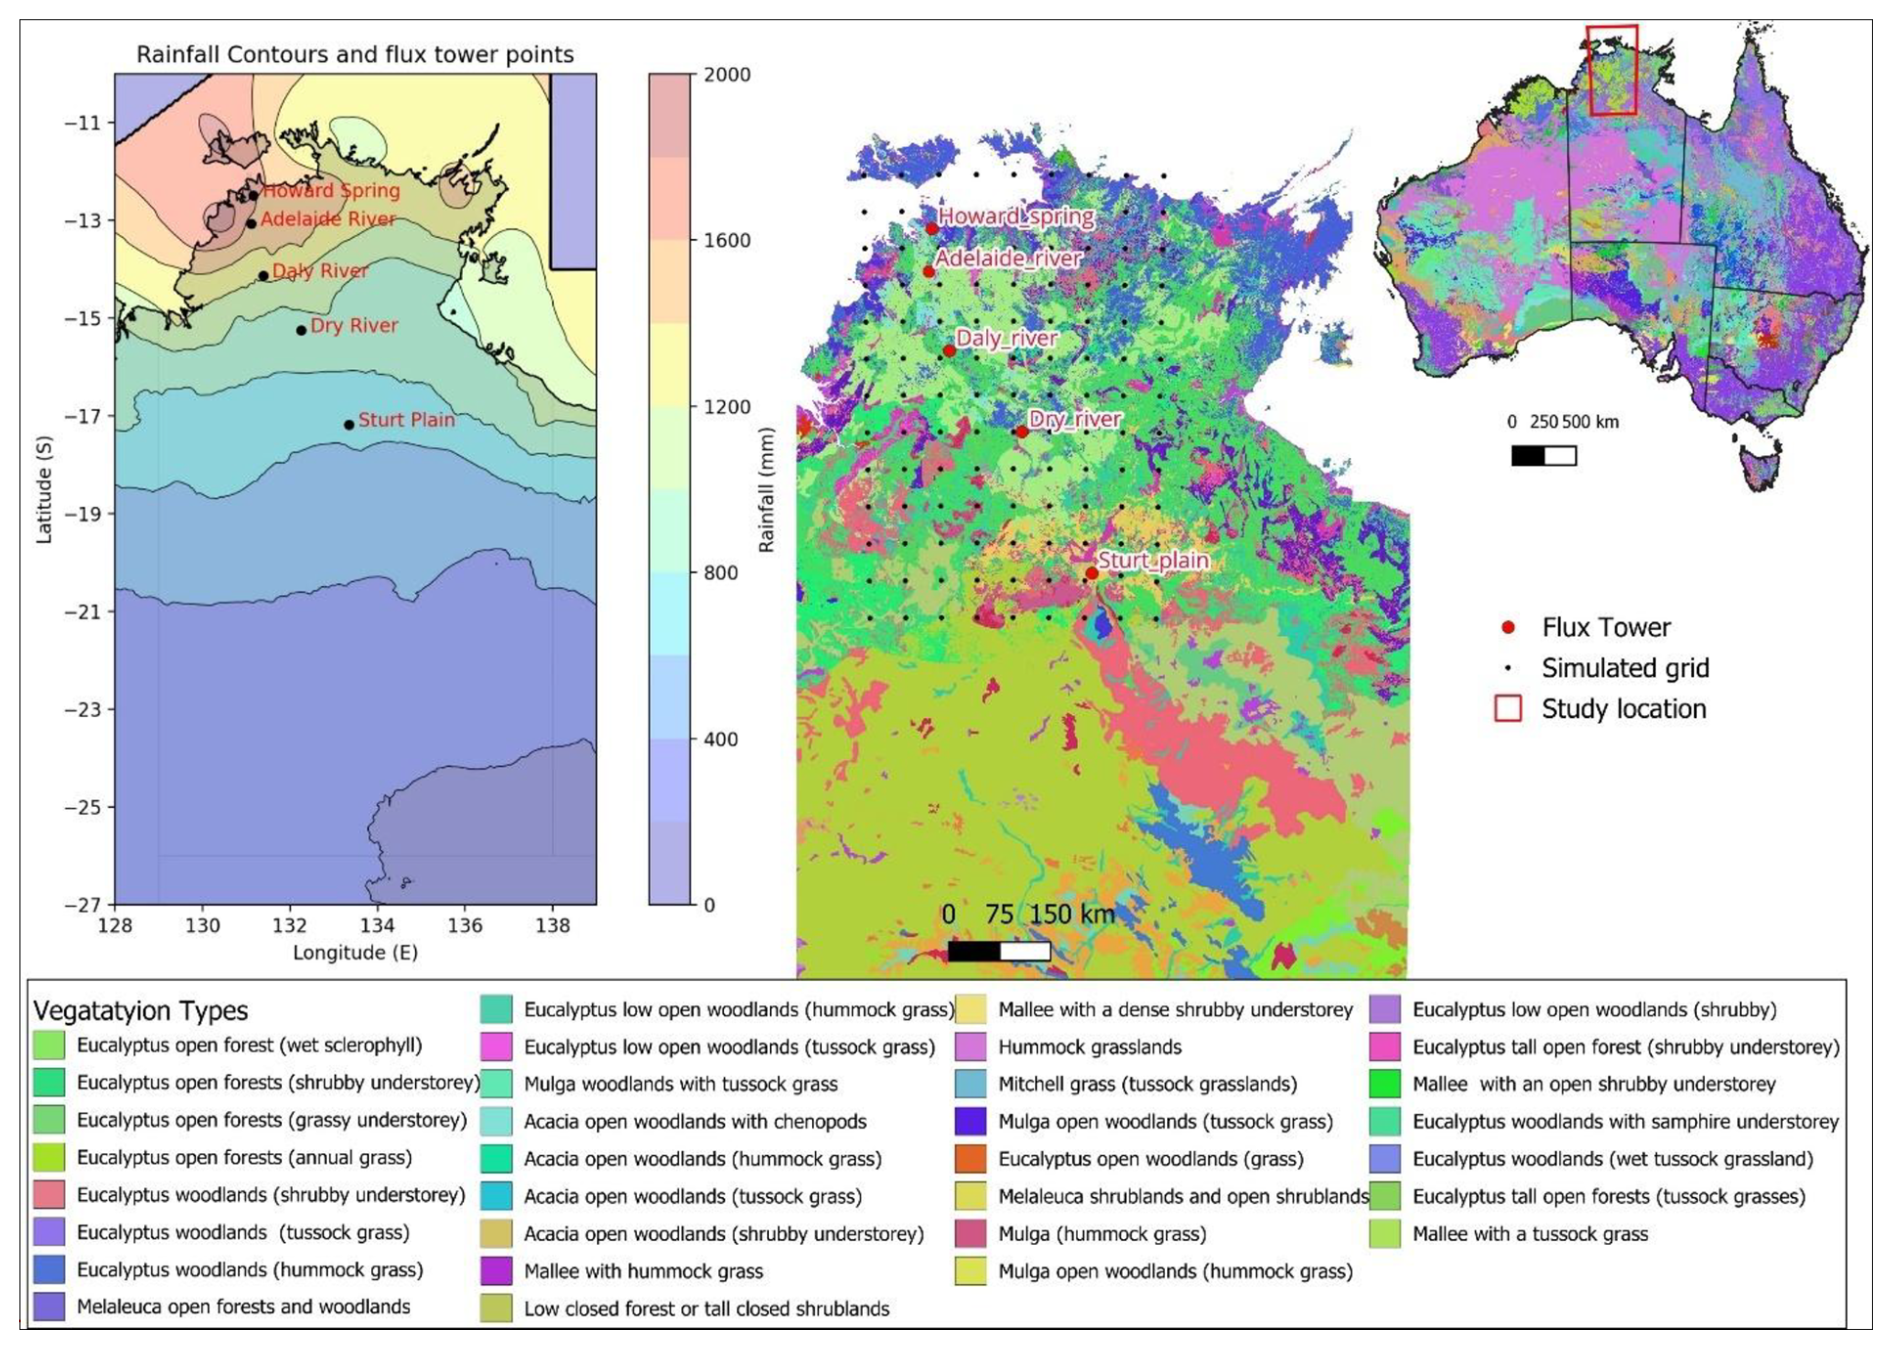
Figure 1Map showing rainfall gradient (data source Bureau of Meteorology, http://www.bom.gov.au, BOM, 2024) with simulated grid, study area, ecosystem flux tower sites of the OzFlux network and vegetation types (data source Australia National Vegetation Information System: http://www.dcceew.gov.au, DCCEEW, 2024) along the NATT.
The northern part of the transect (∼1500 mm rainfall, 12° S) is dominated by tropical savanna vegetation where evergreen eucalypt trees belonging to the Eucalyptus and Corymbia genera dominate the woody overstorey and C4 grasses and other forb and shrub species characterise the understorey. The southern semi-arid region (∼500 mm rainfall, 17° S) comprises shrublands and hummock grassland with scattered Acacia trees (Hutley et al., 2011). Along this transect, five ecosystem flux tower sites (namely Howard Spring, Adelaide River, Daly River, Dry River, and Sturt Plain) belonging to the Terrestrial Ecosystem Research Network (TERN) OzFlux platform monitor meteorological, soil moisture, ecosystem flux, and productivity covering all major ecosystem types along the transect (Hutley et al., 2011; Koch et al., 1995). In addition to the flux tower measurements, TERN samples vegetation at each site through field plots, where limited measurements of plant traits and biomass are conducted to assess ecosystem structure and function (TERN, 2024).
2.2 Ecosystem model description and customization
We employed the standard LPJ-GUESS DVM (Smith et al., 2001, 2014) as a modelling approach to simulate vegetation structure, composition, and productivity along the NATT. LPJ-GUESS is a process-based DVM that simulates ecosystem function through biogeochemical and biophysical processes (Sitch et al., 2003) and integrates the structural dynamics resulting from plant growth, demography, and composition from neighbourhood (patch) to landscape (grid cell) scales (Smith et al., 2001, 2014). DVMs of this kind that combine process-based physiology with explicit vegetation demography have been referred to as second-generation DVMs (Fisher et al., 2018, 2010). Vegetation response to climate, atmospheric CO2 levels, and nitrogen input through competition among co-occurring PFTs for light, space, and soil resources is simulated at the patch scale on a daily timestep. Similarly, the model incorporates stress factors such as drought, nutrient limitations, and soil moisture dynamics impacting growth and survival. Additionally, the model also considers nutrient (nitrogen) cycling (Smith et al., 2014), and fire disturbance, the latter based on the present study on the BLAZE wildfire module (Rabin et al., 2017). The BLAZE fire model simulates combustion and tree mortality based on daily fire-weather and fuel conditions across patches. Annual burned area is estimated using the SIMFIRE model (Knorr et al., 2014), which considers fire weather, fuel continuity, and population density, and is distributed monthly using GFED3 climatology (Giglio et al., 2013). Fuel consumption and mortality are then simulated in BLAZE, with tree mortality based on height-dependent survival probabilities (Haverd et al., 2014), using functions from Bond (2008) for savanna broadleaved trees (Rabin et al., 2017).
PFTs are functional “taxa” that differ in growth form, phenology, and life-history strategies having different growth rates and competitive abilities in resource variability conditions influenced by traits like height, root depth, and specific leaf area (SLA). C3 and C4 photosynthetic pathways are differentiated for grass PFTs. Bioclimatic (temperature) limits determine the potential distribution of PFTs in climate space via establishment and survival limits, whereas mechanistic links between traits and competition of co-occurring PFTs determine the structure, composition, and productivity at stand and landscape scales. Key PFT parameters (traits) for trees include SLA, wood density, leaf longevity, leaf area to sapwood cross-section area (1/Huber value), and root distribution (root profile), which is defined for each PFT before simulation. These parameters influence different ecological processes like growth, biomass accumulation, establishment, and mortality, resulting in community assembly and a distribution of the plant communities along climate and soil gradients (Smith et al., 2001).
Given Australia's unique environmental and ecological characteristics, we modified the following features to customize the model for application to our study.
-
The model uses a global set of 12 PFTs by default, representing dominant elements of the major global vegetation types (biomes). For this study, we defined a new PFT set specific to the local context using a multivariate clustering approach. The parameter values of each PFT were defined based on trait data of tree species that occur along the NATT. These PFTs were chosen to capture the diverse strategies employed by plants to cope with competition and stress conditions prevalent along the transect. C3 and C4 grass default PFTs were adopted for simulation with default parameter values. For trees, values of wood density and Huber value were adjusted using trait observations from trait databases and literature reports (details below) to better represent ecosystem composition and productivity under general conditions across the study domain (field measured and adjusted values of traits/parameters; Table S1 in the Supplement).
-
LPJ-GUESS distributes roots in 15 layers, each 10 cm in depth. However, some Eucalyptus species have roots extend much deeper (sometimes up to 60 m) to access water during the dry season (Janos et al., 2008). However, some Eucalyptus species have roots extend much deeper (sometimes up to 60 m) to access water during the dry season (Janos et al., 2008). Deep water access is believed to be an important determinant of survivorship and productivity of the tree component of savanna ecosystems along the NATT (Chen et al., 2002; February et al., 2007; Whitley et al., 2017). To emulate such deep water access within the architectural constraints of the model, we optimized the model to meet plant water demand by amending the simulated water content of the 15th (lowest) and 14th soil layer to 100 % and 75 % of available water holding capacity, respectively, emulating root access to water reserves within reach of tree roots. Apart from this adjustment, the root profile for each PFT was adopted from the global synthesis of Jackson et al. (1996), which generally prescribes a higher proportion of deep roots for trees relative to grasses (80 % of roots in the top 50 cm of soil for grass; 40 %–65 % in the top 50 cm for trees).
-
Nitrogen-fixing Acacia species are an important component of the woody vegetation element at the dry end of the NATT transect. To emulate the better access to nitrogen supply that these species gain through symbiotic association with nitrogen-fixing rhizobia, we increased the optimum limit for utilizing nitrogen for nitrogen-fixing PFTs to a non-dimensional scalar value of 3, compared to 2 for non-nitrogen-fixing PFTs.
2.3 Data sources and parameterisation of model
Trait values, phenological and morphological characteristics of 28 plant species, recorded across the rainfall gradient during the 2008 inventory (TERN, 2024) at flux tower sites, were compiled from the AusTraits database (Falster et al., 2021b) and other relevant literature sources, including Williams et al. (1997) and the Atlas of Living Australia, regardless of distribution in Australia.
Table 1Tree PFTs and their parameter values used for simulation.
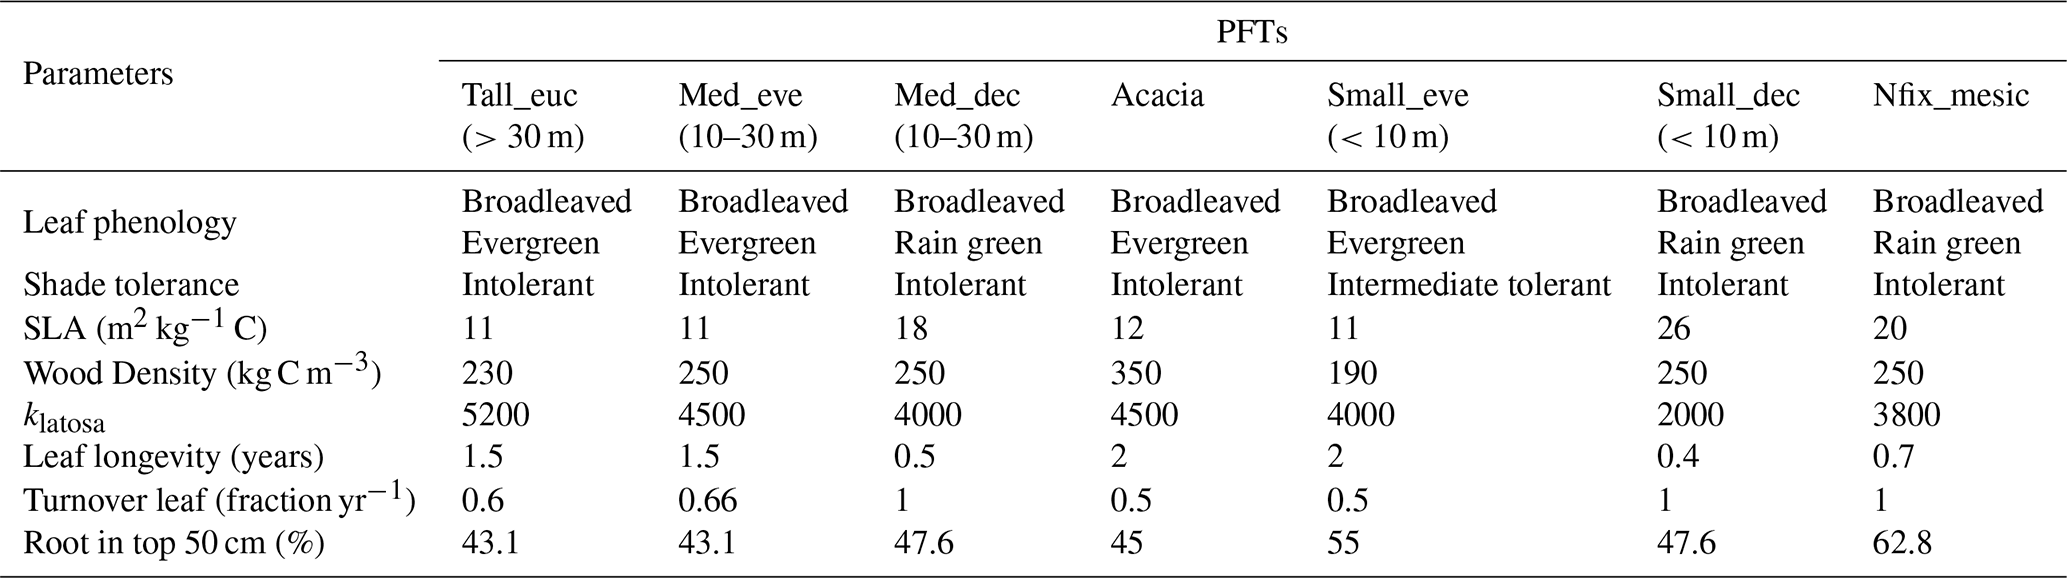
A hierarchical clustering process was used to group species into categories based on similarity in plant traits and life-history strategies. Specifically, we employed a divisive (top-down) clustering approach where species were progressively divided into functionally distinct groups. We used plant life history strategies – such as nitrogen fixation potentiality, leaf phenology (evergreen, rain green, summer green, broadleaved, and conifers), and water requirement for growth (mesic, Intermediate, xeric) – along with traits such as wood density and tree height (height at maturity) were used for clustering species into seven groups (Fig. S1 in the Supplement). Three of these groups comprised tropical broadleaved raingreen trees, with one PFT being intermediate shade tolerant (Table 1). The following parameters: leaf phenology, drought tolerance, leaf longevity, wood density, nitrogen fixation potentiality, plant height, specific leaf area (SLA), shade tolerance, leaf area to sapwood cross-section area (klatosa, i.e. Huber value), root depth distribution, and leaf turnover rate of species correspond to prescribed parameters that discriminate PFTs in LPJ-GUESS. The values of these parameters compiled from different sources were averaged across the species in each cluster to arrive at a representative value for each PFT (Table 1).
2.4 Simulation protocol
LPJ-GUESS was configured using gridded meteorological, soil properties, and atmospheric nitrogen deposition rate at 0.5° × 0.5° spatial resolution (CRUNCEP data (1901–2015)). The model was run with 15 patches in each grid cell, simulating the time period from 1901 to 2015. We run the LPJ-GUESS in cohort mode, using the BLAZE fire model to account for the impacts of weather-related fire disturbances on vegetation structure (Rabin et al., 2017), and applied a generic return interval of 100 years for patch-destroying disturbances (Pugh et al., 2019; Smith et al., 2014). A spin-up of 500 years forced by recycling the first 30 years of the observed climate data set was performed to achieve an initial steady state for vegetation structure. The atmospheric CO2 concentration data from NOAA (1901–2015) is used as input data (Friedlingstein et al., 2023).
2.5 Model validation and Evaluation
The long-term ecosystem productivity data (monthly evapotranspiration, gross primary productivity) recorded at flux tower sites (2002–2015 – Howard Spring; 2008–2009 – Adelaide River; 2008–2015 – Daly River; 2011–2015 – Dry River and 2008–2015 – Sturt Plain) were extracted from TERN Oz flux, a network of flux tower sites across Australia and New Zealand that provides long-term data on ecosystem productivity and climate variables (Beringer et al., 2022; Isaac et al., 2017). The flux-based monthly gross primary productivity (GPP) and evapotranspiration (ET) are used for validating model performance. To validate the vegetation structural component, remotely sensed leaf area index (LAI) from MODIS from 2002 to 2015 (Myneni et al., 2015) was compared with simulated LAI. In addition, species-level fractional cover of plot-based point intercept data from ausplot (Munroe et al., 2021) was used for validating model-simulated foliar projective cover (FPC). Fire flux validation was done using Global Fire Emission flux data (Vernooij et al., 2023), which was compared with simulated fire flux output generated by the BAZE model.
Model accuracy in predicting carbon and water cycle fluxes along the rainfall gradient was evaluated by comparing model outputs of gross primary production (GPP, g C m−2 month−1) and evapotranspiration (ET, mm month−1), to observations/estimates of these quantities at flux tower sites along the NATT. Spatial mapping of the gridded model output to the flux tower location was achieved by distance-weighted averaging of model values for the four nearest grid centroids to the flux tower location, as follows:
Where, Si,j is the simulated value in the ith grid for the jth month, and Wi denotes the weighted distance between the grid point and the actual location of the flux tower, calculated using the inverse of the square of distance (). The actual distance (di) is , where x and y represent the coordinates of the grid point and the flux towers (x1 and y1 are the coordinates of the grid point; x2 and y2 are the coordinates of the flux tower.)
We employed the root mean square error (RMSE) and coefficient of determination (R2) to assess the quality of the fit matrix. The formula used for computing RMSE is:
Where n is the number of months, Si is the model simulation value of the ith month, Oi is the observed value of the ith month. All figures and statistical analyses were prepared using Python within the Jupyter Notebook environment.
3.1 Ecosystem Fluxes (ET, GPP, and Fire flux) along the gradient
The comparison of simulated monthly evapotranspiration with observed values across five sites shows distinct spatial and temporal patterns (Fig. 2). A consistent trend emerges, showing a decrease in ET with a decrease in rainfall (>1300 kg m−2 yr−1 in wet and <800 kg m−2 yr−1). The RMSE and R2 show that the performance of the model differed by site. The RMSE was lowest at Adelaide River (17.00 mm month−1), followed by Daly River (18.77 mm month−1) sites, indicating closer agreement between observed and simulated ET values. R2 shows the highest accuracy at Adelaide River (0.84), followed by Daly River (0.82), and the lowest in Dry River (0.52). Additionally, there were no specific patterns in monthly observed and simulated ET by seasons, with some sites, like Howard Spring and Dry River, showing slight underestimation in the dry season, whereas in Sturt Plain, there was overestimation. The model performed slightly better at sites with more consistent patterns in productivity, while it faces challenges in accurately predicting ET rates at extreme sites (high rainfall or high arid conditions).
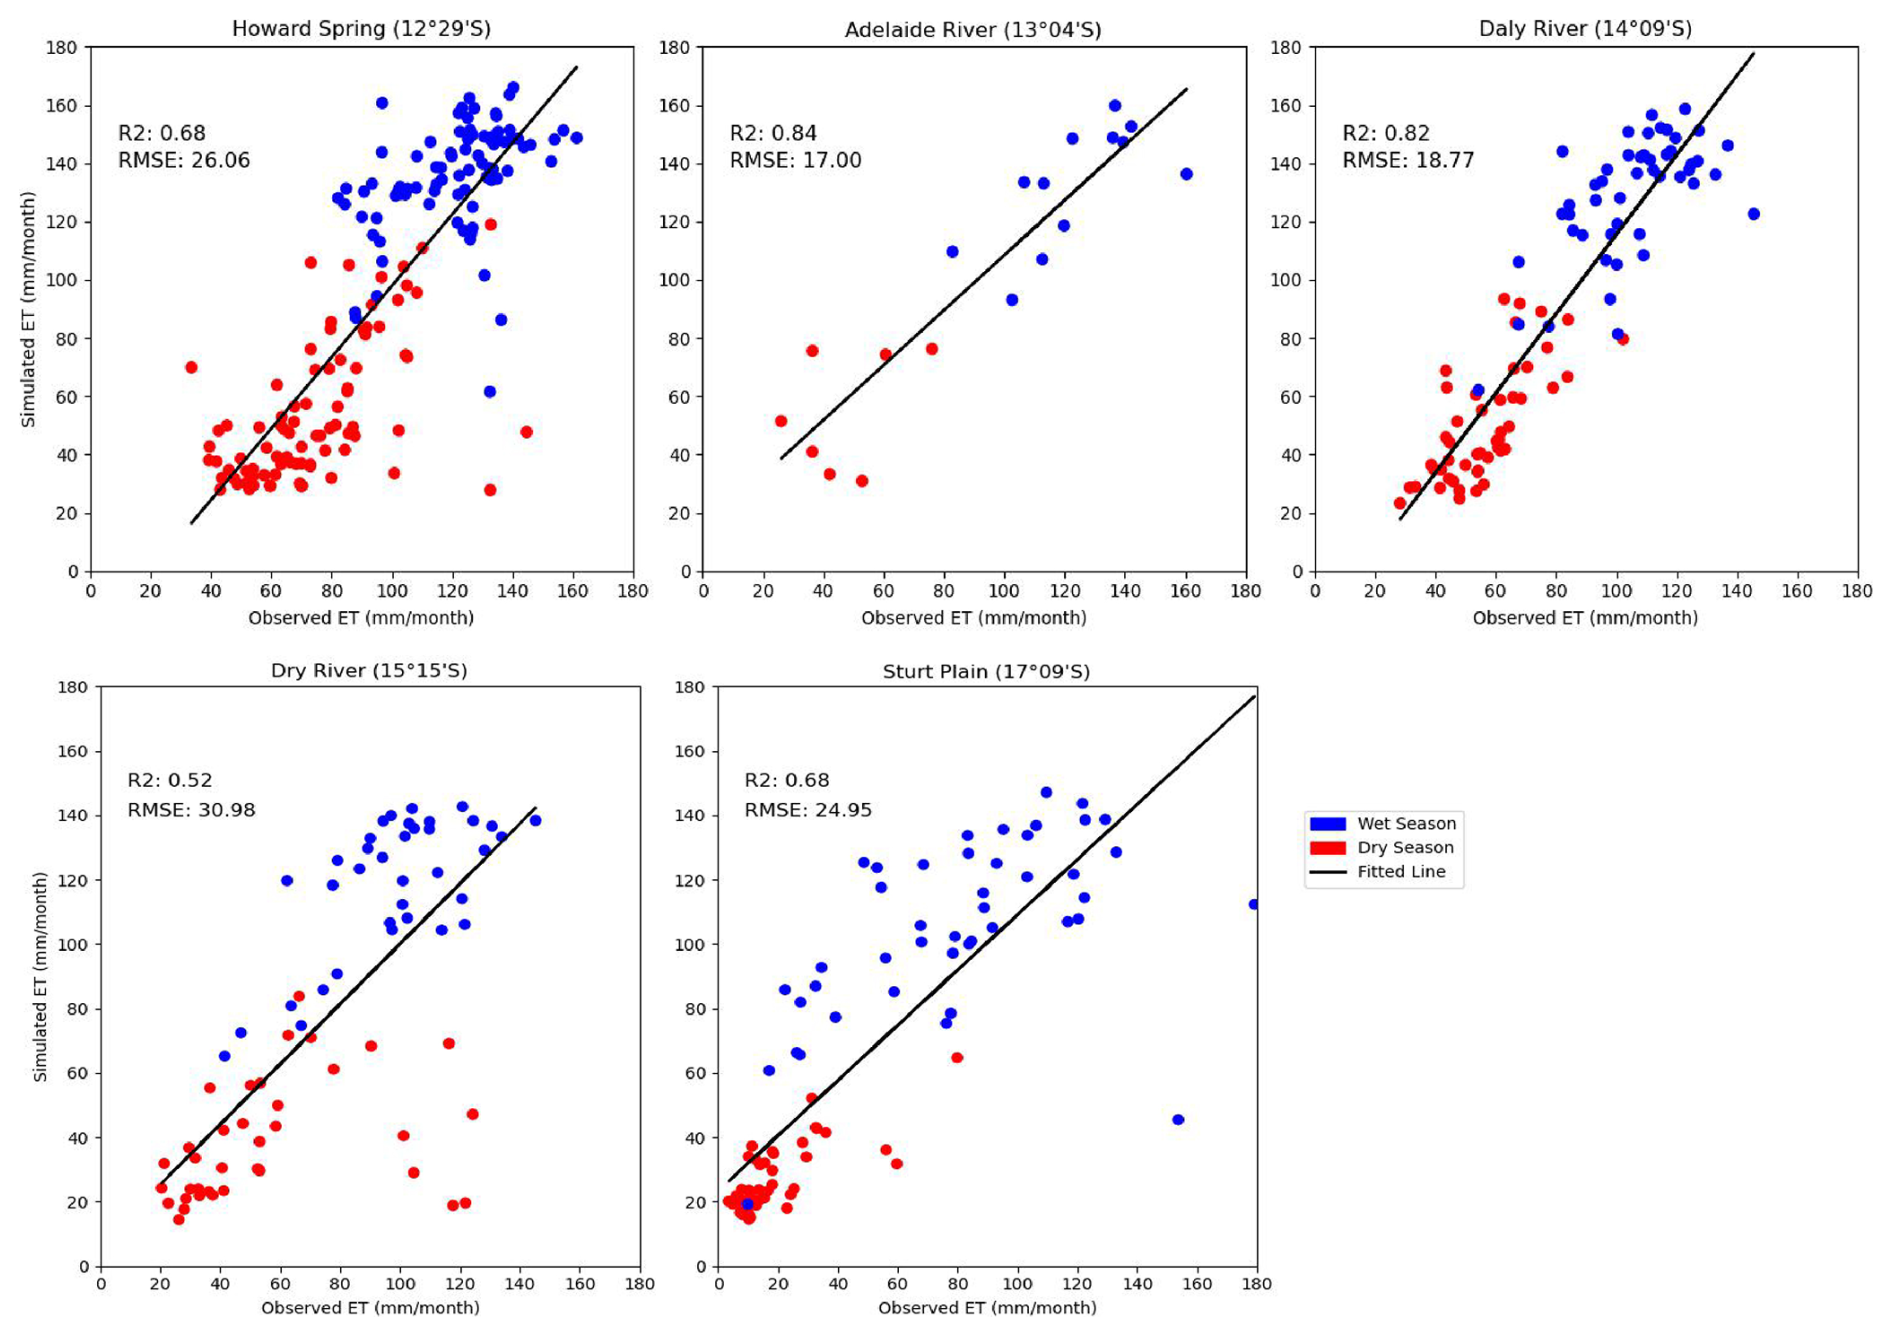
Figure 2Observed versus simulated evapotranspiration (mm month−1) across the studied sites by seasons. Points show values for individual months. Dry Season: May, June, July, Aug, September, and October; Wet Season: November, December, January, February, March, and April.
In this analysis, we compared observed monthly GPP data from different time frames; depending on the site, there is a decrease in productivity with a decrease in rainfall, showing a limitation of resources, especially water in dry regions. The monthly simulated and observed values (light blue lines) show, except for Sturt Plain, where the model overestimated GPP for all months (RMSE 69.53 g C m−2 month−1), that the model was able to capture productivity along the rainfall gradient (Fig. 3). Similarly, the model was able to capture both temporal and seasonal patterns with RMSE ranging from 48.46 to 69.53 g C m−2 month−1, but consistently underestimated productivity in the dry season in all sites except Sturt plain.
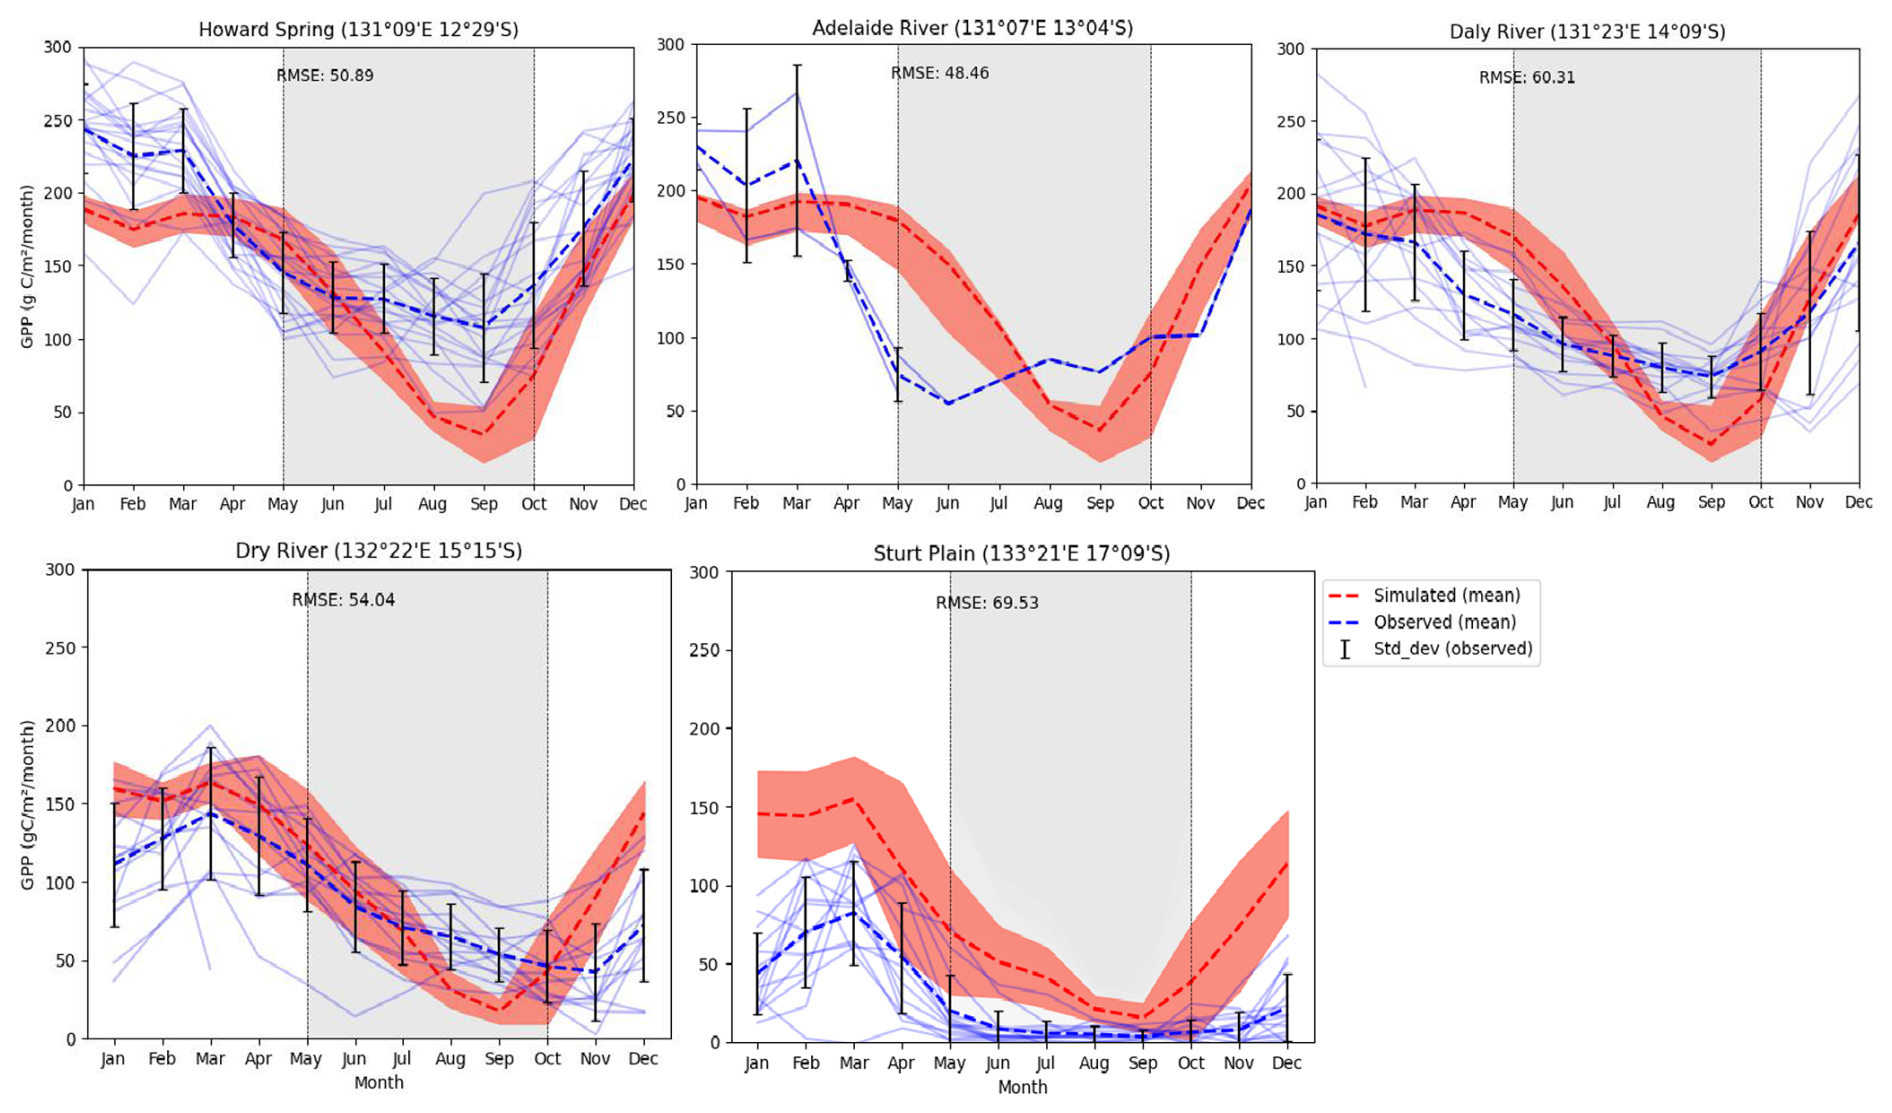
Figure 3Observed and simulated GPP by sites (g C m−2 month−1) with simulated mean (1990–2015) and observed mean (faint lines: observed fluxes for individual years; orange shading = variability (standard deviation) of simulated fluxes for individual years and light-gray shading: dry season).
We compared (Fig. 4) the simulated carbon flux from fire using the BLAZE model (1990–2015) with carbon emission data (2000–2015) from the GFED. It shows that both datasets follow a similar pattern, and fire flux depends on water availability and fuel loads, which decrease with decreasing latitude. The latitudinal trend in the mean fire flux (top panel) shows a decline from north to south, with higher mean fluxes in the last 25 years around 14–15° S and reduced values beyond 16° S. Even though the model slightly underestimates emissions at the northern end of the gradient, the overall pattern corresponds closely with the GFED (bottom panel), where northern regions (particularly those below 15° S) exhibit higher fire activity emissions (Fig. 4).
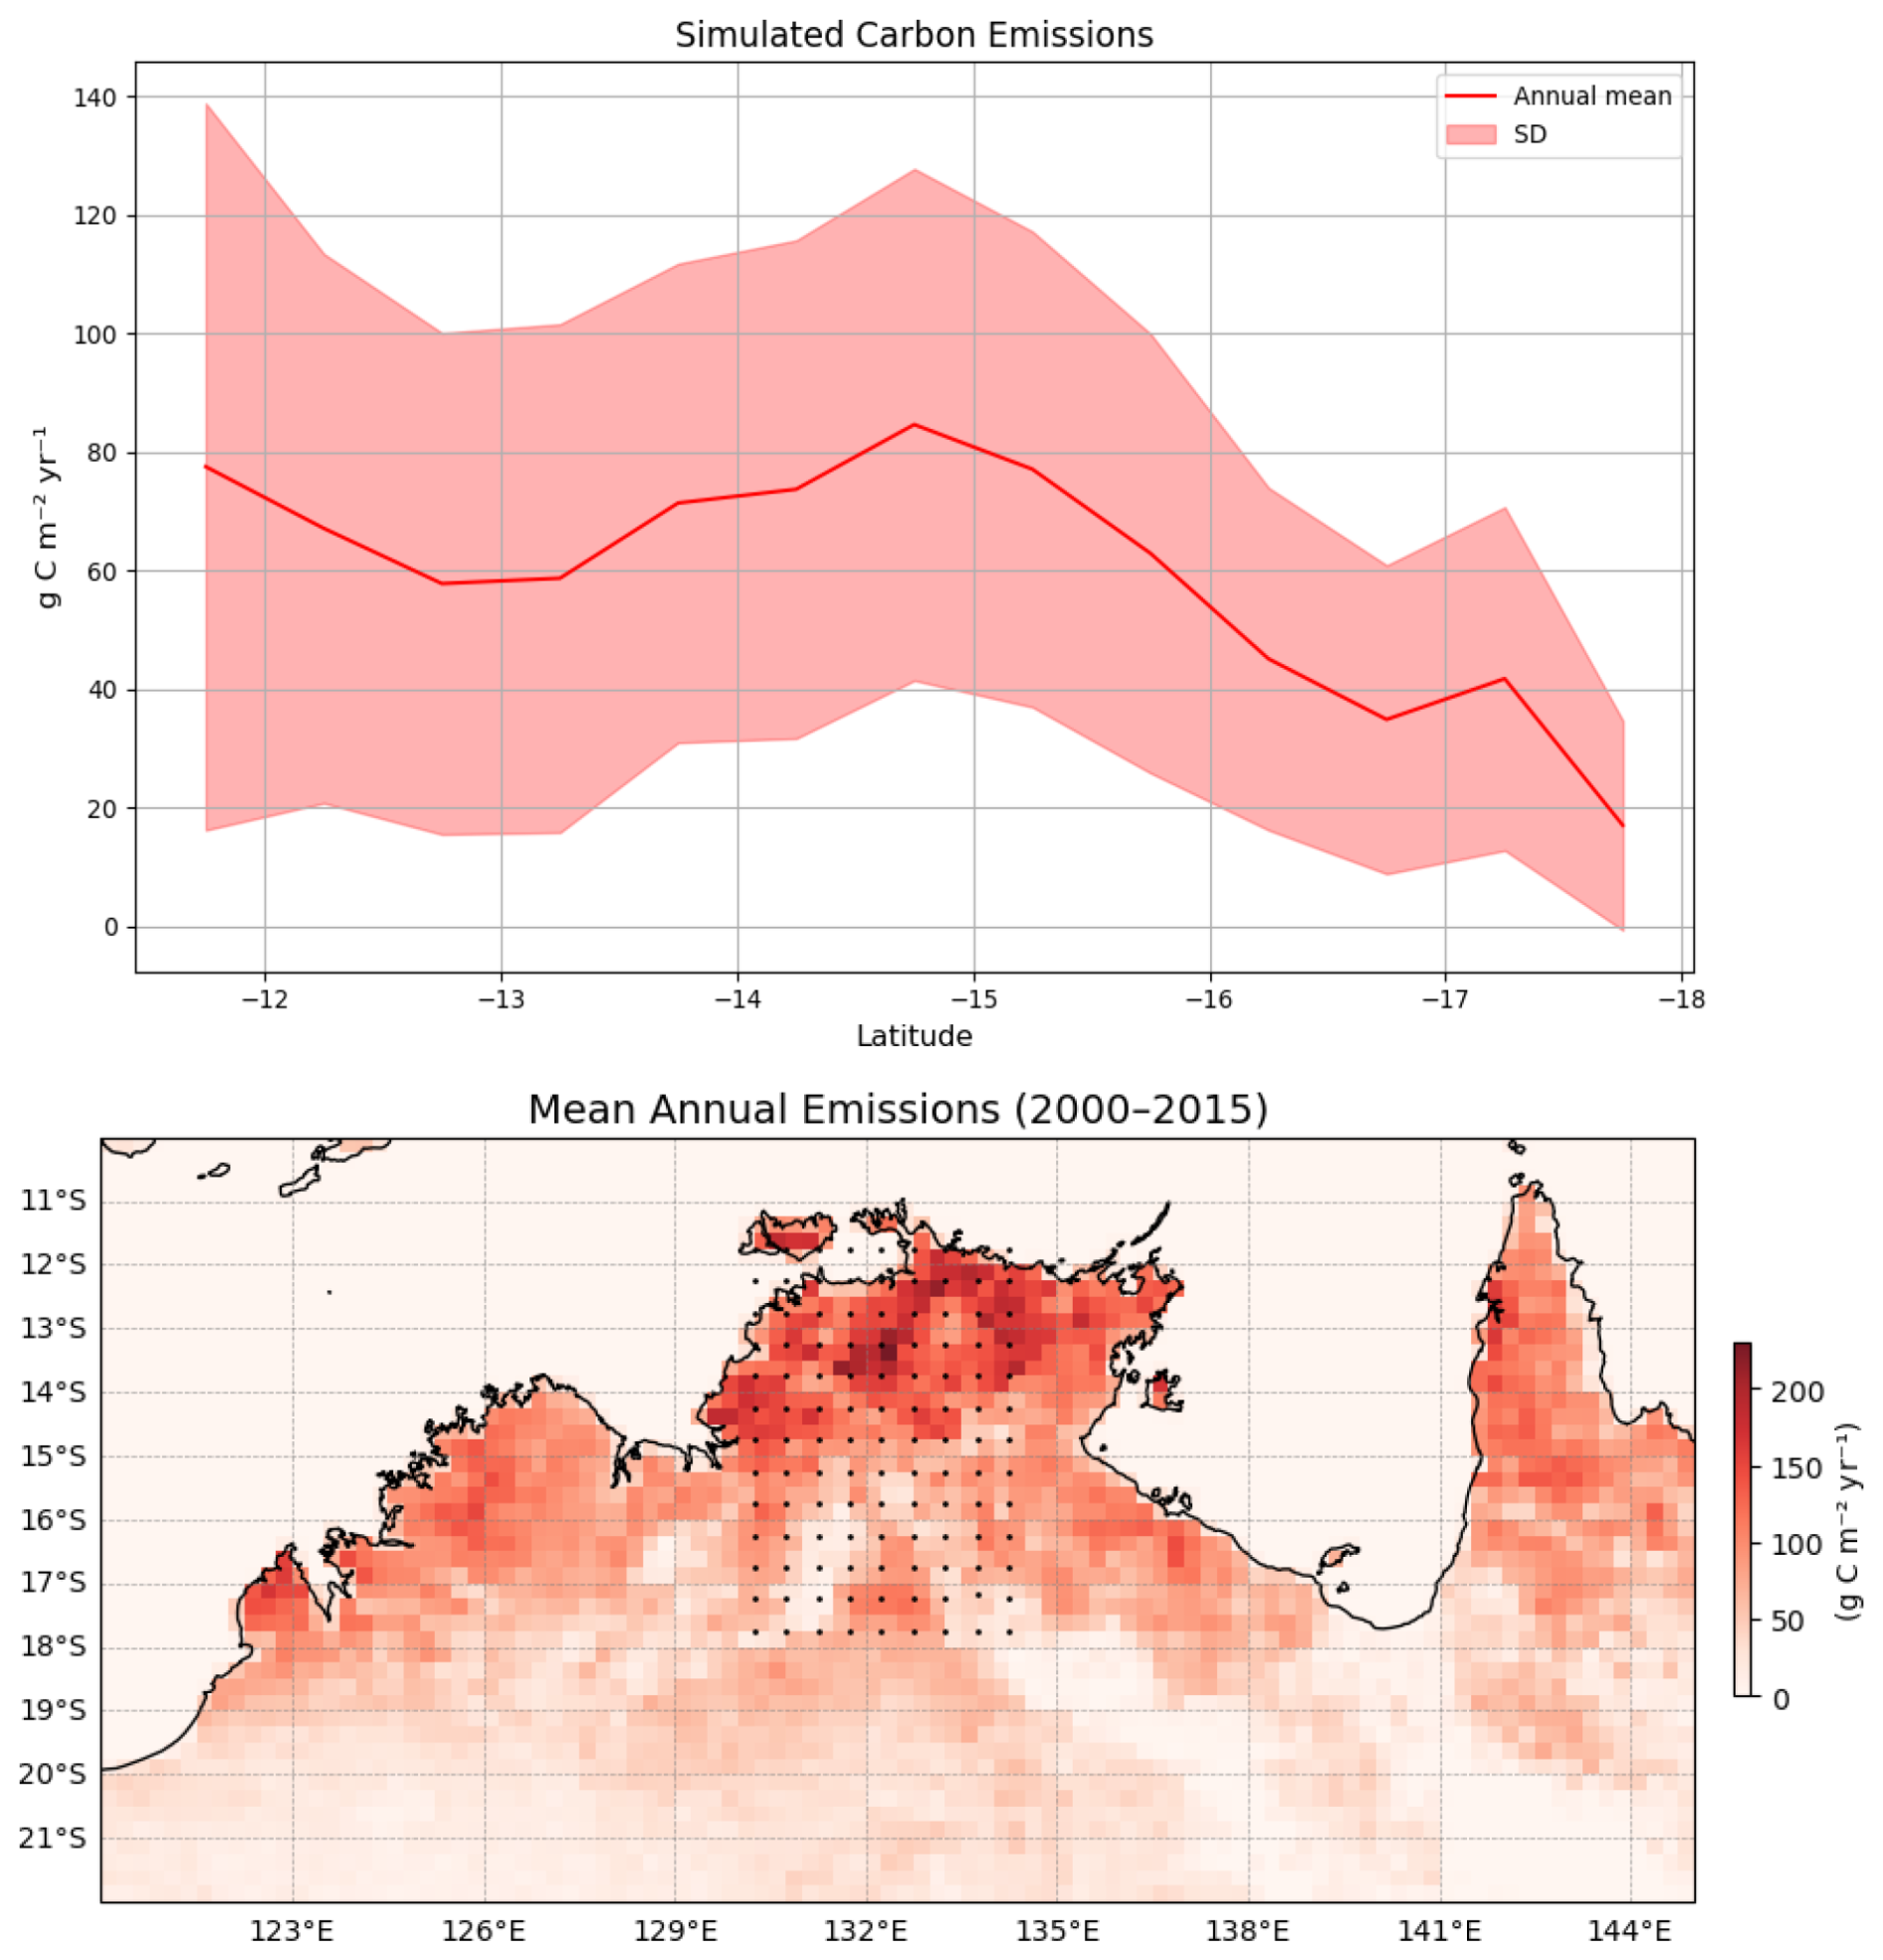
Figure 4Simulated carbon flux from fire (g C m−2 yr−1) with simulated mean (1990–2015) and annual fire flux (2000–2015) map from Global Fire Emission data (GFED) along the rainfall gradient.
3.2 PFTs composition shift with rainfall
Figure 5 depicts compositional variation along the rainfall gradient in terms of FPC as a proxy of PFT abundance. Both observed projective foliar cover (PFC) patterns and simulated FPC show that PFT composition varies with water availability, with grass dominance increasing as water availability decreases (Fig. 5, top panel). The simulation result also shows the dominance of taller evergreen trees (Tall_euc) (>25 m high) and other medium eucalypts at the northern end of the gradient and short evergreen nitrogen-fixing Acacia and deciduous trees (Med_dec) at the southern end (Fig. 5). The dominance of tall and medium-sized eucalypts (Tall_euc and Med_eve) decreases with increased aridity, with other PFTs having minimal FPCs in wet regions. In contrast, with a decrease in rainfall, the dominance of C4 grasses increases, reaching more than 50 % FPC in a dry part of the gradient. Similarly, the contribution of PFTs other than grass in FPC remains similar in the dry end of the gradient, indicating water stress and competition for resources other than light, as FPC is evenly distributed among tree PFTs (PFT-wise simulated FPC and observed PFC are kept in Fig. S5).
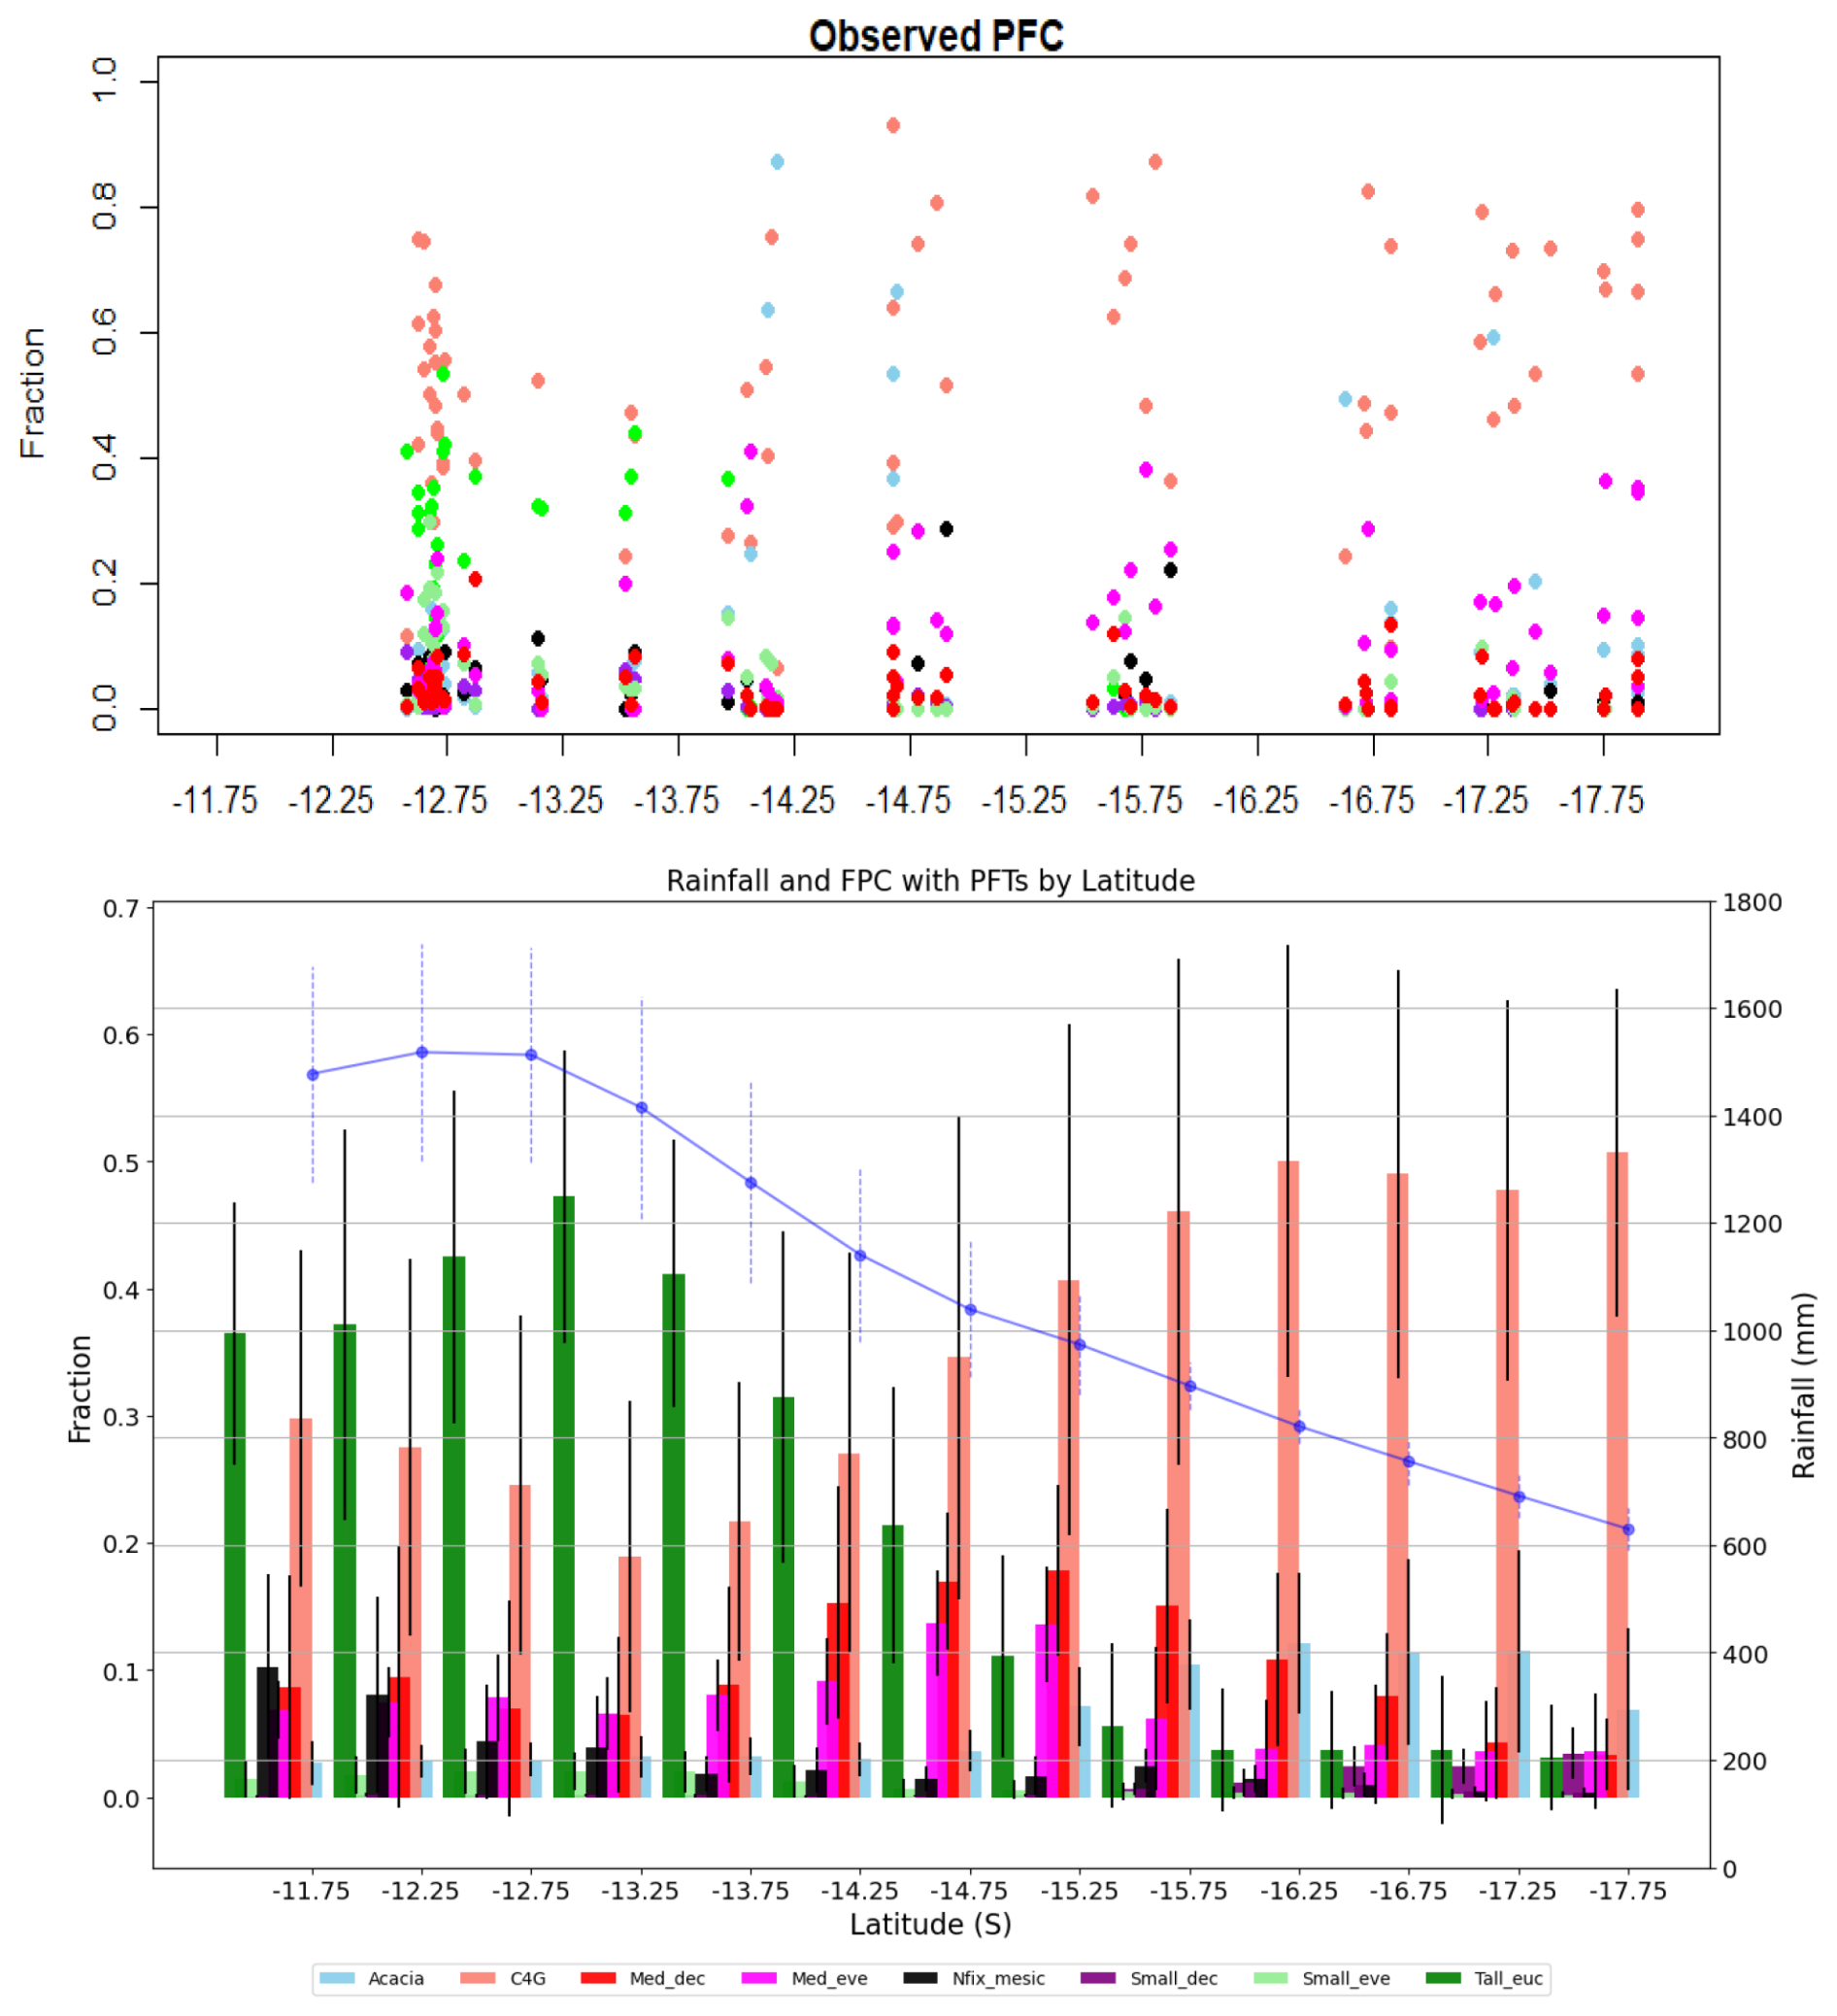
Figure 5Plot level projective foliar cover from ausplot (top panel) and simulated foliar projective cover by PFTs along the NATT (bottom panel). Bars represent mean value and error bar depicts standard deviation. Blue line shows mean rainfall with standard deviation (Acacia, C4G: grasses, Med_dec: Medium sized deciduous trees, Med_eve: medium sized evergreen trees, Nfix_mesic: Nitrogen fixing mesic trees, Small_dec: Small sized deciduous trees, Small_eve: Small sized evergreen trees, Tall_euc: tall eucalyptus trees).
Figure 6 depicts the variability of production in carbon mass and its relative contribution to carbon mass production along the rainfall gradient. Carbon mass production per year decreases with rainfall, ranging from 3.35 to 12.80 kg C m−2 yr−1 in wet regions to 0.76 to 6.33 kg C m−2 yr−1 in dry regions among PFTs. Mirroring FPC composition, the simulation also reveals that eucalypts contribute significantly more to carbon mass production in the wet end (3–6 kg C m−2 yr−1) but minimally at the dry end of the gradient (less than 0.2 kg C m−2 yr−1). However, in the dry areas, Acacia (0.8 kg C m−2 yr−1), medium-sized deciduous species (0.5 kg C m−2 yr−1), and grass (0.45 kg C m−2 yr−1) are major contributors to carbon production, showing the difference in vegetation composition with rainfall. In terms of relative contribution in carbon mass, eucalypt contributes up to 65 % in wet areas, while in the dry end, three PFTs, namely Acacia (35.78 %), Medium-sized deciduous (25.15 %), and C4 grass (24.82 %), are significant contributors. Similar contributions in overall productivity and decreases in carbon mass with an increase in dryness reflect that PFTs are adopted for limited water availability in dry conditions. Nitrogen-fixing mesic trees show notable productivity in the wet end of the gradient (2.05 kg C m−2 yr−1) with eucalypt, while other PFTs have a relatively small contribution to carbon productivity, reflecting asymmetric competition for light. Similarly, grass productivity increased from 0.17 to 0.44 kg C m−2 yr−1 with decreases in rainfall, becoming a significant contributor in the dry end of the gradient (up to 70 % in some years) (Fig. 6).
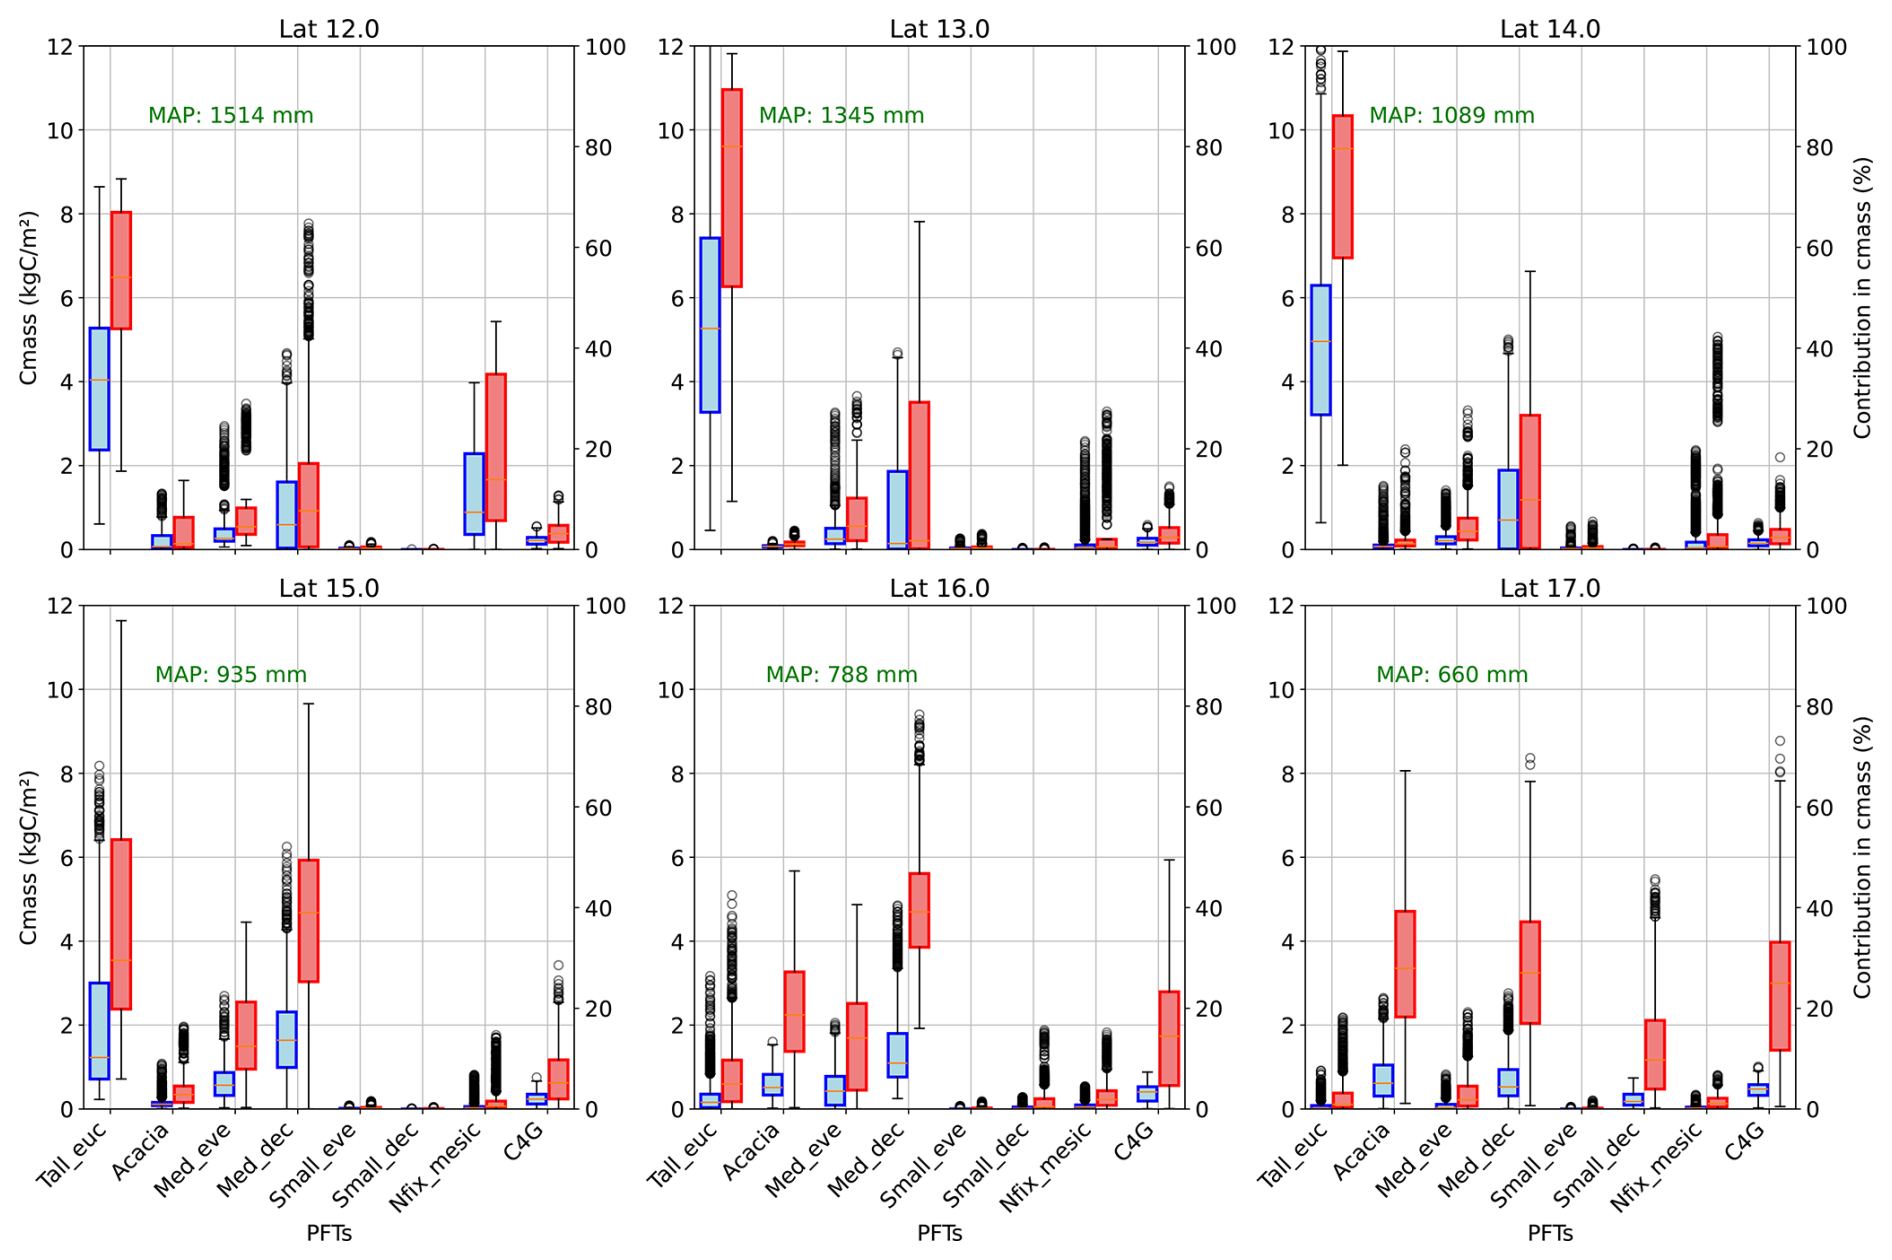
Figure 6Carbon mass and relative contribution in carbon mass production by PFTs in along the latitude (average across rows of simulated grids) (Tall_eue: tall eucalyptus trees, Acacia, Med_eve: medium sized evergreen trees, Med_dec: Medium sized deciduous trees, Small_eve: Small sized evergreen trees, Small_dec: Small sized deciduous trees, Nfix_mesic: Nitrogen fixing mesic trees, C4G: grasses).
Figure 7 illustrates the seasonal variation in MODIS LAI and simulated monthly LAI values from 2000 to 2015 along NATT in relation to rainfall and seasons. Both LAI datasets exhibit the same pattern, i.e., a decrease in LAI with decreases in rainfall. The MODIS LAI shows more variability in LAI compared to the simulated LAI, where the simulated LAI was within the range of MODIS LAI (Fig. 7). Across the simulated longitude, MODIS LAI has a denser value within the range of 1 to 2 m2 m−2 in the wetter end of the gradient, with a maximum of 7 m2 m−2 in both seasons. In both LAI, at the wetter end of the gradient, LAI remains relatively constant throughout the year, whereas in the dry season, LAI at the dry end of the gradient is smaller (less than 2 m−2 m−2). It reflects that the PFTs' composition (Fig. 5) and their adaptive mechanisms vary with water availability, as rainfall in the wet season is significantly higher than in the dry season.
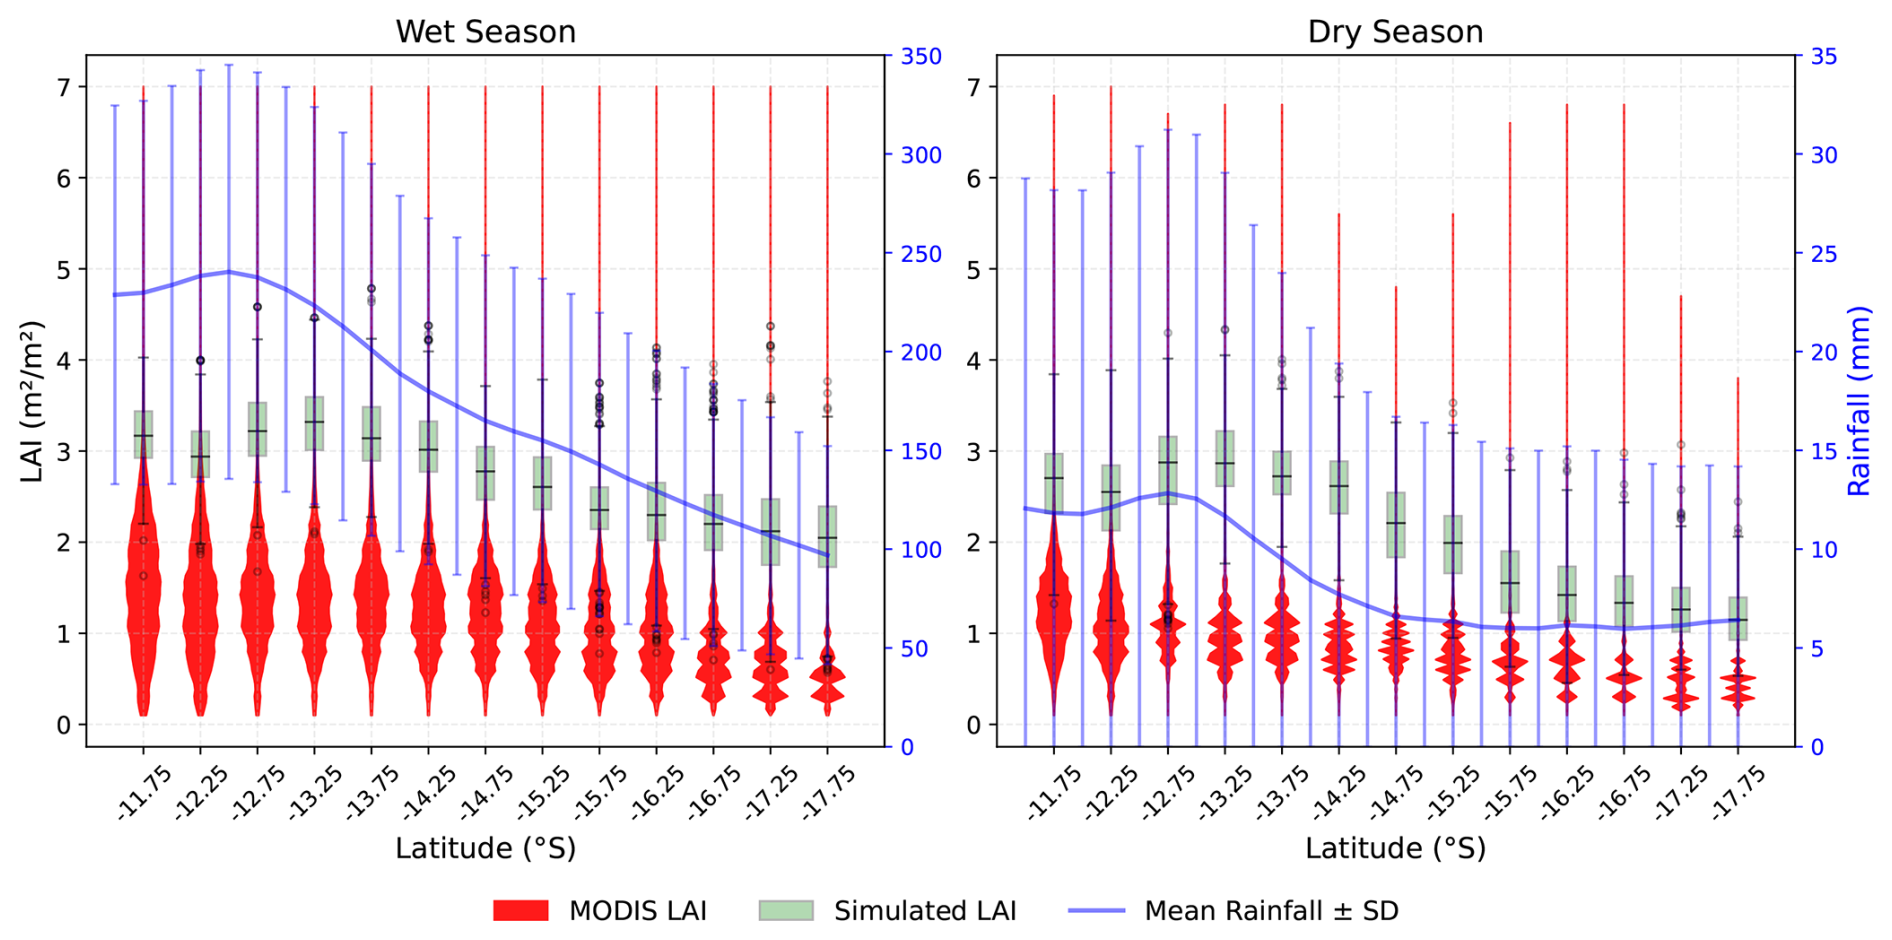
Figure 7MODIS LAI (2000–2015) and simulated monthly LAI (2000–2015) with rainfall by season along the NATT. Black line plot represents the mean simulated LAI value, and the error bar depicts the standard deviation. Blue line shows the mean rainfall with standard deviation (error bar).
Figure 8 shows the relationship between LAI and latitude for PFTs. The LAI of tall Eucalyptus trees decreases as rainfall decreases, with a maximum LAI of 2.02 m2 m−2 at latitude 13.25° S and a minimum at 17.75° S (0.3 m2 m−2), reflecting the competitive dominance of these PFTs in wet conditions. For medium deciduous species (Med_dec), LAI increases with a decrease in rainfall before decreasing again, showing a non-linear response to rainfall, which can be interpreted as PFT adaptation to fluctuating competition and stress conditions. Overall, the LAI trend for trees shows a negative correlation between LAI and rainfall, i.e., with a decrease in rainfall, the LAI of trees decreases. By contrast, the LAI of grass increases towards the dry end of the transect (0.4 m2 m−2 at 11.75° S and 0.75 m2 m−2 at 17.75° S), showing dominancy of grasses in arid regions, which is the opposite of the trend for trees. Similarly, at the dry end of the gradient, Acacia dominancy in LAI becomes more apparent, as this genus, characteristic of the Australian inland arid region, is generally more adapted to water stress conditions compared to eucalypts.
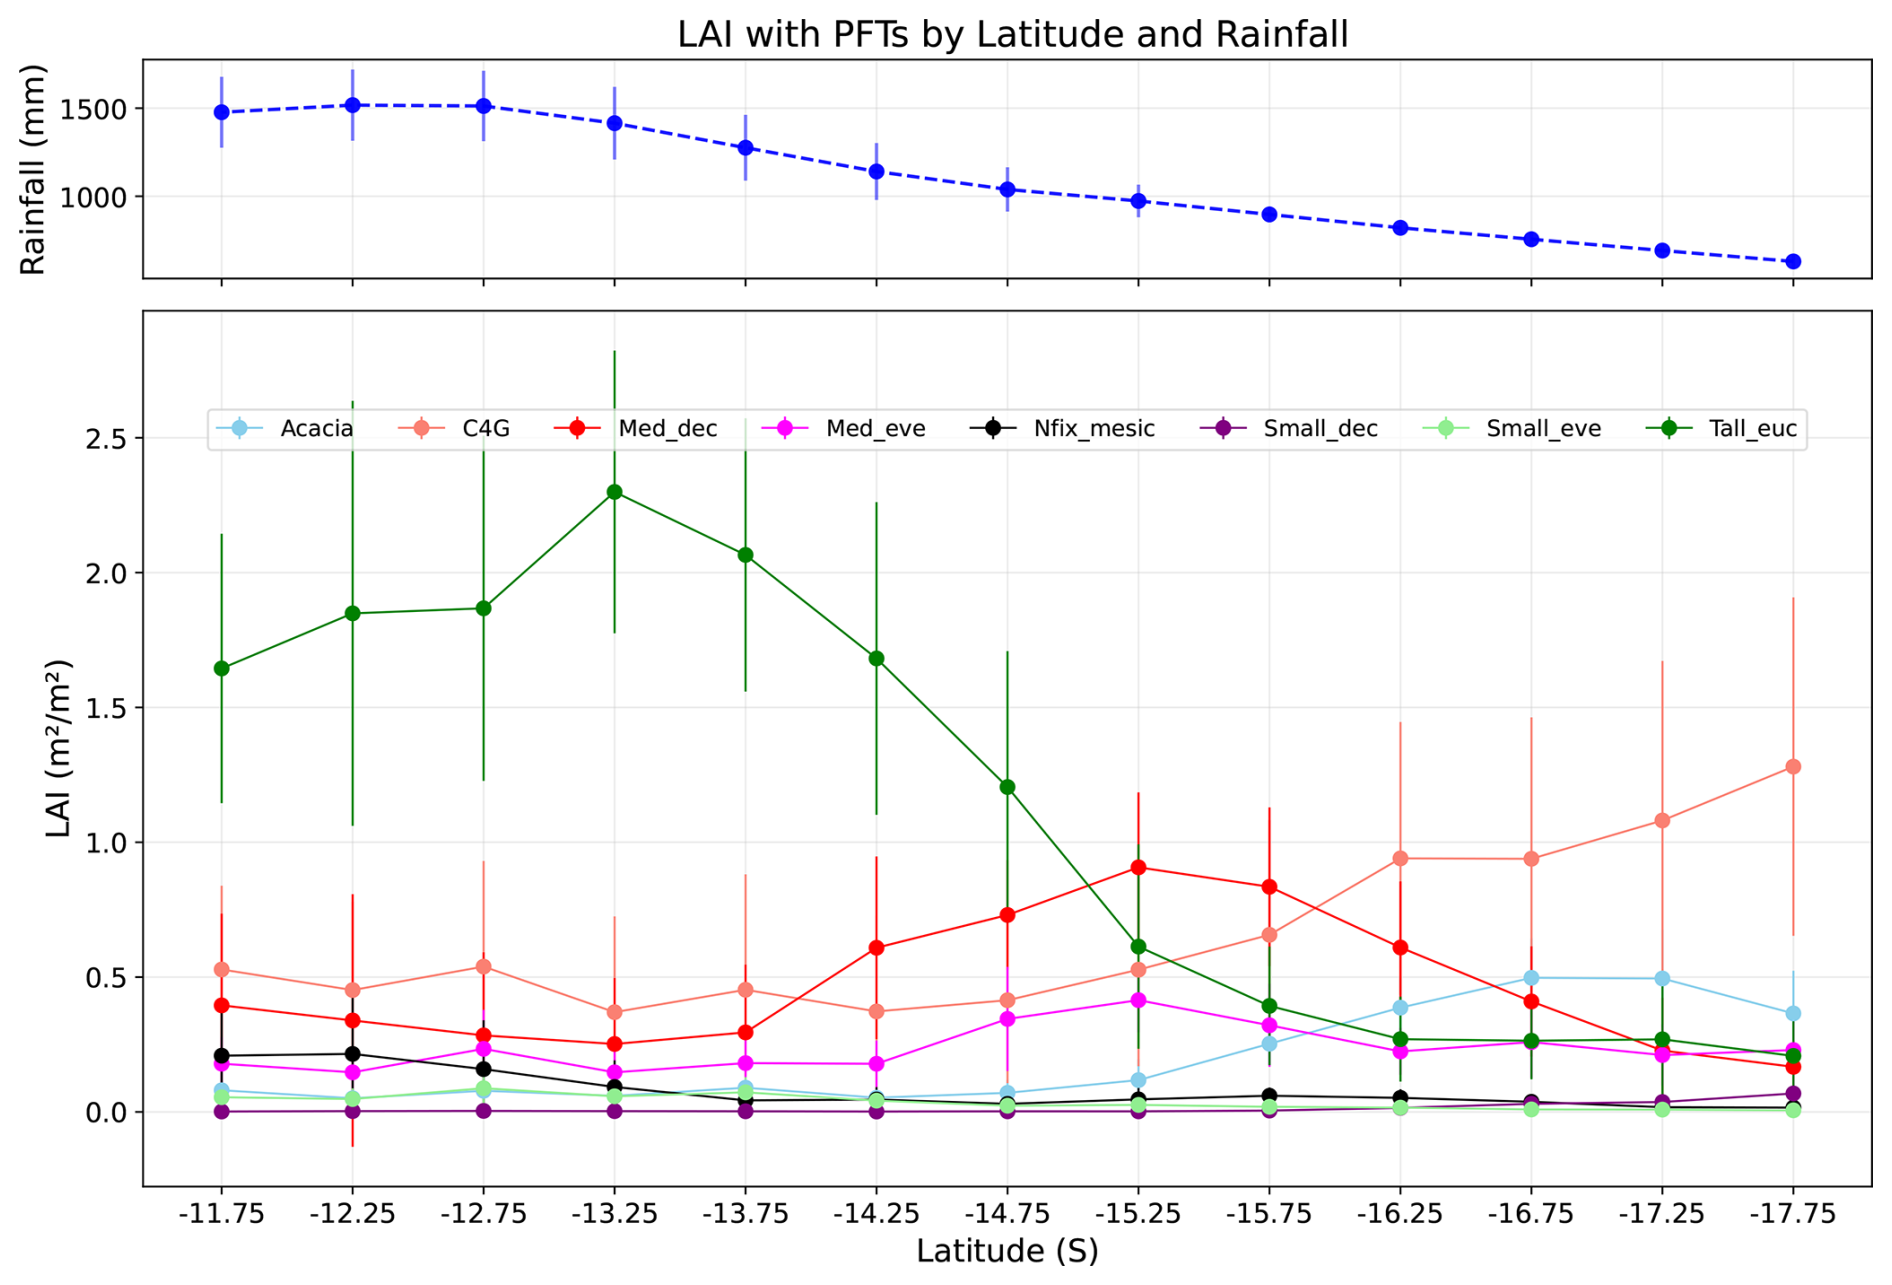
Figure 8LAI by PFTs along the NATT (simulated grid), solid point showing mean, and error bar showing standard deviation of mean for each PFT. Blue line shows mean rainfall with standard deviation in each latitude (Acacia, C4G: grasses, Med_dec: Medium sized deciduous trees, Med_eve: medium sized evergreen trees, Nfix_mesic: Nitrogen fixing mesic trees, Small_dec: Small sized deciduous trees, Small_eve: Small sized evergreen trees, Tall_euc: tall eucalyptus trees).
3.3 Grass abundance increases with a decrease in rainfall
Across the rainfall gradient, productivity and flux decreased with declining rainfall (Fig. 9). Simulated GPP, data from Haverd et al. (2016), and flux tower observed data consistently show a decline in GPP with rainfall across four sites, accompanied by strong seasonal fluctuations. The tree component in Haverd et al. (2016) exhibits less seasonal fluctuation in flux compared to grass, where grass productivity drops to almost zero during the dry season. This lower variability in the tree component is evident in the consistent fPAR throughout the year for trees. However, in the simulated results, the tree component also fluctuated due to the presence of deciduous PFTs in the simulation inputs. The seasonal cycle in GPP exhibits sharper fluctuations in drier regions, where grass becomes productive during the wet season, and the overall productivity of the ecosystem peaks, reflecting a strong phenological response of vegetation to rainfall. Furthermore, the contribution of C4 grasses to overall GPP increases with decreasing rainfall, reaching maximum productivity at the drier sites. In these regions, approximately 30 %–35 % of total annual production is attributed to grass. These spatial and temporal patterns highlight a structural shift in ecosystem function, and the composition of the ecosystem is controlled by rainfall and PFTs' adaptation to water stress and competition.
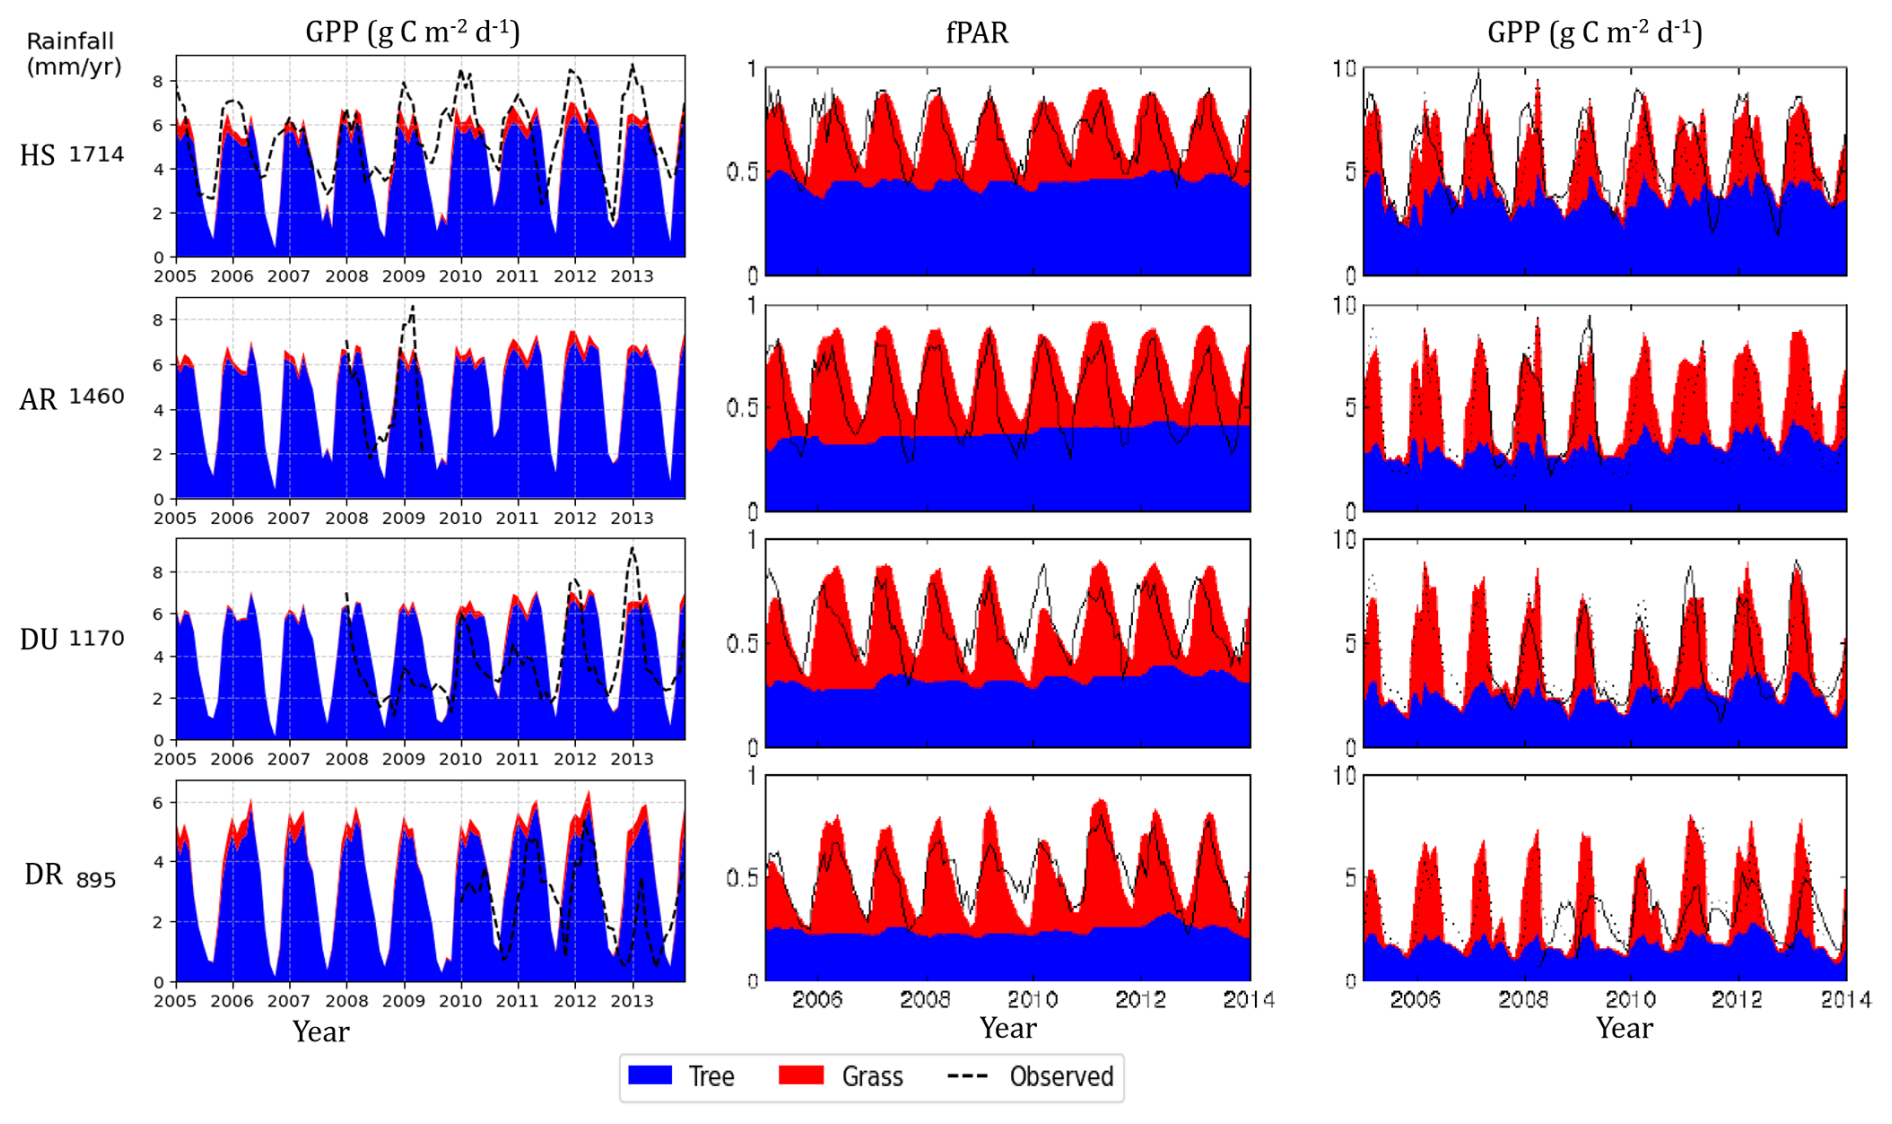
Figure 9Monthly time series of simulated GPP of trees and grasses (2002–2015) and monthly fPAR and daily GPP adopted from Haverd et al. (2016) along the rainfall gradient (HS: Howard Spring; AR: Adelaide River; DU: Daly Uncleared (River), DR: Dry River).
Along the rainfall gradient, variation in the simulated monthly leaf area index of trees and grasses demonstrates a relationship between seasonal rainfall patterns (Fig. 10) and vegetation composition. In both wet and dry seasons, the monthly LAI of the trees decreased with a decrease in rainfall and contributed maximum monthly LAI at the wet end of the gradient. The LAI of trees in both dry and wet seasons is relatively similar (less than 0.5 m2 m−2) at the dry end of the gradient, which is almost one-fourth compared to the wet end of the gradient. However, the monthly LAI of grasses exhibits distinct behaviour. In the dry season, the monthly LAI of grass was almost the same throughout the gradient, averaging around 0.2 m2 m−2. However, during the wet season in drier regions of the gradient, grasses have a higher leaf area index than trees, reaching more than 1 m2 m−2. Here, the difference in LAI of trees in wet and dry seasons remains smaller compared to grass, which increases with a decrease in rainfall, illustrating the role of internal annual variability of rainfall and stress caused by it on determining structural variability and interaction between trees and grass along the gradient.
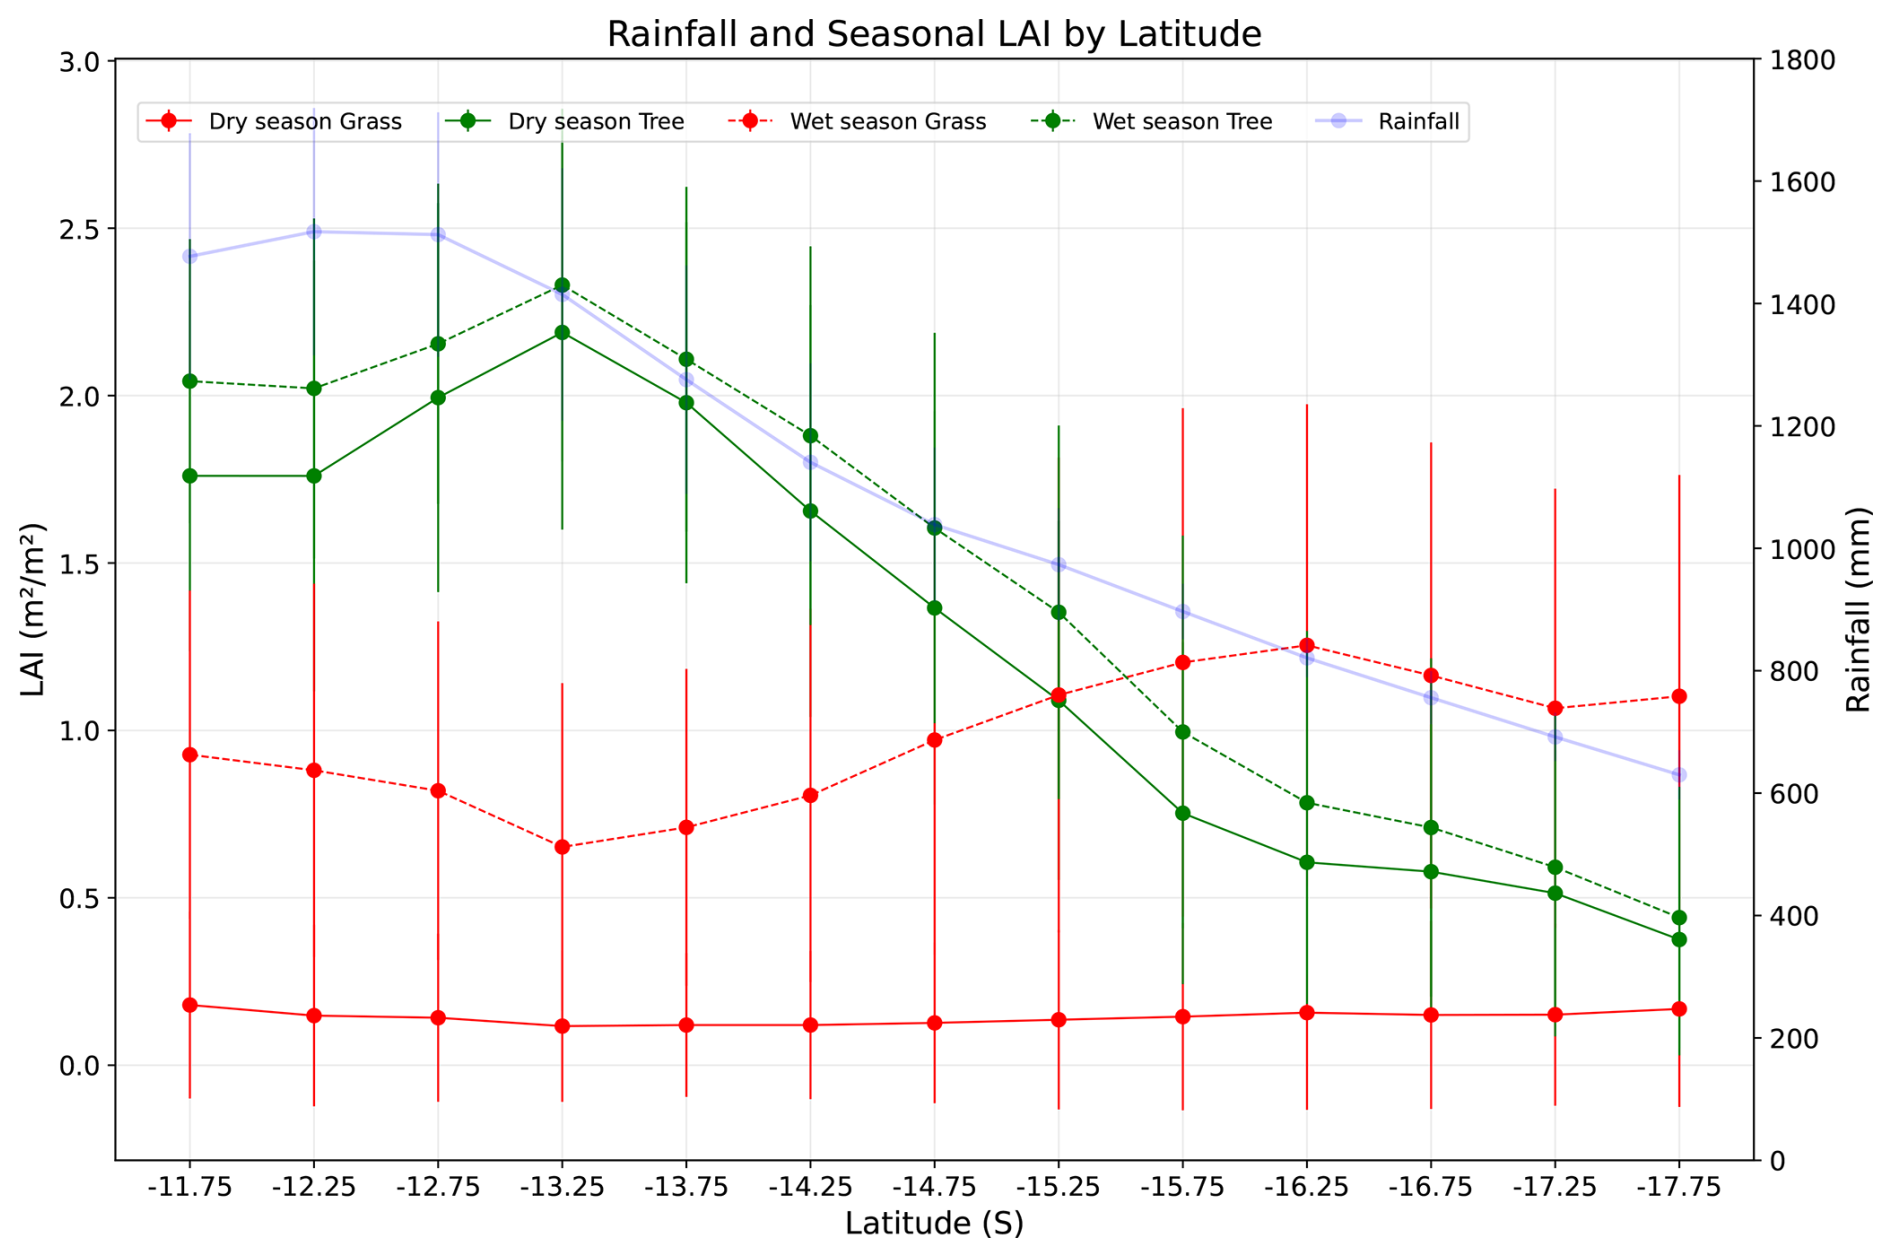
Figure 10Leaf area index in wet and dry seasons for trees and grass along the rainfall gradient (average across simulated grids from longitude 130.75 to 134.25° E) and their variability.
We evaluated the interactions between environmental variables and underlying mechanisms, and associated traits and life history strategies by defining and integrating regional PFTs with updated parameter values to represent local savanna composition using observations across the NATT. Our model confirmed that, along the gradient, rainfall is a major driving factor, creating an opposing gradient in terms of competition for light and nutrients at the northern end and water stress in the southern end during prolonged dry months. Consequently, ecosystem structure, composition, and productivity vary spatio-temporally. The variation in resource availability, especially water, along the gradient, impacts both the structure and composition of the savanna ecosystem, reflected by the dominance of trees and grass at respective ends of the gradient in terms of carbon mass production, LAI and FPC, presence of nitrogen-fixing mesic Trees at the wet end and the emergence of Acacia as a dominant tree genus at the dry end of the transect.
The simulated evapotranspiration, GPP, and fire flux agree with the observed decrease in these quantities with a decrease in rainfall, showing the dependency of the vegetation structure and composition on rainfall. Similarly, Haverd et al. (2016), Kanniah et al. (2011) and Ma et al. (2020) also observed decreasing trends and patterns in GPP along the gradient from north to south using both remote sensing and modelling approaches. Our model was able to capture both seasonal and temporal patterns of GPP and ET on the rainfall gradient with lower accuracy in dry months and at the dry end of the gradient, potentially reflecting the influences of inter-annual variability of rainfall. Similar to our study, Havard et al. (2016) found that both HAVANNA-POP and CABLE models also slightly overestimated ET and GPP at the dry end of the transect. This difference was attributed to the simplistic representation of the grass PFTs in this model. Moore et al. (2016) estimated that approximately 40 % of the total annual GPP in the Australian tropical savanna could be attributed to C4 grasses. The carbon flux from fires decreases with decreases in rainfall, as fuel load also decreases with rainfall. Deceukelier (2021) evaluated the performance of LPJ-GUESS with the BLAZE module for Australian ecosystems and noted that while the model captures key fire processes, it struggles to capture emissions at a finer spatial scale. The fire model tends to slightly underpredict emission, especially at the wet end of the gradient, potentially due to fire–climate interactions and higher inter-annual climatic variability (Canadell et al., 2021).
The seasonal difference in evapotranspiration (less than 50 g m−2 month−1 in dry months to 180 g m−2 month−1), monthly GPP, seasonal responses of grass, and LAI of grasses (less than 0.2 m2 m−2 in dry months and 1.2 m2 m−2 in wet months in dry end of gradient) show the role of rainfall patterns in ecosystem productivity and adaptation of vegetation in water availability conditions. This disparity in GPP, ET, and LAI between the dry and wet seasons at the dry end suggests a significant response of grasses to increased rainfall, resulting in a substantial expansion of leaf area and re-greening of existing leaf area by perennial grasses as an adaptation to water stress and a response to temporal dynamics in water availability. Ma et al. (2020) also reported that productivity along the NATT depends on rainfall and the response of grass to rainfall to the rainfall dynamics as grass in dry savanna exhibits a higher hydrological sensitivity with their contribution being strongly seasonal with around 75 %–80 % in wet season and 18 % in dry seasonal along the NATT (Moore et al., 2016).
The dominance of taller Eucalyptus and other medium eucalypt PFTs at the northern end of the gradient, with higher carbon mass production and a major contributor in FPC and LAI shows the competition for light with tall trees limiting light for understory growth and small trees. Eucalyptus miniate and Eucalyptus tetrodonta form the top canopy of more than 50 % cover (Hutley et al., 2000) with more than 500 stands per hectare in the wet region with Sorghum intrans, Sorghum plumosum, Heteropogon triticeus, and other C4 grasses making up the understory (TERN, 2024). Several studies have concluded that in closed-canopy forests where stand density is high, intense competition for light not only structures the vegetation but also determines the growth patterns and biomass partitioning (Matsuo et al., 2024; Woinarski et al., 2020). At the dry end of the gradient, grass, Acacia, and other deciduous tree PFTs have similar carbon mass production, with C4 grass dominating FPC and LAI. Hutley et al. (2011) reported that in the southern semi-arid region, shrublands and hummock and tussock grassland become increasingly prominent with scattered Acacia trees. Plot-based measurement of foliar cover (Munroe et al., 2021) data also shows that hummock and tussock grasses dominance increases in the drier end of the gradient. The relative contribution of different PFTs to FPC varies along the rainfall gradient, with tall and medium-size eucalypt (Tall_euc and Med_eve) PFTs contributing most to wet regions, but these contributions decline as aridity increases. This can be interpreted as an outcome of asymmetric competition for light and resources. Similarly, the relative contribution of drought-deciduous trees in LAI, FPC, and carbon mass production increases with a decrease in rainfall, showing the adaptation of the relevant taxa to water stress conditions. Eamus and Prior (2001) found that even though around 50 % of species in NATT savannas are deciduous, 90 % of the projected crown cover is formed by evergreen species, which exhibit water uptake throughout the year. The presence of fine roots even down to 9 m depth (Chen et al., 2004) suggests that the water table fluctuates by seasons, as woody species in savannas are able to acquire deep soil water, making them productive year-round, as suggested by Hutley et al. (2000) and Chen et al. (2002).
We found that the GPP, LAI, carbon mass, and FPC of trees decrease with a decrease in water availability, whereas the contribution of C4 grass and Acacia increases with increased aridity. During the wet season, particularly in the drier regions of the gradient, grasses display a noteworthy increase in LAI compared to trees, with values exceeding 1 m2 m−2 showing seasonal adaptation of grass in stress conditions. The decrease in GPP coincides with a decrease in LAI and FPC of tree components along the gradient, where, in the dry end of the gradient, the FPC of tree PFTs remains similar and the dominance of single PFTs decreases, showing evidence that competition for light among PFTs decreased from north to south. Taken together, the variations our model predicted along the rainfall gradient are consistent with the following interpretation: in the northern, high-rainfall end of the gradient, vegetation competes for light with shading effects on understory vegetation, including grass, whereas in the dry end, vegetations are adapted to stress and seasonal rainfall. Structurally and compositionally, tall and medium-sized eucalypts dominate the northern part and short and small trees the drier conditions of the south, in line with the differential strategies and traits of the respective groups. Variations in resource availability and intensity of competition along the productivity gradient not only shape the structure and composition of the ecosystem but also govern the productivity in varying environmental conditions (Michalet et al., 2021; Rees, 2013; Sauter et al., 2021). Similarly, other environmental factors such as temperature and disturbance, including fire (Emmett et al., 2021; Werner and Prior, 2013) may be responsible for changes in trees and grass productivity and an increase in the dominance of Acacia species with short height, ability to fix nitrogen, and reduced stomatal conductance in the dry end of the gradient.
Recognizing the seasonality in productivity, variability in interannual rainfall, adaptive strategies of trees, and the combined role of biotic and abiotic factors in shaping vegetation structure, composition, and productivity provided crucial insight for both ecological theory and practical implications. These insights can inform reforestation and restoration projects, ensuring the selection of species that are well-suited to local climatic conditions and capable of withstanding competition and resilient to stress associated with low soil moisture. Thus, our results are relevant to the management and conservation of NATT ecosystems and other similar savanna and woodland ecosystems.
Limitations
Our process-based modelling approach allowed us to reproduce ecosystem structure, composition, and functioning along the rainfall gradient and interpret underpinning mechanisms of plant community – and related ecosystem functional – responses in relation with differing environmental conditions. However, several limitations existed, and future work can improve the representation of spatio-temporal dynamics of composition, structure, and productivity of the savannas in contrasting gradients of competition and stress. A primary limitation is the dependency of PFT parameter values on limited observational trait data for tropical climatic conditions, as the model becomes less accurate (higher RMSE in dry conditions) as environmental conditions become more extreme, both regarding wet and dry conditions. We emulated deep water access by eucalypt trees by adding additional water to the soil profile, overriding the internally simulated hydrological dynamics. In tropical savannas, fine root biomass and abundance, and their depth depend on season, phenology, competition, and water availability (Eamus and Prior, 2001; Holdo, 2013) enabling plant access to deep water in dry seasons. Detailed observations of entire tree root profiles, replicated for a range of environments and hydroclimate episodes (such as positive and negative ENSO cycles) would be needed to adequately represent root dynamics under varying environmental stress. Such observations are unfortunately rare and were not available for the taxa and ecosystems we here studied. Deep water access by trees would ideally be better captured by explicitly prescribing or simulating groundwater reserves and tree-rooting strategies to access these, but this would require significant and novel extensions to the model, and, similar to root profiles, is likely to be data-limited. Prospects for including such details in regional models are currently limited by available data on groundwater distribution and depth, as well as detailed knowledge of the below-ground allocation patterns of the trees.
In our model setup, overall patterns in carbon flux from fire were captured by the BLAZE model. However, fire in these systems is a complex phenomenon influenced by multiple interacting drivers, including natural ignitions, vegetation structure, plant-specific traits, climate variability, and cultural practices such as indigenous burning (Deceukelier, 2021; Kelley et al., 2014; Murphy et al., 2023). However, parameterizing tree PFTs with traits representative of savanna species (e.g., adjusted wood density, leaf phenology, Huber value) has been shown to compensate for some of these limitations by improving the simulation of fire resilience and post-fire recovery (Deceukelier, 2021; Kelley et al., 2014). Accurately analyzing and attributing fire impacts, including disentangling them from climate-vegetation interactions, would require a dedicated analysis with further fire-specific simulations and data inputs. Similarly, post-fire recovery traits, particularly resprouting capacity, which are ecologically important in the Australian savanna system (Ondei et al., 2016; Tangney et al., 2022), are not explicitly included in the model setup due to limitations in observational data regarding phenology of carbohydrate storage under different conditions and remobilisation in response to different disturbances.
In our simulations, we used traits governing growth allometry that were inherited from the default global PFT parameter set of LPJ-GUESS. Local species and functional groups of our study region may show different allometric growth patterns. Allometry and associated plant biomass allocation (growth) strategies have an important influence on competition and carbon partitioning in different environmental conditions. Height, crown shape, and size of the tree depend on the space and growth conditions (Pretzsch et al., 2015), and competition for light not only structures the vegetation but also determines the growth patterns and biomass partitioning (Damgaard, 2003; Matsuo et al., 2024). Accurately describing allometric relations for growing trees would help us understand how light competition in high rainfall areas and free light availability in dry regions impact the composition, structure, and function of savannas over the stand development cycle. A subsequent study will explore how alternative allometries impact the simulation of growth efficiency, carbon partitioning, root development, and nutrient acquisition, thereby shaping competitive exclusion and the resulting structure and composition of PFTs at stand to landscape scales.
By integrating field-based trait observations with regional PFTs into LPJ-GUESS, we elucidated spatial and temporal patterns of vegetation structure, composition, and productivity along a savanna rainfall gradient. We found that tall and medium-sized eucalypts have higher contributions in LAI, FPC, and carbon mass production in high rainfall areas, whereas in drier areas, short Acacia trees and C4 grass dominated. GPP, ET, and LAI of trees decrease with a decrease in rainfall. Similar values of productivity-related variables for trees with a decrease in water availability may reflect adaptive strategies of trees that allow them to tolerate or avoid water stress, maintaining relatively strong productivity towards the dry end of the gradient. The increase in the relative contribution of grass to carbon mass, GPP, and LAI in the wet season illustrates differential seasonality in productivity of trees versus grasses, particularly at the dry end of the gradient. As a case study of how water availability as a key environmental driver, plant functional strategies, and resource capture interact to govern outcomes of savanna stand development and composition, this comprehensive analysis provides critical insights into the complex dynamics of savanna ecosystems. Our model was able to replicate key patterns of composition, structure, and function along the gradient, on a credible mechanistic basis. This suggests it could be a relevant tool to predict the impacts of climate change on savannas and guide mitigation, ecosystem management, and conservation strategies to ensure their future resilience and sustainability. Future research should focus on better characterising soil water reserves at depth, plant use of these, and on refining tree growth allometries to further enhance our understanding of savanna ecosystems and their response to environmental change.
The customized LPJ-GUESS version used in this study has been archived in the LPJ-GUESS Zenodo community (https://doi.org/10.5281/zenodo.17081548 (Paudel et al., 2025a). The forcing data, simulated output, that reproduce the analyses presented in the manuscript have been deposited in Zenodo (https://doi.org/10.5281/zenodo.17034489 (Paudel et al., 2025b). The evaluation data, the flux tower data, were collected from the OZ flux data portal (https://data.ozflux.org.au/home.jspx, last access: 5 September 2023), which belongs to the Australian Terrestrial Ecosystem Network (TERN), and the Traits data are freely available from Zenodo (https://doi.org/10.5281/zenodo.7368074; Falster et al., 2022).
The supplement related to this article is available online at https://doi.org/10.5194/bg-22-6153-2025-supplement.
PP: conceptualization and design (lead); data curation (lead); simulation (lead); formal analysis (lead); writing – original draft (lead); writing – review and editing (lead). SO: Supervision (supporting); writing – review and editing (supporting). MT: Supervision (supporting); writing – review and editing (supporting); Supervision (supporting); writing – review and editing (supporting). MP: Supervision (supporting); writing – review and editing (supporting). DM: Supervision (supporting); writing – review and editing (supporting). BS: Supervision (lead); conceptualization and design (equal); writing – original draft (equal); writing – review and editing (equal).
The contact author has declared that none of the authors has any competing interests.
Publisher's note: Copernicus Publications remains neutral with regard to jurisdictional claims made in the text, published maps, institutional affiliations, or any other geographical representation in this paper. While Copernicus Publications makes every effort to include appropriate place names, the final responsibility lies with the authors. Also, please note that this paper has not received English language copy-editing. Views expressed in the text are those of the authors and do not necessarily reflect the views of the publisher.
We thank Dr. Laura Williams, Dr. Juergen Knauer, Drew Holzworth, and Andrew Leahy for their guidance and support throughout this work.
This research has been supported by Western Sydney University as a PhD scholarship. Stefan Olin was supported by Modelling the Regional and Global Earth System (MERGE).
The publication of this article was funded by the Swedish Research Council, Forte, Formas, and Vinnova.
This paper was edited by David Medvigy and reviewed by two anonymous referees.
Argles, A. P. K., Moore, J. R., and Cox, P. M.: Dynamic Global Vegetation Models: Searching for the balance between demographic process representation and computational tractability, PLOS Clim., 1, e0000068, https://doi.org/10.1371/journal.pclm.0000068, 2022.
Asner, G. P., Anderson, C. B., Martin, R. E., Knapp, D. E., Tupayachi, R., Sinca, F., and Malhi, Y.: Landscape-scale changes in forest structure and functional traits along an Andes-to-Amazon elevation gradient, Biogeosciences, 11, 843–856, https://doi.org/10.5194/bg-11-843-2014, 2014.
Baudena, M., D'Andrea, F., and Provenzale, A.: An idealized model for tree-grass coexistence in savannas: The role of life stage structure and fire disturbances, J. Ecol., 98, 74–80, https://doi.org/10.1111/j.1365-2745.2009.01588.x, 2010.
Baudena, M., Dekker, S. C., van Bodegom, P. M., Cuesta, B., Higgins, S. I., Lehsten, V., Reick, C. H., Rietkerk, M., Scheiter, S., Yin, Z., Zavala, M. A., and Brovkin, V.: Forests, savannas, and grasslands: bridging the knowledge gap between ecology and Dynamic Global Vegetation Models, Biogeosciences, 12, 1833–1848, https://doi.org/10.5194/bg-12-1833-2015, 2015.
Beringer, J., Moore, C. E., Cleverly, J., Campbell, D. I., Cleugh, H., De Kauwe, M. G., Kirschbaum, M. U. F., Griebel, A., Grover, S., Huete, A., Hutley, L. B., Laubach, J., Van Niel, T., Arndt, S. K., Bennett, A. C., Cernusak, L. A., Eamus, D., Ewenz, C. M., Goodrich, J. P., Jiang, M., Hinko-Najera, N., Isaac, P., Hobeichi, S., Knauer, J., Koerber, G. R., Liddell, M., Ma, X., Macfarlane, C., McHugh, I. D., Medlyn, B. E., Meyer, W. S., Norton, A. J., Owens, J., Pitman, A., Pendall, E., Prober, S. M., Ray, R. L., Restrepo-Coupe, N., Rifai, S. W., Rowlings, D., Schipper, L., Silberstein, R. P., Teckentrup, L., Thompson, S. E., Ukkola, A. M., Wall, A., Wang, Y. P., Wardlaw, T. J., and Woodgate, W.: Bridge to the future: Important lessons from 20 years of ecosystem observations made by the OzFlux network, Glob. Change Biol., 28, 3489–3514, https://doi.org/10.1111/gcb.16141, 2022.
Bird, M. I., Brand, M., Comley, R., Fu, X., Hadeen, X., Jacobs, Z., Rowe, C., Wurster, C. M., Zwart, C., and Bradshaw, C. J. A.: Late Pleistocene emergence of an anthropogenic fire regime in Australia's tropical savannahs, Nat. Geosci., 17, 233–240, https://doi.org/10.1038/s41561-024-01388-3, 2024.
Bond, W. J.: What limits trees in C4 grasslands and savannas?, Annu. Rev. Ecol. Evol. Syst., 39, 641–659, https://doi.org/10.1146/annurev.ecolsys.39.110707.173411, 2008.
Bureau of Meteorology (BOM): Climate Data Services, http://www.bom.gov.au, last access: 31 March 2024.
Canadell, J. G., Meyer, C. P., Cook, G. D., Dowdy, A., Briggs, P. R., Knauer, J., Pepler, A., and Haverd, V.: Multi-decadal increase of forest burned area in Australia is linked to climate change, Nat. Commun., 12, https://doi.org/10.1038/s41467-021-27225-4, 2021.
Chen, X., Eamus, D., and Hutley, L. B.: Seasonal patterns of soil carbon dioxide efflux from a wet-dry tropical savanna of northern Australia, Aust. J. Bot., 50, 43, https://doi.org/10.1071/BT01049, 2002.
Chen, X., Eamus, D., and Hutley, L. B.: Seasonal patterns of fine-root productivity and turnover in a tropical savanna of northern Australia, J. Trop. Ecol., 20, 221–224, https://doi.org/10.1017/S0266467403001135, 2004.
Clark, D. B., Hurtado, J., and Saatchi, S. S.: Tropical rain forest structure, tree growth and dynamics along a 2700-m elevational transect in Costa Rica, PLoS ONE, 10, 1–18, https://doi.org/10.1371/journal.pone.0122905, 2015.
Damgaard, C.: Modeling plant competition along an environmental gradient, Ecol. Model., 170, 45–53, https://doi.org/10.1016/S0304-3800(03)00299-0, 2003.
Deceukelier, R.: MODELLING AUSTRALIAN SAVANNA BUSHFIRES USING LPJ-GUESS, Masters Thesis, Ghent University, 102 pp., 2021.
Department of Climate Change, Energy, the Environment and Water (DCCEEW): Australian National Vegetation Information System (NVIS), http://www.dcceew.gov.au, last access: 10 March 2024.
Eamus, D. and Prior, L.: Ecophysiology of trees of seasonally dry tropics: Comparisons among phenologies, in: Advances in Ecological Research, vol. 32, Elsevier, 113–197, https://doi.org/10.1016/S0065-2504(01)32012-3, 2001.
Emmett, K. D., Renwick, K. M., and Poulter, B.: Adapting a dynamic vegetation model for regional biomass, plant biogeography, and fire modeling in the Greater Yellowstone Ecosystem: Evaluating LPJ-GUESS-LMfireCF, Ecol. Model., 440, 109417, https://doi.org/10.1016/j.ecolmodel.2020.109417, 2021.
Falster, D., Gallagher, R., Wenk, E. H., Wright, I. J., Indiarto, D., Andrew, S. C., Baxter, C., Lawson, J., Allen, S., Fuchs, A., Monro, A., Kar, F., Adams, M. A., Ahrens, C. W., Alfonzetti, M., Angevin, T., Apgaua, D. M. G., Arndt, S., Atkin, O. K., Atkinson, J., Auld, T., Baker, A., von Balthazar, M., Bean, A., Blackman, C. J., Bloomfield, K., Bowman, D. M. J. S., Bragg, J., Brodribb, T. J., Buckton, G., Burrows, G., Caldwell, E., Camac, J. S., Carpenter, R., Catford, J. A., Cawthray, G. R., Cernusak, L. A., Chandler, G., Chapman, A. R., Cheal, D., Cheesman, A. W., Chen, S.-C., Choat, B., Clinton, B., Clode, P. L., Coleman, H., Cornwell, W. K., Cosgrove, M., Crisp, M., Cross, E., Crous, K. Y., Cunningham, S., Curran, T., Curtis, E., Daws, M. I., DeGabriel, J. L., Denton, M. D., Dong, N., Du, P., Duan, H., Duncan, D. H., Dwyer, J. M., Eamus, D., Edwards, C., Esperon-Rodriguez, M., Evans, J. R., Everingham, S. E., Farrell, C., Firn, J., Fonseca, C. R., French, B. J., Frood, D., Funk, J. L., Ghannoum, O., Gleason, S. M., Gosper, C. R., Gray, E., Groom, P. K., Grootemaat, S., Gross, C., Guerin, G., Guja, L., Hahs, A. K., Harrison, M. T., Hayes, P. E., Henery, M., Hochuli, D., Howell, J., Huang, G., Hughes, L., Huisman, J., Ilic, J., Jagdish, A., Jin, D., Jordan, G., Jurado, E., Kanowski, J., Kasel, S., Kellermann, J., Kenny, B., Kohout, M., Kooyman, R. M., Kotowska, M. M., Lai, H. R., Laliberté, E., Lambers, H., Lamont, B. B., Lanfear, R., van Langevelde, F., Laughlin, D. C., Laugier-Kitchener, B., Laurance, S., Lehmann, C. E., Milberg, P., Mokany, K., Moles, A. T., Moore, B. D., Moore, N., Morgan, J. W., Morris, W., Muir, A., Munroe, S., Nicholson, Á., Nicolle, D., Nicotra, A. B., Niinemets, Ü., North, T., O’Reilly-Nugent, A., O’Sullivan, O. S., Oberle, B., Onoda, Y., Ooi, M. K. J., Osborne, C. P., Paczkowska, G., Pekin, B., Pereira, C. G., Pickering, C., Pickup, M., Pollock, L. J., Poot, P., Powell, J. R., Power, S. A., Prentice, I. C., Prior, L., Prober, S. M., Read, J., Reynolds, V., Richards, A. E., Richardson, B., Roderick, M. L., Rossell, J. A., Rossetto, M., Rye, B., Rymer, P. D., Sams, M. A., Sanson, G., Sauquet, H., Schmidt, S., Schönenberger, J., Schulze, E.-D., Sendall, K., Sinclair, S., Smith, B., Smith, R., Soper, F., Sparrow, B., Standish, R. J., Staples, T. L., Stephens, R., Szota, C., Taseski, G., Tasker, E., Thomas, F., Tissue, D. T., Tjoelker, M. G., Tng, D. Y. P., Tombeur, F. D., Tomlinson, K., Turner, N. C., Veneklaas, E. J., Venn, S., Vesk, P., Vlasveld, C., Vorontsova, M. S., Warren, C. A., Warwick, N., Weerasinghe, L.K., Wells, J., Westoby, M., White, M., Williams, N. S. G., Wills, J., Wilson, P. G., Yates, C., Zanne, A. E., Zemunik, G., and Ziemińska, K.: AusTraits, a curated plant trait database for the Australian flora, Sci. Data, 8, 1–20, https://doi.org/10.1038/s41597-021-01006-6, 2021a.
Falster, D., Gallagher, R., Wenk, E., and Sauquet, H.: AusTraits: a curated plant trait database for the Australian flora, Zenodo [data set], https://doi.org/10.5281/zenodo.7368074, 2022.
Falster, D. S., Kunstler, G., Fitz John, R. G., and Westoby, M.: Emergent shapes of trait-based competition functions from resource-based models: A gaussian is not normal in plant communities, Am. Nat., 198, 253–267, https://doi.org/10.1086/714868, 2021b.
February, E. C., Higgins, S. I., Newton, R., and West, A. G.: Tree distribution on a steep environmental gradient in an arid savanna, J. Biogeogr., 34, 270–278, https://doi.org/10.1111/j.1365-2699.2006.01583.x, 2007.
Fisher, R. A., McDowell, N., Purves, D., Moorcroft, P., Sitch, S., Cox, P., Huntingford, C., Meir, P., and Ian Woodward, F.: Assessing uncertainties in a second-generation dynamic vegetation model caused by ecological scale limitations, New Phytol., 187, 666–681, https://doi.org/10.1111/j.1469-8137.2010.03340.x, 2010.
Fisher, R. A., Koven, C. D., Anderegg, W. R. L., Christoffersen, B. O., Dietze, M. C., Farrior, C. E., Holm, J. A., Hurtt, G. C., Knox, R. G., Lawrence, P. J., Lichstein, J. W., Longo, M., Matheny, A. M., Medvigy, D., Muller-Landau, H. C., Powell, T. L., Serbin, S. P., Sato, H., Shuman, J. K., Smith, B., Trugman, A. T., Viskari, T., Verbeeck, H., Weng, E., Xu, C., Xu, X., Zhang, T., and Moorcroft, P. R.: Vegetation demographics in Earth System Models: A review of progress and priorities, Glob. Change Biol., 24, 35–54, https://doi.org/10.1111/gcb.13910, 2018.
Friedlingstein, P., O'Sullivan, M., Jones, M. W., Andrew, R. M., Bakker, D. C. E., Hauck, J., Landschützer, P., Le Quéré, C., Luijkx, I. T., Peters, G. P., Peters, W., Pongratz, J., Schwingshackl, C., Sitch, S., Canadell, J. G., Ciais, P., Jackson, R. B., Alin, S. R., Anthoni, P., Barbero, L., Bates, N. R., Becker, M., Bellouin, N., Decharme, B., Bopp, L., Brasika, I. B. M., Cadule, P., Chamberlain, M. A., Chandra, N., Chau, T.-T.-T., Chevallier, F., Chini, L. P., Cronin, M., Dou, X., Enyo, K., Evans, W., Falk, S., Feely, R. A., Feng, L., Ford, D. J., Gasser, T., Ghattas, J., Gkritzalis, T., Grassi, G., Gregor, L., Gruber, N., Gürses, Ö., Harris, I., Hefner, M., Heinke, J., Houghton, R. A., Hurtt, G. C., Iida, Y., Ilyina, T., Jacobson, A. R., Jain, A., Jarníková, T., Jersild, A., Jiang, F., Jin, Z., Joos, F., Kato, E., Keeling, R. F., Kennedy, D., Klein Goldewijk, K., Knauer, J., Korsbakken, J. I., Körtzinger, A., Lan, X., Lefèvre, N., Li, H., Liu, J., Liu, Z., Ma, L., Marland, G., Mayot, N., McGuire, P. C., McKinley, G. A., Meyer, G., Morgan, E. J., Munro, D. R., Nakaoka, S.-I., Niwa, Y., O'Brien, K. M., Olsen, A., Omar, A. M., Ono, T., Paulsen, M., Pierrot, D., Pocock, K., Poulter, B., Powis, C. M., Rehder, G., Resplandy, L., Robertson, E., Rödenbeck, C., Rosan, T. M., Schwinger, J., Séférian, R., Smallman, T. L., Smith, S. M., Sospedra-Alfonso, R., Sun, Q., Sutton, A. J., Sweeney, C., Takao, S., Tans, P. P., Tian, H., Tilbrook, B., Tsujino, H., Tubiello, F., van der Werf, G. R., van Ooijen, E., Wanninkhof, R., Watanabe, M., Wimart-Rousseau, C., Yang, D., Yang, X., Yuan, W., Yue, X., Zaehle, S., Zeng, J., and Zheng, B.: Global Carbon Budget 2023, Earth Syst. Sci. Data, 15, 5301–5369, https://doi.org/10.5194/essd-15-5301-2023, 2023.
Giglio, L., Randerson, J. T., and Van Der Werf, G. R.: Analysis of daily, monthly, and annual burned area using the fourth-generation global fire emissions database (GFED4), J. Geophys. Res.-Biogeosciences, 118, 317–328, https://doi.org/10.1002/jgrg.20042, 2013.
Harrison, S. P., Prentice, I. C., Bloomfield, K. J., Dong, N., Forkel, M., Forrest, M., Ningthoujam, R. K., Pellegrini, A., Shen, Y., Baudena, M., Cardoso, A. W., Huss, J. C., Joshi, J., Oliveras, I., Pausas, J. G., and Simpson, K. J.: Understanding and modelling wildfire regimes: an ecological perspective, Environ. Res. Lett., 16, 125008, https://doi.org/10.1088/1748-9326/ac39be, 2021.
Haverd, V., Smith, B., Nieradzik, L. P., and Briggs, P. R.: A stand-alone tree demography and landscape structure module for Earth system models: integration with inventory data from temperate and boreal forests, Biogeosciences, 11, 4039–4055, https://doi.org/10.5194/bg-11-4039-2014, 2014.
Haverd, V., Smith, B., Raupach, M., Briggs, P., Nieradzik, L., Beringer, J., Hutley, L., Trudinger, C. M., and Cleverly, J.: Coupling carbon allocation with leaf and root phenology predicts tree–grass partitioning along a savanna rainfall gradient, Biogeosciences, 13, 761–779, https://doi.org/10.5194/bg-13-761-2016, 2016.
Haverd, V., Smith, B., Raupach, M., Briggs, P., Nieradzik, L., Beringer, J., Hutley, L., Trudinger, C. M., and Cleverly, J.: Coupling carbon allocation with leaf and root phenology predicts tree–grass partitioning along a savanna rainfall gradient, Biogeosciences, 13, 761–779, https://doi.org/10.5194/bg-13-761-2016, 2016.
Holdo, R. M.: Revisiting the Two-Layer Hypothesis: Coexistence of Alternative Functional Rooting Strategies in Savannas, PLoS ONE, 8, https://doi.org/10.1371/journal.pone.0069625, 2013.
Holdo, R. M. and Nippert, J. B.: Linking resource- and disturbance-based models to explain tree–grass coexistence in savannas, New Phytol., 237, 1966–1979, https://doi.org/10.1111/nph.18648, 2023.
Hutley, L. B., O'Grady, A. P., and Eamus, D.: Evapotranspiration from Eucalypt open-forest savanna of Northern Australia, Funct. Ecol., 14, 183–194, https://doi.org/10.1046/j.1365-2435.2000.00416.x, 2000.
Hutley, L. B., Beringer, J., Isaac, P. R., Hacker, J. M., and Cernusak, L. A.: A sub-continental scale living laboratory: Spatial patterns of savanna vegetation over a rainfall gradient in northern Australia, Agric. For. Meteorol., 151, 1417–1428, https://doi.org/10.1016/j.agrformet.2011.03.002, 2011.
Isaac, P., Cleverly, J., McHugh, I., van Gorsel, E., Ewenz, C., and Beringer, J.: OzFlux data: network integration from collection to curation, Biogeosciences, 14, 2903–2928, https://doi.org/10.5194/bg-14-2903-2017, 2017.
Jackson, R. B., Canadell, J., Ehleringer, J. R., Mooney, H. A., Sala, O. E., and Schulze, E. D.: A global analysis of root distributions for terrestrial biomes, Oecologia, 108, 389–411, https://doi.org/10.1007/BF00333714, 1996.
Janos, D. P., Scott, J., and Bowman, D. M. J. S.: Temporal and spatial variation of fine roots in a northern Australian Eucalyptus tetrodonta savanna, J. Trop. Ecol., 24, 177–188, https://doi.org/10.1017/S0266467408004860, 2008.
Kanniah, K. D., Beringer, J., and Hutley, L. B.: Environmental controls on the spatial variability of savanna productivity in the Northern Territory, Australia, Agric. For. Meteorol., 151, 1429–1439, https://doi.org/10.1016/j.agrformet.2011.06.009, 2011.
Kelley, D. I., Harrison, S. P., and Prentice, I. C.: Improved simulation of fire–vegetation interactions in the Land surface Processes and eXchanges dynamic global vegetation model (LPX-Mv1), Geosci. Model Dev., 7, 2411–2433, https://doi.org/10.5194/gmd-7-2411-2014, 2014.
Knorr, W., Kaminski, T., Arneth, A., and Weber, U.: Impact of human population density on fire frequency at the global scale, Biogeosciences, 11, 1085–1102, https://doi.org/10.5194/bg-11-1085-2014, 2014.
Koch, G. W., Vitousek, P. M., Steffen, W. L., and Walker, B. H.: Terrestrial transects for global change research, Vegetatio, 121, 53–65, https://doi.org/10.1007/BF00044672, 1995.
Kuppler, J., Albert, C. H., Ames, G. M., Armbruster, W. S., Boenisch, G., Boucher, F. C., Campbell, D. R., Carneiro, L. T., Chacón-Madrigal, E., Enquist, B. J., Fonseca, C. R., Gómez, J. M., Guisan, A., Higuchi, P., Karger, D. N., Kattge, J., Kleyer, M., Kraft, N. J. B., Larue-Kontić, A. C., Lázaro, A., Lechleitner, M., Loughnan, D., Minden, V., Niinemets, Ü., Overbeck, G. E., Parachnowitsch, A. L., Perfectti, F., Pillar, V. D., Schellenberger Costa, D., Sletvold, N., Stang, M., Alves-dos-Santos, I., Streit, H., Wright, J., Zych, M., and Junker, R. R.: Global gradients in intraspecific variation in vegetative and floral traits are partially associated with climate and species richness, Glob. Ecol. Biogeogr., 29, 992–1007, https://doi.org/10.1111/geb.13077, 2020.
Ma, X., Huete, A., Moore, C. E., Cleverly, J., Hutley, L. B., Beringer, J., Leng, S., Xie, Z., Yu, Q., and Eamus, D.: Spatiotemporal partitioning of savanna plant functional type productivity along NATT, Remote Sens. Environ., 246, 111855, https://doi.org/10.1016/j.rse.2020.111855, 2020.
Maharjan, S. K., Sterck, F. J., Dhakal, B. P., Makri, M., and Poorter, L.: Functional traits shape tree species distribution in the Himalayas, J. Ecol., 109, 3818–3834, https://doi.org/10.1111/1365-2745.13759, 2021.
Matsuo, T., Bongers, F., Martínez-Ramos, M., Van Der Sande, M. T., and Poorter, L.: Height growth and biomass partitioning during secondary succession differ among forest light strata and successional guilds in a tropical rainforest, Oikos, 2024, e10486, https://doi.org/10.1111/oik.10486, 2024.
Michalet, R., Delerue, F., Liancourt, P., and Pugnaire, F. I.: Are complementarity effects of species richness on productivity the strongest in species-rich communities?, J. Ecol., 109, 2038–2046, https://doi.org/10.1111/1365-2745.13658, 2021.
Moore, C. E., Beringer, J., Evans, B., Hutley, L. B., McHugh, I., and Tapper, N. J.: The contribution of trees and grasses to productivity of an Australian tropical savanna, Biogeosciences, 13, 2387–2403, https://doi.org/10.5194/bg-13-2387-2016, 2016.
Muñoz Mazón, M., Klanderud, K., Finegan, B., Veintimilla, D., Bermeo, D., Murrieta, E., Delgado, D., and Sheil, D.: How forest structure varies with elevation in old growth and secondary forest in Costa Rica, For. Ecol. Manag., 469, 118191, https://doi.org/10.1016/j.foreco.2020.118191, 2020.
Munroe, S., Guerin, G., Saleeba, T., Martín-Forés, I., Blanco-Martin, B., Sparrow, B., and Tokmakoff, A.: ausplotsR: An R package for rapid extraction and analysis of vegetation and soil data collected by Australia's Terrestrial Ecosystem Research Network, J. Veg. Sci., 32, e13046, https://doi.org/10.1111/jvs.13046, 2021.
Murphy, B. P., Whitehead, P. J., Evans, J., Yates, C. P., Edwards, A. C., MacDermott, H. J., Lynch, D. C., and Russell-Smith, J.: Using a demographic model to project the long-term effects of fire management on tree biomass in Australian savannas, Ecol. Monogr., 93, e1564, https://doi.org/10.1002/ecm.1564, 2023.
Myneni, R., Knyazikhin, Y., and Park, T.: MYD15A2H MODIS/Aqua Leaf Area Index/FPAR 8-Day L4 Global 500m SIN Grid V006, NASA Land Processes Distributed Active Archive Center [data set], https://doi.org/10.5067/MODIS/MYD15A2H.006, 2015.
Nijzink, R. C., Beringer, J., Hutley, L. B., and Schymanski, S. J.: Does maximization of net carbon profit enable the prediction of vegetation behaviour in savanna sites along a precipitation gradient?, Hydrol. Earth Syst. Sci., 26, 525–550, https://doi.org/10.5194/hess-26-525-2022, 2022.
Ondei, S., Prior, L. D., Vigilante, T., and Bowman, D. M. J. S.: Post-fire resprouting strategies of rainforest and savanna saplings along the rainforest–savanna boundary in the Australian monsoon tropics, Plant Ecol., 217, 711–724, https://doi.org/10.1007/s11258-015-0531-3, 2016.
Paudel, P., Olin, S., and Smith, B.: LPJ-GUESS Model Code for Savanna Ecosystem of Northern Australia, Zenodo [code], https://doi.org/10.5281/zenodo.17081548, 2025a.
Paudel, P., Olin, S., and Smith, B.: Forcing_data_and_model_output_for_Savanna ecosystem_northern_Australia, Zenodo [data set], https://doi.org/10.5281/zenodo.17034489, 2025b.
Peel, D. R., Pitman, A. J., Hughes, L. A., Narisma, G. T., and Pielke, R. A.: The impact of realistic biophysical parameters for eucalypts on the simulation of the January climate of Australia, Environ. Model. Softw., 20, 595–612, https://doi.org/10.1016/j.envsoft.2004.03.004, 2005.
Pretzsch, H., Biber, P., Uhl, E., Dahlhausen, J., Rötzer, T., Caldentey, J., Koike, T., van Con, T., Chavanne, A., Seifert, T., Toit, B. du, Farnden, C., and Pauleit, S.: Crown size and growing space requirement of common tree species in urban centres, parks, and forests, Urban For. Urban Green., 14, 466–479, https://doi.org/10.1016/j.ufug.2015.04.006, 2015.
Pugh, T. A. M., Arneth, A., Kautz, M., Poulter, B., and Smith, B.: Important role of forest disturbances in the global biomass turnover and carbon sinks, Nat. Geosci., 12, 730–735, https://doi.org/10.1038/s41561-019-0427-2, 2019.
Rabin, S. S., Melton, J. R., Lasslop, G., Bachelet, D., Forrest, M., Hantson, S., Kaplan, J. O., Li, F., Mangeon, S., Ward, D. S., Yue, C., Arora, V. K., Hickler, T., Kloster, S., Knorr, W., Nieradzik, L., Spessa, A., Folberth, G. A., Sheehan, T., Voulgarakis, A., Kelley, D. I., Prentice, I. C., Sitch, S., Harrison, S., and Arneth, A.: The Fire Modeling Intercomparison Project (FireMIP), phase 1: experimental and analytical protocols with detailed model descriptions, Geosci. Model Dev., 10, 1175–1197, https://doi.org/10.5194/gmd-10-1175-2017, 2017.
Rees, M.: Competition on productivity gradients-what do we expect?, Ecol. Lett., 16, 291–298, https://doi.org/10.1111/ele.12037, 2013.
Rogers, C. D. W. and Beringer, J.: Describing rainfall in northern Australia using multiple climate indices, Biogeosciences, 14, 597–615, https://doi.org/10.5194/bg-14-597-2017, 2017.
Sauter, F., Albrecht, H., Kollmann, J., and Lang, M.: Competition components along productivity gradients – revisiting a classic dispute in ecology, Oikos, 130, 1326–1334, https://doi.org/10.1111/oik.07706, 2021.
Sitch, S., Smith, B., Prentice, I. C., Arneth, A., Bondeau, A., Cramer, W., Kaplan, J. O., Levis, S., Lucht, W., Sykes, M. T., Thonicke, K., and Venevsky, S.: Evaluation of ecosystem dynamics, plant geography and terrestrial carbon cycling in the LPJ dynamic global vegetation model, Glob. Change Biol., 9, 161–185, https://doi.org/10.1046/j.1365-2486.2003.00569.x, 2003.
Smith, B., Prentice, I. C., and Sykes, M. T.: Representation of vegetation dynamics in the modelling of terrestrial ecosystems: Comparing two contrasting approaches within European climate space, Glob. Ecol. Biogeogr., 10, 621–637, https://doi.org/10.1046/j.1466-822X.2001.00256.x, 2001.
Smith, B., Wårlind, D., Arneth, A., Hickler, T., Leadley, P., Siltberg, J., and Zaehle, S.: Implications of incorporating N cycling and N limitations on primary production in an individual-based dynamic vegetation model, Biogeosciences, 11, 2027–2054, https://doi.org/10.5194/bg-11-2027-2014, 2014.
Snell, R. S., Huth, A., Nabel, J. E. M. S., Bocedi, G., Travis, J. M. J., Gravel, D., Bugmann, H., Gutiérrez, A. G., Hickler, T., Higgins, S. I., Reineking, B., Scherstjanoi, M., Zurbriggen, N., and Lischke, H.: Using dynamic vegetation models to simulate plant range shifts, Ecography, 37, 1184–1197, https://doi.org/10.1111/ecog.00580, 2014.
Tangney, R., Paroissien, R., Le Breton, T. D., Thomsen, A., Doyle, C. A. T., Ondik, M., Miller, R. G., Miller, B. P., and Ooi, M. K. J.: Success of post-fire plant recovery strategies varies with shifting fire seasonality, Commun. Earth Environ., 3, 126, https://doi.org/10.1038/s43247-022-00453-2, 2022.
TERN Australia (Eds.): TERN AusPlots ecosystem surveillance monitoring dataset, TERN Australia, https://field.jrsrp.com/, last access: 10 March 2024.
Vernooij, R., Eames, T., Russell-Smith, J., Yates, C., Beatty, R., Evans, J., Edwards, A., Ribeiro, N., Wooster, M., Strydom, T., Giongo, M. V., Borges, M. A., Menezes Costa, M., Barradas, A. C. S., van Wees, D., and Van der Werf, G. R.: Dynamic savanna burning emission factors based on satellite data using a machine learning approach, Earth Syst. Dynam., 14, 1039–1064, https://doi.org/10.5194/esd-14-1039-2023, 2023.
Wang, B., Smith, B., Waters, C., Feng, P., and Liu, D. L.: Modelling changes in vegetation productivity and carbon balance under future climate scenarios in southeastern Australia, Sci. Total Environ., 924, 171748, https://doi.org/10.1016/j.scitotenv.2024.171748, 2024.
Werner, P. A. and Prior, L. D.: Demography and growth of subadult savanna trees: Interactions of life history, size, fire season, and grassy understory, Ecol. Monogr., 83, 67–93, https://doi.org/10.1890/12-1153.1, 2013.
Whitley, R., Beringer, J., Hutley, L. B., Abramowitz, G., De Kauwe, M. G., Duursma, R., Evans, B., Haverd, V., Li, L., Ryu, Y., Smith, B., Wang, Y.-P., Williams, M., and Yu, Q.: A model inter-comparison study to examine limiting factors in modelling Australian tropical savannas, Biogeosciences, 13, 3245–3265, https://doi.org/10.5194/bg-13-3245-2016, 2016.
Whitley, R., Beringer, J., Hutley, L. B., Abramowitz, G., De Kauwe, M. G., Evans, B., Haverd, V., Li, L., Moore, C., Ryu, Y., Scheiter, S., Schymanski, S. J., Smith, B., Wang, Y.-P., Williams, M., and Yu, Q.: Challenges and opportunities in land surface modelling of savanna ecosystems, Biogeosciences, 14, 4711–4732, https://doi.org/10.5194/bg-14-4711-2017, 2017.
Williams, R. J., Myers, B. A., Muller, W. J., Duff, G. A., and Eamus, D.: Leaf Phenology of Woody Species in a North Australian Tropical Savanna, Ecology, 78, 2542–2558, 1997.
Woinarski, J. C. Z., Andersen, A. N., and Murphy, B. P.: The Tropical Savannas of Northern Australia, in: Encyclopedia of the World's Biomes, Elsevier, 827–834, https://doi.org/10.1016/B978-0-12-409548-9.12023-8, 2020.
Zhu, L., Zhang, Y., Ye, H., Li, Y., Hu, W., Du, J., and Zhao, P.: Variations in leaf and stem traits across two elevations in subtropical forests, Funct. Plant Biol., 49, 319–332, https://doi.org/10.1071/FP21220, 2022.