the Creative Commons Attribution 4.0 License.
the Creative Commons Attribution 4.0 License.
 | 05 Nov 2025
Technical note: New insights into stomatal oxygen transport viewed as a multicomponent diffusion process
Jordi Vilà-Guerau de Arellano
Roderick Dewar
Kim A. P. Faassen
Teemu Hölttä
Remco de Kok
Ingrid T. Luijkx
Timo Vesala
We investigate oxygen (O2) transport through stomata, focusing on its interaction with water vapour (H2O) flux. The dominant H2O flux exerts a drag force on other gases, a well-studied effect in the ternary air–water vapor–carbon dioxide (CO2) system but unexplored for O2 transport. This study aims to: (1) apply the Stefan-Maxwell equations to a quaternary system of H2O, O2, CO2, and N2; (2) identify conditions where O2 transport from stomata to the atmosphere occurs against its mole fraction gradient (“uphill”); and (3) derive an expression linking the O2 mole fraction in sub-stomatal air spaces (xoi) to that in the atmosphere (xoa) based on atmospheric relative humidity.
Our theoretical results, constrained by typical values from previous flux observations of this quaternary system, reveal distinct transport regimes defined by the mole flux ratio of H2O and O2 (). Uphill O2 diffusion occurs in the common regime where , and internal O2 mole fraction increases towards its atmospheric value as relative humidity tends to 100 %. These theoretical results offer a framework for interpreting laboratory and field experiments on stomatal O2 exchange under stagnant atmospheric or low Reynolds number conditions and can support the development of more physically accurate models of leaf–atmosphere oxygen exchange.
- Article
(724 KB) - Full-text XML
- BibTeX
- EndNote


The terrestrial biosphere exchange of water (H2O), carbon dioxide (CO2) and oxygen (O2), plays a crucial role in the global water and carbon cycles. These cycles integrate processes across scales, from the stomatal level to the global atmosphere. Transport between stomata and the atmosphere represents the smallest-scale process governing the exchange of greenhouse gases. When scaled up to leaf and canopy levels, this stomata-atmosphere interaction modifies surface fluxes, which directly influence the diurnal variability of carbon tracers (Faassen et al., 2023) and impacts weather (Jacobs and de Bruin, 1997; Boussetta et al., 2013) and climate-carbon patterns (Bonan et al., 2024). Advancing our understanding of these interactions requires a more integrated approach that bridges ecophysiology and transport dynamics across multiple scales (Vilà-Guerau de Arellano et al., 2023; Miralles et al., 2025). In doing so, we improve the representation of carbon tracers across a wide range of scales.
While the exchange of CO2 (Goudriaan, 1977; von Caemmerer and Farquhar, 1981) and H2O (Jarvis and McNaughton, 1986), typically quantified through molar flux density, has been extensively studied and well-characterized, the transport of O2 between stomata and the atmosphere has received comparatively little attention. Recent advances now allow biosphere-atmosphere exchange of O2 to be measured with increasing accuracy (Stephens et al., 2007; Ishidoya et al., 2013; Battle et al., 2019; Faassen et al., 2023), supported by conceptual land-atmosphere modelling studies (Yan et al., 2023; Faassen et al., 2024). This provides a unique opportunity to study the H2O-CO2-O2 system through a complete and integrated approach, advancing our understanding of processes related to photosynthesis and the transport of carbon tracers. Notably, O2 transport exhibits distinct characteristics: O2 exists at a much higher mole fraction in the atmosphere than either CO2 or water vapour, yet its flux is of the same order of magnitude as that of CO2 and typically two to three orders of magnitude smaller than the water vapour flux. As a result, the O2 flux may be influenced by fluxes of other gases. The significance of this issue can strongly affect the interpretation of O2 exchange on stomatal level, as was recently highlighted by Vesala (2024), whereas on the scale of canopy exchange the O2-transport is dominated by turbulent fluxes (Ishidoya et al., 2013; Faassen et al., 2023).
The stomatal–atmosphere exchange is affected by molecular interaction between gases (also referred to as species). This exchange is primarily driven by the dominant effect of water (i.e. stomatal transpiration) relative to the individual fluxes of O2 and CO2. Specifically, transpiration at the stomatal level generates drag forces (also referred to as frictional forces) and a bulk displacement of air known as Stefan (or molar) flow. This process leads to gradients between the sub-stomatal cavity and the atmosphere mole fractions, thereby modifying their diffusive transport. Traditionally, the relationship between the flux of a given species and its mole fraction gradient is described by Fick’s law, but the additional drag forces associated with multicomponent interactions can lead to the emergence of more complex (non-Fickian) flux–gradient relationships. Accurately interpreting measurements of O2, CO2, and H2O, as well as their representation in models, requires these species–species interactions to be taken into account, e.g. Jarman (1974). In this framework, the Stefan–Maxwell equations provide a more complete description than Fick’s law, unifying the effects of molar flow, interspecies drag (friction), and diffusive flux into a single formulation. Fick’s law can be deduced from the Stefan–Maxwell equations as an approximation.
To address this in the case of O2, we investigate the transport of O2, CO2, H2O, and the inert carrier nitrogen (N2) between the leaf intercellular space within the stomata and the atmosphere. Our approach is based on the well-established theory of multicomponent diffusion (Jarman, 1974). Mathematically, the theory is encapsulated in the Stefan–Maxwell equations, which describe the net balance between the thermodynamic force (i.e. mole fraction gradient) on a given species that drives its diffusion and the momentum exchange (frictional drag) arising from binary collisions with all the other species, which depends on their relative molar velocities. Previous studies have shown that Stefan flow can play a significant role in CO2 transport at the stomatal level (Jarman, 1974), and may also be relevant at larger atmospheric scales – from the canopy to the atmospheric boundary layer – as well as for key compounds involved in the photosynthesis cycle, such as O2 (Kowalski et al., 2021). However, a comprehensive mathematical description of oxygen exchange in relation to water vapour, carbon dioxide, and nitrogen at the stomatal level remains absent.
We adopt a two-step approach. First, we analyze a binary mixture following the method described in Lushnikov et al. (1994) where one species diffuses in a stagnant carrier species. Secondly, we examine a multicomponent (quaternary) system consisting of H2O, O2, CO2 diffusing in stagnant N2, building on previous analyses of ternary systems, such as H2O-CO2-air (Jarman, 1974; von Caemmerer and Farquhar, 1981). Our key objectives are:
-
To derive interrelated molar flux density and gradient expressions for O2, H2O, and CO2 that account for the net balance between drag and thermodynamic forces.
-
To identify general conditions under which the transport of O2 occurs against its mole fraction gradient, referred here as “uphill”, due to the drag effect of transpiration.
-
To derive an expression for the internal stomatal O2 mole fraction as a function of atmospheric relative humidity.
To achieve these objectives, we apply the Stefan-Maxwell equations to the system composed of N2-O2-H2O-CO2. We focus on the transport processes between stomata and the atmosphere, without explicitly accounting for the biochemistry of O2 sources and sinks within the leaf. While our study is based on theoretical calculations, these are constrained by representative measurements of water vapour, carbon dioxide, and oxygen fluxes at the leaf level (Vilà-Guerau de Arellano et al., 2020), which are subsequently scaled down to the stomatal level at which the Stefan-Maxwell equations apply.
The rest of the paper is structured as follows. In Sect. 2 we outline the three key elements of multicomponent diffusion theory that were used in this study: molar balance, decomposition of species transport into molar flow and molecular diffusive flux components, and the Stefan-Maxwell equations relating species mole fraction gradients to species flux densities. In Sect. 3, as a simple reference case, we use this theory to derive expressions for gas transport in a binary system consisting of one tracer species diffusing in stagnant air (e.g. Jarman, 1974). In Sect. 4 we extend this theory to a more realistic quaternary system consisting of O2, H2O and CO2 diffusing in stagnant N2. In particular, we derive a simple expression linking the O2 mole fraction gradient to relative humidity. We then identify the general regime conditions of O2 transport with respect to the water vapour flux. We discuss the implications of these results in Sect. 5.
To study the exchange of O2 between a single stoma and a stagnant atmosphere relating to H2O, CO2 and N2, we derive a theory that is applied to gas transport through a single stomatal pore. Our derivations are at the stomatal level, but can be scaled up to the leaf level. When discussing our results numerically using representative leaf-scale flux observations (Vilà-Guerau de Arellano et al., 2020), we convert from stomatal-scale flux densities (mol m−2 pore s−1) to leaf-scale flux densities (mol m−2 leaf s−1). In short, by multiplying the stomatal-scale flux density by the cross-sectional area of a pore (m2 pore), we obtain the flux through a single stoma. Multiplying this value by the stomatal density (number of stomata per m2 of leaf surface) then yields the flux density at the leaf scale.
Our key conclusions do not depend on this conversion factor, since this it cancels out when scaling (or downscaling) from the stomata to the atmosphere. For simplicity we consider one-dimensional gas transport through a stomatal pore connecting the stomatal interior to the external atmosphere. Appendix B describes the geometrical assumptions underlying this simplification. The theory presented in the next section can readily be generalized to three spatial dimensions. Finally, for clarity, Table A1 in Appendix A, provides symbol definitions, units, and representative parameter values, including typical values for mole fractions, prescribed molar flux densities based on observations, and molecular diffusivity coefficients.
2.1 Molar balance
Molar balance of a tracer provides the overall context for the description of multicomponent diffusion. The molar balance equation for cα, the concentration of chemical species α (units mol m−3), reads
where Fα (mol m−2 s−1) and Rα are, respectively, the stomatal-scale molar flux density and the net production rate (i.e.. sources – sinks) of species α, t is time and l is the distance along the pore (see Fig. B1). For n species, the total mole fraction of the mixture is
and Eq. (1) can then be re-expressed in terms of the mole fraction (t is here the total amount of species), as
where .
2.2 Decomposition of fluxes into molar flow and diffusive flux
For each chemical species α, we can decompose its molar flux density Fα into a component related to the average flow of the mixture as a whole (molar flow, also called Stefan flow) and a diffusive component related to its transport relative to this average (diffusive flux). We first note that Fα is related to the species velocity uα (relative to the stationary laboratory frame) by
The mole-average velocity of the mixture (u) is defined as the sum of the species velocities weighted by their respective mole fractions:
By substituting into Eq. (5) and using Eq. (4), u can be expressed in terms of the total molar flux density of the mixture (Ft):
where
We can then decompose Fα (Eq. 4) into the sum of a Stefan flow defined by
and a diffusive flux defined by
Using Eqs. (4) and (9), we can find an expression of the flux Fα related to the molar flow and the diffusive flux:
From these relationships we note that the total diffusive flux of the mixture is zero, i.e.. .
Whereas Eqs. (8) and (9) define Stefan flow and diffusion in terms of species velocities, we can use Eqs. (6) and (10) to re-express these components in terms of the species molar flux densities, giving
and
From Eq. (11) we note that the Stefan flow of a given species is proportional to its mole fraction so that, for a given total flux density Ft, we expect Stefan flow to be much larger for O2 (xo = 0.21) than for H2O () or CO2 () (see Table A for additional values). Using the decomposition of Eqs. (8)–(10), we can then re-express molar balance (Eq. 3) as
where the first and second terms on the right-hand side represent the contributions to molar transport from Stefan flow and diffusion, respectively.
To complete our analysis of the molar O2-equation, and focusing on the molar balance for oxygen, Appendix D shows Eq. (13) in a dimensionless form. The analysis shows that the diffusive term can be ignored at atmospheric scales – due to the dominance of turbulence with respect the molecular diffusion transport. However, at the stomatal scale, characterized by low Reynolds numbers (rougly speaking maximum values of 104, the Stefan flow and the diffusive terms needs to be included. It is at this stomatal scale, and in order to solve Eq. (13) for the mole fractions xα, we need to relate the Stefan flow and diffusion terms to the species mole fractions. This linkage is supplied by the Stefan-Maxwell equations, and it is at this stage that the need for a multicomponent approach becomes apparent.
2.3 Stefan-Maxwell equations
Stefan-Maxwell equations provide a framework to study the dependence of the flux as a function of the gradients of other of all other species. For a multicomponent system consisting of n chemical species, the relationship between the one-dimensional mole fraction gradient of species α and the species flux densities is given by the Stefan-Maxwell equation (Curtiss and Hirschfelder, 1949; Kalkkinen et al., 1991; Bird et al., 2007):
where Dαβ is the binary diffusivity of species α and β, and the summations are over all species β other than species α. The second equality follows (i) substituting Fα and Fβ in the numerator using Eq. (12) and (ii) cancellation of the Stefan flow components (xαFt and xβFt). The last and third equality follows substituting Fα and Fβ using Eq. (4).
Physically, Eq. (14) describes the net balance of forces on species α. The left-hand side is the thermodynamic driving force for diffusion of species α while the right-hand side is the sum of the drag (frictional) forces due to molecular collisions between species α and all the other species. The drag force on species α due to collisions with species β is proportional to the product of their mole fractions (xαxβ) and their velocity difference (uβ−uα). The inverse of the binary diffusivity () then represents an effective drag coefficient. A useful feature of the Stefan-Maxwell equations is that the binary diffusivities are virtually independent of species mole fractions (Bird et al., 2007). As shown below (Sects. 3 and 4), Eq. (14) can be inverted to express the molar flux density of species α (Fα) in terms of the spatial gradients of all other species in the system. This facilitates the comparison with Fick's law. It also shows the implications of solving the molar balance equation (Eq. 13) using a multicomponent approach that accounts for the interactions between the different species.
We first apply Eq. (14) to a binary system (n=2) consisting of one tracer species (e.g. α= H2O, O2 or CO2) diffusing in stagnant air. Here we define air composed solely by nitrogen and indicated by the subscript a. This provides a simplified but useful reference case against which the more realistic quaternary system will be compared (Sect. 4). In this case there is only one term on the right-hand side of Eq. (14 (β=α). Substituting Fa=0 (stagnant air, i.e.. ua=0, where a means air) and , then solving for Fα gives:
where Dαa is the binary diffusivity of species α in air. The total molar flux density of the binary mixture is simply (since Fa=0), so from Eqs. (11), (12) and (15) the Stefan flow and diffusive components of Fα are given by
and
Eq. (15) shows that for this simple binary system, the molar flux density of the diffusing species (Fα) is proportional to its mole fraction gradient , i.e. a Fickian diffusion law, with an effective diffusion coefficient that depends on the mole fraction xα. In Sect. 4, we contrast this result with the four-component system (N2-O2-H2O-CO2) for which, in general, the molar flux densities of water and oxygen (Fw and Fo) each depend on both mole fraction gradients , leading to non-Fickian diffusion. In Sect. 4 we will also show that, for water vapour (α=w), the Fickian diffusion result of Eq. (15) is a special case of the expression for Fw in the four-component system, in the limiting case that the water vapour flux density is much greater than that for oxygen or carbon dioxide (i.e.. Fw≫Fo or Fc), which is a realistic assumption. For oxygen (α=o), however, this is not the case (Sect. 4).
As anticipated from Eq. (11), when xα is much smaller than 1 (i.e. for a dilute tracer), the contribution of Stefan flow (Eq. 16) becomes negligible, and Fα is dominated by the diffusive component fα (Eq. 17). Therefore, the dependence of the effective diffusion coefficient on xα can be interpreted as a correction to Eq. (17) arising from the influence of Stefan flow. This correction is significant for O2. For CO2, the correction is smaller but still non-negligible, as demonstrated in the next section, where we apply the full derivation of the Stefan–Maxwell equations (Eq. 14) to the four-component system under study.
We now apply the Stefan–Maxwell equations (Eq. 14) to a four-component mixture consisting of water vapour, oxygen, and carbon dioxide diffusing in stagnant nitrogen (labelled by species indices , and n, respectively). Figure 1 shows the flux directions of the four components (Fig. 1a), their orders of magnitude, and the decomposition of the O2-flux into a Stefan flow and a diffusive molar flux component (Fig. 1b). If we consider the flux components in Fig. 1b from the perspective of the physiological constraints, fo depends on the photosynthesis rate and stomatal conductance. so depends on the transpiration rate, that is on water vapour pressure deficit and on stomatal conductance. If the conductance decreases, both fo and so decrease, too.
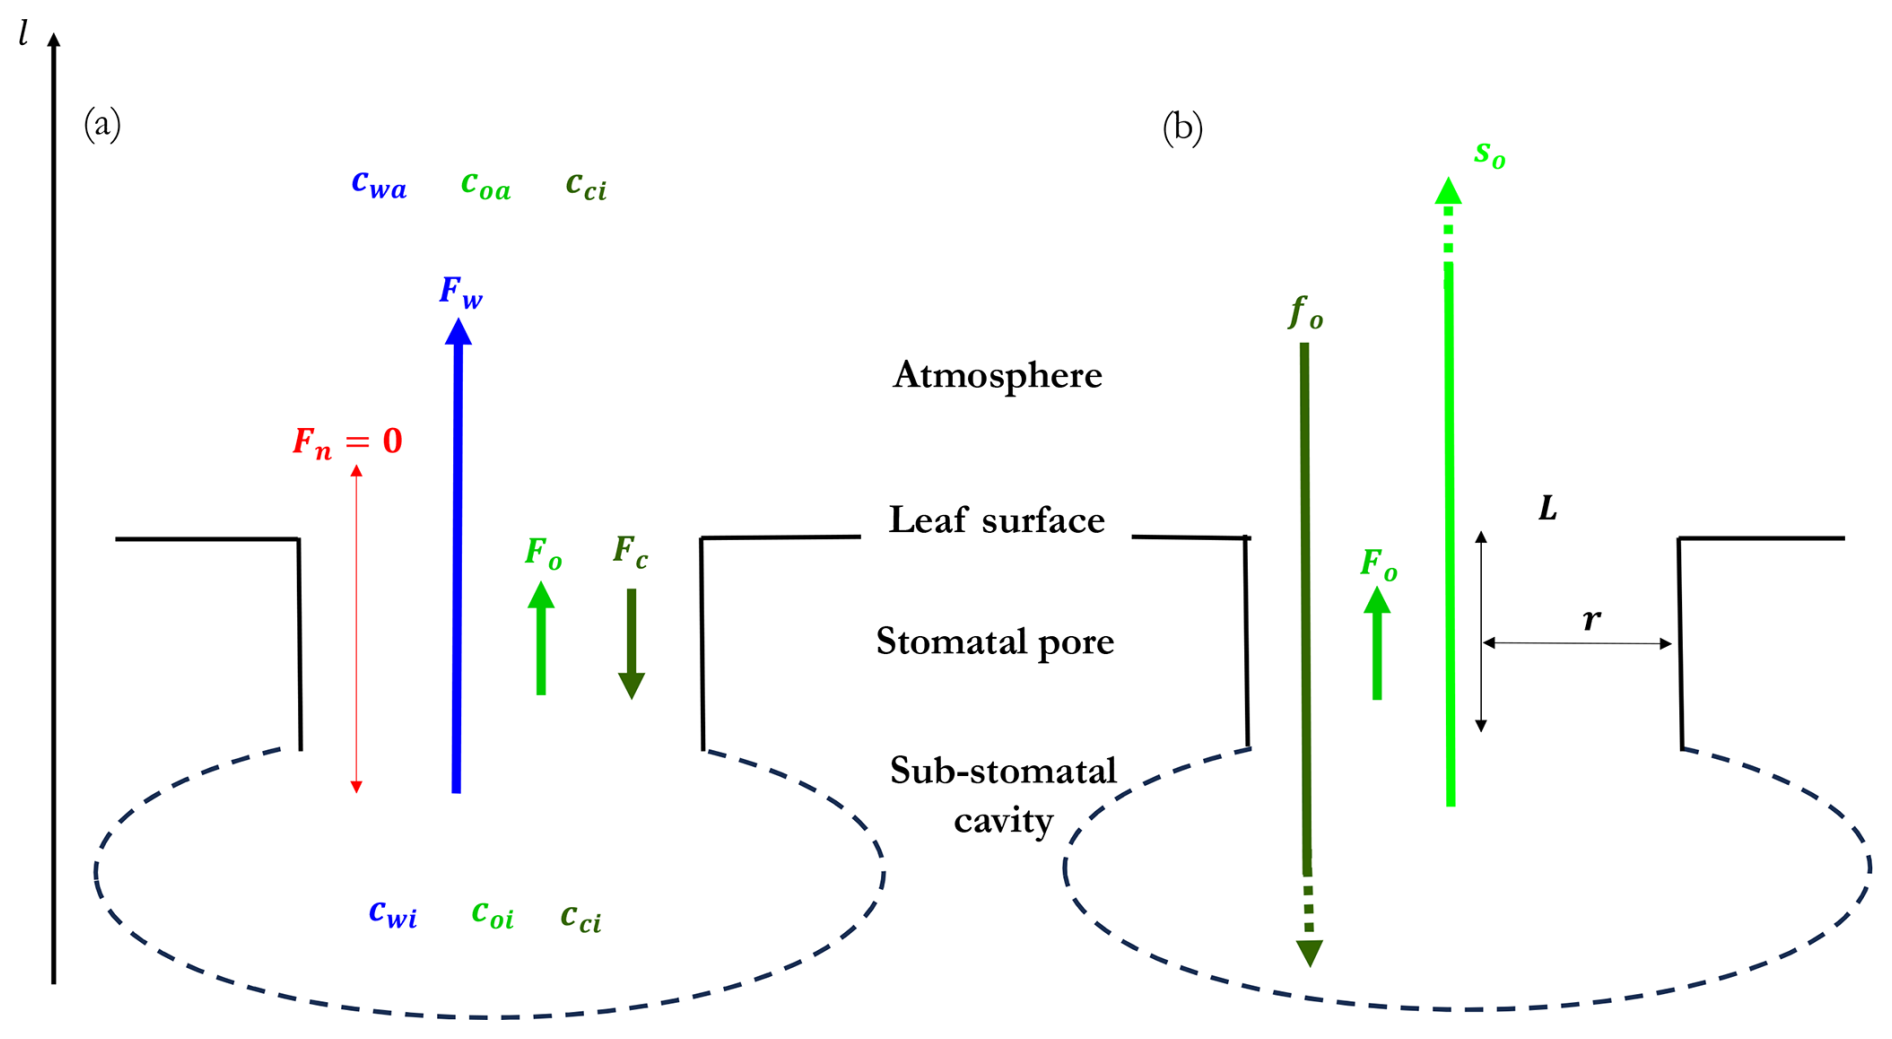
Figure 1Multicomponent fluxes in a system composed of water vapour (w), oxygen (o), and carbon dioxide (c) diffusing in stagnant nitrogen (n). The mole fraction at the sub-stomatal cavity and the atmosphere are expressed by the subscripts i and a, respectively. (a) Direction of the fluxes of the four compounds as investigated in our study, with the dominant role by the water vapor molar flux. (b) Decomposition of O2-flux into a Stefan flow component and a diffusive molar flux component. The dashed lines indicate that the Stefan flow and diffusive flux are much larger than the O2 flux as shown by the theory. L is the length and r the radius of the cylindrical symmetric stomatal pore, respectively. The O2 flux is prescribed based on observations of the CO2 flux at leaf level. More details on the geometry can be found at Fig. B1.
In Eq. (14), for each species α there are now three terms in the sum over all other species β≠α on the right-hand side. For H2O, O2 and CO2 () we obtain the following expressions for their mole fraction gradients in terms of the stomatal-scale molar flux densities:
4.1 Non-Fickian relationship between H2O and O2 gradients and fluxes
The derived equations relating gradients to multiple fluxes (Eqs. 18a–18c) simplify if we assume that (1) on stoichiometric grounds the CO2 molar flux density is equal and opposite to the O2 molar flux density (), and (2) N2 is stagnant (Fn=0). Focusing now on H2O and O2, and making the substitutions , Fn=0 and , Eqs. (18a)–(18c) can be written in the form:
where
The right-hand sides of Eqs. (19a)–(19b) only depend on Fw and Fo. Eqs. (19a)–(19b) can be inverted (e.g. using the standard rules of matrix algebra) to express the fluxes in terms of the gradients:
Therefore, in general, each of the H2O and O2 fluxes Fw and Fo depends on both gradients – and vice-versa, as seen from Eqs. (19a)–(19b) – giving a non-Fickian diffusion law between fluxes and gradients.
This is a general characteristics of the Stefan-Maxwell equations (Eq. 14), whether expressed in terms of Fα or fα. The physical interpretation is that while represents the thermodynamic force driving the diffusion of species α in the absence of other species, within a mixture this force is counterbalanced by the total drag force exerted on species α by all other species. This drag force depends on the relative velocities – and consequently on the flux densities – of all species in the mixture. The Stefan-Maxwell equations, whether expressed in terms of Fα or fα, describe this balance of forces. As a result, when solving for Fα or fα by inverting the Stefan-Maxwell equations, Fα or fα depend on the mole fraction gradients of all species, not just on .
However, in the present case, Eqs. (21a)–(21b) simplify further if we note that typically Fw is much larger than Fo, so that in the right-hand sides of Eqs. (19a)–(19b) the terms involving Fo are much smaller than the terms involving Fw, and to a first approximation can therefore be neglected, leading to
where we have substituted the terms A and C using Eqs. (20a) and (20b). For the second equalities in Eqs. (22a)–(22b) we have made the further approximations in Eq. (20a): (1) xc is typically much smaller than xo and xw, and (2) , where Dwa is the molecular diffusivity of air (Table A1).
Equation (22a) reproduces the same Fickian relationship between the H2O flux and H2O gradient that was obtained previously for the binary case of H2O diffusing in stagnant air (Eq. 15 with α=w). In contrast, Eq. (22b) implies that the O2 gradient is proportional to the H2O flux, and not the O2 flux.
4.2 Diffusive and molar flows
As shown by Fig. 1b is interesting to calculate the contribution of the Stefan flow and diffusive molar flux to the flux. Using Eqs. (7), (11) and (12) we can quantify the Stefan flow and diffusive components of the molar flux densities for a given species α. In the quaternary system, since – recall that we assume –, the total molar flux density of the mixture (Ft) (Eq. 7) is therefore equal to the water flux density, i.e. Ft=Fw. From Eqs. (11) and (12), therefore:
and
These relationships between the stomatal-scale flux densities sα, fα and Fα (mol m−2 pore s−1) also apply to the leaf-scale flux densities. Here we use the following conversions as follows simply by multiplying both sides of Eqs. (23)–(24) by asρs: , and (mol m−2 leaf s−1), where as (m2 pore) is the cross-sectional area of the stomatal aperture and ρs (number of stomata m−2 leaf) is stomatal leaf density.
This allows us to gauge the relative importance of the Stefan and diffusive components at leaf scales using representative values of . Table 1 gives values of and for H2O, O2 and CO2. Also shown are the corresponding scaled gradients calculated by multiplying both sides of Eqs. (18a)–(18c) by asρs and substituting into the right-hand sides of Eqs. (18a)–(18c).
Table 1Stefan flow () and diffusive molar flux density () components of the leaf-scale H2O, O2 and CO2 molar flux densities (), calculated by multiplying both sides of Eqs. (23) and (24) by asρs and substituting typical values of , where as (m2 pore) is stomatal aperture, ρs (number of stomata m−2 leaf) is stomatal leaf density and Fα is the stomatal-scale flux density. Also shown are the scaled mole fraction gradients calculated from Eqs. (18a)–(18c) (multiplied through by asρs) using typical values of and the parameter values in Table A1. We use the following mole fractions for H2O = 1 , O2 = 0.21 and CO2 = 4. For this value of H2O, it corresponds to a specific humidity equal to 16.1 gw kg (representative high atmospheric humid conditions like the tropical forest).
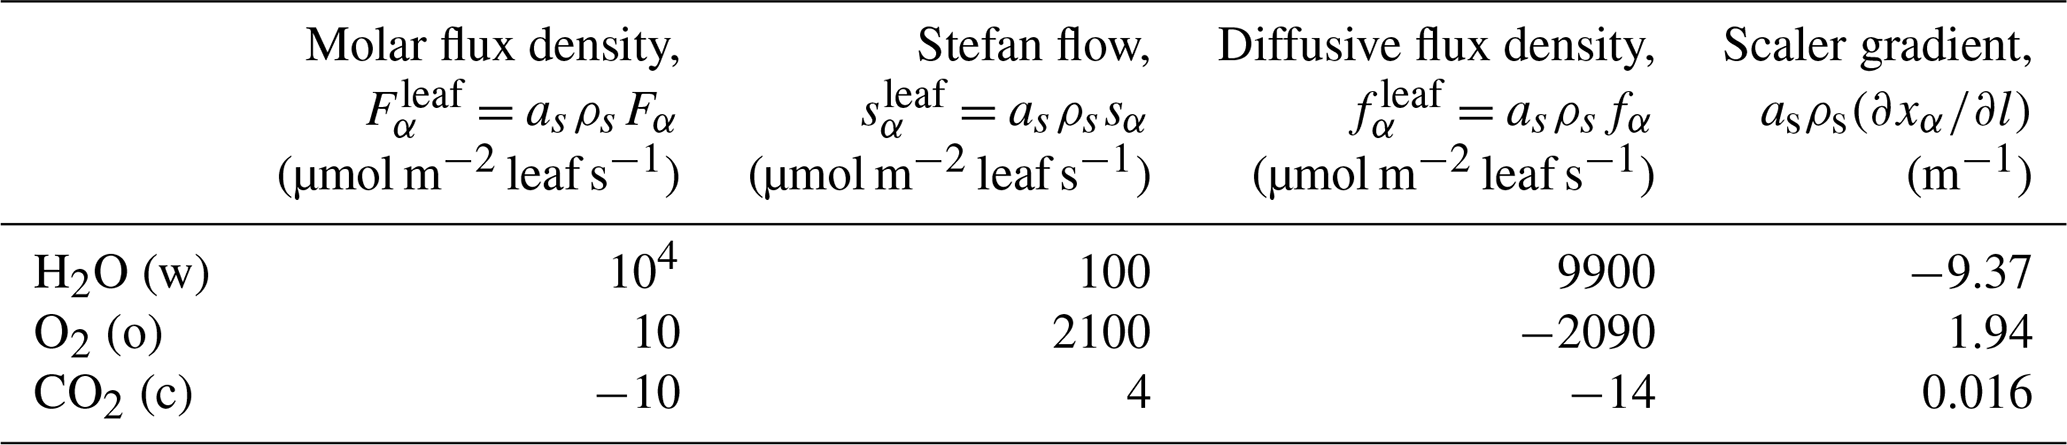
As shown in Eq. (22a) the gradient of H2O is also dependent of the mole fraction of water. Under very dry conditions, for instance air masses characterized by mole fractions H2O = 10−3 equal to the specific humidity of 1.6 gw kg, the scalar gradient is −9.46 m−1 compared to the control value of −9.37−1 m−1 as shown in Table 1. These results stress the already-noted importance of Stefan flow for O2 transport relative to Stefan flow for H2O and CO2. For H2O, characterized by a positive value (i.e. stomata to atmosphere) Stefan flow (100 mol m−2 leaf s−1) is dominated by an even larger diffusive flow in the same direction (9900 mol m−2 leaf s−1). For CO2, the positive Stefan flow (4 mol m−2 leaf s−1) is offset by diffusion in the opposite direction (−14 mol m−2 leaf s−1), but yet relevant. For O2 the diffusive and Stefan components are individually two orders of magnitude larger than the prescribed Fo but are almost equal in magnitude and opposite in direction to each other.
Another consequence of the relative importance of Stefan flow in O2 transport is that, unlike H2O and CO2, the flux of O2 does not necessarily follow the opposite direction of its mole fraction gradient. Specifically, both Fw and Fc are opposite in sign to their respective mole fraction gradients, i.e. following qualitatively the Fickian law relationship between the flux and the gradient. This means that water vapour and CO2 are transported “downhill”, from regions of high to low mole fractions, although deviating from Fick's law due to the influence of the fluxes of other species.
This is not the case for O2. As shown in Eq. (22b), the O2 gradient is directly proportional to, and in the same direction as, the O2 Stefan flow rate, so = xoFw. This represents a clear departure from classical Fickian diffusion, where flux and gradient are expected to have opposite direction. We explore the conditions for uphill O2 transport more generally in Sect. 4.4.
4.3 Relationship between internal O2 mole fraction and relative humidity
From the gradient-flux relationships given by Eqs. (22a)–(22b) (which are based on the realistic approximations Fw≫Fo, xc≪xo and xw, and , it follows that the gradients in O2 and H2O satisfy the relationship
By integrating Eq. (25 from l=0 (internal stomata) to l=L (atmosphere, see Fig. B1), it follows that
where xoi and xoa are, respectively, the internal and atmospheric O2 mole fractions, xwi and xwa being the corresponding H2O mole fractions. In the second equality we have expressed the latter in terms of the atmospheric saturated specific humidity (qs), the atmospheric relative humidity RH (assuming RH = 1 internally), and the air-to-water molecular weight ratio (η=1.61 kga kg) to convert from mole fractions to relative humidity in expression (26).
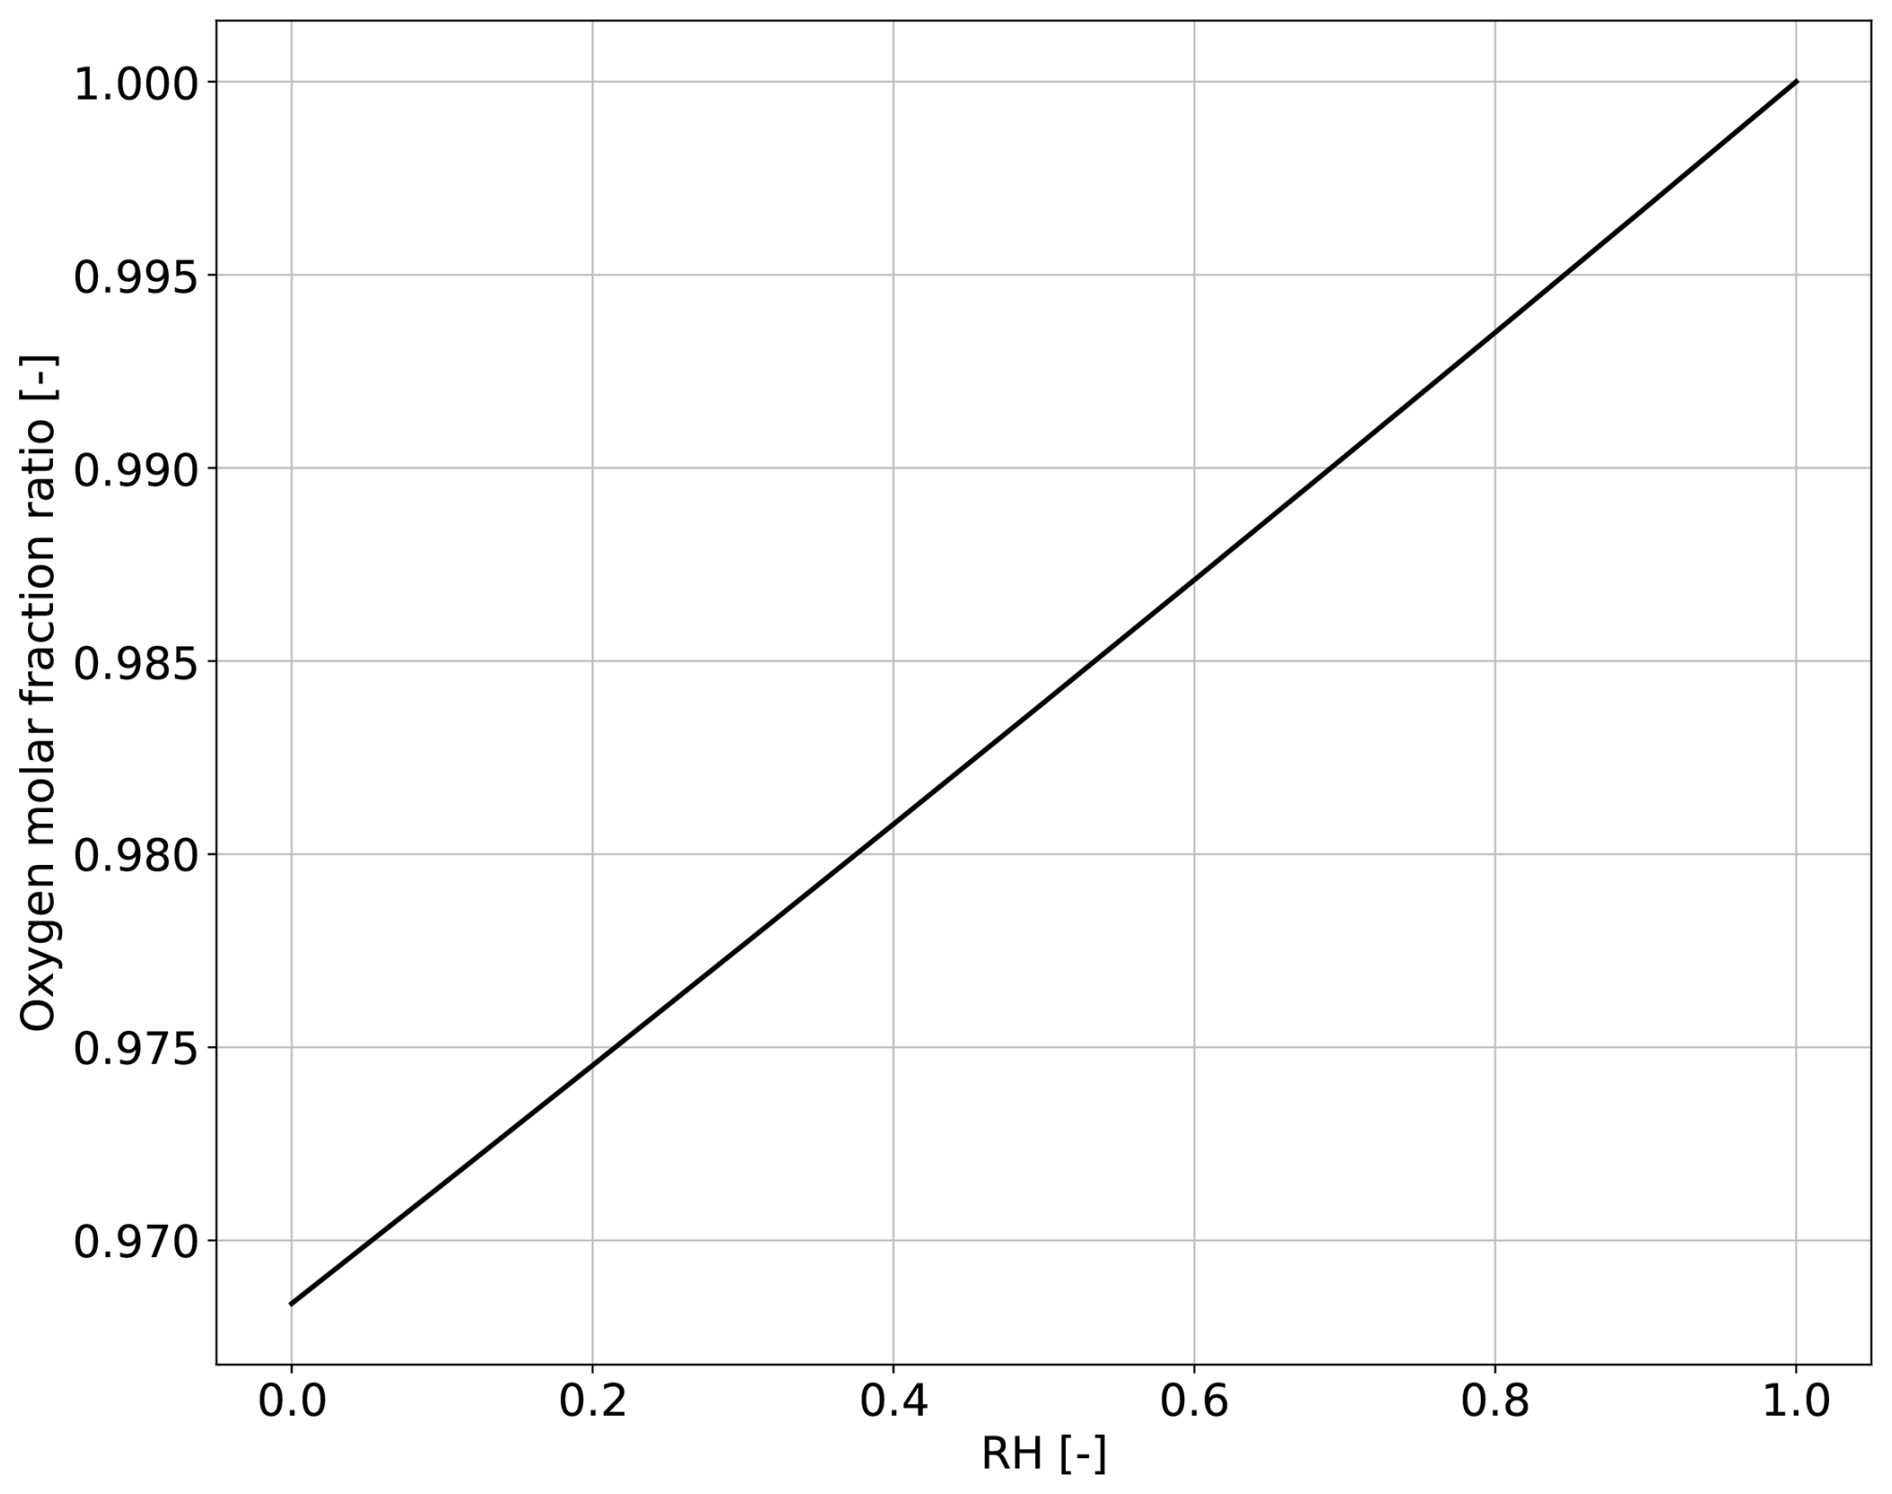
From the expression (26) we infer that from normal atmospheric values of relative humidity (RH < 1), it follows from Eq. (26) that the internal O2 mole fraction is smaller than its atmospheric value. Figure 2 shows the predicted ratio of internal to atmospheric O2 mole fractions as a function of relative humidity. For all the values of RH, the mole fraction in the sub-stomatal cavity is lower than the one of the atmosphere. The lowest internal O2 mole fraction occurs when RH = 0 (largest water demand by the atmosphere), when the predicted internal O2 fraction is approximately 3 % lower than its atmospheric value. The predicted internal and atmospheric O2 mole fraction equalise at RH = 1. However, when RH = 1 (lowest water demand) the assumption Fw≫Fo that underlies Eq. (26) is no longer valid. As a result, the simple relationship of Eq. (26) breaks down, and Eq. (22b) must be replaced by the exact expression given by Eq. (19b), i.e. including the term DFo; since the coefficient D is negative (Eq. 20d). The effect of including this term is to decrease the O2 gradient (i.e. increase the ratio ) so that the internal and atmospheric O2 mole fractions equalize at a value of RH slightly less than 1 (data not shown).
4.4 Uphill vs downhill O2 transport: three regimes
In the previous sections, we have discussed the dominant role of the H2O flux with respect the O2transport. Here, we examine more generally the conditions under which O2 transport (Fo) and/or its diffusive component (fo) occurs “uphill”, i.e. against the O2 mole fraction gradient, due to the dominant drag-force effect of water-driven Stefan flow. For Fo>0 (i.e. O2 transport in the direction stoma to atmosphere), uphill O2 transport occurs when . From the exact expression for the O2 gradient given by Eq. (19b), this occurs when . The expression reads:
where in the last expression R is defined by
Since Dow>Don and Dow>Doc (Table 1) it follows that R>0. With the assumed values of Fw, Fo and parameter values in Table 1, the condition Eq. (27) is comfortably satisfied, the left- and right-hand sides being 100 and ≈ 5.5 respectively. This condition will be violated when transpiration is sufficiently small compared to O2 transport (e.g. when RH is close to 1).
From Eq. (24) with α=0, the diffusive O2 flux density is negative (fo<0) whenever
Thus, as the ratio of water to oxygen flux densities () increases, we can identify three oxygen transport regimes (Table 2), distinguished by the relative orientation of the O2 gradient (), O2 flux density (Fo) and diffusive O2 flux density (fo).
Table 2Three O2 transport regimes distinguished by the relative orientations of the O2 gradient (), O2 flux density (Fo, assumed positive), and diffusive O2 flux density (fo), as determined by the value of the flux ratio () according to Eqs. (27)–(28) and (29). Positive values of indicate that the internal O2 mole fraction is less than atmospheric O2 mole fraction. Positive fo or Fo show that flux direction is from stoma to the atmosphere.
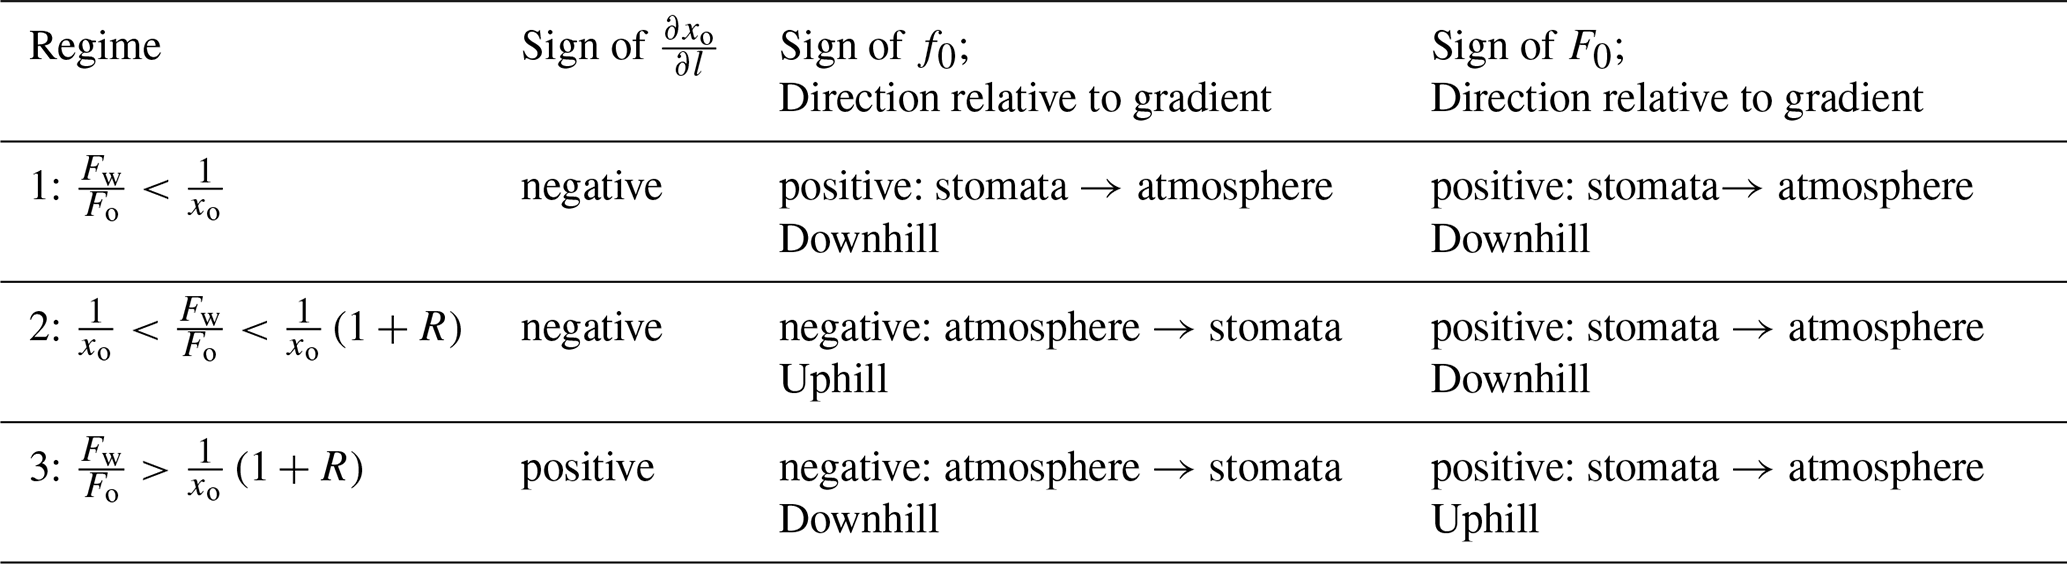
Table 2 outlines three regimes for water vapour and oxygen transport, defined by the direction of their respective mole fraction gradients. These regimes are characterised as uphill – where O2 is transported from the stomata to the atmosphere despite an opposing mole fraction gradient – and downhill, where the flux and gradient are in opposite directions, consistent with classical Fickian diffusion. As noted above, due to the typically large value of the flux ratio (), and since , the O2 transport between the stoma and the atmosphere typically falls within regime 3, resulting in uphill transport of O2 (Fo) in the direction from low to high O2 mole fraction, as already seen in Table 2. In this regime, the molar flux density of H2O drags O2 molecules from the stoma to the atmosphere, driven by the O2 Stefan flow so=xoFw. This drag effect leads to lower O2 mole fraction in the stoma than in the atmosphere (xoi<xoa), and a negative diffusive O2 molar flux density (fo) (i.e. from the atmosphere to the stomata) that counterbalances but does not completely offset positive Stefan flow (Table 2) since we prescribe that the O2 flux is from the stoma into the atmosphere. As decreases into regime 2, the O2 gradient changes sign but the diffusive flux fo remains negative (i.e. Stefan flow is still important), resulting in uphill diffusion from low to high O2 mole fractions; this reflects the non-Fickian character of the flux-gradient relationships in general. At very low values of (regime 1), Stefan flow becomes very small, fo changes sign, and O2 transport is dominated by positive diffusion from the stoma to the atmosphere. It is important to note that the characterization of these three regimes does not account for the roles of photorespiration or dark respiration, and potential sources of O2 within the sub-stomatal cavity are omitted from the analysis. Similarly, transport processes driven by thermal differences between the stomata and the atmosphere (thermodiffusion) are omitted.
Our research extends the studies of Jarman (1974) and von Caemmerer and Farquhar (1981), which examined the transport of a ternary gas mixture comprising air, water vapour, and carbon dioxide. Here, air is composed by combining O2 and N2. Jarman (1974) also briefly considered the CO2-H2O-O2-N2 quaternary system considered in our study, but only with the aim of verifying the insignificant effect of O2 transport on internal CO2 mole fraction. For completeness, in Appendix D we demonstrate that our equations for the quaternary system (Eqs. 18a–18c) reduce to these ternary formulations.
Following Jarman (1974), in Appendix E we evaluated the percentage corrections to the O2 gradient due to Stefan molar flow, using a ternary system (CO2, H2 and air, the latter compost by O2 and N2) as the reference system (cf. Sect. 3). As shown in Table E1, our results are consistent with those in Table 1 and confirm the key role of the H2O molar flux density in determining the O2 gradient.
Although previous studies have recognized that transport of O2 is distinguished by its higher mole fraction and that Stefan flow could be relevant across scales from the canopy to the atmospheric boundary layer (Kowalski et al., 2021), our analysis of the fundamental molar balance equation demonstrates that the primary effects of Stefan flow emerge at the stomatal scale. To this end Appendix C shows a non-dimensional analysis of the governing equation of O2 calculating the O2-transport under representative Reynolds numbers measured in a greenhouse and at the top of a rainforest canopy. Connecting to previous studies of O2 transport, Kowalski (2025) has proposed a simple model for the effects of water vapour flow on O2 transport which assumes, a priori and without rigorous physical foundation, that the sub-stomatal O2 pressure deficit (relative to the atmosphere) is equal to the atmospheric O2 mole fraction multiplied by the water vapour pressure surplus in the sub-stomatal cavity. Since partial pressure is proportional to mole fraction, this assumption implies the relationship.
Interestingly, Eq. (26) of our study is equivalent to the relationship
which, because xwa≪1, is practically identical to Eq. (30). However, in contrast to Eq. (30), our result (Eq. 31) has been derived from the fundamental physics of multicomponent diffusion (Stefan-Maxwell equations), and is itself an approximation (which assumes in particular that Fw≫Fo). Our underlying theory not only provides a physical justification for Eq. (29), but also a rigorous framework for calculating corrections to it under a wider range of conditions.
Our study does not yet address the physiological connection between sources and sinks of O2 and CO2 driven by photosynthesis, photorespiration and dark respiration. A logical next step would be to couple our theoretical expressions for the non-Fickian relationship between gradients and fluxes to biochemical models of photosynthetic CO2 fixation (e.g. Farquhar, 1982) and O2 transport dynamics during photosynthesis and photorespiration. Traditional models often over-simplify photorespiration and dark respiration by neglecting the dynamic interactions between different gases, key processes in the transport stomata-atmosphere.
Our theoretical findings – particularly the influence of H2O molar flux density on internal O2 mole fraction – suggest that incorporating a more physically realistic representation of O2 dynamics could improve the coupling with models of photosynthetic processes, leading to more accurate estimates of O2 transport's impact on photosynthetic efficiency. A better understanding of these processes could refine the predictions of photosynthesis under varying environmental conditions (Zhang et al., 2024), where photorespiration critically limits carbon assimilation. In a similar vein, it will be convenient to study the relationship between the O2 flux density with respect to the CO2 flux relationship. In our study, we assume on stoichiometric grounds that the O2 flux density is equal and opposite to the CO2 molar flux density. However, we do not have observational evidence that this occurs at the leaf level. Besides the Stefan (molar) flow, additional processes such as thermodiffusion (Curtiss and Hirschfelder, 1949; Griffani et al., 2024) may also contribute to gas transport, particularly in the presence of leaf–air temperature gradients. In the present work, we did not account for these thermal effects, but they may become relevant for leaves exposed to strong radiation loads or under fluctuating microclimatic conditions, such as cloud passages or sunflecks (van Diepen et al., 2025). An open question therefore remains regarding the relative importance of thermodiffusion in comparison to Stefan flow and molecular diffusion. To this end, a future aim is to represent O2 biophysical processes independently from CO2 at all relevant atmospheric scales.
One key prediction in our study – that the internal stomatal O2 mole fraction is typically lower than the atmospheric O2 mole fraction (Eq. 26, Fig. 2) – offers an opportunity to experimentally test the underlying multicomponent diffusion theory on which it is based. Such a test would require the precise measurement of internal O2 mole fraction under stagnant or low Reynolds number atmospheric conditions and without photosynthesis. Figure 2 suggests that such measurements would be best carried out under a wide range of relative humidity, and expecting the larger gradient values under low relative humidity values. Experimental deviations from the predictions shown in Fig. 2 would also be of value, because they would signal missing physics not included in our current approach – which assumes the ideal gas approximation and isothermal conditions –; crucially, the underlying theory of the Stefan-Maxwell equations provides a rigorous thermodynamic framework for including such extensions (e.g. to non-ideal gases and thermal forces).
Oxygen transport between the sub-stomatal cavity and the atmosphere exhibits two key characteristics that require particular consideration: (i) the relatively high mole fraction of oxygen compared to other primary components of the photosynthesis system, and (ii) the significant influence of the water molar flux density (transpiration) on oxygen transport. The Stefan-Maxwell equations provided a rigorous physical framework for examining those characteristics quantitatively. Based on these equations, our findings emphasize the interplay between fluxes, gradients, and diffusivity coefficients within the quaternary N2-O2-H2O-CO2 system, and provide new insights into the dynamics of oxygen stomatal gas exchange. The main conclusions are:
-
The water vapour molar flux density generates a drag force that drives the movement of oxygen from the stomatal interior to the atmosphere. The large water-driven Stefan or molar flow of oxygen is almost (but not exactly) counterbalanced by a diffusive O2 flux from the atmosphere to the stomatal interior.
-
We identify three distinct regimes of O2 transport depending on the ratio of water to oxygen molar flux densities. These regimes are distinguished by the relative orientations of the O2 molar flux density, the diffusive component, and gradient in O2 mole fraction between the sub-stomatal cavity and the atmosphere. Under typical conditions, oxygen moves uphill from stoma to the atmosphere from low to high O2 mole fraction, whereas the diffusive component of O2 transport moves from the atmosphere to the stomata (downhill).
-
For this typical regime, we derived a simple analytical expression for the ratio of the internal to atmospheric O2 mole fractions as a function of relative humidity, which explicitly accounts for the drag effect of water-driven Stefan flow. This expression offers the possibility to interpret and explain experiments measuring simultaneous O2 mole fractions in the stomata and the atmosphere, grounded in underlying multicomponent diffusion theory. If future experiments indeed, measure a lower stomatal internal oxygen mole fraction compared to the atmosphere, our results would offer a robust physical explanation.
Our theoretical results establish a baseline for developing a general multicomponent theory of stomatal gas exchange, which can also be extended to other carbon tracers, such as stable isotopologues. By incorporating isotopic variants of CO2 (e.g., 13CO2, C18OO), the framework can help disentangle the relative contributions of different biochemical and physical processes – such as diffusion, carboxylation, and photorespiration – to overall gas exchange. This extension opens new avenues for interpreting isotopic measurements in both laboratory and field settings, providing a physically sounded representation of the transport of carbon tracers across scales and more comprehensive understanding of leaf-level carbon and oxygen dynamics under varying environmental conditions.
Table A1 presents the definitions of the variables used in this study, including their symbols, units, and characteristic values applied in the calculations. The calculations are performed at the stomatal level, with units of [mol s−1], while the input variables are based on representative observations taken at the leaf level, where the units are [mol m−2 s−1] (Jarman, 1974; Vilà-Guerau de Arellano et al., 2020). Leaf-level values are downscaled to the stomatal level by dividing them by the leaf stomatal density, which represents the number of stomata per unit area of leaf. “water” is referring to water vapour.
Table A1Definitions of the variables, symbols, characteristic values, and units used in the study. Molecular diffusivities are calculated at 293 K using the expression proposed by Reid et al. (1987).
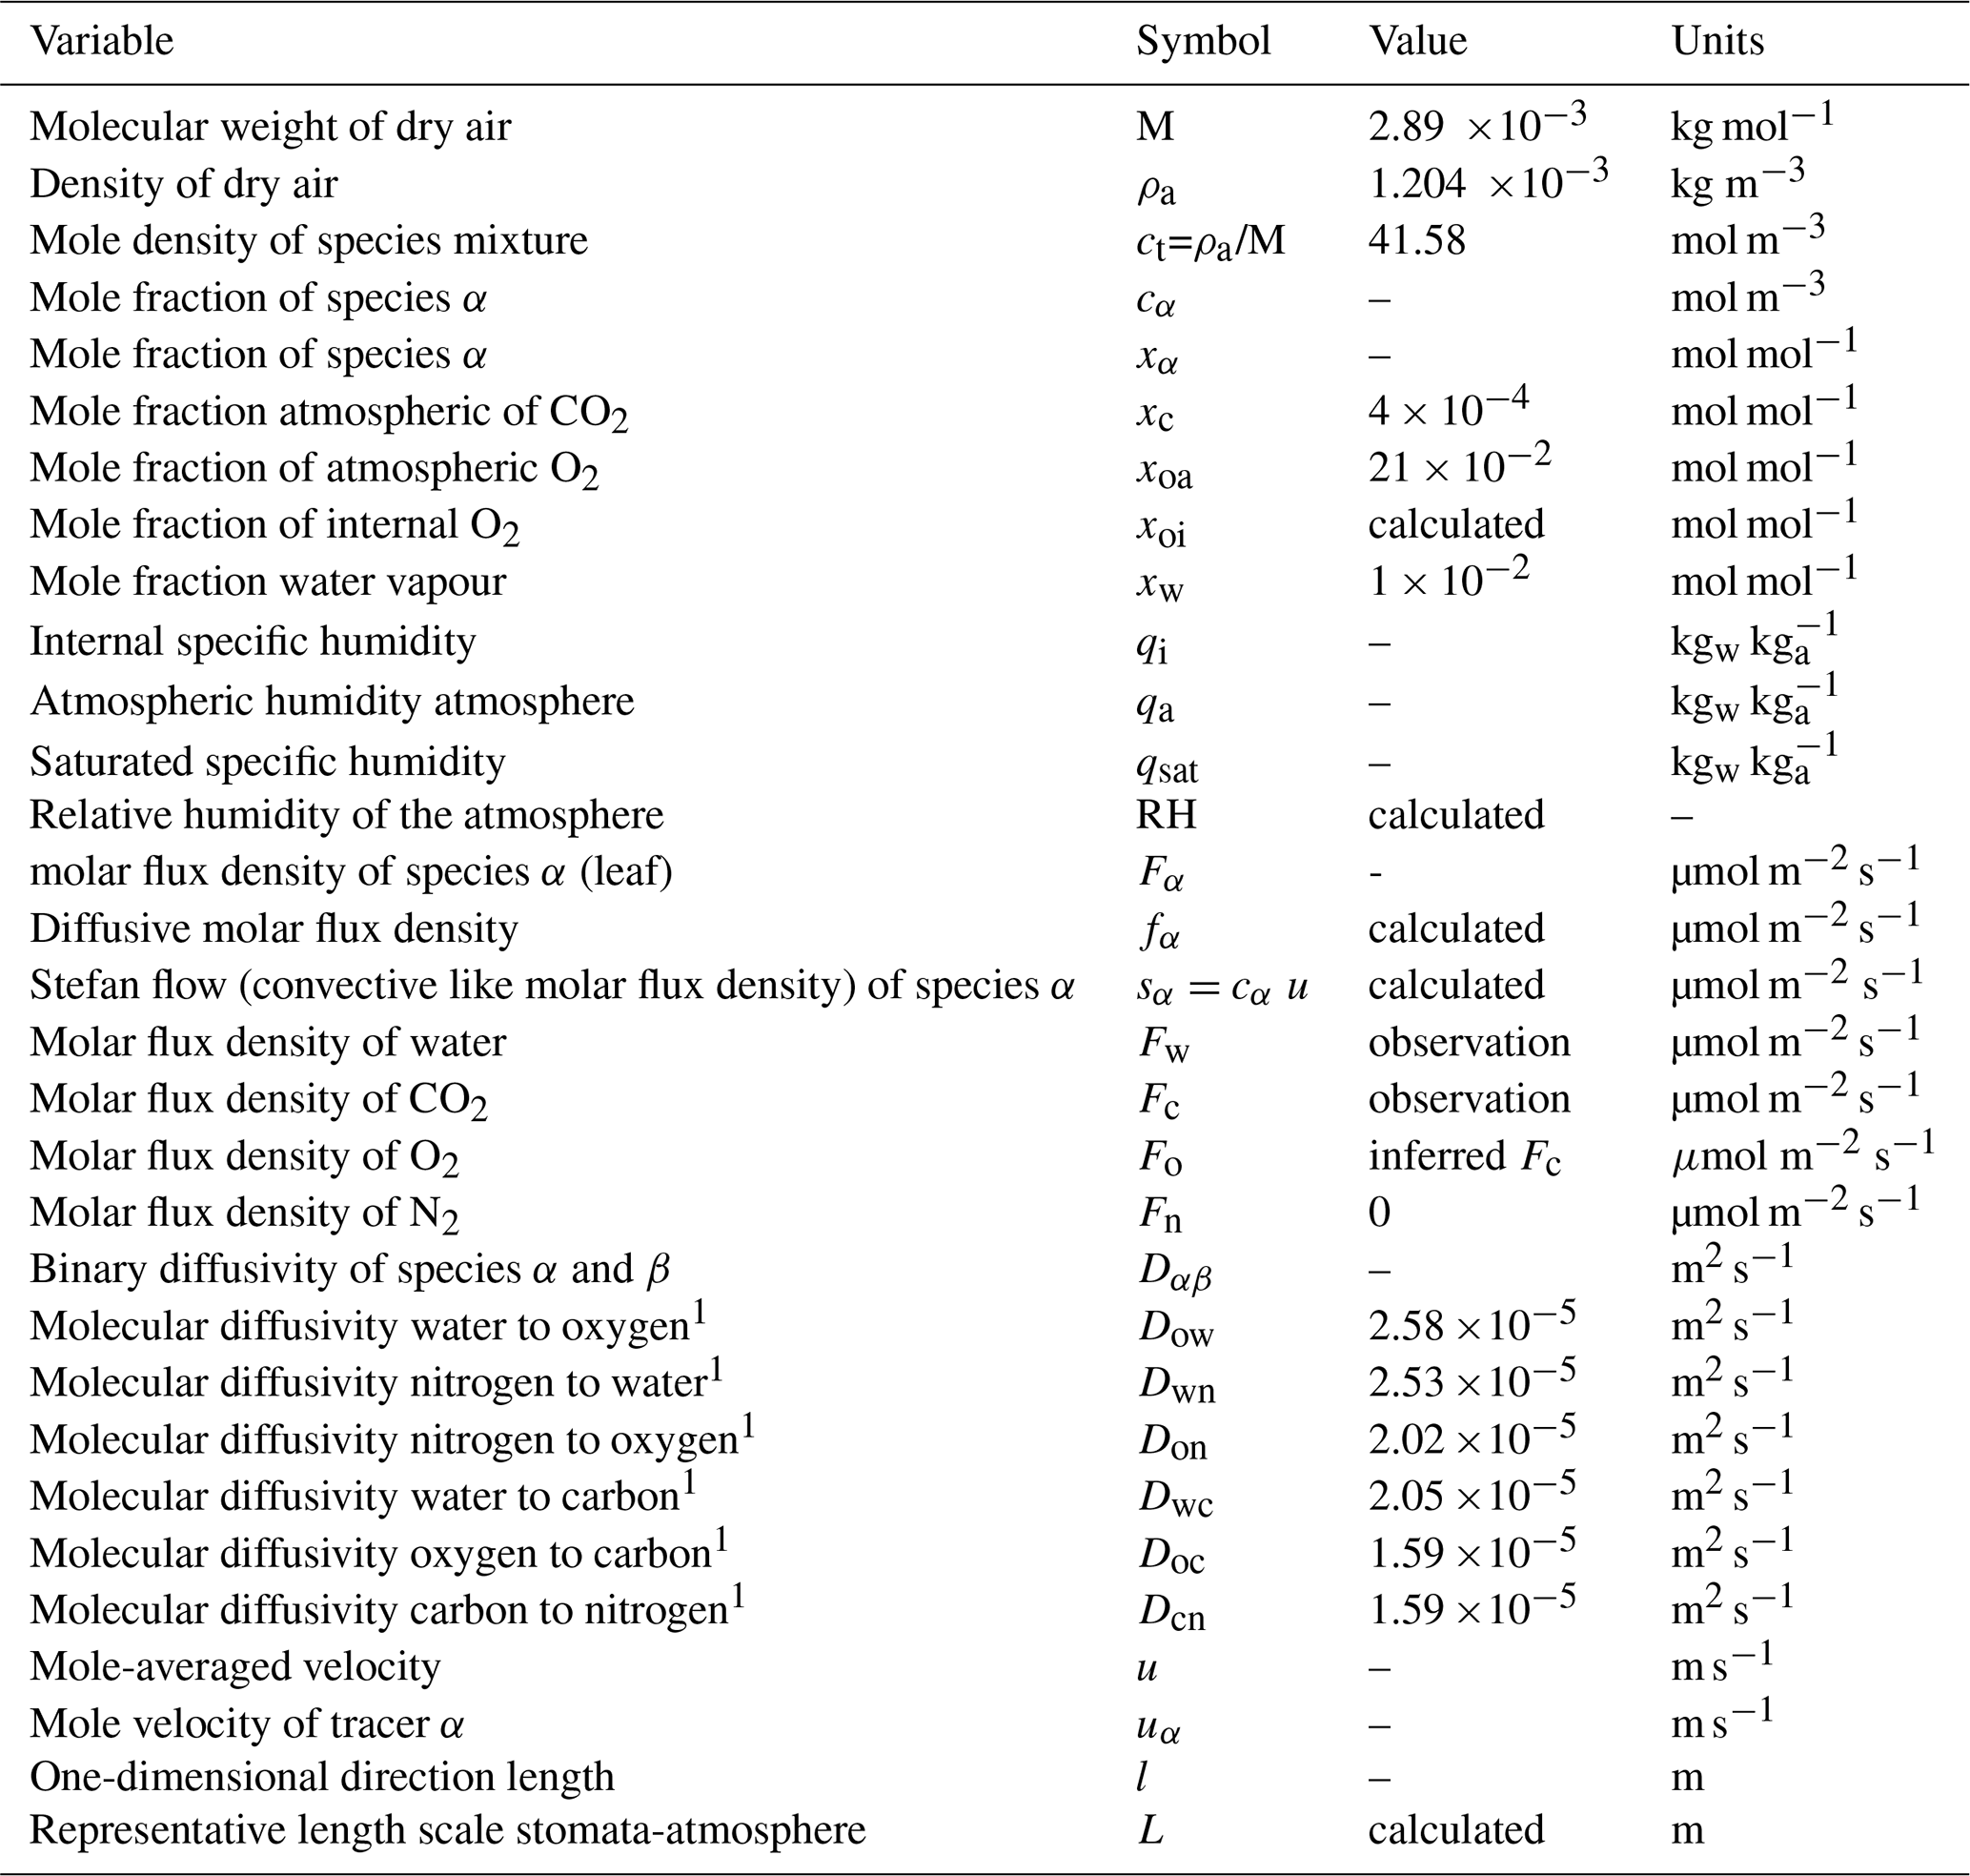
1 All the molecular diffusivities are calculated Reid et al. (1987).
Figure B1 shows the one-dimensional representation of the stomata and the atmosphere in which the Stefan-Maxwell equations are applied. The transport of all the species is through the stomatal pore that connects between the sub-stomatal cavity and the atmosphere. This geometry and assumptions are similar to the binary and quaternary mixtures (see Fig. 1).
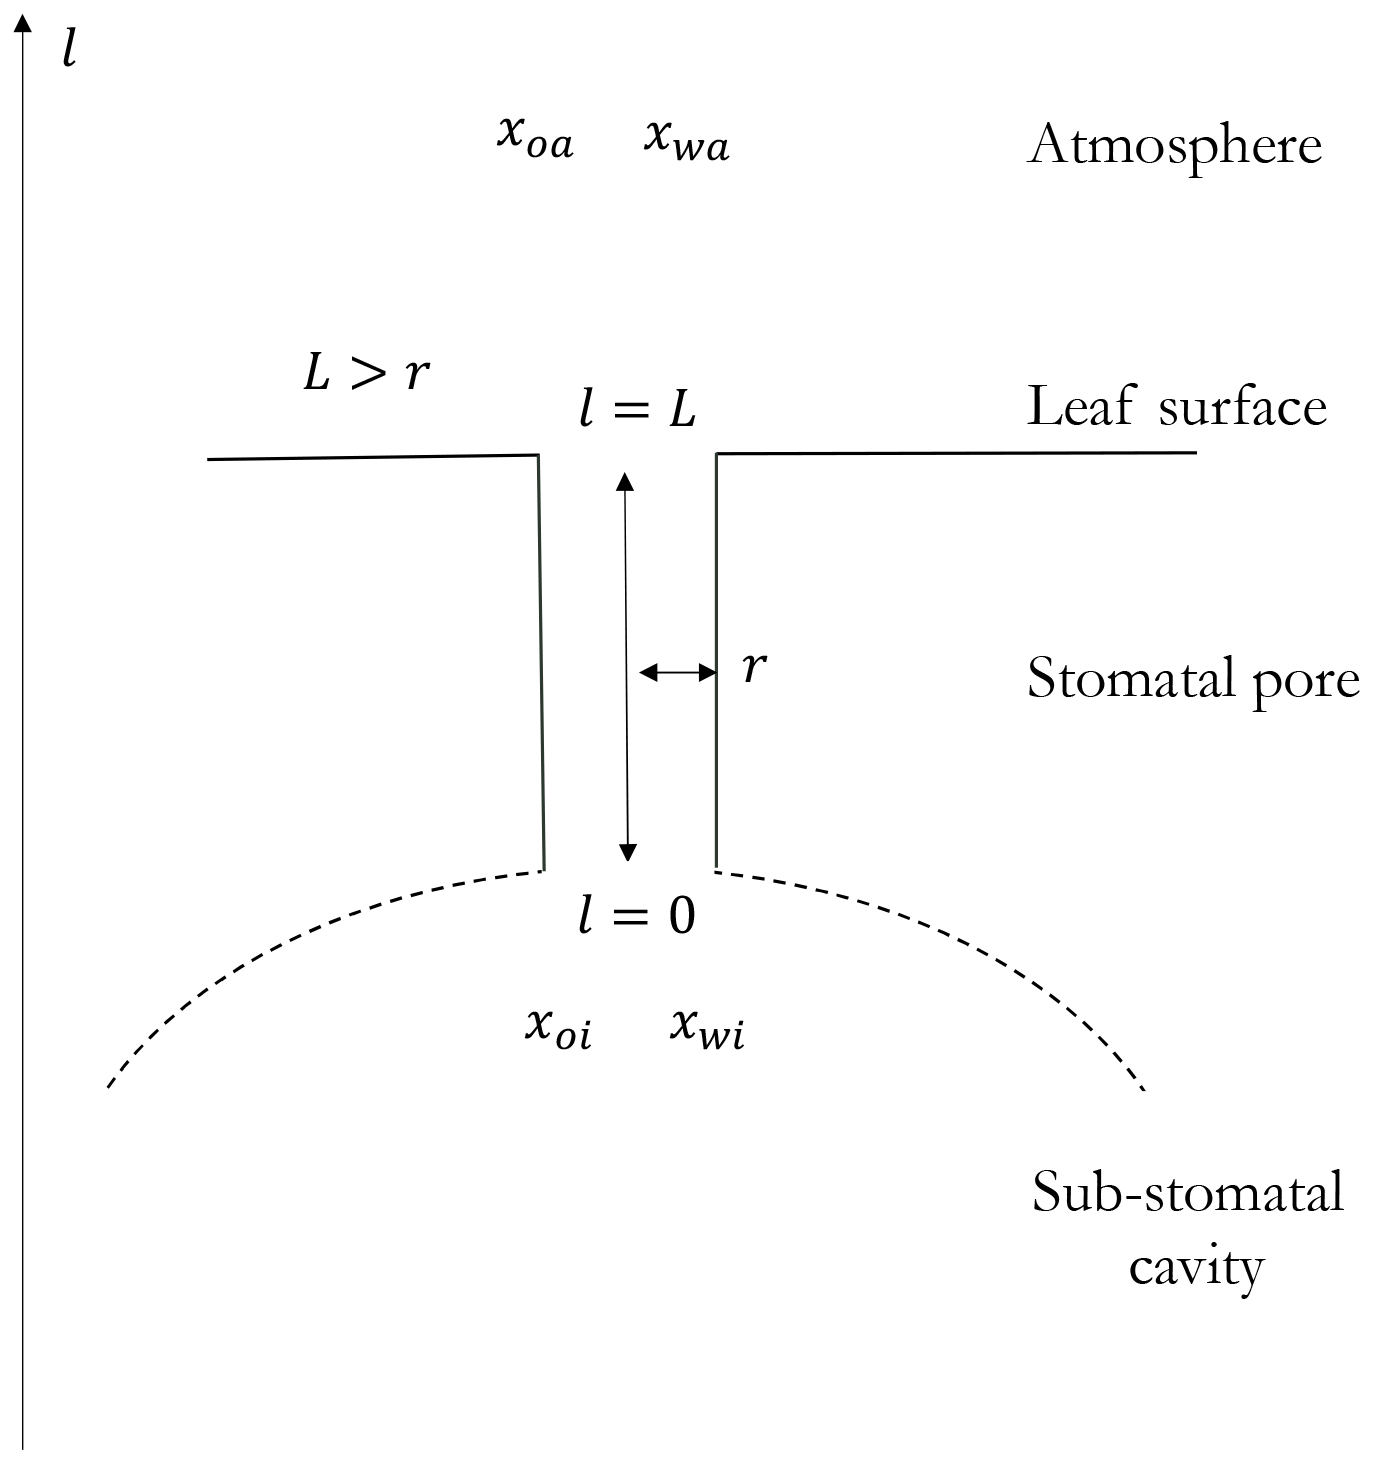
Figure B1Sketch of the geometry of the stomata and atmosphere systems where the oxygen exchange takes place. The spatial one-dimensionality is represented by the coordinate l and the characteristic length scale L. Based on observations, we assume that this length scale is larger than the radius of the stomatal pore r, but it is not a theoretical requirement.
A key question in our analysis is to determine when a multicomponent diffusion representation is necessary to accurately describe oxygen transport. To address this, we consider the one-dimensional molar balance equation for O2 and non-dimensionalize it using characteristic length and velocity scales. For the binary system of O2 diffusing in stagnant N2 (Sect. 3), Eq. (13) becomes:
in which we use Eq. (17) to represent the diffusive molar flux density (fo) as a function of the gradient of oxygen . This equation has units of (molo mol s−1. Note that in the multicomponent diffusion approach, this equation must be solved simultaneously with the governing equations for u (Navier-Stokes equation) and for the mole fraction of water vapour xw.
If Eq. (C1) is made non-dimensional using the characteristic length ℒ and velocity 𝒰 inertial scales, the molecular diffusion term will be divided by the Reynolds number, defined as the ratio of inertial acceleration to the molecular diffusion (νa) and it reads ; and the Schmidt number, defined as the ratio of momentum diffusivity (kinematic viscosity) to mass diffusivity () (Vilà-Guerau de Arellano et al., 2004). To derive this non-dimensional equation, we introduce the following non-dimensional variables: , , and . Substituting these non-dimensional variables into Eq. (C1) and dividing the equation by the factor , we obtain the non-dimensional equation for oxygen. The final non-dimensional equation for oxygen is:
where the source term is . The diffusive term (second term on the right-hand side) is now expressed as a function of the Reynolds number, defined as the ratio of inertial acceleration (), and the Schmidt number, defined as the ratio of momentum diffusivity (kinematic viscosity) to mass diffusivity (). Additionally, the source/sink term is made dimensionless by introducing a representative source/sink scale.
Using typical values for the flow velocity near the leaf surface (ranging from 0.05 to 0.15 m s−1 taken by under greenhouse conditions (Kimura et al., 2020), the length scale (order millimeters) and a kinematic viscosity of air m2 s−1, we obtain Reynolds numbers on the order of 1 to 100. For larger leaves (0.1 m) and more realistic wind conditions – see, for instance, values of 1 m s−1 taken at the canopy top in the Amazonian rain forest (González-Armas et al., 2025) – the Reynolds number is 6666. These greenhouse and forest Reynolds number values indicate that the flow remains laminar around the leaf surface. As a result, we need to retain the molecular diffusion term (2nd right-hand side term) in the governing equation for O2, and describe this O2 transport process using a multidiffusion component as described here.
In this Appendix, we study the equivalence between the equations derived for the quaternary system (18a), (18b) and (18c), and the ternary-system equations derived by Jarman (1974) and further applied by von Caemmerer and Farquhar (1981). We start by rewriting the gradients of water and carbon dioxide as a function of the molar flux densities. The general expression for water vapour is as follows:
and the gradient for carbon dioxide reads:
To connect and compare with expressions B9 and B10 at (von Caemmerer and Farquhar, 1981) we need to introduce the following assumptions: (1) in the ternary system used by Jarman (1974); von Caemmerer and Farquhar (1981), the fluxes Fo and Fn are grouped in a flux of air Fa. There is a mole fraction gradient of air across the stomata. However, they assume there net flux of air is zero, i.e. Fa=0 at the interface by Jarman (1974); von Caemmerer and Farquhar (1981). (2) the mole fraction of oxygen and nitrogen are added , (3) the diffusion coefficients are related as follow: Dow=Dnw and Doc=Dnc, and (4) we approximate the partial derivatives of xo, xw and l with increments Δ.
Using these previous assumptions, we define the conductance of water vapour in air, carbon dioxide in air, and carbon dioxide in water vapour as follows:
In applying these assumptions, the equations become the following:
and
These expressions are equivalent to the ones found by Jarman (1974) (see expressions of the CO2-gradient at page 932). However, to obtain the final equivalence with Eqs. (B9) and (B10) at von Caemmerer and Farquhar (1981), we need to modify the notation. von Caemmerer and Farquhar (1981) defined water vapour and carbon dioxide gradients and fluxes in the following way: and . Following this sign convention, we obtain:
and
The late expressions are identical to Eqs. (B9) and (B10) at von Caemmerer and Farquhar (1981) probing that the ternary solutions derived by Jarman (1974) can be retrieved from the more general fourth-equation systems here derived.
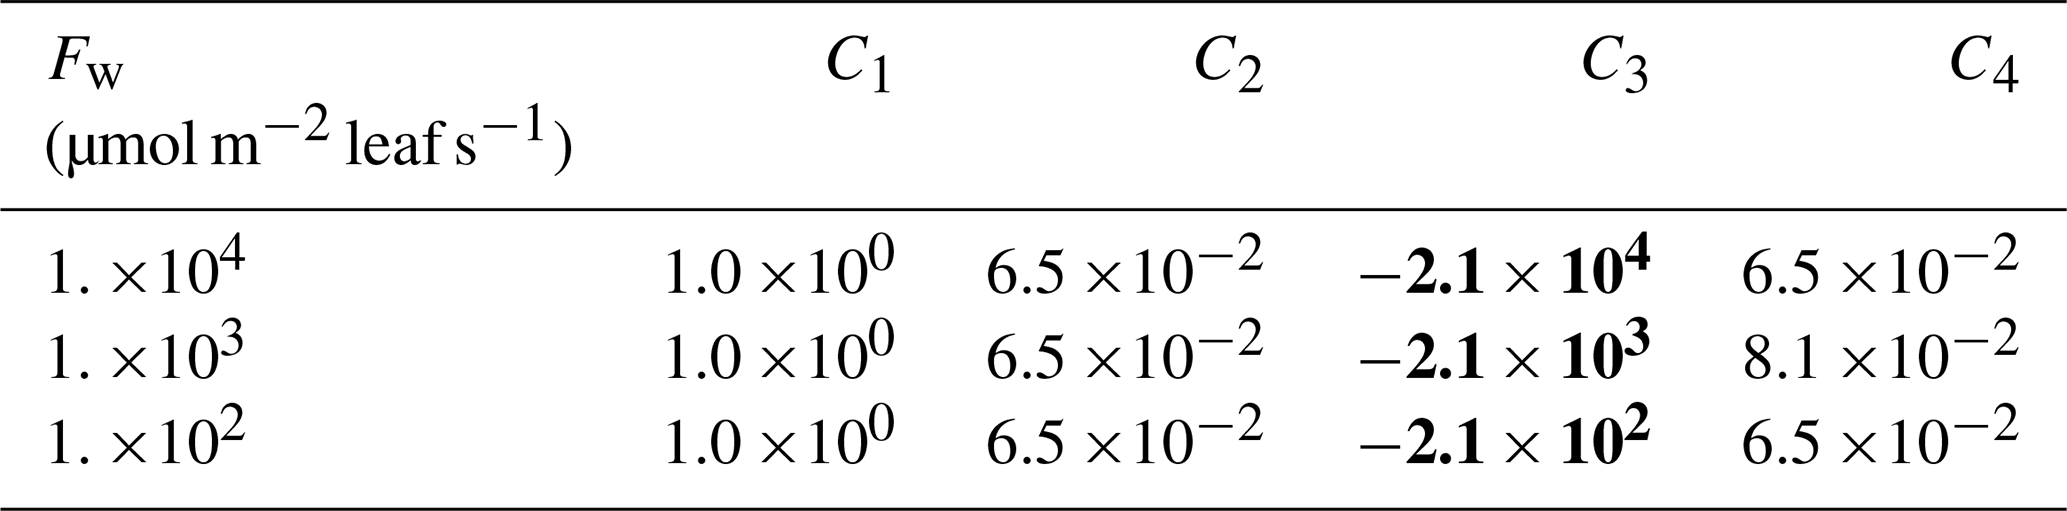
From Eq. (18b), and after simplifying by assuming the net flux of nitrogen Fn=0, we group the various terms as functions of the mole diffusive fluxes Fo, Fw and Fo. This allows us to derive the correction contributions to the single mole diffusive expression that follows Fick's law. Rearranging Eq. (18b), we obtain:
Following the procedure outlined by Jarman (1974) to calculate the correction terms, we determine the percentage of the correction factor for the O2-gradient. We take term (a) as the reference, representing the interaction between oxygen molecules relative to the compound with the larger mole fraction – in this case, nitrogen. For the remaining terms, we assume that the correction factors are defined as follows:
Table E1 shows the correction values using the values of the molar flux densities and molecular diffusivity coefficients shown in Table A1. The very large value of the coefficient C3 corroborates the dominance of the Stefan flow.
As shown in Table E1 only C3 is the largest correction factor that strongly depends on the water vapour molar flux density. These results corroborate the key role played by the Stefan flow as shown in Table 1.
No data sets were used in this paper. Code to reproduce Fig. 2 can be found at https://doi.org/10.5281/zenodo.17491279 (Vilà-Guerau de Arellano, 2025).
RD, TV, and JV-GdA derived and verified the equations. KAPF, ITL and JV-GdA formulated the research motivation. TV and RD provided physical and mathematical expertise. JV-GdA carried out the calculations and prepared the figures. RD and JV-GdA drafted the main text, with substantial input on concepts and writing from TV, KAPF, TH, RdK, and ITL.
The contact author has declared that none of the authors has any competing interests.
Publisher’s note: Copernicus Publications remains neutral with regard to jurisdictional claims made in the text, published maps, institutional affiliations, or any other geographical representation in this paper. While Copernicus Publications makes every effort to include appropriate place names, the final responsibility lies with the authors. Views expressed in the text are those of the authors and do not necessarily reflect the views of the publisher.
We thank the two referees, Dr. Andrew Kowalski and an anonymous reviewer, for their constructive evaluations.
We thank the experimental team working to validate our theoretical findings and for the valuable discussions: Alexey Shapiguzov, Matleena Punkkinen, and Paulina Dukat (University of Helsinki); Ole Pedersen and Juan de la Cruz Jimenez Serna (University of Copenhagen); and Steven Driever and Lukas Hulsman (Wageningen University).
ITL and KAP were supported by the Netherlands Organisation for Scientific Research (grant no. VI.Vidi.213.143).
This work is the outcome of a team brought together by a shared fascination with curiosity-driven science and a commitment to collaborative, interdisciplinary research aimed at advancing the understanding of interactions between plants and the atmosphere.
ITL and KAP have been supported by the Netherlands Organisation for Scientific Research (grant no. VI.Vidi.213.143).
This paper was edited by David Medvigy and reviewed by Andrew Kowalski and one anonymous referee.
Battle, M. O., Munger, J. W., Conley, M., Sofen, E., Perry, R., Hart, R., Davis, Z., Scheckman, J., Woogerd, J., Graeter, K., Seekins, S., David, S., and Carpenter, J.: Atmospheric measurements of the terrestrial O2 : CO2 exchange ratio of a midlatitude forest, Atmos. Chem. Phys., 19, 8687–8701, https://doi.org/10.5194/acp-19-8687-2019, 2019. a
Bird, R., Stewart, W., and Lightfoot, E.: Transport Phenomena, p. 928, Wiley, ISBN 0470115394, ISBN 9780470115398, 2007. a, b
Bonan, G. B., Lucier, O., Coen, D. R., Foster, A. C., Shuman, J. K., Laguë, M. M., Swann, A. L. S., Lombardozzi, D. L., Wieder, W. R., Dahlin, K. M., Rocha, A. V., and SanClements, M. D.: Reimagining Earth in the Earth System, Journal of Advances in Modeling Earth Systems, 16, e2023MS004017, https://doi.org/10.1029/2023MS004017, 2024. a
Boussetta, S., Balsamo, G., Beljaars, A., Panareda, A.-A., Calvet, J.-C., Jacobs, C., van den Hurk, B., Viterbo, P., Lafont, S., Dutra, E., Jarlan, L., Balzarolo, M., Papale, D., and van der Werf, G.: Natural land carbon dioxide exchanges in the ECMWF integrated forecasting system: Implementation and offline validation, Journal Geophysical Research-Atmosphere, 118, 5923–5946, 2013. a
Curtiss, C. F. and Hirschfelder, J. O.: Transport Properties of Multicomponent Gas Mixtures, The Journal of Chemical Physics, 17, 550–555, 1949. a, b
Faassen, K. A. P., Nguyen, L. N. T., Broekema, E. R., Kers, B. A. M., Mammarella, I., Vesala, T., Pickers, P. A., Manning, A. C., Vilà-Guerau de Arellano, J., Meijer, H. A. J., Peters, W., and Luijkx, I. T.: Diurnal variability of atmospheric O2, CO2, and their exchange ratio above a boreal forest in southern Finland, Atmos. Chem. Phys., 23, 851–876, https://doi.org/10.5194/acp-23-851-2023, 2023. a, b, c
Faassen, K. A. P., Vilà-Guerau de Arellano, J., González-Armas, R., Heusinkveld, B. G., Mammarella, I., Peters, W., and Luijkx, I. T.: Separating above-canopy CO2 and O2 measurements into their atmospheric and biospheric signatures, Biogeosciences, 21, 3015–3039, https://doi.org/10.5194/bg-21-3015-2024, 2024. a
Farquhar, G. D. and von Caemmerer, S.: Modelling of Photosynthetic Response to Environmental Conditions, Springer Berlin Heidelberg, 549–587, https://doi.org/10.1007/978-3-642-68150-9_17, 1982. a
González-Armas, R., Rikkers, D., Hartogensis, O., Dias-Júnior, C. Q., Komiya, S., Pugliese, G., Williams, J., van Asperen, H., Vilà-Guerau de Arellano, J., and de Boer, H. J.: Daytime water and CO2 exchange within and above the Amazon rainforest, Agricultural and Forest Meteorology, 372, 110621, https://doi.org/10.1016/j.agrformet.2025.110621, 2025. a
Goudriaan, J.: Crop Micrometeorology: A Simulation Study, PhD thesis, Wageningen University, https://edepot.wur.nl/166537 (last access: 02 November 2025), 1977. a
Griffani, D. S., Rognon, P., and Farquhar, G. D.: The role of thermodiffusion in transpiration, New Phytologist, 243, 1301–1311, 2024. a
Ishidoya, S., Murayama, S., Takamura, C., Kondo, H., Saigusa, N., Goto, D., Morimoto, S., Aoki, N., Aoki, S., and Nakazawa, T.: O2 : CO2 exchange ratios observed in a cool temperate deciduous forest ecosystem of central Japan, Tellus B: Chemical and Physical Meteorology, https://doi.org/10.3402/tellusb.v65i0.21120, 2013. a, b
Jacobs, C. M. J. and de Bruin, H. A. R.: Predicting regional transpiration of elevated atmospheric CO2: Influence of the PBL-vegetation interaction., J. Appl. Meteorol., 36, 1663–1675, 1997. a
Jarman, P.: Diffusion of Carbon dioxide and water vapor through the stoma, Journal of Experimental Biology, 25, 927–936, 1974. a, b, c, d, e, f, g, h, i, j, k, l, m, n, o
Jarvis, P. G. and McNaughton, K. G.: Stomatal control of transpiration: Scaling up from leaf to region, Adv. Ecol. Res, 15, 1–49, 1986. a
Kalkkinen, J., Vesala, T., and Kulmala, M.: Binary droplet evaporation in the presence of an inert gas: An exact solution of the Maxwell-Stefan equations, International Communications in Heat and Mass Transfer, 18, 117–126, 1991. a
Kimura, K., Yasutake, D., Yamanami, A., and Kitano, M.: Spatial examination of leaf-boundary-layer conductance using artificial leaves for assessment of light airflow within a plant canopy under different controlled greenhouse conditions, Agricultural and Forest Meteorology, 280, 107773, https://doi.org/10.1016/j.agrformet.2019.107773, 2020. a
Kowalski, A. S.: An elucidatory model of oxygen's partial pressure inside substomatal cavities, Biogeosciences, 22, 785–789, https://doi.org//10.5194/bg-22-785-2025, 2025. a
Kowalski, A. S., P. Serrano-Ortiz, P., Miranda-García, G., and Fratini, G.: Disentangling Turbulent Gas Diffusion from Non-diffusive Transport in the Boundary Layer, Boundary-Layer Meteorology, 179, 347–367, 2021. a, b
Lushnikov, A., Vesala, T., Kulmala, M., and Hari, P.: A Semiphenomenological Model for Stomatal Gas Transport, Journal of Theoretical Biology, 171, 291–301, https://doi.org/10.1006/jtbi.1994.1232, 1994. a
Miralles, D. G., Vilà-Guerau de Arellano, J., McVicar, T. R., and Mahecha, M. D.: Vegetation–climate feedbacks across scales, Annals of the New York Academy of Sciences, 1544, 27–41, 2025. a
Reid, R. C., Prausnitz, J. M., and Poling, B. E.: The properties of gases and liquids, McGraw Hill Book Co., New York, NY, ISBN 0070517991, ISBN 9780070517998, 1987. a, b
Stephens, B. B., Bakwin, P. S., Tans, P. P., Teclaw, R. M., and Baumann, D. D.: Application of a Differential Fuel-Cell Analyzer for Measuring Atmospheric Oxygen Variations, Journal of Atmospheric and Oceanic Technology, 24, 82–94, 2007. a
van Diepen, K. H., Kaiser, E., Hartogensis, O. K., Graf, A., Vilà-Guerau de Arellano, J., and Moene, A. F.: When do clouds and aerosols lead to higher canopy photosynthesis?, Agricultural and Forest Meteorology, 370, 110597, https://doi.org/10.1016/j.agrformet.2025.110597, 2025. a
Vesala, T.: Opening Pandora's box of transport phenomena, New Phytologist, 243, 1281–1283, 2024. a
Vilà-Guerau de Arellano, J.: Figure 02 Biogescience Paper Technical note: New insights into stomatal oxygen transport viewed as a multicomponent diffusion process, Zenodo [code], https://doi.org/10.5281/zenodo.17491279, 2025. a
Vilà-Guerau de Arellano, J., Dosio, A., J.-F. Vinuesa, and Holtslag, A. A. M.: The dispersion of chemically reactive species in the atmospheric boundary layer, Meteorol. Atmos. Phys., 87, 23–28, 2004. a
Vilà-Guerau de Arellano, J., Ney, P., Hartogensis, O., de Boer, H., van Diepen, K., Emin, D., de Groot, G., Klosterhalfen, A., Langensiepen, M., Matveeva, M., Miranda-García, G., Moene, A. F., Rascher, U., Röckmann, T., Adnew, G., Brüggemann, N., Rothfuss, Y., and Graf, A.: CloudRoots: integration of advanced instrumental techniques and process modelling of sub-hourly and sub-kilometre land–atmosphere interactions, Biogeosciences, 17, 4375–4404, https://doi.org/10.5194/bg-17-4375-2020, 2020. a, b, c
Vilà-Guerau de Arellano, J., Hartogensis, O., Benedict, I., de Boer, H., Bosman, P. J. M., Botía, S., Cecchini, M. A., Faassen, K. A. P., González-Armas, R., van Diepen, K., Heusinkveld, B. G., Janssens, M., Lobos-Roco, F., Luijkx, I. T., Machado, L. A. T., Mangan, M. R., Moene, A. F., Mol, W. B., van der Molen, M., Moonen, R., Ouwersloot, H. G., Park, S.-W., Pedruzo-Bagazgoitia, X., Röckmann, T., Adnew, G. A., Ronda, R., Sikma, M., Schulte, R., van Stratum, B. J. H., Veerman, M. A., van Zanten, M. C., and van Heerwaarden, C. C.: Advancing understanding of land–atmosphere interactions by breaking discipline and scale barriers, Annals of the New York Academy of Sciences, 1522, 74–97, https://doi.org/10.1111/nyas.14956, 2023. a
von Caemmerer, S. and Farquhar, G.: Some relationships between the biochemistry of photosynthesis and the gas exchange of leaves, Planta, 153, 376–387, 1981. a, b, c, d, e, f, g, h, i, j
Yan, Y., Klosterhalfen, A., Moyano, F., Cuntz, M., Manning, A. C., and Knohl, A.: A modeling approach to investigate drivers, variability and uncertainties in O2 fluxes and O2 : CO2 exchange ratios in a temperate forest, Biogeosciences, 20, 4087–4107, https://doi.org/10.5194/bg-20-4087-2023, 2023. a
Zhang, Z., Zhu, G., and Peng, X.: Photorespiration in plant adaptation to environmental changes, Crop and Environment, 3, 203–212, 2024. a
- Abstract
- Introduction
- Multicomponent diffusion theory
- Binary mixture: one species diffusing in stagnant air
- Quaternary mixture: water vapour, oxygen and carbon dioxide diffusing in stagnant nitrogen
- Discussion
- Conclusions
- Appendix A: List of variables, symbols, values and units
- Appendix B: Geometry and scaling of one-dimensional gas exchange between stomata and the atmosphere
- Appendix C: Non-dimensional O2 governing equation including Stefan flow effects
- Appendix D: Equivalence ternary and quaternary systems
- Appendix E: Quaternary versus binary mixture
- Code and data availability
- Author contributions
- Competing interests
- Disclaimer
- Acknowledgements
- Financial support
- Review statement
- References