the Creative Commons Attribution 4.0 License.
the Creative Commons Attribution 4.0 License.
 | 06 Nov 2025
Very-high resolution aerial imagery and deep learning uncover the fine-scale patterns of elevational treelines
Donato Morresi
Fabio Meloni
Nicolò Anselmetto
Emanuele Lingua
Raffaella Marzano
Carlo Urbinati
Alessandro Vitali
Matteo Garbarino
Treelines are sensitive indicators of global change, as their position, composition and pattern directly respond to ecological and anthropogenic factors. Treelines worldwide exhibit a great variability even within single landscapes, which limits the reliability and generalizability of locally measured patterns. Advancing methods to accurately map fine-scale treeline spatial patterns over large extents is crucial to overcome this limitation. Innovative approaches integrating remote sensing with uncrewed aerial vehicles (UAV) and deep learning offer a promising way to bridge the gap between field-based observations of fine-scale patterns and their large-scale implications, ultimately informing and supporting practices for the conservation of forest ecosystems in the face of ongoing and future ecological challenges. In this study, we combined field data and UAV-based remote sensing with a deep learning model to retrieve individual tree-scale information across 90 ha in 10 study sites in the Italian Alps. Using the proposed methodology, we were able to correctly detect individual tree crowns of conifers taller than 50 cm with a detection rate of 70 % and an F1 score of 0.76. Accuracy increased with tree height, reaching 86 % for trees taller than 2 m. Canopy delineation was robust overall (Intersection over Union, IoU = 0.76) and excellent for tall trees (IoU = 0.85). Tree position and height estimates achieved RMSEs of 59 cm and 92 cm, respectively.
Our results demonstrated that the proposed methodology effectively detects, delineates, georeferences, and measures the height of most trees across diverse Alpine treeline ecotones. The proposed methodology enables the analysis of fine-scale patterns in order to achieve an interpretation of underlying ecological processes over large ecotonal extents. The inclusion of heterogeneous study areas facilitates the transferability of the segmentation model to other mountain regions and offers a benchmark for developing a global network of fine-scale mapped treeline spatial patterns, bearing a great potential in monitoring the effects of global change on ecotone dynamics.
- Article
(11811 KB) - Full-text XML
- BibTeX
- EndNote


The elevational treeline is the transition zone from the uppermost closed montane forest (timberline) to the highest scattered trees (tree species line) (Holtmeier et al., 2003), and one of the most studied ecotones. Since the late 19th century, scientific studies largely focused on the diversity and complexity of factors affecting the ecotone spatial and temporal patterns at different scales (Hansson et al., 2021; Holtmeier, 2009). It is well known that temperature plays a crucial role in treeline positioning and dynamics from regional to global scales (Dirnböck et al., 2003; Gehrig-Fasel et al., 2007; Harsch et al., 2009; Körner and Paulsen, 2004), but is not the only driving factor. Many other studies have emphasised the significant role of other factors in treeline formation (Mienna et al., 2024), including water availability (Barros et al., 2017; Williams et al., 2013), site topography (Leonelli et al., 2016; Marquis et al., 2021; Müller et al., 2016), biotic drivers (Brown and Vellend, 2014; Cairns et al., 2007), and anthropogenic pressure (Gehrig-Fasel et al., 2007; Malandra et al., 2019; Vitali et al., 2019).
Global change can trigger large-scale vegetation dynamics affecting the provision of ecosystem services - such as carbon sequestration (Hansson et al., 2021; Zierl and Bugmann, 2007). Climate alteration can induce upward migration of species, threatening a loss of habitat and biodiversity of high alpine communities (Kyriazopoulos et al., 2017). This sensitivity to climatic and anthropogenic factors makes high-elevation ecotones key indicators of global change (Dirnböck et al., 2011; Greenwood and Jump, 2014). Monitoring changes at elevational treelines is therefore of utmost importance to follow how forests are responding and to forecast how they will respond to a changing environment (Chan et al., 2024; Hansson et al., 2023; Mottl et al., 2021) and ultimately to guide the definition of appropriate conservation strategies. However, understanding vegetation changes in response to the complex interplay of these drivers requires studying highly heterogeneous systems across broad spatial and temporal gradients (Holtmeier and Broll, 2007, 2017).
An open question in many areas of ecology is how to infer processes from observed patterns. Tree maps act as a foundation towards this goal. In forest ecosystems, tree spatial distributions retain critical signatures of historical dynamics and can be used to derive insights into underlying ecological processes (Grimm et al., 2005; McIntire and Fajardo, 2009; Salazar Villegas et al., 2023). For instance, tree distribution can reveal species-specific coping strategies under stressful conditions, such as the ones found in the elevational treeline ecotones, where positive facilitative interactions may prevail (Callaway, 1995, 1998; Smith et al., 2003). Tree spatial patterns may reflect the result of intra- and interspecific interactions, encompassing both facilitative and competitive associations (Getzin et al., 2006; Salazar Villegas et al., 2023). Assessing these spatial association patterns among species can help to disentangle the mechanisms shaping treeline structure and dynamics. In this context, the great spatial heterogeneity observed in high-elevation ecotones provides a great opportunity to investigate pattern-process relationships. Such a high heterogeneity between treeline ecotones can be better tracked by mapping multiple sites with large spatial extents, allowing for a generalization of underlying processes.
Field surveys remain the traditional methods used at treelines to observe patterns and link them to ecological processes. They involve measuring several tree parameters (e.g. stem DBH, height, position, health conditions) within small study areas like plots or transects (Mainali et al., 2020; Van Bogaert et al., 2011; Vitali et al., 2017, 2019). This approach provides high-resolution, high-quality data applicable to a broad array of ecological investigations. However, its time-intensive nature, coupled with the limited spatial extent and discontinuous distribution of plots or transects, may reduce the representativeness of the broader landscape.
At this point, remote sensing (RS) techniques come into play. Although RS application in treeline studies dates back to the 1980s (Holmgren and Thuresson, 1998), it is only over the last two decades that RS has been widely adopted in treeline ecology (Garbarino et al., 2023). The choice of the right RS tool depends on the spatial and temporal scale required to address a given research question. For instance, while satellite imagery can provide suitable data over large forest areas and long time periods (Garbarino et al., 2020; Nguyen et al., 2024), most optical sensors lack the spatial resolution necessary for individual tree mapping (Bennett et al., 2024; Morley et al., 2018; Simard et al., 2011). The limitations of field surveys (limited spatial and temporal extent) and satellite-based data (high spatial and temporal extent but low resolution) can be overcome by using Uncrewed Aerial Vehicle (UAV) platforms (Fromm et al., 2019; Qin et al., 2022; Xie et al., 2024). Their growing availability and ease of deployment make UAVs increasingly valuable for applications such as detailed tree mapping. In addition to wall-to-wall mapping of relatively large and heterogeneous areas, UAVs survey enables the analysis of fine-scale drivers and the extraction of single-tree attributes and features (Nasiri et al., 2021; Panagiotidis et al., 2017; Shimizu et al., 2022; Xiang et al., 2024). The combination of field sampling and high-resolution RS data could be a winning venue to increase the spatial extent of case studies while retaining the fine-scale level of details typical of the traditional approaches.
Single-tree mapping approaches are crucial in treeline ecology, as they provide insights into the underlying ecological processes shaping treeline pattern and structure. Seedling establishment – a key driver of plant community dynamics – heavily depends on the presence and availability of microsites that provide suitable conditions for growth and survival (Frei et al., 2018). Multiple local factors such as topography, vegetation, and herbivory influence tree recruitment and thus mediate treeline dynamics (Elliott and Kipfmueller, 2010; Lett and Dorrepaal, 2018; Ramírez et al., 2024). Neighbouring vegetation can either hinder or enhance tree recruitment through competitive or facilitation associations (Getzin et al., 2006; Getzin et al., 2006; Salazar Villegas et al., 2023; Smith et al., 2003). Whether these interactions result in a positive or negative feedback depends on the fine-scale interplay between biotic and abiotic factors. The resulting spatial patterns at the individual tree-scale provide a valuable perspective to both infer past processes and predict future trajectories. Accurate high-resolution single-tree maps are essential tools to capture these fine-scale patterns and investigate such tree–tree interactions.
Convolutional Neural Networks (CNNs) combined with very-high-resolution images are a reliable and versatile tool for single-tree scale analyses, enabling the accurate identification and representation of different plant species and communities as well as the detection of individual trees (Braga et al., 2020; Fricker et al., 2019; Fromm et al., 2019; Kattenborn et al., 2021). The latter can be achieved through instance segmentation algorithms that enable the detection of individual objects on the input images, allowing to distinguish and separate individual interwoven tree canopies (Ball et al., 2023; Braga et al., 2020).
The distinctive species composition, stratified horizontal and vertical structure, and complex terrain characteristics of treeline ecotones confer a unique ecological identity to these environments. Therefore, a framework for fine-scale tree mapping at treeline ecotones based on low-cost UAV imagery is needed. In this regard, the present study tests the following hypotheses: (i) the integration of UAV derived very high-resolution RGB imagery with CNNs models achieves high performances in single-tree detection rates and (ii) tree attributes estimation, and (iii) the trained model exhibits sufficient generalizability to perform reliably on heterogeneous datasets. Moreover, we expect (iv) the proposed workflow to achieve very good detection rates for tall trees and poorer ones for small trees without a critical drop in model performances and (v) to achieve comparable detection performances on all sites despite the high heterogeneity present in the dataset.
2.1 Study Area
We selected ten study sites across the Italian Alps (Fig. 1) spanning a broad longitudinal gradient representative of the Western, Central, and Eastern Italian Alps. This selection ensured a balanced dataset encompassing highly heterogeneous climatic, topographical, soil, and vegetational conditions (Appendix A). Introducing such heterogeneity allowed us to test the transferability of the protocol to several treeline conditions. The selected treelines present elevations ranging between 2100 and 2400 m a.s.l., and variable slope aspects due to the differing orientations of the valleys. Above the closed forest there are both mesic and xeric regions and feature patches of grasslands, sparsely vegetated areas, screes, and surfaces shaped by gravitational events such as rill and gullies. All the selected landscapes experienced centuries of human land-use practices under varying intensities of management pressure. In general, land abandonment is more marked in the Western sector of the study area (Bätzing et al., 1996). Across all sites, the annual range of air temperature ranges between 2.8 and 3.1 °C, while the mean annual precipitation varies from 800 to 1800 mm. Reflecting the typical species composition of the subalpine belt in the Alps, in all the studied treelines the dominant treeline-forming species are European larch (Larix decidua Mill.) and Swiss stone pine (Pinus cembra L.). Other species present include Norway spruce (Picea abies (L.) H.Karst.), dwarf mountain pine (Pinus mugo Turra), mountain pine (Pinus uncinata Miller), Scots pine (Pinus sylvestris L.), as well as few broadleaf species such as green alder (Alnus viridis (Ehrh.) K. Koch) and silver birch (Betula pendula Roth). Further details on the study sites are provided in Table 1.
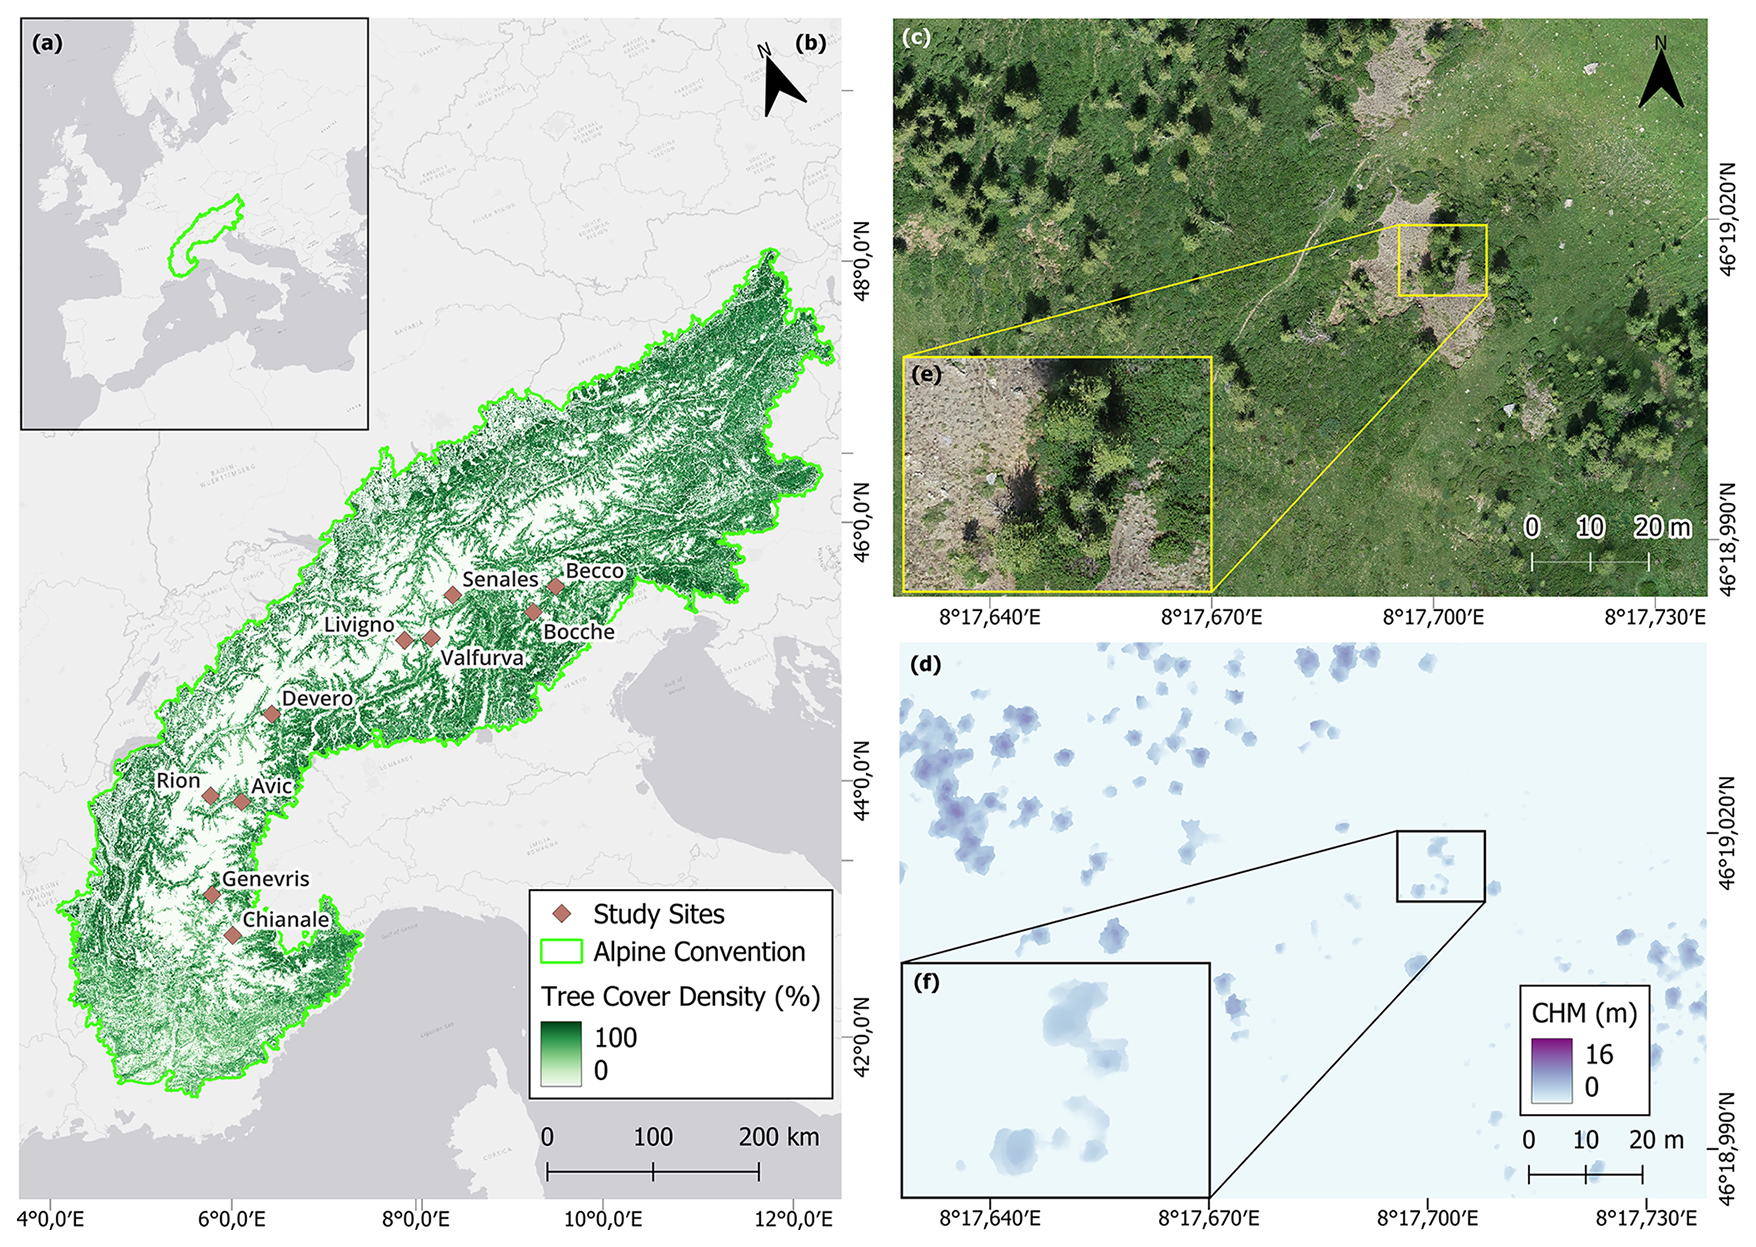
Figure 1Geographic location of (a) the Alpine Convention Perimeter in Europe and (b) the ten study sites (brown diamonds) along with their names across the Alps. Detail in the UAV-derived orthomosaic of the study site (c) Devero and (d) same site overlayed with the canopy height model (CHM). (e) Further details of the study area Devero and (f) its CHM. For further details see Sect. 2.2
Table 1Details of the study sites including date of the survey, their latitude and longitude (WGS84), average elevation (m a.s.l.), aspect, dominant tree species, mean annual temperature (°C) and total annual precipitation (mm). Climate variables were derived from Chelsa Climate database (Brun et al., 2022), while position, elevation, and species from the field surveys.
2.2 Sampling design and data collection
We selected ten treeline ecotones above 2000 m a.s.l. along an east-west gradient across the Italian Alps, with a minimum distance of 25 km between sites. Site selection was stratified by administrative region with only fully accessible locations included, and edaphic treelines were explicitly avoided. In these ecotones, we placed ten 9 ha square plots (300 m × 300 m) with a side aligned parallel to the steepest slope of the mountainside so that the forestline occurred in the lower third of the plot. We defined forestline as the continuous line separating the closed forest (canopy cover > 10 %) from the semi-open and open areas (canopy cover < 10 %) (FAO, 2000). The canopy cover was assessed based on the pan-European Tree Cover Density (TCD) layer provided by Copernicus (https://land.copernicus.eu/en, last access: 18 September 2024).
Data collection included UAV and field surveys in summer 2021. We used a DJI Phantom 4 pro V2 quadcopter equipped with a RGB camera featuring a 2.54 cm CMOS sensor with 20 MP. Each UAV survey consisted of three flight paths: two of them with the camera in the nadiral position (one aligned along the contour lines and the other perpendicular), and one with an oblique camera perspective of 60° off-nadir, granting a more complete view of trees and terrain features.
To mitigate spatial resolution loss in the lower portion of the plot due to the slope steepness, each set of three flights was repeated two times. The first three flights covered the top half of the study area and were performed by deploying the drone from either the top-right or top-left corner of the study plot. The second set of three flights covered the bottom half of the plot and was performed by deploying the UAV from a point located on either the right or left side of the plot at approximately 150 m from the plot bottom (half the side length of the study plot). Flight height was fixed at 30 m above the highest point of the 300 × 300 m plot for the first set and above the middle of the study site for the second.
All the flights were performed on sunny, windless days to minimise shadowing from clouds and image distortions due to UAV irregular motion. To assess how different phenological stages and light conditions affect canopy detection, we performed UAV flights in Avic and Rion during the late vegetative period and late afternoon, respectively (Table 1). Images were captured with 80 % frontal and lateral overlaps to ensure high-quality structure-from-motion outputs. Prior to the UAV flights, 12 ground control points (GCPs) marked with bull's eye targets were placed within the flight area. Their positions were recorded using Trimble R2 and Reach RS2 GNSS (Global Navigation Satellite Systems) antennas, providing both sub-metric horizontal and vertical positioning accuracies with a 10 min static occupation time. GCP positions were post-processed for a final georeferencing correction. The acquired RGB aerial images were processed using Agisoft Metashape Pro software version 1.5.1. A Structure-from-Motion procedure was employed to generate 3D point clouds, from which we derived digital surface models (DSMs), and orthomosaics with 5 cm spatial resolution. The classification of ground and non-ground points in the point clouds was based on a threshold of 10 cm height of DSMs points: points lower than 10 cm were considered ground and used to produce the DTM. Canopy height models (CHMs) were then produced by subtracting the DTM from the DSM.
In the field, we recorded the position, height, and species of 50 randomly selected individual trees per study site, scattered across the plot. We used a sampling height threshold of 25 cm. In this study, we defined individual trees as individual tree crowns clearly separable from the other adjacent crowns. Due to its low abundance and specific growth form characteristics (Table 1), the dwarf mountain pine was not considered as a tree in our analyses. Tree height was measured using a TruPulse 200b (Crisel srl) or a measuring tape for smaller individuals. Tree positions were recorded using the same GNSS antennas described above, with a 3 to 5 min occupation time. The final ground-truth dataset included a total of 500 georeferenced trees across the ten sites.
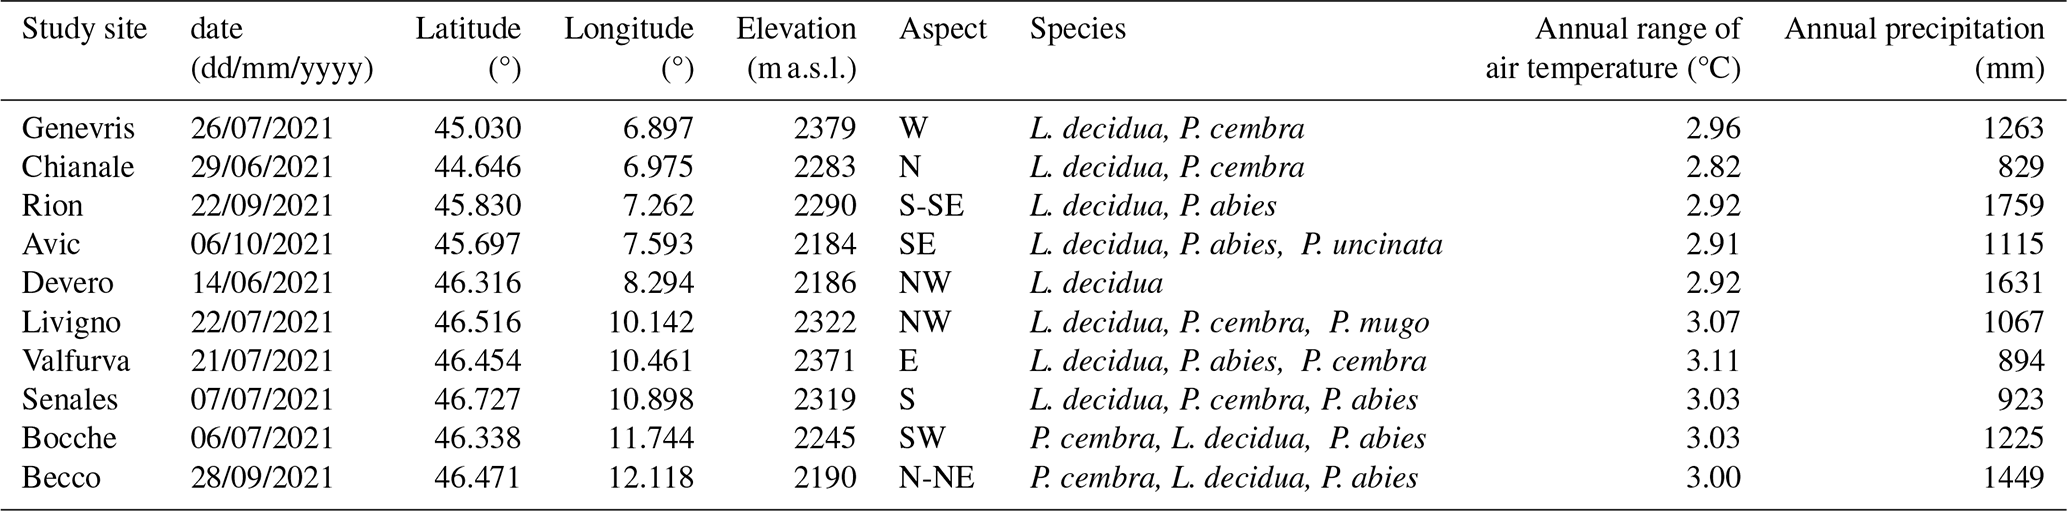
The entire workflow of the study, from data acquisition to final analyses, is reported in Fig. 2.
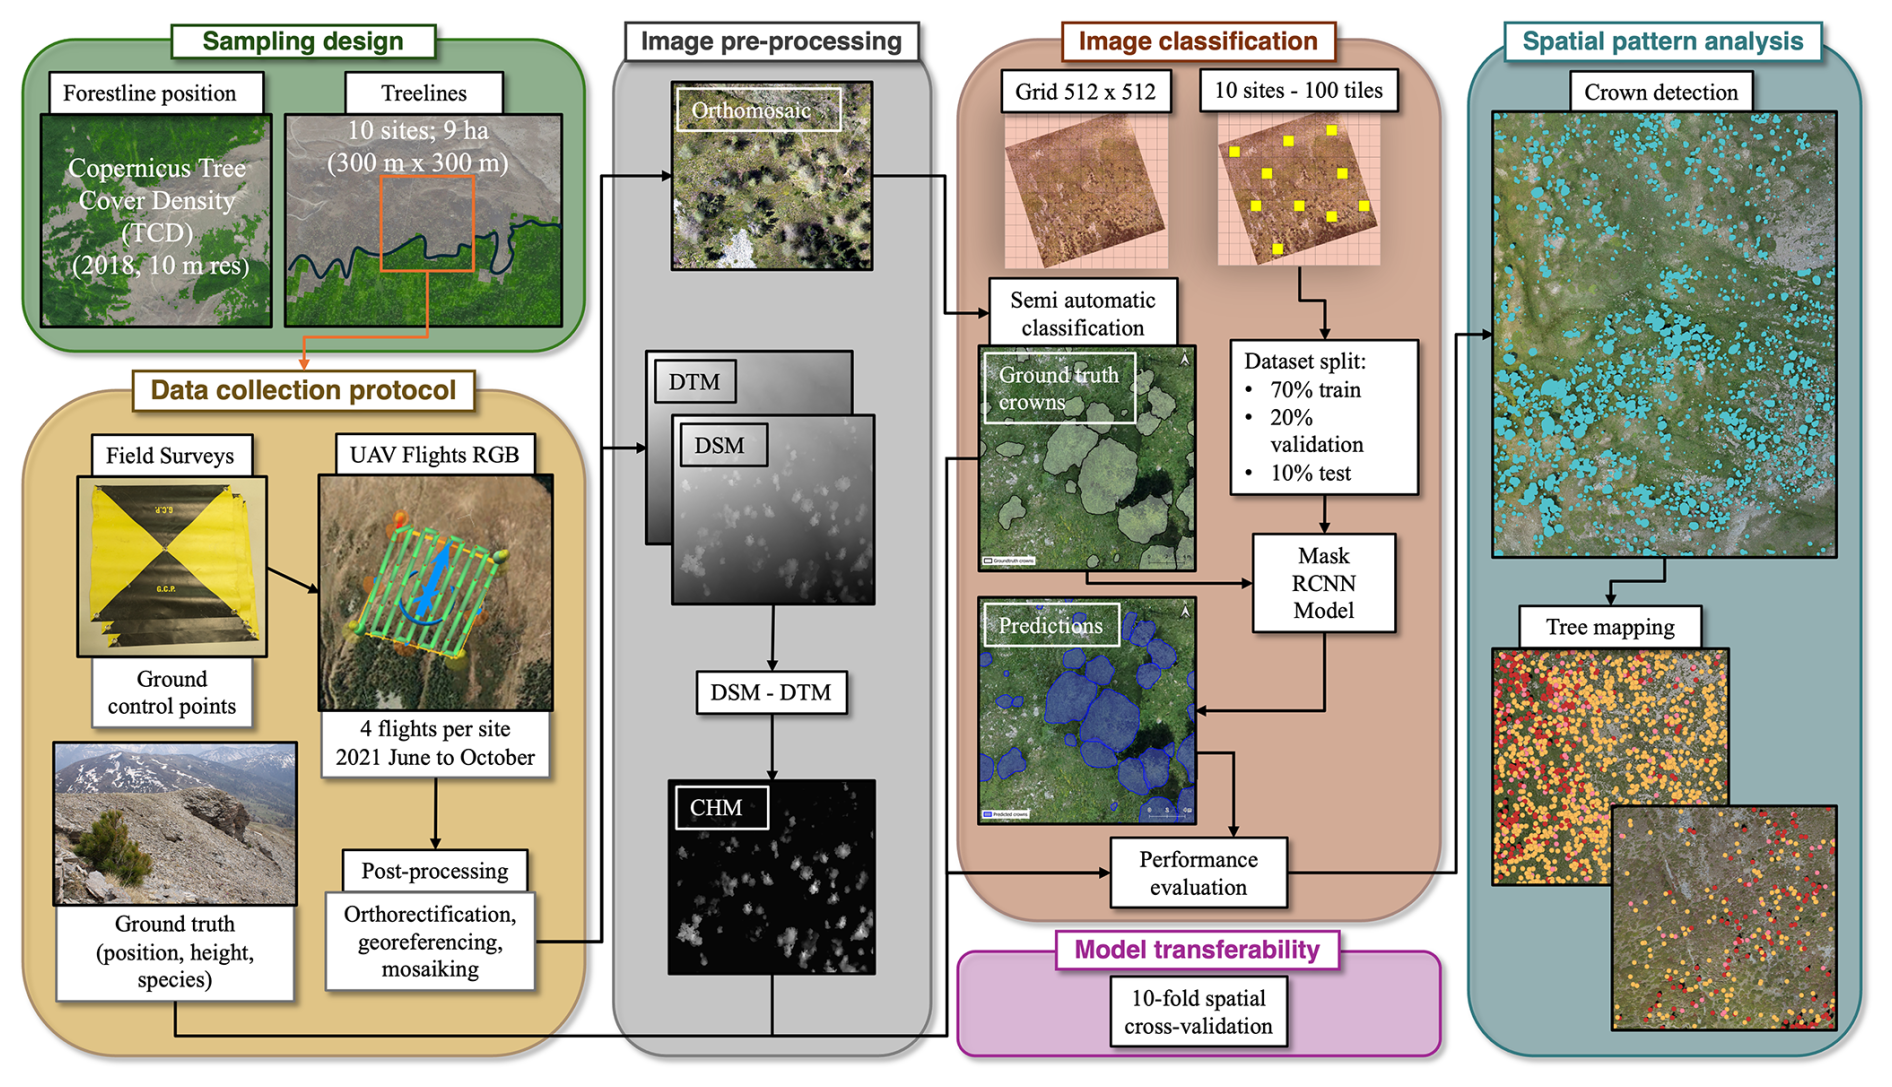
Figure 2Overview of the workflow adopted to conduct tree-scale analyses at the alpine treeline ecotone. Each box depicts a different methodological step of the study.
2.3 Deep learning modelling
To perform tree detection and segmentation we used a pre-trained deep learning (DL) model based on the Mask R-CNN algorithm implemented in the “Detectron2” library from Meta AI and available at https://github.com/facebookresearch/detectron2 (last access: 16 July 2024). Mask R-CNN is a DL framework which performs instance segmentation by combining semantic segmentation and object detection (Kattenborn et al., 2021). Its framework involves the generation of region of interest proposals by a deep fully convolutional network, and then there is a classification of the object of interest within each generated region proposal. Our methodology consisted of the following steps: (i) cropping the RGB orthomosaic of each study site into adjacent tiles of 512 × 512 pixels; (ii) systematically selecting 10 tiles per each study site to create the reference dataset; (iii) semi-automatic classification of tree crowns; (iv) hyperparameter tuning and model calibration using a dataset randomly split into training, validation, and testing subsets; (v) performance evaluation; (vi) separate validation and evaluation of model transferability through spatial cross-validation. Each of the steps is furtherly explained in the following sections. We selected tiles of 512 × 512 pixels (equivalent to 25.6 × 25.6 m at 5 cm spatial resolution) as this size resulted in models with higher detection rates and accuracy across all sites compared to smaller tiles of 128 × 128 and 256 × 256 pixels.
2.3.1 Training, validation, and test data
We here used only 5 % of the total amount of tiles for training, with the purpose of testing the limits of using a low number of training images on a pre-trained DL model. To build a strong reference dataset we fine-tuned the model using a Meta AI Segment Anything for the creation of individual validation polygons samples (https://github.com/facebookresearch/segment-anything, last access: 8 September 2025). Annotations were carried out by visual interpretation of RGB images, resulting in non-overlapping binary masks. To minimise operator biases photo interpretation was conducted by a single operator. The semi-automatically delineated validation polygons were used to evaluate the model performances in delineating tree crowns (see Sect. 2.3.3). At the end of the process, we obtained a dataset with a total of 1016 individual canopies of different coniferous species (larch trees n = 885, pine trees n = 131). All the segmented validation polygons were classified and labelled as “trees” regardless of the species due to the similar spectral information.
To generate the training, validation and test datasets, the reference dataset of 100 tiles (512 × 512) was split into 70 % of images for training, 20 % for validation, and 10 % for testing. The split in the three datasets was performed by systematically sampling the 512-pixel tiles in the reference dataset. The tiles were sampled diagonally in order to cover a larger surface of the study area and to minimise spatial autocorrelation. Finally, we assessed the performance of the model using the test dataset, consisting of tiles with which the model was not familiar. The model trained in this way was used to perform predictions on the rest of the tiles to generate tree maps. However, this type of dataset partitioning does not guarantee model transferability since images from all sites are included in each phase of training, validation, and testing. Hence, we performed a separate spatial cross validation to evaluate model generalizability. A k-fold spatial cross-validation was performed using training and validation datasets partitioned according to their geographic distribution. The dataset was partitioned into ten folds based on study sites. In each iteration, images from nine sites were used for training, while the remaining site's images were reserved exclusively for testing. This procedure was repeated across ten iterations, such that each site served as the test set once, thereby ensuring a leave-one-site-out cross-validation scheme. The outputs of the ten iterations through the entire dataset were finally averaged to achieve a mean F1 score, precision, recall, and average precision (AP) value.
2.3.2 Model development and hyper-parameter configuration
During training we used the Adam optimizer with a learning rate of 0.00025, 128 ROIs per image, 1500 epochs, and a batch size of 30. We used the R101-FPN configuration as it offers a good balance between training speed and segmentation accuracy (https://github.com/facebookresearch/detectron2/blob/main/MODEL_ZOO.md, last access: 16 July 2024). To prevent overfitting, we monitored the validation loss in the F1-score every 100 iterations and implemented early stopping if the F1-score declined for more than five evaluations. The model was trained with data augmentation consisting in random resizing and rotation of the input images.
We predicted tree crowns contours using the tiling process developed by Ball et al. (2023), which consists of creating a buffer around each tile to avoid splitting crowns located at the edges of the tiles. The overlapping crowns resulting from this operation were then filtered by removing those with the lowest confidence value assigned during the prediction. Classified maps were then post-processed to reduce noise and correct evident misclassifications. Crowns remaining after this cleaning process were considered valid tree detections. Model evaluation was computed prior to the cleaning process for all the evaluation metrics except detection rate (DET %) and IoU, which were calculated after the post-processing (see Sect. 2.4 for details).
2.3.3 Model performance assessment
To assess the performances of the DL model, we selected four evaluation metrics commonly used in individual tree detection studies (Beloiu et al., 2023; Dersch et al., 2023; Dietenberger et al., 2023; Xie et al., 2024): (i) precision (1), recall (2), F1 score (3), and average precision (4). The F1 score, a measure of test accuracy, is the weighted average of precision and recall; values closer to one indicate higher classification accuracy. The average precision is computed as the area under the precision-recall curve. It evaluates the quality of the classifier in retrieving the relevant instances.
To evaluate model transferability, we corroborated the results with a spatial cross-validation procedure. Metrics (1)–(4) were computed after each cross-validation fold and the results were averaged to achieve a mean estimate.
In addition, tree maps were evaluated in terms of two spatially explicit metrics: detection rate (DET %), and delineation accuracy (Intersection over Union, IoU). DET % is the ratio between the predicted number of trees and the number of trees measured in the field (5). It is computed to evaluate how many objects were correctly classified out of all the ground truth data. For the evaluation we used only field-sampled trees that did not belong to the training and validation datasets. The IoU is measured as the ratio between the area of overlap and the area of union of the ground truth crown and predicted crown (6), providing an estimate of the segmentation and delineation accuracy. Semi-automatically delineated validation polygons were used as ground truth for IoU assessment.
where TP are the true positives instances; FP are the false positive instances; FN are the false negatives (number of ground truth trees that the model did not detect).
where n is the number of thresholds; Rn is the recall at the nth threshold; Pn is the precision at the nth threshold.
To test our hypothesis on the effect of tree height on detection, delineation and attributes extraction performances trees were grouped into three size classes: small (height ≤ 130 cm), medium (130 cm < height ≤ 200 cm), and tall (height > 200 cm).
Thresholds for smaller and larger trees were chosen based on broadly accepted definitions of forest regeneration (130 cm; Dullinger et al., 2005; Wesche et al., 2008) and of “tree” at the treeline ecotone (200 cm; Holtmeier and Broll, 2017; Wieser et al., 2009), respectively.
Statistical differences in accuracy among these groups were evaluated using a Wilcoxon test with pairwise comparison. To further investigate how small trees impacted the model performances we conducted a separate analysis excluding individuals shorter than 50 cm (i.e., considering only trees with height > 50 cm). In this sense, we selected this threshold as the crown of these individuals occupied few pixels in the orthomosaics and were indistinguishable from the background.
2.4 Tree attributes assessment
Tree position estimation accuracy was assessed by comparing the field-collected coordinates of each tree with the centroid coordinates of the corresponding predicted crowns. For height estimation, we compared the value of the CHM at the predicted centroid with the height measured in the field. The evaluation metrics chosen for evaluating the accuracy in tree height and position were root mean square error (RMSE) and mean absolute error (MAE), both calculated in centimetres. RMSE is a standard deviation of prediction errors or residuals (7). The MAE shows how close the ground truth values and predicted values are to each other (8). It is obtained as the average absolute difference between the predicted value and the real value; hence, it gives an overall estimation of the error in terms of standard SI (International System) units. Position accuracy was also evaluated using the Euclidean distance between the centroid of each predicted crown and the corresponding stem position as recorded in the field (9). For tree height estimation accuracy, we also computed the deviation between real and predicted values calculated both in absolute and relative terms. RMSE, MAE, Euclidean distance and tree height accuracy were computed only for correctly predicted trees (n = 343) with the exclusion of the trees that fell within tiles used for training and validation of the neural network (n = 157). Tree attributes extraction accuracy assessment was performed using the same size classes listed in Sect. 2.3.3.
where n is the number of observations; xp,yp are the predicted values; xr,yr are the actual values.
3.1 Tree detection rate, delineation performances and transferability of the protocol
Our methodology allowed us to produce tree maps of the 10 treeline sites that reveal the treeline patterns of the study sites (Fig. 3). Overall, we mapped 14 737 trees. The Valfurva site was the densest, with 2990 trees, whereas Rion contained the fewest, with 499 trees. On average, each site contained 1474 trees. Across all sites, we mapped 7246 small trees, 1364 medium trees, and 6127 tall trees.
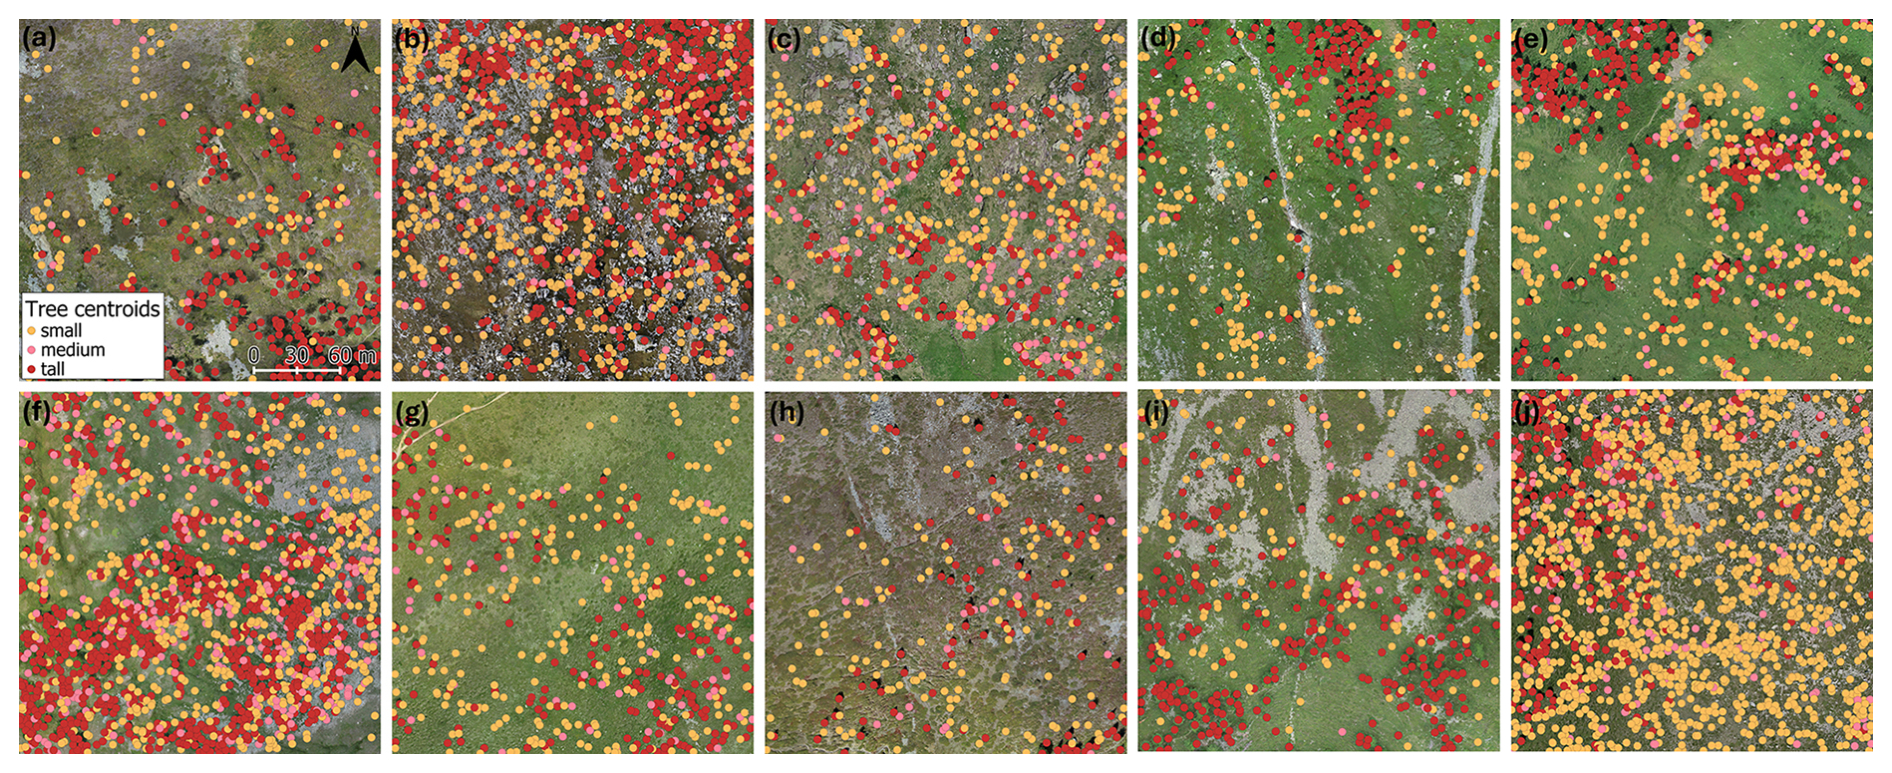
Figure 3Fine-scale stem-mapped treeline ecotones overlapped with the 9 ha orthophoto as a background image (a) Avic, (b) Becco, (c) Bocche, (d) Chianale, (e) Devero, (f) Genevris, (g) Livigno, (h) Rion, (i) Senales and (j) Valfurva. Trees belonging to the small, medium, and tall tree-height classes (Small: ≤ 130 cm; Medium: > 130 cm and < = 200 cm; Tall: > 200 cm) are in orange, pink, and red, respectively.
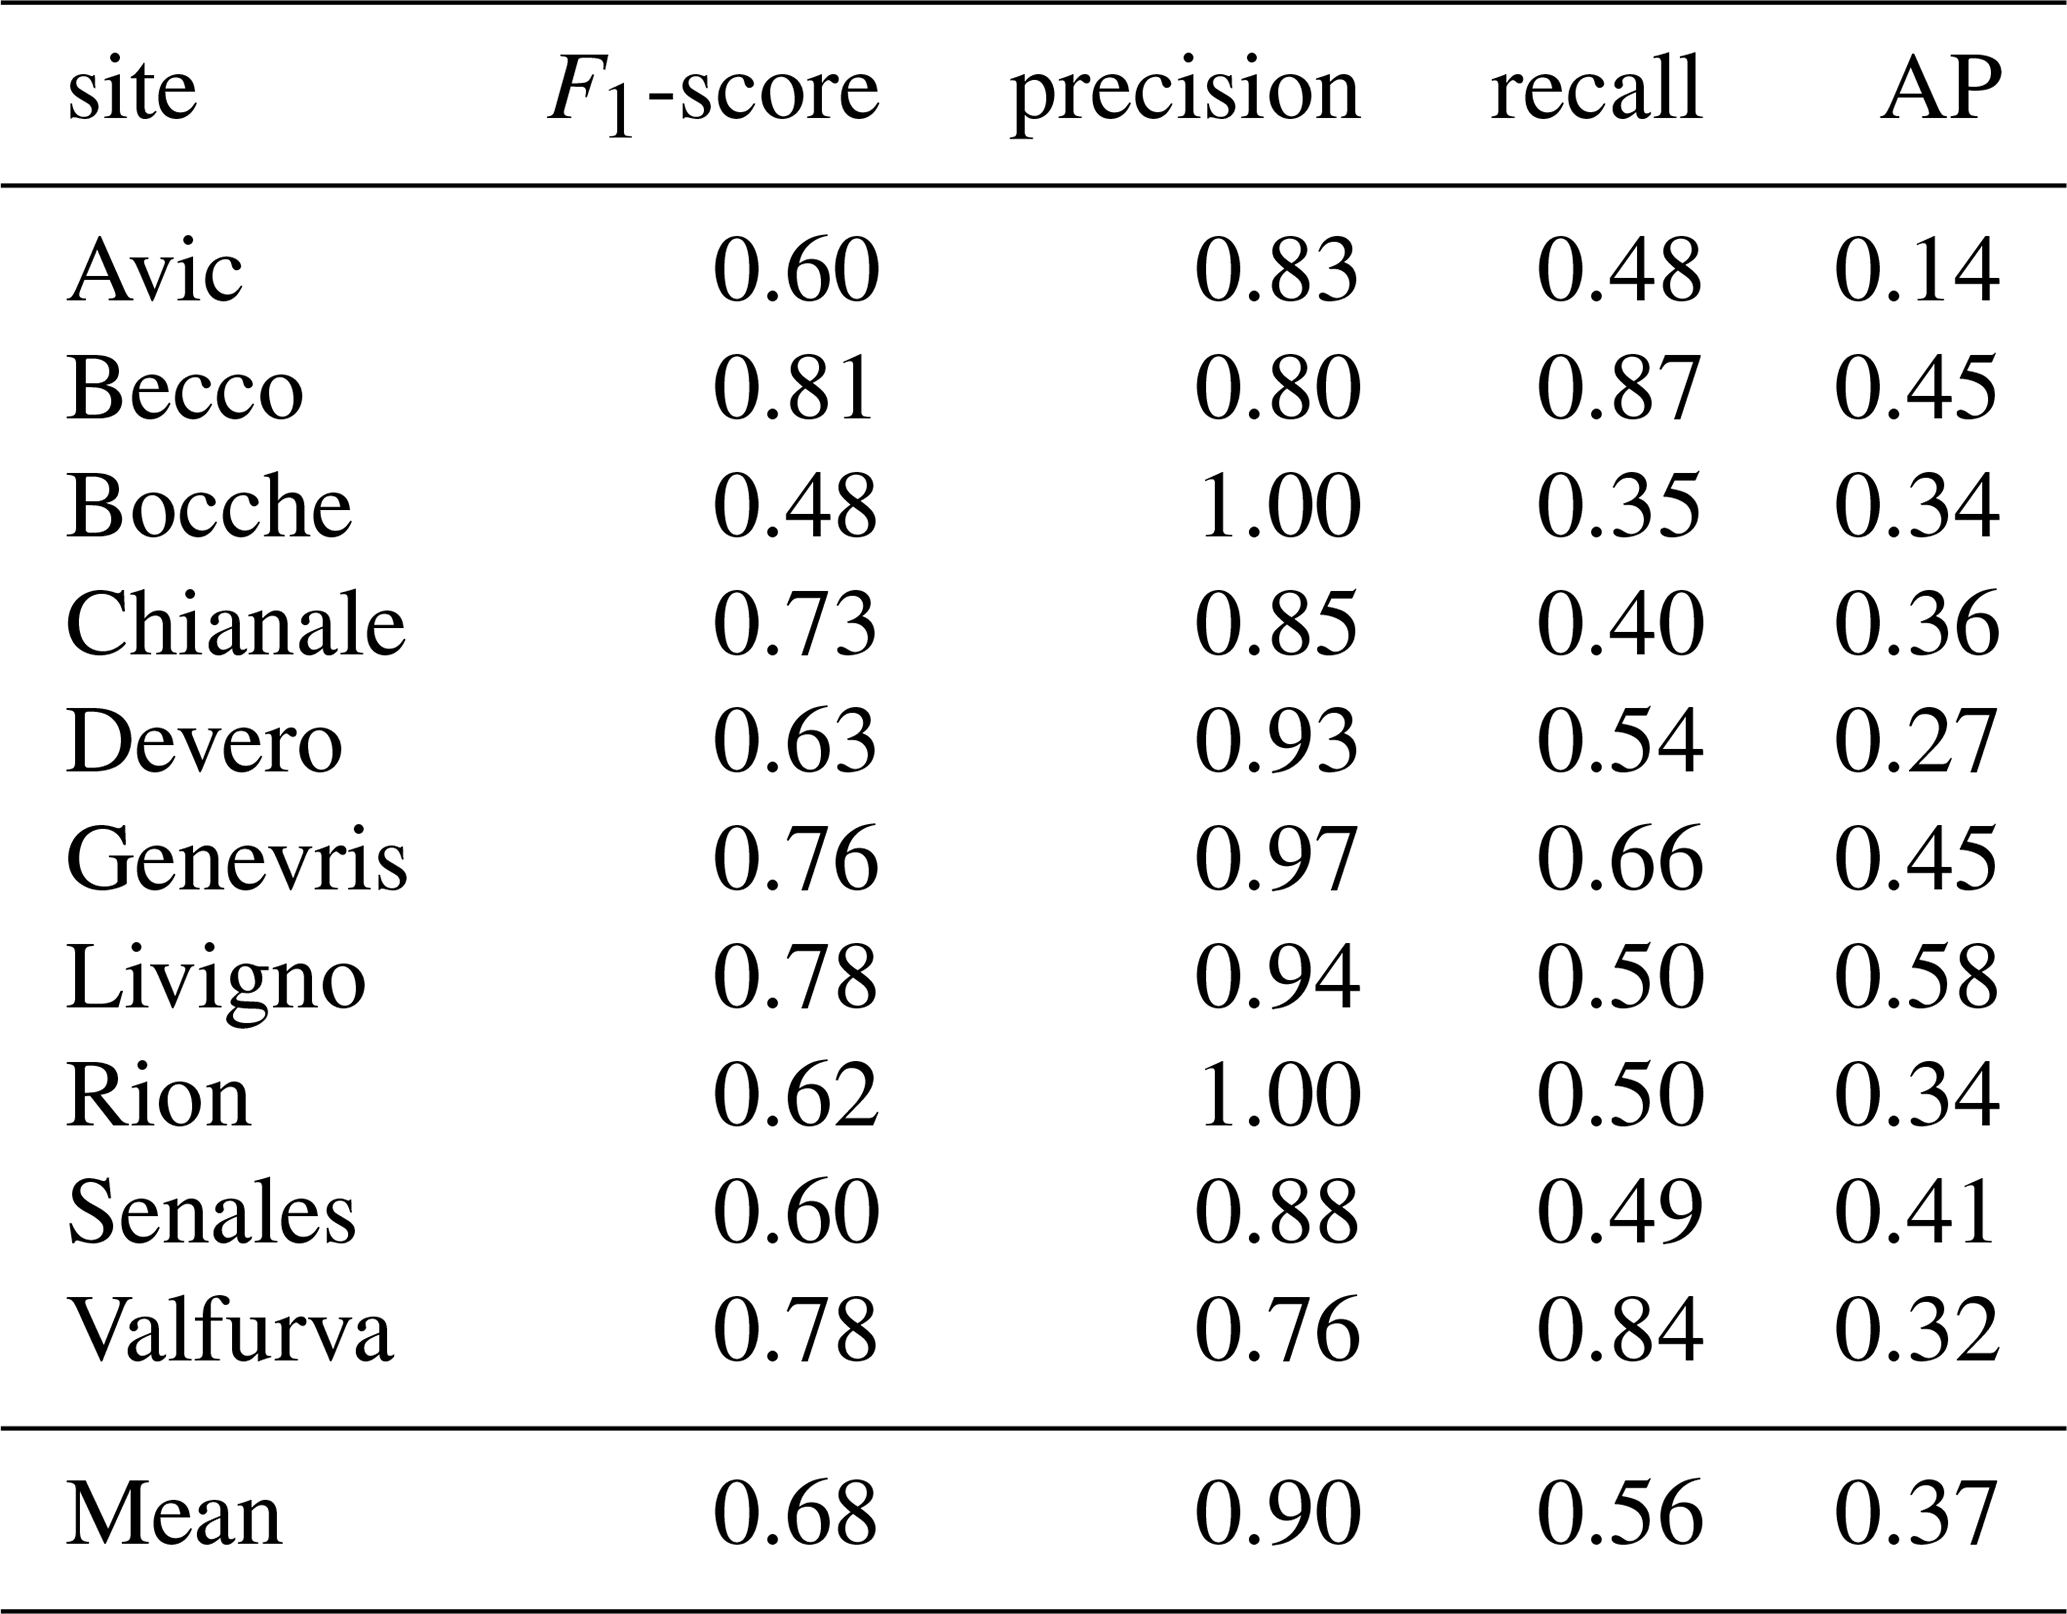
Throughout the evaluation process, the DL model achieved an F1 score of 0.76, precision of 0.92, recall of 0.79, and AP of 0.68. Spatial cross-validation confirmed the DL model generalizability to yet-unseen data, yielding an F1 score 0.68, precision of 0.90, recall of 0.56, and AP of 0.36 (Appendix B).
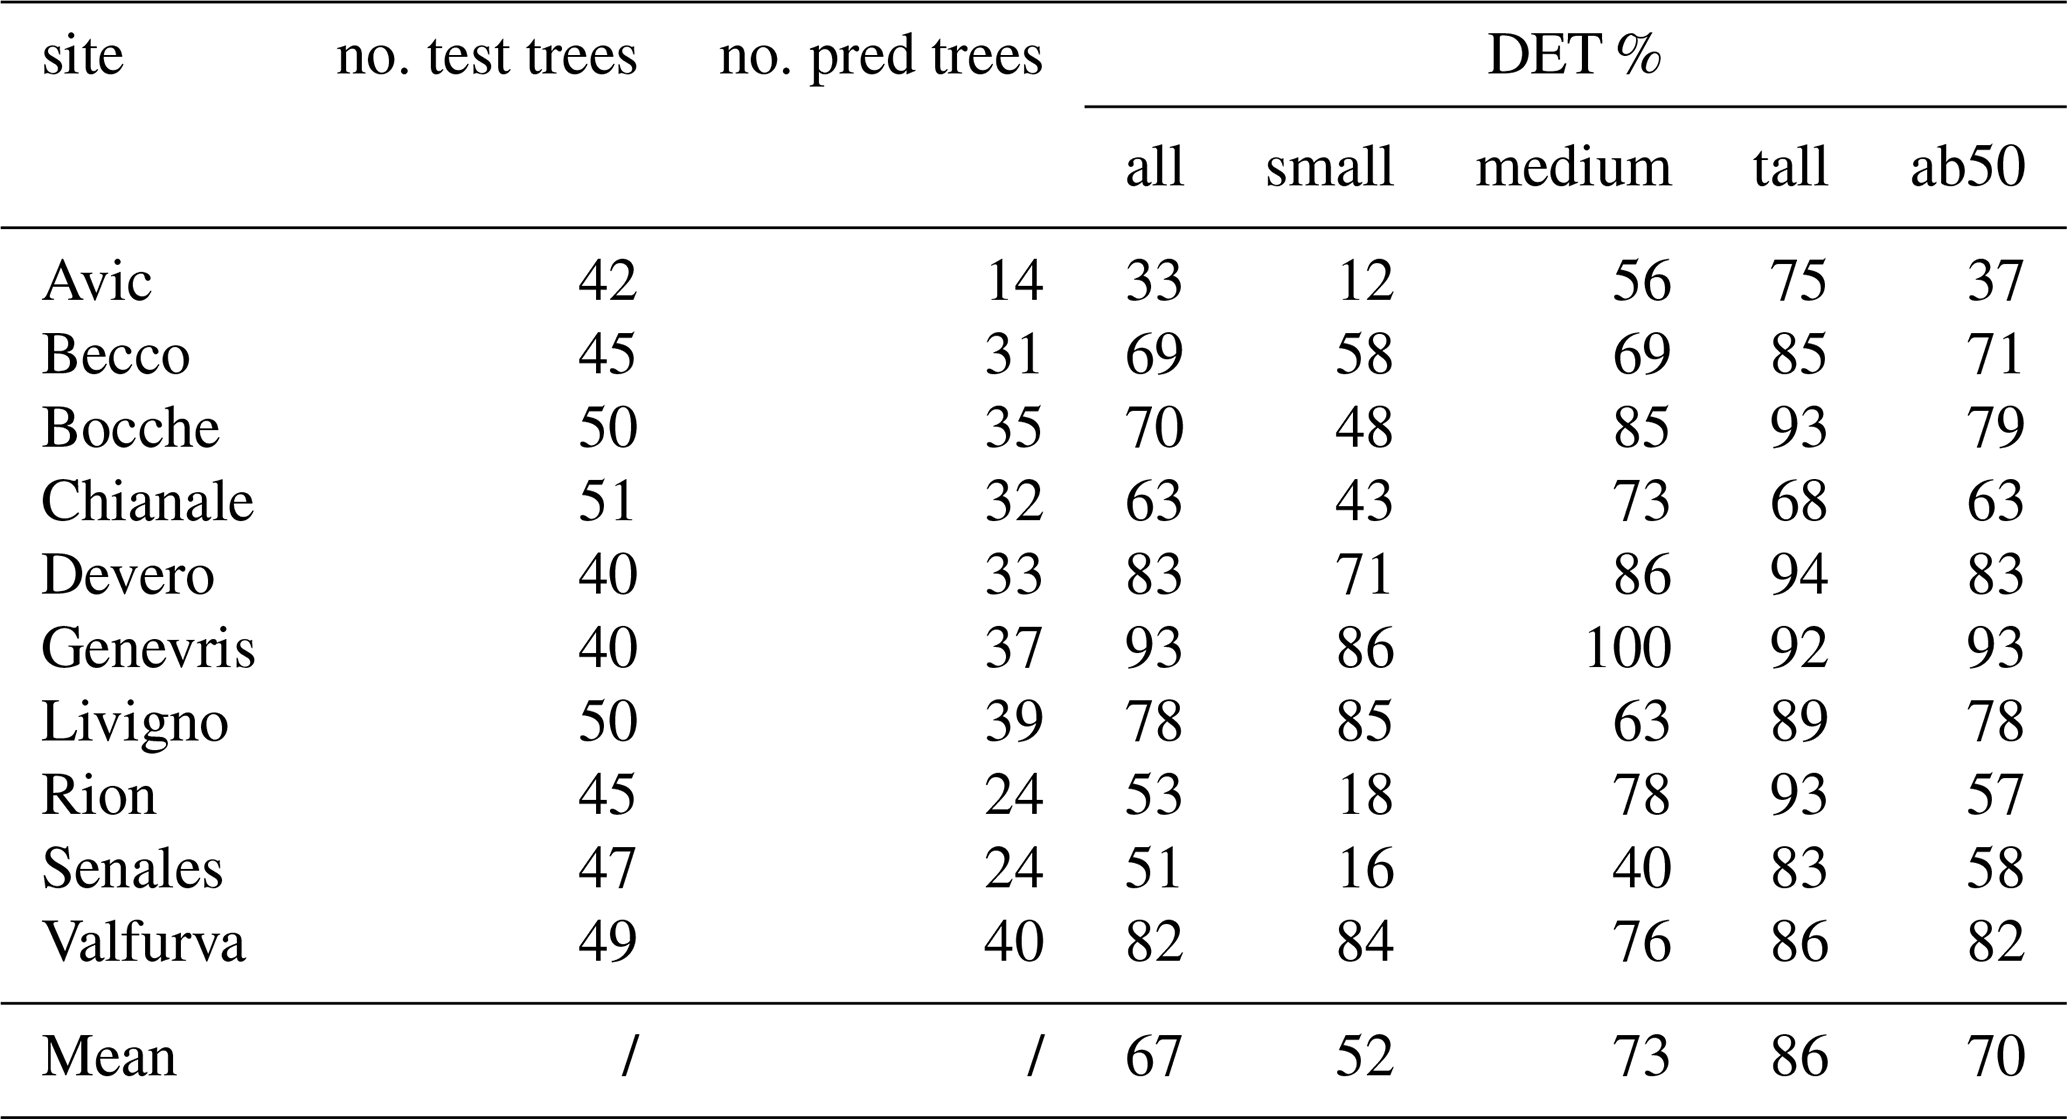
According to DET % results, the DL model detected 67 % of all the trees sampled in the field not included in the training and validation datasets (Table 2). Detection performance was lower for small trees, with a mean detection rate of 52 %. As expected, limiting the analysis to trees taller than 50 cm (DET % ab50) led to higher detection rates, resulting in a DET % = 70, thus confirming that smaller trees have a strong negative effect on the detection rate. When considering only tall trees (> 200 cm) we reached a mean detection rate of 86 %, further demonstrating the effect of size on detection rates. Among the study sites, Genevris was the site in which the best detection rates were registered (93 % for trees taller than 50 cm), followed by Valfurva, Devero, Bocche and Livigno, where the model correctly detected more than 78 % of all the trees. IoU results also showed a similar pattern, with tall trees achieving the best performances (IoU = 0.85). Medium and small trees achieved a mean IoU value of 0.72 and 0.70, respectively. The difference between tall trees' IoU and the other two classes' one was significantly different, as confirmed by a Wilcoxon test (Fig. 5a).
Table 2Single site detection rates and number of total predicted trees (no. pred trees) out of the totality of trees sampled in the field (no. test trees). DET % all = detection rate on the totality of individuals; DET % small = detection rate on small trees; DET % medium = detection rate on medium trees; DET % tall= detection rate on tall trees; DET % ab50 = detection rate on individuals taller than 50 cm.
3.2 Tree attributes estimation
The proposed method demonstrated that it was possible to accurately estimate tree positions and height. Trees' predicted position achieved a RMSE of 0.59 m and a MAE of 0.49 m. For most of the predictions, the Euclidean distance between predicted and reference points was less than one metre, with the majority of values around 30 cm (Fig. 4b). Interestingly, position accuracy increased with reducing tree height, resulting in lower deviation values for the two smaller classes (medium and small trees) (mean Euclidean distance value of 0.40 and 0.44 m, respectively; Fig. 5b). The Wilcoxon test highlighted a significant difference between the two smaller classes' results and the one obtained for tall trees, for which the mean Euclidean distance value was 0.61 m.
In regard to height estimations, despite some outliers, we observed a strong (R2=0.87) linear relationship between predictions and ground-truths (Fig. 4c). The coefficient of determination, the RMSE of 91.6 cm, and the MAE of 71.8 cm confirm that the SfM-derived point cloud can be used to accurately estimate tree heights. Nearly all height predictions deviated by less than one metre from ground truth values, with the most frequent relative deviation around 20 cm (Fig. 4d). Prediction accuracy increased with tree height: tall trees had the lowest mean deviation (0.23 m), followed by medium (0.47 m) and small trees (0.62 m) (Fig. 5c).
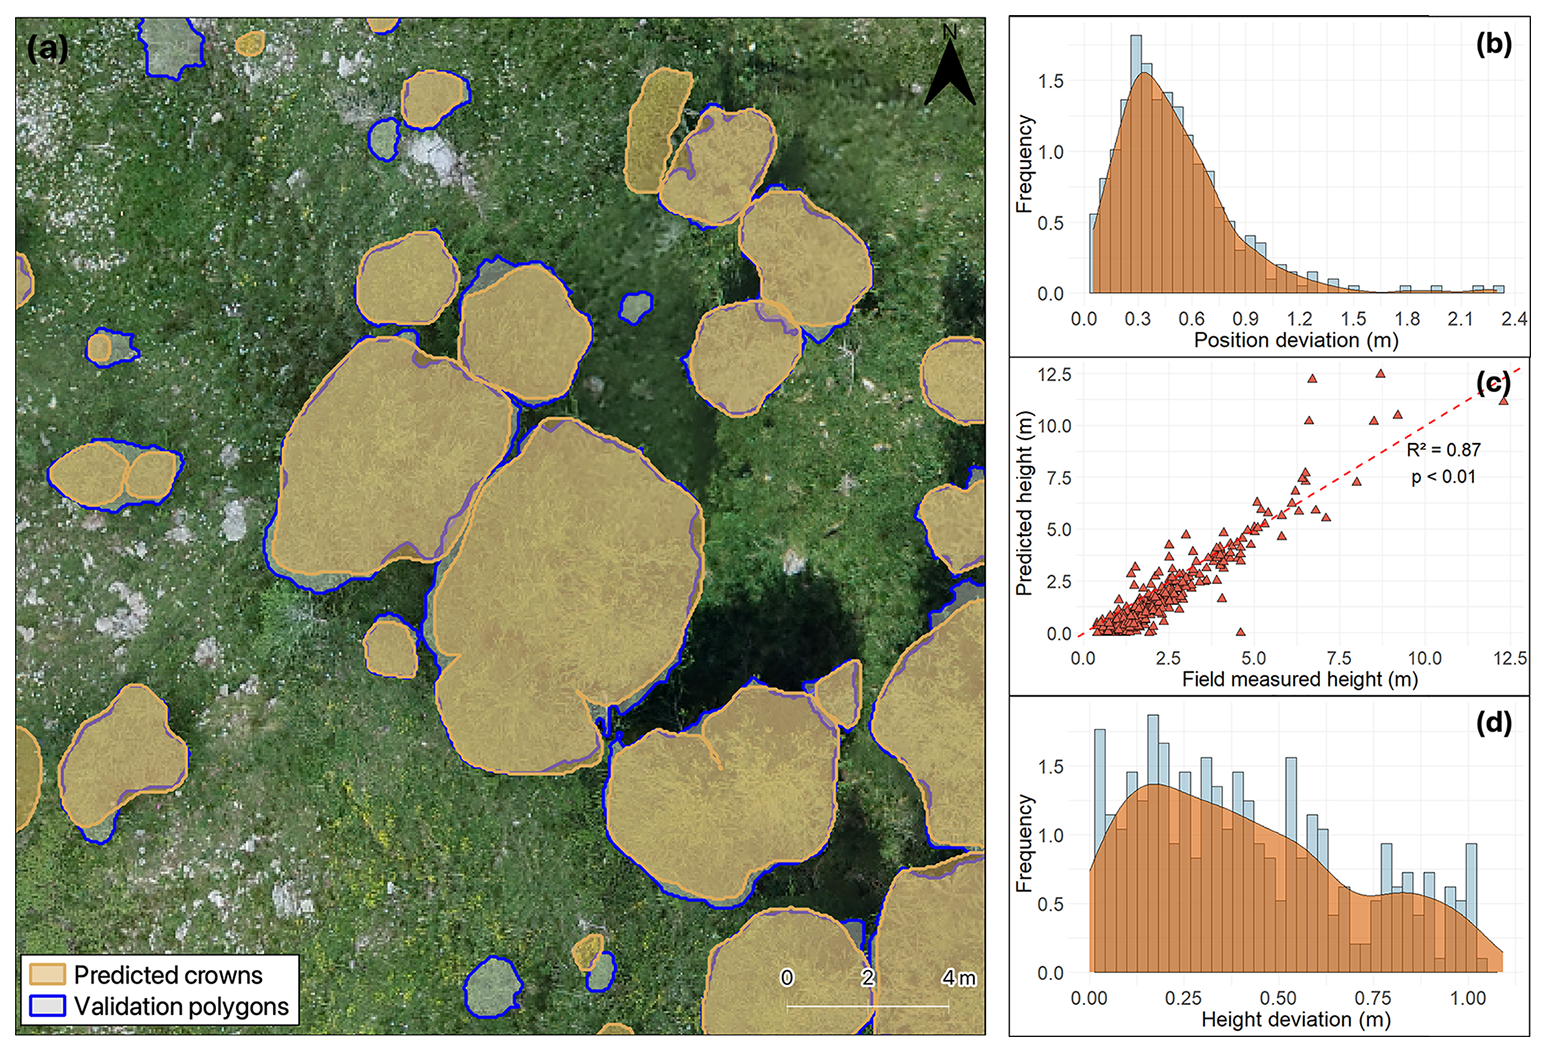
Figure 4(a) Instance segmentation output with a comparison of crowns predicted by the model (shaded with orange outline) and validation polygons (shaded with blue outline) in Genevris study site. The image illustrates how smaller trees were harder to detect by the model, with some missing segmentations. Frequency and smoothed kernel density distribution of (b) relative deviation for position estimation and (d) deviation for height estimations with the smoothed, continuous approximation of the kernel-density estimate in orange. (c) Linear regression model between the field-measured crown heights and estimated heights in metres. The red dashed line represents the 1:1 line.
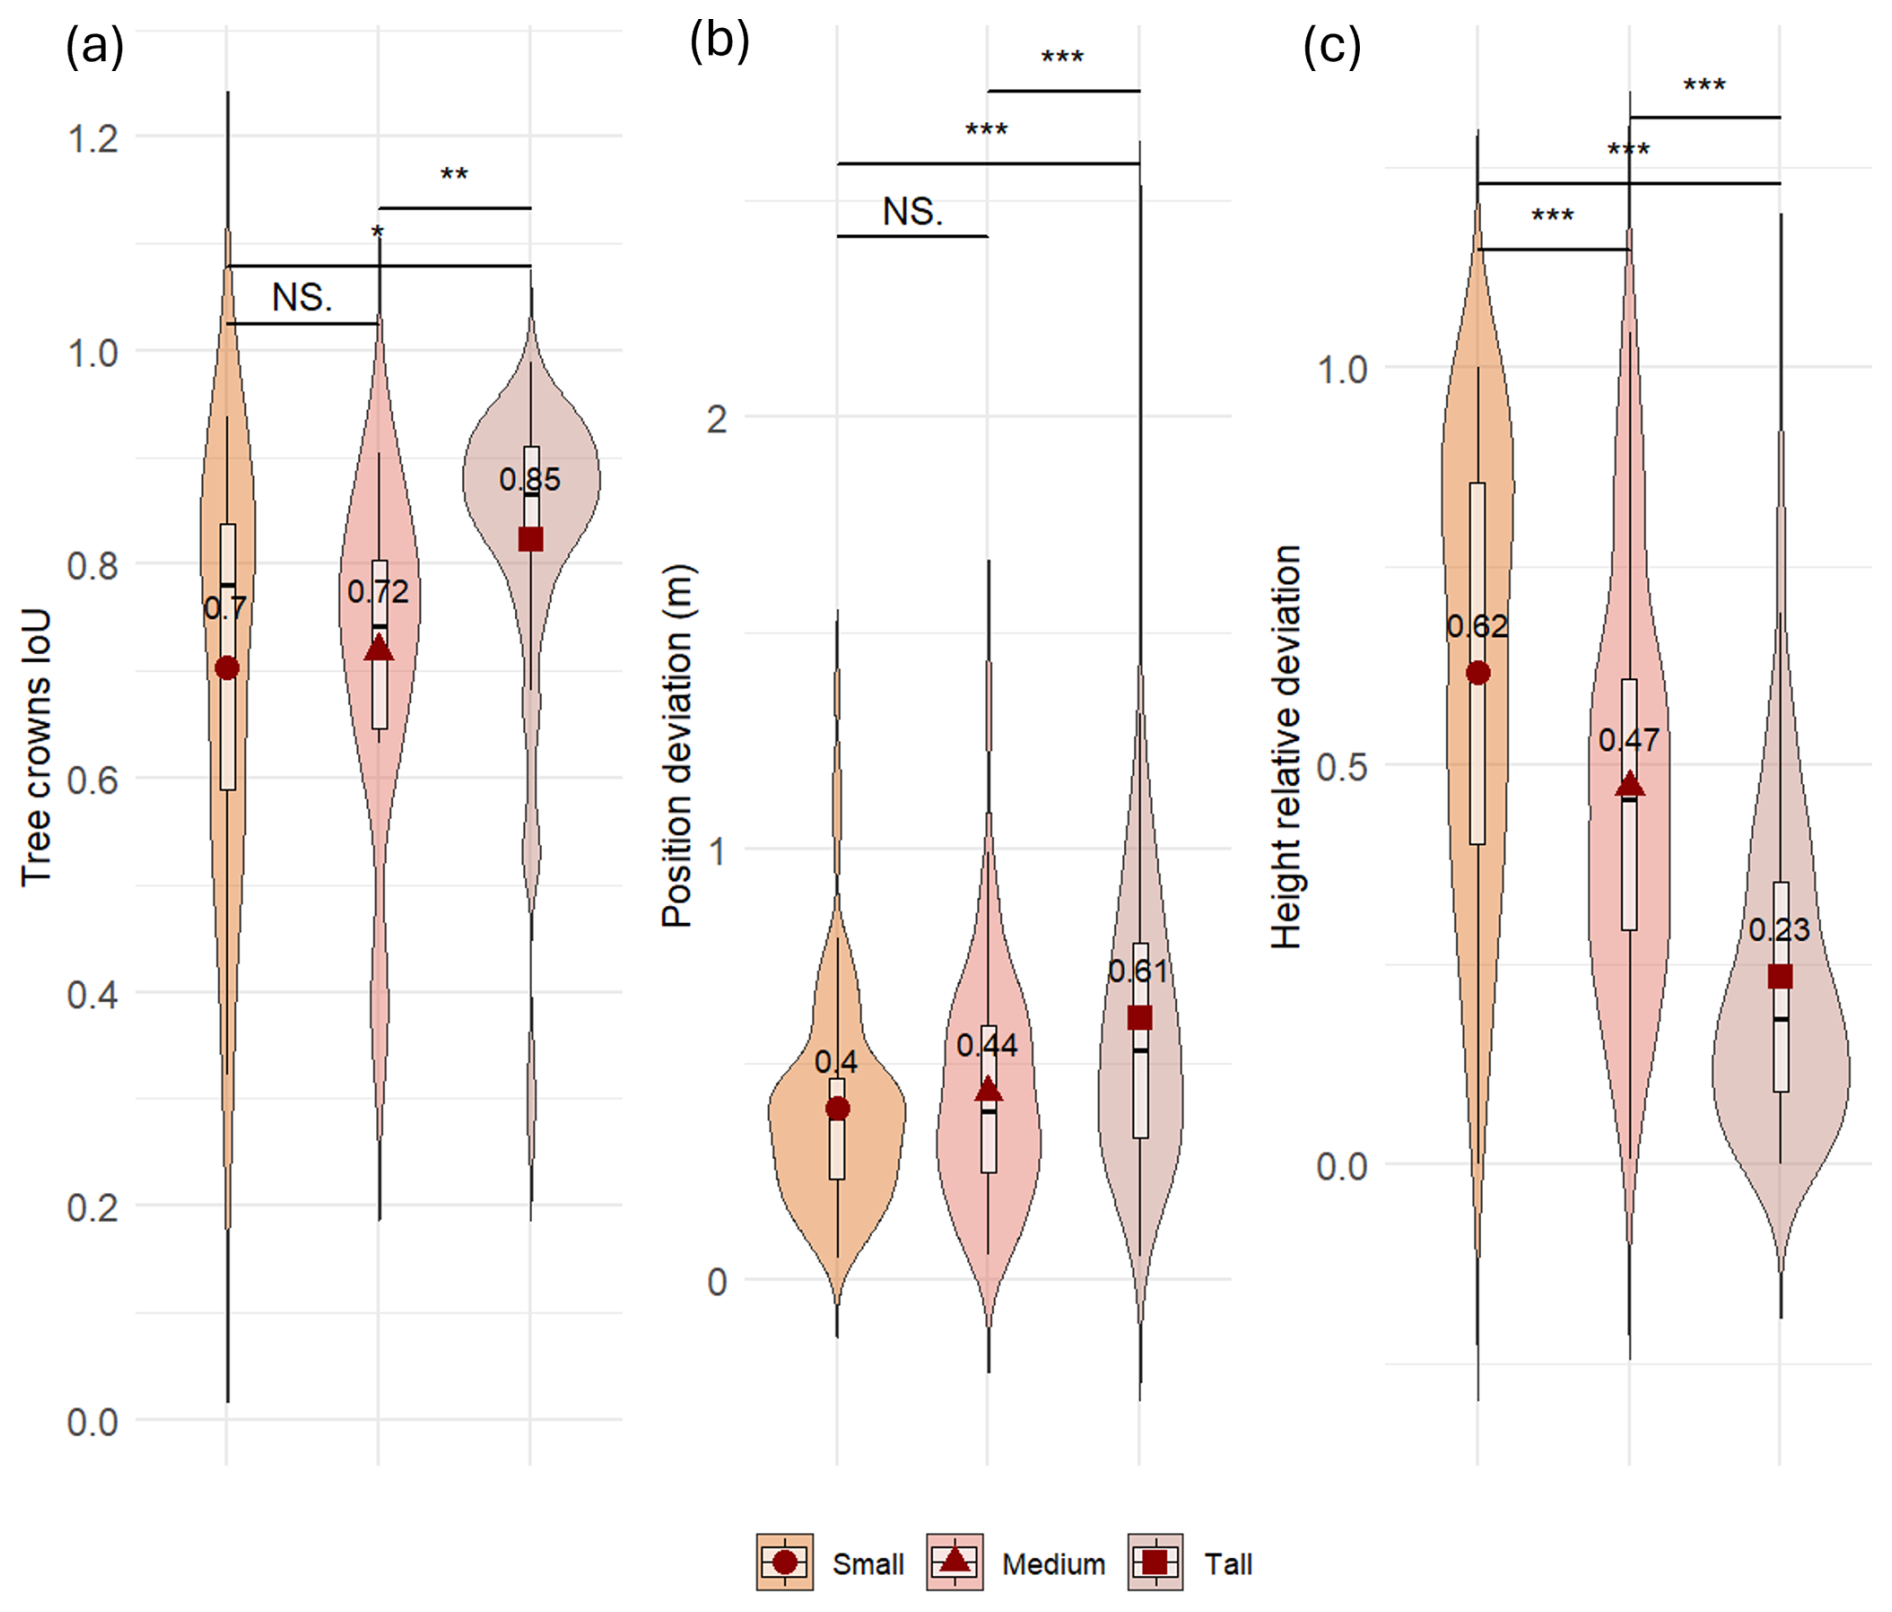
Figure 5Comparison of model performance for three tree-height classes (Small: ≤ 130 cm; Medium: > 130 cm and < = 200 cm; Tall: > 200 cm) in predicting trees (a) canopy surface and shape, measured as Intersection-over-Union (IoU) between predicted and reference crown polygons, (b) position deviation, measured as Euclidean distance (m) between predicted and reference tree centroids and, (c) height relative deviation, measured as absolute difference between predicted and reference height divided by the reference height. Violin plots width at a given value shows the kernel-density estimate of the distribution; the overlaid boxplot displays the interquartile range with the median (black line) and mean (dark-red diamonds). Statistical significance (pairwise Wilcoxon tests) is indicated as: NS = not significant; * p<0.05; p<0.01; p<0.001.
4.1 Detection performances
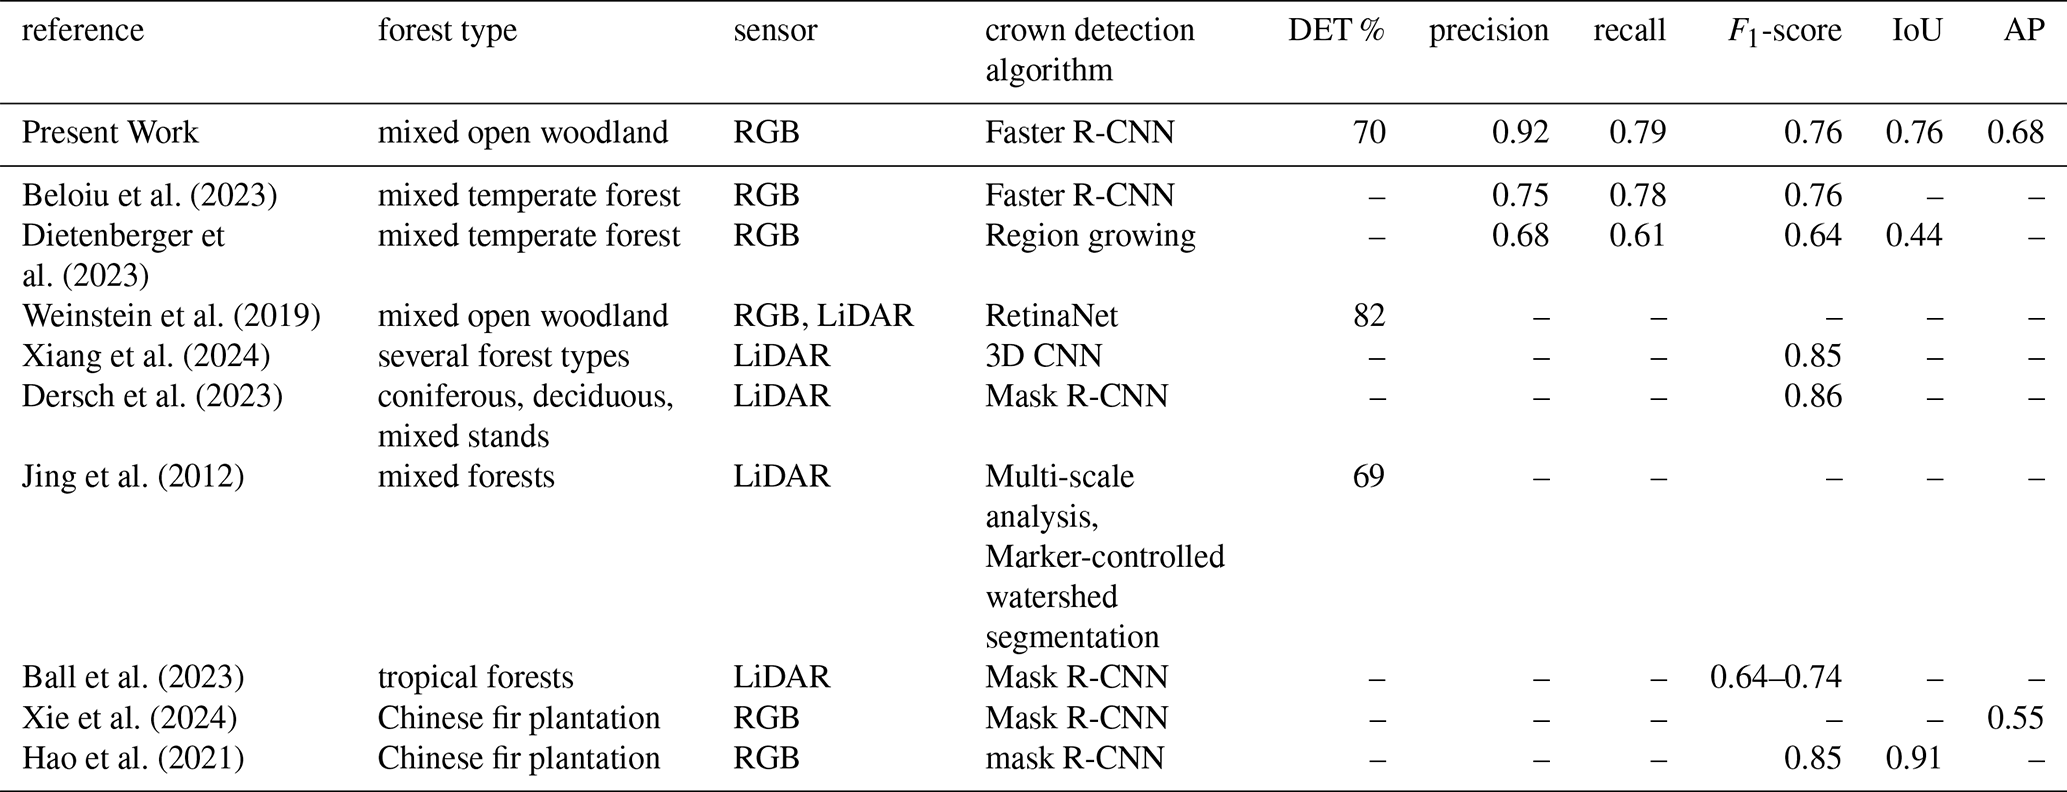
We demonstrated that RGB imagery from low-cost UAVs used in combination with a CNN model can be used for accurate tree detection across large, heterogeneous areas at elevational treelines. Previous studies have conducted similar analyses employing different segmentation strategies in various forest types. Our model achieved precision and recall values that surpass those reported in other studies (Beloiu et al., 2023; Dietenberger et al., 2023). The average IoU across different tree size classes was 0.76, lower than results from plantation-based studies (Hao et al., 2021), but superior to those from mixed temperate forests (Dietenberger et al., 2023). Regarding detection rates and F1 scores, our results fell within the typical range reported in comparable research (Table 3).
However, direct comparisons with other studies are challenging due to substantial differences in forest types, UAV data acquisition protocols, flight parameters, and the image classification algorithms employed. While our analysis outperformed others on certain metrics, it is important to note that our study was conducted in an environment where individual tree detection is facilitated by the reduced presence of intertwined canopies, unlike in tropical or temperate forests. Conversely, this advantage was offset by the inclusion of small trees in our analysis, a factor that negatively impacted the results and is often excluded in similar studies.
Table 3Performances of recent studies focused on tree detection and crown delineation in forest ecosystems using UAV-derived data. DET % = detection rate on the totality of individuals; IoU = Intersection over Union; AP = Average Precision.
We expected tree height to have a negative influence on model performance. By categorising trees in different size classes, we were able to track detection performance, confirming that accuracy improves with tree size in almost all study sites. Across all the study sites, detection was high for taller trees (86 %) but decreased for smaller ones (52 %), meeting our expectations. Although small trees detection is more cumbersome if compared to bigger trees, in some study sites (Devero, Genevris, Livigno, Valfurva) a considerable percentage of them was successfully delineated. The substantial difference in small trees detection across different sites can be linked back to several reasons. As already highlighted in recent studies, in addition to being inherently more challenging to detect in the imagery due to their diminished size, smaller trees often present altered lighting conditions due to being partially obscured or completely concealed by taller ones (Beloiu et al., 2023; Dietenberger et al., 2023; Hamraz et al., 2017), thus potentially leading to missed detections (i.e., false negatives). This problem is exacerbated in dense clusters (Vauhkonen et al., 2012), common in most of our study sites. Another critical challenge in tree detection is the blending of canopies colours with the background, a factor that largely depends on the tree, shrub, and herbaceous species on the site (Diez et al., 2021; Weinstein et al., 2019). Here, although the problem also affects tall trees, it was markedly more problematic for smaller ones. All above-mentioned issues are directly linked to the aerial dataset quality and features. Due to the high heterogeneity of ecotonal characteristics present in our study sites, it is possible that an interplay of all the above-mentioned issues affected detection rates and is thus responsible of the found inter-sites detection rate discrepancies. Nonetheless, according to our results, small trees detection using the proposed approach is feasible and brought to overall satisfying results which contributed to the generation of accurate treeline maps (Fig. 3).
Despite recent advancements in AI tools for object detection and segmentation, accurate identification of small trees in RGB images over large and heterogeneous areas is still cumbersome. Moreover, such improvement would remain unfeasible without significantly lowering flight height, which results in increasing extended survey times (Fromm et al., 2019). Nevertheless, due to the harsh environmental conditions at the treeline ecotone, long-term survival of small trees is jeopardised by factors such as unsuitable sites for survival (Davis and Gedalof, 2018; Marquis et al., 2021), failure to grow in harsh conditions (Crofts and Brown, 2020; Frei et al., 2018; Müller et al., 2016), and predation (Brown and Vellend, 2014; Cairns et al., 2007). While the precise mapping of small trees may be of secondary importance compared to taller, potentially permanent, trees when evaluating survival rates and seed distribution, small trees are crucial when investigating the encroachment process. As a consequence, small tree detection is of utmost importance in treeline ecology research and field surveys remain a valid and valuable approach over small study areas.
With the present work, we investigated how unique treeline characteristics influenced model performance. At the Avic treeline, where European larch is the dominant species, we tested the leaf-off effect on detection rate. Scarcity of green needles on the canopies resulted in lower performances (Table 2). This finding is consistent with previous studies underscoring how leaf-off season surveys are often correlated with lower detection accuracies (Imangholiloo et al., 2019).
The poor cross validation results from the Rion site highlight the substantial influence of illumination conditions on detection performances. As noted by Diez et al. (2021), low sun angles lead to variations in canopy color and the formation of long, distorted shadows, which can significantly impair detection accuracy.
These results reveal some of the main limitations of RGB-based approaches, underscoring the need of applying a standardised sampling protocol throughout all the study sites to augment results reliability or provide more input data to increase variability in the training dataset.
With the exception of Rion and Avic, a clear waning trend in tree detection related to a specific terrain feature of the site – presence of rocks (Becco), herbaceous species (Chianale) or others – was not found. These findings suggest that terrain characteristics had a negligible effect on detection rates, thus meeting our expectations and supporting the generalizability and transferability of the approach to treeline environments with differing features.
4.2 Tree attributes estimation and transferability of the protocol
The proposed approach has demonstrated the ability to accurately georeference individual trees (RMSE = 0.59 m; MAE = 0.49 m) and estimate their height (RMSE = 91.6 cm; MAE = 71.8 cm); some of the observed deviations may in fact be attributable to inaccuracies in the ground control data rather than the UAV images. Despite the high precision of the GNSS antenna employed, some small georeferencing errors are inevitable (e.g. due to limited sky view, positional accuracy can be limited). Additionally, during field surveys, GNSS points coordinates of tree locations are recorded near the base of the tree rather than directly below the real treetop, introducing further spatial errors (Shimizu et al., 2022; Vauhkonen et al., 2012). Nevertheless, our tree position estimations were highly satisfying and comparable with results obtained in other recent studies employing similar or more sophisticated equipment in environments with analogous open stands. For instance, Castilla et al. (2020) georeferenced coniferous species in a boreal forest using SfM point clouds achieving an RMSE of 20 cm, while Fernández-Guisuraga et al. (2018) extracted tree position of coniferous species in a post-fire environment attaining a RMSE < 30 cm.
Tree height estimations presented a trend skewed towards underestimation (Fig. 5c), an issue attributable to the low sharpness of the DSM generated through SfM, as also evidenced by Panagiotidis et al. (2017) and Wallace et al. (2016). Airborne laser scanning is the most well-known tool for DTM modelling due to its better capability in penetrating tree crowns, which often result in highly accurate estimation of tree features. However, in the present study we provide evidence that by means of photogrammetric point clouds it is possible to extract tree height with an accuracy comparable to that achieved using LiDAR sensors, which are still moderately expensive, thus limiting the feasibility of repeated surveys in many cases. Coops et al. (2013) assessed tree height over a Swiss treeline ecotone by employing LiDAR sensors with an RMSE of 0.70 m. Studies employing LiDAR technologies in boreal treelines documented a standard deviation of 0.11–0.73 m (Næsset and Nelson, 2007) and of 0.16–0.57 m (Næsset, 2009). Using LiDAR, Wallace et al. (2012) reported a mean height standard deviation of 0.24 m in a stand with sparse trees – a level of precision that clearly surpasses our results. However, when compared to studies using SfM point clouds for tree height estimation, our results demonstrate higher accuracy. For instance, Wallace et al. (2016) compared LiDAR and SfM-derived point clouds in a stand with spatially variable canopy cover, finding RMSE values of 0.92 m and 1.30 m, respectively – the latter being higher than ours. Similarly, Brieger et al. (2019) estimated tree heights in an open larch forest and reported a mean RMSE of 1.42 m, further supporting the comparatively greater accuracy of our photogrammetric approach for tree height estimation in open stands.
4.3 Limits and perspectives
We adapted an off-the-shelf model for a single-tree detection task at the treeline ecotone and employed AI-powered tools to generate training data. The presented procedure enabled fast and efficient dataset preparation, ultimately yielding accurate results. Our results show that combining low-cost UAV and sensors with open-source AI libraries allows for precise treeline mapping and the extraction of individual tree attributes across large areas, spanning wide latitudinal gradients and featuring diverse environmental conditions. The speed and accuracy of the analyses are further enhanced by the potential use of tree maps to support ecological studies in these sensitive transition zones. Although previous studies have investigated forested areas using AI and remote sensing data, to the best of our knowledge, none have examined an ecotonal surface as extensive as the one presented here (90 ha) using a high-resolution (5 cm) remote sensing approach.
Our detection rates were comparable to, or even exceeded, those reported in many other DL-based classification studies in natural forests. Nonetheless, despite the strong performance achieved, accurately recognising small individuals in RGB images remains a major challenge and a key limitation of RS-based approaches. As highlighted in recent scientific literature, LiDAR-informed segmentation approaches could provide a valuable alternative for comprehensive mapping of individual trees, filling the gap left by our methodology. Another crucial feature of great importance for many ecological analyses is the species composition of the community. The use of multi or hyperspectral sensors would solve this issue by enabling the classification of tree species and thus the analysis of species composition and interactions among individuals. Alternatively, species-level analyses are also possible with very-high-resolution RGB images acquired through low-elevation UAV flights achieving a very fine ground sampling density (∼ 1.6 cm pixel−1 (Egli and Höpke, 2020)), as they can reveal species-specific crown architecture and morphology.
Due to their dynamic nature, it is of great importance to study treeline ecotones in long-term monitoring research. For this task, we envision future research activities to apply the presented approach to simultaneously map and detect tree species at the treeline. The final goal is creating a global network of accurately mapped treeline datasets to monitor the effects of global change on treeline dynamics and explain the position and pattern of the treeline at different scales.
We tested the performance of a Mask R-CNN deep learning model in capturing single-tree attributes across 10 heterogeneous treeline ecotones, using UAV-derived structure-from-motion point clouds. UAV employment allowed us to conduct surveys in a more labour and time efficient manner compared to traditional ground-based methods while also increasing the spatial extent of the study area. Our results showed that the proposed approach can effectively produce fine-scale tree maps over 90 ha of treeline ecotones. The model successfully identified 70 % of trees taller than 50 cm and 86 % of trees taller than 2 m across the ten study sites in the Italian Alps. Beyond its success in detecting tree crowns, the approach also performed well in delineation tasks.
The present work underpins the possibility of using UAVs to advance treeline research, bridging the gap left by limited-in-scale and labor-intensive field surveys and less accurate satellite imagery. The ability to achieve such results with the low-cost equipment used in this study, combined with the flexibility of the protocol to site-specific conditions with minimal data preparation requirements, makes this approach both accessible to a wide range of scientists and forest managers and reliable. These features showcase the methodology as a valuable tool for enhanced ecological analyses of treeline processes, and several applications in forest assessment, ecological restoration, and conservation planning
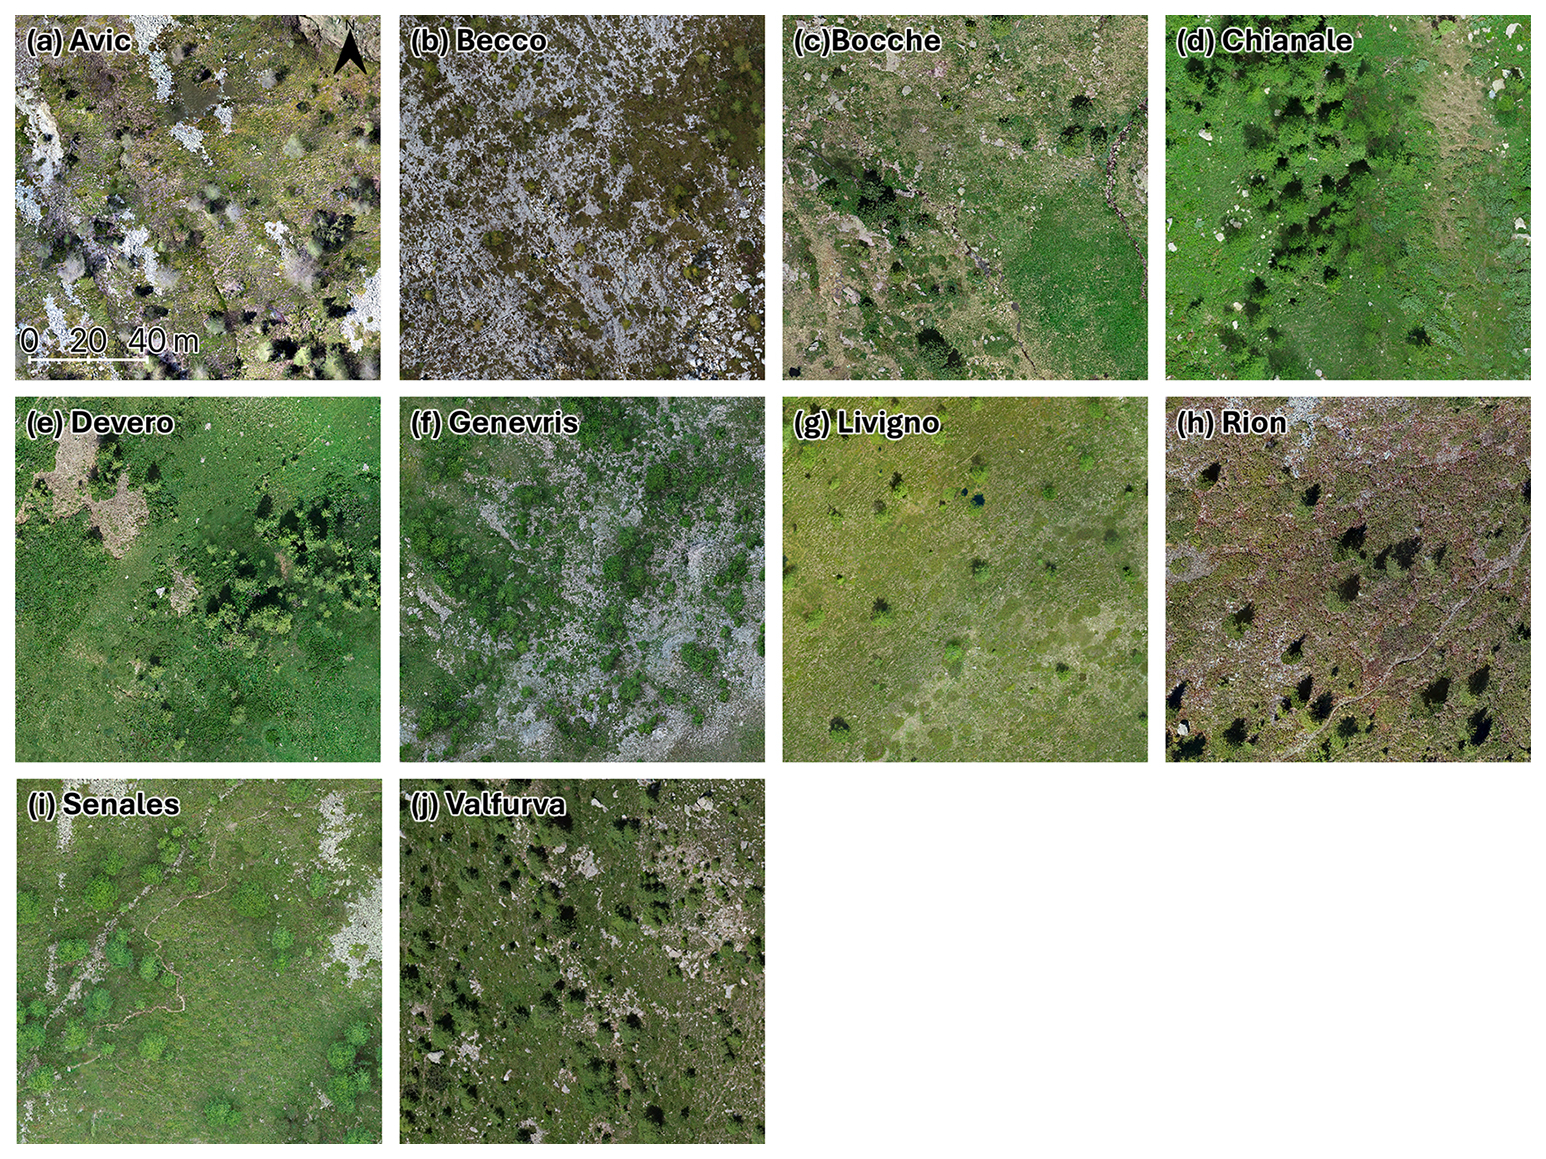
Figure A1Detail in the UAV-derived orthomosaic of (a) Avic, (b) Becco, (c) Bocche, (d) Chianale, (e) Devero, (f) Genevris, (g) Livigno, (h) Rion, (i) Senales and (j) Valfurva.
The code used in the analysis of this research is available upon request from the first author.
The data used in this research are available upon request from the first author.
EC: Methodology, formal analysis, investigation, data curation and writing – original draft preparation. DM: Conceptualization, methodology, formal analysis, investigation, data curation, supervision, writing – review and editing. FM: Data collection, data curation, writing – review and editing. NA: Conceptualization, methodology, investigation, data curation, supervision, writing – review and editing. EL: writing – review and editing. RM: writing – review and editing. CU: writing – review and editing. AV: writing – review and editing. MG: Conceptualization, methodology, investigation, funding acquisition, resources, supervision, writing – review and editing.
At least one of the (co-)authors is a guest member of the editorial board of Biogeosciences for the special issue “Treeline ecotones under global change: linking spatial patterns to ecological processes”. The peer-review process was guided by an independent editor, and the authors also have no other competing interests to declare.
This article is part of the special issue “Treeline ecotones under global change: linking spatial patterns to ecological processes”. It is a result of the EGU General Assembly 2024, session BG3.26 “Treeline ecotones under global change: linking spatial patterns to ecological processes”, Vienna, Austria, 15–16 April 2024.
This research has been supported by the Ministero dell'Università e della Ricerca (grant no. PRIN: PROGETTI DI RICERCA DI RILEVANTE INTERESSE NAZIONALE – Bando 2022 – project code: 20225S47P8).
This paper was edited by Frank Hagedorn and reviewed by Maaike Bader and one anonymous referee.
Ball, J. G. C., Hickman, S. H. M., Jackson, T. D., Koay, X. J., Hirst, J., Jay, W., Archer, M., Aubry-Kientz, M., Vincent, G., and Coomes, D. A.: Accurate delineation of individual tree crowns in tropical forests from aerial RGB imagery using Mask R-CNN, Remote Sensing in Ecology and Conservation, 9, 641–655, https://doi.org/10.1002/rse2.332, 2023.
Barros, C., Guéguen, M., Douzet, R., Carboni, M., Boulangeat, I., Zimmermann, N. E., Münkemüller, T., and Thuiller, W.: Extreme climate events counteract the effects of climate and land-use changes in Alpine tree lines, Journal of Applied Ecology, 54, 39–50, https://doi.org/10.1111/1365-2664.12742, 2017.
Bätzing, W., Perlik, M., and Dekleva, M.: Urbanization and Depopulation in the Alps, Mountain Research and Development, 16, 335–350, https://doi.org/10.2307/3673985, 1996.
Beloiu, M., Heinzmann, L., Rehush, N., Gessler, A., and Griess, V. C.: Individual Tree-Crown Detection and Species Identification in Heterogeneous Forests Using Aerial RGB Imagery and Deep Learning, Remote Sensing, 15, 1463, https://doi.org/10.3390/rs15051463, 2023.
Bennett, L., Yu, Z., Wasowski, R., Selland, S., Otway, S., and Boisvert, J.: Individual tree detection and classification from RGB satellite imagery with applications to wildfire fuel mapping and exposure assessments, International Journal of Wildland Fire, 33, https://doi.org/10.1071/WF24008, 2024.
Braga, J. R. G., Peripato, V., Dalagnol, R., Ferreira, M. P., Tarabalka, Y., Aragão, L. E. O. C., de Campos Velho, H. F., Shiguemori, E. H., and Wagner, F. H.: Tree crown delineation algorithm based on a convolutional neural network, Remote Sensing, 12, https://doi.org/10.3390/RS12081288, 2020.
Brieger, F., Herzschuh, U., Pestryakova, L. A., Bookhagen, B., Zakharov, E. S., and Kruse, S.: Advances in the Derivation of Northeast Siberian Forest Metrics Using High-Resolution UAV-Based Photogrammetric Point Clouds, Remote Sensing, 11, 1447, https://doi.org/10.3390/rs11121447, 2019.
Brown, C. D. and Vellend, M.: Non-climatic constraints on upper elevational plant range expansion under climate change, Proceedings of the Royal Society B: Biological Sciences, 281, https://doi.org/10.1098/rspb.2014.1779, 2014.
Brun, P., Zimmermann, N. E., Hari, C., Pellissier, L., and Karger, D. N.: Global climate-related predictors at kilometer resolution for the past and future, Earth System Science Data, 14, 5573–5603, https://doi.org/10.5194/essd-14-5573-2022, 2022.
Cairns, D. M., Lafon, C., Moen, J., and Young, A.: Influences of animal activity on treeline position and pattern: Implications for treeline responses to climate change, Physical Geography, 28, 419–433, https://doi.org/10.2747/0272-3646.28.5.419, 2007.
Callaway, R. M.: Positive interactions among plants, Bot. Rev, 61, 306–349, https://doi.org/10.1007/BF02912621, 1995.
Callaway, R. M.: Competition and Facilitation on Elevation Gradients in Subalpine Forests of the Northern Rocky Mountains, USA, Oikos, 82, 561–573, https://doi.org/10.2307/3546376, 1998.
Castilla, G., Filiatrault, M., McDermid, G. J., and Gartrell, M.: Estimating Individual Conifer Seedling Height Using Drone-Based Image Point Clouds, Forests, 11, 924, https://doi.org/10.3390/f11090924, 2020.
Chan, W.-P., Lenoir, J., Mai, G.-S., Kuo, H.-C., Chen, I.-C., and Shen, S.-F.: Climate velocities and species tracking in global mountain regions, Nature, 629, 114–120, https://doi.org/10.1038/s41586-024-07264-9, 2024.
Coops, N. C., Morsdorf, F., Schaepman, M. E., and Zimmermann, N. E.: Characterization of an alpine tree line using airborne LiDAR data and physiological modeling, Global Change Biology, 19, 3808–3821, https://doi.org/10.1111/gcb.12319, 2013.
Crofts, A. L. and Brown, C. D.: The importance of biotic filtering on boreal conifer recruitment at alpine treeline, Ecography, 43, 914–929, https://doi.org/10.1111/ecog.04899, 2020.
Davis, E. L. and Gedalof, Z.: Limited prospects for future alpine treeline advance in the Canadian Rocky Mountains, Global Change Biology, 24, 4489–4504, https://doi.org/10.1111/gcb.14338, 2018.
Dersch, S., Schöttl, A., Krzystek, P., and Heurich, M.: Towards complete tree crown delineation by instance segmentation with Mask R–CNN and DETR using UAV-based multispectral imagery and lidar data, ISPRS Open Journal of Photogrammetry and Remote Sensing, 8, 100037, https://doi.org/10.1016/j.ophoto.2023.100037, 2023.
Dietenberger, S., Mueller, M. M., Bachmann, F., Nestler, M., Ziemer, J., Metz, F., Heidenreich, M. G., Koebsch, F., Hese, S., Dubois, C., and Thiel, C.: Tree Stem Detection and Crown Delineation in a Structurally Diverse Deciduous Forest Combining Leaf-On and Leaf-Off UAV-SfM Data, Remote Sensing, 15, https://doi.org/10.3390/rs15184366, 2023.
Diez, Y., Kentsch, S., Fukuda, M., Caceres, M. L. L., Moritake, K., and Cabezas, M.: Deep learning in forestry using uav-acquired rgb data: A practical review, Remote Sensing, 13, https://doi.org/10.3390/rs13142837, 2021.
Dirnböck, T., Dullinger, S., and Grabherr, G.: A regional impact assessment of climate and land-use change on alpine vegetation, Journal of Biogeography, 30, 401–417, https://doi.org/10.1046/j.1365-2699.2003.00839.x, 2003.
Dirnböck, T., Essl, F., and Rabitsch, W.: Disproportional risk for habitat loss of high-altitude endemic species under climate change, Global Change Biology, 17, 990–996, https://doi.org/10.1111/j.1365-2486.2010.02266.x, 2011.
Dullinger, S., Dirnböck, T., Köck, R., Hochbichler, E., Englisch, T., Sauberer, N., and Grabherr, G.: Interactions among tree-line conifers: differential effects of pine on spruce and larch, Journal of Ecology, 93, 948–957, https://doi.org/10.1111/j.1365-2745.2005.01036.x, 2005.
Egli, S. and Höpke, M.: CNN-Based Tree Species Classification Using High Resolution RGB Image Data from Automated UAV Observations, Remote Sensing, 12, 3892, https://doi.org/10.3390/rs12233892, 2020.
Elliott, G. P. and Kipfmueller, K. F.: Multi-scale Influences of Slope Aspect and Spatial Pattern on Ecotonal Dynamics at Upper Treeline in the Southern Rocky Mountains, U.S.A, Arctic, Antarctic, and Alpine Research, 42, 45–56, https://doi.org/10.1657/1938-4246-42.1.45, 2010.
FAO: Global Forest Resources Assessment (FRA),FAO forestry paper 140, Food and Agriculture Organization of the United Nations, Rome, 2000.
Fernández-Guisuraga, J., Sanz-Ablanedo, E., Suárez-Seoane, S., and Calvo, L.: Using Unmanned Aerial Vehicles in Postfire Vegetation Survey Campaigns through Large and Heterogeneous Areas: Opportunities and Challenges, Sensors, 18, 586, https://doi.org/10.3390/s18020586, 2018.
Frei, E. R., Bianchi, E., Bernareggi, G., Bebi, P., Dawes, M. A., Brown, C. D., Trant, A. J., Mamet, S. D., and Rixen, C.: Biotic and abiotic drivers of tree seedling recruitment across an alpine treeline ecotone, Scientific Reports, 8, https://doi.org/10.1038/s41598-018-28808-w, 2018.
Fricker, G. A., Ventura, J. D., Wolf, J. A., North, M. P., Davis, F. W., and Franklin, J.: A convolutional neural network classifier identifies tree species in mixed-conifer forest from hyperspectral imagery, Remote Sensing, 11, https://doi.org/10.3390/rs11192326, 2019.
Fromm, M., Schubert, M., Castilla, G., Linke, J., and McDermid, G.: Automated Detection of Conifer Seedlings in Drone Imagery Using Convolutional Neural Networks, Remote Sensing, 11, 2585, https://doi.org/10.3390/rs11212585, 2019.
Garbarino, M., Malandra, F., Dilts, T., Flake, S., Montalto, L., Spinsante, S., and Weisberg, P. J.: Upper and lower treeline biogeographic patterns in semi-arid pinyon-juniper woodlands, Journal of Biogeography, 47, 2634–2644, https://doi.org/10.1111/jbi.13952, 2020.
Garbarino, M., Morresi, D., Anselmetto, N., and Weisberg, P. J.: Treeline remote sensing: from tracking treeline shifts to multi-dimensional monitoring of ecotonal change, Remote Sensing in Ecology and Conservation, 9, 729–742, https://doi.org/10.1002/rse2.351, 2023.
Gehrig-Fasel, J., Guisan, A., and Zimmermann, N. E.: Tree line shifts in the Swiss Alps: Climate change or land abandonment?, Journal of Vegetation Science, 18, 571–582, https://doi.org/10.1658/1100-9233(2007)18[571:TLSITS]2.0.CO;2, 2007.
Getzin, S., Dean, C., He, F., A. Trofymow, J., Wiegand, K., and Wiegand, T.: Spatial patterns and competition of tree species in a Douglas-fir chronosequence on Vancouver Island, Ecography, 29, 671–682, https://doi.org/10.1111/j.2006.0906-7590.04675.x, 2006.
Greenwood, S. and Jump, A. S.: Consequences of Treeline Shifts for the Diversity and Function of High Altitude Ecosystems, Arctic, Antarctic, and Alpine Research, 46, 829–840, https://doi.org/10.1657/1938-4246-46.4.829, 2014.
Grimm, V., Revilla, E., Berger, U., Jeltsch, F., Mooij, W. M., Railsback, S. F., Thulke, H.-H., Weiner, J., Wiegand, T., and DeAngelis, D. L.: Pattern-Oriented Modeling of Agent-Based Complex Systems: Lessons from Ecology, Science, 310, 987–991, https://doi.org/10.1126/science.1116681, 2005.
Hamraz, H., Contreras, M. A., and Zhang, J.: Vertical stratification of forest canopy for segmentation of understory trees within small-footprint airborne LiDAR point clouds, ISPRS Journal of Photogrammetry and Remote Sensing, 130, 385–392, https://doi.org/10.1016/j.isprsjprs.2017.07.001, 2017.
Hansson, A., Dargusch, P., and Shulmeister, J.: A review of modern treeline migration, the factors controlling it and the implications for carbon storage, Journal of Mountain Science, 18, 291–306, https://doi.org/10.1007/s11629-020-6221-1, 2021.
Hansson, A., Shulmeister, J., Dargusch, P., and Hill, G.: A review of factors controlling Southern Hemisphere treelines and the implications of climate change on future treeline dynamics, Agricultural and Forest Meteorology, 332, 109375, https://doi.org/10.1016/j.agrformet.2023.109375, 2023.
Hao, Z., Lin, L., Post, C. J., Mikhailova, E. A., Li, M., Chen, Y., Yu, K., and Liu, J.: Automated tree-crown and height detection in a young forest plantation using mask region-based convolutional neural network (Mask R-CNN), ISPRS Journal of Photogrammetry and Remote Sensing, 178, 112–123, https://doi.org/10.1016/j.isprsjprs.2021.06.003, 2021.
Harsch, M. A., Hulme, P. E., McGlone, M. S., and Duncan, R. P.: Are treelines advancing? A global meta-analysis of treeline response to climate warming, Ecology Letters, 12, 1040–1049, https://doi.org/10.1111/j.1461-0248.2009.01355.x, 2009.
Holmgren, P. and Thuresson, T.: Satellite remote sensing for forestry planning – A review, Scandinavian Journal of Forest Research, 13, 90–110, https://doi.org/10.1080/02827589809382966, 1998.
Holtmeier, F.-K. (Ed.): History and Present State of Timberline Research, in: Mountain Timberlines, Springer Netherlands, Dordrecht, 5–10, https://doi.org/10.1007/978-1-4020-9705-8_2, 2009.
Holtmeier, F.-K. and Broll, G.: Treeline advance – driving processes and adverse factors, Landscape Online, 1, 1–33, https://doi.org/10.3097/LO.200701, 2007.
Holtmeier, F.-K. and Broll, G.: Treelines – Approaches at Different Scales, Sustainability, 9, 808, https://doi.org/10.3390/su9050808, 2017.
Holtmeier, F.-K., Broll, G., Müterthies, A., and Anschlag, K.: Regeneration of trees in the treeline ecotone: northern Finnish Lapland, Fennia – International Journal of Geography, 181, 103–128, 2003.
Imangholiloo, M., Saarinen, N., Markelin, L., Rosnell, T., Näsi, R., Hakala, T., Honkavaara, E., Holopainen, M., Hyyppä, J., and Vastaranta, M.: Characterizing seedling stands using leaf-off and leaf-on photogrammetric point clouds and hyperspectral imagery acquired from unmanned aerial vehicle, Forests, 10, https://doi.org/10.3390/f10050415, 2019.
Jing, L., Hu, B., Li, J., and Noland, T.: Automated Delineation of Individual Tree Crowns from Lidar Data by Multi-Scale Analysis and Segmentation, Photogrammetric Engineering and Remote Sensing, 78, 1275–1284, https://doi.org/10.14358/PERS.78.11.1275, 2012.
Kattenborn, T., Leitloff, J., Schiefer, F., and Hinz, S.: Review on Convolutional Neural Networks (CNN) in vegetation remote sensing, ISPRS Journal of Photogrammetry and Remote Sensing, 173, 24–49, https://doi.org/10.1016/j.isprsjprs.2020.12.010, 2021.
Körner, C. and Paulsen, J.: A world-wide study of high altitude treeline temperatures, Journal of Biogeography, 31, 713–732, https://doi.org/10.1111/j.1365-2699.2003.01043.x, 2004.
Kyriazopoulos, A., Skre, O., Sarkki, S., Wielgolaski, F., Abraham, E., and Ficko, A.: Human-environment dynamics in European treeline ecosystems: A synthesis based on the DPSIR framework, Climate Research, 73, https://doi.org/10.3354/cr01454, 2017.
Leonelli, G., Masseroli, A., and Pelfini, M.: The influence of topographic variables on treeline trees under different environmental conditions, Physical Geography, 37, 56–72, https://doi.org/10.1080/02723646.2016.1153377, 2016.
Lett, S. and Dorrepaal, E.: Global drivers of tree seedling establishment at alpine treelines in a changing climate, Functional Ecology, 32, 1666–1680, https://doi.org/10.1111/1365-2435.13137, 2018.
Mainali, K., Shrestha, B. B., Sharma, R. K., Adhikari, A., Gurarie, E., Singer, M., and Parmesan, C.: Contrasting responses to climate change at Himalayan treelines revealed by population demographics of two dominant species, Ecology and Evolution, 10, 1209–1222, https://doi.org/10.1002/ece3.5968, 2020.
Malandra, F., Vitali, A., Urbinati, C., Weisberg, P. J., and Garbarino, M.: Patterns and drivers of forest landscape change in the Apennines range, Italy, Reg Environ Change, 19, 1973–1985, https://doi.org/10.1007/s10113-019-01531-6, 2019.
Marquis, B., Bergeron, Y., Simard, M., and Tremblay, F.: Disentangling the effect of topography and microtopography on near-ground growing-season frosts at the boreal-temperate forest ecotone (Québec, Canada), New Forests, 52, 1079–1098, https://doi.org/10.1007/s11056-021-09840-7, 2021.
McIntire, E. J. B. and Fajardo, A.: Beyond description: the active and effective way to infer processes from spatial patterns, Ecology, 90, 46–56, https://doi.org/10.1890/07-2096.1, 2009.
Mienna, I. M., Klanderud, K., Næsset, E., Gobakken, T., and Bollandsås, O. M.: Quantifying the roles of climate, herbivory, topography, and vegetation on tree establishment in the treeline ecotone, Ecosphere, 15, https://doi.org/10.1002/ecs2.4845, 2024.
Morley, P. J., Donoghue, D. N. M., Chen, J.-C., and Jump, A. S.: Integrating remote sensing and demography for more efficient and effective assessment of changing mountain forest distribution, Ecological Informatics, 43, 106–115, https://doi.org/10.1016/j.ecoinf.2017.12.002, 2018.
Mottl, O., Flantua, S. G. A., Bhatta, K. P., Felde, V. A., Giesecke, T., Goring, S., Grimm, E. C., Haberle, S., Hooghiemstra, H., Ivory, S., Kuneš, P., Wolters, S., Seddon, A. W. R., and Williams, J. W.: Global acceleration in rates of vegetation change over the past 18,000 years, Science, 372, 860–864, https://doi.org/10.1126/science.abg1685, 2021.
Müller, M., Schickhoff, U., Scholten, T., Drollinger, S., Böhner, J., and Chaudhary, R.: How do soil properties affect alpine treelines? General principles in a global perspective and novel findings from Rolwaling Himal, Nepal, Progress in Physical Geography, 40, 135–160, https://doi.org/10.1177/0309133315615802, 2016.
Næsset, E.: Influence of terrain model smoothing and flight and sensor configurations on detection of small pioneer trees in the boreal-alpine transition zone utilizing height metrics derived from airborne scanning lasers, Remote Sensing of Environment, 113, 2210–2223, https://doi.org/10.1016/j.rse.2009.06.003, 2009.
Næsset, E. and Nelson, R.: Using airborne laser scanning to monitor tree migration in the boreal-alpine transition zone, Remote Sensing of Environment, 110, 357–369, https://doi.org/10.1016/j.rse.2007.03.004, 2007.
Nasiri, V., Darvishsefat, A. A., Arefi, H., Pierrot-Deseilligny, M., Namiranian, M., and Le Bris, A.: Unmanned aerial vehicles (Uav)-based canopy height modeling under leaf-on and leaf-off conditions for determining tree height and crown diameter (case study: Hyrcanian mixed forest), Canadian Journal of Forest Research, 51, 962–971, https://doi.org/10.1139/cjfr-2020-0125, 2021.
Nguyen, T.-A., Rußwurm, M., Lenczner, G., and Tuia, D.: Multi-temporal forest monitoring in the Swiss Alps with knowledge-guided deep learning, Remote Sensing of Environment, 305, https://doi.org/10.1016/j.rse.2024.114109, 2024.
Panagiotidis, D., Abdollahnejad, A., Surový, P., and Chiteculo, V.: Determining tree height and crown diameter from high-resolution UAV imagery, International Journal of Remote Sensing, 38, 2392–2410, https://doi.org/10.1080/01431161.2016.1264028, 2017.
Qin, H., Zhou, W., Yao, Y., and Wang, W.: Individual tree segmentation and tree species classification in subtropical broadleaf forests using UAV-based LiDAR, hyperspectral, and ultrahigh-resolution RGB data, Remote Sensing of Environment, 280, https://doi.org/10.1016/j.rse.2022.113143, 2022.
Ramírez, L. A., Flinspach, L., Nikolić, N., Toivonen, J., and Bader, M. Y.: Microsite preferences of three conifers in calcareous and siliceous treeline ecotones in the French alps, Alpine Botany, https://doi.org/10.1007/s00035-024-00319-7, 2024.
Salazar Villegas, M. H., Wiegand, T., González-M, R., Rodriguez-Buritica, S., Qasim, M., and Csaplovics, E.: Spatial facilitation and competition regulate tree species assembly in a tropical dry forest, Front. For. Glob. Change, 6, https://doi.org/10.3389/ffgc.2023.1028515, 2023.
Shimizu, K., Nishizono, T., Kitahara, F., Fukumoto, K., and Saito, H.: Integrating terrestrial laser scanning and unmanned aerial vehicle photogrammetry to estimate individual tree attributes in managed coniferous forests in Japan, International Journal of Applied Earth Observation and Geoinformation, 106, https://doi.org/10.1016/j.jag.2021.102658, 2022.
Simard, M., Pinto, N., Fisher, J. B., and Baccini, A.: Mapping forest canopy height globally with spaceborne lidar, Journal of Geophysical Research: Biogeosciences, 116, https://doi.org/10.1029/2011JG001708, 2011.
Smith, W. K., Germino, M. J., Hancock, T. E., and Johnson, D. M.: Another perspective on altitudinal limits of alpine timberlines, Tree Physiology, 23, 1101–1112, https://doi.org/10.1093/treephys/23.16.1101, 2003.
Van Bogaert, R., Haneca, K., Hoogesteger, J., Jonasson, C., Dapper, M., and Callaghan, T.: A century of tree line changes in sub-Arctic Sweden shows local and regional variability and only a minor influence of 20th century climate warming, Journal of Biogeography, 38, 907–921, https://doi.org/10.1111/j.1365-2699.2010.02453.x, 2011.
Vauhkonen, J., Ene, L., Gupta, S., Heinzel, J., Holmgren, J., Pitkanen, J., Solberg, S., Wang, Y., Weinacker, H., Hauglin, K. M., Lien, V., Packalen, P., Gobakken, T., Koch, B., Naesset, E., Tokola, T., and Maltamo, M.: Comparative testing of single-tree detection algorithms under different types of forest, Forestry, 85, 27–40, https://doi.org/10.1093/forestry/cpr051, 2012.
Vitali, A., Camarero, J. J., Garbarino, M., Piermattei, A., and Urbinati, C.: Deconstructing human-shaped treelines: Microsite topography and distance to seed source control Pinus nigra colonization of treeless areas in the Italian Apennines, Forest Ecology and Management, 406, 37–45, https://doi.org/10.1016/j.foreco.2017.10.004, 2017.
Vitali, A., Garbarino, M., Camarero, J. J., Malandra, F., Toromani, E., Spalevic, V., Čurović, M., and Urbinati, C.: Pine recolonization dynamics in Mediterranean human-disturbed treeline ecotones, Forest Ecology and Management, 435, 28–37, https://doi.org/10.1016/j.foreco.2018.12.039, 2019.
Wallace, L., Lucieer, A., Watson, C., and Turner, D.: Development of a UAV-LiDAR system with application to forest inventory, Remote Sensing, 4, 1519–1543, https://doi.org/10.3390/rs4061519, 2012.
Wallace, L., Lucieer, A., Malenovský, Z., Turner, D., and Vopěnka, P.: Assessment of Forest Structure Using Two UAV Techniques: A Comparison of Airborne Laser Scanning and Structure from Motion (SfM) Point Clouds, Forests, 7, 62, https://doi.org/10.3390/f7030062, 2016.
Weinstein, B. G., Marconi, S., Bohlman, S., Zare, A., and White, E.: Individual Tree-Crown Detection in RGB Imagery Using Semi-Supervised Deep Learning Neural Networks, Remote Sensing, 11, 1309, https://doi.org/10.3390/rs11111309, 2019.
Wesche, K., Cierjacks, A., Assefa, Y., Wagner, S., Fetene, M., and Hensen, I.: Recruitment of trees at tropical alpine treelines: Erica in Africa versus Polylepis in South America, Plant Ecology and Diversity, 1, 35–46, https://doi.org/10.1080/17550870802262166, 2008.
Wieser, G., Matyssek, R., Luzian, R., Zwerger, P., Pindur, P., Oberhuber, W., and Gruber, A.: Effects of atmospheric and climate change at the timberline of the Central European Alps, Ann. For. Sci., 66, 402, https://doi.org/10.1051/forest/2009023, 2009.
Williams, A., Allen, C., Macalady, A., Griffin, D., Woodhouse, C., Meko, D., Swetnam, T., Rauscher, S., Seager, R., Grissino-Mayer, H., Dean, J., Cook, E., Gangodagamage, C., Cai, M., and McDowell, N.: Temperature as a potent driver of regional forest drought stress and tree mortality, Nature Climate Change, 3, 292–297, https://doi.org/10.1038/NCLIMATE1693, 2013.
Xiang, B., Wielgosz, M., Kontogianni, T., Peters, T., Puliti, S., Astrup, R., and Schindler, K.: Automated forest inventory: Analysis of high-density airborne LiDAR point clouds with 3D deep learning, Remote Sensing of Environment, 305, https://doi.org/10.1016/j.rse.2024.114078, 2024.
Xie, Y., Wang, Y., Sun, Z., Liang, R., Ding, Z., Wang, B., Huang, S., and Sun, Y.: Instance segmentation and stand-scale forest mapping based on UAV images derived RGB and CHM, Computers and Electronics in Agriculture, 220, https://doi.org/10.1016/j.compag.2024.108878, 2024.
Zierl, B. and Bugmann, H.: Sensitivity of carbon cycling in the European Alps to changes of climate and land cover, Climatic Change, 85, 195–212, https://doi.org/10.1007/s10584-006-9201-8, 2007.