the Creative Commons Attribution 4.0 License.
the Creative Commons Attribution 4.0 License.
Mineral formation during shipboard ocean alkalinity enhancement experiments in the North Atlantic
Lukas Marx
Frieder Klein
Chloe L. Dean
Emily Burdige
Matthew Hayden
Daniel C. McCorkle
Adam V. Subhas
Ocean alkalinity enhancement (OAE) is a carbon dioxide (CO2) removal approach that involves the addition of alkaline substances to the marine environment to increase seawater buffering capacity and allow it to absorb more atmospheric CO2. Increasing seawater alkalinity leads to an increase in the saturation state (Ω) with respect to several minerals, which may trigger mineral precipitation, consuming the added alkalinity and thus decreasing the overall efficiency of OAE. To explore mineral formation due to alkalinity addition, we present results from shipboard experiments in which an aqueous solution of NaOH was added to unfiltered seawater collected from the surface ocean in the Sargasso Sea. Alkalinity addition ranged from 500 to 2000 µmol kg−1, and the carbonate chemistry was monitored through time by measuring total alkalinity (TA) and dissolved inorganic carbon (DIC), which were used to calculate Ω. The amount of precipitate and its mineralogy were determined throughout the experiments. Mineral precipitation took place in all experiments over a timescale of hours to days. The dominant precipitate phase is aragonite with trace amounts of calcite and magnesium hydroxide (MgOH2, i.e., brucite). Aragonite crystallite size increases and its micro-strain decreases with time, consistent with Ostwald ripening. The precipitation rate (r) in our experiments and those of other OAE-related calcium carbonate precipitation studies correlate with the aragonite saturation state (ΩA), and the resulting fit of log10(r) = n × log10 (ΩA−1) + log10 (k) yields a reaction order n=2.15 ± 0.50 and a rate constant k=0.20 ± 0.10 µmol h−1. The reaction order is comparable to that derived from previous studies, but the rate constant is 1 order of magnitude lower, which we attribute to the fact that our experiments are unseeded compared with previous studies that used aragonite seeds which act as nuclei for precipitation. Observable precipitation was delayed by an induction period, the length of which is inversely correlated with the initial Ω. Mineral precipitation occurred in a runaway manner, decreasing TA to values below those of seawater prior to alkalinity addition.
This study demonstrates that the highest risk of mineral precipitation is immediately following alkalinity addition and before dilution and CO2 uptake by seawater, both of which lower Ω. Aragonite precipitation will decrease OAE efficiency because aragonite is typically supersaturated in surface ocean waters. Thus, once formed, aragonite essentially permanently removes the precipitated alkalinity from the CO2 uptake process. Runaway mineral precipitation also means that mineral precipitation following OAE may not only decrease OAE efficiency at sequestering CO2 but could also render this approach counterproductive. As such, mineral precipitation should be avoided by keeping Ω below the threshold of precipitation and quantifying its consequences for OAE efficiency if it occurs. Lastly, in order to be able to quantitatively determine the impact of mineral precipitation during OAE, a mechanistic understanding of precipitation in the context of OAE must be developed.
- Article
(4857 KB) - Full-text XML
- BibTeX
- EndNote
The concentration of atmospheric carbon dioxide (CO2) continues to increase due to human activity, leading to an increase in global mean temperature by >1 °C since pre-industrial times (Cannon, 2025; Hawkins et al., 2017). Nearly 30 % of anthropogenic CO2 emitted annually into the atmosphere is absorbed by the oceans (Friedlingstein et al., 2022; Gruber et al., 2019), decreasing seawater pH, thus causing ocean acidification (Doney et al., 2009). Rapid reductions in anthropogenic CO2 emissions are necessary to minimize the negative impacts of global warming and ocean acidification. Such emission reductions will need to be supplemented by the active removal of atmospheric CO2 in order to meet climate objectives (e.g., Paris Climate Agreement, 2015) and offset CO2 emissions from difficult-to-abate sectors. Ocean alkalinity enhancement (OAE) is a marine-based CO2 removal (mCDR) approach that involves the addition of alkaline substances to the surface ocean or to surficial sediments to increase seawater buffering capacity, allowing it to absorb more atmospheric CO2 (Renforth and Henderson, 2017).
Adding alkalinity to seawater lowers its partial pressure of CO2. As alkalized seawater equilibrates with the atmosphere, it takes up additional atmospheric CO2, which increases seawater dissolved inorganic carbon (DIC) and brings about a new steady state. Alkalinity could be enhanced by adding an alkaline solution or minerals that release alkalinity upon dissolution in seawater (Eisaman et al., 2023). Increasing seawater alkalinity drives an increase in the saturation state (Ω) with respect to several minerals (Fig. 1; Hartmann et al., 2023; Moras et al., 2022; Schulz et al., 2023), which is given by
where IAP is the ionic activity product and Ksp is the mineral solubility product. Ω>1 indicates supersaturation, Ω<1 indicates undersaturation, and Ω=1 indicates chemical equilibrium between the solid and solution. For calcium carbonate (CaCO3) minerals such as vaterite, aragonite, calcite and amorphous CaCO3, the increase in Ω occurs because adding alkalinity to seawater raises its pH and shifts the carbonate chemistry speciation towards a higher concentration of carbonate ions ([CO]). For metal hydroxide minerals, such as magnesium hydroxide (i.e., brucite), the increase in Ω is due to the increase in the concentration of [OH−]. An increase in Ω due to alkalinity addition can trigger mineral precipitation, which consumes some or all of the added alkalinity, thus decreasing the efficiency of OAE at sequestrating atmospheric CO2. Therefore, understanding the timing and kinetics of mineral formation in the context of OAE will help us devise an implementation plan that maximizes CO2 sequestration.
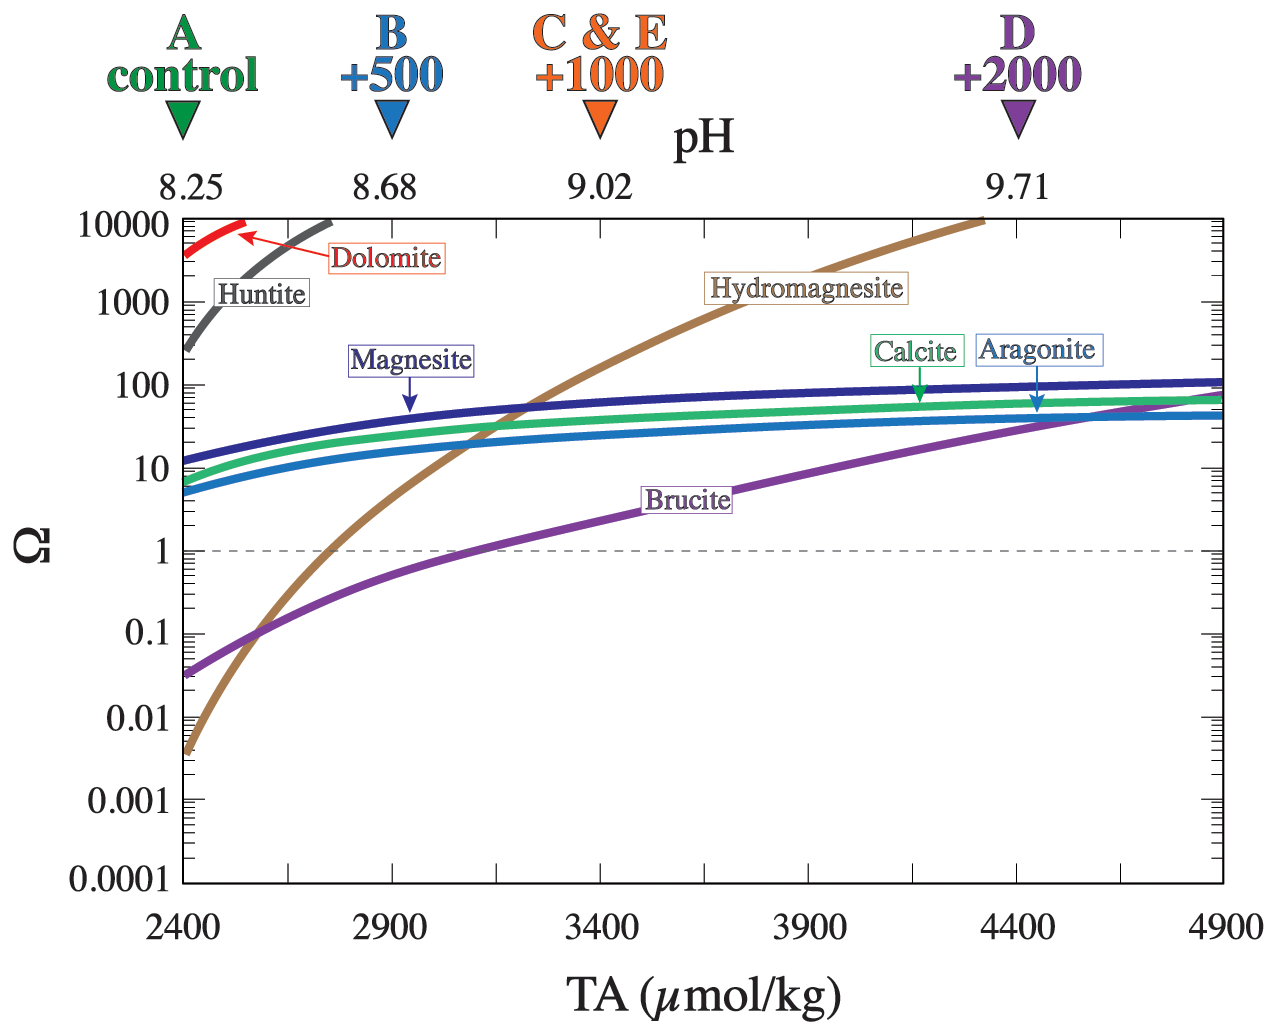
Figure 1The saturation state (Ω) with respect to a number of selected minerals calculated using Geochemist's Workbench software for a solution of average seawater composition at 27 °C and 1 bar. The horizontal dashed line represents equilibrium, above which the solution is supersaturated and below which the solution is undersaturated. The triangles at the top of the plot denote the conditions for each experiment. The calculations assume a closed system where seawater remains unequilibrated with atmospheric CO2.
Precipitation is thermodynamically favored if the solution is supersaturated (Ω>1). However, minerals do not always precipitate once Ω exceeds 1. Typically, there exists a higher, mineral-specific Ω threshold above which precipitation occurs (Pokrovsky, 1998). This threshold is higher for homogenous (i.e., spontaneous) precipitation, where nuclei form directly from the solution, than for heterogeneous precipitation, where minerals nucleate onto existing surfaces (Morse et al., 2007). The exact Ω threshold and the factors influencing it are not fully understood. Determining the Ω threshold is particularly challenging for OAE-induced precipitation, given that alkalinity might be added in the form of minerals that would provide nucleation sites onto which secondary precipitation can take place, potentially lowering the threshold Ω for precipitation.
The kinetics of precipitation are also important. Precipitation does not necessarily occur as soon as Ω is above the precipitation threshold but may be delayed by a period of time referred to as the induction period (Hashim et al., 2023; Kaczmarek et al., 2017; Pokrovsky, 1998). For OAE, if the induction period is longer than the time it takes seawater to equilibrate with atmospheric CO2 (e.g., Jones et al., 2014) or the time of alkalinity dilution (He and Tyka, 2023), then the risk of secondary precipitation is minimized. Hence, the induction period is a critical parameter to incorporate into models of alkalinity consumption and will be an important factor when balancing pH thresholds, dilution timescales, and CO2 uptake rates. Thus far, little attention has been given to characterizing induction periods, particularly in OAE-relevant studies.
The precipitation of each mineral has a unique impact on seawater carbonate chemistry. For example, the precipitation of 1 mol of brucite (Mg(OH)2) decreases alkalinity by 2 mol and does not impact DIC, whereas the precipitation of 1 mol of aragonite (CaCO3) decreases alkalinity by 2 mol and DIC by 1 mol. The type of mineral that precipitates is not only dictated by Ω but also by a range of thermodynamic and kinetic factors, including temperature, and the presence and concentration of chemical catalysts and inhibitors (Burton and Walter, 1987; Hashim and Kaczmarek, 2021; Morse et al., 1997; Morse and He, 1993; Subhas et al., 2017). The compounding effects of these variables lead to the phenomenon – often explained qualitatively by the Ostwald Step Rule (Morse and Casey, 1988) – that what precipitates from seawater is not necessarily the most thermodynamically stable phase but the most kinetically favored. For carbonates, this is exemplified by the observation that, while dolomite and calcite are the most stable phases, aragonite and high-Mg calcite are the ones that are more likely to precipitate. The impact of alkalinity addition on the mineralogical precipitation landscape remains unclear. It is also unknown how minerals change through time after alkalinity is added to seawater and whether they will sink and export the alkalinity to the deep ocean, thus decreasing OAE efficiency, or redissolve over time, releasing the alkalinity back into the surface ocean for CO2 sequestration.
Here we present results from experiments whereby alkalinity was added as an aqueous solution of NaOH to seawater collected from the Sargasso Sea and incubated on deck in a flowing-seawater temperature bath. The carbonate chemistry was monitored through time by measuring TA and DIC, which were used to calculate Ω. The mineralogy of the precipitate was determined using X-ray diffraction and differential scanning calorimetry.
2.1 Experimental setup
Experiments were conducted during a research expedition aboard the R/V Atlantic Explorer in the Sargasso Sea (31°40′00′′ N, 64°10′00′′ W) near the Bermuda Atlantic Time-series Study (BATS) site from 5 to 11 September 2023. The experiments were performed in opaque 5 L Cali-5-Bond™ multi-layer foil bags (Calibrated Instruments) placed in a flow-through incubator, where surface seawater was continuously flowed to maintain a constant temperature of approximately 27 °C. Each bag was filled with approximately 3 ± 0.02 L of unfiltered seawater using a rubber hose that was flushed with water to remove air bubbles, ensuring that no air entered the bags. Bags were rinsed three times with seawater before being filled and sealed with the Luer-fitted stopcock. The bags were allowed to float freely in the incubator, and they moved continuously due to the ship movement. The mixed layer at the study site was approximately 40 m thick, and seawater for the experiment was collected from the upper 10 m. The seawater was not filtered or passed through a mesh in order to mimic a realistic OAE scenario. The total particle concentration in the seawater was 0.15 mg L−1, and the particulate inorganic carbon (PIC) concentration was 0.13 µmol L−1.
Experiments involved the addition of NaOH solution prepared by weighing ACS-grade NaOH in the lab prior to the cruise in a plastic Falcon tube that was capped and sealed with parafilm tape. During the cruise, DI water was added to make up stock NaOH solutions with a final concentration of 1 M. The NaOH solution was pipetted into the seawater-filled bags through the Luer-fitted stopcock. Because NaOH contributes only alkalinity but not DIC, seawater in the experiments was out of equilibrium with the atmosphere, which was intended to simulate conditions immediately following alkalinity addition to seawater during OAE deployments.
In total, five experiments were conducted (Table 1). The first experiment (experiment A in Table 1) was a control with no alkalinity addition. In the second, third, and fourth experiments (B, C, and D), alkalinity was enhanced by 500, 1000, and 2000 µmol kg−1, respectively. The fifth experiment (E) represents a set of “sacrificial” time series experiments whereby nine bags were prepared similarly to other experiments and alkalinity was enhanced by 1000 µmol kg−1 in each one of them but where each bag was sequentially opened and filtered in order to evaluate the precipitate mineralogy through time. In experiment E, water samples for TA and DIC measurements were taken only at the end of the experiment. The experiments were run for approximately 5 d.
Table 1Experimental setup and conditions†.
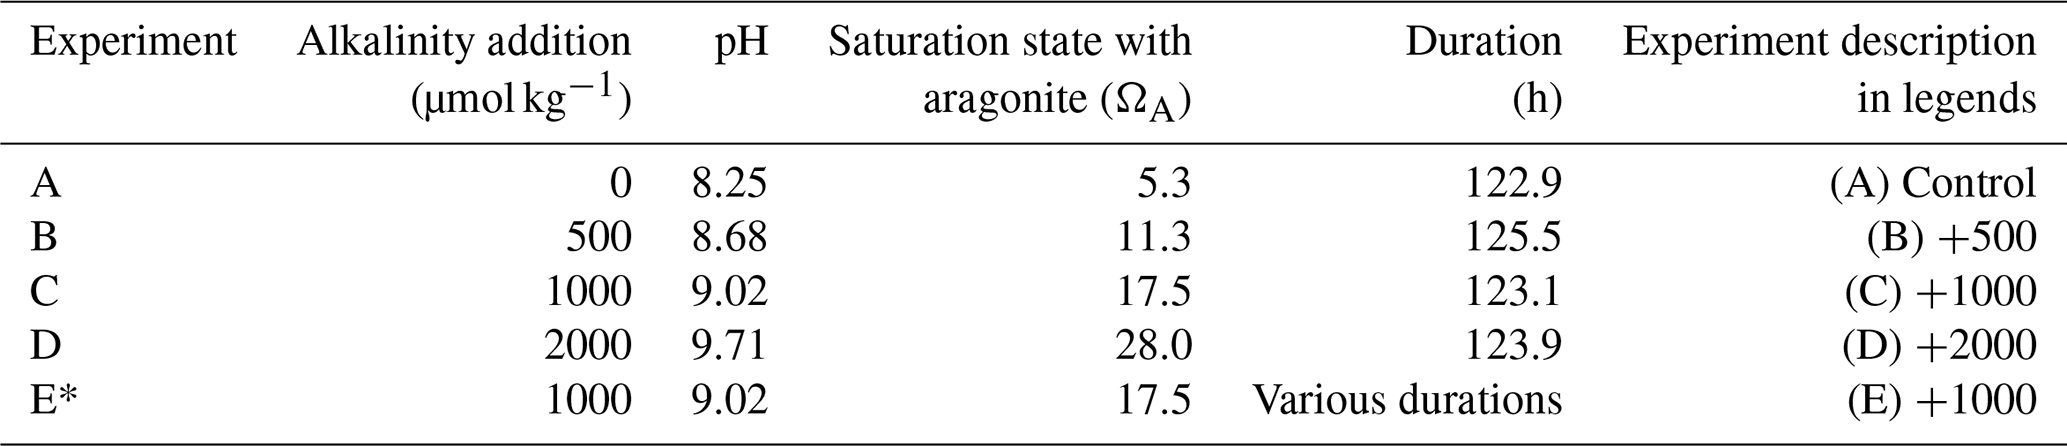
† The seawater used for the experiments has an average TA of 2547 ± 10, an average DIC of 2082 ± 26 µmol kg−1, and an average salinity of 36 psu. The experimental temperature was 27 °C. * This experiment represents a time series whereby nine experiments (bags) were started at the same time and were opened and filtered sequentially at specific time points to determine precipitate mineralogy.
2.2 Sampling from experiments
Two separate 12 mL seawater samples were taken from bags through time: one for DIC and one for TA. Each of these samples was subsequently modified in order to test recently proposed best practices for carbonate chemistry sampling techniques (Schulz et al., 2023). These proposed techniques were designed to retain the original DIC and TA values at the time of sampling while decreasing Ω in the sample container to avoid mineral precipitation during sample storage. For DIC samples, adding an acid to a sample in a completely sealed vessel with no headspace neutralizes a proportion of the previously added alkalinity and thus decreases Ω while retaining all the DIC inside the vial. Similarly for TA samples, bubbling CO2 into the sample increases the DIC and thus decreases Ω without changing the TA. As such, Ω can be lowered in both samples to prevent mineral precipitation during sample storage in a way that allows the accurate determination of DIC and TA (Schulz et al., 2023). We note that these techniques only work for conservative carbonate system parameters (i.e., DIC and TA) and not for non-conservative parameters such as pCO2 or pH.
The 12 mL aliquot taken for DIC was passed through a 0.2 µm filter into a gas-tight borosilicate vial (CHROMONE®, NJ, USA), poisoned with 2.4 µ L of saturated HgCl2, and then acidified by adding a pre-calculated volume of 0.075 M HCl using a glass syringe through the plastic vial septum to titrate the initially added alkalinity. Seawater and acid were injected steadily into the vial to minimize gas exchange. The amount of HCl added was 80, 160, 400, and 160 µL for samples taken from experiments B, C, D, and E, respectively. The 12 mL TA aliquot was filtered (0.2 µm filter) and then bubbled with pure CO2 using a nylon tubing with a stainless-steel needle for 30 s to increase its DIC without changing TA, followed by poisoning with HgCl2. A gas regulator was used to maintain a constant CO2 flow rate and to prevent over-bubbling. The DIC and TA samples were returned to the lab, where they were kept in cool and dark conditions until analysis, which took place within 2 months.
Experiments were quenched by filtering all remaining seawater through 47 mm 0.8 µm polycarbonate filters using a peristaltic pump. Filters were rinsed with deionized and purified water (18.2 MΩ), dried at 55 °C, and stored in a cool, dark place. The precipitates were then scraped off the filters and analyzed for mineralogy with X-ray diffraction (see Sect. 2.4).
2.3 TA and DIC measurements and saturation state calculations
TA was determined using an open-system Gran titration on weighed 5 mL samples in duplicate using a Metrohm 805 Dosimat with a 1 mL burette and an 855 robotic Titrosampler. A 0.04 M HCl titrant was used to firstly acidify the sample to a pH of 3.9 before continuing to a pH of 3.25, dosing at 0.02 mL increments. The analyses were calibrated using in-house seawater standards that were run every 15 samples to assess titrant and electrode drifts throughout the day. A nonlinear least-squares method was used to determine TA as outlined in the Best Practices guide (Dickson et al., 2007).
DIC was determined using an Apollo LI-5300A connected to a LI-COR CO2 analyzer, with CO2 extracted from a 1.5 mL sample volume by adding 0.8 mL of 3 % phosphoric acid. Once opened, the sample lines were inserted into the base of the vial and sealed with parafilm tape to limit gas exchange. Before each analysis, 0.75 mL of sample and 0.8 mL of acid were drawn into the sample syringe to flush out any prior remnants from the system. After the flush, the 1.5 mL sample was drawn into the calibrated syringe and injected into the reaction chamber, where resulting CO2 was carried by a zero-CO2 air stream to the LI-COR CO2 analyzer. Samples were run in triplicate. The instrument was calibrated twice daily against an in-house seawater standard that was intercalibrated against seawater certified reference materials (Dickson batch #187).
The saturation state with respect to aragonite (ΩA) throughout the experiments was calculated using PyCO2 1.8.1 (Humphreys et al., 2022), the Python version of the original CO2SYS program (Lewis et al., 1998), using the carbonic acid dissociation constants of Mehrbach et al. (1973) refitted by Dickson and Millero (1987). The ΩA calculations used a corrected concentration of Ca to account for changes induced by CaCO3 precipitation, calculated according to the following equation:
where [Ca]s_corr is the mean seawater concentration of Ca in mmol kg−1 corrected for salinity by multiplying 10.28 by measured salinity at the BATS site and dividing by 35, TAmsrd is the measured TA in mmol kg−1 in each sample, and TAsw is the initial TA after alkalinity addition in mmol kg−1. The saturation state with respect to other minerals was calculated using the Geochemist's Workbench (GWB) software, version 11, using the thermo.dat database at 1 bar and 27 °C (Bethke, 1996) for seawater, equivalent to that used in our experiments, titrated with 1 M NaOH solution under closed-system conditions (Fig. 1). GWB was used to calculate Ω with respect to a wider range of minerals than possible using PyCO2. The carbonate chemistry data are archived in Hashim et al. (2025a).
2.4 Mineralogy
The solid precipitates collected by filtering the seawater from the experimental bags were analyzed for mineralogy using X-ray diffraction (XRD). Precipitates were gently powdered by hand using an agate mortar and pestle under acetone and mounted on a silicon zero-background diffraction plate, which was placed in an automatic sample changer (Hashim and Kaczmarek, 2022). Samples were measured at the MIT.nano facility at the Massachusetts Institute of Technology using a PANalytical X'Pert PRO X-ray powder diffractometer using a Cu anode and an X'Celerator Scientific 1D position-sensitive detector in Bragg–Brentano geometry. The 2θ range was 5 to 100° and a count time of 1 s per step. Data were processed using the fundamental parameters Rietveld refinement program TOPAS V7 (Coelho, 2018). The data were corrected for an instrument zero error determined using the NIST standard LaB6 (660c), which has a certified unit-cell parameter of 4.156826 Å, a crystallite size (Lvol) of 500 nm, and no micro-strain-related peak broadening (Black et al., 2020). The zero error refers to a shift in diffraction patterns due to misalignment of the detector. Instrument parameters were set to known values during Rietveld refinement, and TOPAS was used to determine relative mineral abundances, unit cell parameters, crystallite size, and micro-strain (Bish and Howard, 1988). All raw XRD data and the Rietveld refinement results are archived in Hashim et al. (2025b).
A TA Instruments Q600 simultaneous thermal analyzer was used for thermogravimetric analysis (TGA) and differential scanning calorimetry of mineral precipitates from Experiment D. About 35 mg was heated from room temperature to 1100 °C with a heating rate of 10 °C per minute in an N2 atmosphere. The N2 flow rate was 50 mL min−1. Routine measurements of standard materials supplied by the manufacturer indicate that the temperature is accurate to 1 °C and that the weight change is accurate to 0.5 µg. The raw TGA data are archived in Hashim et al. (2025c).
3.1 Precipitate mineralogy
Relative mineral abundances derived from X-ray diffraction (XRD) data suggest the precipitation of aragonite, calcite, and halite (Fig. 2A). Halite presence can be attributed to its precipitation as a result of seawater evaporation during filter drying and is omitted from relative abundance comparisons (Fig. 2B). The relative abundance of aragonite and calcite varies slightly across experiments in that calcite abundance decreases with the increase in alkalinity addition (Fig. 2B). In experiment E, aragonite remains the dominant phase through time (Fig. 3). Furthermore, results from the Rietveld refinement for experiment E (Table 1) samples reveal that the aragonite crystallite size increases with time, whereas the lattice strain decreases with time (Fig. 4). Precipitates at the end of experiments C and D (+1000 and 2000 µmol kg−1) yielded aragonite with smaller crystallite size that falls within the trend of experiment E (Fig. 4A).
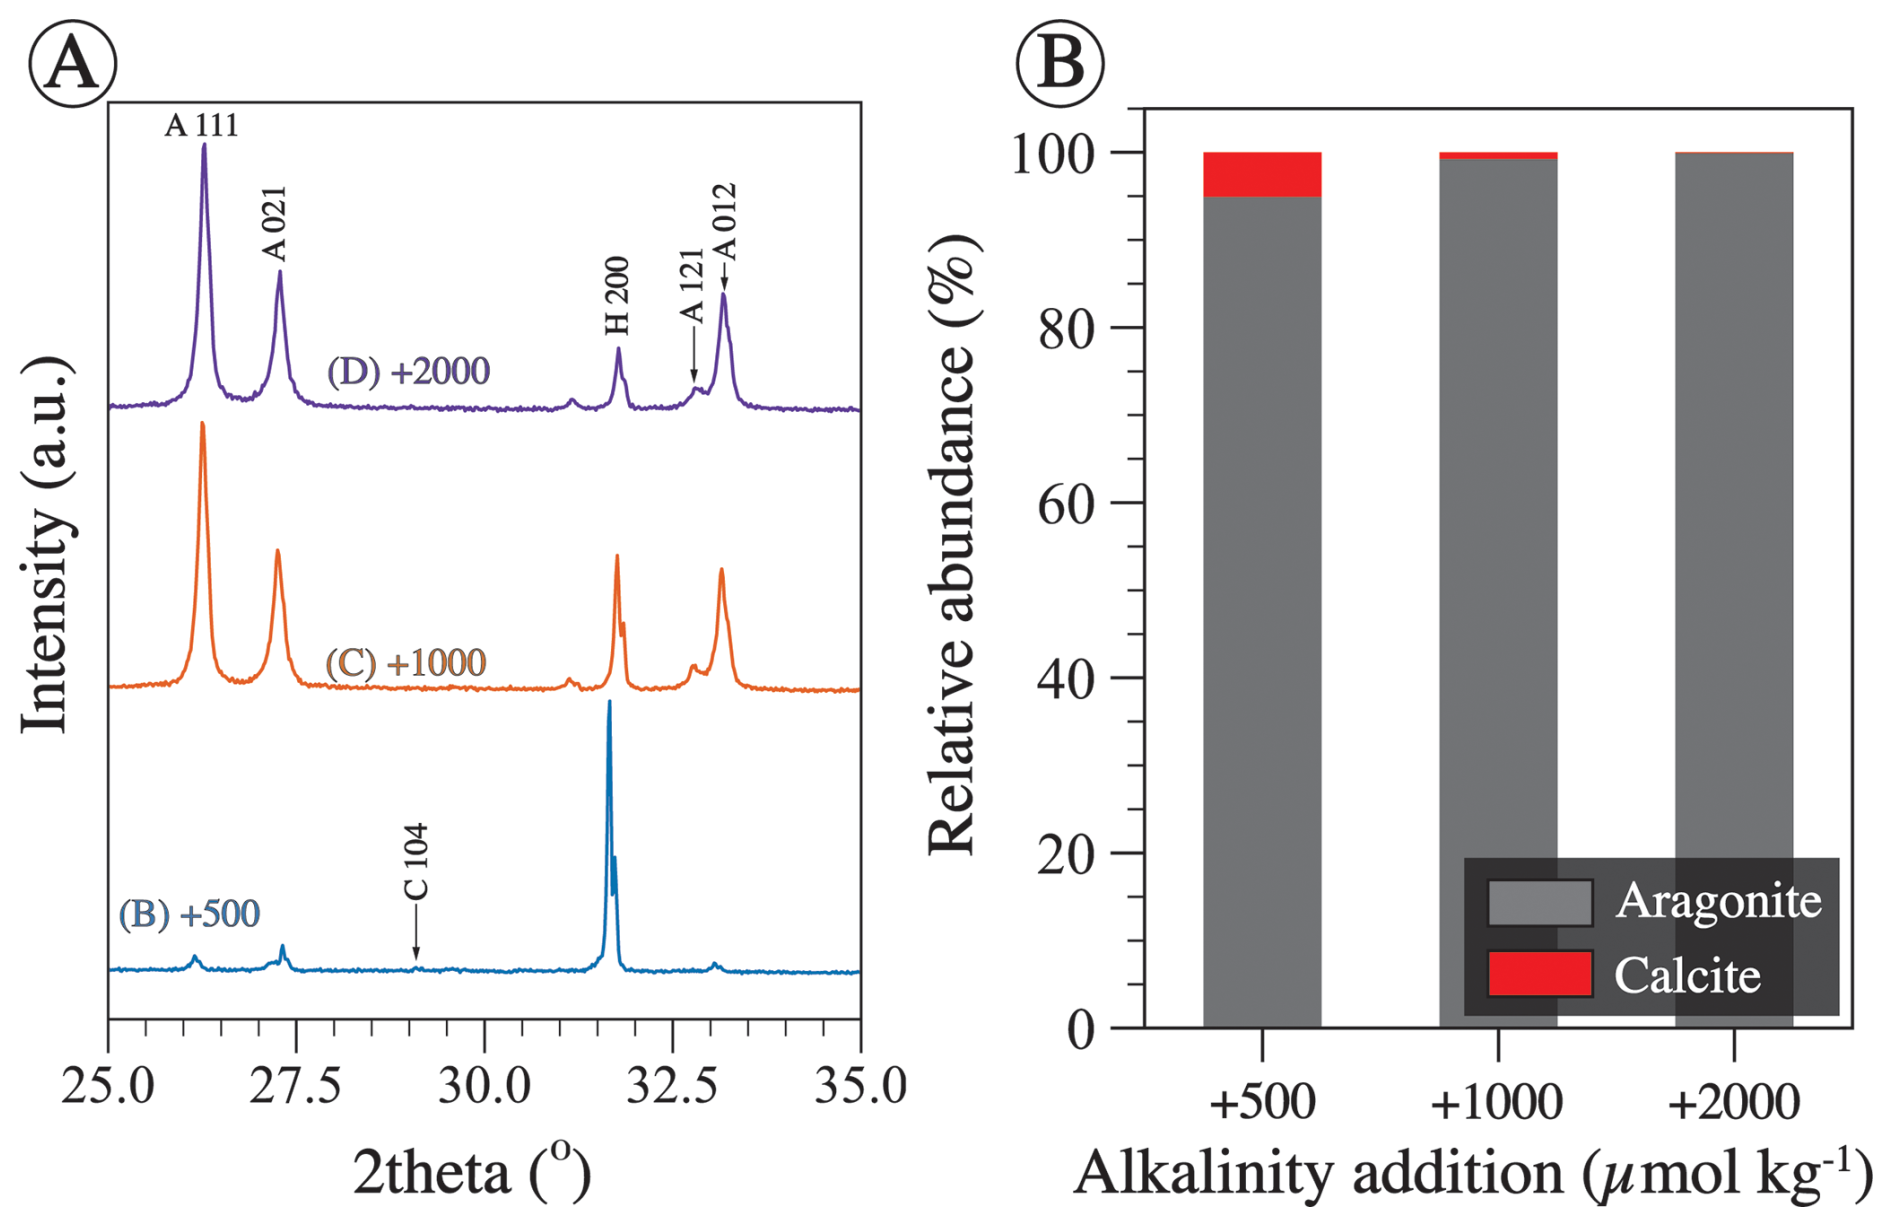
Figure 2(A) Raw X-ray diffraction (XRD) spectra of precipitate from experiments B, C, and D truncated between 25 and 35° 2θ for easier viewing. All three precipitates were collected at the end of the experiments which were conducted for ∼ 123 h. Miller indices of prominent peaks are shown, where A stands for aragonite, H stands for halite, and C stands for calcite. (B) Relative mineral abundance determined via Rietveld refinement of the three spectra shown in panel (A). Each of the aragonite and calcite abundances is normalized to the total (aragonite + calcite), given that halite is considered an artifact that precipitated during filter drying.
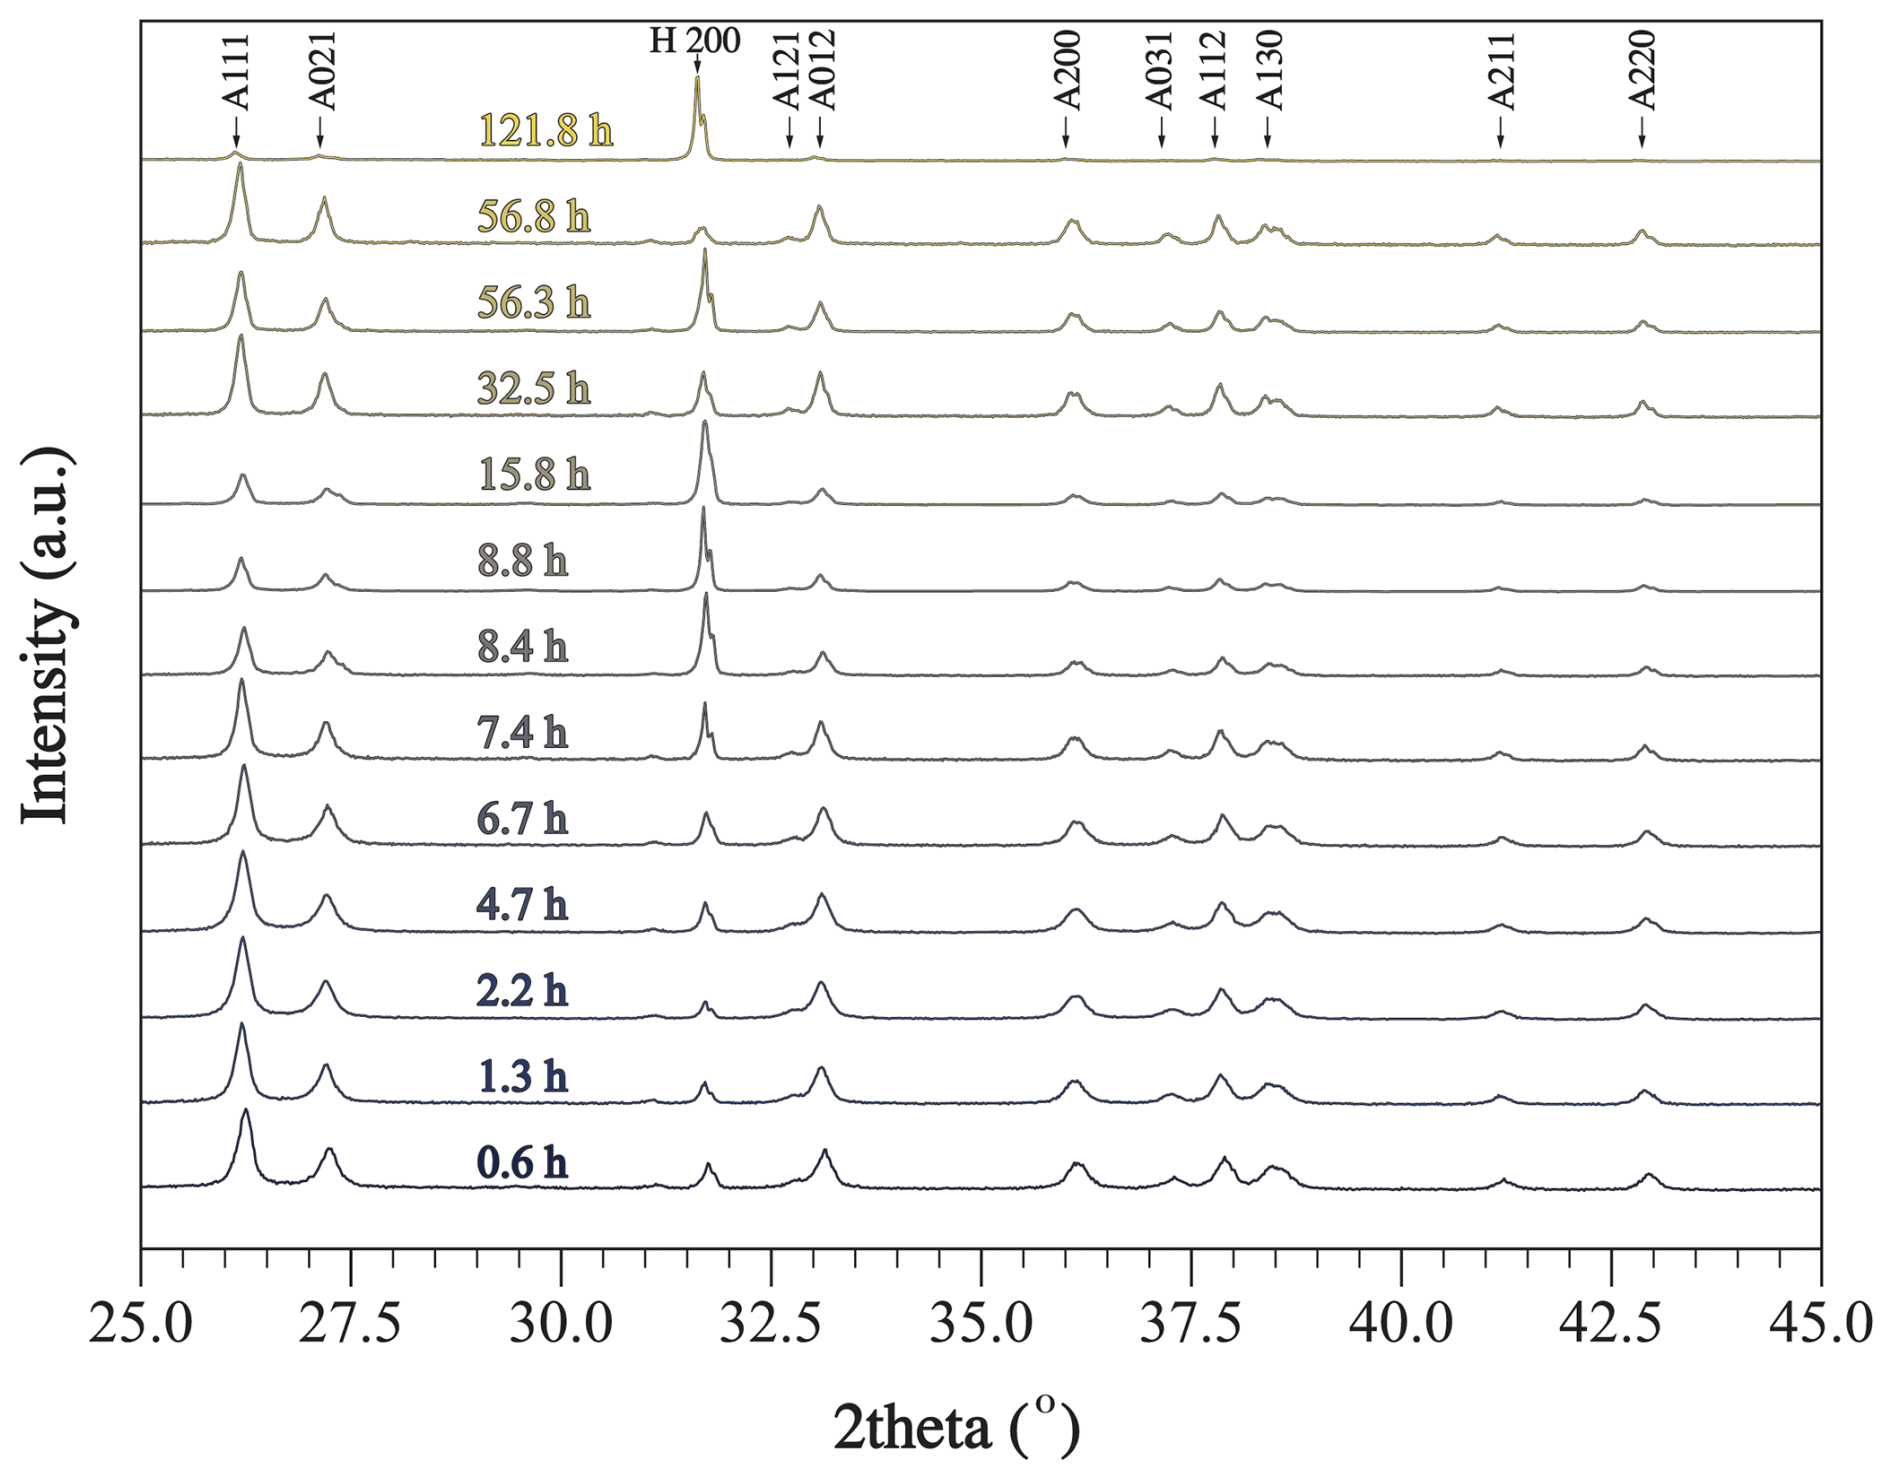
Figure 3Raw XRD data collected for samples from experiment E, where alkalinity was enhanced by 1000 µmol kg−1. Each scan was collected for a sample filtered at a certain period of time from the onset of the experiment. Miller indices of prominent peaks are shown, where A stands for aragonite and H stands for halite. Raw XRD data are available in Hashim et al. (2025b).
Thermogravimetric analysis of precipitate (Fig. 5) from experiment D revealed two weight loss events that can be attributed to dehydroxylation of magnesium hydroxide (2.97 wt % at ∼ 353 °C) and calcination of Ca carbonate (33.52 wt % at ∼ 768 °C) (Földvári, 2011; Klein et al., 2020). Additional weight loss occurred at 467 °C (0.98 wt %) and 968 °C (3.88 wt %); the underlying cause of these weight loss events remains unresolved, but we speculate that the minor weight change at 467 °C could be attributed to the loss of adsorbed water during the phase transition of aragonite to calcite or possibly to decomposition of a hydrous Mg carbonate mineral similar to hydromagnesite.
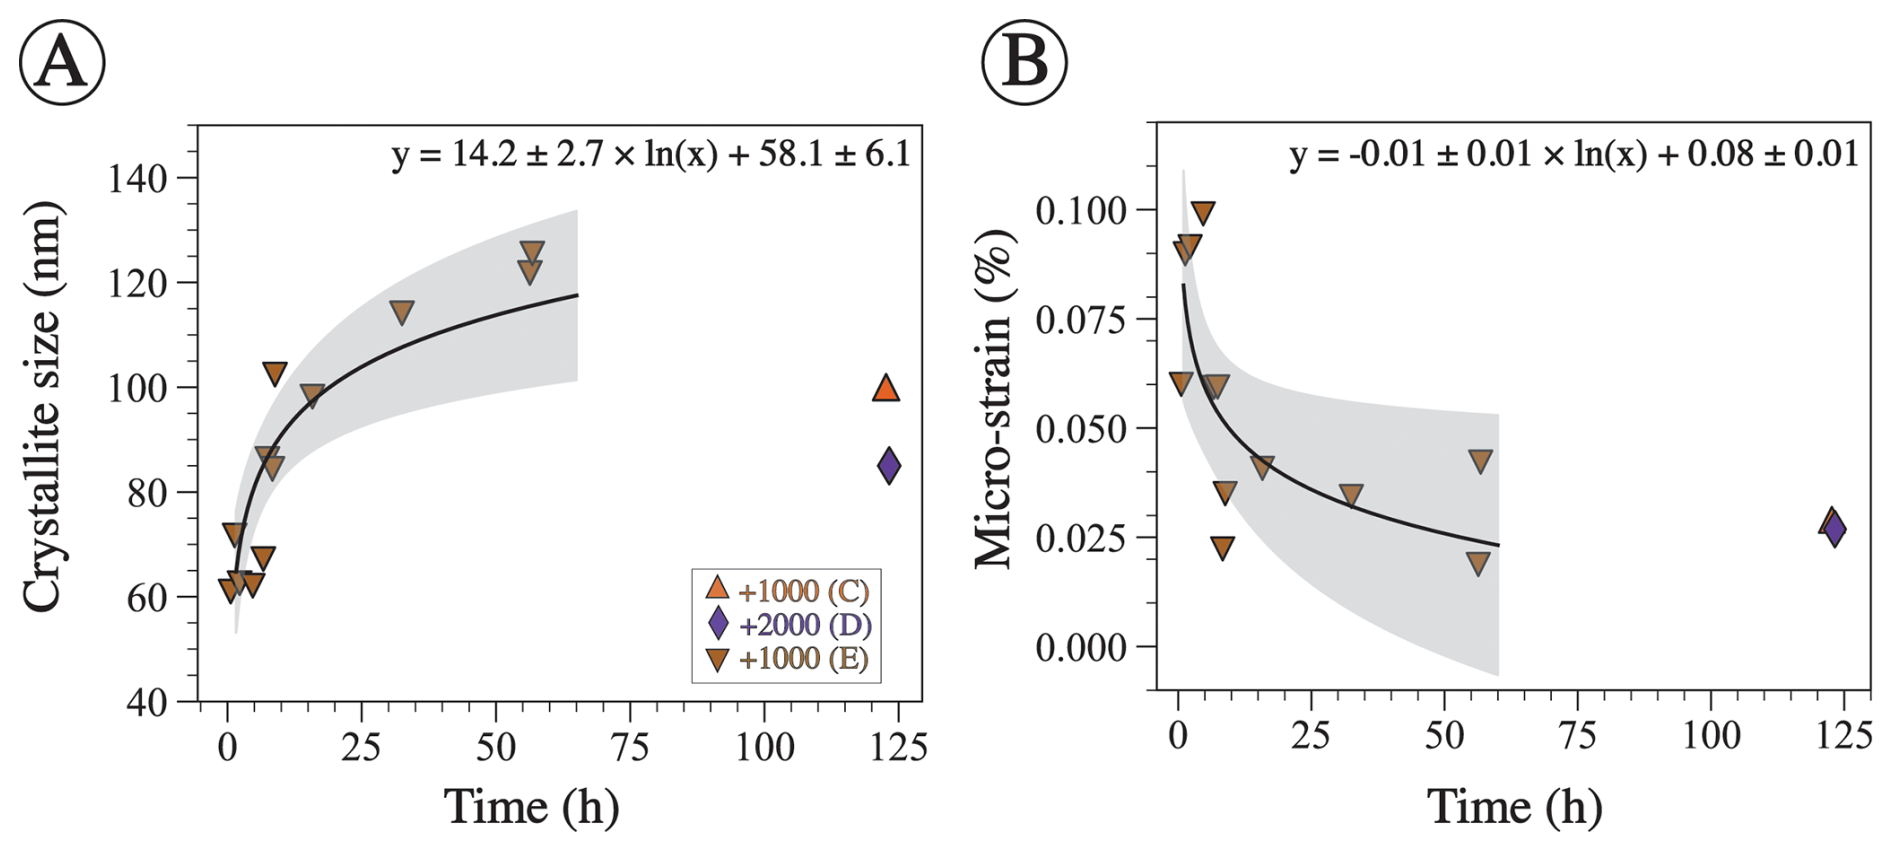
Figure 4Crystallographic characteristics of aragonite precipitate determined via Rietveld refinement. (A) Aragonite crystallite size plotted against time. XRD data were collected for precipitate in experiment E throughout the whole process but only at the end in experiments C and D. The logarithmic function is fitted through the E data only. The p value for the fit is ≪0.05, and R2 is 0.76. (B) Aragonite micro-strain as a function of time for the same experiments shown in panel (A). The logarithmic function is fitted through experiment E data only. The p value of the fit is 0.02, and R2 is 0.47. The shaded region represents the 95 % confidence interval.
3.2 Carbonate chemistry response to alkalinity enhancement
The measured TA and DIC of the control experiment with no alkalinity addition remain nearly constant throughout the duration of the experiment, with an average value (±1σ) for TA of 2547 ± 10 µmol kg−1 and an average value for DIC of 2082 ± 26 µmol kg−1 (Fig. 6A and B). All alkalinity enhancement experiments show elevated initial TA values as expected (Fig. 6A) and exhibit a gradual decrease in TA, DIC, and ΩA with time (Figs. 6A, B, and 7A). The decrease in TA, DIC, and ΩA is steeper and reaches lower final values for experiments with higher alkalinity addition. The lowest final TA value is observed for experiment D with the highest alkalinity addition of 2000 µmol kg−1, followed by experiment C (1000 µmol kg−1), followed by experiment B (500 µmol kg−1) (Fig. 6A). Similar trends are observed with DIC, which decreases more steeply and reaches the lowest final values for experiments where alkalinity is enhanced the most (Fig. 6B).
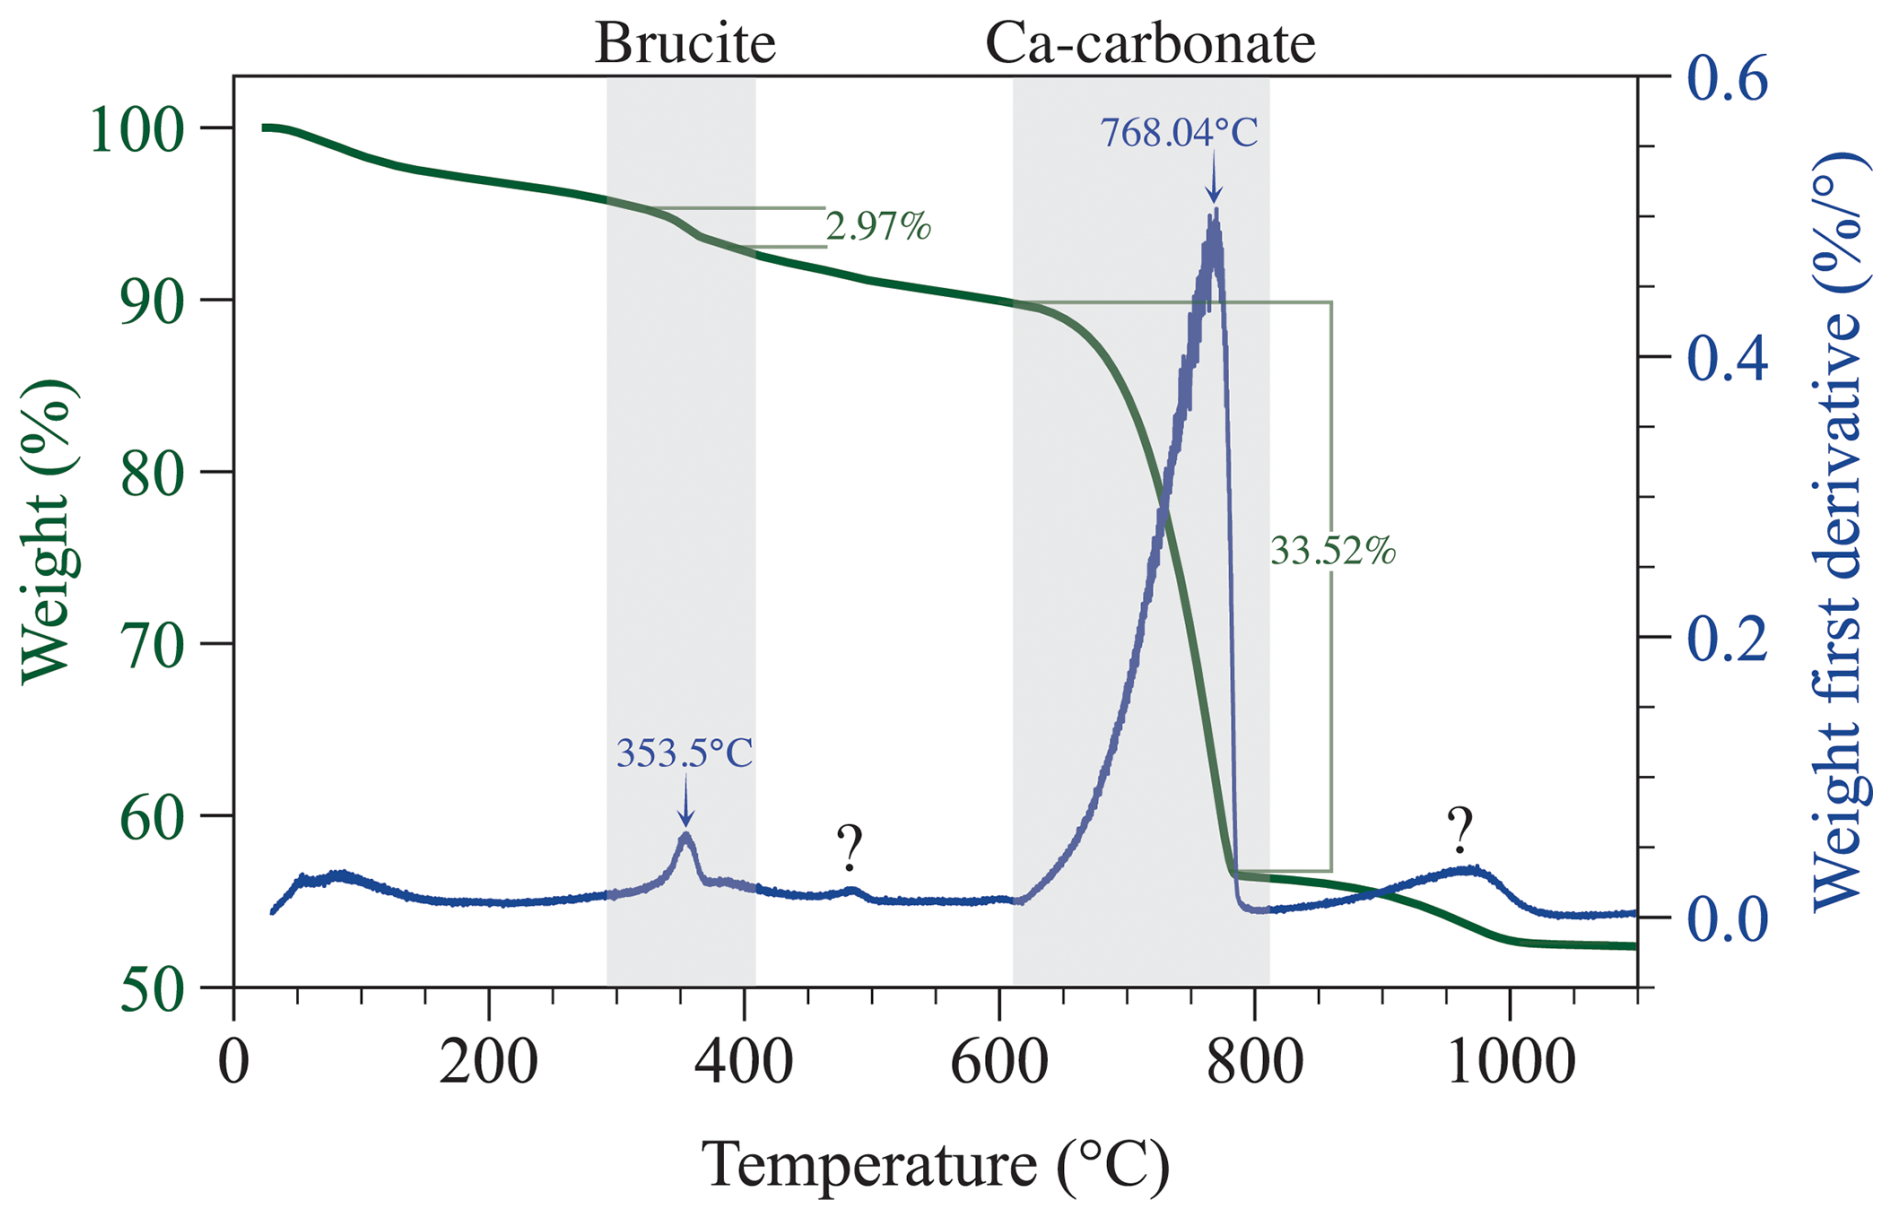
Figure 5Thermogravimetric analysis of precipitates from experiment D (+2000 µmol kg−1) after 124 h. The data are consistent with the presence of Ca carbonate (likely aragonite) and minor amounts of brucite, which are indicated by the shaded area. The small peak around 470°C denoted with a question mark is suggestive of the presence of hydromagnesite, which was initially supersaturated. Alternatively, this event could be due to the loss of minor adsorbed water during the transition of aragonite to calcite. The raw TGA data are available in Hashim et al. (2025c).
TA and DIC decrease linearly with each other with slopes of 1.39, 1.44, and 1.85 for experiments B, C, and D, respectively (Fig. 6C). Such slopes are difficult to interpret in the context of mineral precipitation, given that CaCO3 minerals (aragonite, calcite, vaterite) should decrease TA and DIC in a 2:1 ratio (slope = 2), whereas magnesium hydroxide (i.e., brucite) decreases only TA (slope =∞). Slope values <2 imply that more DIC is removed than can be explained by CaCO3 precipitation (Fig. 6D). We suggest an explanation for these observations in Sect. 4.4.
3.3 Amount and rate of mineral precipitation
Measured TA through time was used to estimate the amount of CaCO3 precipitate (Fig. 8), assuming that the decrease in TA with time was solely due to CaCO3 precipitation and a TA-to-CaCO3 molar ratio of 2:1, according to the following equation:
where is the mass of CaCO3 precipitate in µg kg−1 and is the molar mass of CaCO3 in g mol−1. Assuming that TA decreases only due to CaCO3 precipitation is reasonable because the dominant mineralogy in all experiments is aragonite (see Sect. 3.1). These calculations indicate that a higher amount of precipitation occurs in experiments where TA was enhanced the most (Fig. 8). Moreover, in experiment B (+500 µmol kg−1), precipitation occurs gradually throughout the duration of the experiment, whereas, in experiments C and D (+1000 and 2000 µmol kg−1), most precipitation takes place during the first 24 h followed by a gradual increase in the amount of precipitate with time (Fig. 8).
The rate of mineral precipitation was calculated using the following equation:
where r is the rate in µmol h−1, ΔTA is the change in TA between two data points, and Δt is the time difference between the same data points (Fig. 9). The rate data were fitted to an empirical rate law in its logarithmic form (Zhong and Mucci, 1989):
where n is the empirical reaction order and k is the rate constant in µmol h−1. Plotting log (r) against log (Ω−1) shows that there is a relationship for our experiments, for the experiments of Moras et al. (2022), and for the aragonite precipitation experiments of Mucci et al. (1989). A fit through our data and those of Moras et al. (2022) yields a reaction order of 2.15 ± 0.40 and a rate constant of 0.20 ± 0.10 µmol h−1. A fit through the data of Mucci et al. (1989) gives a reaction order of 1.5 ± 0.3 and a rate constant of 45 ± 2 µmol h−1.
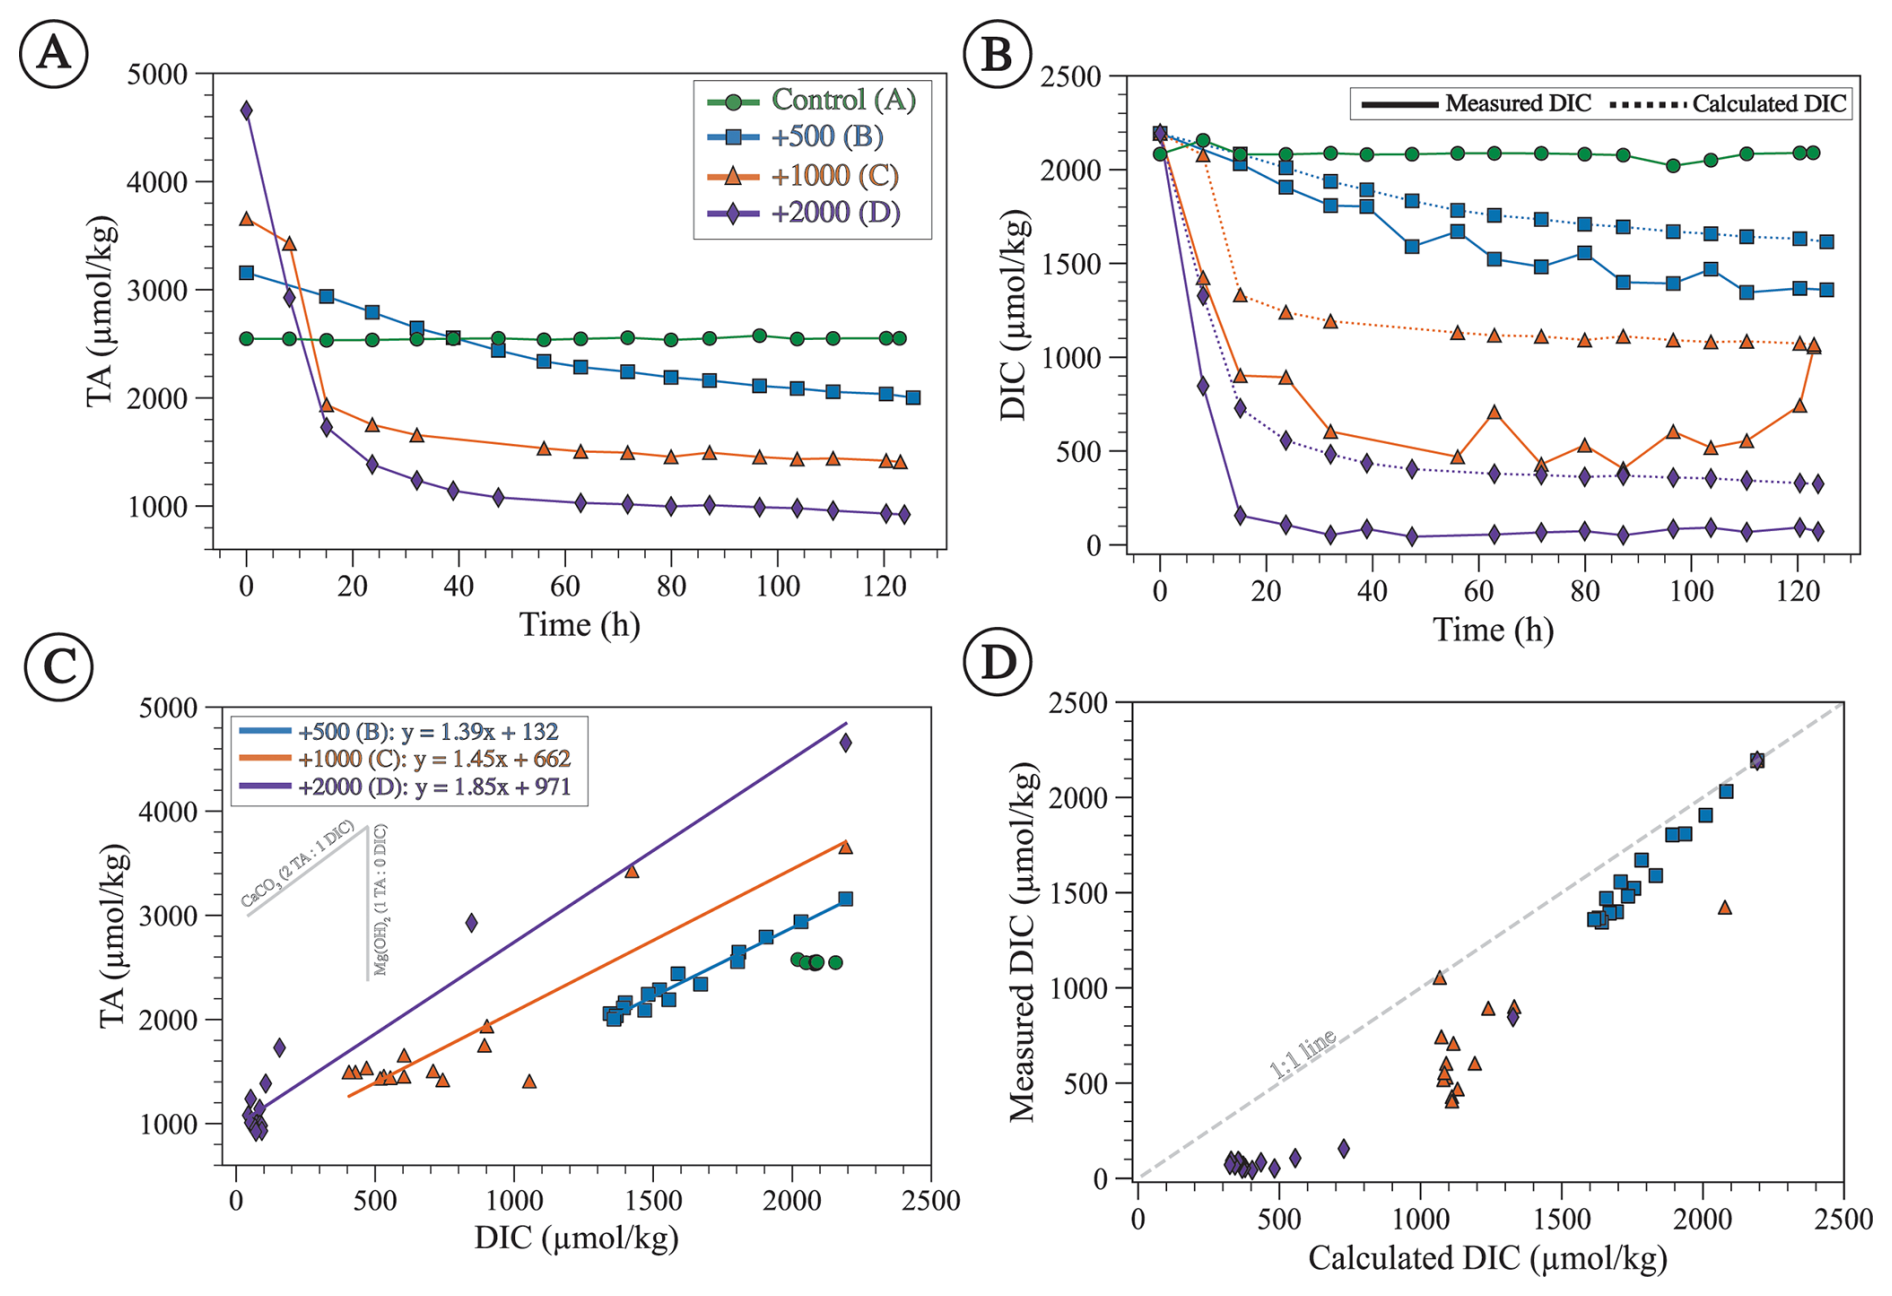
Figure 6(A) Measured TA through time showing a gradual decrease from the initial enhanced value except for the control experiment. (B) Measured DIC (solid line) and calculated DIC (dashed line) using Eq. (6). Both measured and calculated DIC decrease with time from the initial seawater value except for the control experiment. (C) TA plotted against measured DIC with linear regressions fitted for experiments B, C, and D (equations shown in the upper-left corner). The gray lines represent the expected slopes as a result of CaCO3 (slope = 2) and brucite (slope = ∞) precipitation. (D) Measured DIC plotted against DIC calculated assuming 2:1 TA:DIC removal from CaCO3 precipitation, showing that most data points have lower measured than calculated DIC and hence deviate from the 1:1 line, suggesting that some DIC was removed during HCl addition, which was done to preserve the samples.
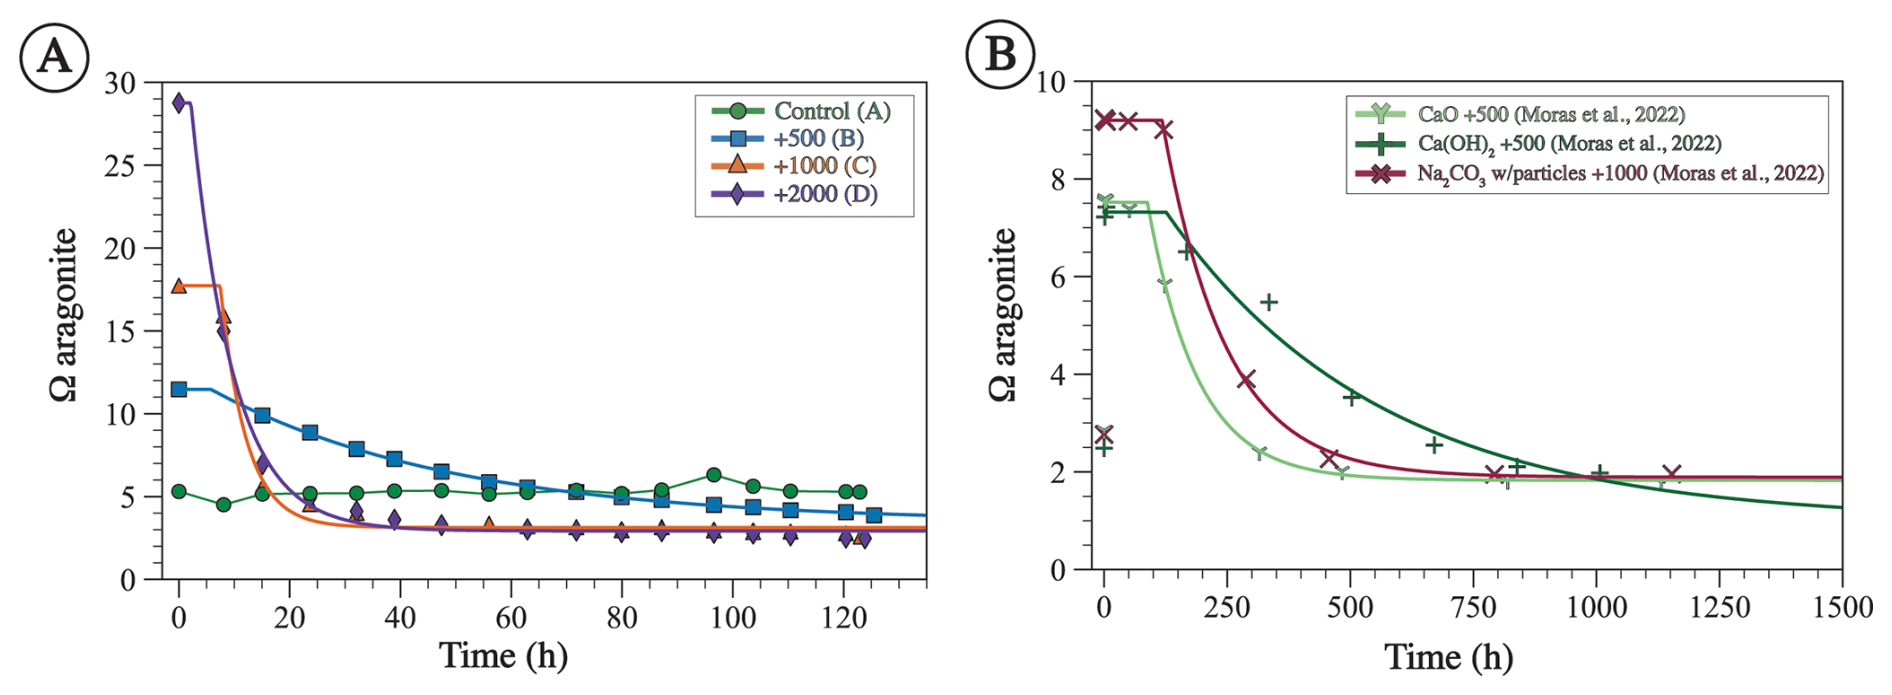
Figure 7The saturation state with respect to aragonite (ΩA) for experiments from this study calculated using measured TA and calculated DIC (A) and from Moras et al. (2022) (B). The lines represent a model fitted using Eq. (8). Both the data and the model are characterized by an induction period (tip) where ΩA remains similar to the initial value, followed by an exponential decrease, followed by an asymptote value where ΩA ceases to change with time (extrapolated at infinite time Ω∞). Note the difference in the range of values of x and y axes between A and B.
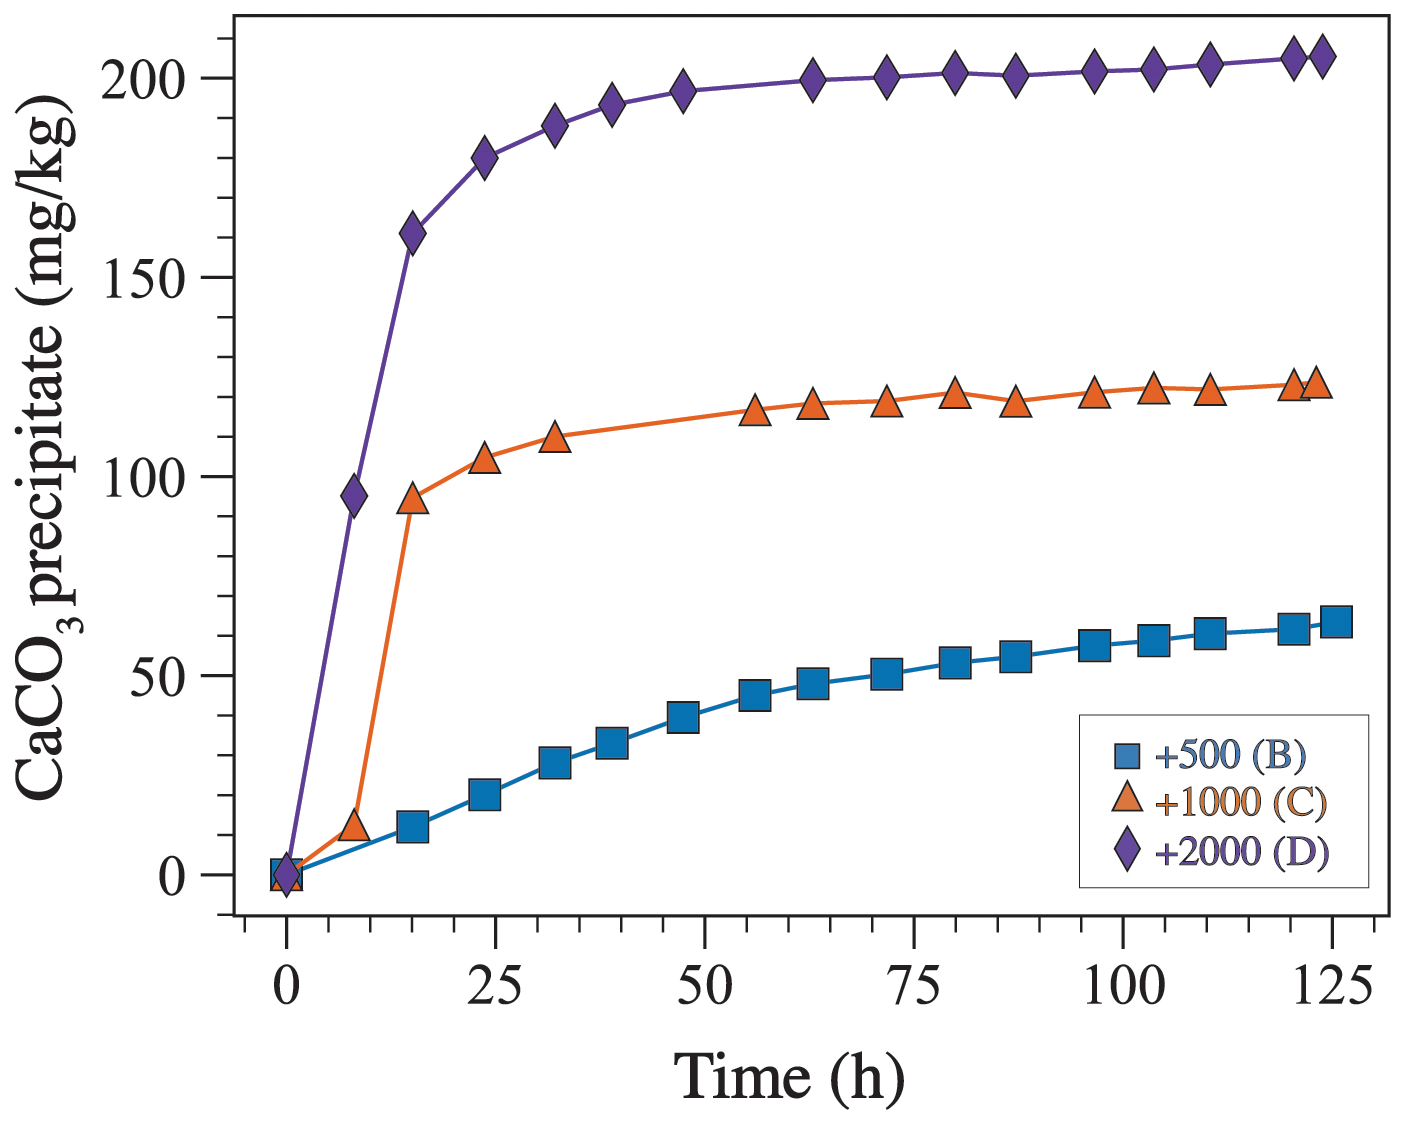
Figure 8The amount of CaCO3 precipitate through time estimated based on changes in TA using Eq. (3).
4.1 Thermodynamic constraints on mineral precipitation
The Ω of the seawater used in our experiments both prior to and following alkalinity addition was calculated with respect to a set of minerals that includes aragonite (CaCO3), calcite (CaCO3), dolomite (CaMg(CO3)2), brucite (Mg(OH)2), magnesite (MgCO3), hydromagnesite (Mg5(CO3)4(OH)2 ⋅ 4H2O), and huntite (Mg3Ca(CO3)4) (Fig. 1). This list represents only a small fraction of all the minerals that could possibly precipitate, but this set of minerals was chosen because they have been reported to occur naturally in marine environments and because some of them (e.g., aragonite and brucite) have been shown to precipitate during OAE experiments (Bach et al., 2024; Hartmann et al., 2023; Moras et al., 2022). Seawater was initially highly (i.e., Ω>100) supersaturated with respect to dolomite and huntite and moderately (i.e., Ω∼ 10) supersaturated with aragonite, calcite, and magnesite (Fig. 1). In contrast, brucite and hydromagnesite are undersaturated in natural seawater and become supersaturated as alkalinity increases. Alkalinity addition increases Ω with respect to all of these minerals. Hydromagnesite becomes supersaturated when the TA reaches ∼ 2700 µmol kg−1, and brucite becomes supersaturated when the TA reaches ∼ 3100 and becomes more supersaturated than aragonite at a TA of ∼ 4600 µmol kg−1 (Fig. 1). The reason for the different saturation behaviors is that magnesium hydroxide solubility is a function of [OH−]2, whereas CaCO3 mineral solubilities are proportional to [CO]. Hydroxide ion concentration increases with TA addition, thus rapidly increasing the saturation state of hydroxide-bearing minerals.
4.2 Mineralogy of the OAE-induced precipitation
In experiments B, C, and D (+500, +1000, +2000 µmol kg−1, respectively), the dominant precipitate mineralogy according to XRD data is aragonite, followed by a small amount of calcite (Fig. 2). This observation is consistent with previous studies showing that the calcium carbonate precipitating from seawater at a temperature of 27 °C is aragonite (Burton and Walter, 1987; Hartmann et al., 2023; Hashim et al., 2024; Moras et al., 2022; Morse et al., 1997; Morse and He, 1993). This is often attributed to the inhibition of calcite growth by Mg (Berner, 1975; Mills et al., 2022) that leads to the precipitation of the metastable aragonite at the expense of the more stable calcite, despite the fact that the solution is more supersaturated with respect to calcite than aragonite (Fig. 1).
Aragonite was also the dominant precipitated phase in experiment E (+1000 µmol kg−1), where mineralogy was determined through time (Fig. 3). The crystallographic characteristics of the aragonite evolved throughout the experiment; specifically, aragonite crystallite size increased, whereas its micro-strain decreased (Fig. 4). Crystallite size refers to a coherently diffracting domain within a crystal, and micro-strain refers to distortions or deformations within the crystal lattice arising from dislocations, point defects, or crystal boundaries (Bish and Post, 2018; Hashim et al., 2023; Mittemeijer and Welzel, 2008). These data are consistent with the process of Oswald ripening, whereby aragonite recrystallizes to a more stable phase with a larger crystallite size and lower strain. It is unclear why experiments C and D yielded aragonite with smaller crystallite size after a longer period of time compared to experiment E (Fig. 4A). The higher alkalinity addition in experiment D compared to E may suggest that there is an inverse relationship between alkalinity (or Ω) and aragonite crystallite size. However, this cannot explain why experiment C, which used a similar amount of alkalinity to experiment E, produced aragonite with a smaller crystallite size. Future work should explore the crystallographic properties of precipitated minerals under a wide range of alkalinity additions. We also suggest supporting the XRD-derived crystallite size measurements with other approaches, such as transmission electron microscopy. Nonetheless, the changing crystallographic properties of aragonite through time suggest that aragonite recrystallizes to become more stable. In the context of OAE, if aragonite becomes more stable, it will take longer to redissolve and may sink in the water column, decreasing the efficiency of OAE.
Another mineral that could have formed in experiment E is brucite, which was initially slightly supersaturated (Ωbrucite ∼ 1.7) (Fig. 1A). This slight supersaturation may not have been high enough for brucite to precipitate, perhaps due to kinetic nucleation limitations similar to carbonate minerals. Alternatively, brucite, or, more generally, amorphous magnesium hydroxide, may have formed initially but redissolved before the first sample was taken at 0.6 h following alkalinity addition. The alkalinity decreased from the initial enhanced value of 3500 to ∼ 3150 µmol kg−1 after 0.6 h, which corresponds to an Ωbrucite of 0.7. Thus, brucite could have formed initially but redissolved as aragonite precipitation decreased alkalinity, rendering brucite undersaturated.
In experiment D, Ωbrucite was initially >10, i.e., likely sufficient for brucite to precipitate (Fig. 1A). The thermogravimetric analysis (TGA) confirms the presence of a small (∼ 3 %) amount of brucite in experiment D precipitate (Fig. 5). It is surprising that brucite in experiment D did not redissolve, given that, at the end of experiment D, Ωbrucite was <0.01. It is possible that aragonite nucleated on brucite crystals, enclosing and protecting them from dissolution. Alternatively, slow dissolution kinetics may have prevented all of the brucite from redissolving, despite near-complete undersaturation. It should be noted that brucite was only detected with TGA but not with XRD, despite the fact that our XRD spectra encompassed the 2θ range of the dominant brucite peaks, such as the (001) that typically appears at 18.4° 2θ. It is possible that the small amount of brucite was below the detection limit of XRD or that the precipitate was amorphous magnesium hydroxide with no diffracting structure rather than brucite mineral. Brucite has been documented to exhibit a wide range of structures, including amorphous Mg(OH)2, with implications for its dissolution kinetics (Cifuentes-Araya et al., 2014; Vermilyea, 1969).
At high Ω values, such as those that characterized some of our experiments, vaterite, amorphous calcium carbonate (ACC), and amorphous calcium magnesium carbonate (ACMC) have been observed to form, but such phases are highly unstable and quickly transform to other more stable phases (Evans et al., 2020; Methley et al., 2024). It is therefore possible that the observed aragonite in our experiment is not the first phase to form but is the product of a transformation reaction from an even less stable phase, such as vaterite, ACC or ACMC, although no evidence for the occurrence of these phases was found. A high-resolution sampling within minutes of the start of the experiments and using synchrotron XRD could detect the first phases that form at conditions relevant to OAE.
4.3 Saturation state (Ω) calculations and the threshold of precipitation
TA and DIC decrease linearly with each other with a slope of 1.39, 1.44, and 1.85 for experiments B, C, and D (+500, +1000, +2000 µmol kg−1), respectively (Fig. 6C). Slope values <2 imply that more DIC is removed than can be explained by CaCO3 precipitation. One way for this to happen is if the acidification of the samples in vials, which was done to lower Ω to prevent precipitation during sample storage (Sect. 2.2), neutralized too much of the sample TA, leading to a high pCO2 that induced outgassing and thus DIC loss. Accordingly, we calculated DIC using TA by assuming that the decrease in DIC was solely due to the precipitation of CaCO3 according to the following equation:
where DICo and TAo are the initial DIC and TA values in each experimental series and TAi is the value of TA measured throughout the experiment. The assumption that DIC decreases solely due to CaCO3 precipitation is a reasonable one, given that our XRD data show that the dominant mineralogy in all experiments is aragonite (Fig. 2). In all alkalinity addition experiments, the measured DIC is lower and more variable than the calculated DIC (Fig. 6D). This suggests that, with high amounts of alkalinity addition, nearly all of the DIC in the sample was lost due to acidification. Thus, the acidification protocol proposed by Schulz et al. (2023) must be carefully evaluated to prevent significant degassing of acidified CO2 during sample storage and when the vial is opened for measurement. For these reasons, instead of measured DIC, we use the DIC calculated with Eq. (6), along with measured TA, to calculate ΩA. For future studies, instead of adding a predetermined amount of acid based on alkalinity addition, we recommend using our study and other mineral precipitation studies as guidance to predict the values of TA and DIC through time, which can then be used to determine the amount of acid to be added such that only excess TA is removed.
The decrease in measured TA, calculated DIC, and ΩA over the course of the experiment (Figs. 6A, B, 7A) suggests that precipitation occurs at all alkalinity enhancement levels. This is in general agreement with previous studies showing that precipitation occurs with similar alkalinity additions (Hartmann et al., 2023; Moras et al., 2022). The threshold of saturation state with respect to aragonite (ΩA) for homogenous precipitation from seawater is between 13 and 19 (Morse and He, 1993; Pytkowicz, 1973; Sun et al., 2015). For reference, surface ocean seawater has an ΩA of <5 (Jiang et al., 2015). In our experiments, precipitation is observed at an initial ΩA of 11 where alkalinity was enhanced by 500 µmol kg−1. Since this is the lowest amount of alkalinity added in our study, we suggest that the threshold ΩA for mineral precipitation under the experimental conditions is ≤11. This is consistent with previous OAE experiments showing that precipitation takes place at an ΩA of 7 (Moras et al., 2022). Several factors impact the threshold Ω for precipitation, one of which is whether precipitation is homogenous or heterogenous (Morse et al., 2007). The threshold Ω is higher for homogenous precipitation due to the energy-intensive process of forming nuclei out of an aqueous solution (Morse et al., 2007). This is supported by the observation that the threshold Ω for precipitation from unfiltered seawater is lower than that from filtered seawater (Hartmann et al., 2023), which means that minerals can nucleate on existing mineral particles in seawater (Alexandersson, 1972).
4.4 Precipitation rate
Using the changes in TA through time (Fig. 6A), we calculated the precipitation rate (r) in our experiments and those of Moras et al. (2022). Plotting this rate against Ω−1 yielded an empirical reaction order of 2.15 ± 0.40 and a rate constant of 0.20 ± 0.10 µmol h−1 (Fig. 9). The reaction order is higher but within the uncertainty of those from Mucci et al. (1989) and Burton and Walter (1987) for seeded aragonite precipitation experiments from artificial seawater at 25 °C (Fig. 9), which are 1.48 ± 0.3 and 1.70 ± 0.1, respectively. The similarity in the reaction order suggests that the precipitation mechanism is similar in our experiments, in those of Moras et al. (2022), and in the seeded experiments of Mucci et al. (1989) and Burton and Walter (1987).
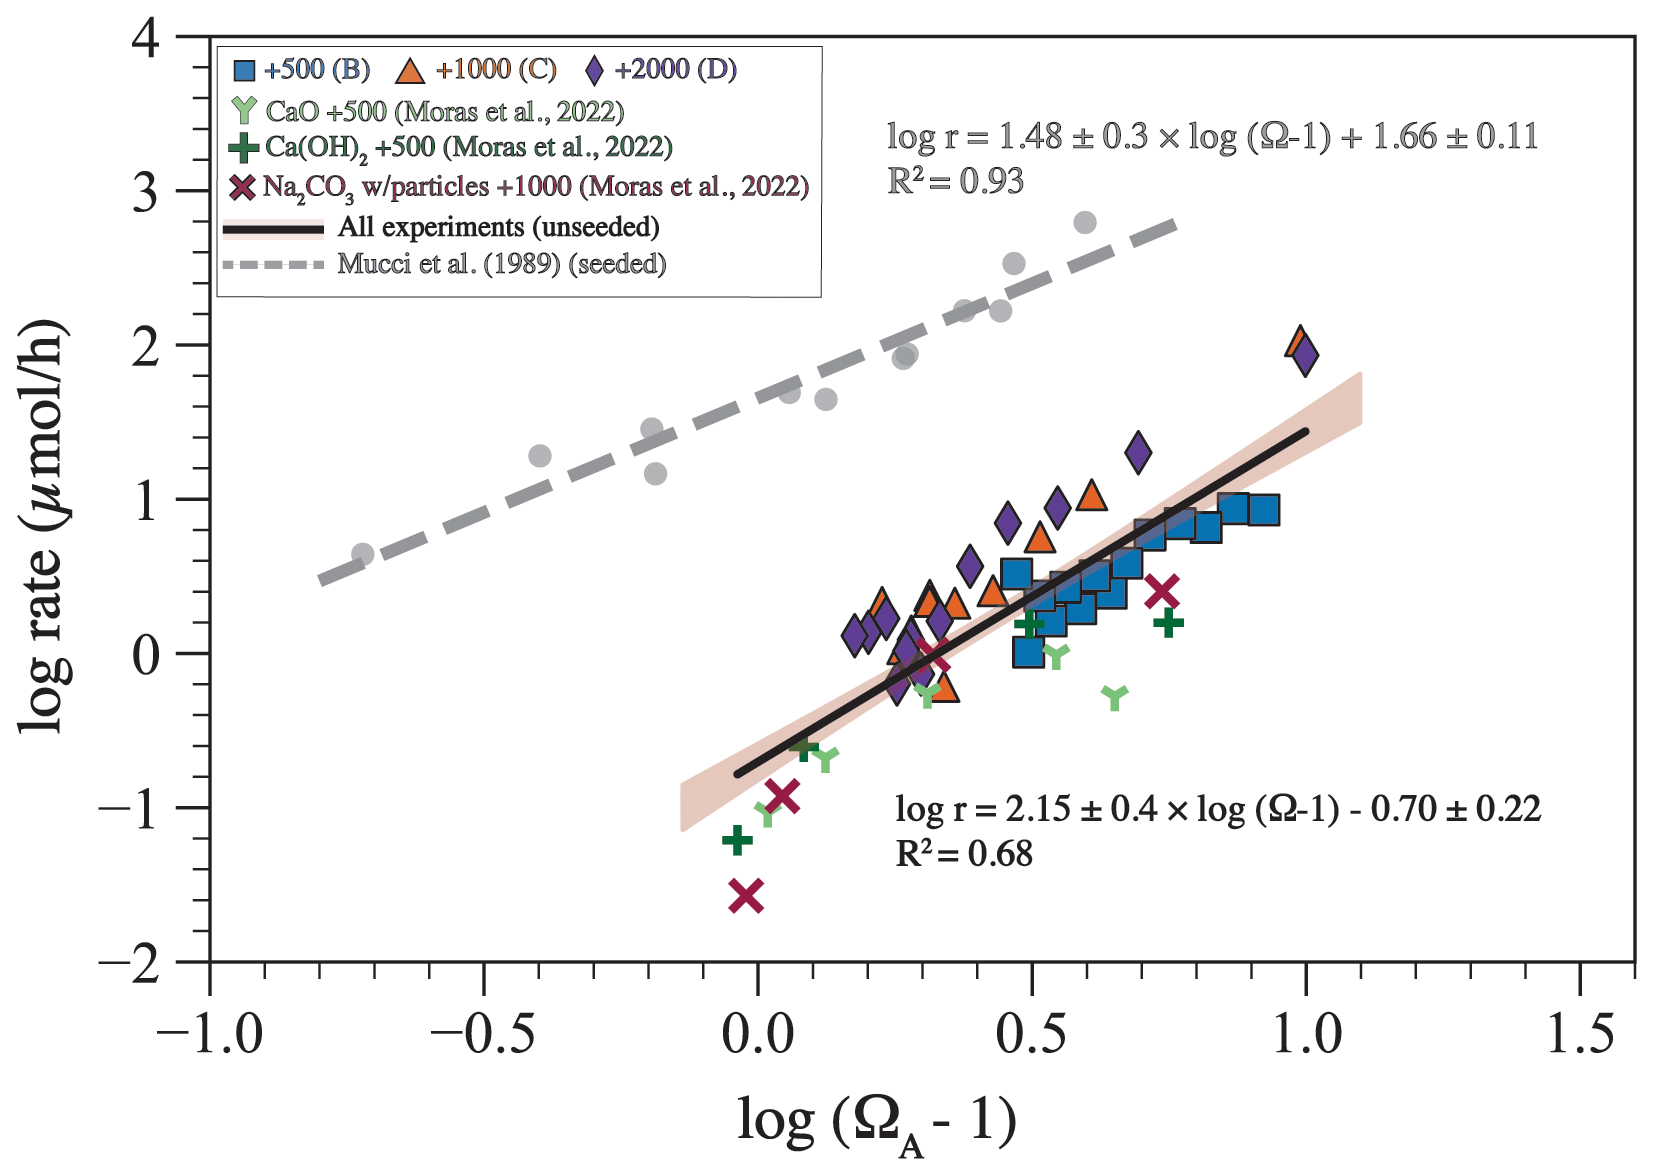
Figure 9The logarithm of precipitation rate (log10 r) plotted against the logarithm of (Ω−1) for experiments from this study, from Moras et al. (2022), and from Mucci et al. (1989). The solid black line with brown shading represents the linear fit through data from our experiments and those of Moras et al. (2022) with a 95 % confidence interval. The equation of this fit provides the reaction order (n=2.15) and the reaction constant (log10 ; k=0.2). All rate data are available in Hashim et al. (2025a).
However, the calculated rate constant is lower by about 1 order of magnitude compared with Mucci et al. (1989). A major difference in the experimental setup is that most previous studies used aragonite seeds to induce precipitation (e.g., Mucci et al., 1989). Aragonite seeds provide a template and thus decrease kinetic limitations to precipitation. In contrast, precipitation in our experiments was homogenous or pseudo-homogenous, where minerals either precipitated directly from seawater or formed on the inner walls of the foil bags. Nucleating on existing aragonite crystal is easier than nucleating on plastic or glass material (Subhas et al., 2022). For example, it has been shown that calcite grows faster on existing calcite compared to quartz (Lioliou et al., 2007). In addition, the entire inner surface area of the bag is 0.24 m2, whereas the surface area of the aragonite seeds in the experiments of Mucci et al. (1989) is 1.7 m2. Normalizing our rate constants and those of Mucci et al. by their respective surface area gives reaction constants of 0.63 and 26.50 µmol m−2 h−1, respectively. Therefore, the higher rate constants in the experiments of Mucci et al. (1989) are likely due to the presence of aragonite seeds. These comparisons indicate that the availability of nuclei represents a significant control on the rate of precipitation (Morse et al., 2007). They also reveal that the kinetics of homogenous nucleation of calcium carbonate minerals is not fully understood and that future work should address this knowledge gap, particularly in the context of OAE.
It is worth pointing out that our experiments were conducted at 27 °C, the experiments of Moras et al. (2022) were conducted at 21 °C, and the experiments of Mucci et al. (1989) were calculated at 25 °C. The reaction order is expected to increase by ∼ 0.066 per 1 °C, and the reaction constant is expected to increase by ∼ 0.5 per 1 °C (Burton and Walter, 1987). This suggests that differences in reaction order and constant due to temperature are within the reported uncertainties and are much smaller than the observed differences between our experiments, those of Moras et al. (2022), and those of Mucci et al. (1989). We have not recalculated all of these results to a single temperature because the study of Burton and Walter (1987), which originally explored the effects of temperature on reaction order and constant, was based on seeded experiments where the reaction constant is much higher than in our experiments and in those of Moras et al. (2022). This difference in experimental conditions is likely to be a dominant factor, and recalculation to account for slight differences in temperature did not seem warranted. This highlights the need for future work focusing on the role of temperature in mineral precipitation kinetics under conditions representative of a range of OAE scenarios.
4.5 The induction period prior to mineral precipitation
The induction period (tip) is the time required for precipitation to initiate from a supersaturated solution. In the context of OAE, a longer tip allows more dilution with surrounding seawater during OAE deployments (He and Tyka, 2023) and, on longer timescales, allows more CO2 uptake to increase DIC (Jones et al., 2014), potentially reducing or even eliminating mineral precipitation. Previous work has shown that the tip for CaCO3 minerals inversely correlates with the initial Ω (Pokrovsky, 1998), although the exact mechanism behind this relationship and how other variables impact tip remain unclear. One interesting observation is that higher-solution leads to longer tip for the same Ω (Fig. 10A), likely due to the inhibition effect of Mg on the nucleation and/or crystal growth of carbonate minerals (Berner, 1975; Bischoff, 1968; Hashim and Kaczmarek, 2020).
Identifying tip precisely in highly supersaturated solutions requires continuous and fast-responding measurements such as pH. To determine the induction period (tip) and the extrapolated Ω to infinite time following precipitation, the change in Ω over time was empirically described by fitting a Heaviside stepwise function to the data:
where Ω is the saturation state with respect to aragonite to be calculated through time; Ωo is the initial saturation state in the experiments, which is higher than that of seawater as a result of alkalinity addition; t is time in hours; tip is the induction period in hours; Ω∞ is the non-zero asymptote value after the exponential decay when Ω ceases to change with time; k is a decay constant that is related to the precipitation rate; and H is the Heaviside function, which is defined by
When t<tip (i.e., during the induction period), the expression (t−tip) becomes negative, and H(t) equals 0, which makes the first term of the equation equal to Ωo. When t>tip (after the induction period), H(t) equals 1, and Ω will decrease with time according to the exponential decay formula in the second term of the equation. This function was fitted to data from experiments B, C, and D (Table 1) and to three sets of experiments from Moras et al. (2022), which, similarly to our experiments, are characterized by an induction period and exponential decay. The fit was performed by concomitantly changing the free parameters Ωo, tip, Ω∞, and k while minimizing the difference between the fit and the data using Solver's nonlinear generalized reduced gradient algorithm in Excel®. We note that we only interpret tip and Ω∞ in this framework. The exponential part of the equation is a convenient functional form to model the decrease in Ω with time but is purely descriptive of the data and should not be used as a functional relationship between time and the decrease in Ω. All parameters obtained from the fitting are provided in Table 2.
Table 2Parameters obtained from fitting Eq. (7) to data for TA and ΩA.
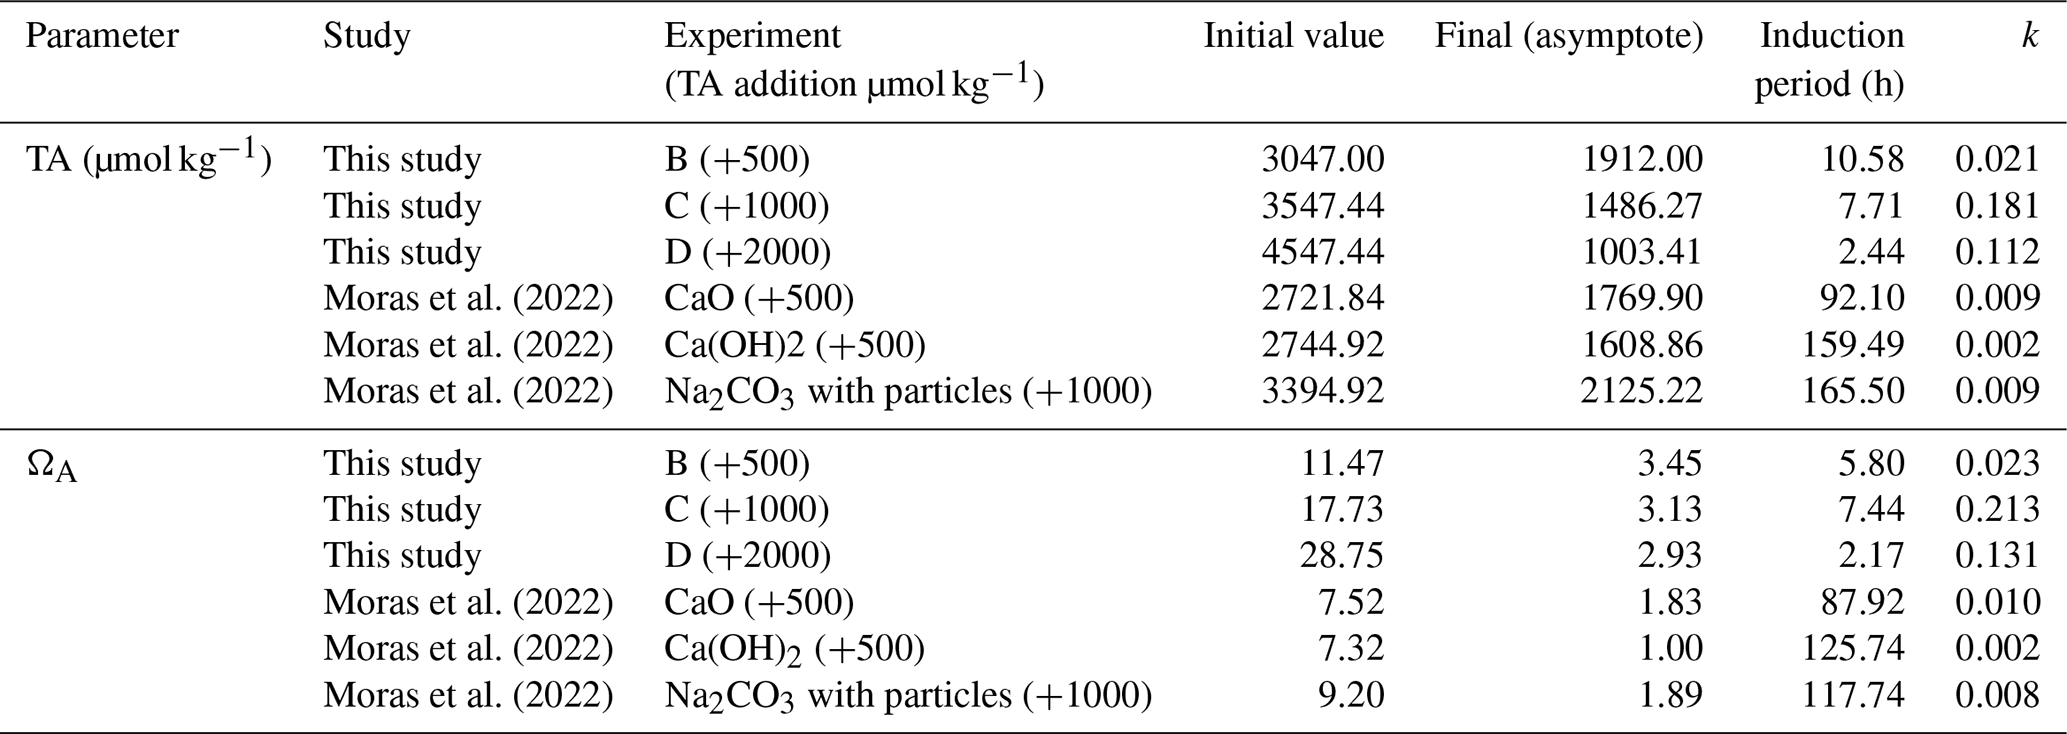
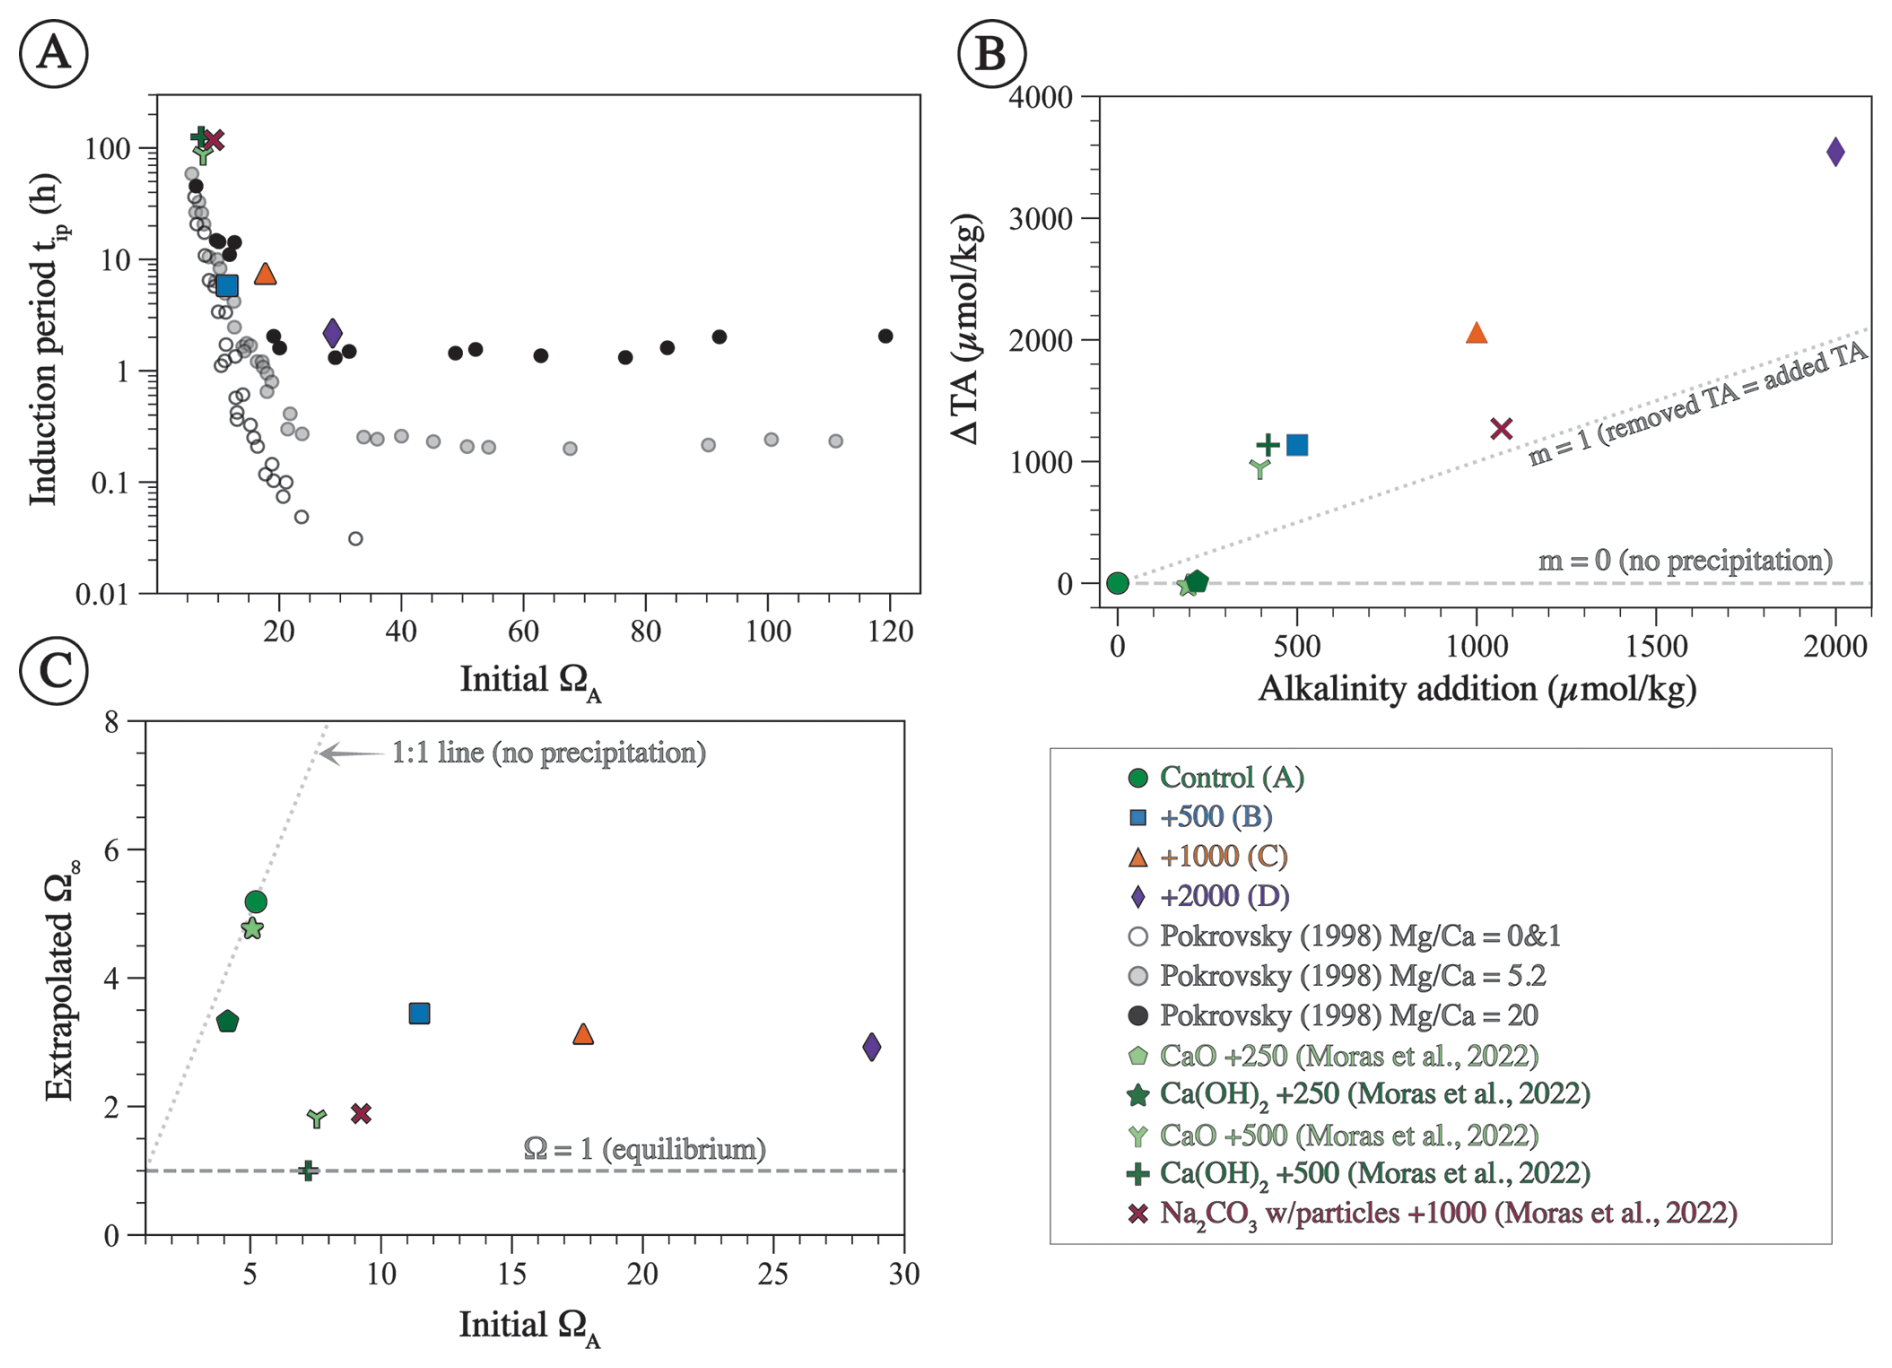
Figure 10Plots of some of the parameters obtained from fitting Eq. 7 to data shown in Fig. 7. (A) Linear–log plot between the induction period (tip) and the initial Ω (all Ω values are with respect to aragonite). Circles are data from Pokrovsky (1998) for solutions with different ratios. (B) Alkalinity drawdown (ΔTA = initial TA following alkalinity addition − final TA at the end of the experiment) plotted against alkalinity addition. The horizontal dashed line is plotted at ΔTA = 0, indicating no precipitation, whereas the dotted line has a slope of 1, indicating that the removed alkalinity due to precipitation equals the added alkalinity. (C) Cross-plot of the extrapolated Ω at infinite time (Ω∞) and initial Ω following alkalinity addition. The 1:1 line indicates that the initial Ω and Ω∞ are equal (no precipitation).
For our experiments, tip decreases as initial ΩA increases (Fig. 10A). Furthermore, the tip of our experiments is shorter than in those of Moras et al. (2022), confirming the relationship between tip and initial ΩA, given that our experiments were conducted at higher ΩA (Fig. 10A). In general, the tip from our experiment B (+500 µmol kg−1) and from the experiments of Moras et al. (2022) are in good agreement with data from Pokrovsky (1998) for seawater with average . In contrast, the tip values of experiments C and D (+1000 and +2000 µmol kg−1) are generally longer than those of Pokrovsky (1998) for the same initial ΩA. Experiment C has a tip of 7 h compared to 1 h for Pokrovsky's data for the same Ω, and experiment D has a tip of 2 h compared to 0.3 h for Pokrovsky's data (Fig. 10A). These differences could be due to the fact that our tip values are based on a model fitted to the data and do not represent actual measurements. Alternatively, they might be related to the presence of chemical inhibitors. Pokrovsky (1998) used a sulfate-free solution and a phosphate-free solution, both of which are known inhibitors of carbonate mineral precipitation and dissolution (e.g., Burton and Walter, 1990; Fernández-Díaz et al., 2010). Given that both our study and that of Moras et al. (2022) used natural seawater that contains both sulfate and phosphate, we suggest that the inhibition of mineral precipitation by these ions, in addition to Mg, may explain the longer tip in our experiments compared to those of Pokrovsky (1998). Additionally, the presence of particulate and dissolved organics in natural seawater may have further contributed to the inhibition of mineral precipitation (Moras et al., 2024; Naviaux et al., 2019; Subhas et al., 2018). Our study does not provide quantitative constraints on the tip because the sampling resolution was not high enough to determine the occurrence and duration of the induction period. Furthermore, there are few data in the literature on this important feature of mineral precipitation. Future work should focus on directly constraining tip under a wide range of OAE-relevant chemical conditions.
4.6 Runaway precipitation
Alkalinity addition can raise Ω high enough to initiate spontaneous precipitation of minerals whose surfaces can then serve as additional nucleation sites for crystal growth, leading to a phenomenon referred to as “runaway” precipitation, where more alkalinity is removed than had been added (Fuhr et al., 2022; Hartmann et al., 2023; Moras et al., 2022; Schulz et al., 2023; Suitner et al., 2024). Our data suggest the occurrence of runaway precipitation in all experiments (Figs. 6A and 10B).
Examining the relationship between alkalinity addition and alkalinity decline (i.e., the decrease in TA over the course of the experiment) provides further insights into the nature of this phenomenon (Fig. 10B). When plotting alkalinity addition on the x axis and ΔTA on the y axis, the horizontal line (slope and intercept = 0) indicates no precipitation, whereas the 1:1 line (slope = 0) indicates that the amount of alkalinity removed due to precipitation equals the amount added. The ideal scenario is that data points fall on the horizontal line or at least below the 1:1 line. The experiments of Moras et al. (2022), where alkalinity was enhanced by 250 µmol kg−1, are an example of such a scenario where no alkalinity was removed due to precipitation (Fig. 10B). In contrast, all other experiments fall above the 1:1 line, reflecting runaway precipitation where more alkalinity is removed than added. The data also suggest that the intensity of the runaway precipitation increases with higher alkalinity addition (Fig. 10B).
The extrapolated Ω∞ value in our experiments is always above 1, suggesting that mineral precipitation did not lower Ω until equilibrium was reached but ceased at an ΩA of ∼ 3 regardless of the initial ΩA, which ranged between 10 and 30 (Fig. 10C). One explanation as to why equilibrium is not reached is that precipitation becomes kinetically limited at lower Ω values due to the presence of Mg, phosphate, and organics, all of which are known to inhibit carbonate mineral precipitation (e.g., Berner, 1975; Mills et al., 2022). Alternatively, Ω may not have reached equilibrium because the duration of the experiments was too short. Indeed, the experiments of Moras et al. (2022), which were conducted for longer durations than ours, are all characterized by lower final Ω values, although two out of the three experiments analyzed here have an Ω of ∼ 2, suggesting that, even with long durations, equilibrium may not be reached due to kinetic inhibition of mineral precipitation (Fig. 10C).
This study used shipboard experiments to investigate mineral precipitation from seawater following alkalinity addition to test the efficiency of OAE as an ocean-based CO2 sequestration approach. Thermodynamic calculations indicate that OAE causes seawater to become supersaturated with respect to numerous minerals. The mineralogical data reveal that the dominant mineralogy of precipitate in all experiments is aragonite followed by a minor amount of calcite. A small amount of brucite is detected only in the experiment where 2000 µmol kg−1 of alkalinity was added. Moreover, the data show that the crystallographic characteristics (crystallite size and micro-strain) of aragonite evolve through time, consistent with the occurrence of Ostwald ripening.
The logarithm of the precipitation rate correlates with the logarithm of Ω−1, yielding a reaction order of 2.16 ± 0.5 and a rate constant of 0.2 ± 0.10 µmol h−1 for our experiments and those of Moras et al. (2022). Our reaction order is generally comparable to that derived from previous studies, but the rate constant is 1 order of magnitude lower. This difference is attributed to the fact that our experiments and most of those of Moras et al. (2022) were unseeded, whereas previous studies (e.g., Burton and Walter, 1987; Mucci et al., 1989) used carbonate seeds that act as nuclei for precipitation. The onset of precipitation was detected after an induction period, the length of which is inversely correlated with the initial Ω. Mineral precipitation occurred in all experiments, suggesting that the threshold ΩA for precipitation is <11. Precipitation took place in a runaway manner, decreasing TA to values below those of seawater prior to alkalinity addition.
Our results demonstrate that the highest risk of mineral precipitation is immediately following alkalinity addition and before dilution and CO2 uptake by seawater, both of which lower Ω. The observation that the dominant mineralogy of precipitate is aragonite indicates that mineral precipitation has a negative impact on OAE efficiency because aragonite is unlikely to redissolve given that the surface ocean is currently supersaturated with respect to this mineral. Magnesium hydroxide (i.e., brucite) precipitation, in contrast, is less problematic because it is more likely to redissolve, releasing alkalinity back into seawater. The occurrence of runaway precipitation also means that mineral precipitation following OAE may not only decrease OAE efficiency at sequestering CO2 but can also render this approach counterproductive. As such, mineral precipitation should be avoided by keeping Ω below the threshold of precipitation and quantifying its consequences on OAE efficiency if it occurs. Lastly, in order to be able to quantitatively determine the impact of mineral precipitation on OAE under a wide range of conditions, a mechanistic understanding of precipitation in the context of OAE must be developed.
All data used in this study are archived in the BCO-DMO repository. This includes the carbonate chemistry measurements and precipitate kinetics data (https://doi.org/10.26008/1912/bco-dmo.963736.1; Hashim et al., 2025a), the raw XRD data and the associated Rietveld refinement results (https://doi.org/10.26008/1912/bco-dmo.963717.1; Hashim et al., 2025b), and the thermogravimetric analysis (https://doi.org/10.26008/1912/bco-dmo.963692.1; Hashim et al. 2025c).
Conceptualization: MSH and AVS. Funding acquisition: AVS, MSH, FK. Data collection: MSH, EB, MH, FK. Investigation: MSH, AVS, LM, FK, DM, CD. Writing (original draft): MSH. Writing (review and editing): MSH, AVS, DM, FK, LM, CD, MH, EB.
The contact author has declared that none of the authors has any competing interests.
Publisher’s note: Copernicus Publications remains neutral with regard to jurisdictional claims made in the text, published maps, institutional affiliations, or any other geographical representation in this paper. While Copernicus Publications makes every effort to include appropriate place names, the final responsibility lies with the authors. Views expressed in the text are those of the authors and do not necessarily reflect the views of the publisher.
We would like to thank the captains and crew members of expeditions AE2316 and AE2321. We thank Ben Van Mooy, the chief scientist of expedition AE2321; Helen Fredricks for helping with field work; Donna Dimarchopoulou and Charles Settens for assisting with sample preparation for XRD analysis; and Dave Bish for insightful discussions regarding XRD data. MSH was funded by an NSF OCE Postdoctoral Fellowship (grant no. 2205984); AVS, LM, MH, and DM were funded by the Carbon to Sea Initiative; CD was funded by an NOAA-NOPP award (grant no. NOAA-OAR-OAP-2023-2007714); and EB was funded by the NSF OCE (grant no. 2123055). We are grateful to Devon Cole and Charly Moras for providing constructive feedback that improved the study and to the Associate Editor Olivier Sulpis for handling the article.
This research has been supported by the National Science Foundation (grant nos. 2205984 and 2123055), National Oceanic and Atmospheric Administration (grant no. 2007714), and Carbon to Sea Initiative.
This paper was edited by Olivier Sulpis and reviewed by Charly Moras and Devon Cole.
Alexandersson, T.: Intragranular Growth of Marine Aragonite and Mg-Calcite: Evidence of Precipitation from Supersaturated Seawater, Journal of Sedimentary Research, 42, https://doi.org/10.1306/74D72581-2B21-11D7-8648000102C1865D, 1972.
Bach, L. T., Ferderer, A. J., LaRoche, J., and Schulz, K. G.: Technical note: Ocean Alkalinity Enhancement Pelagic Impact Intercomparison Project (OAEPIIP), Biogeosciences, 21, 3665–3676, https://doi.org/10.5194/bg-21-3665-2024, 2024.
Berner, R. A.: The role of magnesium in the crystal growth of calcite and aragonite from sea water, Geochimica et Cosmochimica Acta, 39, 489–504, https://doi.org/10.1016/0016-7037(75)90102-7, 1975.
Bethke, C. M.: Geochemical Reaction Modeling, Oxford University Press, New York, https://doi.org/10.1093/oso/9780195094756.002.0001, 1996.
Bischoff, J. L.: Kinetics of calcite nucleation: Magnesium ion inhibition and ionic strength catalysis, J. Geophys. Res., 73, 3315–3322, https://doi.org/10.1029/JB073i010p03315, 1968.
Bish, D. L. and Howard, S. A.: Quantitative phase analysis using the Rietveld method, Journal of Applied Crystallography, 21, 86–91, 1988.
Bish, D. L. and Post, J. E.: Modern Powder Diffraction, in: Reviews in Mineralogy, Walter de Gruyter GmbH & Co KG, ISBN 0-939950-24-3, ISBN 978-0-939950-24-9, 2018.
Black, D. R., Mendenhall, M. H., Brown, C. M., Henins, A., Filliben, J., and Cline, J. P.: Certification of Standard Reference Material 660c for powder diffraction, Powder Diffr., 35, https://doi.org/10.1017/s0885715620000068, 2020.
Burton, E. A. and Walter, L. M.: Relative precipitation rates of aragonite and Mg calcite from seawater: Temperature or carbonate ion control?, Geol., 15, 111, https://doi.org/10.1130/0091-7613(1987)15<111:RPROAA>2.0.CO;2, 1987.
Burton, E. A. and Walter, L. M.: The role of pH in phosphate inhibition of calcite and aragonite precipitation rates in seawater, Geochimica et Cosmochimica Acta, 54, 797–808, https://doi.org/10.1016/0016-7037(90)90374-T, 1990.
Cannon, A. J.: Twelve months at 1.5 °C signals earlier than expected breach of Paris Agreement threshold, Nat. Clim. Change, https://doi.org/10.1038/s41558-025-02247-8, 2025.
Cifuentes-Araya, N., Astudillo-Castro, C., and Bazinet, L.: Mechanisms of mineral membrane fouling growth modulated by pulsed modes of current during electrodialysis: Evidences of water splitting implications in the appearance of the amorphous phases of magnesium hydroxide and calcium carbonate, Journal of Colloid and Interface Science, 426, 221–234, https://doi.org/10.1016/j.jcis.2014.03.054, 2014.
Coelho, A. A.: TOPAS and TOPAS-Academic: an optimization program integrating computer algebra and crystallographic objects written in C, J. Appl. Cryst., 51, 210–218, https://doi.org/10.1107/S1600576718000183, 2018.
Dickson, A. G. and Millero, F. J.: A comparison of the equilibrium constants for the dissociation of carbonic acid in seawater media, Deep Sea Research Part A. Oceanographic Research Papers, 34, 1733–1743, https://doi.org/10.1016/0198-0149(87)90021-5, 1987.
Dickson, A. G., Sabine, C. L., Christian, J. R., and Bargeron, C. P. (Eds.): North Pacific Marine Science Organization Guide to best practices for ocean CO2 measurements, PICES special publication, North Pacific Marine Science Organization, Sidney, BC, ISBN 1-897176-07-4, https://doi.org/10.25607/OBP-1342, 2007.
Doney, S. C., Fabry, V. J., Feely, R. A., and Kleypas, J. A.: Ocean Acidification: The Other CO2 Problem, Annual Review of Marine Science, 1, 169–192, https://doi.org/10.1146/annurev.marine.010908.163834, 2009.
Eisaman, M. D., Geilert, S., Renforth, P., Bastianini, L., Campbell, J., Dale, A. W., Foteinis, S., Grasse, P., Hawrot, O., Löscher, C. R., Rau, G. H., and Rønning, J.: Assessing the technical aspects of ocean-alkalinity-enhancement approaches, in: Guide to Best Practices in Ocean Alkalinity Enhancement Research, edited by: Oschlies, A., Stevenson, A., Bach, L. T., Fennel, K., Rickaby, R. E. M., Satterfield, T., Webb, R., and Gattuso, J.-P., Copernicus Publications, State Planet, 2-oae2023, 3, https://doi.org/10.5194/sp-2-oae2023-3-2023, 2023.
Evans, D., Gray, W. R., Rae, J. W. B., Greenop, R., Webb, P. B., Penkman, K., Kröger, R., and Allison, N.: Trace and major element incorporation into amorphous calcium carbonate (ACC) precipitated from seawater, Geochimica et Cosmochimica Acta, 290, 293–311, https://doi.org/10.1016/j.gca.2020.08.034, 2020.
Fernández-Díaz, L., Fernández-González, Á., and Prieto, M.: The role of sulfate groups in controlling CaCO3 polymorphism, Geochimica et Cosmochimica Acta, 74, 6064–6076, https://doi.org/10.1016/j.gca.2010.08.010, 2010.
Földvári, M.: Handbook of the thermogravimetric system of minerals and its use in geological practice, Occasional Papers of the Geological Institute of Hungary, Geological Institute of Hungary, Budapest, ISBN 978-963-671-288-4, https://link.gale.com/apps/doc/A457593957/AONE?u=anon~8d77c84&sid=googleScholar&xid=53fc2ea9 (last access: 13 October 2025), 2011.
Friedlingstein, P., O'Sullivan, M., Jones, M. W., Andrew, R. M., Gregor, L., Hauck, J., Le Quéré, C., Luijkx, I. T., Olsen, A., Peters, G. P., Peters, W., Pongratz, J., Schwingshackl, C., Sitch, S., Canadell, J. G., Ciais, P., Jackson, R. B., Alin, S. R., Alkama, R., Arneth, A., Arora, V. K., Bates, N. R., Becker, M., Bellouin, N., Bittig, H. C., Bopp, L., Chevallier, F., Chini, L. P., Cronin, M., Evans, W., Falk, S., Feely, R. A., Gasser, T., Gehlen, M., Gkritzalis, T., Gloege, L., Grassi, G., Gruber, N., Gürses, Ö., Harris, I., Hefner, M., Houghton, R. A., Hurtt, G. C., Iida, Y., Ilyina, T., Jain, A. K., Jersild, A., Kadono, K., Kato, E., Kennedy, D., Klein Goldewijk, K., Knauer, J., Korsbakken, J. I., Landschützer, P., Lefèvre, N., Lindsay, K., Liu, J., Liu, Z., Marland, G., Mayot, N., McGrath, M. J., Metzl, N., Monacci, N. M., Munro, D. R., Nakaoka, S.-I., Niwa, Y., O'Brien, K., Ono, T., Palmer, P. I., Pan, N., Pierrot, D., Pocock, K., Poulter, B., Resplandy, L., Robertson, E., Rödenbeck, C., Rodriguez, C., Rosan, T. M., Schwinger, J., Séférian, R., Shutler, J. D., Skjelvan, I., Steinhoff, T., Sun, Q., Sutton, A. J., Sweeney, C., Takao, S., Tanhua, T., Tans, P. P., Tian, X., Tian, H., Tilbrook, B., Tsujino, H., Tubiello, F., van der Werf, G. R., Walker, A. P., Wanninkhof, R., Whitehead, C., Willstrand Wranne, A., Wright, R., Yuan, W., Yue, C., Yue, X., Zaehle, S., Zeng, J., and Zheng, B.: Global Carbon Budget 2022, Earth Syst. Sci. Data, 14, 4811–4900, https://doi.org/10.5194/essd-14-4811-2022, 2022.
Fuhr, M., Geilert, S., Schmidt, M., Liebetrau, V., Vogt, C., Ledwig, B., and Wallmann, K.: Kinetics of Olivine Weathering in Seawater: An Experimental Study, Front. Clim., 4, https://doi.org/10.3389/fclim.2022.831587, 2022.
Gruber, N., Clement, D., Carter, B. R., Feely, R. A., van Heuven, S., Hoppema, M., Ishii, M., Key, R. M., Kozyr, A., Lauvset, S. K., Lo Monaco, C., Mathis, J. T., Murata, A., Olsen, A., Perez, F. F., Sabine, C. L., Tanhua, T., and Wanninkhof, R.: The oceanic sink for anthropogenic CO2 from 1994 to 2007, Science, 363, 1193–1199, https://doi.org/10.1126/science.aau5153, 2019.
Hartmann, J., Suitner, N., Lim, C., Schneider, J., Marín-Samper, L., Arístegui, J., Renforth, P., Taucher, J., and Riebesell, U.: Stability of alkalinity in ocean alkalinity enhancement (OAE) approaches – consequences for durability of CO2 storage, Biogeosciences, 20, 781–802, https://doi.org/10.5194/bg-20-781-2023, 2023.
Hashim, M. S. and Kaczmarek, S. E.: Experimental stabilization of carbonate sediments to calcite: Insights into the depositional and diagenetic controls on calcite microcrystal texture, Earth and Planetary Science Letters, 538, 116235, https://doi.org/10.1016/j.epsl.2020.116235, 2020.
Hashim, M. S. and Kaczmarek, S. E.: The transformation of aragonite to calcite in the presence of magnesium: Implications for marine diagenesis, Earth and Planetary Science Letters, 574, 117166, https://doi.org/10.1016/j.epsl.2021.117166, 2021.
Hashim, M. S. and Kaczmarek, S. E.: Rhombic calcite microcrystals as a textural proxy for meteoric diagenesis, Sci. Rep., 12, 213, https://doi.org/10.1038/s41598-021-04219-2, 2022.
Hashim, M. S., Rose, K. G., Cohen, H. F., and Kaczmarek, S. E.: Effects of sodium and potassium concentrations on dolomite formation rate, stoichiometry and crystallographic characteristics, Sedimentology, https://doi.org/10.1111/sed.13124, 2023.
Hashim, M. S., Kaczmarek, S. E., Wolfram Naa, G., Bish, D. L., and Subhas, A. V.: A process-based geochemical framework for carbonate sediments during marine diagenesis, Geochimica et Cosmochimica Acta, 376, 54–67, https://doi.org/10.1016/j.gca.2024.05.023, 2024.
Hashim, M., Marx, L., Klein, F., Dean, C., Burdige, E., McCorkle, D. C., and Subhas, A. V.: Carbonate chemistry data for shipboard ocean alkalinity enhancement (OAE) experiments in the North Atlantic on R/V Atlantic Explorer cruise AE2320 in September 2023, Version 1, Biological and Chemical Oceanography Data Management Office (BCO-DMO) [data set], https://doi.org/10.26008/1912/bco-dmo.963736.1, 2025a.
Hashim, M., Marx, L., Klein, F., Dean, C., Burdige, E., Hayden, M. G., McCorkle, D. C., and Subhas, A. V.: X-ray diffraction (XRD) raw data and results from Rietveld refinement for precipitate from shipboard ocean alkalinity enhancement (OAE) experiments in the North Atlantic on R/V Atlantic Explorer cruise AE2320 in September 2023, Version 1 , Biological and Chemical Oceanography Data Management Office (BCO-DMO) [data set], https://doi.org/10.26008/1912/bco-dmo.963717.1, 2025b.
Hashim, M., Marx, L., Klein, F., Dean, C., Burdige, E., Hayden, M. G., McCorkle, D. C., and Subhas, A. V.: Thermogravimetric analysis (TGA) for precipitate from shipboard ocean alkalinity enhancement (OAE) experiments in the North Atlantic on R/V Atlantic Explorer cruise AE2320 in September 2023, Version 1, Biological and Chemical Oceanography Data Management Office (BCO-DMO) [data set], https://doi.org/10.26008/1912/bco-dmo.963692.1, 2025c.
Hawkins, E., Ortega, P., Suckling, E., Schurer, A., Hegerl, G., Jones, P., Joshi, M., Osborn, T. J., Masson-Delmotte, V., Mignot, J., Thorne, P., and van Oldenborgh, G. J.: Estimating Changes in Global Temperature since the Preindustrial Period, B. Am. Meteorol. Soc., https://doi.org/10.1175/BAMS-D-16-0007.1, 2017.
He, J. and Tyka, M. D.: Limits and CO2 equilibration of near-coast alkalinity enhancement, Biogeosciences, 20, 27–43, https://doi.org/10.5194/bg-20-27-2023, 2023.
Humphreys, M. P., Lewis, E. R., Sharp, J. D., and Pierrot, D.: PyCO2SYS v1.8: marine carbonate system calculations in Python, Geosci. Model Dev., 15, 15–43, https://doi.org/10.5194/gmd-15-15-2022, 2022.
Jiang, L. Q., Feely, R. A., Carter, B. R., Greeley, D. J., Gledhill, D. K., and Arzayus, K. M.: Climatological distribution of aragonite saturation state in the global oceans, Global Biogeochemical Cycles, 29, 1656–1673, https://doi.org/10.1002/2015GB005198, 2015.
Jones, D. C., Ito, T., Takano, Y., and Hsu, W. C.: Spatial and seasonal variability of the air-sea equilibration timescale of carbon dioxide, Global Biogeochemical Cycles, 28, 1163–1178, https://doi.org/10.1002/2014GB004813, 2014.
Kaczmarek, S., Gregg, J., Bish, D., Machel, H. G., and Fouke, B.: Dolomite, Very High-Magnesium Calcite, and Microbes – Implications for the Microbial Model of Dolomitization, SEPM Special Publication No. 109, GeoScienceWorld, https://doi.org/10.2110/sepmsp.109.01, 2017.
Klein, F., Humphris, S. E., and Bach, W.: Brucite formation and dissolution in oceanic serpentinite, Geochemical Perspectives Letters, 16, https://doi.org/10.7185/geochemlet.2035, 2020.
Lewis, E., Wallace, D., and Allison, L. J.: Program developed for CO2 system calculations (No. ORNL/CDIAC-105), Brookhaven National Lab., Dept. of Applied Science, Upton, NY (United States), Oak Ridge National Lab., Carbon Dioxide Information Analysis Center, TN (United States), https://doi.org/10.15485/1464255, 1998.
Lioliou, M. G., Paraskeva, C. A., Koutsoukos, P. G., and Payatakes, A. C.: Heterogeneous nucleation and growth of calcium carbonate on calcite and quartz, Journal of Colloid and Interface Science, 308, 421–428, https://doi.org/10.1016/j.jcis.2006.12.045, 2007.
Mehrbach, C., Culberson, C. H., Hawley, J. E., and Pytkowicz, R. M.: Measurement of the Apparent Dissociation Constants of Carbonic Acid in Seawater at Atmospheric Pressure, Limnology and Oceanography, 18, 897–907, https://doi.org/10.4319/lo.1973.18.6.0897, 1973.
Methley, P., Jiang, C., Strauss, J., and Tosca, N.: Evaporation of seawater produces amorphous calcium-magnesium carbonate when aragonite precipitation is inhibited, EGU General Assembly 2024, Vienna, Austria, 14–19 Apr 2024, EGU24-17981, https://doi.org/10.5194/egusphere-egu24-17981, 2024.
Mills, J. V., Barnhart, H. A., DePaolo, D. J., and Lammers, L. N.: New insights into Mn2+ and Mg2+ inhibition of calcite growth, Geochimica et Cosmochimica Acta, 334, 338–367, https://doi.org/10.1016/j.gca.2022.06.015, 2022.
Mittemeijer, E. J. and Welzel, U.: The “state of the art” of the diffraction analysis of crystallite size and lattice strain, Zeitschrift für Kristallographie, 223, 552–560, https://doi.org/10.1524/zkri.2008.1213, 2008.
Moras, C. A., Bach, L. T., Cyronak, T., Joannes-Boyau, R., and Schulz, K. G.: Ocean alkalinity enhancement – avoiding runaway CaCO3 precipitation during quick and hydrated lime dissolution, Biogeosciences, 19, 3537–3557, https://doi.org/10.5194/bg-19-3537-2022, 2022.
Moras, C. A., Cyronak, T., Bach, L. T., Joannes-Boyau, R., and Schulz, K. G.: Effects of grain size and seawater salinity on magnesium hydroxide dissolution and secondary calcium carbonate precipitation kinetics: implications for ocean alkalinity enhancement, Biogeosciences, 21, 3463–3475, https://doi.org/10.5194/bg-21-3463-2024, 2024.
Morse, J. W. and He, S.: Influences of T, S and on the pseudo-homogeneous precipitation of CaCO3 from seawater: implications for whiting formation, Marine Chemistry, 41, 291–297, https://doi.org/10.1016/0304-4203(93)90261-L, 1993.
Morse, J. W., Wang, Q., and Tsio, M. Y.: Influences of temperature and Mg:Ca ratio on CaCO3 precipitates from seawater, Geol., 25, 85, https://doi.org/10.1130/0091-7613(1997)025<0085:IOTAMC>2.3.CO;2, 1997.
Morse, J. W., Arvidson, R. S., and Lüttge, A.: Calcium carbonate formation and dissolution, Chem. Rev., 107, 342–381, https://doi.org/10.1021/cr050358j, 2007.
Morse, W. and Casey, H.: Ostwald processes and mineral paragenesis in sediments, American Journal of Science, https://doi.org/10.2475/ajs.288.6.537, 1988.
Mucci, A., Canuel, R., and Zhong, S.: The solubility of calcite and aragonite in sulfate-free seawater and the seeded growth kinetics and composition of the precipitates at 25 °C, Chemical Geology, 74, 309–320, https://doi.org/10.1016/0009-2541(89)90040-5, 1989.
Naviaux, J. D., Subhas, A. V., Rollins, N. E., Dong, S., Berelson, W. M., and Adkins, J. F.: Temperature dependence of calcite dissolution kinetics in seawater, Geochimica et Cosmochimica Acta, 246, 363–384, https://doi.org/10.1016/j.gca.2018.11.037, 2019.
Paris Climate Agreement: United Nations Framework Convention on Climate Change, Paris Agreement. Article 2(a), https://unfccc.int/process-and-meetings/the-paris-agreement (last access: 13 October 2025), 2015.
Pokrovsky, O. S.: Precipitation of calcium and magnesium carbonates from homogeneous supersaturated solutions, Journal of Crystal Growth, 186, 233–239, https://doi.org/10.1016/S0022-0248(97)00462-4, 1998.
Pytkowicz, R. M.: Calcium carbonate retention in supersaturated seawater, American Journal of Science, 273, 515–522, 1973.
Renforth, P. and Henderson, G.: Assessing ocean alkalinity for carbon sequestration, Reviews of Geophysics, 55, 636–674, https://doi.org/10.1002/2016RG000533, 2017.
Schulz, K. G., Bach, L. T., and Dickson, A. G.: Seawater carbonate chemistry considerations for ocean alkalinity enhancement research: theory, measurements, and calculations, in: Guide to Best Practices in Ocean Alkalinity Enhancement Research, edited by: Oschlies, A., Stevenson, A., Bach, L. T., Fennel, K., Rickaby, R. E. M., Satterfield, T., Webb, R., and Gattuso, J.-P., Copernicus Publications, State Planet, 2-oae2023, 2, https://doi.org/10.5194/sp-2-oae2023-2-2023, 2023.
Subhas, A. V., Adkins, J. F., Rollins, N. E., Naviaux, J., Erez, J., and Berelson, W. M.: Catalysis and chemical mechanisms of calcite dissolution in seawater, P. Natl. Acad. Sci. USA, 114, 8175–8180, https://doi.org/10.1073/pnas.1703604114, 2017.
Subhas, A. V., Rollins, N. E., Berelson, W. M., Erez, J., Ziveri, P., Langer, G., and Adkins, J. F.: The dissolution behavior of biogenic calcites in seawater and a possible role for magnesium and organic carbon, Marine Chemistry, 205, 100–112, https://doi.org/10.1016/j.marchem.2018.08.001, 2018.
Subhas, A. V., Dong, S., Naviaux, J. D., Rollins, N. E., Ziveri, P., Gray, W., Rae, J. W. B., Liu, X., Byrne, R. H., Chen, S., Moore, C., Martell-Bonet, L., Steiner, Z., Antler, G., Hu, H., Lunstrum, A., Hou, Y., Kemnitz, N., Stutsman, J., Pallacks, S., Dugenne, M., Quay, P. D., Berelson, W. M., and Adkins, J. F.: Shallow calcium carbonate cycling in the North Pacific Ocean, Global Biogeochemical Cycles, 36, https://doi.org/10.1029/2022GB007388, 2022.
Suitner, N., Faucher, G., Lim, C., Schneider, J., Moras, C. A., Riebesell, U., and Hartmann, J.: Ocean alkalinity enhancement approaches and the predictability of runaway precipitation processes: results of an experimental study to determine critical alkalinity ranges for safe and sustainable application scenarios, Biogeosciences, 21, 4587–4604, https://doi.org/10.5194/bg-21-4587-2024, 2024.
Sun, W., Jayaraman, S., Chen, W., Persson, K. A., and Ceder, G.: Nucleation of metastable aragonite CaCO3 in seawater, Proceedings of the National Academy of Sciences, 112, 3199–3204, https://doi.org/10.1073/pnas.1423898112, 2015.
Vermilyea, D. A.: The dissolution of MgO and Mg(OH)2 in aqueous solutions, Journal of the Electrochemical Society, 116, 1179, https://doi.org/10.1149/1.2412273, 1969.
Zhong, S. and Mucci, A.: Calcite and aragonite precipitation from seawater solutions of various salinities: Precipitation rates and overgrowth compositions, Chemical Geology, 78, 283–299, https://doi.org/10.1016/0009-2541(89)90064-8, 1989.