the Creative Commons Attribution 4.0 License.
the Creative Commons Attribution 4.0 License.
 | 23 Feb 2026
Long-term effects of drainage and rewetting on the degradation and preservation of peat organic matter in sub-tropical climate
Guy Sapir
Alon Angert
Yoav Oved Rosenberg
Rotem Golan
Peatlands cover about 3 % of the earth's land surface, while storing about 20 % of the total global soil organic carbon. These carbon stocks are largely at risk, as many peatlands have deteriorated since the Industrial Revolution due to conversion to agricultural land by drainage. Globally, peatland drainage is responsible for over 3.5 % of anthropogenic greenhouse gas emissions. Approximately 75 % of these emissions originate from warm climate regions. Mitigation of these emissions can be achieved by rewetting degraded peatlands. This study focuses on a warm Mediterranean sub-tropical climate peatland that has been cultivated for the past ∼70 years (Hula Valley, Israel). The historic marsh was drained in 1957 for agricultural use and underwent a hydrological restoration project for elevating and stabilizing groundwater table since 1994. This land management history resulted in a sedimentary peat column that can be divided into three distinct sub-sections: drained, rewetted and pristine peat. This setting enables studying the drainage and rewetting effects on soil organic matter (SOM) degradation and preservation under warm climates. For this purpose, five sediment cores, 4 m long each, were excavated from cropland located over the historic marsh area. Locations were chosen to match previous studies on this site. Each soil profile was characterized using Rock-Eval® thermal analysis of the organic matter, and short-term soil aerobic respiration experiments. Integration of these results with historic SOM content data and with SOM modelling was used to explore the long-term process and rate of degradation. We found that the mean SOM content in the top one meter of the soil profile declined from 68±4 % to 21±2 % by weight over the past 66 years, excluding the compaction effect. In comparison to the drained section, the rewetted and pristine sub-sections have a mean SOM of 33±2 % and 64±2 %, respectively. A peak in pyrite concentration beneath the recent water table-level, was observed in most profiles, indicating anaerobic conditions and sulfur recycling. Rock-Eval® thermal analysis demonstrated that during decomposition, the residual SOM became more oxidized and contained a lower proportion of thermally labile SOM, with a significant difference found between drained and rewetted peat. These results imply that the raising of the water table (∼30 years ago) effectively helped preserving organic matter compared to the drained section. Long-term SOM field data were integrated and studied using an SOM decomposition model and by incorporating respiration fluxes. The resulting trends highlighted that the first few decades of exposure are highly significant for the fate of the carbon stock, leading to substantial CO2 emissions. These emissions were lower by 60 %–85 % after 70 years. Furthermore, our results suggest that currently, approximately 13 %–21 % of SOM persists as resistant organic matter in the degraded peat.
- Article
(3973 KB) - Full-text XML
-
Supplement
(1910 KB) - BibTeX
- EndNote


Peatlands cover about 3 % of the earth's land surface and estimated to store between 500–700 Pg of carbon (C), which are about 20 % of the global total soil organic stock (Page and Baird, 2016). Peatland has been exploited intensively by humans since the Industrial Revolution. At present, human activity of draining and mining affects approximately 10 % of the remaining global peatlands, transforming these ecosystems from long-term carbon sinks into significant sources of greenhouse gases (GHG's) (Leifeld and Menichetti, 2018). This transformation promotes carbon loss, primarily through microbial respiration and dissolved organic carbon (DOC) leaching (Hiraishi et al., 2013). Degraded peatlands currently contain 80.8 Pg of carbon and 2.3 Pg of nitrogen (Leifeld and Menichetti, 2018). Without further protective actions, drained peatlands will release most of this stock as greenhouse gases into the atmosphere.
The primary factor that contributes to the preservation of peat organic matter (OM) is anaerobic conditions, which predominantly prevail in water-saturated conditions (Moore, 1989). In such environments, where the SOM supply rate exceeds the decomposition rate, a net carbon sink can evolve (Moore, 1989). Generally, organic matter is added to the surface of the marsh (peat-forming habitat) mainly from net primary production, and its accumulation is countered by decomposition processes. Decomposition in the top layer occurs under aerobic conditions, followed by deeper burial in the saturated horizon where oxygen is limited (Moore, 1989; Joosten and Clarke, 2002). There, under anaerobic conditions, decomposition occurs at rates that are approximately a thousand times lower than the upper aerobic layer (Clymo et al., 1998; Kleinen et al., 2012). These low decomposition rates result in a carbon sink with a turnover time of several thousand years if it remains undisturbed (Yu et al., 2010). Lowering the water table level (WTL) results in oxidation of the peat column, stimulating aerobic microbial decomposition of the SOM (Scanlon and Moore, 2000; Joosten and Clarke, 2002), which releases intense CO2 and N2O fluxes into the atmosphere (Page and Baird, 2016). Draining peatlands by lowering the WTL to convert them into agricultural lands has been a widespread practice for centuries and continues today. Numerous studies, e.g., Hooijer et al. (2010) and Moore and Knowles (1989), have demonstrated a clear correlation between low WTL and high CO2 emissions due to peat soil respiration. Currently, more than 90 % of global drained peatlands are used for agriculture (Tubiello et al., 2016). This practice occurs across most climate zones, with the largest emission rates from drained peatlands currently observed in Southeast Asia (Hooijer et al., 2010; Tubiello et al., 2016). Emissions rates due to microbial respiration are strongly controlled by temperature, and therefore, by climate zones. Drained peatlands in tropical regions have the highest annual emissions per area (∼70 t CO2 ha−1 yr−1), which is four and two times higher than in boreal and warm temperate climate zones, respectively (Tubiello et al., 2016; Hiraishi et al., 2013). Global emissions stemming from drained peatlands are estimated to be ∼1.9 Pg CO2 eq. yr−1 (Leifeld and Menichetti, 2018), accounting for ∼3.6 % of global anthropogenic CO2 eq. emissions, with ∼77 % of those emissions coming from the tropical climate zone (Leifeld and Menichetti, 2018).
Peatland restoration, primarily through rewetting drained peat, can reduce global CO2 emissions by 0.5–1.3 Pg CO2 eq. yr−1 (Leifeld and Menichetti, 2018; Günther et al., 2020), and account for 30 % of global mitigation solutions for forests and other land ecosystems (Roe et al., 2021). Successful rewetting often involves blocking drainage systems, stabilizing water levels, and re-establishing vegetation adapted to wet conditions (Convention on Wetlands, 2021). While drainage leads to high CO2 emissions, maintaining a high WTL can result in increased methane emissions. However, studies showed that raising the WTL to near the surface results in a net reduction of CO2 emissions that outweighs methane emissions (Günther et al., 2020; Wilson et al., 2016; Nyberg et al., 2022). A global meta-analysis found that keeping the groundwater level close to the surface can reduce global GHG's emissions from wetlands by about 90 % by the end of the 21st century (Zou et al., 2022). Despite many studies highlighting the importance of rewetting for climate mitigation, there is scarce data on organic matter preservation in rewetted tropical peatlands (Nabuurs et al., 2022; Wilson et al., 2016). Available data on rewetted sites are limited to several to ten years (Wilson et al., 2016), thus limiting the evaluation of rewetting effect on SOC preservation and GHG emissions. Moreover, information about the time frame since drainage, during which rewetting remains effective, is crucial for selecting sites for management and preservation actions.
Peatlands deposits are rich in organic matter, characterized by about 50 % by weight of SOM (Joosten and Clarke, 2002). While drainage leads to SOM loss and mineralization, studies have shown that recalcitrant material in peatlands may influence decomposition rates after drainage (Leifeld et al., 2012). Leifeld et al. (2012) showed that, in drained peatlands, high respiration rates were correlated with high concentrations of O-alkyl-C (a functional group of labile compounds). Könönen et al. (2016) found that tropical peat drainage leads to an increase in recalcitrant compounds concentrations. Phenol oxidase is known as a key factor in accelerating the decomposition of recalcitrant SOM, such as lignin, after drainage (Freeman et al., 2004). However, Fe2+ oxidation may inhibit phenol oxidase activity and further enhancing Fe(III) and lignin complexation, as suggested by the “iron gate” mechanism (Wang et al., 2017). These studies suggest that the reactivity for decomposition depends on the different fractions and compounds of the SOM in peat. However, the fate of these recalcitrant compounds after prolonged peat degradation and mineralization remains unclear.
Recent evidence in mineral soils studies suggests that stabilization by recalcitrant material, as proposed in the “selective preservation” hypothesis, is not common and relevant only at the beginning of SOM decomposition and in rich SOM soils (Rowley et al., 2017). Besides the limitations of oxygen availability due to water saturation, and extreme temperature constraints on bacterial and enzymatic activity (Rowley et al., 2017), the most significant preservation mechanisms in mineral soils are SOM aggregation and mineral sorption (Lützow et al., 2006; Kleber et al., 2015). SOM aggregation is a physical process by which SOM is separated from decomposers by the occlusion of organic and inorganic particles within aggregates with cementing agents (Six et al., 2002). Aggregation is known to be promoted both by microbial activity (Chenu and Cosentino, 2011) and inorganic components in the soil matrix (Kleber et al. 2015). The sorption mechanism involves a wide range of reactions between organic compounds and soil minerals. Various clay minerals, oxides, and cations exhibit a high affinity for bonding with organic matter, leading to stabilization (Kleber et al., 2015; Rowley et al., 2017). Recent studies indicate that microbial residue, known as necromass, and depolymerized organic compounds produced by microbes are highly correlated with mineral-bonded OM, more than complex recalcitrant plant-derived material (Liang et al., 2017; Manzoni and Cotrufo, 2024).
Pristine peatlands lack these mechanisms (i.e., aggregation and sorption) due to their low mineral content (Leifeld et al., 2012; Mirabito and Chambers, 2023). However, these preservation mechanisms may become relevant after prolonged mineralization of peat soils. Knowledge remains limited regarding SOM pools and stabilization mechanisms in degraded peat soils. This makes it challenging to accurately characterize long-term peat degradation and select suitable models for describing peat SOM loss over time.
Moreover, despite the disproportionate importance of peatlands to global carbon stocks compared to mineral soils, to the best of our knowledge, long-term peat degradation data and models remain scarce in the literature. For instance, multiple long-term Bare Fallow experiments, spanning several decades, have been conducted on mineral soils in cold temperate climate zones (Barré et al., 2010). These experiments are especially valuable for identifying stable SOM, as they exclude organic matter inputs to the soil, a condition resembling drained peat.
Here we study a peatland site located in the Hula Valley, Israel, which has several important characteristics: (1) The site is located in a warm, subtropical climate; (2) The peat drainage occurred nearly 70 years ago, initiating a peat degradation period; (3) Rewetting of the bottom part of the degraded peat column occurred three decades ago, leaving the upper peat column drained until present time; and (4) Numerous historical studies were conducted in this site, enabling long-term (66 years) tracking of SOM stock. This research had two main objectives: First, to evaluate the long-term effect of rewetting on SOM preservation after nearly four decades of drainage in a warm subtropical climate. Second, to examine the decomposition rate of nearly 70 years of degradation of drained peat and to explore the fate of peat SOM after prolonged mineralization period. To achieve this, we integrate Rock-Eval analysis, short-term respiration experiments, historical geochemical data, and a SOM decomposition model to investigate the long-term effects of drainage and rewetting on SOM degradation and preservation in the Hula Valley peatland.
The Hula Valley, Israel (33.1° N, 35.6° E), spans 175 km2, of which 28 km2 consists of drained marshland that accumulated peat, now used mostly as cropland. The basin sustained lacustrine environments for the past 4 million years (Bein, 1986), with the last Hula Marsh prevailing from 2.5 to 4000 years ago until its drainage in 1957 (Cowgill, 1969; Bein, 1986). The dominant species found in the accumulated peat soil of the historic marsh was Cyperus Papyrus (Bein and Horowitz, 1986), typically occurring at characteristic water table of 0.5–2 m (Jones, 1940; Dimentman et al., 1992). The peat has accumulated in the top section of the sediment, reaching up to 12 m of peat at its central area (Bein, 1967). This central area is also known as the “deep peat” area which spans 12 km2 (Marish, 1986). In 1957, the Hula Marsh and Lake were drained, primarily for agricultural land use and of reduction of water loss through evaporation. Consequently, the habitat was destroyed, and the exposed peat underwent aerobic conditions, accelerating SOM oxidation in the following years. This led to spontaneous peat fires, erosion, soil loss, subsidence, and nutrient leaching into downstream waterways (Hambright and Zohary, 1998; Litaor et al., 2011). In 1994, a major agricultural peat land preservation project was initiated, in which partial rewetting was implemented to halt soil degradation and fires by means of raising and stabilizing the WTL and frequent irrigation of crops (Hambright and Zohary, 1998). As part of the protection efforts, a hydrological barrier was constructed, and a local water body (Agamon lake; blue polygon in Fig. 1) was created. Since then, the water table has been managed at approximately −100 cm (Tsipris et al., 2022). Hence, the Hula's deep peat area can be divided vertically into 3 sections: (1) The deep pristine peat section (that was not drained) (2) mid-section of peat drained for 37 years (1957–1994) and then rewetted for the last 30 years (1994–present) and (3) the top peat which was drained over the last 66 years (1957–present).
The site, classified within the Mediterranean sub-tropical climate, is characterized by ambient air mean annual temperature of ∼ 20 °C (Marish, 1986; MIGAL, 2023), Soil average daily temperature measured at −20 cm depth was ∼30 °C in summer months (June–October 2023) and ∼15 °C in winter months (December–March 2023), with annual mean of ∼22 °C (MIGAL, 2023). The annual mean precipitation was 610 mm (1987–1997; Tsipris and Meron, 1998), and the peat area is used for cropland which is regularly irrigated during summer months preventing the upper peat from drying. WTL are routinely measured in 19 observation wells and 4 operational drainage channels throughout the Hula Valley, as documented in MIGAL's multi-annual reports over the past 20 years (Tsipris et al., 2022). However, assessing WTL in the drainage period between 1957 and 1994, is more challenging due to limited data availability. To address this, we relied on historical studies. Yaari-Cohen et al. (1971b) provides WTL data from core samples collected in December 1970, specifying the WTL for each core (Table 1). A report by Marish (1986) presents a spatial WTL map for winter 1985, indicating areas where the WTL is above or below −120 cm, and notes that no significant changes in WTL have occurred since Yaari-Cohen et al. (1971b) (Table 1). Therefore, we adopted Yaari-Cohen et al. (1971b) WTL data to represent the period from post-drainage (1957) until the rewetting in 1994. Further, we choose to follow Yaari-Cohen et al. (1971b) soil profile's locations for our study and soil core samples collection for comparison. Table 1 presents the complete dataset of WTL variations from 1957 to 2021 in our examined profiles.
In this research, we focused on the area north of the Agmon lake, where the WTL is managed between the eastern and western canals, bordered by underground hydrological barrier (emphasized by an orange outline; Fig. 1). Focusing in this selection targeted areas with substantial peat thickness, enabled investigation of both drainage and rewetting effects, and ensured the availability of historical WTL records and SOM data.
Table 1Water table levels in cm. Negative values (−) indicate depth below ground surface.
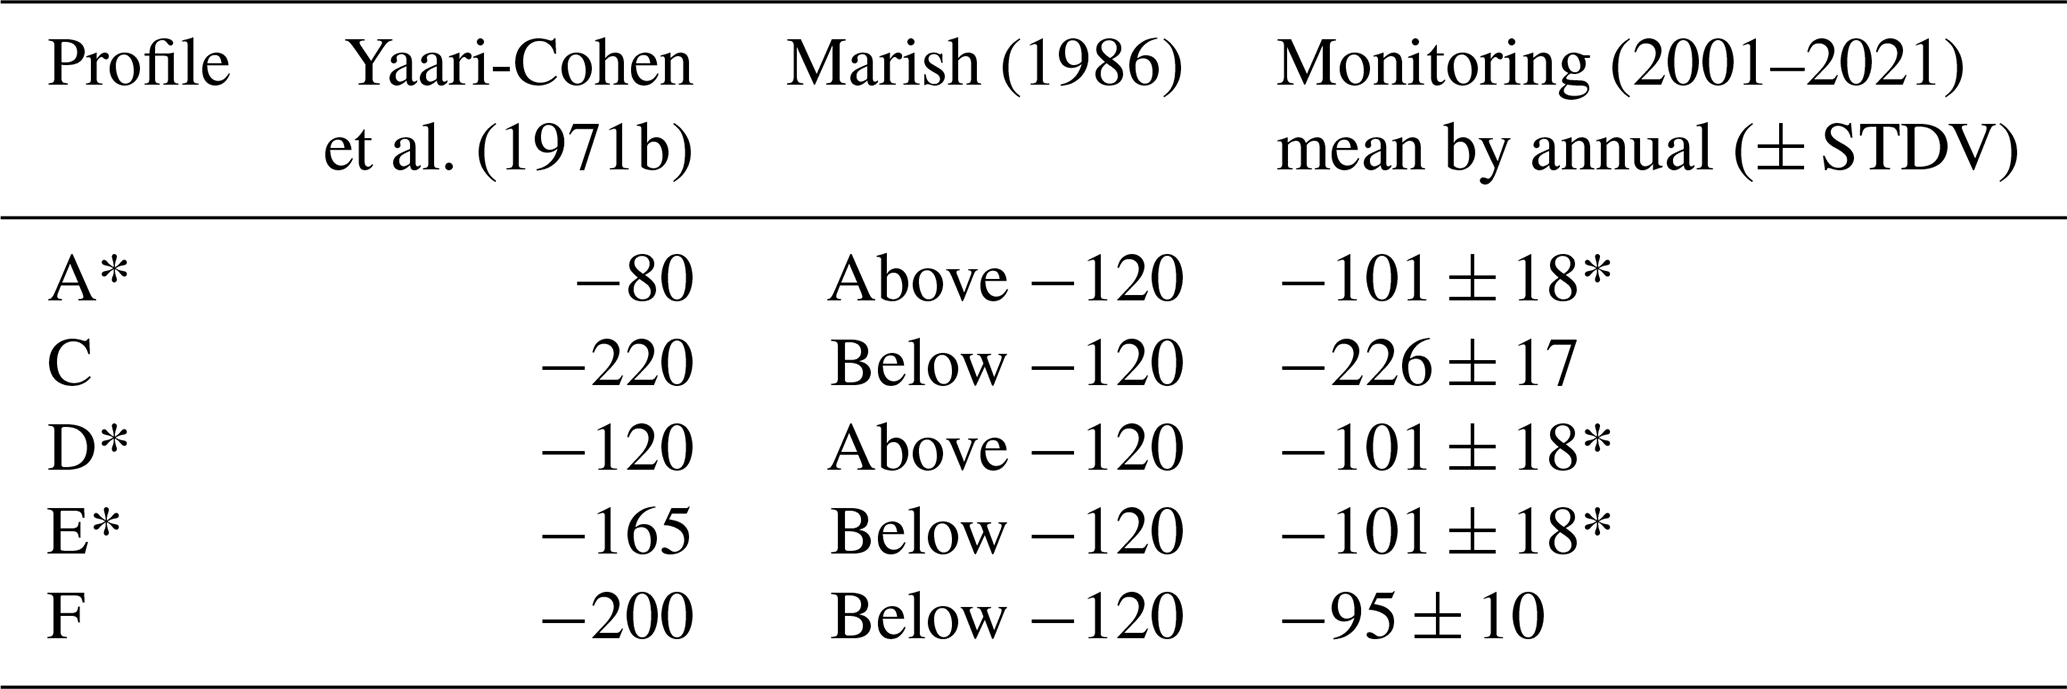
* Based on data collected from observation well number 13. Locations marked in Fig. 1.
Sample collection
Soil samples were collected in January–April of 2023 from the “Deep Peat” area (Fig. 1). Five different locations were chosen based on the sampling locations of Yaari-Cohen et al. (1971a) designated there as Crossline B. For coordinates, see the Supplement (Sect. 1.8). To ensure that the sampling included the pristine peat, each core was excavated to a depth of approximately −4 m (much deeper than the WTL preceding the drainage; Table 1). We used a manual gauge auger (Eijkelkamp ©) of either 1 or 0.5 m long cores and of 5 and 2 cm diameter, respectively. The soil sampling from the cores was based on two collection schemes: (1) sampling of discrete 2–5 g samples, collected at 10 cm intervals, into pre-weighed 50 mL tubes. These samples were mainly used for RockEval analysis, (2) sampling of homogeneous soil sections, based on lithology and historic WTL, at 30–60 cm intervals to cotton aired bags. These samples were mainly used for respiration incubation experiments.
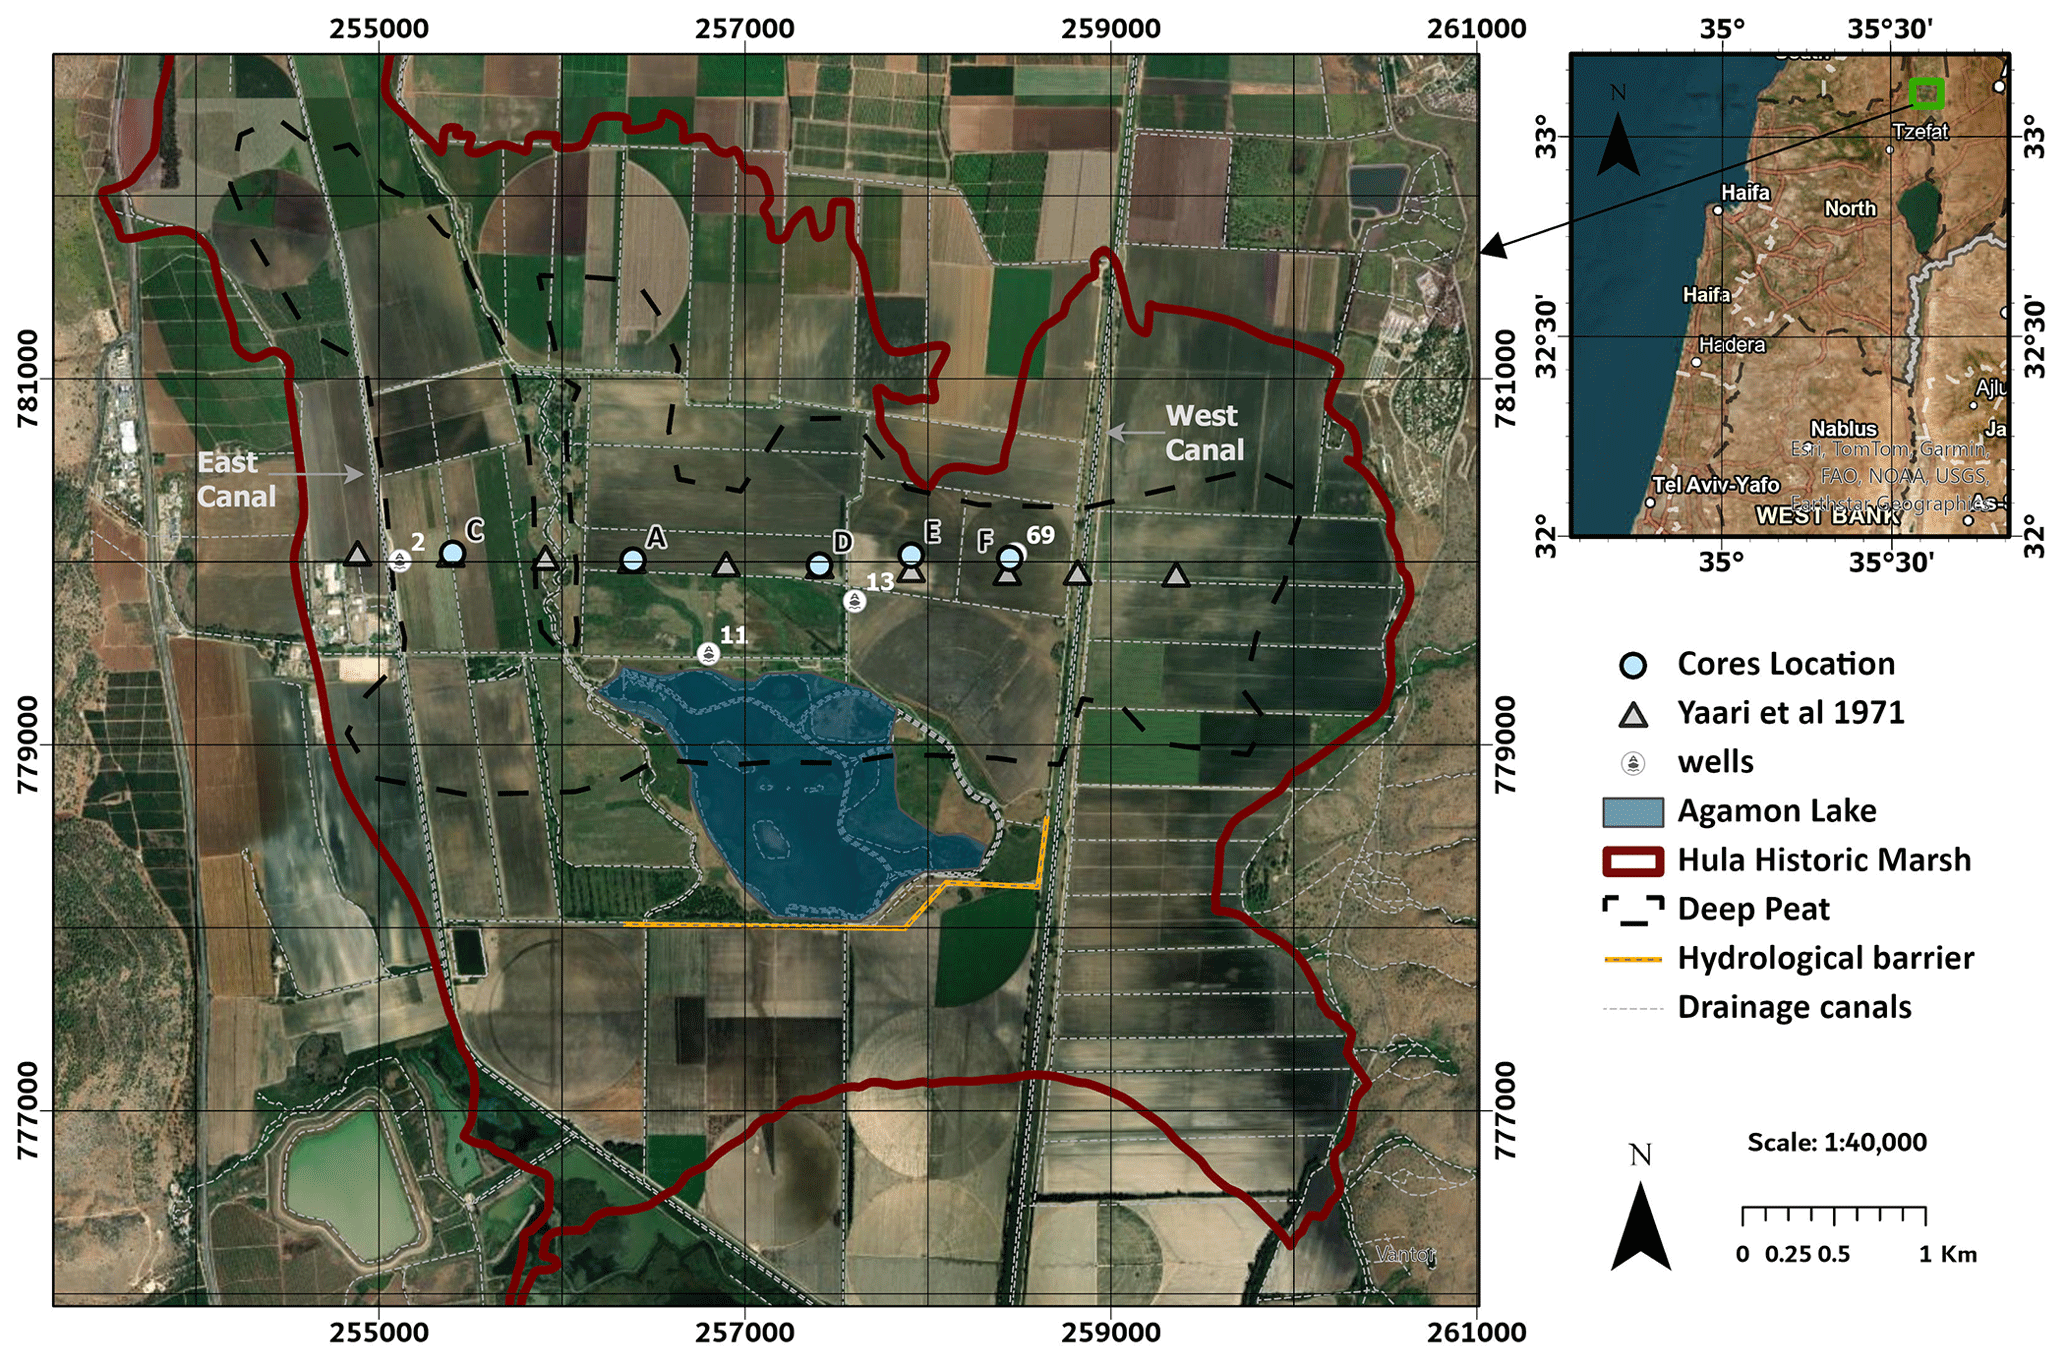
Figure 1Study site satellite map – Hula valley, Israel (coordinates of Israel TM Grid). Polygons of the historic marsh boundaries in dark red, deep peat area in black dashed line (after Marish 1986), WTL observation wells in white circles, core locations in light blue, underground hydrological barrier in orange. Regional map to the right in WGS 1984 coordinates. Image made by ArcGIS software and is based on ESRI-provided data.
3.1 Rock-Eval analysis
Rock-Eval pyrolysis is a widely accepted method for the analysis of peat and organic soil for SOM characterization and soil organic carbon (SOC) estimation (e.g., Disnar et al., 2008; Marchand et al., 2008; Sebag et al., 2016; Brown et al., 2023). In this study, the newest Rock-Eval 7S analyzer was used (RE-7S, Vinci Technologies). 107 samples of peat from all profiles were freeze-dried, ground, and homogenized for analysis. About 15–30 mg of the ground sample were taken for analysis. The analytical protocol included two phases: (1) pyrolysis in an inert N2 atmosphere starting at a temperature of 200 °C, reaching 650 °C; (2) combustion using air, starting at a temperature of 300 °C and rising to 850 or 1200 °C when sulfates were also quantified (see below). The heating rate for both steps was 25 °C min−1, and combustion had a final hold time of 10 min at maximum temperature before cooling down. The heating cycle is based on Behar et al. (2001) and modified for soils based on Sebag et al. (2016). The gradual heating of the RE-7S promotes a sequential decomposition of organic and inorganic phases according to their thermal stability. Continuous monitoring of the generated products is carried via four different detectors: (1) a Flame Ionization detector (FID) for hydrocarbons (HC), (2) two Infrared (IR) detectors for CO and CO2 and (3) Ultra violate (UV) detector for SO2.
Calibration of C was done using the IFP 160000 standard (Behar et al., 2001). As carbonates are also decomposed during a RE analysis, an empirical separation between organic and inorganic C was previously determined for rocks and mineral soils (Behar et al., 2001). Usually, the organic CO, and CO2 at the pyrolysis phase is determined up to 400 °C, and for the oxidation phase, at a local minimum above 650 °C. The mineral carbon (MINC) is the remaining fraction of the CO2 and CO curves, calculated between 400–650 °C in the pyrolysis phase and approximately between 650–850 °C in the oxidation phase. To validate the usefulness of this discrimination, we also applied a loss-on-ignition (LOI) procedure to remove SOM and to identify the correct separation between soil organic carbon (SOC) and mineral carbon (MINC) (see Sect. 1.5 and Fig. S4 in the Supplement). SOC is calculated by summing the hydrocarbon signal (HC), CO, and CO2 curves from both the pyrolysis and oxidation phases. The HC peak, representing carbon in a reduced state, is used to calculate the hydrogen index (HI) of the SOC mg HC g SOC−1. The HC signal was also integrated in 4 parts representing different thermal stability regimes according to Sebag et al. (2016): A1 (200–340 °C), A2 (340–400 °C), A3 (400–460 °C), A4 (460–650 °C), which are used to calculate two indices: The R-index (RI) calculated as (A3+ A4) A1−4 is indicative of the relatively thermal stable fraction of the HC, while the I-index (log10 [(A1+ A2) A3]) is indicative for the thermal labile fraction of HC (Sebag et al., 2016). The oxygen index in its revised version(OI[RE6]; mg O g SOC−1), represents the oxygen emitted as CO2 and CO in the pyrolysis phase (200–400 °C), corresponding to oxygen content in the OM (Saenger et al., 2013; Cécillon et al., 2018; Delahaie et al., 2023). The TpkS2 °C is the temperature at the maximum HC signal.
Calibration of sulfur signal in both the pyrolysis and combustion phases was done using pure organic S compound (Di-benzothiophene) and pure pyrite, following Cohen-Sadon et al. (2022). For real samples that contain multiple S fractions, the organic and pyrite fractions are separated during the pyrolysis phase and can be distinguished by a local minimum at approximately 500 °C (Cohen-Sadon et al., 2022). However, during the oxidation phase, the residual organic and pyrite S are co-eluted at around 400 °C, requiring an empirical relation to deconvolute (Cohen-Sadon et al., 2022; Aboussou, 2018). Moreover, some of the pyritic S is retained during pyrolysis at the presence of carbonates and is released at higher temperature (∼700–900 °C). Sulfate sulfur measurement requires high temperatures and is released during combustion above 900–1000 °C (Aboussou, 2018). In this contribution the cutoff between retained S and sulfate signals was set manually to the local minimum between them, at temperature of ∼1000 °C.
3.2 Soil incubation
Soil samples were oven-dried at 60 °C overnight and then stored in the lab. Each profile consists of 6 samples, each sample was gently ground, if it contained large aggregates, and sieved to <2 mm. From each sample, four splits of 1.5 g portion of soil were weighed into 6 mL vessels, then distilled water was added to 60 % of its water-holding capacity. Water holding capacity was determined separately for degraded and pristine samples. This was done by saturating 15 g of soil with 50 mL distilled water and measuring the drained volume of water, using Whatman 40 filter (8 µm). All samples were preincubated for bacterial acclimation for 5 d at the designated temperature. Respiration experiments were conducted at 22 and 33 °C, which represent the annual average soil temperature and its maximal summer temperature in Hula valley, respectively. The experiments were aerobic and conducted in duplicates under two conditions: (1) for 7 d at 22 °C, and (2) for 2 d at 33 °C. During the incubations, gas samples were collected for CO2 and O2 concentration analyses. Samples were taken using glass flasks (∼3.7 mL or ∼13 mL, depending on incubation duration) equipped with Louwer™ O-ring high-vacuum valves. Measurements were taken at halfway (t=1) and at the end (t=2) of the experiment to validate a linear change in gas concentration during incubation. The O2 [µmol] and CO2 [µmol] of the air samples were measured in the laboratory by a closed system (The “Hampadah”; Hilman and Angert, 2016). The system is based on two analyzers: an infra-red gas analyzer (IRGA) for CO2 measurement (LI 840A LI-COR; Lincoln, NE, USA) and a fuel-cell-based analyzer (FC-10; Sable Systems International, Las Vegas, NV, USA) for measuring O2, and is fully automated. Each sample was incubated and measured in a known volume, to derive the percentage and concentration of CO2 and O2. Flux rates [µmol d−1 g], and reaction constant (k [yr−1]) of CO2 and O2 were calculated for both 22 and 33 °C, as shown in Eqs. (1) and (2), respectively. The apparent respiratory quotient (ARQ), as shown in Eq. (3), represents the ratio of CO2 and O2 fluxes (Angert et al., 2015). This ratio provides information on the respiratory substrate stoichiometry as well as the underlying biotic and abiotic processes (Hilman et al., 2022). Temperature sensitivity of organic matter decomposition, expressed as Q10 (Eq. 4), is a metric for assessing the vulnerability of organic matter to temperature increases (Hilasvuori et al., 2013). Q10 was calculated using the rate constant k, derived from respiration experiments.
3.3 Statistical analysis
Statistical analyses were performed using JMP software (JMP®, JMP Pro 17, SAS Institute Inc., Cary, NC, USA). To determine the difference between the peat column sections, we used one-way analysis of variance (ANOVA) and the Tukey-Kramer test. For unequal variances, we used a Welch's test and nonparametric comparisons using Steel-Dwass test. Significant differences were determined at P<0.05.
The geochemical and respiration data were statistically analyzed based on three peat profile sections: drained, rewetted, and pristine, defined according to their respective historic and current WTLs (Table 1). The drained section included samples from depths of −30 to −100 cm, except for profile C, in which it extended to −180 cm. The upper boundary at −30 cm was set to minimize the influence of agricultural practices such as soil tillage and root bias. The rewetted section, available only in profiles E and F, ranged from −110 to −160 cm in profile E and −110 to −190 cm in profile F. A rewetted section is absent from the other cores because the WTLs post-drainage and post-rewetting were very similar (Fig. 2, purple and light blue shaded areas). The pristine section extended from −200 to −400 cm in profiles C, E, and F, while in profiles A and D, it began at a depth of −150 cm. Samples containing more than 30 % carbonate content were excluded from the statistical analysis to avoid incorporating lake mineral horizons, which were primarily found at the bottom of the profile.
3.4 Historical data of SOM
Since its drainage in 1957, the “deep peat” area of the Hula Valley (marked in Fig. 1) has been studied in numerous research projects, some of which have dealt specifically with SOM loss over time, such as the report by Marish (1986) and Litaor et al. (2011). To assess the changes in peat soil organic matter (SOM) subjected to 66 years of drainage, we focused on the drained section identified in previous studies with multiple soil profiles (Schallinger, 1970; Yaari-Cohen et al., 1971a, b; Marish, 1986; Litaor et al., 2003). We constrained our data compilation to the boundaries of the “deep peat” area to ensure consistency and avoid significant lithological variations, as well as the impact of soil fires, which mainly occurred south of this region. To focus on the upper, drained peat, the upper boundary was set at −30 cm (to minimize the influence of agriculture practices) and the lower boundary was established at -100 cm, which reflects the prevailing WTL in the region, given the spatial heterogeneity of the WTL. To convert the SOC results to SOM data, as reported by previous studies, we measured the SOM gravimetrically by removing SOM through combustion (using the LOI400 procedure; Nelson and Sommers, 1996) on a set of samples. We then correlated the SOM to SOC and applied a correction factor. Details of this correction are provided in the Supplement (Sect. S1.5).
3.5 Fitted SOM Model
The modelling of organic matter loss through decomposition is a well-studied topic (Manzoni and Porporato, 2009), with various models proposed to represent these processes (Manzoni et al., 2012). Here we chose a model that comprises of two organic matter compartments (pools), as described by Eq. (5). These two pools are: (1) a labile SOM pool decomposing exponentially with reaction constant k, and (2) a persistent SOM pool (SOMP [%]), with decomposition rates that are significantly lower than the observed duration of degradation for the labile pool. SOMi [%] represents the initial SOM value, P denotes the fraction of persistent SOM out of SOMi, t denotes time in years, and k serves as the reaction constant for SOM decomposition. The unknown parameters, k and SOMP, are optimized to minimize the root mean square deviation (RMSD; Eq. 6), which quantifies the mean difference between model predictions and observed data. Where SOMdata represents field data from various studies, SOMmodel denotes the simulated values, and n is the number of observations. The initial SOM (SOMi) value is based on Ravikovitch (1945) work. Historical data and this current study (five data points, n=5) are used as the observed data (SOMdata) for RMSD calculation. The model simulates the long-term decline in organic matter following drainage from 1957 to 2023 (present study).
4.1 SOC oxidation and mineralization
Previous research on Hula peat has highlighted a decline in the SOM content within the drained section, attributed to aerobic conditions (Marish, 1986; Litaor et al., 2011). Based on these findings, we hypothesize a continued reduction in SOM content in the upper drained section and anticipate potential evidence of SOM preservation in the rewetted section, which has remained unexplored to date. Additionally, the pristine section, which remained under anaerobic conditions, is expected to exhibit minimal variations in SOM content. Figure 2 shows the measured SOC profiles [% SOC] from west to east, along with their corresponding WTL as detailed in Table 1. Overall, SOC content in all profiles is lower in the drained and rewetted sections relative to the pristine section. The profiles can be categorized into two main types: (1) profiles with similar post-drainage and post-rewetting WTLs, resulting in only drained and pristine sections – profiles A, D and C, and (2) profiles with different historical WTLs, creating a rewetted section between the drained and pristine sections – (profiles E and F). In most profiles, there is a clear upward decline in SOC corresponding to the post-drainage WTL (purple bars, Fig. 2), indicating mineralization and SOC loss due to the lowering of the WTL. For instance, profiles A and C (type 1) had relatively constant but different WTLs over 66 years of drainage. In both profiles, the depth in which SOC declines above it, aligns with the respective WTLs.
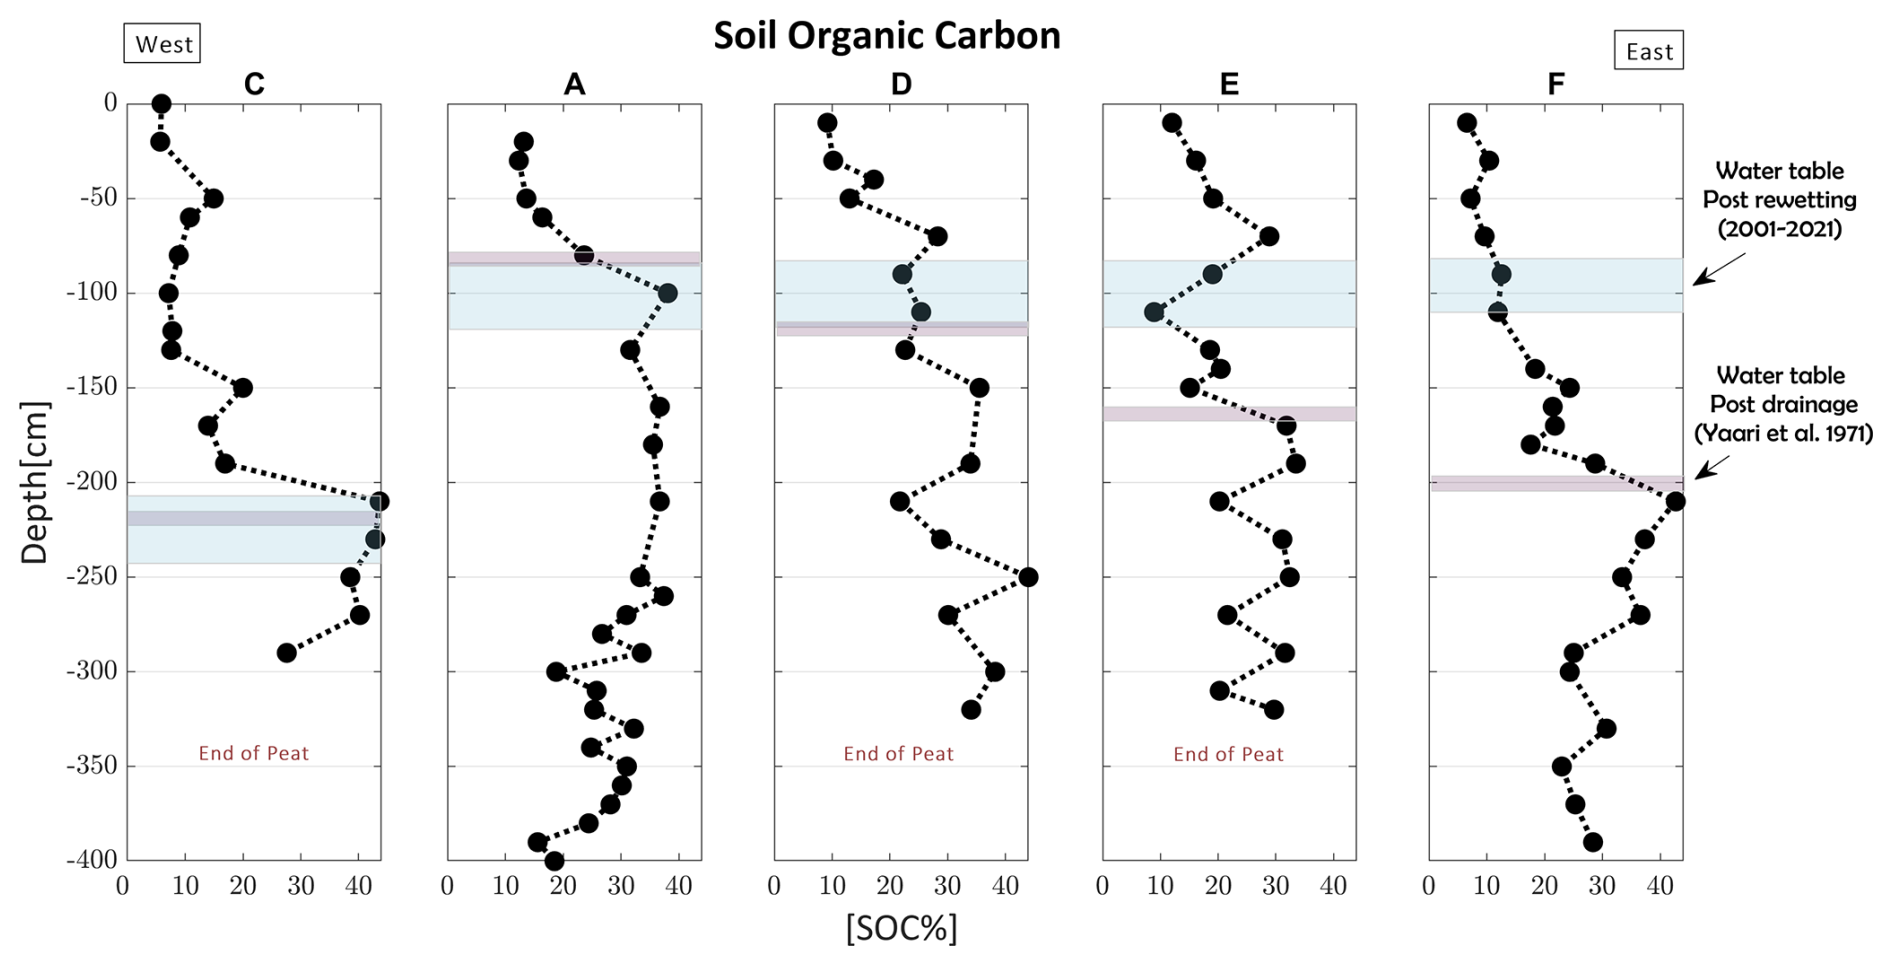
Figure 2SOC profiles (from west to east) of peat cores with respective WTLs – post drainage (purple – after Yaari-Cohen et al., 1971b) and post rewetting (light blue – MIGAL's Monitoring data).
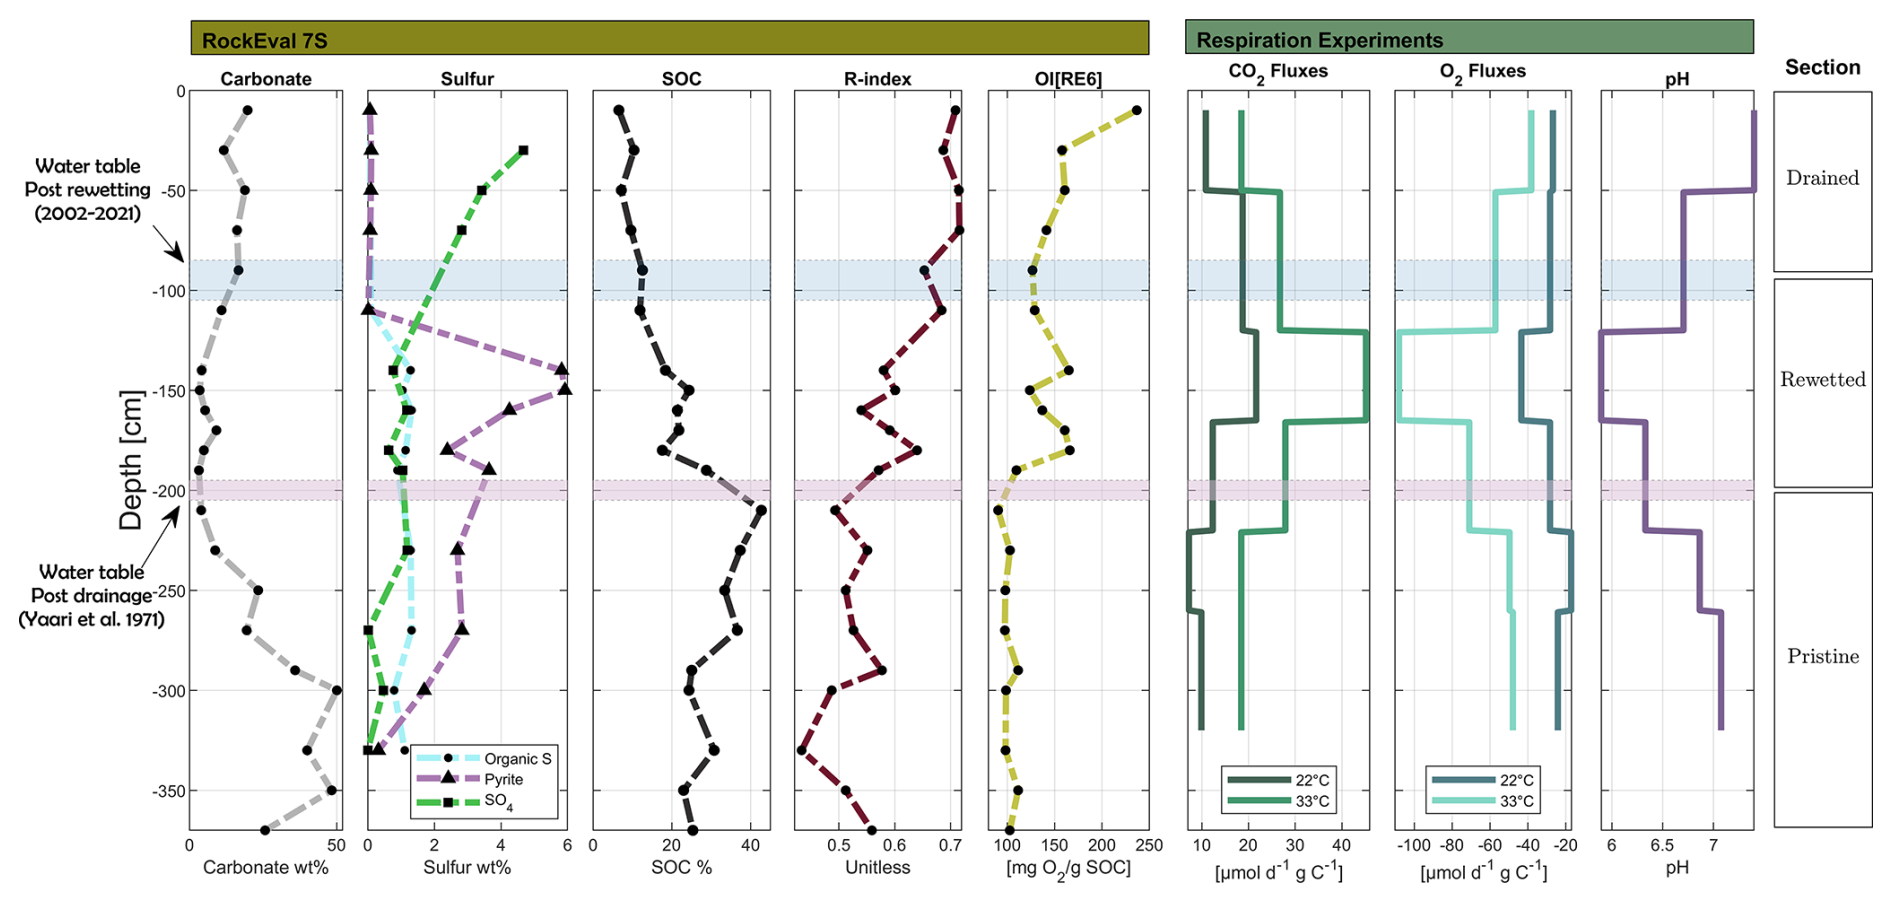
The trends in SOM content are further supported by additional organic geochemical data, such as the OI and RI indices. For example, a detailed composite plot of profile F (type 2) identifies three distinct sections (Fig. 3), corresponding to drained, rewetted, and pristine conditions, separated by the historical WTL. Alongside the declining SOC trend, a negative relationship exists between SOC and both OI and RI. This suggests that as peat degradation progresses, the residual SOC becomes more oxidized, and exhibits an increase in the proportion of the thermally stable fraction. Similar coupling of the historical WTL and the trends of the organic geochemical proxies was found for the rest of the cores, and their composite plots are given in Sect. S1.4.
Sulfur speciation, obtained using the RE-7S, was distinguished as detailed in Sect. S1.9. In the drained section, a decline in both organic sulfur and pyrite is evident, while sulfate accumulates, which reflects aerobic conditions (Fig. 3 and Sect. S1.4). In contrast, the pristine and rewetted sections show low sulfate levels accompanied by elevated pyrite concentrations. The rewetted section exhibits a maximum pyrite abundance, clearly indicating that rewetting successfully re-established reducing conditions. Assuming that pyrite was largely oxidized in the rewetted section during its 37-year drainage period, this peak is interpreted as secondary pyrite formation through sulfate reduction under anaerobic conditions following rewetting. Moreover, the peak in pyrite concentration beneath the recent WTL was observed in most profiles (Sect. S1.4), suggesting a sulfur recycling mechanism in the drained and rewetted peat sections. Specifically, soluble sulfate appears to be constantly washed from the drained section and accumulates under anoxic conditions, in its reduced forms, within the rewetted section. Ultimately, pyrite serves as an indicator of both sulfate reduction in the sediment and the recent WTL regimes.
The corresponding respiration fluxes reveal two key points (Fig. 3 and Sect. S1.4): (1) respiration fluxes (normalized to SOC) in the drained and pristine sections are similar despite differences in SOC content and chemical properties (as indicated by OI[RE6] and RI); and (2) respiration fluxes in the rewetted section are twice as high as in the other two sections. These findings are explored further in the next section.
pH levels remain mostly neutral but drop to 5.9 in profile F and as low as 3.5 in other profiles. Litaor et al. (2011) also found pH levels of 5–3.8 at a depth of 50 cm in carbonate-free horizons, which they interpreted to result from pyrite oxidation, and nitrification.
4.2 Average SOC characteristics of drained, rewetted and pristine peat
In the current section we present a statistical compilation of all the soil profiles data. The analyses are made for the predefined three peat column sections: drained, rewetted, and pristine. Figure 4 present the average thermal analysis indices for each section, including standard error and the number of available data points for each section. Overview of the results and statistical tests for sections comparison are presented in Tables S1 and S2.
Generally, the data show a clear trend with depth for each of the thermal indices. Despite the expected natural variation that characterize such sedimentary basin, it was found that most of the thermal indices show significant difference (p<0.05) between the three sections defined. These include the SOC, TpkS2, RI, and I-index. The only exception is the OI[RE6] values, which show no significant difference between the drained section and the rewetted section). The mean SOC values for the drained, rewetted, and pristine sections are 13±1 %, 20±2 % and 35±1 %, respectively. Thus, indicating that 66 years of drainage have led to extensive degradation that resulted in the lowering of SOC in the drained section to approximately one-third of its original pristine value (not accounting for compaction processes). The rewetted section shows higher SOC content than the drained section, suggesting that degradation ceased or decreased following rewetting. The OI[RE6] shows an opposite pattern to the SOC, with a gradual decrease in its mean value from the drained to the rewetted and pristine sections (157±5, 133±8 and 88±5 mg CO2 g, respectively). This pattern can indicate a partial oxidation of the SOM due to drainage and suggests a slowdown in oxidation due to rewetting. Additional support is evident by other SOM thermal indices (Fig. 4; correlation in Fig. S6). For example, mean TpkS2 values for the drained, rewetted, and pristine sections are 460±5, 431±7 and 378±5 °C, showing the increase of HC peak temperature along with degradation and SOC decline. The mean RI values for the drained, rewetted, and pristine sections are 0.67±0.01, 0.59±0.02, and 0.49±0.01, respectively, while the mean I-index values are , 0.1±0.02 and 0.26±0.01, respectively (Table S1). While the RI and I-index values of the pristine section represent organic soil, those of the rewetted and drained sections fall into the range typical for organic-mineral and mineral soil horizons (Sebag et al., 2016). The RI values of the drained and pristine peatlands further align with the findings of Brown et al. (2023), who reported higher RI values for disturbed peat sites compared to pristine peat sites, all measured from the top 50 cm peat layer (duration since drainage was not specified). The higher thermal stability of the OM observed in the degraded peat sections is presumably indicative of preferential utilization of the thermally labile fraction during microbial respiration. This relationship between available OM for decomposition and thermal stability is further explored in Sect. 4.7 below.
Together, these results demonstrate that with decomposition the residual SOM becomes more oxidized and contains a lower proportion of thermally labile compounds. The increase in thermal stability could be due to a relative increase of litter recalcitrant material (Könönen et al., 2016; Barré et al., 2016), that the residual SOM is minerals associated (Saenger et al., 2014), or both. Moreover, the rewetted section exhibits a higher degree of SOM preservation compared to the drained section, highlighting the impact of rewetting on reducing degradation.
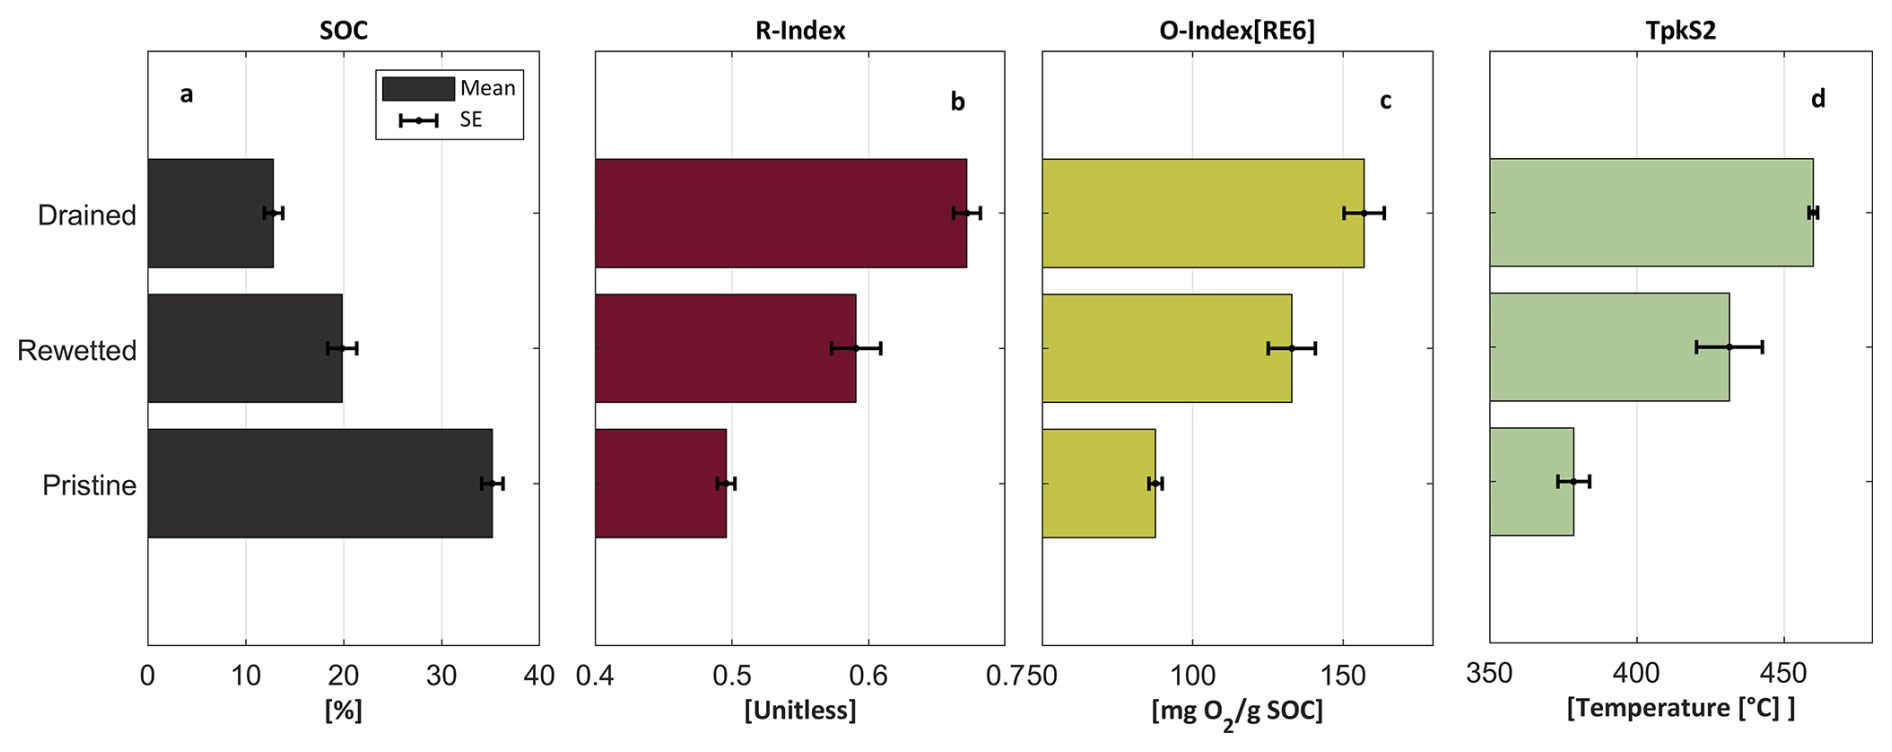
Figure 4Rock Eval analysis results. mean value and standard error of all the profiles from three sections [cm]: drained [30–100] (n=25), rewetted [110–170] (n=10) and pristine [200–400] (n=26). (a) SOC content, (b) R-index, (c) Oxygen index [RE6] and (d) HC peak temperature – TpkS2.
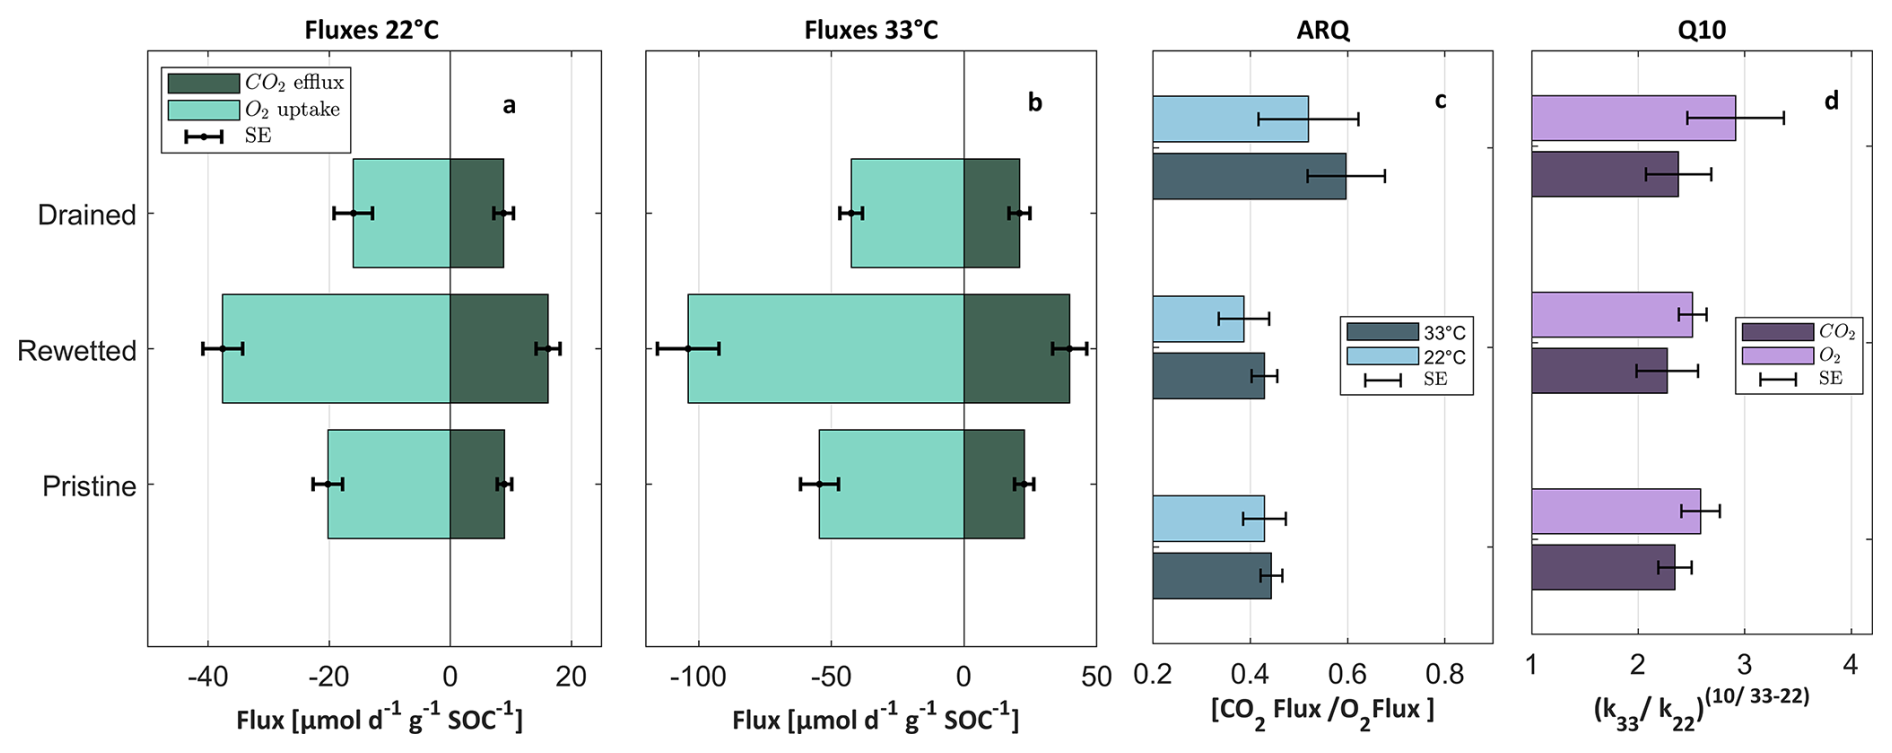
Figure 5Respiration experiment results – mean value and standard error of all the profiles from three sections [cm]: drained [30–100] (n=8), rewetted [110–170] (n=4) and pristine [200–400] (n=12). (a) CO2 and O2 fluxes at 22 °C experiments. (b) CO2 and O2 fluxes at 33 °C experiments. (c) ARQ – CO2 fluxes divided by O2 fluxes derived from 22 and 33 °C experiments. (d) Q10 – derived from CO2 and O2 k constant. HC peak temperature – TpkS2.
The experimental respiration results were also statistically analysed in each of the defined sections for all the profiles collectively. Figure 5 displays the mean CO2 and O2 fluxes per gram of SOC at 22 and 33 °C, and their derivatives indices; ARQ and Q10. Mean fluxes of CO2 of the drained, rewetted, and pristine sections at 22 °C were 9±2, 16±2 and 9±1 µmol CO2 g SOC−1 d−1, respectively (Fig. 5a), showing a similar flux for the drained and pristine sections, and approximately a double flux in the rewetted section. This pattern is also evident for the O2 fluxes at 22 °C (, and µmol O2 g SOC−1 d−1) for the drained, rewetted and pristine sections, respectively; Fig. 5a). The same pattern is evident in the 33 °C experiments in both CO2 and O2 (Fig. 5b), reinforcing the reliability of this finding. It should be noted that our incubation experiments were done at 60 % of the soil water holding capacity, which is a standard approach aimed at measuring respiration at close to optimal moisture conditions (Rey et al., 2005). Of course, the soil moisture in the field is variable, and the upper soil is often drier or wetter than this 60 % value, while the lower sections are constantly saturated. Hence, the rates measured during these incubation experiments are an estimate of the potential respiration rates and the SOM short-term stability. For example, the value measured for the pristine or the re-flooded section gives an estimate for the rate of carbon loss if these sections were to be drained (and kept moist).
We found similar fluxes in the drained and pristine sections despite the distinctly their different SOC, RI and OI values (Fig. 4). A similar observation was made by Bader et al. (2018), which also found that the degraded peat horizon in cold temperate sites exhibited similar flux per SOC as deeper, less disturbed peat. Moreover, in our study, the rewetted section which has intermediate SOC, RI and OI values (compared with the pristine and drained sections), had the highest respiration fluxes. These results indicate that SOC content and RE-7S proxies (RI, OI, and I-index) do not directly reflect SOM bioavailability for short-term bacterial respiration. The high CO2 fluxes that were measured during the incubation of rewetted peat at 60 % water holding capacity can be related to the exposure of flooded soil to oxygen, which may cause a temporary increase in SOC oxidation. However, this does not explain the reason for the higher respiration rates in the rewetted peat versus the pristine peat, as the latter was also exposed to oxygen during incubation. Thus, it seems that the drying and re-wetting of this section caused destabilization of the SOM, potentially through the release of occluded and mineral-protected SOM (e.g. iron-bound), or by changes in enzyme activity. The exact mechanism warrants future investigation.
The first order reaction constant k (Eq. 2) was calculated for aerobic SOC decomposition at 22 °C, resulting in −0.037, −0.087 and −0.033 yr−1, for the drained, rewetted and pristine sections, respectively. Temperature sensitivity, as indicated by the mean Q10 values, for O2 fluxes was 2.9±0.4 for the drained section and 2.5±0.4 for the pristine and rewetted sections, with no significant difference between the sections. Mean Q10 values from CO2 of across all sections were relativity similar (2.3±0.3), with no statistically significant difference (Table S2). Bader et al. (2018) found that the mean Q10 (derived from CO2 flux) for drained peatlands in cold temperate sites was 2.5±0.1, which resembles our findings despite the different climate.
The ARQ results also show no significant difference between the sections, with mean values at 22 °C of 0.6±0.05, 0.43±0.07 and 0.45±0.04, for the drained, rewetted and pristine sections, respectively. In aerobic conditions the expected ARQ value can be indicative of the oxidation state of the decomposed organic carbon compounds (Hilman et al., 2022). Values of ARQ of 1.0 are attribute to sugars which are more labile, while lower values are attribute to compounds such as lipids (0.73) or proteins (0.77), which can derive from necromass and more recalcitrant material (Masiello et al., 2008; Hicks-Pries et al., 2020). However, the pristine and rewetted ARQ results show lower values that cannot be solely attributed to standard organic compounds. These low values thus may indicate oxygen consumption, which is not related to CO2 production, such as partial oxidation of SOM or oxidation of reduced chemical species (Hilman et al., 2022), such as Fe2+ and sulfides, which are prevalent in such peat soils (Markel et al., 1998).
4.3 Long-term SOM decomposition in the Hula's drained peat
The Hula peat exhibits lithological variations both spatially and with depth, resulting from the natural habitat's dependence on varying water regimes and plant diversity. Additionally, as mentioned above, a decline in SOM of Hula's peat since its drainage was reported (Marish, 1986; Litaor et al., 2011). Here, we evaluate long-term (7 decades) decomposition of peat in the field, by compiling literature data focusing on the top drained section. To this end, studies that included comprehensive data of spatial distribution and sampling depths together with evaluations of SOM of the drained section (30–100 cm) were compiled and analysed. The SOC data from this study were converted to SOM using correlations factors for the Hula peat soils determined here as 1.6 for drained samples and 1.8 for pristine samples (Fig. S3). The full data set is summarized in Table 2 and illustrated in Fig. 6, alongside our SOM analysis.
During the 66 years of drainage the mean SOM content of the top layer significantly decreased from 68±4 % to 21±2 % (Fig. 6). This decline was continuous, following an exponential decay pattern, with the most substantial loss of organic matter occurring during the first three decades, after which the rate of SOM decomposition slowed. Notably, the initial SOM value reported by Ravikovitch (1945) aligns closely with the SOM data of the pristine section in our study (2023), supporting the claim of preservation under saturated conditions (Fig. 6). Additionally, the SOM value in the rewetted section also conforms to this timeline, suggesting that it has remained mostly unchanged since 1994. These agreements are illustrated by the grey arrows in Fig. 6.
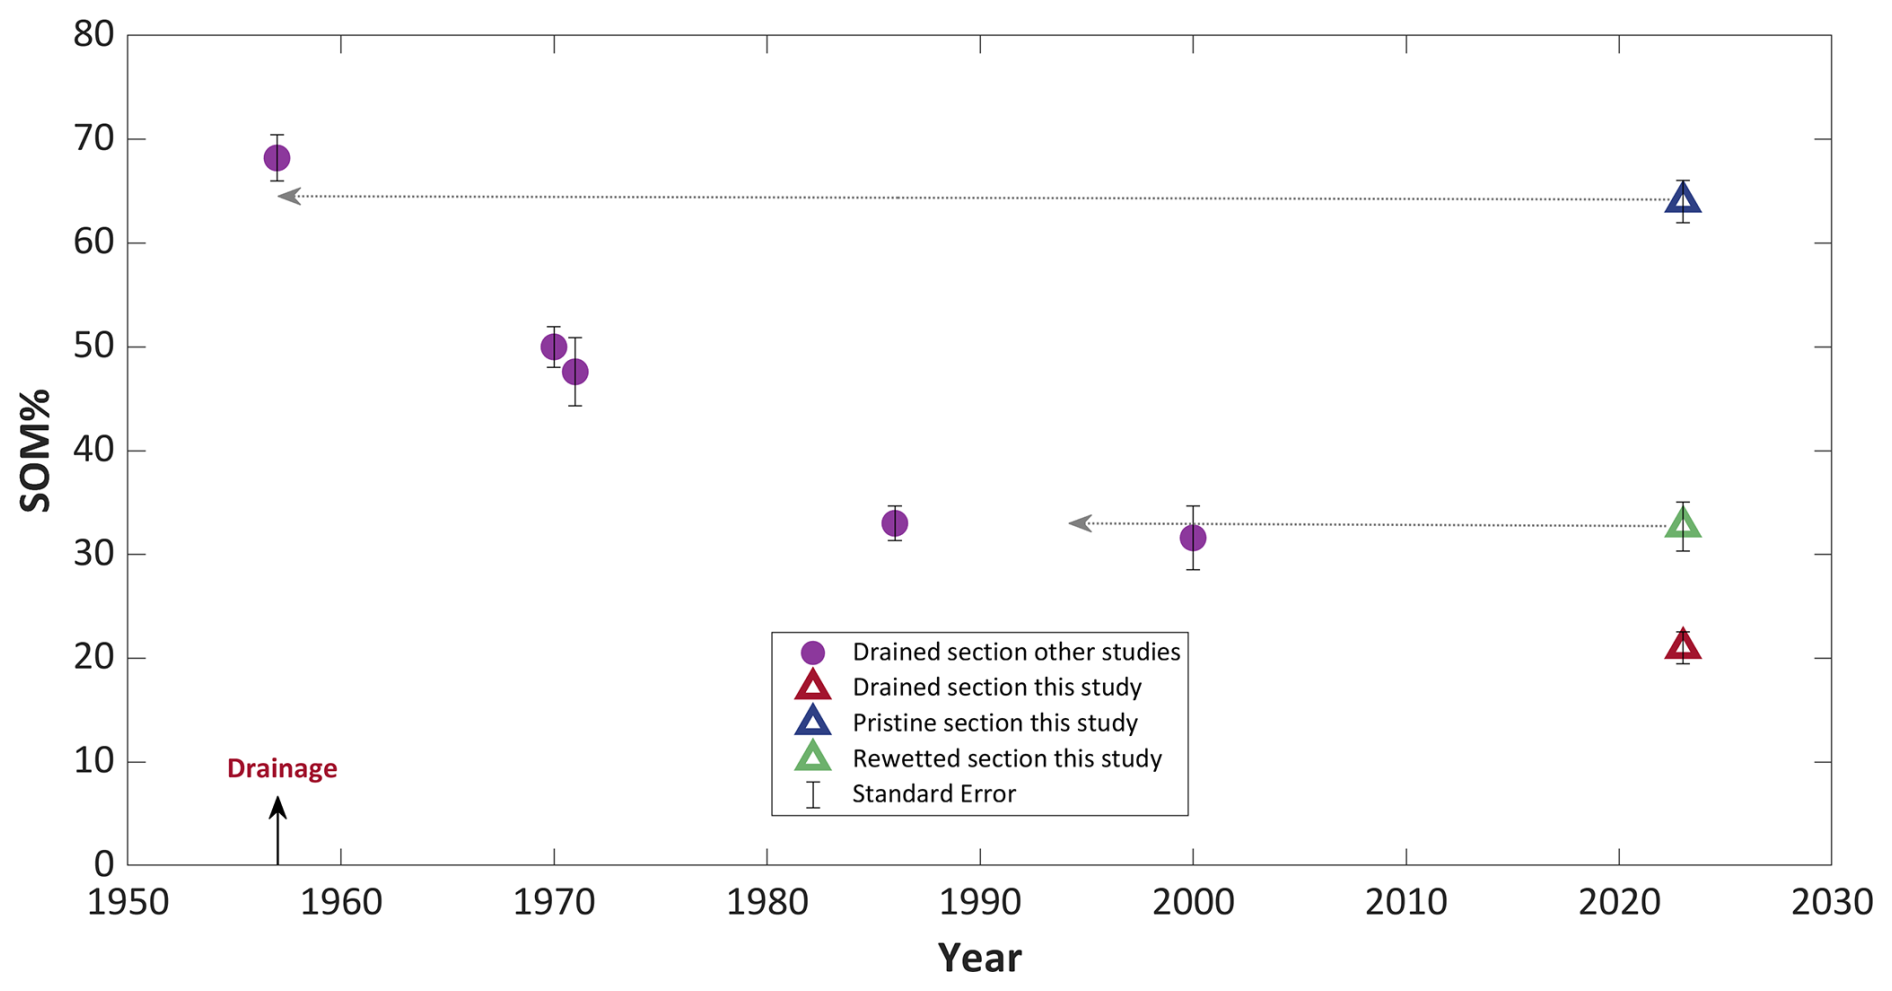
Figure 6Mean soil organic matter (SOM) content of Hula peat since the drainage, based on data from this study (triangles) and historical studies (purple circles). All from depths of 30–100 cm. Arrows show an alignment between current values in each section and the value for this section. Each section was flooded for the duration covered by the arrows. Error bars represent the standard error (SE).
Table 2Changes in soil organic matter content in the Hula deep peat area since the drainage.
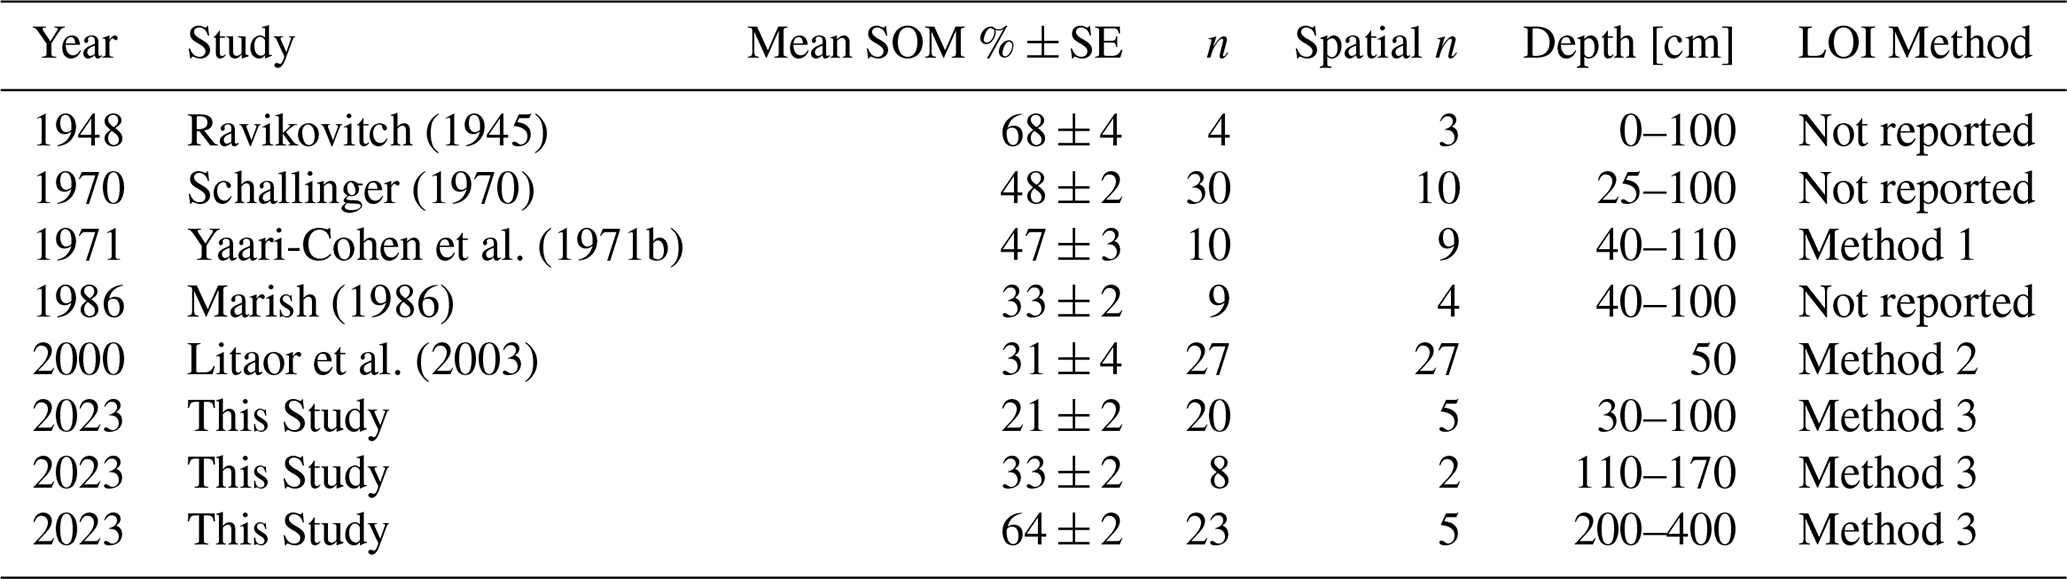
Method 1: LOI at 850 °C and carbonate correction following acid digestion. Method 2: Acid digestion and LOI at 850 °C. Method 3: This study – SOC analysis with RE-7S and LOI at 400 °C conversion (Sect. S1.5).
4.4 The two-pool SOM model
The decay pattern in Fig. 6 shows an exponential decline, a behavior similar to long-term Bare Fallow experiments of mineral soils (Barré et al., 2010). To better understand the long-term decomposition process of Hula's peat, we explored the observed SOM data with a model. A simple one-box model proved inadequate for capturing the decomposition process of SOM in mineral soils (Barré et al., 2010; Manzoni et al., 2012; Clivot et al., 2019). The long-term data of Manzoni et al. (2012), based on the Rothamsted Bare Fallow experiment, serves as a good analog to Hula's peat SOM for two reasons: (1) it involves decomposition without significant additional organic matter inputs, and (2) it follows an exponential decomposition pattern over time. Manzoni et al. (2012) suggest that a two-pool model effectively captures long-term soil respiration dynamics, making further complexity unnecessary. Comparable models were used by Barré et al. (2010) and Cécillon et al. (2021), in which one pool undergoes exponential decay while the other remains stable. Other models account for plant input flux (e.g., the AMG model; Clivot et al., 2019) and leaching of dissolved organic carbon as a pathway for SOM decomposition (e.g., Page and Baird, 2016; Rixen et al., 2016). Here we assume that plant input to the deep peat (i.e., below 30 cm) is negligible and focus on total SOM loss rather than specific pathways (i.e., respiration vs. DOC leaching). In addition, although seasonal soil moisture and temperature variations influence SOM decomposition rates, their effects were not addressed explicitly in this analysis. Ultimately, we adopted a two-pool model, where a persistent pool of SOM is initially present and assumed to have a negligible decay rate, while a labile-intermediate pool is consumed with a single reaction constant (Eq. 5).
4.5 The SOM Model results
As discussed above, the drained and pristine sections of Hula peat have similar respiration fluxes per unit SOC, both for the CO2 efflux and the O2 influx (Fig. 5). Similarly, Bader et al. (2018) also found, in their study of peat in temperate-cold climate, that respiration rates per SOC unit in drained and undisturbed peat are comparable. Thus, we postulate that both the pristine and drained peat sections can be characterized by the same reaction constant (see Eq. 5), despite their different organic characteristics. Practically, this similarity allows a fixed reaction constant (k) to be applied to the labile SOM pool throughout the entire model duration. Also, the similarity of the present-day pristine SOM value to those reported for the peat in the historic marsh of the Hula by Ravikovitch (1945) allows us to assume a value of 68±4 % for the initial SOMi (i.e., pre-drainage).
Hence, our two-pool model includes two unknown variables: SOMP and k. With these two degrees of freedom, the model yields a range of possible solutions. The model was run with multiple SOMP and k values, and the RMSD was calculated for each run (Eq. 6). Plotting SOMP versus k and RMSD for all the runs (Fig. S1) reveals that the two unknown variables are related and identifies a single local minimum for the solutions RMSD. In Fig. 7, we illustrate the model results as an envelope of possible solutions (grey area). This envelope represents model solutions with the lowest RMSD values, defined by a maximum RMSD value of 2.2 % SOM, which ensures that all observed data fit within their standard error. The resulting model envelope ranges for k and SOMP are −0.03 to −0.042 yr−1 and 13 %–21 %, respectively. To further constrain our model results, we incorporated the reaction constant (k) measured by the CO2 fluxes in the short-term respiration experiments at 22 °C (which is the mean annual temperature) into the model (Fig. 5a). This reduces the model solution to a single degree of freedom, enabling a direct comparison with the two degrees of freedom model solution. Since the experimental k constant is calculated for the entire SOC content, it must be corrected if SOMp>0 according to the labile SOM . Assuming SOMP of 17 % (the median result of the two degrees of freedom model run) the experimental kcorrected constant is yr−1 (Fig. 7, green shade). Additionally, we run the model assuming no SOMp (SOMp=0) and as a result the experimental respiration k constant had no correction factor ( yr−1; Fig. 7, blue line).
As Fig. 7 shows, using the experiment k as an input, and assuming that there is no stable fraction of SOM (SOMp=0), results in a predicted decomposition (blue line) which is much faster compared with the field data. This model run predicts a SOM content in 2023 of approximately 8 %, which is inconsistent with the observed value of 21 %. In contrast, the model run which used the experimental k and a SOMp value of 17 % (green envelope), effectively explains the field data and aligns closely with the RMSD envelope of the two degrees of freedom run (grey envelope). Therefore, the short-term respiration experiments can be used to bridge the gap with long-term (70-years) process of peat degradation, at least at this site. In summary, we suggest that peat degradation is a process lasting several decades under a warm sub-tropical climate, during which a fraction of persistent organic matter remains in the soil, even after long-term degradation given the prevailing land-use practices. Given the degradation duration of the labile SOM was of the order of 70 years, we estimate that the persistent SOM should be stable for several centuries given similar environmental conditions.
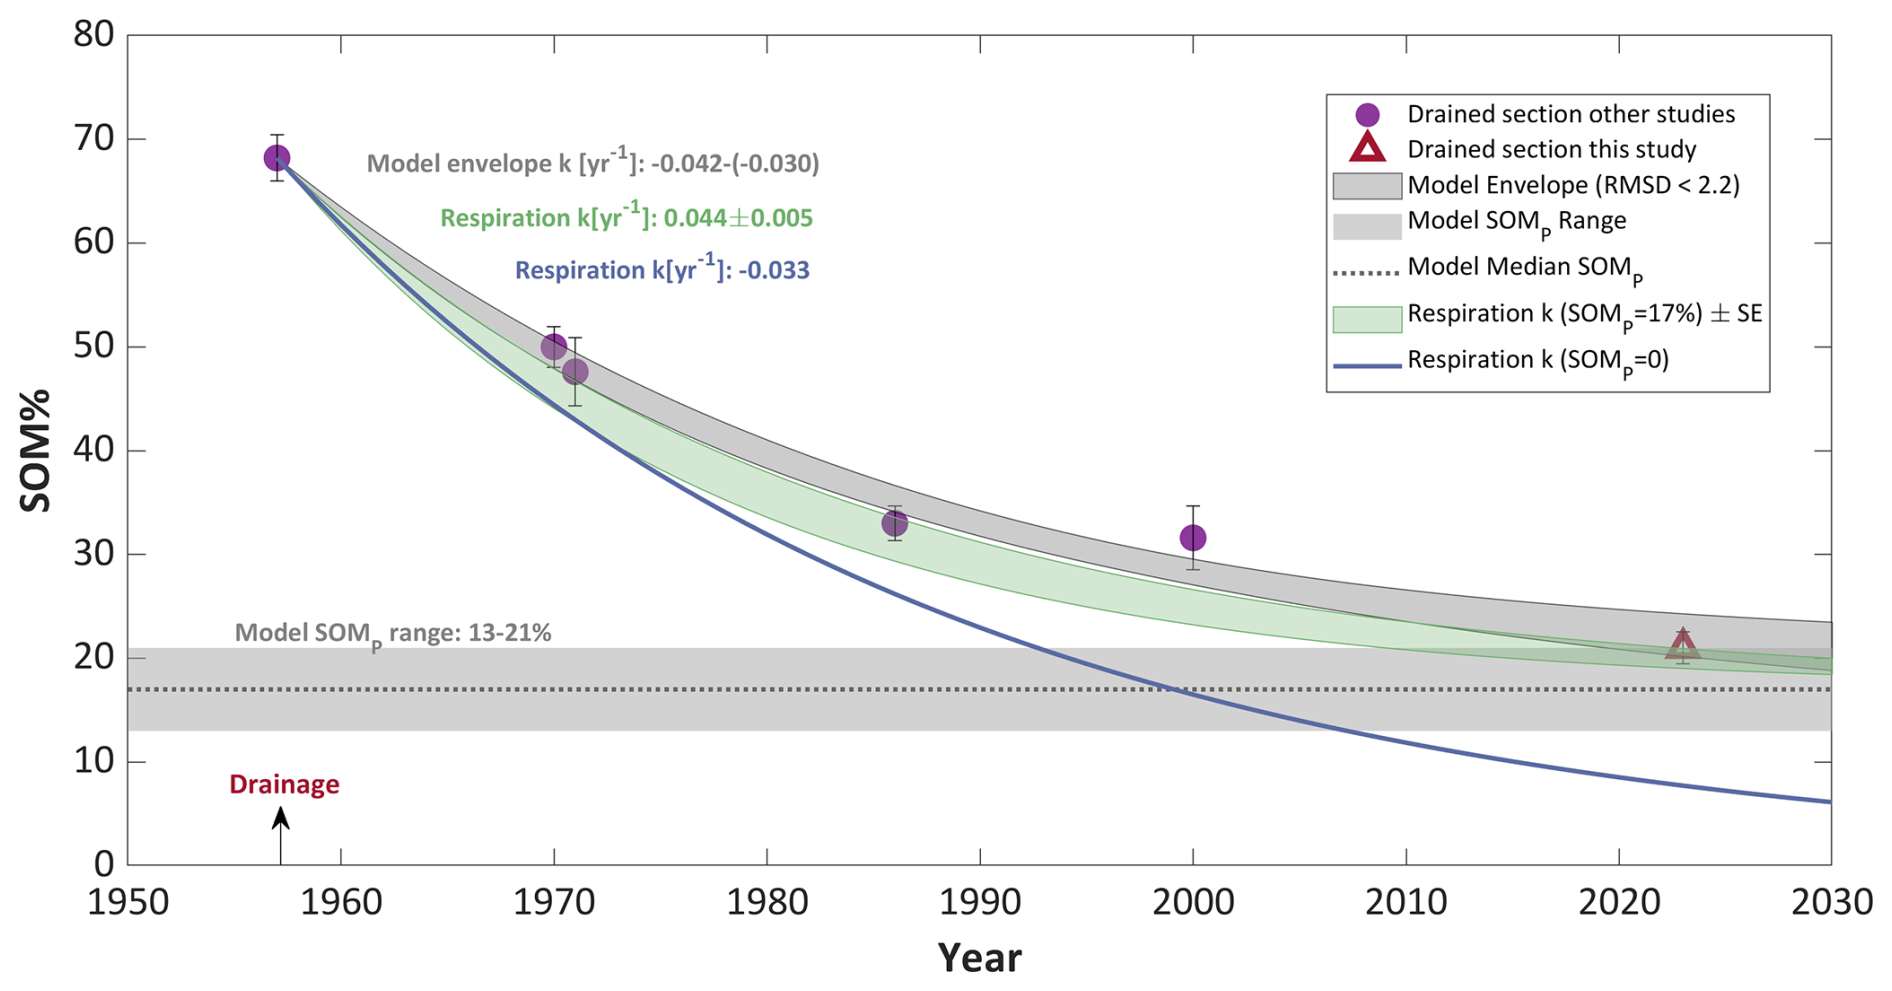
Figure 7Mean soil organic matter content of the upper 1 meter of Hula peat since drainage in 1957, represented by markers. The fitted model result is shown by the grey envelope of possible solutions with RMSD lower than 2.2 % SOM. The horizontal grey area and dashed line represent the persistent SOM pool range and median, respectively, predicted by the model. The experimental respiration decay result is represented by the green area (width is indicating the standard error), assuming 17 % SOMp. The blue line shows the result of the experimental k with zero SOMP.
4.6 The model limitations
It is important to note some limitations: (1) Our analysis assumes the drained section has not been significantly affected by the partial rewetting initiated in 1994. While this section technically remains drained after the rewetting project, the increase in water content could influence soil respiration and potentially alter decomposition rates (either enhancing or reducing them). (2) The respiration experiment might overestimate the actual rate since it is measured in optimal water holding capacity (60 %), which does not typically occur in natural settings. We suggest that this might be the reason for the experimental k plot to project somewhat more intense decomposition compared to the observed data (Fig. 7, green shade). (3) Another potential limitation is the possibility of enhanced decomposition in the drained section due to the priming effect caused by root exudates from crops (Fontaine et al., 2004). However, Linkosalmi et al. (2012) found no evidence of a priming effect in their study of drained peatlands, suggesting that the introduction of labile carbon substrates, such as root exudates, did not significantly accelerate the decomposition of older, more persistent organic matter. Furthermore, in the model the top 30 cm of the profile was excluded, minimizing this potential effect. (4) It is acknowledged that additional SOM inputs and outputs that are not accounted for in the model may contribute to the overall trend. These may be root carbon contributions or DOC leaching for example. While the model, which is based on observed data, effectively captures the overall SOM losses and gains, this remains a limitation when directly comparing its results to respiration fluxes. Nevertheless, as pointed out above, we find the model in its current form – both satisfactory and informative.
4.7 Persistent SOM in the Hula peat
While our model analysis suggests the presence of original persistent SOM, and is further supported by including the short-term experiments' decomposition rate constant, direct evidence for persistent SOM in the field-scale is still lacking. Recent studies have attempted to quantify persistent SOC using Rock-Eval analysis (Saenger et al., 2014; Cécillon et al., 2021). Here, we discuss SOC persistence in the context of our findings. Such persistent SOM could have been an original fraction of the peat, formed during the oxidation process, or resulted from a combination of both. Furthermore, the mechanism behind its persistence in the field (e.g., mineral association or other processes) in drained peat remains unknown.
In addition to our SOM model, the correlation between mean SOC and RI values across sections highlights the increase in thermal stability of the drained section compared to the pristine section. Figure 8a presents pyrograms of the Rock-Eval HC signal generated during the pyrolysis ramping. It shows that pristine samples (blue curves) exhibit two dominant HC peaks, corresponding to thermally labile and stable fractions (Sebag et al., 2016). In drained samples, these peaks persist but are diminished, with the high-temperature peak decreasing to a lesser extent. This suggests that during drainage, as microbial activity accelerates organic matter decomposition, the thermally labile fraction (up to 400 °C) is preferentially consumed, leaving behind residual thermally stable SOC, which contributes to higher RI values in drained samples.
The mechanism and evaluation of persistent SOC have been widely studied and debated (Cécillon et al., 2021). Barré et al. (2016), Gregorich et al. (2015), and Saenger et al. (2014) demonstrate that while persistent SOM has diverse chemical compositions, it generally exhibits low energy content and hydrogen depletion, making it more refractory at high temperatures. This suggests a relation between biological availability of OM and thermal stability, which aligns with our findings (Fig. 8).
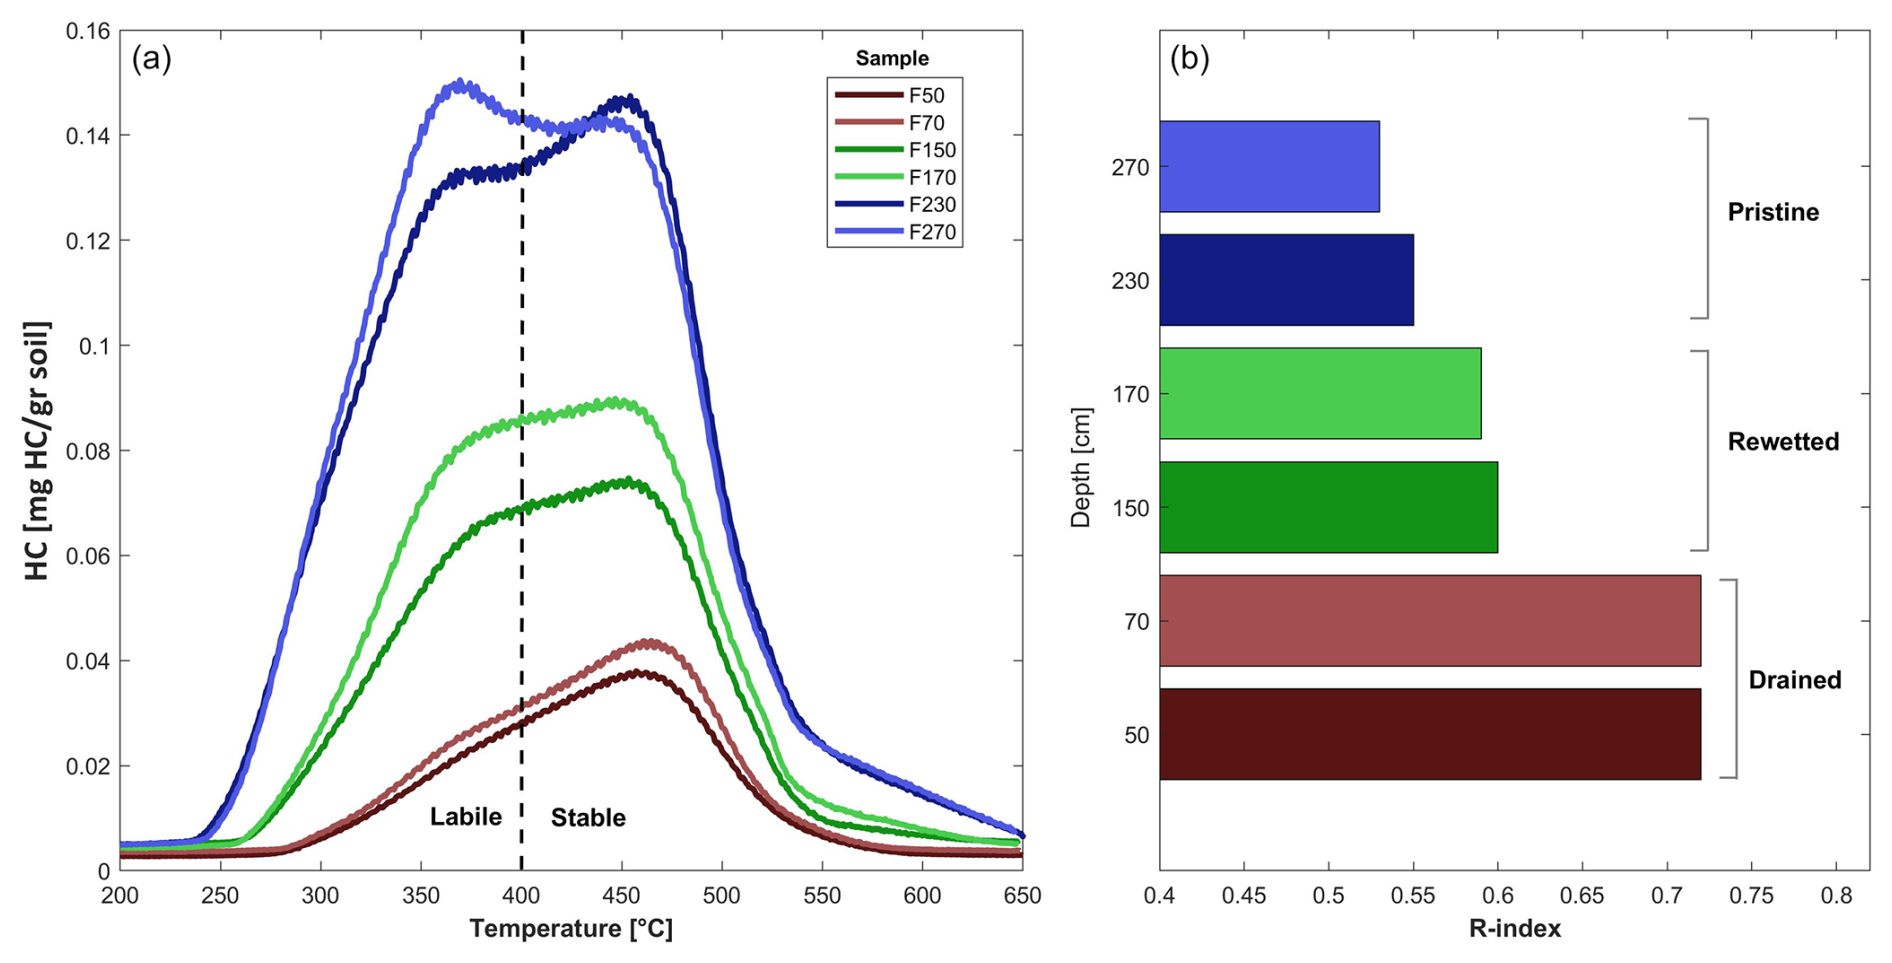
Figure 8(a) FID signal curves of hydrocarbons for pristine, rewetted, and drained samples from profile F, with colour scheme by section type and depth. The dashed line separates labile and stable hydrocarbons, following the method used for RI (Sebag et al., 2016). (b) RI values for the same samples, using the same colour scheme.
There are generaly three SOC pools that can be identifed in soils: labile, particulate, and mineral-associated SOC, a classification widely accepted in soil science (Blume et al., 2016). Saenger et al. (2014) proposed a thermal fractionation of those SOC pools using RE analysis. Our thermal analysis partially aligns with this method. The stable SOC HC peak (above 450 °C), attributed by Saenger et al. (2014) to mineral-associated SOC, appears in all sections. In pristine samples, it is as high as the labile SOC peak. However, mineral association with SOC is expected to be very low in pristine peat samples (Mirabito and Chambers, 2023). This demonstrates that attributing HC peaks to particulate and mineral-associated SOC presents a challenge in Hula's peat.
An additional approach to estimating persistent SOC in soils using Rock-Eval was proposed recently by Cécillon et al. (2021) through the PARTYSOC model (v2.0). The results indicate that, unlike the thermal indices we used above, the predicted stable SOM by the PARTYSOC model showed only a weak negative correlation with SOC content (R2=0.25; Sect. S1.6). The PARTYSOC model estimates of the stable fraction were multiplied by the SOC content, yielding mean persistent SOC values of 13.2±0.8 % in the pristine section and 6.1±0.5 % in the drained section. However, persistent SOC is not expected to decline so fast during 66 years of peat decomposition, since it is defined as resilient for more than a century (Cécillon et al., 2021), which suggests a discrepancy in these results. Those discrepancies may arise as the PARTYSOC model was fitted to soils that are not as organic-rich as peat soils (Cécillon et al., 2021). Indeed, our findings show that the estimation of the PARTYSOC v2.0 model or pool separation by Saenger et al. (2014) is inapplicable for the Hula's peat. Nevertheless, while RI does not allow for direct quantification of persistent SOC, it could serve as a practical and effective tool for analyzing and comparing degraded peat SOC, both in research contexts and for peatland management.
4.8 Estimation of annual CO2 emissions
Respiration models and global annual emission estimates typically incorporate factors such as peat SOM content, bulk density (BD), and WTL. However, these models often neglect the critical factor of time since drainage, which significantly influences emission rates (Hooijer et al., 2010; Tubiello et al., 2016). To emphasize the impact of drainage duration on carbon fluxes, we used a dual approach involving two distinct time frames and two independent flux estimation methods. These time frames represent the change in fluxes in the decades following peat drainage: (1) Comparing experimental respiration data from pristine and drained sections of the Hula's peat (Sect. 4.1). (2) Historical trends estimating the annual flux based on SOM decrease with time (Sect. 4.3, Fig. 7). This dual approach allows the comparison between the first decade following the exposure of the pristine peat by the onset of drainage, and the second scenario, representing the degraded peat after nearly 70 years of drainage.
The average annual carbon emissions flux from the pristine and drained peat sections of the Hula at 22 °C, derived from the short-term experiments (Flux per g soil; Eq. 1), are 12±1 and 4.7±0.9 mg C g yr−1, respectively. An independent flux estimation was carried based on the two-pool box model. In this case, the average annual carbon loss rates are derived from the observation-based long-term model (Fig. 7, grey area), and was calculated as (SOCintial – SOC (10 years)) 10 years, where SOC is given in mg C g. Based on these calculations, the estimated fluxes are 9±1 and 1.4±0.2 mg C g yr−1 for the 1st and (current) 7th decades, respectively. These two independent methods demonstrate the drastic difference in CO2 fluxes between early and advanced stages of peat degradation. The comparison between these fluxes is presented in Fig. 9.
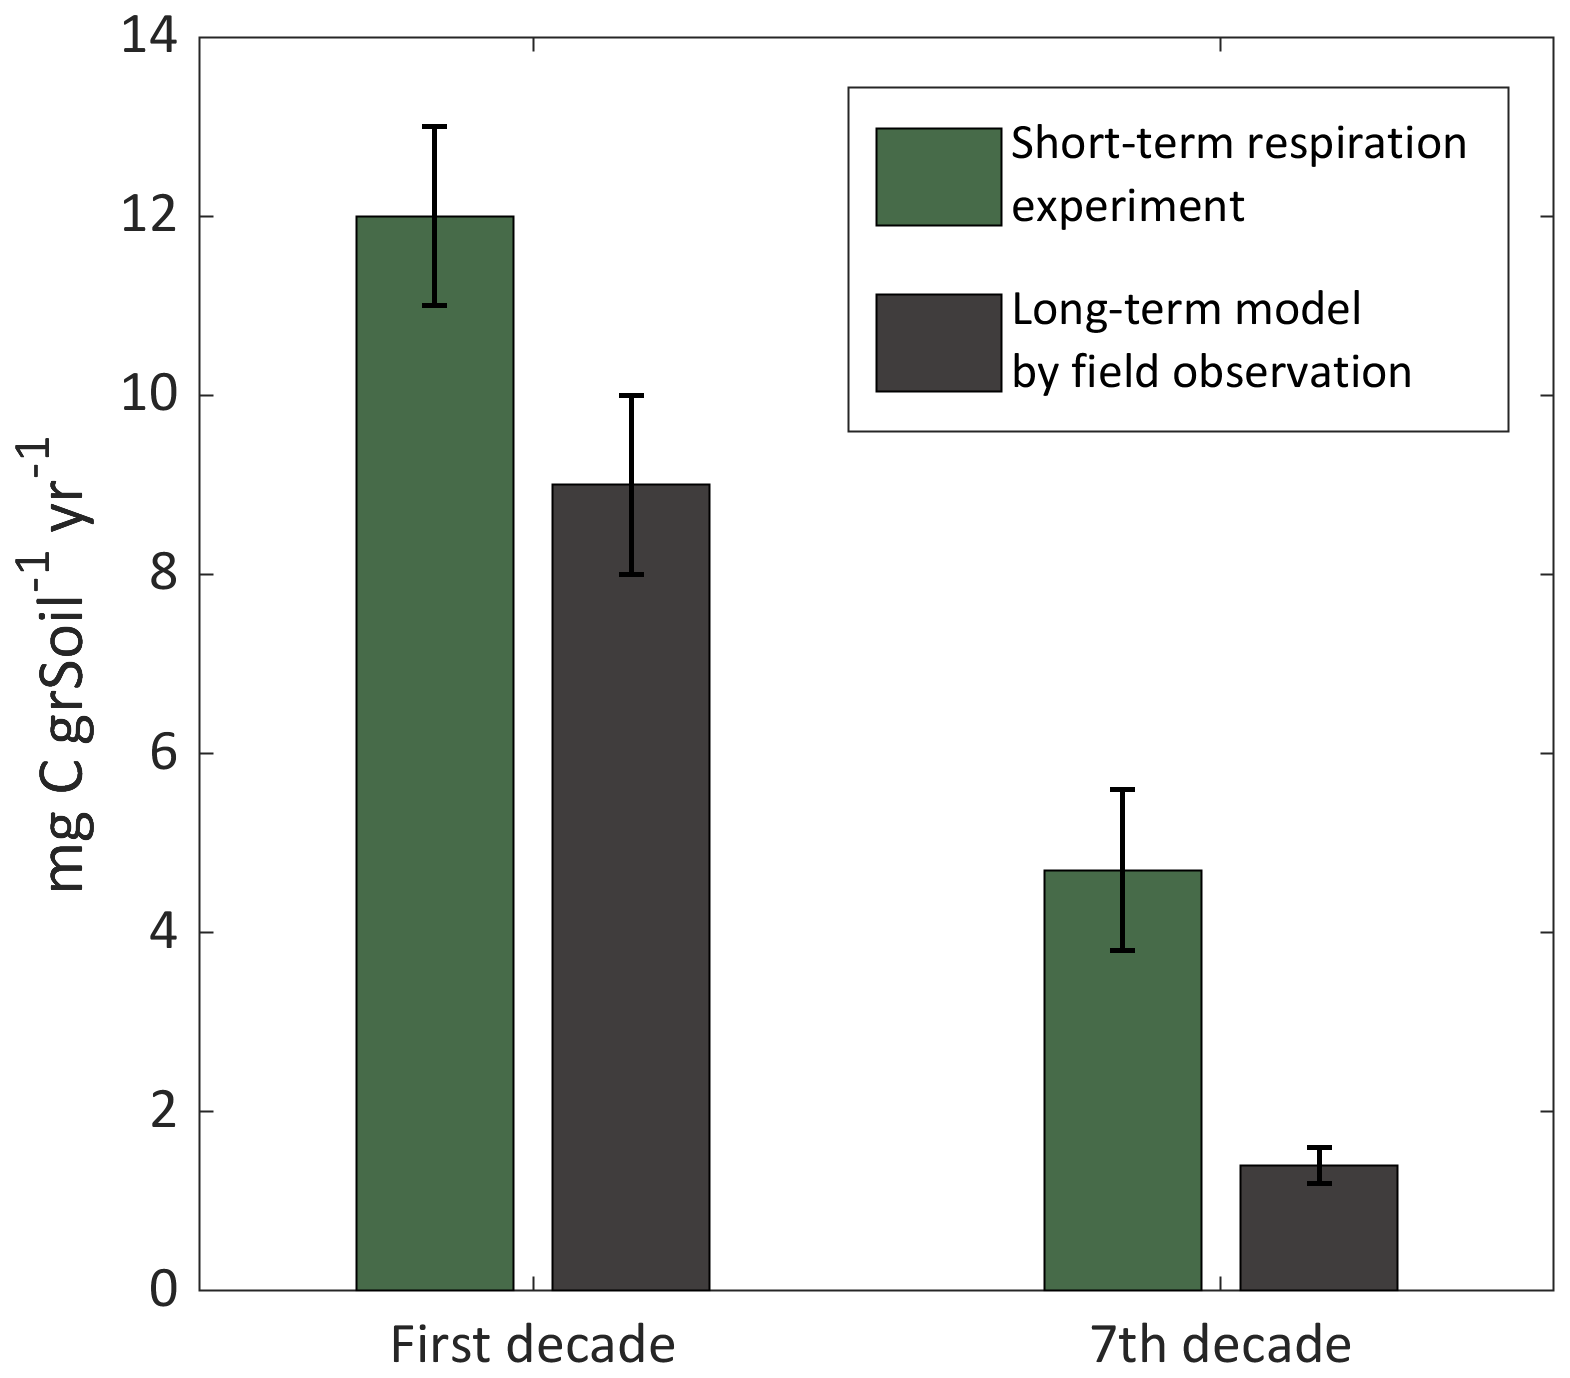
Figure 9Average annual fluxes of CO2 from peat soil, derived from short-term experiment (green) and long-term field model (black).
Next, these fluxes were converted to emissions estimates. This was done by incorporating additional data regarding the peat's bulk density, it's shrinkage properties, and assuming a characteristic peat column depth of 100 cm as a baseline for calculation (Sect. S1.10). This calculation was carried to represent the two timeframes mentioned above. For the first decade following the drainage, we assumed pristine peat exposure, incorporated data experimental flux data of pristine peat at 22 °C (mean annual average), bulk density of 0.22±0.07 g cm−3 (Dasberg and Neuman, 1977), yielded an estimated emission of 94±31 t CO2 ha−1 yr−1. This is in good agreement with the IPCC and global models estimated CO2 emissions from drained tropical peatlands at 73±14 t CO2 ha−1 yr−1 (Hiraishi et al., 2013; Tubiello et al., 2016). This similarity may be attributed to the Hula valley's mean annual temperature (∼20 °C), which falls within the classification of tropical soil respiration zone (Bond-Lamberty et al., 2024).
For the 7th decade, representing the degraded peat layer after 66 years of drainage, we used experimental flux of degraded peat at 22 °C, increased bulk density of 0.52±0.04 g cm−3 (Orlov-Levin and Meron, 2005), and assumed 71±7 % soil shrinkage (after Yaari-Cohen et al., 1971b). This yielded an estimated emission of 26±11 t CO2 ha−1 yr−1. Thus, the expected emissions from the upper degraded peat have decrease to ∼30 % of the original estimated value.
This sharp decline in CO2 emissions, which occurs within the first decades following drainage, implys a narrow window for effective restoration. The degradation trajectory observed in the Hula Valley may therefore be relevant to other peatlands in subtropical and warm climatic regions subjected to long-term drainage.
Our observations show that active land management that includes partial rewetting of the once-drained peat column significantly mitigates CO2 emissions and organic carbon loss, demonstrating its effectiveness even after prolonged drainage in a warm sub-tropical climate. The respiration results highlight the vulnerability of the rewetted peat horizon to re-exposure to air, showing the potential of enhanced fluxes, twice as high relative to the drained and pristine sections (per SOC). We also found a peak in pyrite concentration beneath the recent WTL, and sulfate accumulation in the drained section, which indicates sulfur recycling and re-establishment of anaerobic conditions. Short-term respiration experiments reveal that the drained and pristine sections share similar first-order reaction rates (k) for SOM decomposition, and that these experiments successfully describe the observed long-term SOM decomposition in the Hula's peat. Model analysis, supported by those experimental results, indicates that approximately 13 %–21 % of the ∼68 % initial SOM persists as a stable fraction in the drained peat, emphasizing the role of the persistent organic pool in stabilizing carbon stocks. However, the mechanism of persistence SOM formation in degraded peatlands requires further investigation. The use of a thermal analysis (Rock-Eval) to characterize the OM properties, coupled with short-term aerobic respiration experiments, is shown here to be useful in bridging the gap to the field scale, to the modelling of long-term decomposition of peatlands, and to estimating their CO2 emissions. The timeline of drained peat SOM decomposition shows that the first few decades are crucial, as SOM declines rapidly, resulting in high CO2 emissions. Future peatland restoration projects, especially in sub-tropical and warm climates, can use this site as an analogue to make more informed decisions regarding rewetting priorities.
The code for the peat SOM Model can be accessed in this DOI link: https://doi.org/10.5281/zenodo.18649019 (Sapir, 2026).
Data of Rock-Eval 7 analysis and respiration experiments can be accessed in this DOI link: https://doi.org/10.5281/zenodo.18649019 (Sapir, 2026).
Samples are stored in the Geological survey of Israel and can be accessed if needed, please reach the author for more information.
The supplement related to this article is available online at https://doi.org/10.5194/bg-23-1403-2026-supplement.
The Investigation was done by GS. RG, AA, and YR conceptualized the research, were in charge on the methodology, and supervised GS. GS wrote the original draft, and AA, YR and RG reviewed and edited it.
The contact author has declared that none of the authors has any competing interests.
Publisher's note: Copernicus Publications remains neutral with regard to jurisdictional claims made in the text, published maps, institutional affiliations, or any other geographical representation in this paper. The authors bear the ultimate responsibility for providing appropriate place names. Views expressed in the text are those of the authors and do not necessarily reflect the views of the publisher.
We would like to express our gratitude to the Hula Valley Monitoring Program, operated by MIGAL Institute, Tel-Hai College, and the Israel Water Survey, for their valuable collaboration and the availability of their data online. We also thank Oren Reichman and Michael Litaor for providing access to their field data and helpful information. Our acknowledgments to Tal Weiner, Roee Katzir and Itay Eyal for their assistance during field and laboratory work, and the helpful comments of two anonymous reviewers. OpenAI was used solely to improve the grammar and phrasing of the text. The authors declare that no other artificial intelligence or machine learning tools were employed in this study.
This research was partly supported by the Israel Science Foundation (grant no. 300/23) and the Chief Scientist of the Ministry of Agriculture and Food Security, Israel (grant no. 20-03-0081).
This paper was edited by Ji-Hyung Park and reviewed by two anonymous referees.
Aboussou, A.: New Rock-Eval method for Pyritic and Organic Sulphur quantification: Application to study Organic Matter preservation in Jurassic sediments, Doctoral dissertation, Sorbonne Université, NNT: 2018SORUS529, 2018.
Angert, A., Yakir, D., Rodeghiero, M., Preisler, Y., Davidson, E. A., and Weiner, T.: Using O2 to study the relationships between soil CO2 efflux and soil respiration, Biogeosciences, 12, 2089–2099, https://doi.org/10.5194/bg-12-2089-2015, 2015.
Bader, C., Müller, M., Schulin, R., and Leifeld, J.: Peat decomposability in managed organic soils in relation to land use, organic matter composition and temperature, Biogeosciences, 15, 703–719, https://doi.org/10.5194/bg-15-703-2018, 2018.
Barré, P., Eglin, T., Christensen, B. T., Ciais, P., Houot, S., Kätterer, T., van Oort, F., Peylin, P., Poulton, P. R., Romanenkov, V., and Chenu, C.: Quantifying and isolating stable soil organic carbon using long-term bare fallow experiments, Biogeosciences, 7, 3839–3850, https://doi.org/10.5194/bg-7-3839-2010, 2010.
Barré, P., Plante, A. F., Cécillon, L., Lutfalla, S., Baudin, F., Bernard, S., Christensen, B. T., Eglin, T., Fernandez, J. M., Houot, S., Kätterer, T., Le Guillou, C., Macdonald, A., van Oort, F., and Chenu, C.: The energetic and chemical signatures of persistent soil organic matter, Biogeochemistry, 130, 1, https://doi.org/10.1007/s10533-016-0246-0, 2016.
Behar, F., Beaumont, V. D. E. B., and Penteado, H. D. B.: Rock-Eval 6 technology: performances and developments, Oil and Gas Science and Technology, 56, 111–134, https://doi.org/10.2516/ogst:2001013, 2001.
Bein, A: Hula valley report by the Geological Survey of Israel, 1967 (in Hebrew).
Bein, A: Early evolution and transformation of organic matter in the active continental Jordan Rift Valley, Organic Geochemistry, 10, 751–757, https://doi.org/10.1016/S0146-6380(86)80012-2, 1986.
Bein, A. and Horowitz, A: Papyrus-A a historic newcomer to the Hula Valley Israel?, Review of Palaeobotany and Palynology, 47, 89–95, https://doi.org/10.1016/0034-6667(86)90007-2, 1986.
Blume, H.-P., Brümmer, G. W., Fleige, H., Horn, R., Kandeler, E., Kögel-Knabner, I., Kretzschmar, R., Stahr, K., and Wilke, B.-M.: Soil organic matter, Scheffer/Schachtschabel Soil Science, 55–86, https://doi.org/10.1007/978-3-662-49880-4_3, 2016.
Bond-Lamberty, B., Ballantyne, A., Berryman, E., Fluet-Chouinard, E., Jian, J., Morris, K. A., Rey, A., and Vargas, R.: Twenty years of progress, challenges, and opportunities in measuring and understanding soil respiration, American Geophysical Union (AGU), https://doi.org/10.1029/2023jg007637, 2024.
Brown, C., Boyd, D. S., Sjögersten, S., and Vane, C. H.: Detecting tropical peatland degradation: Combining remote sensing and organic geochemistry, PLoS ONE, 18, e0280187, https://doi.org/10.1371/journal.pone.0280187, 2023.
Cécillon, L., Baudin, F., Chenu, C., Houot, S., Jolivet, R., Kätterer, T., Lutfalla, S., Macdonald, A., van Oort, F., Plante, A. F., Savignac, F., Soucémarianadin, L. N., and Barré, P.: A model based on Rock-Eval thermal analysis to quantify the size of the centennially persistent organic carbon pool in temperate soils, Biogeosciences, 15, 2835–2849, https://doi.org/10.5194/bg-15-2835-2018, 2018.
Cécillon, L., Baudin, F., Chenu, C., Christensen, B. T., Franko, U., Houot, S., Kanari, E., Kätterer, T., Merbach, I., van Oort, F., Poeplau, C., Quezada, J. C., Savignac, F., Soucémarianadin, L. N., and Barré, P.: Partitioning soil organic carbon into its centennially stable and active fractions with machine-learning models based on Rock-Eval® thermal analysis (PARTYSOCv2.0 and PARTYSOCv2.0EU), Geosci. Model Dev., 14, 3879–3898, https://doi.org/10.5194/gmd-14-3879-2021, 2021.
Chenu, C. and Cosentino, D.: Microbial regulation of soil structural dynamics, in: The architecture and biology of soils: life in inner space, 37–70, Wallingford UK: CABI, https://doi.org/10.1079/9781845935320.0037, 2011.
Clivot, H., Mouny, J.-C., Duparque, A., Dinh, J.-L., Denoroy, P., Houot, S., Vertès, F., Trochard, R., Bouthier, A., Sagot, S., and Mary, B.: Modeling soil organic carbon evolution in long-term arable experiments with AMG model, Environ. Model. Softw., 118, 99–113, https://doi.org/10.1016/j.envsoft.2019.04.004, 2019.
Clymo, R. S., Turunen, J., and Tolonen, K.: Carbon accumulation in peatland, Oikos, 81, 368–388, https://doi.org/10.2307/3547057, 1998.
Cohen-Sadon, H., Amrani, A., Feinstein, S., and Rosenberg, Y. O.: A new empirical approach for rapid quantification of organic and pyritic sulfur in sedimentary rocks using the Rock-Eval 7S, Organic Geochemistry, 166, 104350, https://doi.org/10.1016/j.orggeochem.2021.104350, 2022.
Convention on Wetlands: Global guidelines for peatland rewetting and restoration, Ramsar technical report no. 11, Gland, Switzerland: Secretariat of the Convention on Wetlands, 2021.
Cowgill, U. M.: The waters of Merom: A study of Lake Huleh. I. Introduction and general stratigraphy of a 54 m core, Archiv für Hydrobiologie, 66, 249–272, 1969.
Dasberg, S. and Neuman, S. P.: Peat hydrology in the Hula Basin, Israel: I. Properties of peat, J. Hydrol., 32, 219–239, 1977.
Delahaie, A. A., Barré, P., Baudin, F., Arrouays, D., Bispo, A., Boulonne, L., Chenu, C., Jolivet, C., Martin, M. P., Ratié, C., Saby, N. P. A., Savignac, F., and Cécillon, L.: Elemental stoichiometry and Rock-Eval® thermal stability of organic matter in French topsoils, SOIL, 9, 209–229, https://doi.org/10.5194/soil-9-209-2023, 2023.
Dimentman, Ch., Bromley, H. J., and Por, F. D.: Lake Hula, Reconstruction of the Fauna and Hydrobiology of a Lost Lake, The Israel Academy of Science and Humanities, Jerusalem, 170 pp., 1992.
Disnar, J.-R., Jacob, J., Morched-Issa, M., Lottier, N., and Arnaud, F.: Assessment of peat quality by molecular and bulk geochemical analysis: Application to the Holocene record of the Chautagne marsh (Haute Savoie, France), Chem. Geol., 254, 101–112, https://doi.org/10.1016/j.chemgeo.2008.06.004, 2008.
Fontaine, S., Bardoux, G., Abbadie, L., and Mariotti, A.: Carbon input to soil may decrease soil carbon content, Ecol. Lett., 7, 314–320, https://doi.org/10.1111/j.1461-0248.2004.00579.x, 2004.
Freeman, C., Ostle, N. J., Fenner, N., and Kang, H.: A regulatory role for phenol oxidase during decomposition in peatlands, Soil Biol. Biochem., 36, 1663–1667, https://doi.org/10.1016/j.soilbio.2004.07.012, 2004.
Gregorich, E. G., Gillespie, A. W., Beare, M. H., Curtin, D., Sanei, H., and Yanni, S. F.: Evaluating biodegradability of soil organic matter by its thermal stability and chemical composition, Soil Biol. Biochem., 91, 182–191, https://doi.org/10.1016/j.soilbio.2015.08.032, 2015.
Günther, A., Barthelmes, A., Huth, V., Joosten, H., Jurasinski, G., Koebsch, F., and Couwenberg, J.: Prompt rewetting of drained peatlands reduces climate warming despite methane emissions, Nat. Commun., 11, 1644, https://doi.org/10.1038/s41467-020-15499-z, 2020.
Hambright, K. D. and Zohary, T.: Lakes Hula and Agmon: destruction and creation of wetland ecosystems in northern Israel, Wetlands Ecology and Management, 6, 83–89, https://doi.org/10.1023/A:1008441015990, 1998.
Hicks-Pries, C., Angert, A., Castanha, C., Hilman, B., and Torn, M. S.: Using respiration quotients to track changing sources of soil respiration seasonally and with experimental warming, Biogeosciences, 17, 3045–3055, https://doi.org/10.5194/bg-17-3045-2020, 2020.
Hilasvuori, E., Akujärvi, A., Fritze, H., Karhu, K., Laiho, R., Mäkiranta, P., Oinonen, M., Palonen, V., Vanhala, P., and Liski, J.: Temperature sensitivity of decomposition in a peat profile, Soil Biol. Biochem., 67, 47–55, https://doi.org/10.1016/j.soilbio.2013.08.009, 2013.
Hilman, B. and Angert, A.: Measuring the ratio of CO2 efflux to O2 influx in tree stem respiration, Tree Physiol., 36, 1422–1431, https://doi.org/10.1093/treephys/tpw057, 2016.
Hilman, B., Weiner, T., Haran, T., Masiello, C. A., Gao, X., and Angert, A.: The apparent respiratory quotient of soils and tree stems and the processes that control it, American Geophysical Union (AGU), https://doi.org/10.1029/2021jg006676, 2022.
Hiraishi, T., Krug, T., Tanabe, K., Srivastava, N., Baasansuren, J., Fukuda, M., and Troxler, T. G.: 2013 supplement to the 2006 IPCC guidelines for national greenhouse gas inventories: Wetlands, IPCC, Switzerland, 2014, 2013.
Hooijer, A., Page, S., Canadell, J. G., Silvius, M., Kwadijk, J., Wösten, H., and Jauhiainen, J.: Current and future CO2 emissions from drained peatlands in Southeast Asia, Biogeosciences, 7, 1505–1514, https://doi.org/10.5194/bg-7-1505-2010, 2010.
Jones, R. F.: Report of the Percy Sladen Expedition to Lake Huleh: A Contribution to the Study of the Fresh Waters of Palestine: The Plant Ecology of the District, J. Ecol., 28, 357–376, https://doi.org/10.2307/2256234, 1940.
Joosten, H. and Clarke, D.: Wise use of mires and peatlands, International Mire Conservation Group and International Peat Society, Saarijärvi, Finland, 304 pp., ISBN 951-97744-8-3, 2002.
Kleber, M., Eusterhues, K., Keiluweit, M., Mikutta, C., Mikutta, R., and Nico, P. S.: Chapter One – Mineral–Organic Associations: Formation, Properties, and Relevance in Soil Environments, Adv. Agron., 130, 1–40, https://doi.org/10.1016/bs.agron.2014.10.005, 2015.
Kleinen, T., Brovkin, V., and Schuldt, R. J.: A dynamic model of wetland extent and peat accumulation: results for the Holocene, Biogeosciences, 9, 235–248, https://doi.org/10.5194/bg-9-235-2012, 2012.
Könönen, M., Jauhiainen, J. R., Laiho, R. P., Spetz, P. K., Kusin, K. S., Limin, S. H., and Vasander, H.: Land use increases the recalcitrance of tropical peat, Wetlands Ecology and Management, 24, 717, https://doi.org/10.1007/s11273-016-9498-7, 2016.
Leifeld, J. and Menichetti, L.: The underappreciated potential of peatlands in global climate change mitigation strategies, Nat. Commun., 9, https://doi.org/10.1038/s41467-018-03406-6, 2018.
Leifeld, J., Steffens, M., and Galego-sala, A.: Sensitivity of peatland carbon loss to organic matter quality, American Geophysical Union (AGU), https://doi.org/10.1029/2012gl051856, 2012.
Liang, C., Schimel, J. P., and Jastrow, J. D.: The importance of anabolism in microbial control over soil carbon storage, Nature Microbiology, 2, https://doi.org/10.1038/nmicrobiol.2017.105, 2017.
Linkosalmi, M., Biasi, C., Pumpanen, J., Heinonsalo, J., Linden, A., Minkkinen, K., Laurila, T., and Lohila, A.: Can the contrasting carbon balances of forestry-drained peatlands be explained by different priming effects?, in: The 14th International Peat Congress “Peatlands in Balance”, Stockholm, Sweden, 3–8 June 2012, proceedings, Article No. 36, International Peat Society, 2012.
Litaor, M. I., Reichmann, O., Belzer, M., Auerswald, K., Nishri, A., and Shenker, M.: Spatial analysis of phosphorus sorption capacity in a semiarid altered wetland, Journal of Environmental Quality, 32, 335–343, https://doi.org/10.2134/jeq2003.3350, 2003.
Litaor, M. I., Reichmann, O., and Shenker, M.: Genesis, classification and human modification of peat and mineral-organic soils, Hula Valley, Israel, Mires and Peat, 9, 2011.
Lützow, M. v., Kögel-Knabner, I., Ekschmitt, K., Matzner, E., Guggenberger, G., Marschner, B., and Flessa, H.: Stabilization of organic matter in temperate soils: Mechanisms and their relevance under different soil conditions – a review, European Journal of Soil Science, 57, 426–445, https://doi.org/10.1111/j.1365-2389.2006.00809.x, 2006.
Manzoni, S. and Cotrufo, M. F.: Mechanisms of soil organic carbon and nitrogen stabilization in mineral-associated organic matter – insights from modeling in phase space, Biogeosciences, 21, 4077–4098, https://doi.org/10.5194/bg-21-4077-2024, 2024.
Manzoni, S. and Porporato, A.: Soil carbon and nitrogen mineralization: Theory and models across scales, Soil Biology and Biochemistry, 41, 1355–1379, https://doi.org/10.1016/j.soilbio.2009.02.031, 2009.
Manzoni, S., Piñeiro, G., Jackson, R. B., Jobbágy, E. G., Kim, J. H., and Porporato, A.: Analytical models of soil and litter decomposition: Solutions for mass loss and time-dependent decay rates, Elsevier BV, https://doi.org/10.1016/j.soilbio.2012.02.029, 2012.
Marchand, C., Lallier-Vergès, E., Disnar, J.-R., and Kéravis, D.: Organic carbon sources and transformations in mangrove sediments: A Rock-Eval pyrolysis approach, Org. Geochem., 39, 408–421, https://doi.org/10.1016/j.orggeochem.2008.01.018, 2008.
Marish, S.: The Hula: A soil survey report (Report, in Hebrew). Israel Ministry of Agriculture/Water Commissioner, Department of Soil Conservation and Drainage, Lake Kinneret Authority, 1986.
Markel, D., Sass, E., Lazar, B., and Bein, A.: Biogeochemical evolution of a sulfur-iron rich aquatic system in a reflooded wetland environment (Lake Agmon, northern Israel), Wetlands Ecology and Management, 6, 103–120, https://doi.org/10.1023/A:1008407800060, 1998.
Masiello, C. A., Gallagher, M. E., Randerson, J. T., Deco, R. M., and Chadwick, O. A.: Evaluating two experimental approaches for measuring ecosystem carbon oxidation state and oxidative ratio, J. Geophys. Res.-Biogeo., 113, https://doi.org/10.1029/2007jg000534, 2008.
MIGAL (Ministry of Galilee Research Institute): Data Reports reports by stations; Hava 1 station, Mop-Zafon website, http://www.mop-zafon.net/ (last access: February 2025), 2023.
Mirabito, A. J. and Chambers, L. G.: Quantifying mineral-associated organic matter in wetlands as an indicator of the degree of soil carbon protection, Elsevier BV, https://doi.org/10.1016/j.geoderma.2023.116327, 2023.
Moore, P. D.: The ecology of peat-forming processes: a review, Int. J. Coal Geol., 12, 89–103, https://doi.org/10.1016/0166-5162(89)90048-7, 1989.
Moore, T. R. and Knowles, R.: The influence of water table levels on methane and carbon dioxide emissions from peatland soils, Can. J. Soil Sci., 69, 33–38, https://doi.org/10.4141/cjss89-004, 1989.
Nabuurs, G.-J., Mrabet, R., Abu Hatab, A., Bustamante, M., Clark, H., Havlík, P., House, J., Mbow, C., Ninan, K. N., Popp, A., Roe, S., Sohngen, B., and Towprayoon, S.: Agriculture, Forestry and Other Land Uses (AFOLU), in: Climate Change 2022: Mitigation of Climate Change. Contribution of Working Group III to the Sixth Assessment Report of the Intergovernmental Panel on Climate Change, edited by: Shukla, P. R., Skea, J., Slade, R., Al Khourdajie, A., van Diemen, R., McCollum, D., Pathak, M., Some, S., Vyas, P., Fradera, R., Belkacemi, M., Hasija, A., Lisboa, G., Luz, S., and Malley, J., Cambridge University Press, Cambridge, UK and New York, NY, USA, https://doi.org/10.1017/9781009157926.009, 2022.
Nelson, D. W. and Sommers, L. E.: Total Carbon, Organic Carbon, and Organic Matter, in: Methods of Soil Analysis: Part 3—Chemical Methods, edited by: Sparks, D. L., Page, A. L., Helmke, P. A., Loeppert, R. H., Soltanpour, P. N., Tabatabai, M. A., Johnston, C. T., and Sumner, M. E., Soil Science Society of America Book Series, 5, 961–1010, https://doi.org/10.2136/sssabookser5.3.c34, 1996.
Nyberg, M., Black, T. A., Ketler, R., Lee, S.-C., Johnson, M., Merkens, M., Nugent, K. A., and Knox, S. H.: Impacts of active versus passive re-wetting on the carbon balance of a previously drained bog, J. Geophys. Res.-Biogeo., 127, e2022JG006881, https://doi.org/10.1029/2022JG006881, 2022.
Orlov-Levin, V. and Meron, M.: Soil salinization in Hula Valley crops, Report, Israel Ministry of Agriculture, 2005 (in Hebrew).
Page, S. E. and Baird, A. J.: Peatlands and global change: Response and resilience, Annu. Rev. Environ. Resour., 41, 35–57, https://doi.org/10.1146/annurev-environ-110615-085520, 2016.
Ravikovitch, S.: The Peat soils and enriched organic matter soils of the Hula Valley, Agric. Rep., 1, 23–54, 1945.
Rey, A., Petsikos, C., Jarvis, P. G., and Grace, J.: Effect of temperature and moisture on rates of carbon mineralization in a Mediterranean oak forest soil under controlled and field conditions, Eur. J. Soil Sci., 56, 589–599, https://doi.org/10.1111/j.1365-2389.2004.00699.x, 2005.
Rixen, T., Baum, A., Wit, F., and Samiaji, J.: Carbon leaching from tropical peat soils and consequences for carbon balances, Front. Earth Sci., 4, https://doi.org/10.3389/feart.2016.00074, 2016.
Roe, S., Streck, C., Beach, R., Busch, J., Chapman, M., Daioglou, V., Deppermann, A., Doelman, J., Emmet-Booth, J., Engelmann, J., Fricko, O., Frischmann, C., Funk, J., Grassi, G., Griscom, B., Havlík, P., Hanssen, S., Humpenöder, F., Landholm, D., Lomax, G., Lehmann, J., Mesnildrey, L., Nabuurs, G.-J., Popp, A., Rivard, C., Sanderman, J., Sohngen, B., Smith, P., Stehfest, E., Woolf, D., and Lawrence, D.: Land-based measures to mitigate climate change: Potential and feasibility by country, Glob. Change Biol., 27, 9357–9401, https://doi.org/10.1111/gcb.15873, 2021.
Rowley, M. C., Grand, S., and Verrecchia, É P.: Calcium-mediated stabilisation of soil organic carbon Springer Science and Business Media LLC, https://doi.org/10.1007/s10533-017-0410-1, 2017.
Saenger, A., Cécillon, L., Poulenard, J., Bureau, F., De Daniéli, S., Gonzalez, J., and Brun, J.: Surveying the carbon pools of mountain soils: A comparison of physical fractionation and rock-eval pyrolysis, Geoderma, 241–242, 279, https://doi.org/10.1016/j.geoderma.2014.12.001, 2014.
Saenger, A., Cécillon, L., Sebag, D., and Brun, J. J.: Soil organic carbon quantity, chemistry and thermal stability in a mountainous landscape: A Rock–Eval pyrolysis survey, Organic Geochemistry, 54, 101–114, https://doi.org/10.1016/j.orggeochem.2012.10.008, 2013.
Sapir, G.: Hula_Peat_data&code, Zenodo [code and data set], https://doi.org/10.5281/zenodo.18649019, 2026.
Scanlon, D. and Moore, T.: Carbon dioxide production from peatland soil profiles: the influence of temperature, oxic/anoxic conditions and substrate, Soil Sci., 165, 153–160, https://doi.org/10.1097/00010694-200002000-00007, 2000.
Schallinger, K. M.: Investigations of the Agricultural Problems Concerning Peat Soils of the Hula Valley, Report number 673, Volcani Institute for Agricultural Research, Bet Dagan, Israel, 1–33, 1970 (in Hebrew).
Sebag, D., Verrecchia, E. P., Cécillon, L., Adatte, T., Albrecht, R., Aubert, M., Bureau, F., Cailleau, G., Copard, Y., Decaens, T., Disnar, J.-R., Hetényi, M., Nyilas, T., and Trombino, L.: Dynamics of soil organic matter based on new Rock-Eval indices, Geoderma, 284, 185–199, https://doi.org/10.1016/j.geoderma.2016.08.025, 2016.
Six, J., Conant, R. T., Paul, E. A., and Paustian, K.: Stabilization mechanisms of soil organic matter: implications for C-saturation of soils, Plant Soil, 241, 155–176, https://doi.org/10.1023/A:1016125726789, 2002.
Tsipris, J. and Meron, M.: Climatic and hydrological aspects of the Hula restoration project, Wetlands Ecology and Management, 6, 91–101, https://doi.org/10.1023/A:1008459816898, 1998.
Tsipris, J., Meron, M., and Orlov-Levin, V.: Meteorological and hydrological regime of the Hula valley in 2008–2021, in: MIGAL – Galilee Research Institution; Hula monitoring project report, edited by: Pearlson O., Klein D., and Kaplan D., MIGAL – Galilee Research Institution, 2022 (in Hebrew).
Tubiello, F. N., Biancalani, R., Salvatore, M., Rossi, S., and Conchedda, G.: A worldwide assessment of greenhouse gas emissions from drained organic soils, MDPI AG, https://doi.org/10.3390/su8040371, 2016.
Wang, Y., Wang, H., He, J. S., and Feng, X.: Iron-mediated soil carbon response to water-table decline in an alpine wetland, Nat. Commun., 8, 15972, https://doi.org/10.1038/ncomms15972, 2017.
Wilson, D., Blain, D., Couwenberg, J., Evans, C. D., Murdiyarso, D., Page, S. E., Renou-Wilson, F., Rieley, J. O., Sirin, A., Strack, M., and Tuittila, E.-S.: Greenhouse gas emission factors associated with rewetting of organic soils, Mires Peat, 17, 28, https://doi.org/10.19189/MaP.2016.OMB.222, 2016.
Yaari-Cohen, G., Paldi, H., Moses, G., and Harpaz, A.: A survey of the peat soils in the Hula-valley, Israel, part I, Ministry of Agriculture, Department Of Soil Conservation And Drainage, Kyriat Shemona, Israel, 112 pp., 1971a (in Hebrew).
Yaari-Cohen, G., Paldi, C., Moses, G., and Harpaz, A.: A survey of the peat soils in the Hula- valley, Israel, part II (Appendices), Ministry of Agriculture, Department Of Soil Conservation And Drainage, Kyriat Shemona, Israel, 78 pp., 1971b (in Hebrew).
Yu, Z., Loisel, J., Brosseau, D. P., Beilman, D. W., and Hunt, S. J.: Global peatland dynamics since the last glacial maximum, Geophys. Res. Lett., 37, https://doi.org/10.1029/2010gl043584, 2010.
Zou, J., Ziegler, A. D., Chen, D., McNicol, G., Ciais, P., Jiang, X., Zheng, C., Wu, J., Wu, J., Lin, Z., He, X., Brown, L. E., Holden, J., Zhang, Z., Ramchunder, S. J., Chen, A., and Zeng, Z.: Rewetting global wetlands effectively reduces major greenhouse gas emissions, Nat. Geosci., 15, 627–634, https://doi.org/10.1038/s41561-022-00989-0, 2022.