the Creative Commons Attribution 4.0 License.
the Creative Commons Attribution 4.0 License.
 | 02 Mar 2026
Drivers of long-term grassland CO2 fluxes: effects of management and meteorological conditions during regrowth periods
Yi Wang
Iris Feigenwinter
Lukas Hörtnagl
Anna K. Gilgen
Nina Buchmann
Grasslands serve a unique role in the global carbon (C) cycle and cover about 30 % of the European and about 70 % of the Swiss agricultural area. Carbon dioxide (CO2) fluxes of managed grasslands are substantially influenced by land management practices and meteorological conditions, but the temporal development of drivers and their effects are still uncertain. We used 20 years (2005–2024) of eddy-covariance (EC) fluxes, meteorological data, and detailed management information collected from an intensively managed grassland site (Chamau) in Switzerland, and employed machine learning approaches, i.e., eXtreme Gradient Boosting (XGBoost) models in combination with SHapley Additive exPlanations (SHAP) analyses, to identify drivers and their temporal contributions over two decades. Our study aimed to (1) identify intra- and inter-annual variations in grassland CO2 fluxes, (2) assess magnitude and drivers of gross primary production (GPP) and ecosystem respiration (Reco) during regrowth periods (i.e., the period after mowing, grazing, or reseeding events until the next event), and (3) quantify driver contributions to GPP and Reco over time, with focus on management and extreme events. Our results showed pronounced intra- and inter-annual variations in CO2 fluxes, driven by both management activities as well as meteorological conditions. Despite significant increases in temperature and decreases in soil water content (SWC) during the two decades, GPP and Reco during regrowth periods remained stable, and no significant trend over time was detected, suggesting adapted, climate-smart decision making of the farmer. The most important drivers of GPP in the long-term were light, management, and temperature, while Reco was mainly driven by temperature, GPP, and management. However, during extreme drought periods in the peak growing seasons (June, July, August), SWC increased in importance and limited GPP. In contrast, the impact of nitrogen (N) fertilization was more differentiated, either acting in parallel with SWC, suggesting low N availability during drought periods, or increasing GPP in years after sward renewal despite low SWC. Overall, our study provided novel insights into relevant drivers of grassland CO2 fluxes and their complex temporal contributions in the short- and long-term. Our results suggest that even small climate-smart management adaptations could be promising solutions for stabilizing important grassland processes, such as grassland regrowth, under current and future climate.
- Article
(6128 KB) - Full-text XML
- BibTeX
- EndNote


Grassland ecosystems cover 40 % of the global ice-free land surface and contribute about one third to the terrestrial carbon (C) stocks (Bai and Cotrufo, 2022; White et al., 2000). Moreover, grasslands provide a broad set of ecosystem services and thus play a unique role in global and regional feed and food production (Henwood, 1998; Richter et al., 2024; Schils et al., 2022; Wang et al., 2025). Temperate permanent grasslands (i.e., grasslands continuously used for forage production, not being part of any crop rotation) account for about 34 % of the European and about 70 % of the Swiss agricultural area (Eurostat, 2020; FSO, 2021). With great capacity to store C belowground and their large potential to act as a significant C sink, these agroecosystems are often considered as nature-based solutions to mitigate climate change (Bengtsson et al., 2019; Jia et al., 2019). Therefore, accurate understanding and assessment of grassland C dynamics and their drivers are of high relevance to inform grassland management and policies (EASAC, 2022; European Commission, 2023; Soussana et al., 2004; Wang et al., 2019; Xia et al., 2015).
Carbon dioxide (CO2) fluxes at the ecosystem scale are the result of two opposing fluxes: CO2 uptake as gross primary production (GPP) via plant photosynthesis, and CO2 release as ecosystem respiration (Reco) via autotrophic and heterotrophic respiration (Reichstein et al., 2005). The balance between these two processes represents the net ecosystem CO2 exchange (NEE) between the ecosystem and the atmosphere, which can be directly measured at high temporal resolution with the eddy covariance (EC) technique (Aubinet et al., 2012; Eugster and Merbold, 2015). Dynamics of grassland CO2 fluxes are substantially driven by land management practices (e.g., mowing, grazing, fertilization, sward renewal), climate conditions (e.g., trends, variabilities, and anomalies), and their interactions (Ammann et al., 2007, 2020; Feigenwinter et al., 2023b; Liu et al., 2024; Rogger et al., 2022; Wall et al., 2019, 2020; Winck et al., 2023, 2025; Zeeman et al., 2010). Yet, disentangling their respective effects remains challenging due to high variability across different grassland types, diverse management practices, as well as strong interdependencies and confounding interactions among drivers (Barneze et al., 2022; Chang et al., 2021; Shi et al., 2022).
With ongoing anthropogenic climate change, temperate regions are experiencing rising temperature and atmospheric dryness (i.e., high vapour pressure deficit (VPD)), reduced precipitation and soil moisture, along with more frequent, intense, and prolonged extreme events such as droughts and heatwaves, and compound extremes (Fischer and Knutti, 2014; Grillakis, 2019; Hermann et al., 2024; IPCC, 2023; Shekhar et al., 2024; Zscheischler et al., 2014). Global meta-analyses showed that warming can promote grassland productivity and increase CO2 fluxes (both GPP and Reco; Shi et al., 2022; Wang et al., 2019), but temperate grasslands have shown higher sensitivity to warming for Reco compared to GPP (Wang et al., 2019). In contrast, a latitudinal, cross-site study showed GPP and Reco consistently increased with increasing precipitation but decreased with increasing temperature (Liu et al., 2024). The effect of warming on CO2 fluxes was also found to interact with management activities such as fertilization (Barneze et al., 2022), mowing or grazing (Shi et al., 2022; Zhou et al., 2019). While extreme events (here mainly droughts, heatwaves, and compound events) typically resulted in reduced magnitude of CO2 fluxes (Fu et al., 2020; Li et al., 2023a; Reichstein et al., 2013; Zscheischler et al., 2014), their impacts can also be influenced by different management practices. A long-term study comparing intensive and extensive grazing in France found that extensive management may mitigate the impact of temperature anomalies on CO2 fluxes (Winck et al., 2025), while another observational study in Switzerland demonstrated that certain management activities could result in higher than usual net CO2 release, if followed by unfavourable meteorological anomalies (Rogger et al., 2022). Given these diverse findings across spatial and temporal scales and under varying management regimes, it remains difficult to pinpoint the dominant drivers of CO2 fluxes. Moreover, scientific evidence is urgently needed to identify and recommend climate-smart agricultural practices, as requested by international institutions (FAO, 2019; World Bank, 2024), which allow for mitigating future climate risks and improving resilience in grassland-based farming systems (Lipper et al., 2014; Walter et al., 2017).
Long-term field studies using the EC technique have been able to capture the temporal variability of CO2 fluxes with additional consideration of actual management activities (Ammann et al., 2020; Feigenwinter et al., 2023b; Rogger et al., 2022; Winck et al., 2025; Wohlfahrt et al., 2008). Current studies evaluating the drivers of CO2 fluxes have typically used traditional linear models to analyse the effects of climate conditions, only sometimes considering also management practices. However, linear models frequently fail to capture nonlinear, interactive, and highly variable effects of drivers that influence CO2 fluxes in complex systems such as intensively managed agroecosystems (Feigenwinter et al., 2023a; Maier et al., 2022). In contrast, a powerful alternative are machine learning models, which are capable of integrating these complex drivers at high temporal resolution and can account for management events. Although these models operate as black boxes, providing only aggregated measures of driver importance, advancements in interpretable machine learning such as SHapley Additive exPlanations (SHAP) analysis (Lundberg et al., 2020; Lundberg and Lee, 2017) now enable the estimation of individual driver contributions and importance for each discrete observation, albeit requiring large datasets from long time series or high temporal resolutions. This capability allows the attribution of CO2 flux variability and facilitates the identification of temporal changes in underlying drivers. In this study, we present 20 years (2005–2024) of CO2 fluxes measured at an intensively managed temperate grassland in Switzerland. Using additional meteorological data and well-documented management information, we applied eXtreme Gradient Boosting (XGBoost) models in combination with SHAP analysis to address the following objectives: (1) identify intra- and inter-annual variations in grassland CO2 fluxes, (2) assess magnitude and drivers of GPP and Reco during regrowth periods (i.e., after mowing, grazing, or reseeding), and (3) quantify driver contributions to GPP and Reco over time, with focus on management and extreme events.
2.1 Study site
The study site Chamau is a permanent grassland located in the canton of Zug, Switzerland (47°12′36.8′′ N and 8°24′37.6′′ E, 393 m a.s.l.). In 2005, an EC and meteorological station (part of FLUXNET as CH-Cha) was established, and CO2 and H2O vapour fluxes have been continuously measured since then. The average annual temperature was 9.9 °C, and the average annual precipitation sum was 1147 mm over the study period (2005–2024). The soil of the grassland parcels surrounding the flux station is classified as a Cambisol/Gleysol and has a silt loam soil texture, with a pH of 5.3 in the topsoil (Roth, 2006). This grassland has been intensively managed, with four to six mowing events per year, occasional grazing by sheep, and organic fertilizer application (mainly as slurry, normally applied once after each mowing event, on average 260 kg N ha−1 yr−1 from 2005 to 2024). In February 2012 and August 2021, the sward was renewed, i.e., the existing sward was terminated and ploughed, and a new sward was sown. The vegetation in the grassland includes English ryegrass (Lolium perenne), common meadowgrass (Poa pratensis), Italian ryegrass (Lolium multiflorum), white clover (Trifolium repens), red clover (Trifolium pratense), and dandelion (Taraxacum officinale) (Feigenwinter et al., 2023b).
2.2 Management information and regrowth periods
The Chamau grassland site consists of two parcels A and B (Feigenwinter et al., 2023b), and detailed management information from this site has been continuously documented since 2005, including major activities like mowing, grazing, fertilization, and sward renewal. A nitrous oxide (N2O) mitigation experiment was carried out from 2015 to 2020, where parcel A received standard fertilization, while parcel B was oversown with a higher legume proportion and received no fertilization (Feigenwinter et al., 2023a; Fuchs et al., 2018). Since parcel B dominated the footprint area in earlier years (2005–2013; Fig. B3 in Feigenwinter et al., 2023b), and the two parcels were under similar mowing and grazing scheme during the entire study period (Table B2 in Feigenwinter et al., 2023b; Tables A1, A2), we adopted the management scheme of parcel B to define regrowth periods in the current study.
We defined the period between two mowing/grazing/sward renewal events as a regrowth period (excluding the day(s) when management occurred). For grazing events, the start of any given grazing was defined as the end of the previous regrowth period, and the end of this grazing was considered the start of the next regrowth period. Each regrowth period consists of a minimum of 10 d. If several management activities took place only a few days apart within the entire footprint, we defined the latest activity as the start of the next regrowth period. For example, in earlier years, the parcels were occasionally first partially grazed and then partially mowed within a certain time window. We thus considered the start date of the grazing as the end of the previous regrowth period, and the mowing date as the beginning of the next regrowth period. A “DaySinceUse” variable was generated for each day in a regrowth period to indicate the number of days after the last mowing/grazing/sward renewal event. An average daily fertilizer nitrogen (N) input for each regrowth period (DailyN, in kg N ha−1 d−1) was calculated based on the total fertilizer N received during the period and the length of that period. If parcel A and B had different N inputs for certain regrowth periods, the average of the two parcels was used as the total N input. GPP and Reco during each regrowth period (in g C m−2 d−1) were calculated based on the cumulative CO2 uptake or release over the regrowth period (in g C m−2) divided by the length of the regrowth period (i.e., number of days). If the center of regrowth periods was between April and September, i.e., the main growing season for agricultural grasslands in central Europe, they were classified as spring–summer regrowth periods, else as autumn–winter regrowth periods.
2.3 Flux and meteorological measurements and data processing
Since July 2005, molar densities of CO2 and H2O vapour were measured with open path infrared gas analysers (IRGAs; LI-7500; LI-COR Biosciences, USA) at 2.42 m measurement height and tilted 15° from the vertical, together with measurements of 3D wind speed and wind direction using ultrasonic anemometers (R3–50, Gill Instruments Ltd., UK) at 20 Hz time resolution. Meteorological variables, including air temperature (TA, in °C), relative humidity (RH, in %), atmospheric pressure (PA, in hPa), incoming and outgoing shortwave and longwave radiation (SW IN/OUT and LW IN/OUT, in W m−2), incoming and outgoing photosynthetic photon flux density (PPFD IN/OUT, in ), precipitation (PREC, in mm), soil temperature (TS, in °C), and volumetric soil water content (SWC, %), were also measured. For more details on instrumentation, see Feigenwinter et al. (2023b).
Half-hourly CO2 and H2O vapour fluxes were calculated with EddyPro (v7.0.9) based on the covariance between the turbulent fluctuations of gas concentration and vertical wind speed. Widely used community guidelines (Aubinet et al., 2012; Pastorello et al., 2020, Sabbatini et al., 2018), including corrections for density fluctuations (Webb et al., 1980), double axis rotation (Wilczak et al., 2001), high-pass (Moncrieff et al., 2005) and low-pass filtering effects (Horst, 1997), were applied. The default self-heating correction for the open path LI-7500 (Burba et al., 2008) was not applied because it was developed specifically for vertically mounted IRGAs, and applying it to a 15°-tilted setup without a parallel reference flux for validation would risk introducing systematic over-corrections, larger than the random uncertainty of the measurement (Deventer et al., 2021). Time lags were detected using covariance maximization in a short time window (between 0.05 and 0.55 s), with a default time lag (typically 0.30 s) if no clear time lag was found. Post-processing for quality assessment and gap-filling was done in the Python library diive (Hörtnagl, 2025a), NEE flux partitioning into GPP and Reco based on the night-time method (Reichstein et al., 2005) was done with the R package REddyProc (v1.3.3, Wutzler et al., 2018). During quality assessment, a series of quality control flags were applied to classify data quality (after testing steady-state, data completeness, spectral correction factor, IRGA signal strength, outlier detection), and turbulence-based constant friction velocity (USTAR) thresholds were applied (0.05, 0.07, and 0.09 m s−1 for the 16th, 50th, and 84th percentile of the USTAR threshold distribution, respectively). An overall Quality Control Flag (QCF) was generated, integrating all assessments to filter for high quality data. Resulting data gaps were then filled using random forest models utilizing a sliding three-year window for annual model training (Breiman, 2001; Hörtnagl, 2025a). For all further analyses, we used quality-controlled fluxes that were filtered with the 50th percentile of the USTAR threshold distribution, subsequently gap-filled using random forest models, and partitioned into GPP and Reco.
For meteorological data, a similar quality assessment procedure was applied with the diive library (Hörtnagl, 2025a), and all screened variables were aggregated into half-hourly resolution. Vapour pressure deficit (VPD) was calculated based on TA and RH. For TS (at 0.04, 0.15, and 0.4 m depths) and SWC (at 0.05, 0.15, and 0.75 m depths) measurements, averages across all depths were calculated and used in the final analysis to represent the overall soil conditions over the entire soil profile. All data used in this study were derived from the most recent PI dataset (Hörtnagl et al., 2025), with all processing steps openly documented in a GitHub repository (Hörtnagl, 2025b).
2.4 Data analyses
2.4.1 Trend analysis, extreme detection, and functional relationships
To detect monotonic trends in monthly and yearly meteorological variables, we applied the Mann-Kendall test (Kendall, 1955; Mann, 1945). If the temporal trend was significant (p value <0.05), we additionally obtained the slope and sign of the trend with Sen's slope estimator (Sen, 1968). We tested trends in GPP and Reco across all regrowth periods. Moreover, two seasons were compared as well: spring–summer (April to September) and autumn–winter (October to March).
To identify months with high soil and air dryness, z-scores were calculated for monthly average SWC and VPD using Eq. (1):
where x represents the monthly average for SWC or VPD, μ is the respective overall mean, and σ is the respective standard deviation for all monthly values across the entire study period. Months with z scores for SWC lower than minus two were defined as months with high soil dryness, and months with z scores of VPD higher than two were defined as months with high air dryness.
To evaluate the functional relationship between PPFD and GPP, we assigned regrowth periods to three categories, (i) two years before (i.e., 2010 and 2011; 2019 and 2020) and (ii) two years after (i.e., 2013 and 2014; 2022 and 2023) the grassland renewal years (2012 and 2021), and (iii) all remaining years excluding the renewal years. Second degree polynomial regressions were then fitted using the average PPFD (calculated from the daily total PPFD) and GPP during regrowth periods (see Sect. 2.2) within each category.
2.4.2 XGBoost models and SHAP analyses
To model effects of different drivers on daily GPP and Reco (in g C m−2 d−1), we applied two eXtreme Gradient Boosting (XGBoost) models (Chen and Guestrin, 2016), one model for GPP and one model for Reco, based on 20 years of data. For GPP, we selected management indicators (i.e., DaySinceUse and DailyN) and major meteorological variables (i.e., PPFD, TA, TS, PREC, SWC, and VPD) as predicting features. For Reco, TS was used instead of TA, and GPP was added as an additional feature to better represent the C supply and C allocation for autotrophic and heterotrophic respiration. Input daily data from all 20 years were randomly split into 70 % and 30 % for training and testing datasets, respectively. Major hyperparameters (i.e., number of estimators, max depth, learning rate, and subsample) in both XGBoost models were fine-tuned using grid search with 10-fold cross-validation to improve performance and avoid overfitting. The best hyperparameters that minimized root mean square error (RMSE) were then used in the final models (Table A3). To evaluate model performance and generalization on the testing dataset, metrics like RMSE and the coefficient of determination (R2) were calculated.
To estimate the marginal contribution (i.e., SHAP value) of each feature to every model prediction (here, daily GPP and Reco predictions), we used the TreeExplainer SHAP framework that was designed specifically for tree-based ensembles like XGBoost (Lundberg et al., 2020). SHAP values at zero represent the overall mean prediction of the background dataset, which is a collection of representative data points used to estimate the expected model output that SHAP compares individual predictions against (Lundberg et al., 2020; Molnar, 2023). The SHAP value of a feature (i.e., a driver variable) represents the effect of that driver, at its specific value, on each individual prediction. A positive SHAP value indicates that this driver increases the local prediction compared to the overall mean prediction, and vice versa for negative SHAP values. Higher absolute SHAP values represent larger effects (positive or negative) on predicted fluxes. For each prediction (here, daily GPP and Reco), the sum of all SHAP values across all features equals the difference between the local model prediction (i.e., the predicted fluxes) and the overall mean prediction (from the background dataset), which is consistent with the additive property of SHAP values (Gou et al., 2024; Krebs et al., 2025; Qiu et al., 2022). The relationship between each driver and its SHAP values was further explored using SHAP dependence plots.
In this study, we performed two SHAP analyses (1 and 2), based on the same XGBoost model for daily CO2 fluxes, but with different foci:
SHAP analysis 1. For a general comparison, the “tree_path_ dependent” method was used as feature perturbation method. Thus, the mean prediction at SHAP zero represents roughly the mean prediction (i.e., of GPP or Reco) of the training dataset. We then averaged the daily SHAP values of any given feature for each regrowth period to calculate the average effect of that feature on the predicted fluxes during the regrowth period.
SHAP analysis 2. To evaluate the effect of relevant drivers on daily GPP during extreme months, we used the “interventional” method as feature perturbation method (Lundberg et al., 2020). With this method, SHAP values can be calculated that compare the predictions to a certain subset of samples (Molnar, 2023). Here, we used only the months during the peak growing seasons (June, July, August) when no extreme weather conditions occurred as the background dataset. We then calculated a second set of SHAP values for the peak growing seasons in 2018, 2019, 2022, and 2023, as these times included the majority of recent extreme months. With this approach, we also eliminated the impact of seasonality in the data and were able to assess the impact of extreme events only.
XGBoost models and SHAP analyses were performed in Python (version 3.11.11, Python Software Foundation, 2024) using the libraries xgboost (v3.0.0, Chen and Guestrin, 2016), shap (v0.47.1, Lundberg and Lee, 2017), and scikit-learn (v1.6.1, Pedregosa et al., 2011). Other statistical analyses and visualization were done in R version 4.4.1 (R Core Team, 2024).
3.1 Meteorological conditions and CO2 fluxes over 20 years
During the past 20 years (2005–2024), the Chamau grassland experienced a mild temperate climate (MAT 9.9 °C, MAP 1147 mm). At an annual scale, TA at this site increased significantly by 0.071 °C yr−1 (Mann Kendall test p<0.01), mean TS and minimum TS also increased by 0.070 and 0.095 °C yr−1, respectively (p<0.01). The years 2018 and 2022 were the hottest years on record, with mean annual TA of 11.0 and 11.1 °C, respectively, while the years 2010 and 2013 were the coldest years, with mean annual TA of 8.6 and 9.0 °C, respectively. Annual PREC did not show a significant trend (p=0.87) over the 20 years. Nevertheless, the years 2018 and 2022 were the driest years on record, with annual PREC of 906 and 884 mm, respectively, while the years 2016 and 2024 were the wettest years, with annual PREC of 1351 and 1378 mm, respectively.
At the monthly scale, meteorological conditions showed pronounced seasonal variability (Fig. 1a–d). Overall, monthly TA reached maximum values in July (mean of 19.6 °C) and minimum values in January (mean of 1.0 °C). Monthly TA (Fig. 1a), PREC (Fig. 1b), and VPD (Fig. 1d) did not show significant trends over time (p=0.21 for TA, p=0.69 for PREC, p=0.51 for VPD), while SWC (Fig. 1d) decreased significantly over the 20 years (slope % per month, p<0.01). Looking at each specific month (i.e., across 20 years), TA and TS increased significantly in the winter months (December to March; Table A4). August was the only month to experience a decrease in PREC, which otherwise remained stable. SWC significantly decreased in late summer and autumn (August to October; Table A4). Based on the z-scores, four months of extreme air dryness, seven months of extreme soil dryness, and six months of compound extremes (i.e., high VPD and low SWC) were identified (Fig. 2). These extreme conditions mainly occurred between May and September, particularly during the peak growing season months (June, July, and August) in the years 2018, 2019, 2022, and 2023.
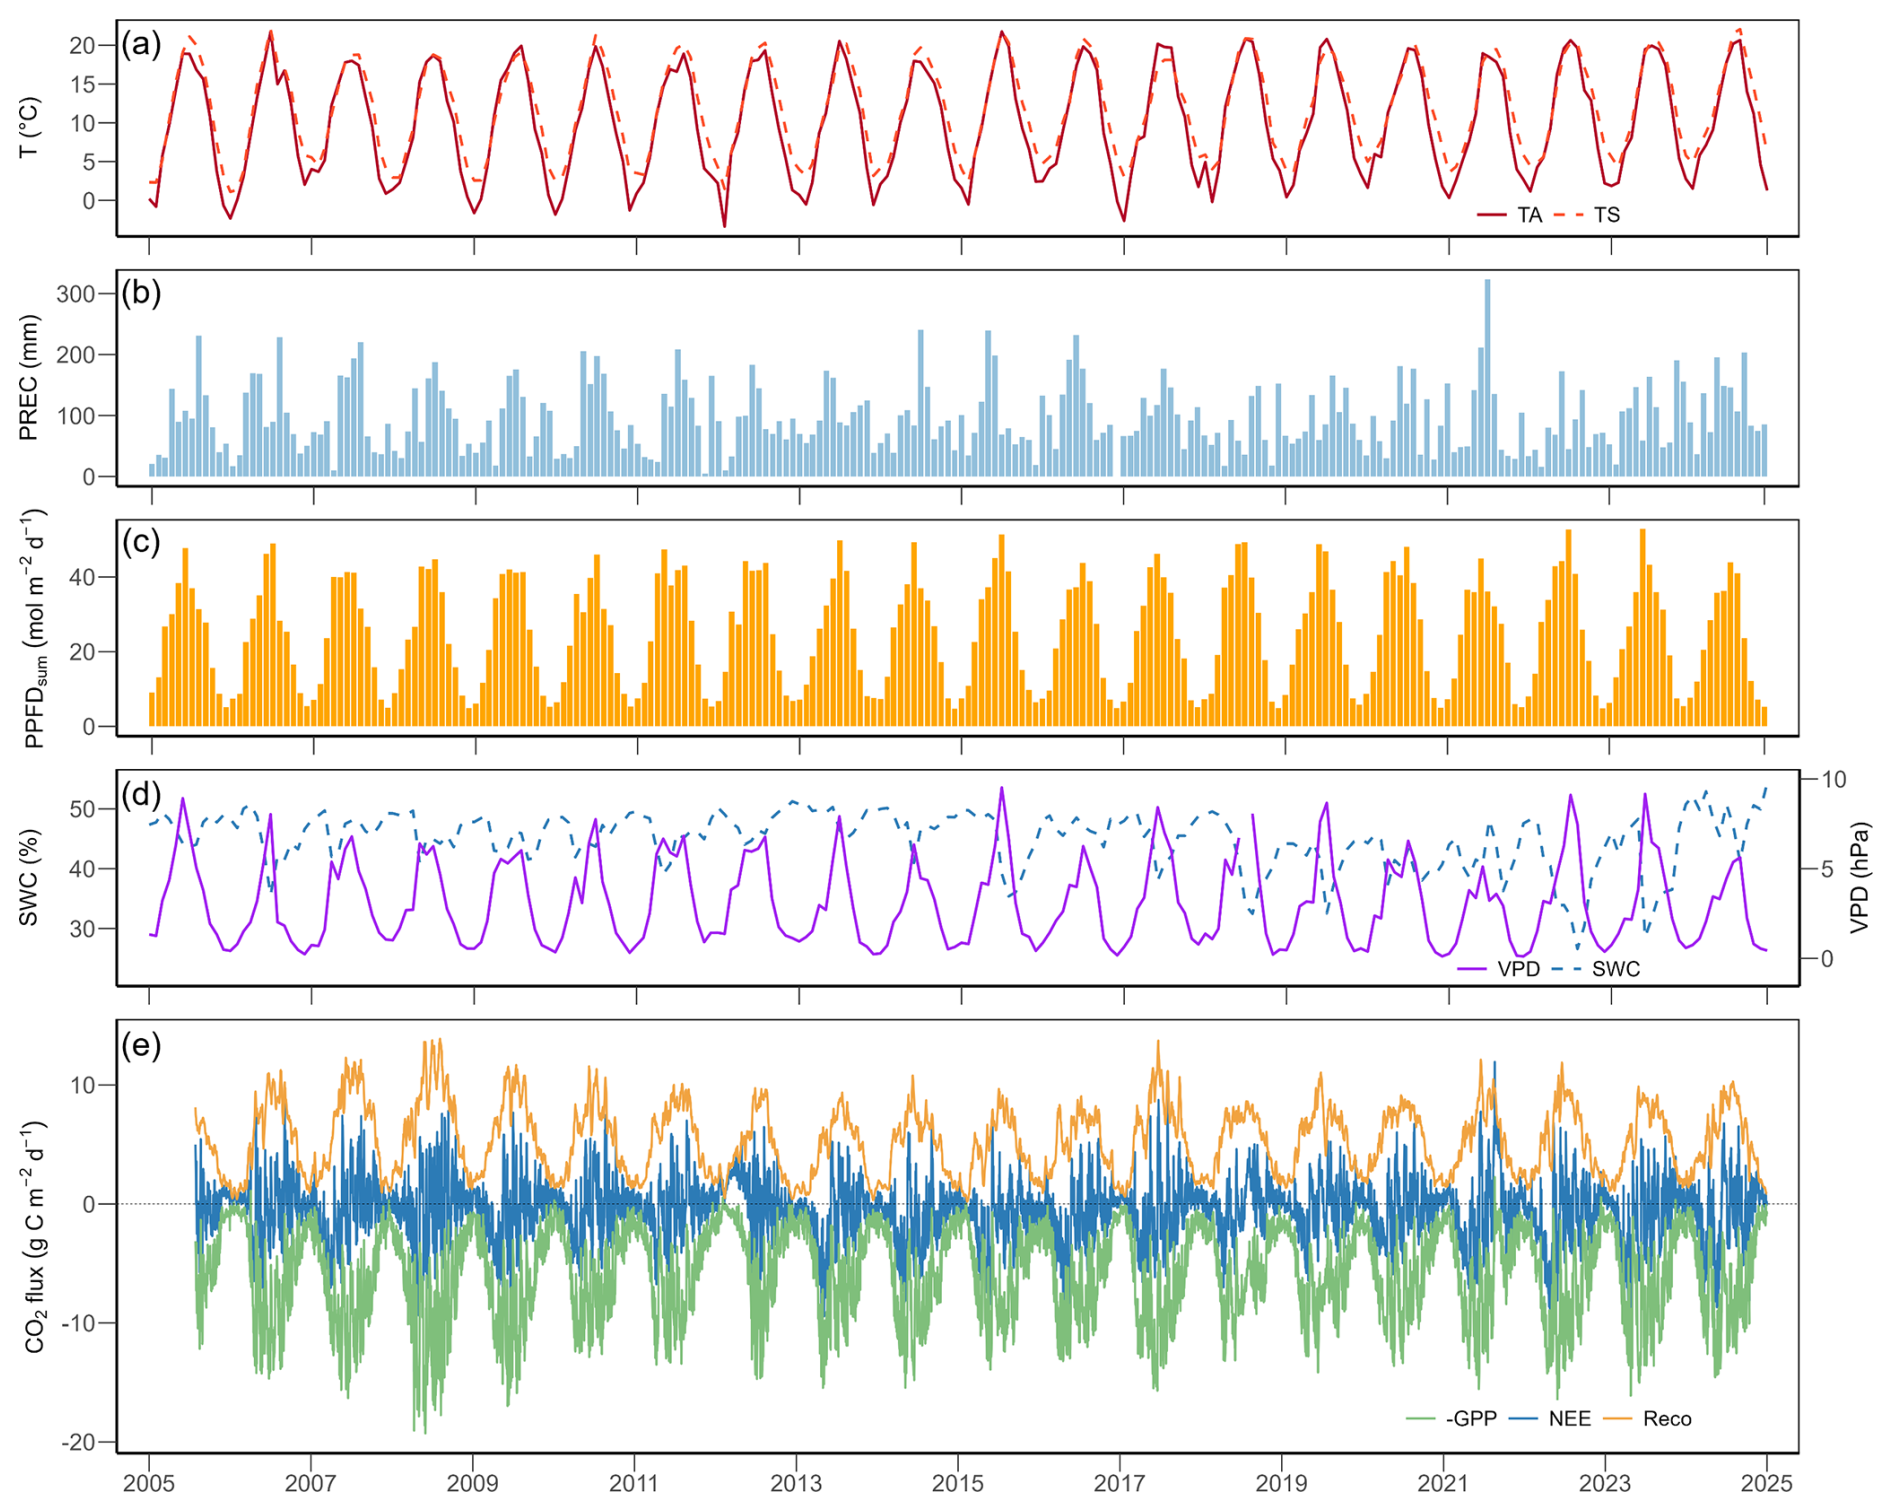
Figure 1Meteorological variables and CO2 fluxes at the Chamau grassland site from 2005 to 2024: (a) monthly mean air temperature (TA, red solid line) and soil temperature (TS, orange dashed line), (b) monthly sum of precipitation (PREC), (c) monthly mean daily total photosynthetic photon flux density (PPFDsum), (d) monthly mean volumetric soil water content (SWC, blue dashed line) and vapour pressure deficit (VPD, purple solid line), (e) daily sum of net ecosystem CO2 exchange (NEE, blue line), gross primary production (GPP, green line), and ecosystem respiration (Reco, orange line).
Daily NEE, GPP, and Reco showed strong inter-annual and seasonal variations over the 20 years (Fig. 1e, Table A5). Annual cumulative NEE ranged from 139 g C m−2 yr−1 (in 2012) to −503 g C m−2 yr−1 (in 2014), with an overall mean (± standard deviation) of −260 (±172) g C m−2 yr−1 (Fig. A1). In 2012 and 2021, two grassland renewal events (i.e., ploughing and reseeding of the grassland) took place, with very different effects on annual NEE: while the event in 2012 led to a strong net CO2 loss (cumulative NEE of 139 g C m−2 yr−1; Fig. A1), the event in 2021 resulted only in a weaker-than-normal net CO2 uptake (cumulative NEE of −163 g C m−2 yr−1; Fig. A1). All three flux components were strongly influenced by management practices (Fig. 3a, Tables A1, A2) such as mowing and grazing. Strongest net CO2 uptake occurred in early spring (March–April), while the largest net CO2 release happened in early winter (December–January).
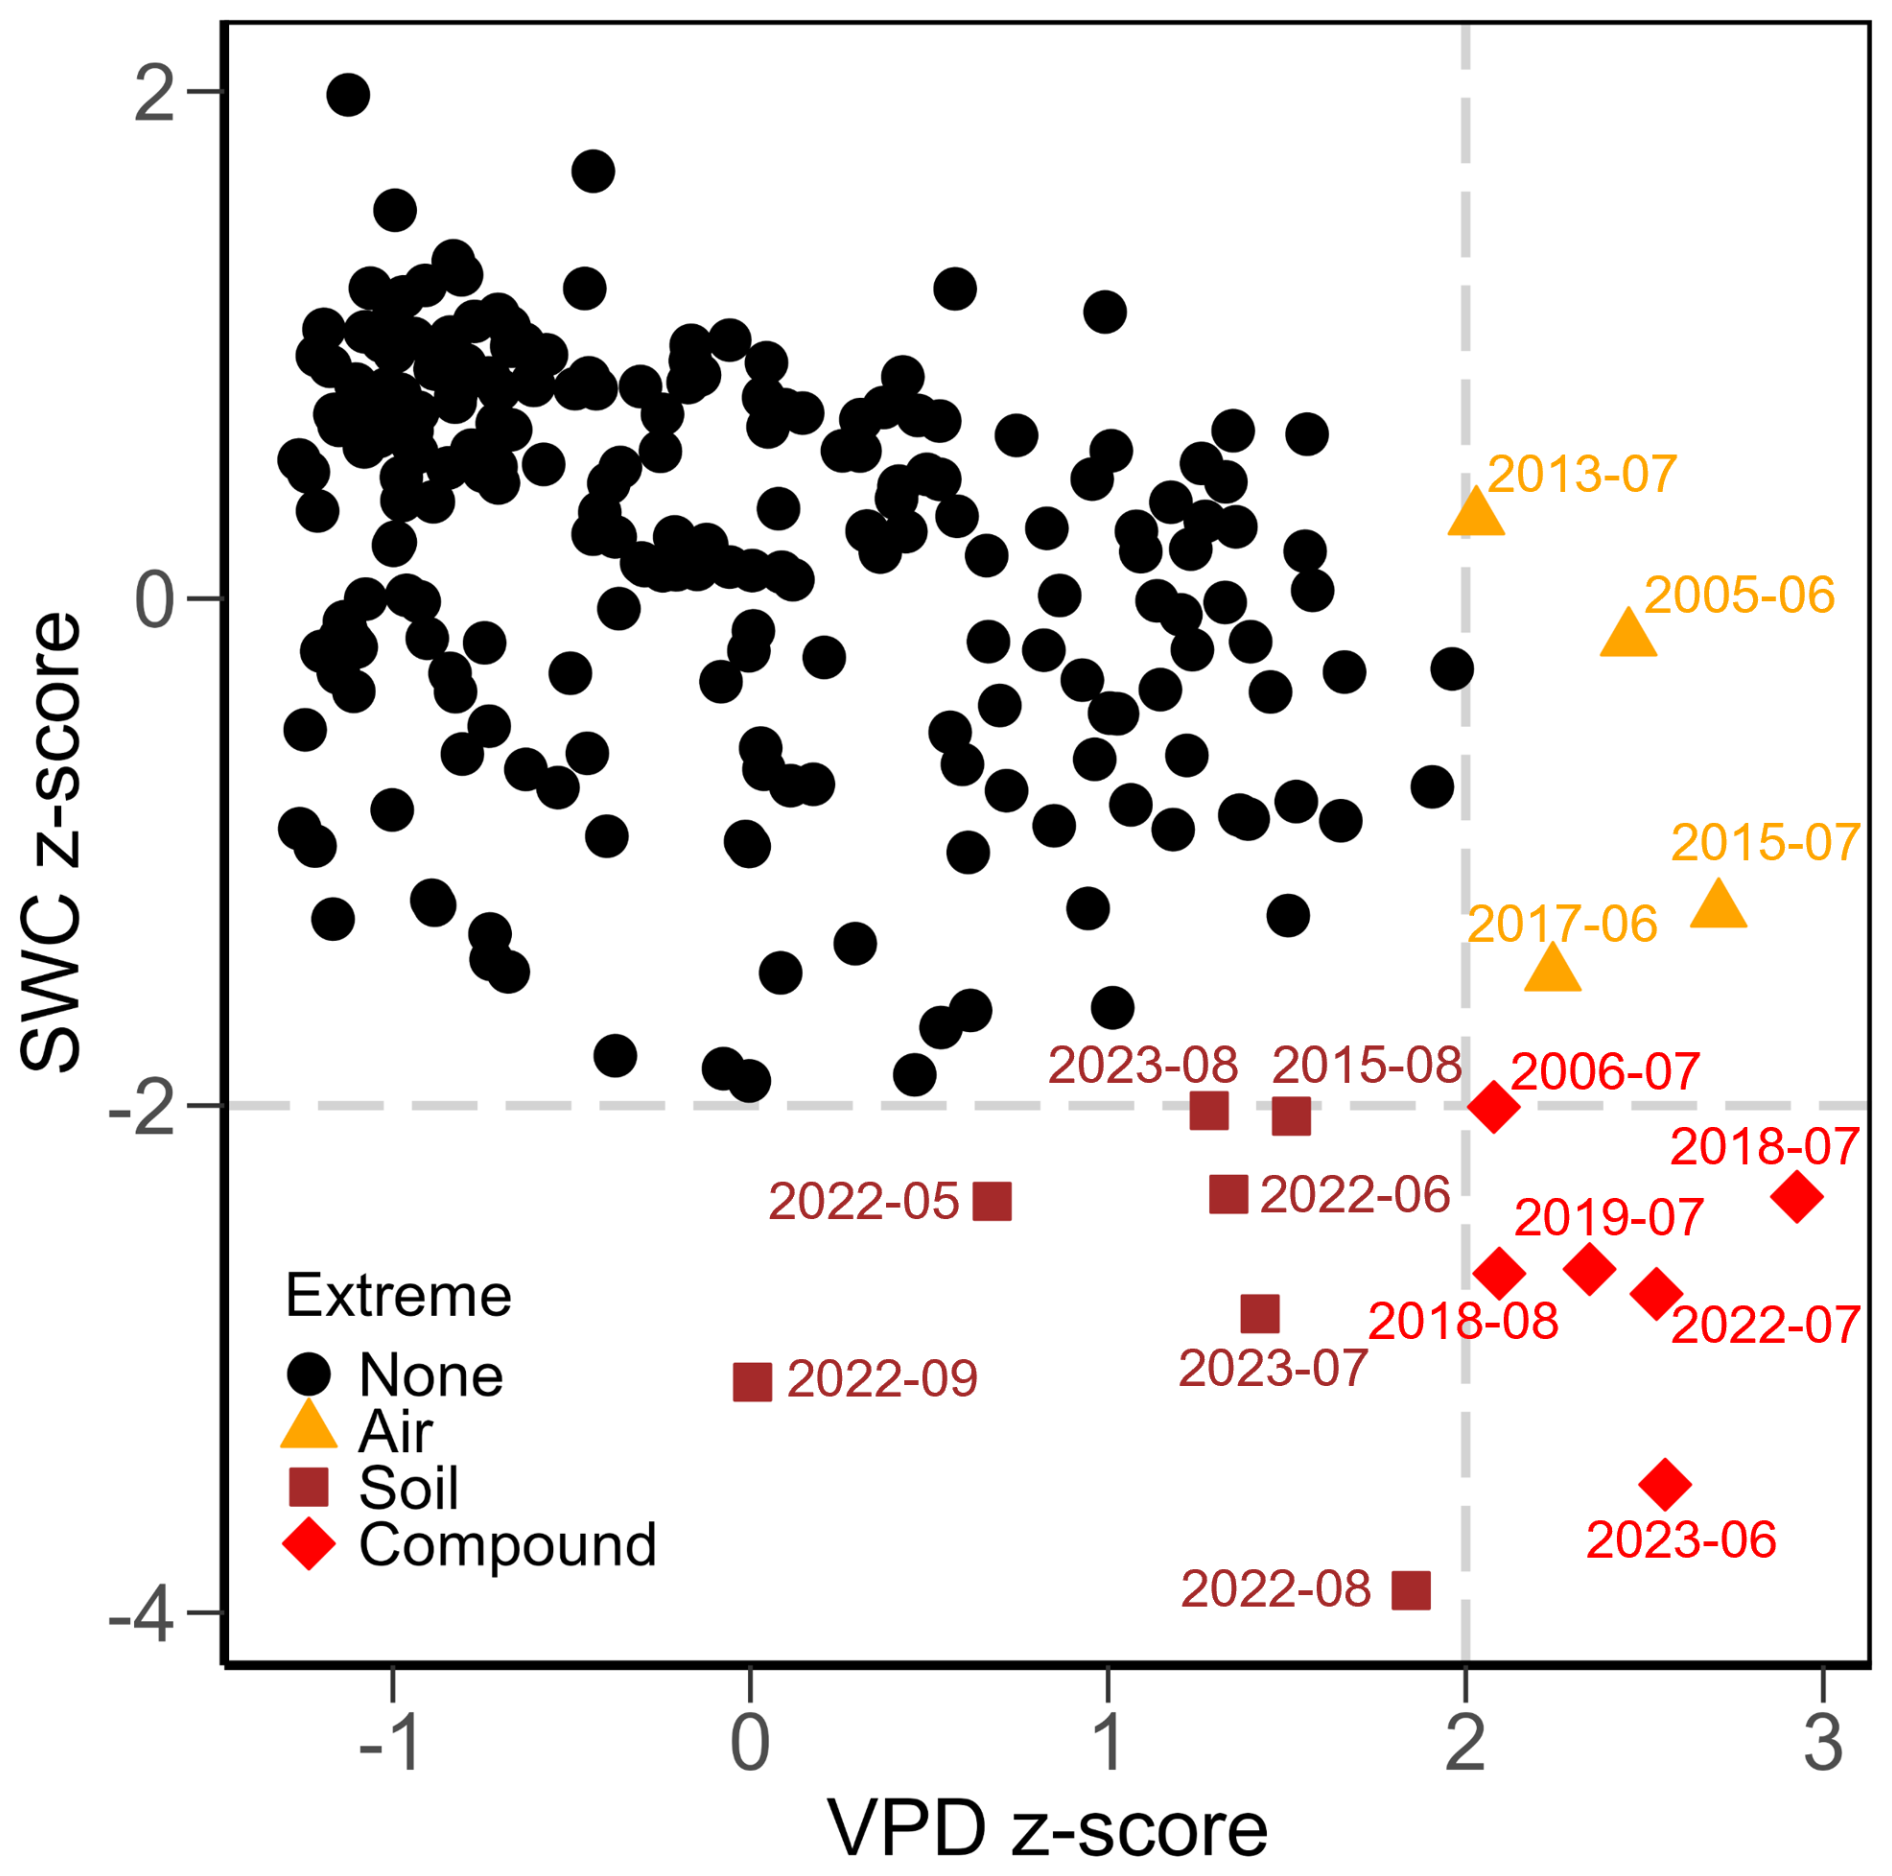
Figure 2Z-scores for monthly mean vapour pressure deficit (VPD) and volumetric soil water content (SWC) from 2005 to 2024. Grey dashed lines indicate thresholds for extreme months (z-score of 2 for VPD and of −2 for SWC). Symbols and colours indicate types of extreme: none (black dots), high air dryness (orange triangles), high soil dryness (dark red squares), and compound air and soil dryness (red diamonds).
3.2 Management and CO2 fluxes during regrowth periods
The Chamau grassland was managed intensively during the past two decades, and experienced in total 94 mowing events, 319 d of grazing, and 102 fertilizer applications. Moreover, the grassland was renewed twice, in 2012 and 2021 (Fig. 3a). This resulted in 115 grassland regrowth periods during the 20 years of this study. The average (± standard deviation) length of the regrowth period was 58 (±47) d, with shorter regrowth periods in spring–summer seasons (39±20 d) and longer regrowth periods in autumn–winter seasons (100±60 d). During spring–summer seasons (i.e., April to September), about four mowing/grazing events took place (about two to three events in extreme dry years of 2018 and 2019). A slightly increasing trend (p=0.01) was found for the length of regrowth periods over the 20 years of the study: While the length of regrowth periods during the spring–summer seasons increased significantly (p<0.01), no significant trend was found during the autumn–winter seasons (p=0.87). Generally, longer regrowth periods corresponded to lower GPP and Reco. Overall, mean (± standard deviation) GPP during regrowth periods was 7.2 (±2.6) g C m−2 d−1 and Reco during regrowth periods was 6.6 (±2.5) g C m−2 d−1 (Fig. 3b–c). The average GPP and Reco during regrowth periods in spring–summer seasons were 8.6 (±1.4) and 7.9 (±1.6) g C m−2 d−1, respectively. In comparison, average GPP and Reco in autumn–winter seasons were 4.1 (±1.4) and 3.7 (±1.5) g C m−2 d−1, respectively. We did not observe any significant trend for GPP during regrowth periods over the 20 years (overall p=0.13), regardless of seasonality (spring–summer season: p=0.10; autumn–winter season: p=0.33). Similarly, Reco during regrowth periods did not change significantly over time (overall p=0.07), not during the spring–summer (p=0.08) nor the autumn–winter seasons (p=0.84).
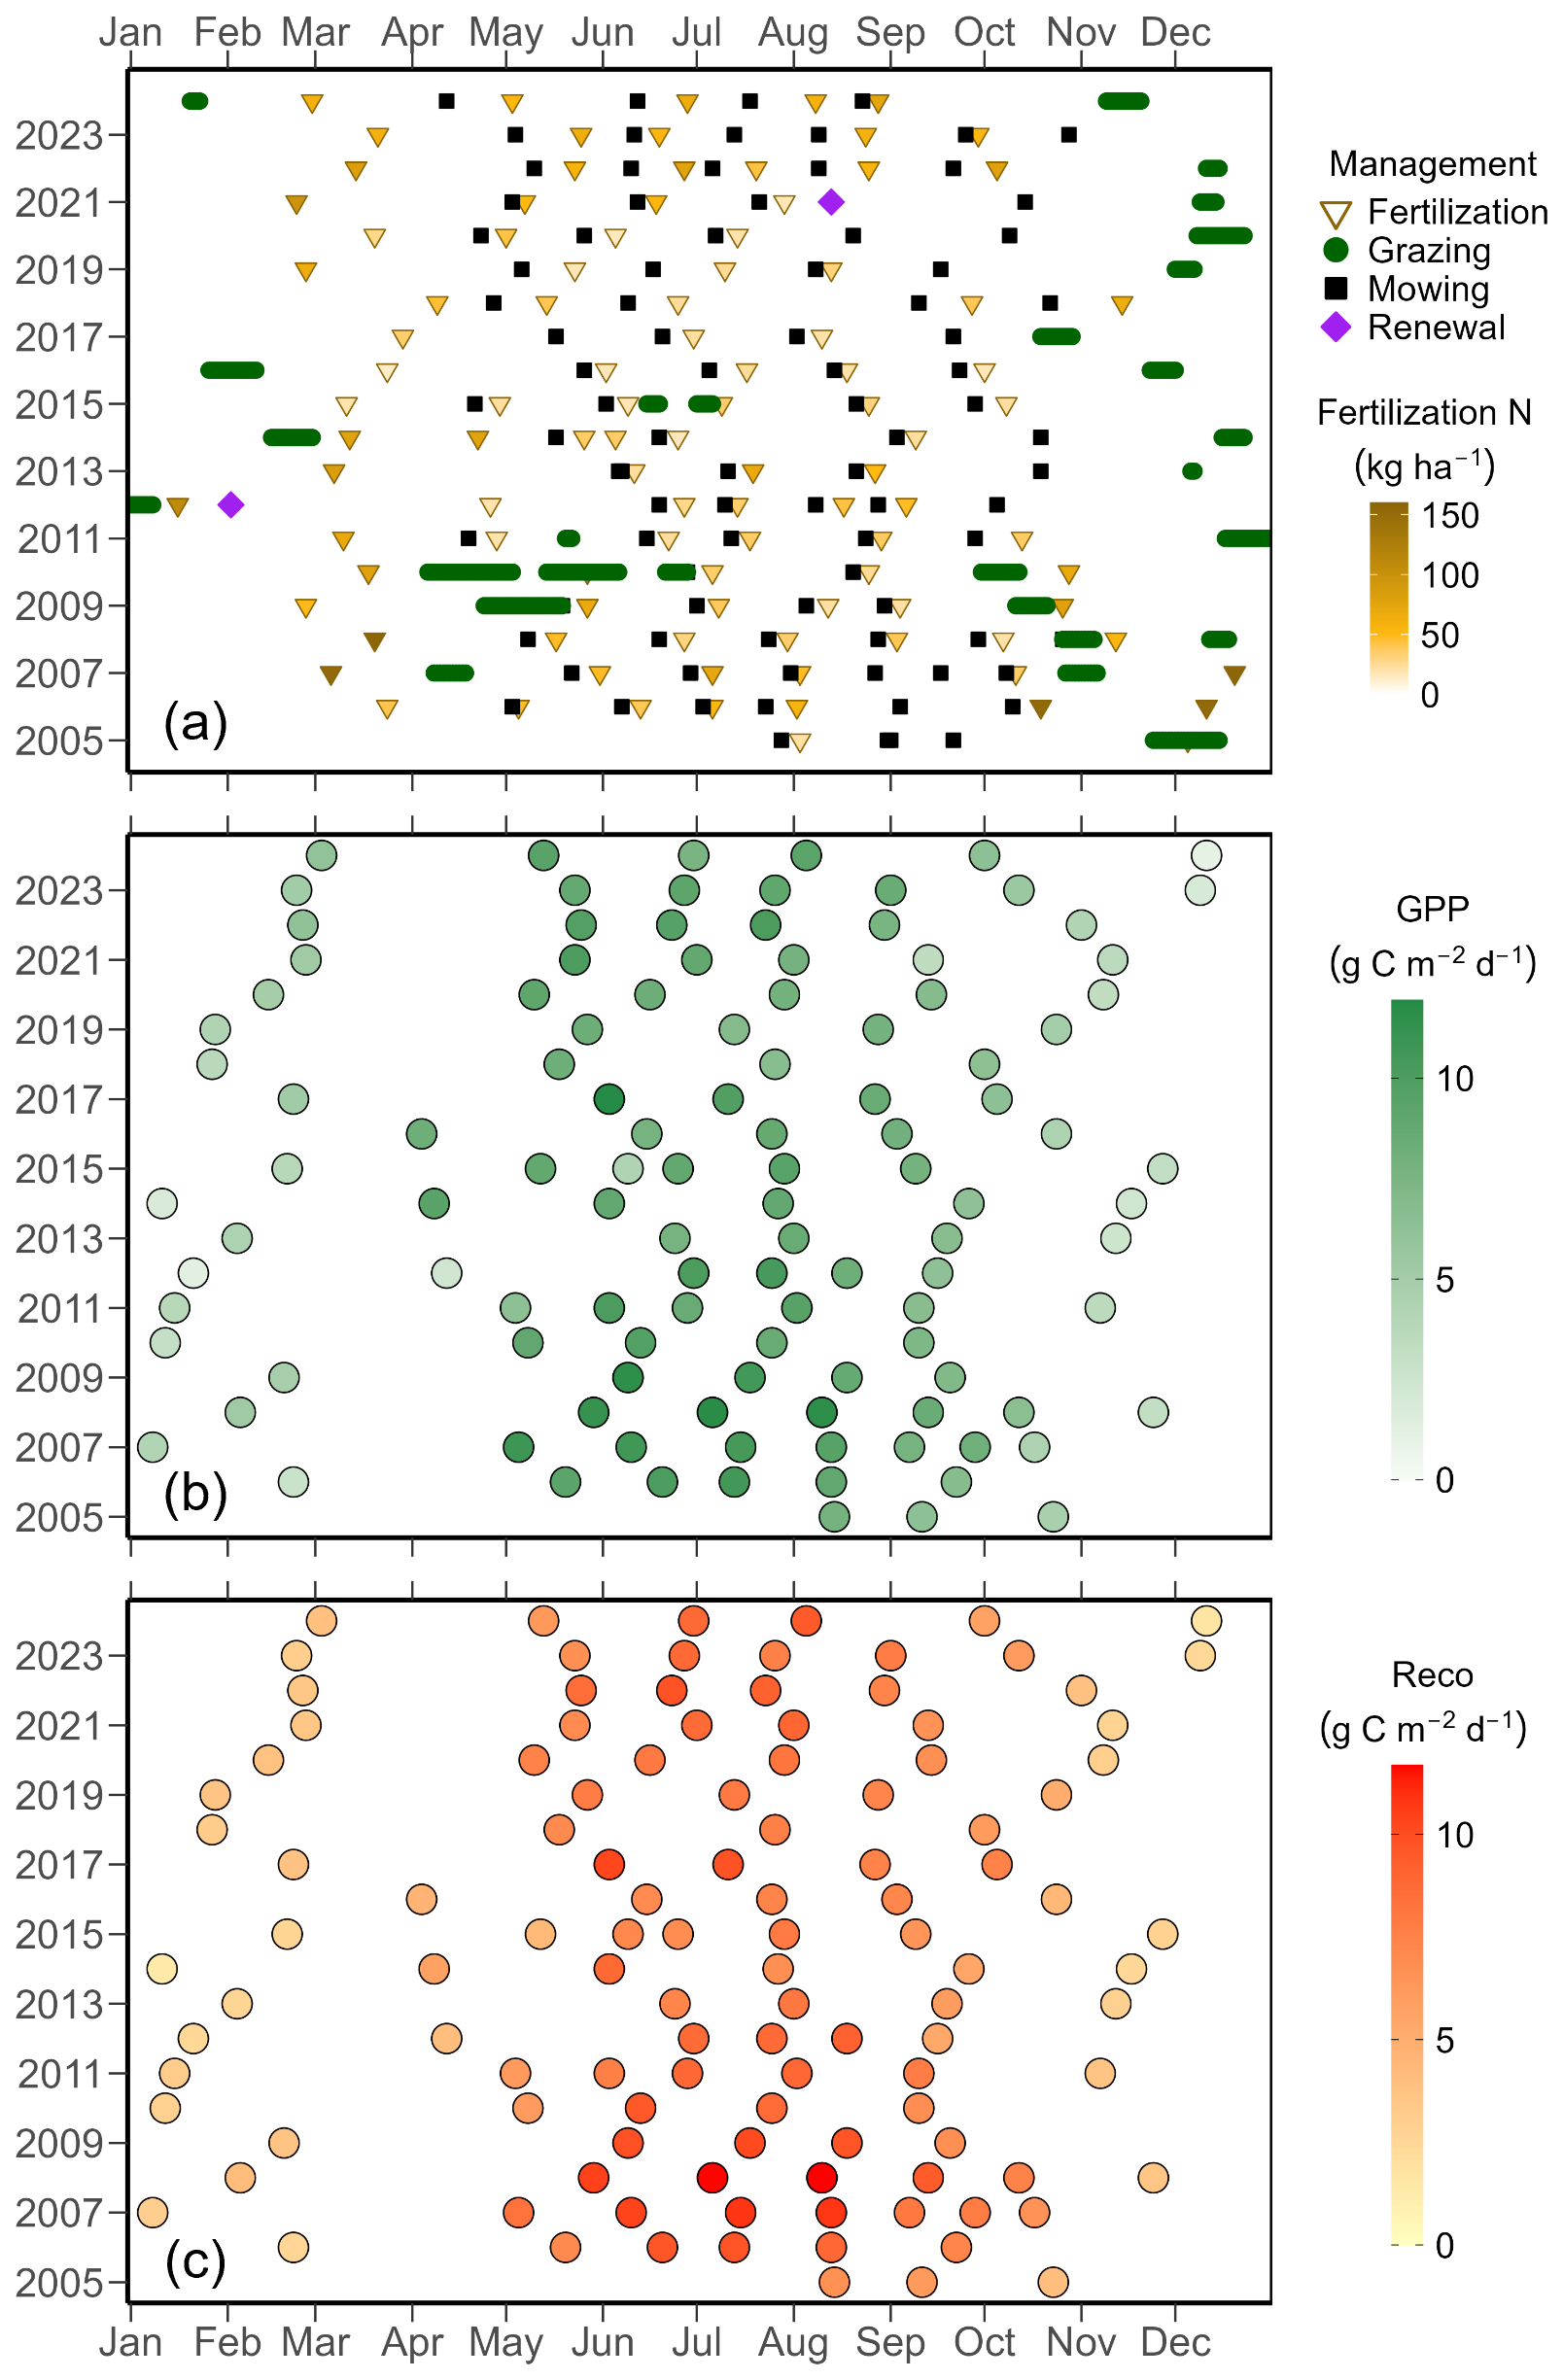
Figure 3Management events (a) and CO2 fluxes (b–c) during regrowth periods. (a) Major management events at the Chamau grassland site between July 2005 and December 2024. The x axis position of each point indicates the date of each event. Symbols represent different management activities: fertilization (brown triangles), mowing (black squares), grazing (green circles), and sward renewals (purple diamonds). Colours of fertilization triangles represent the amount of nitrogen inputs, with darker colours meaning higher inputs. The period between two mowing/grazing/sward renewal events was defined as a regrowth period (excluding the day(s) when management occurred). For grazing events, the start of any given grazing was defined as the end of the previous regrowth period, and the end of this grazing was considered the start of the next regrowth period. CO2 fluxes for (b) gross primary production (GPP) and (c) ecosystem respiration (Reco) for individual regrowth periods between 2005 and 2024. Points indicate GPP or Reco during a regrowth period, with the x axis position corresponding to the center of that period. Darker colours represent high GPP or Reco values.
3.3 Drivers of GPP and Reco
The XGBoost models for daily GPP and Reco performed well (Fig. A2), with a RMSE for GPP of 1.2 g C m−2 d−1 and an R2 of 0.91 on the testing set (Fig. A2a). The performance of the Reco models was better, with a RMSE of 0.6 g C m−2 d−1 and R2 of 0.96 on the testing set (Fig. A2c). The three most important drivers for daily GPP were PPFD, TS, and DaySinceUse (Fig. A2b), while the three most important drivers for daily Reco were TS, GPP, and DailyN (Fig. A2d).
For both GPP and Reco, the drivers showed strong seasonality over the 20 years of the study (Fig. 4; SHAP analysis 1). PPFD and temperature normally increased GPP in summer compared to the overall mean, while low light and low temperature conditions in winter decreased GPP compared to the mean (Fig. 4a). At daily scale, higher PPFD (Fig. A3a) and higher TS (Fig. A3b) had more positive effects on GPP than lower PPFD and lower TS (i.e., SHAP values of both drivers generally increased (and then saturated for TS) with increasing magnitude of the driver values). When averaged over the entire regrowth period, management events (i.e., mowing and grazing, represented by DaySinceUse) typically had a negative effect (i.e., negative SHAP values) on GPP compared to the overall mean GPP (Fig. 4a). However, at daily scale (Fig. A3c), SHAP values for DaySinceUse were first negative, but then steadily increased towards positive before becoming stable after around 20 d, indicating that GPP increased the more time had passed since the last management event. Compared to the main drivers of GPP (light, temperature, and management), water-related drivers (i.e., SWC, VPD, and PREC) had relatively smaller contributions and showed a less strong seasonality. However, during the extreme summers (i.e., 2018, 2019, 2022, and 2023), SWC increasingly limited GPP (negative SHAP values compared to normal years). The main drivers of Reco, i.e., TS and GPP, showed a similar seasonality, with higher TS and higher GPP in summer generally promoting respiration, while in winter, these drivers limited Reco (Fig. 4b). At daily scale, the effects of these two drivers on Reco became more positive with higher TS (Fig. A3d) and higher GPP (Fig. A3f). Compared to the drivers of GPP, fertilizer N inputs were more important for Reco than DaySinceUse, while water-related drivers had relatively low importance and smaller effects on Reco. During the extreme summers when low SWC occurred, negative effects of SWC on Reco were more obvious in 2022 and 2023 compared to earlier years (e.g., 2018 and 2019).
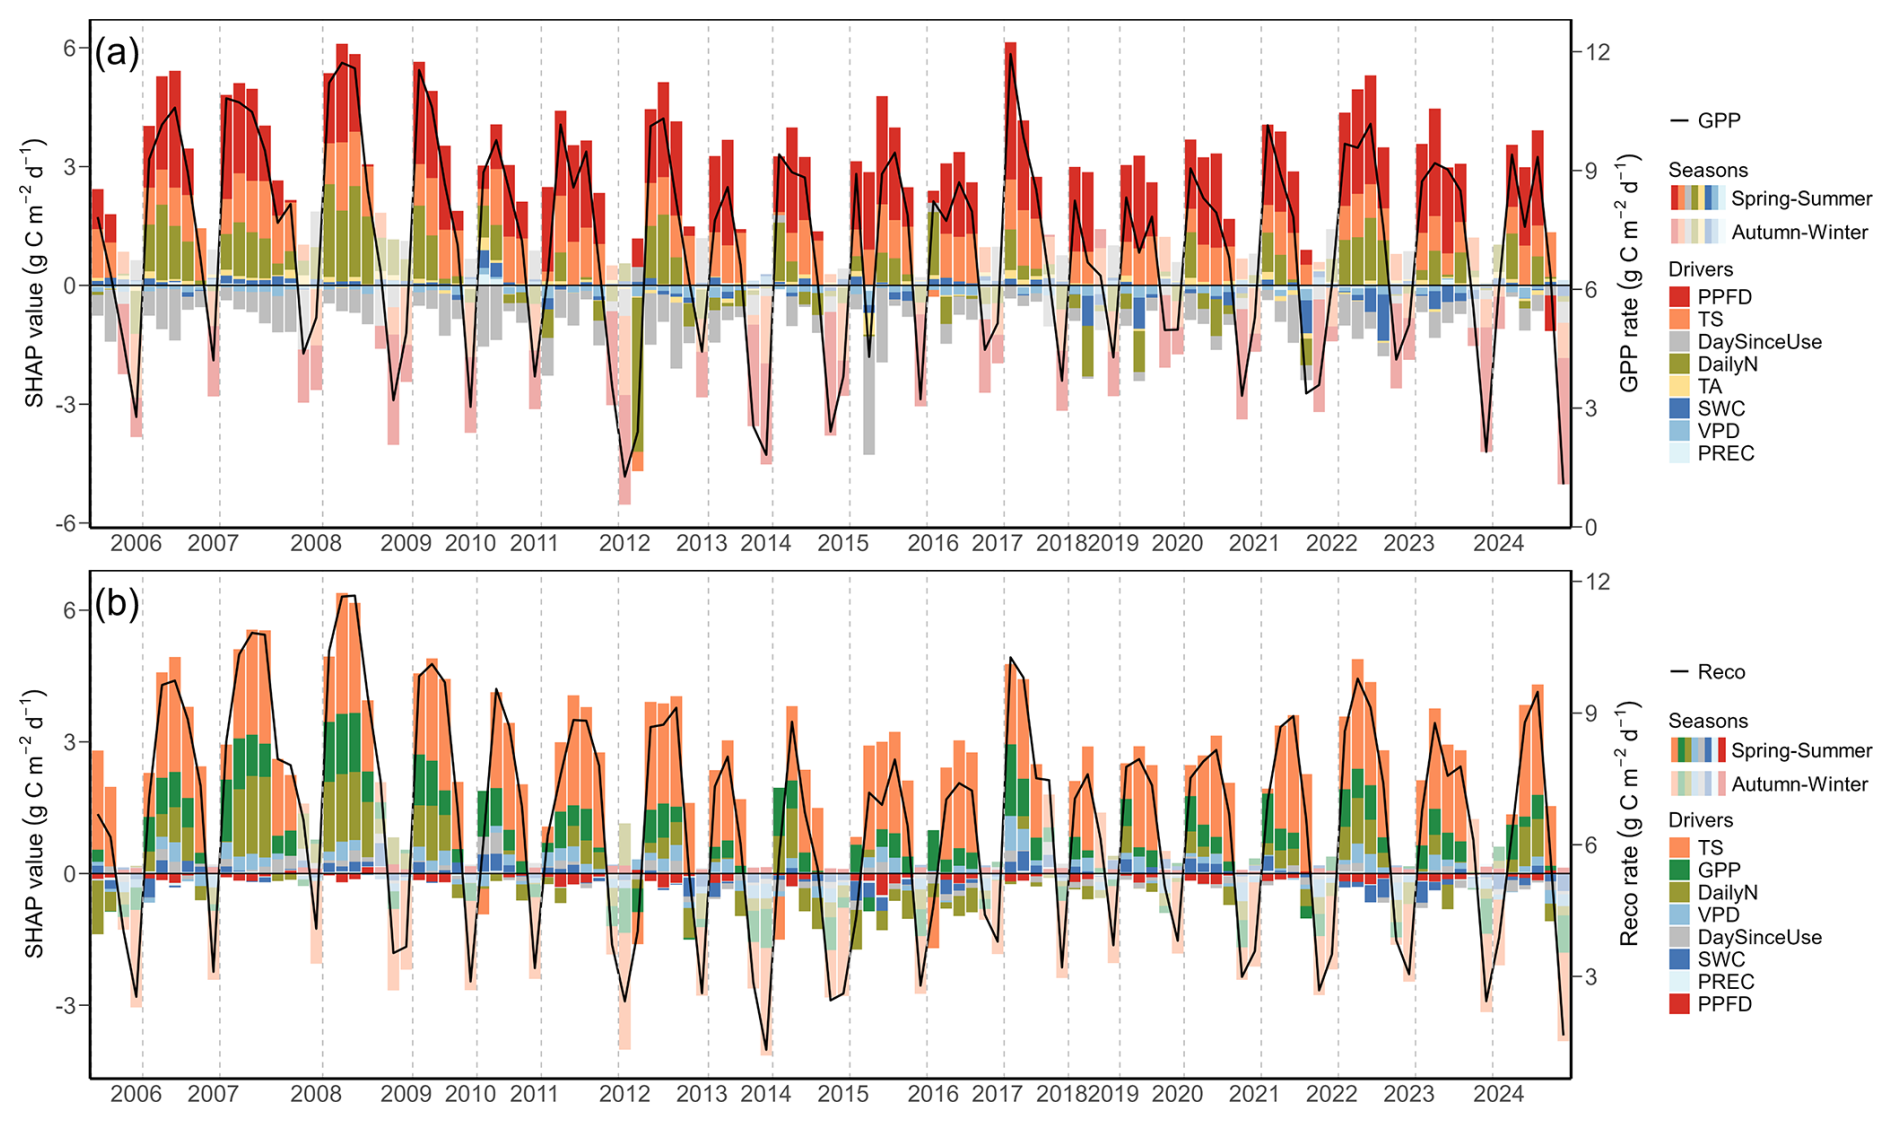
Figure 4Drivers of (a) gross primary production (GPP) and (b) ecosystem respiration (Reco) for all regrowth periods during the years 2005 to 2024 from SHAP analysis 1. Each stacked bar represents mean SHAP values of drivers from the overall XGBoost model, presented for each regrowth period: total photosynthetic photon flux density (PPFD, red), soil temperature (TS, orange), air temperature (TA, yellow), volumetric soil water content (SWC, dark blue), vapour pressure deficit (VPD, blue), precipitation (PREC, light blue), daily fertilizer nitrogen input (DailyN, moss green), day since last mowing, grazing or renewal (DaySinceUse, grey), and gross primary production (GPP, green). The overall mean prediction for all years at SHAP value zero corresponds to a GPP of 6.1 g C m−2 d−1 and Reco of 5.3 g C m−2 d−1. Positive SHAP values represent positive effects of drivers on GPP and Reco relative to the mean prediction, while negative values indicate negative effects from the mean prediction. GPP and Reco during each regrowth period are shown as black lines. Bars with full opaque colours indicate regrowth periods in the spring–summer season (April–September). Bars with more transparent colours indicate regrowth periods in the autumn–winter season (October–March).
3.4 Functional relationships between PPFD and GPP
Focusing on the years with exceptional management during the 20 years of this study, i.e., the renewal years 2012 and 2021, we tested the functional relationships between PPFD and GPP for the two years before and after the renewal years vs. all other normal years (Fig. 5). During all periods, GPP increased with mean daily PPFD, while maximum GPP (GPPmax, i.e., the maximum of the curves in Fig. 5) was reached at a PPFD of about 30 mol m−2 d−1 (for years before the renewals) or at about 45 mol m−2 d−1 (for all other normal years and years after the renewals). Moreover, spring–summer seasons in all years showed rather similar average GPP during regrowth periods: 8.2 g C m−2 d−1 before the renewal years, 8.6 g C m−2 d−1 after the renewal years, and 8.9 g C m−2 d−1 for normal years. However, GPPmax was lower before the renewal years (8.5 g C m−2 d−1) compared to normal years (9.7 g C m−2 d−1) and years after the renewals (9.3 g C m−2 d−1), despite the fact that the two years (2022 and 2023) after the second renewal (2021) experienced more extreme weather conditions during summer than the normal years (Fig. 2).
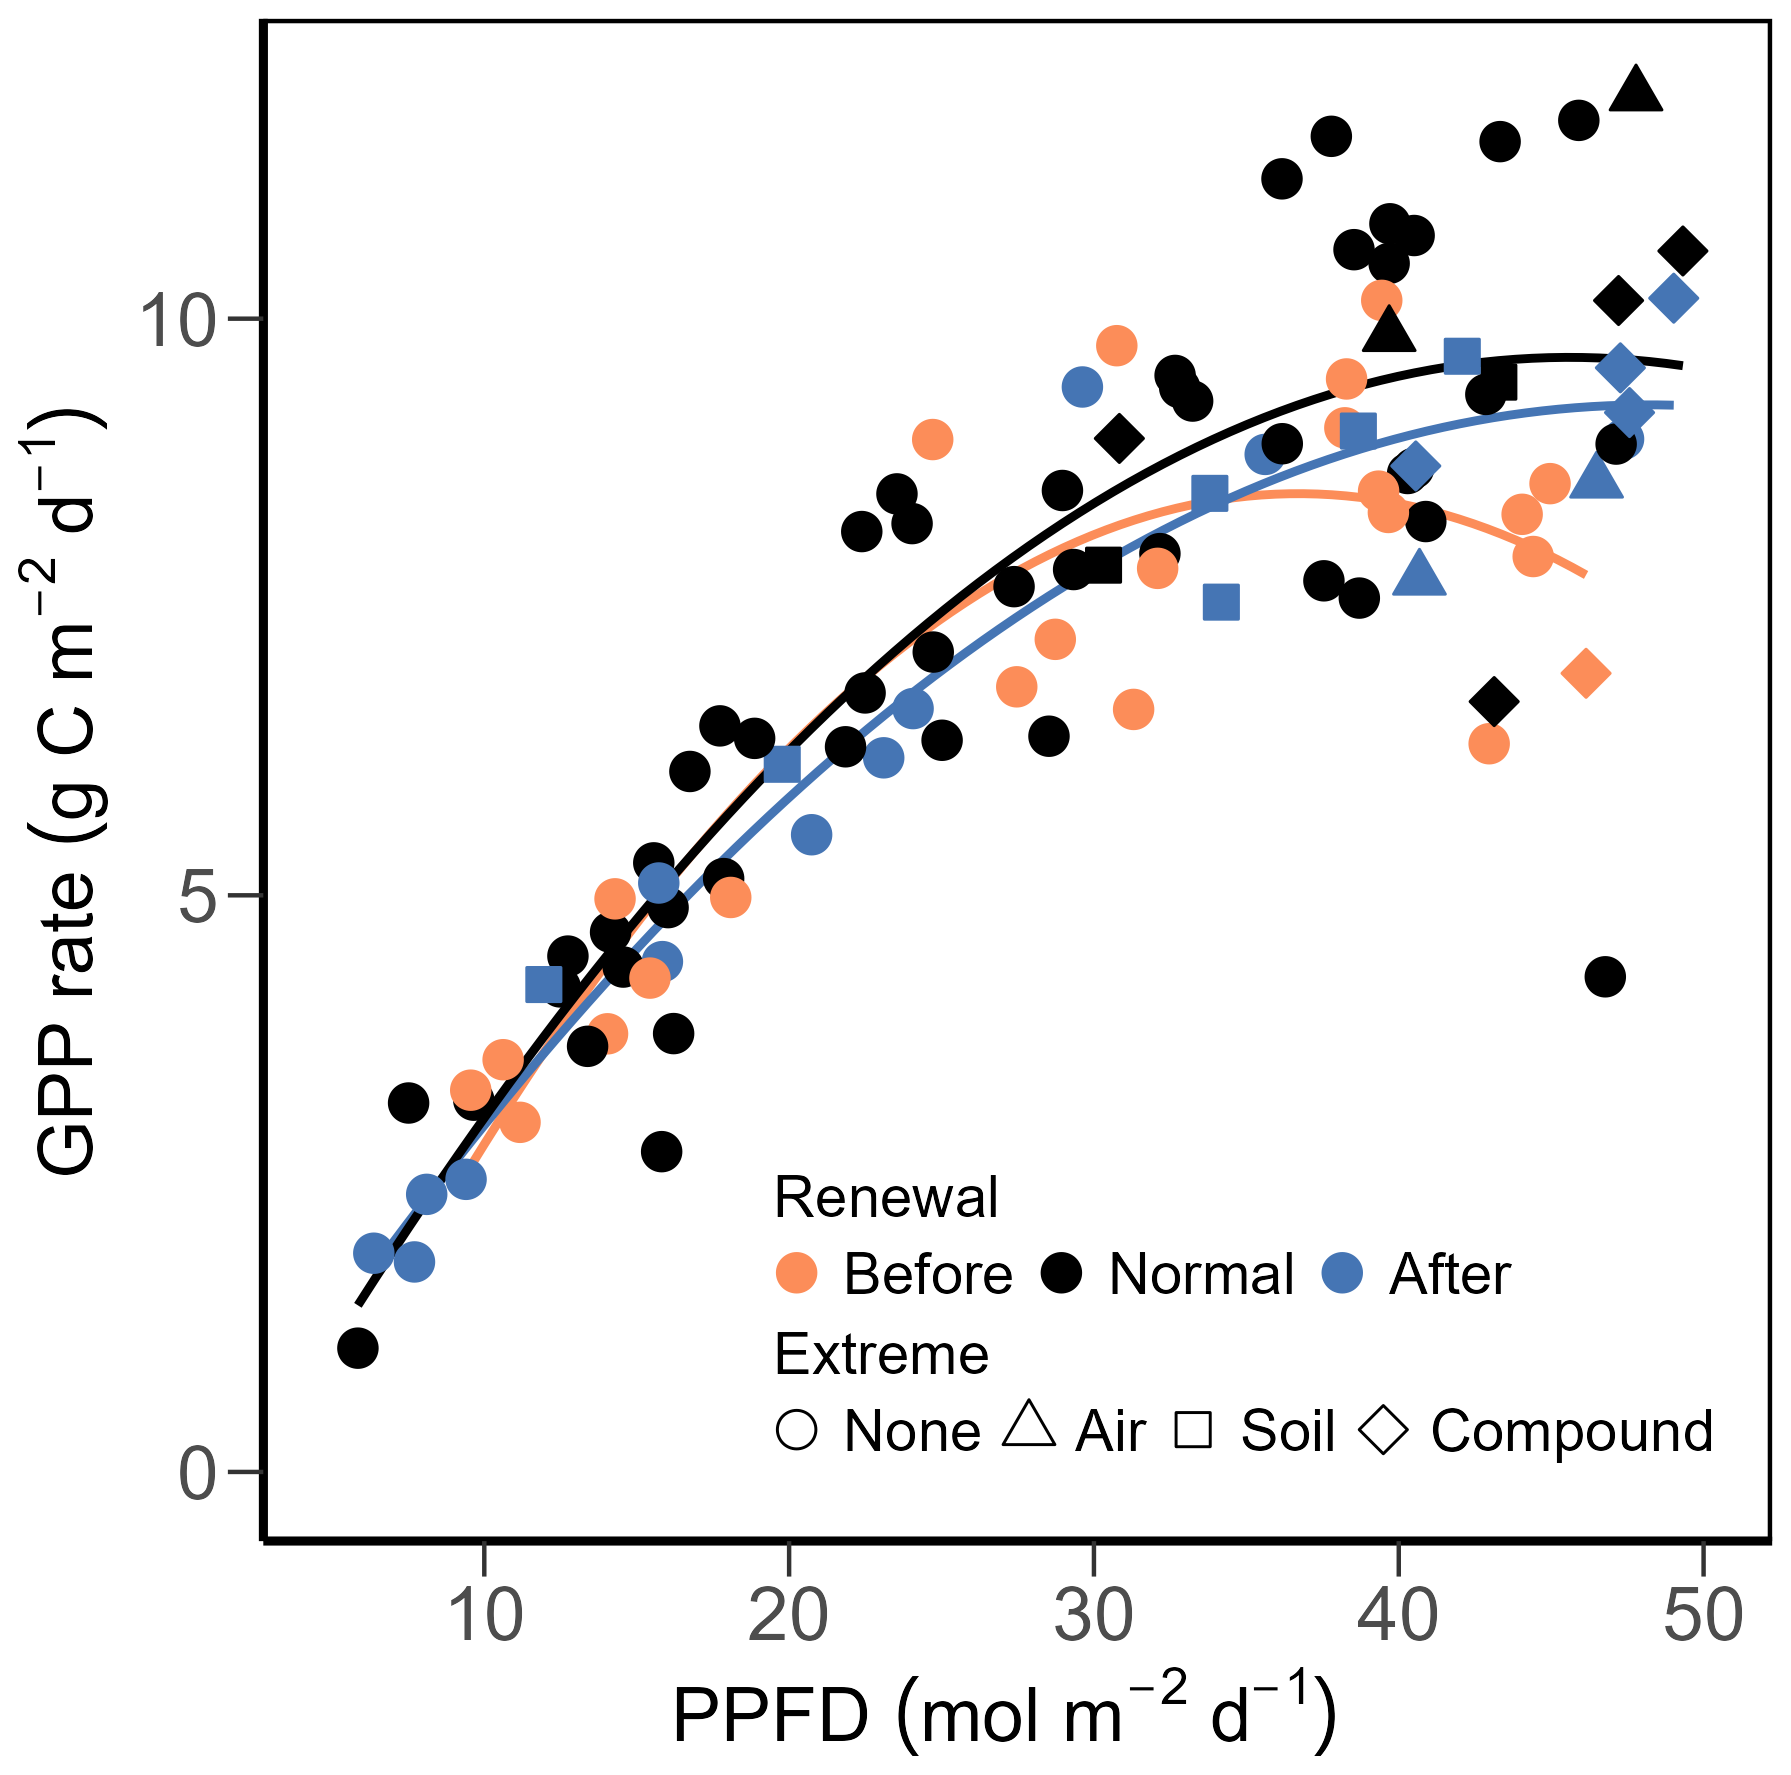
Figure 5Relationships between mean photosynthetic photon flux density (PPFD) and gross primary production (GPP) during regrowth periods between 2005 and 2024, excluding the renewal years (2012 and 2021). Two years before the renewal years (i.e., 2010 and 2011; 2019 and 2020) are presented in orange; two years after the renewal years (2013 and 2014; 2022 and 2023) are shown in blue, while the remaining years are shown in black. Regrowth periods that spanned across extreme months (as shown in Fig. 2) are shown in different shapes: high air dryness (triangles), high soil dryness (squares), and compound air and soil dryness (diamonds). Second-degree polynomial fits are shown in solid lines, with the same colour code as for the years.
3.5 Temporal development of GPP drivers during extreme months
Focusing on years with extreme summer months (i.e., July and August of 2018, July of 2019, July of 2022, and June of 2023; Fig. 2), we found normal daily PPFD (Fig. 6a), but significantly higher-than-normal daily TA, TS and VPD, accompanied by lower-than-normal SWC (Fig. 6b, c). Mean monthly TA in July 2018, 2019, 2022 was 1.2, 1.2, and 1.1 °C above the 20-year monthly average (19.6 °C), respectively, and 1.8 °C higher in August 2018 compared to 20-year monthly average (18.6 °C). All extreme summer months had SWC more than 10 % lower than the 20-year monthly averages. Daily GPP during the peak growing seasons (June, July, August) in 2018 and 2019 (i.e., years before the second renewal) was smaller than the mean predicted GPP of non-extreme months during the peak growing seasons of normal years (9.7 g C m−2 d−1), while GPP in 2022 and 2023 (i.e., years after the second renewal) was more dynamic, ranging from 1.3 to 15.5 g C m−2 d−1 (Fig. 6d). Mowing and fertilization events were also more frequent in the recent years (2022, 2023) compared to earlier years (2018, 2019), accompanied by higher amounts of N input. In contrast to the findings over all 20 years (Fig. 4), management-related drivers, i.e., DailyN and DaySinceUse, gained higher importance during the extreme summer months, while PPFD lost importance (Fig. 6d). In addition, SWC surpassed TS in importance, and its limiting effect on GPP was clearly seen in all four extreme summers, stronger in 2018 and 2019 than in 2022 and 2023. However, effects of fertilizer N inputs on GPP differed during the four summers: In 2018 and 2019 (i.e., years before the renewal in 2021), N fertilization effects acted similarly to SWC (both drivers having negative SHAP values), suggesting low N availability during low SWC periods, while in 2022 and 2023 (i.e., years after the renewal in 2021), fertilizer N inputs increased GPP (positive SHAP values) despite low SWC values. The relationship between SWC and its SHAP values for GPP during those four extreme summers showed a clear trend with limitation of GPP at low SWC (negative SHAP values; Fig. A4). This limitation of GPP by SWC was stronger in the years 2018 and 2019 (before the renewal; lowest SHAP values) compared to the years 2022 and 2023 (after the renewal in 2021).
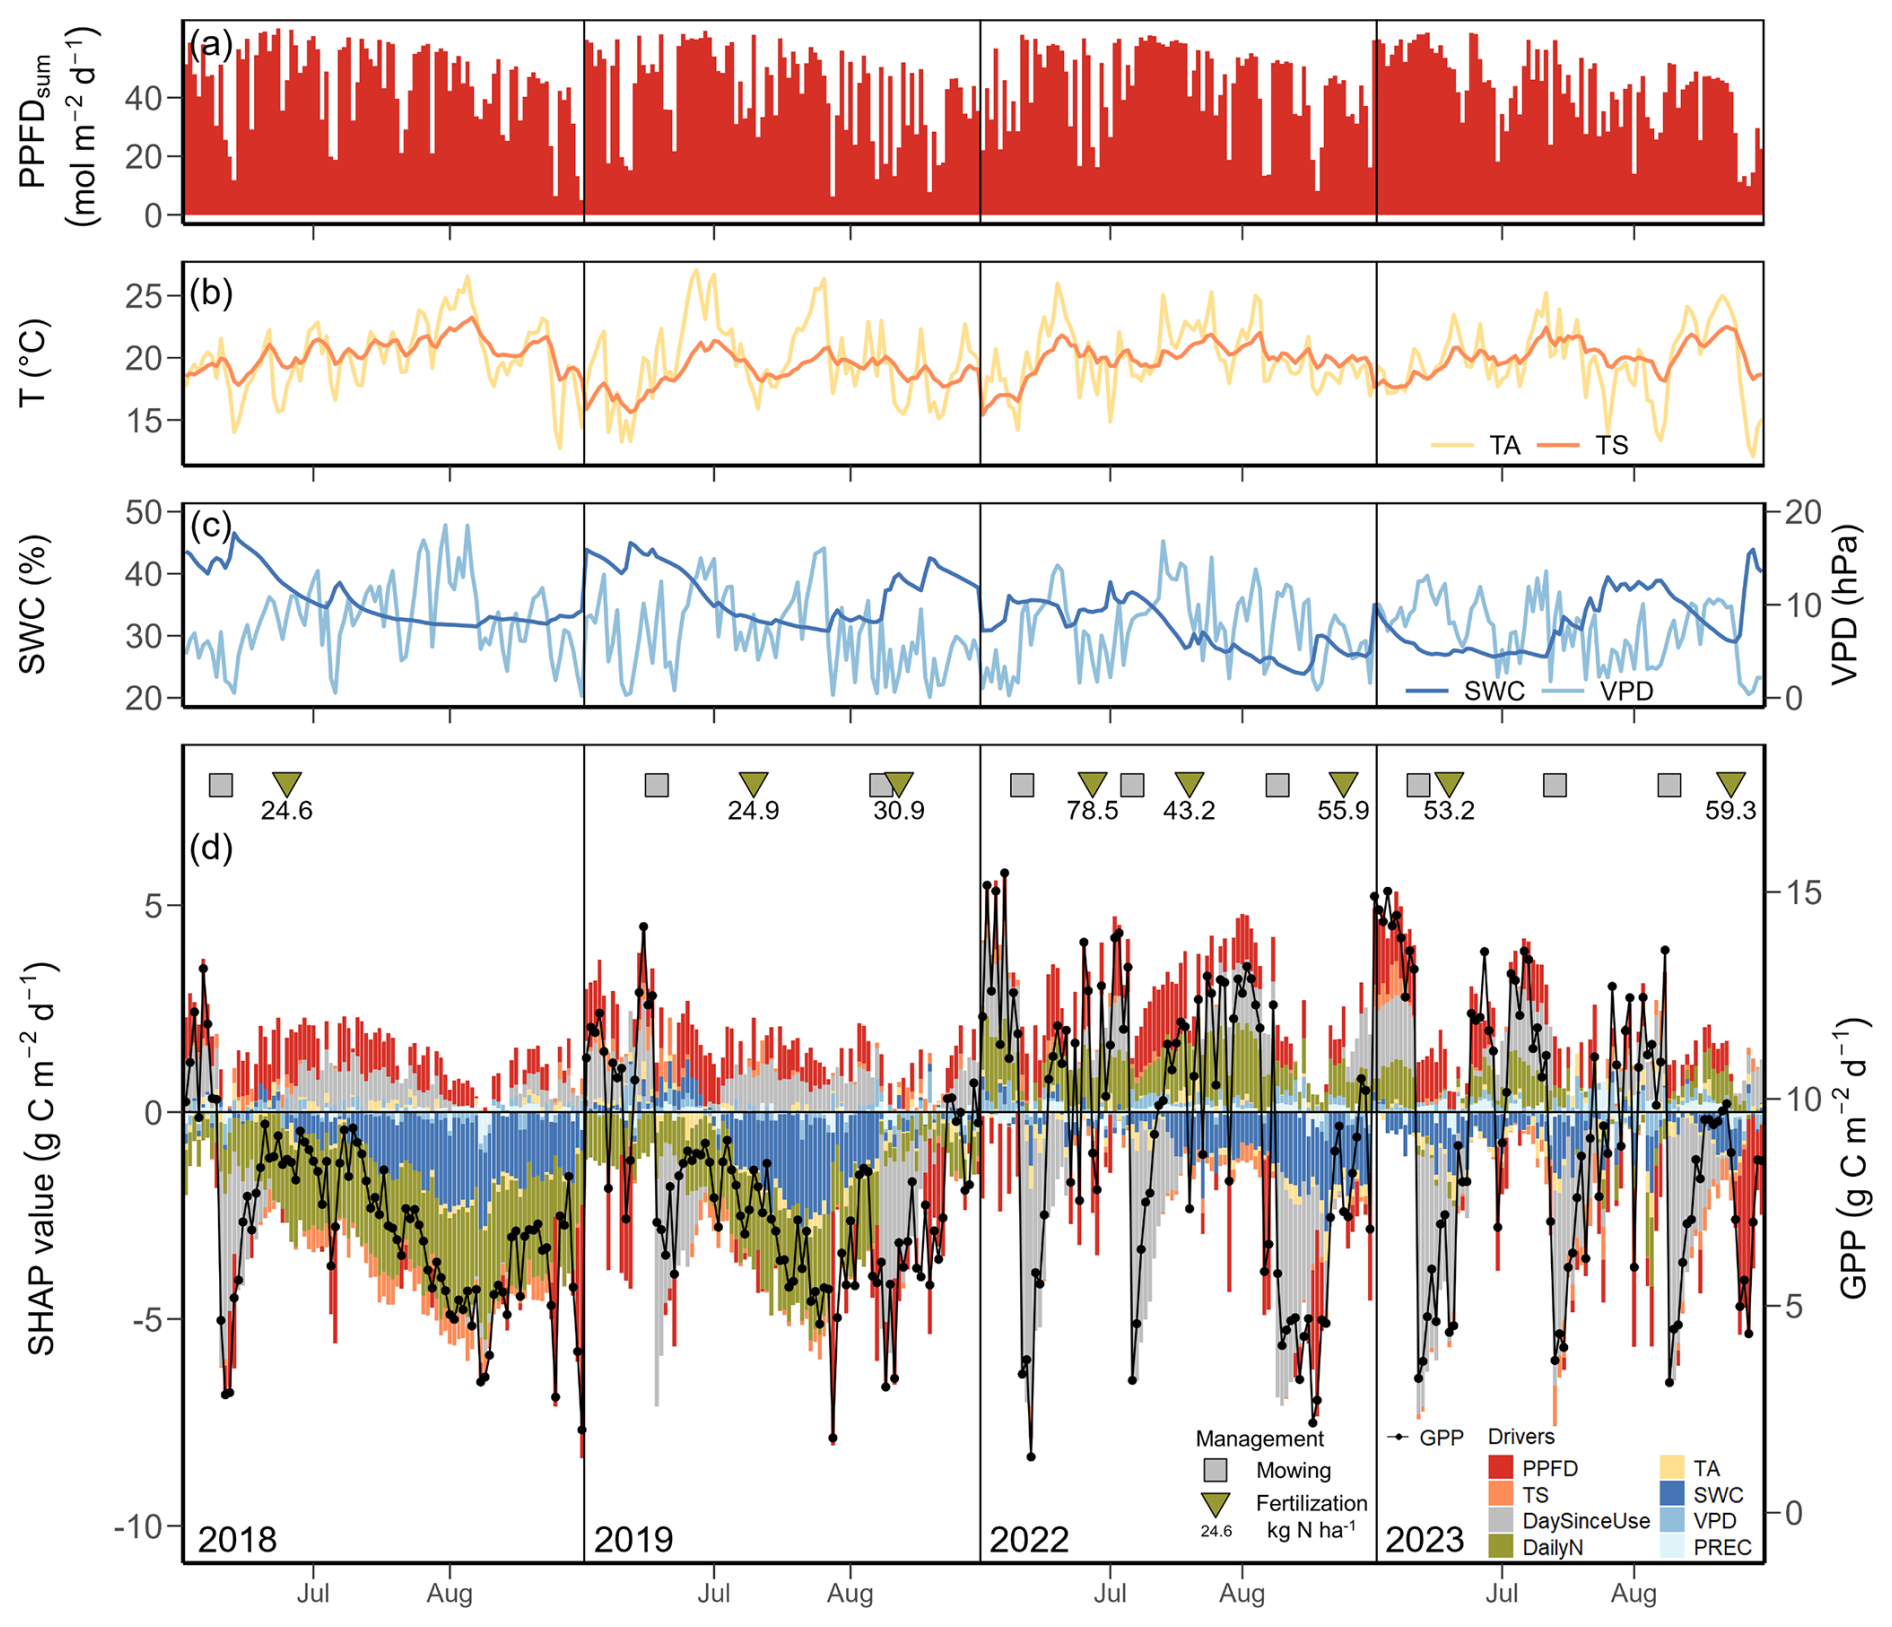
Figure 6Meteorological conditions and drivers of gross primary production (GPP) for days in the peak growing seasons (June, July, August) during the extreme years 2018, 2019, 2022, and 2023 from SHAP analysis 2. (a) Daily total photosynthetic photon flux density (PPFDsum), (b) daily mean air temperature (TA, yellow line) and soil temperature (TS, orange line), (c) daily mean volumetric soil water content (SWC, dark blue line) and vapour pressure deficit (VPD, light blue line), (d) daily GPP (black dot-line) and SHAP values of each driver (stacked bar) are given. Colours of the bars represent different drivers: photosynthetic photon flux density (PPFD, red), soil temperature (TS, orange), air temperature (TA, yellow), soil water content (SWC, dark blue), vapour pressure deficit (VPD, blue), precipitation (PREC, light blue), day since last mowing, grazing or renewal (DaySinceUse, grey), and daily fertilizer nitrogen input (DailyN, moss green). The mean prediction of GPP during non-extreme months in peak growing seasons (June, July, August) at SHAP value zero corresponds to a GPP of 9.7 g C m−2 d−1. The years 2018 and 2019 were before the grassland renewal in 2021, the years 2022 and 2023 after the grassland renewal. Positive SHAP values represent positive effects of drivers on GPP relative to the mean prediction, while negative values indicate negative effects from the mean prediction. Symbols in the top of panel (d) represent management events during these months: mowing (squares) and fertilization (triangles). Numbers under the triangles give the amount of total fertilizer nitrogen (N) input. The x axis position of each symbol indicates the date of each event.
4.1 Intra- and inter-annual variations of CO2 fluxes and management during 20 years
Overall, CO2 fluxes (NEE, GPP, and Reco) at the Chamau grassland site showed significant intra- and inter-annual variations (Figs. 1e, A1), with sometimes higher inter-annual variation (, 2193±263, 1934±244 g C m−2 yr−1 for NEE, GPP and Reco, respectively) than reported earlier for managed grasslands (e.g., Ammann et al., 2020; Heimsch et al., 2021, 2024; Peichl et al., 2011; Rogger et al., 2022). Reasons for these differences are manifold, considering that our study spanned two decades of measurements (2005 to 2024). Besides short-term changes introduced from meteorological conditions and frequent management events, we also captured the impacts of multiple extreme periods, particularly dry and hot summer months in 2018, 2019, 2022, and 2023 (Fig. 2), a six-year N2O mitigation experiment with reduced organic fertilization (2015 to 2020; Feigenwinter et al., 2023a; Fuchs et al., 2018), as well as infrequent management practices such as two complete sward renewals (in 2012 and 2021; Feigenwinter et al., 2026; Merbold et al., 2014), all contributing to the highly dynamic nature of ecosystem CO2 fluxes observed at our site.
With climate change, GPP of terrestrial vegetation has been observed and predicted to increase (Keenan et al., 2014; Knauer et al., 2023; Myneni et al., 1997; Piao et al., 2007) due to CO2 fertilization, increasing temperature, and longer growing seasons favouring photosynthesis, unless other resources become limiting, such as water or nutrients (He et al., 2017; Keenan et al., 2023; Madani et al., 2020; Terrer et al., 2019; Xu et al., 2019). Often, studies focused on natural unmanaged ecosystems or forests at regional and global scales (Anav et al., 2015; Cai and Prentice, 2020; Davi et al., 2006; Norby et al., 2010), but studies on grasslands also observed increasing trends in GPP and Reco with higher temperature in the past (Shi et al., 2022; Wang et al., 2019). These studies were often based on experiments in less intensively managed or even unmanaged grasslands, consequently with less intervention potential for farmers or land managers. In contrast, despite significant increases in mean annual TA of around 1.4 °C over the past 20 years and decreases in SWC during late summer and autumn months (Table A4), we did not observe significant trends in GPP nor Reco of our intensively managed grassland (Fig. 3b–c). This clearly indicates that despite observed climate change, the farmer managed to maintain GPP during regrowth periods and forage production over the past two decades, also seen in the harvest exports reported by Feigenwinter et al. (2023b) for the same site (335±42 g C m−2 yr−1 between 2005 and 2020). The local farmer adapted management practices, e.g., skipped individual harvests in extreme years (e.g., 2018), thereby extending the regrowth periods (Fig. 3a). These detailed adjustments are typically difficult to capture by standard large-scale models and coarse-resolution management datasets, demonstrating that management information at high spatio-temporal resolution is crucial to reliably model GPP of agricultural systems. However, management data at high temporal resolution is difficult to obtain, therefore large-scale modelling studies often use harmonized datasets at annual time scales (Winkler et al., 2021), potentially introducing substantial bias in modelled GPP.
In addition, infrequent management events such as sward renewals, carried out every 5–15 years depending on vegetation composition and soil texture (Schils et al., 2007; SUPER-G, 2018), are typically not considered in C cycle models, partially due to lack of information about their occurrence but also simply due to lack of data for such events. The observed differences in annual NEE during the two renewal events at the Chamau grassland (139 vs. −163 g C m−2 yr−1 for 2012 and 2021, respectively; Fig. A1) might be explained by differences in seasons (February 2012 versus August 2021) and soil disturbance intensities (ploughed at 20 cm in 2012 and 3–4 cm in 2021), which subsequently influenced the establishment and regrowth of the new sward. Other studies in managed grasslands have also reported different magnitudes of CO2 fluxes after renewal, influenced by timing, intensity, and environmental conditions of the renewal events (Ammann et al., 2020; Drewer et al., 2017; Li et al., 2023b). Such observations, albeit rare, are impactful in terms of C dynamics and underscore the necessity to include such infrequent destructive management practices in long-term flux studies as well as modelling frameworks.
4.2 Temporal development of driver contributions during regrowth periods using machine learning
NEE represents a combination of two large opposing fluxes, i.e., GPP and Reco, based on two physiological processes, i.e., photosynthesis and respiration, which respond differently to changing environmental conditions (Feigenwinter et al., 2023b; Peichl et al., 2011; Schwalm et al., 2010; Wang et al., 2019). Thus, using two separate machine learning models for GPP and Reco (XGBoost models with high performance, R2>0.9 on testing datasets), we identified their main drivers as well as the temporal development of daily driver contributions (SHAP analysis 1). Confounding effects from overlapping predictor variables were reduced by using a broader set of variables for the driver analysis compared to the gap-filling model. Daily aggregated data for the driver analysis (instead of half hourly as for gap-filling) furthermore reduced potential correlation among predictor variables. In contrast to other studies, we not only included high resolution meteorological data but also information about management events in our analyses at daily time scales. Consistent with previous studies (Gilmanov et al., 2007; Wohlfahrt et al., 2008), PPFD and temperature were the main drivers of GPP and Reco, respectively (Figs. 4, A2). However, management-related variables such as the number of days since the last management event and fertilizer N inputs were always among the top four to five important drivers for daily GPP and Reco, respectively. This highlights their importance for a comprehensive understanding of C dynamics and greenhouse gas fluxes in managed grasslands (Hörtnagl et al., 2018). By using time since the last management event (i.e., DaySinceUse) as a driver, we incorporated the management information into the models in a relatively straightforward way. However, the simplification of our approach should also be recognised: Rather than acting as a direct ecophysiological driver, DaySinceUse serves as a temporal index that tracks the time elapsed since the most recent management intervention (e.g., mowing or grazing). By establishing this temporal relation for each data record, the model can account for the recovery dynamics and residual effects of management that are otherwise omitted from standard meteorological drivers. The machine learning analyses also picked up the smaller effects of fertilizer N inputs as a driver for GPP during the N2O mitigation experiment (2015 to 2020), when organic fertilization – and thus N inputs – was replaced with higher fractions of legumes for half of the area (Feigenwinter et al., 2023a; Fuchs et al., 2018). Since the majority of temperate grasslands in Europe are actively managed (Eurostat, 2023), long-term and detailed management information, combined with more field observational measurements such as EC fluxes, can support improved management strategies to enhance grassland ecosystem services under changing climate (Wang et al., 2025). Although detailed management information has been used successfully in our XGBoost models, we also acknowledge the limitation from our simplified representation of N fertilization on the daily scale. We represented N availability after fertilization by distributing the total N applied evenly across the regrowth period (see Sect. 2.2), although the actual temporal dynamics of N availability most likely follow a more complex pattern, involving different processes and drivers such as soil properties, precipitation, soil moisture and temperature but also microbial activity. However, such data are very rare, and model assumptions can thus often not be validated due to insufficient evidence in the existing literature. While we employed a simplified approach, we clearly recognize the need for remotely sensed or in-situ quantified daily N availability to further improve modelling of CO2 fluxes in managed grasslands.
Focusing on GPP and its most important driver PPFD, we further examined the physiological consequences of the two renewals in 2012 and 2021. Although the sward had shown a lower performance before the renewals (i.e., lower GPPmax, orange line, Fig. 5), compared to the following years with higher GPPmax (black and blue lines), the slopes of the light-response curves were very similar. Differences in GPPmax resulted in high net CO2 uptake rates after both renewals (average cumulative NEE of −465 g C m−2 yr−1 for 2013, 2014, 2022, and 2023) and also higher yields than before the renewals (Tables A1, A2). Thus, the farmer's decision to renew the grassland with a multi-species mixture was substantiated. Furthermore, frequent oversowing (Tables B1 and B2 in Feigenwinter et al., 2023b) might further help to maintain the preferred species composition and a stable yield. However, even though oversowing more diverse mixtures (Schaub et al., 2020) or increasing legume proportions (Fuchs et al., 2018) can improve yield quality and are less destructive management interventions than sward renewals, they can be costly (Schaub et al., 2021), and positive results are not always guaranteed. Therefore, adopting a combination of these observed management practices is a crucial first step towards more climate-smart farming practices, helping to ensure stable production and to sustain ecosystem services over the long term.
Besides consistent positive effects of light and temperature on GPP (Fig. 4a; red and orange bars), fertilizer N inputs (Fig. 4a; moss green bars) also promoted GPP during spring–summer seasons. Moreover, our analysis demonstrated the complex interactions between N inputs and soil water availability: the positive effects of N on GPP diminished in drier years (e.g., 2018, 2019) or even became negative, indicating lower soil N availability and thus lower N uptake for GPP when soil moisture was low (Bloor and Bardgett, 2012; Hartmann et al., 2013). For Reco, negative effects of N inputs were more obvious during the spring–summer seasons 2015 to 2020 (Fig. 4b), i.e., when the N2O mitigation experiment was ongoing, and the entire site received around half of fertilizer N input compared to other years (Feigenwinter et al., 2023a; Fuchs et al., 2018). Without N inputs via organic fertilizer (mostly slurry), the organic C inputs and the C sink strength were reduced as well (Feigenwinter et al., 2023b). This resulted in less C available for microbial soil respiration, which was also reflected in lower Reco during regrowth periods in spring–summer seasons during the N2O mitigation experiment (7.4±1.3 g C m−2 d−1) compared to Reco in years with normal management (8.2±1.7 g C m−2 d−1).
Overall, being purely data-driven and highly site-dependent, the combination of machine learning models and SHAP analysis confirmed the highly dynamic nature of the drivers influencing GPP and Reco and also revealed the complexity of their individual contributions across temporal scales. Compared to traditional linear models, these new approaches not only captured the non-linear and combined effects among drivers at high temporal resolution (here daily), but also provided explanatory outputs such as driver importance on a daily basis, which enhanced interpretability of the machine learning models and further improved our understanding of these complex grassland systems.
4.3 Drivers during extreme growing seasons
Using non-extreme summer months as the background dataset, SHAP analysis 2 focused on drivers of GPP only during extreme summer months, which minimized the confounding effects of strong seasonality in temperature and light conditions. This approach further improved the interpretability of our results, by isolating and focusing on the influence of extreme events-related factors such as SWC and VPD. Across all extreme periods, SWC strongly reduced GPP (SHAP analysis 2; Fig. 6d). In contrast, the effect of VPD was small (Fig. 6d), even on days with exceptionally high VPD values (Fig. 6c). This finding supported our long-term driver analysis (SHAP analysis 1; Fig. 4): here, SWC had a larger effect on GPP than VPD (mean absolute SHAP value of 0.6 for SWC and 0.2 for VPD during the peak growing seasons in 2018, 2019, 2022, and 2023), underscoring that soil water availability was more relevant for GPP than atmospheric water demand. This observation aligns well with previous studies reporting more significant negative effects of soil droughts (i.e., low SWC) on grassland CO2 fluxes compared to those of heatwaves (i.e., high VPD; Li et al., 2016, 2021). Our finding is also consistent with the behaviour seen during the 2003 summer drought (Teuling et al., 2010) and the 2018 summer drought (Gharun et al., 2020), during which grasslands sustained evapotranspiration (ET) and thus GPP, as long as water was available in the soil, much in contrast to forests which rapidly reduced canopy conductance and ET in response to high VPD.
The effects of fertilizer N inputs were more differentiated during these extreme periods compared to the overall 20-year time series. While N inputs showed mostly negative effects on GPP during the years 2018 and 2019 (i.e., during the N2O mitigation experiment and before the second renewal in 2021), effects of N inputs were typically positive during the years 2022 and 2023 (Fig. 6d). This suggests that after the second sward renewal in 2021, a resumed organic fertilization regime with a higher amount of fertilizer N input could further support recovery and increase regrowth rates after extreme periods (Hofer et al., 2017). Additionally, in response to the persistent droughts in 2018 and 2019 before the second renewal, the farmer delayed or skipped some mowing events (which typically occurred monthly during the peak growing season, Figs. 6d, 3a). In contrast, we observed even more frequent mowing events (three times between June and August) during 2022 and 2023 after the second renewal, which resulted in more regrowth periods and more variation in GPP compared to earlier years. While the first renewal in 2012 also resulted in increased productivity and forage yields (Feigenwinter et al., 2023b), our study clearly indicated that also after the second renewal in 2021 the new sward performed very well despite frequent and more intense extreme conditions in the two succeeding years, sustaining forage production also during such extreme summers.
Over the past two decades, Switzerland has experienced its hottest years on record (2022, 2023) and several extreme summers (e.g., 2018, 2022) (MeteoSwiss, 2023, 2024; Scherrer et al., 2022). In our study, we also observed consistent trends of rising temperature and frequent extreme summer months in recent years. The CO2 fluxes of this intensively managed grassland responded very dynamically to changes in meteorology and to the already climate-adjusted management practices implemented by the farmer. However, it is unclear whether such small adjustments will suffice when extreme events intensify in the future (CH2025, 2025; IPCC, 2023). Some evidence suggests that less intensive management may buffer grasslands against extreme impact (Winck et al., 2025), which would require a different sward composition, lower livestock density, and further adjusted management practices. Adopting a less intensive management scheme for a single grassland site in a short time period is challenging. Therefore, site-specific adaptation of management strategies for both short- and long-term is needed to mitigate current and future climate risks (Gilgen and Buchmann, 2009; Woo et al., 2022). Further management options, such as multi-species mixtures (Craven et al., 2016; Finn et al., 2018; Isbell et al., 2015; Wang et al., 2025) and spatially adjusted precision-farming (Finger et al., 2019), can offer additional highly site-specific solutions to maintain selected ecosystem services and support the resilience of grasslands against extreme events.
Using a long-term dataset of CO2 fluxes (NEE, GPP, Reco) and detailed management information, our study provided unique and novel insights into temporal dynamics of CO2 fluxes and their drivers. With state-of-the-art machine learning tools, we were able to identify and attribute the effects of different drivers, i.e., management and meteorological conditions, and their complex temporal dynamics, which would have been impossible with classical statistical approaches. While management-related drivers showed high importance for grassland CO2 fluxes, such information is unfortunately often lacking, creating large uncertainties in C cycle model simulations at all scales. Therefore, we call for reliable collection and sharing of management data according to FAIR (Findable, Accessible, Interoperable, and Reusable) principles, alongside the highly valuable long-term observational data. Open science strongly improves our understanding of these highly dynamic grassland systems and enables development of realistic solutions under future climate conditions. Moreover, based on two decades of measurements, our evidence suggests that the grassland farmer succeeded in managing the site with relatively stable GPP during regrowth periods, based on climate-smart adaptive management. With increasing climate risks, additional practices like multi-species mixtures and spatially adjusted management practices such as precision-farming, but also early warning systems for extreme events will become crucial to further enhance the resilience of grassland-based farming systems in the future.
Table A1Management events per parcel from 2021 to 2024, expanding Table B1 in Feigenwinter et al. (2023b). The number of each management activity in each year is indicated in round brackets. For grazing, the duration in days is given. Fertilizer N and C imports as well as total yields (from mowing and grazing) are given.
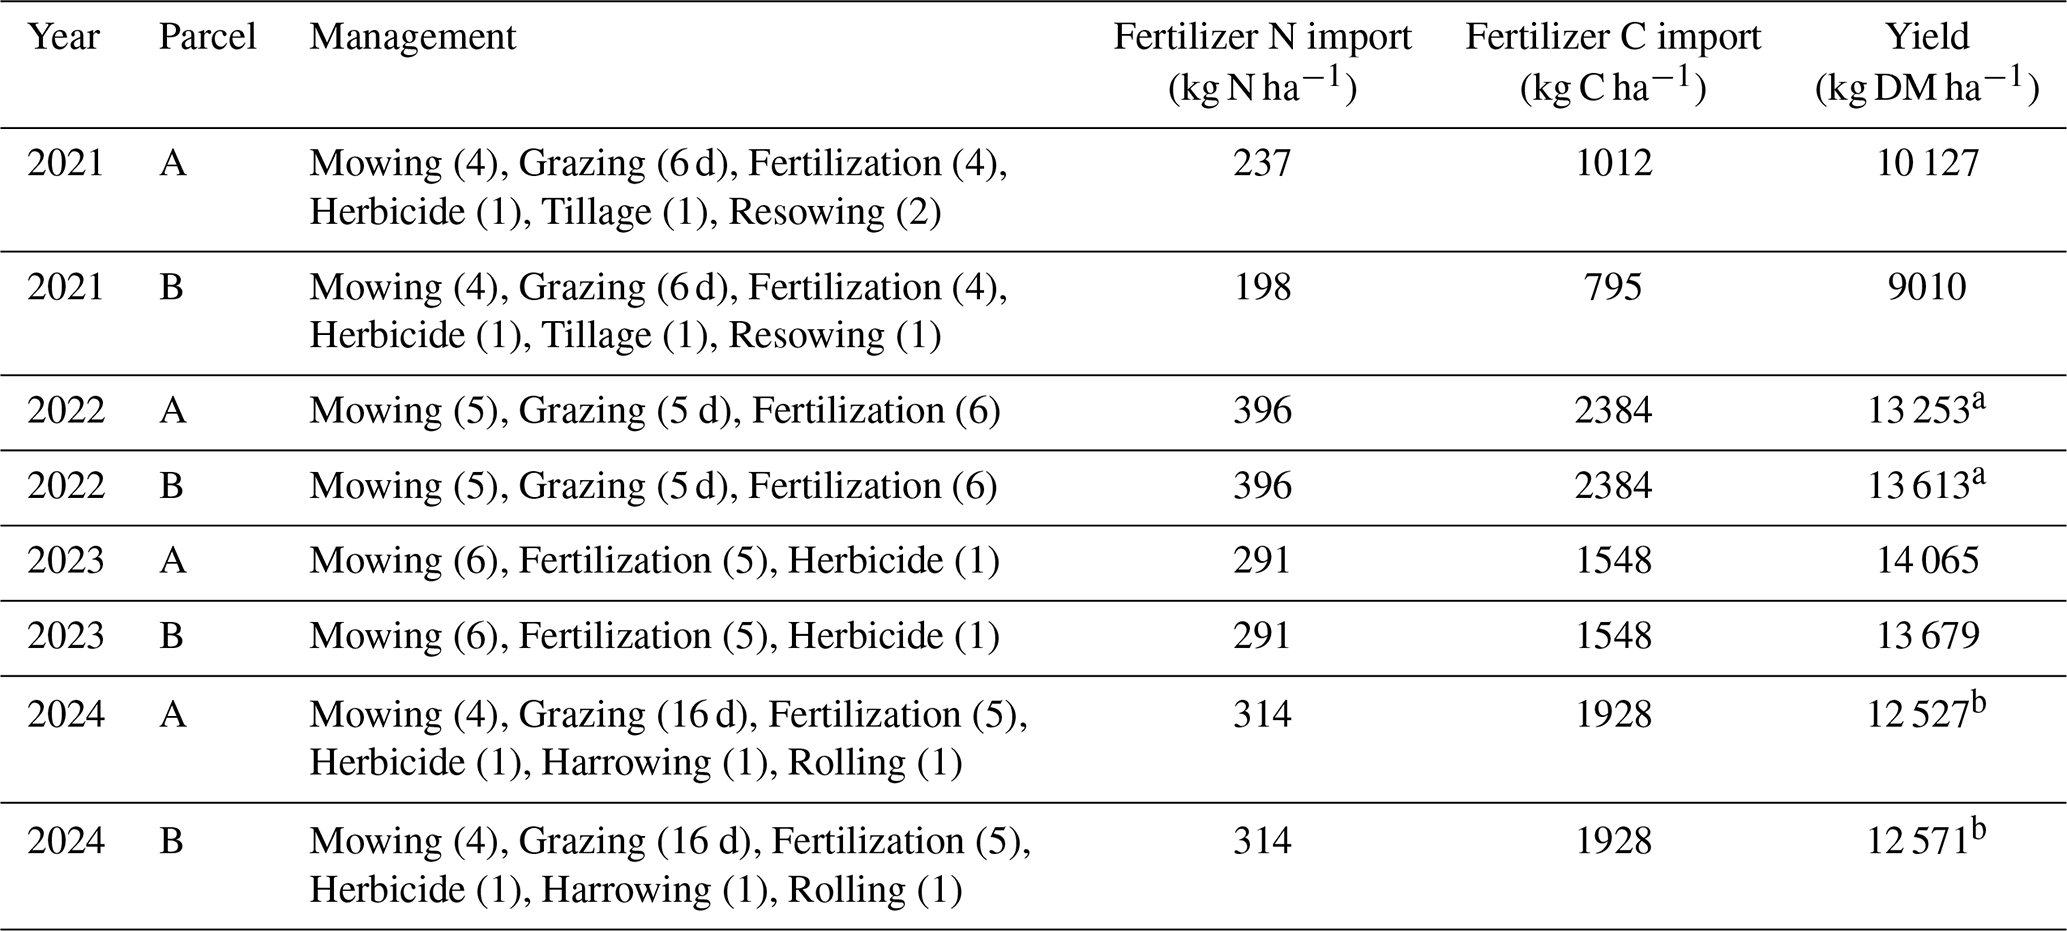
Years with missing yield data are indicated (a yield from one mowing event missing; b yield from one grazing event missing).
Table A2Detailed information about management events from 2021 to 2024, expanding Table B2 in Feigenwinter et al. (2023b). The amount of harvested yield (kg DM ha−1), fertilizer applied (m3 ha−1), number of animals (number ha−1) and duration (days) for grazing as well as fertilizer N and C imports (kg C or N ha−1) are reported.
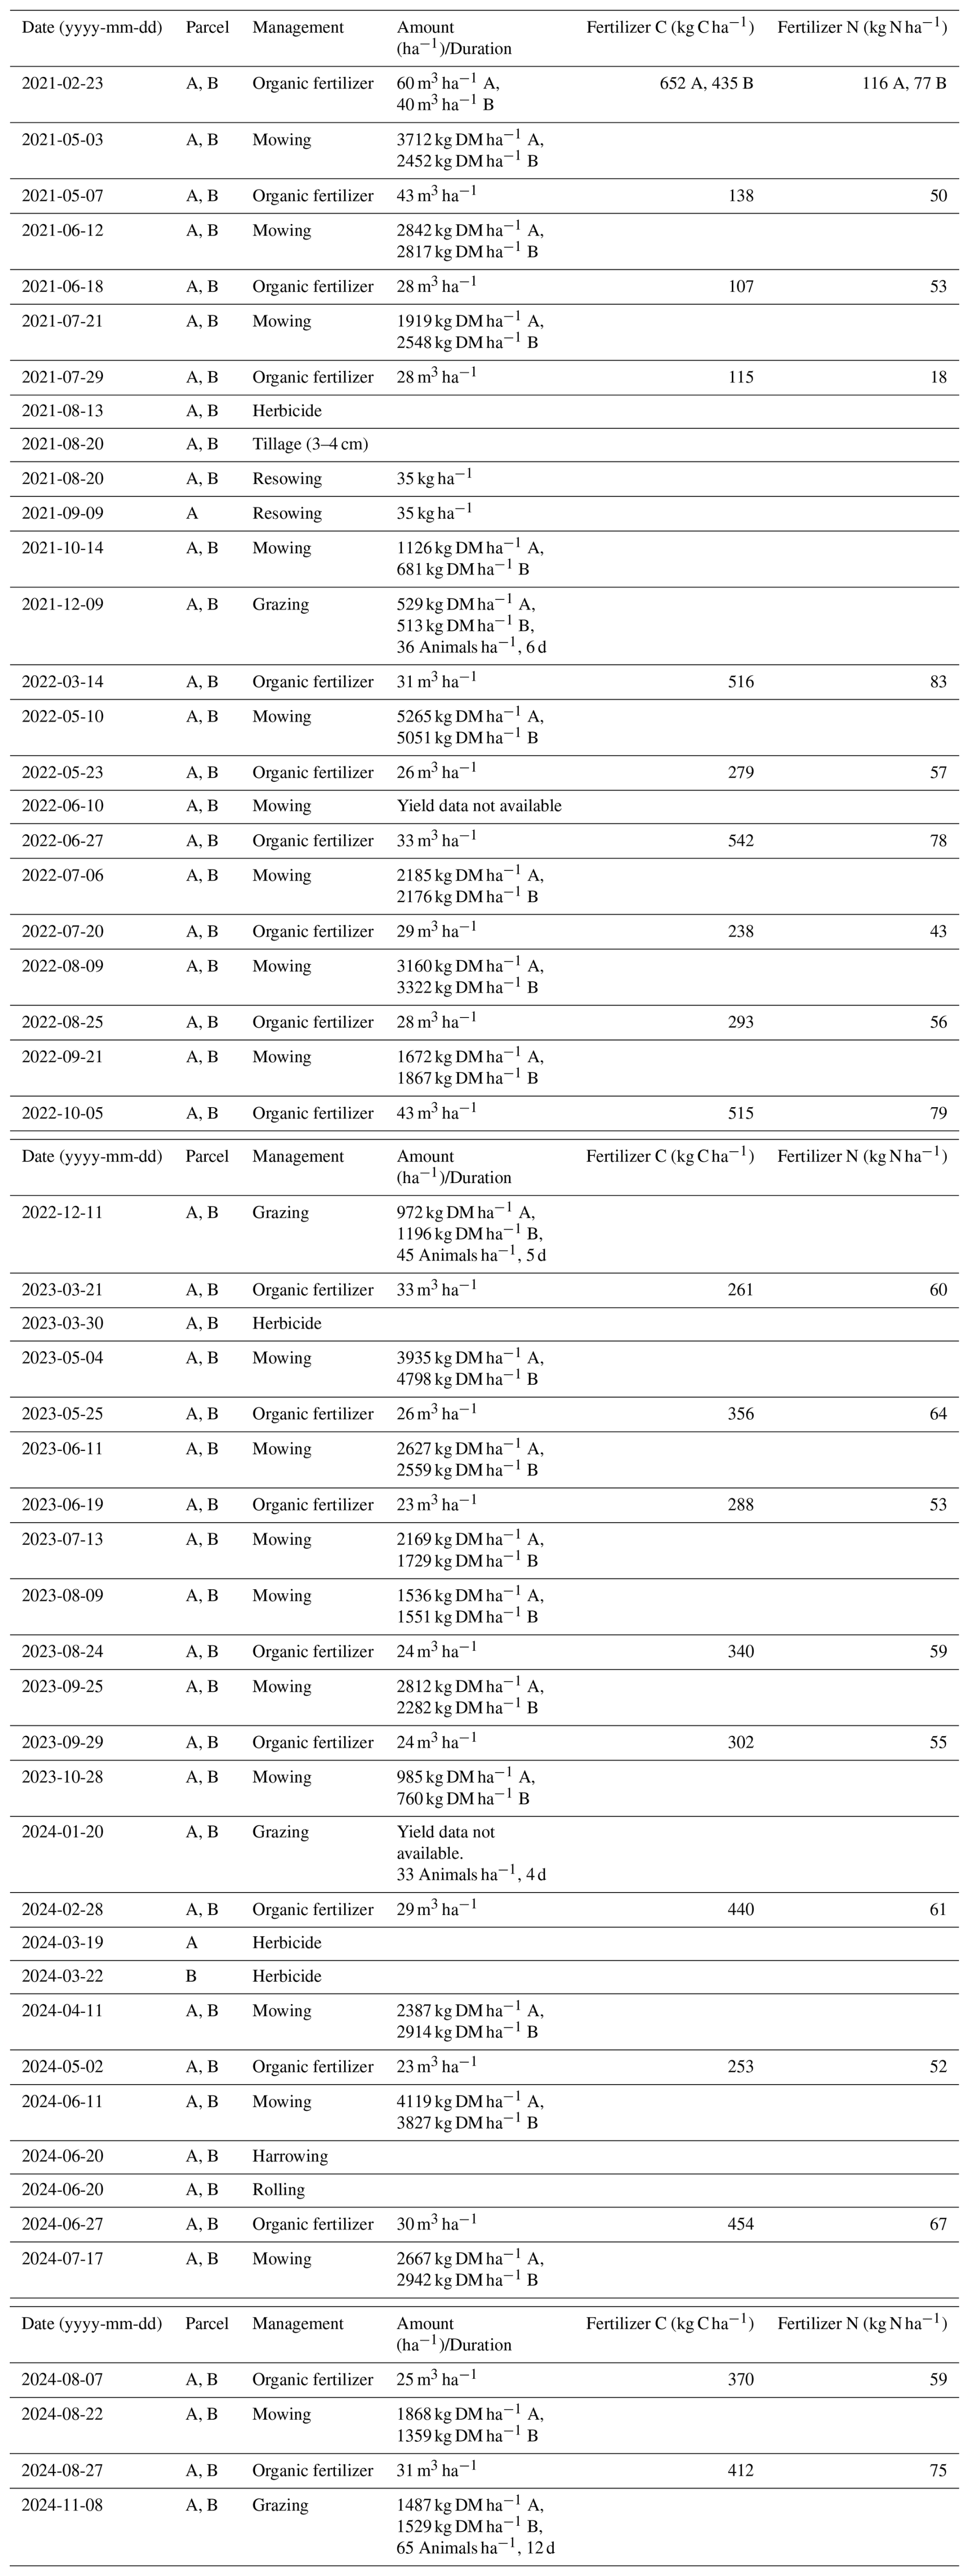
Table A3The best hyperparameters used in the XGBoost models for GPP and Reco.
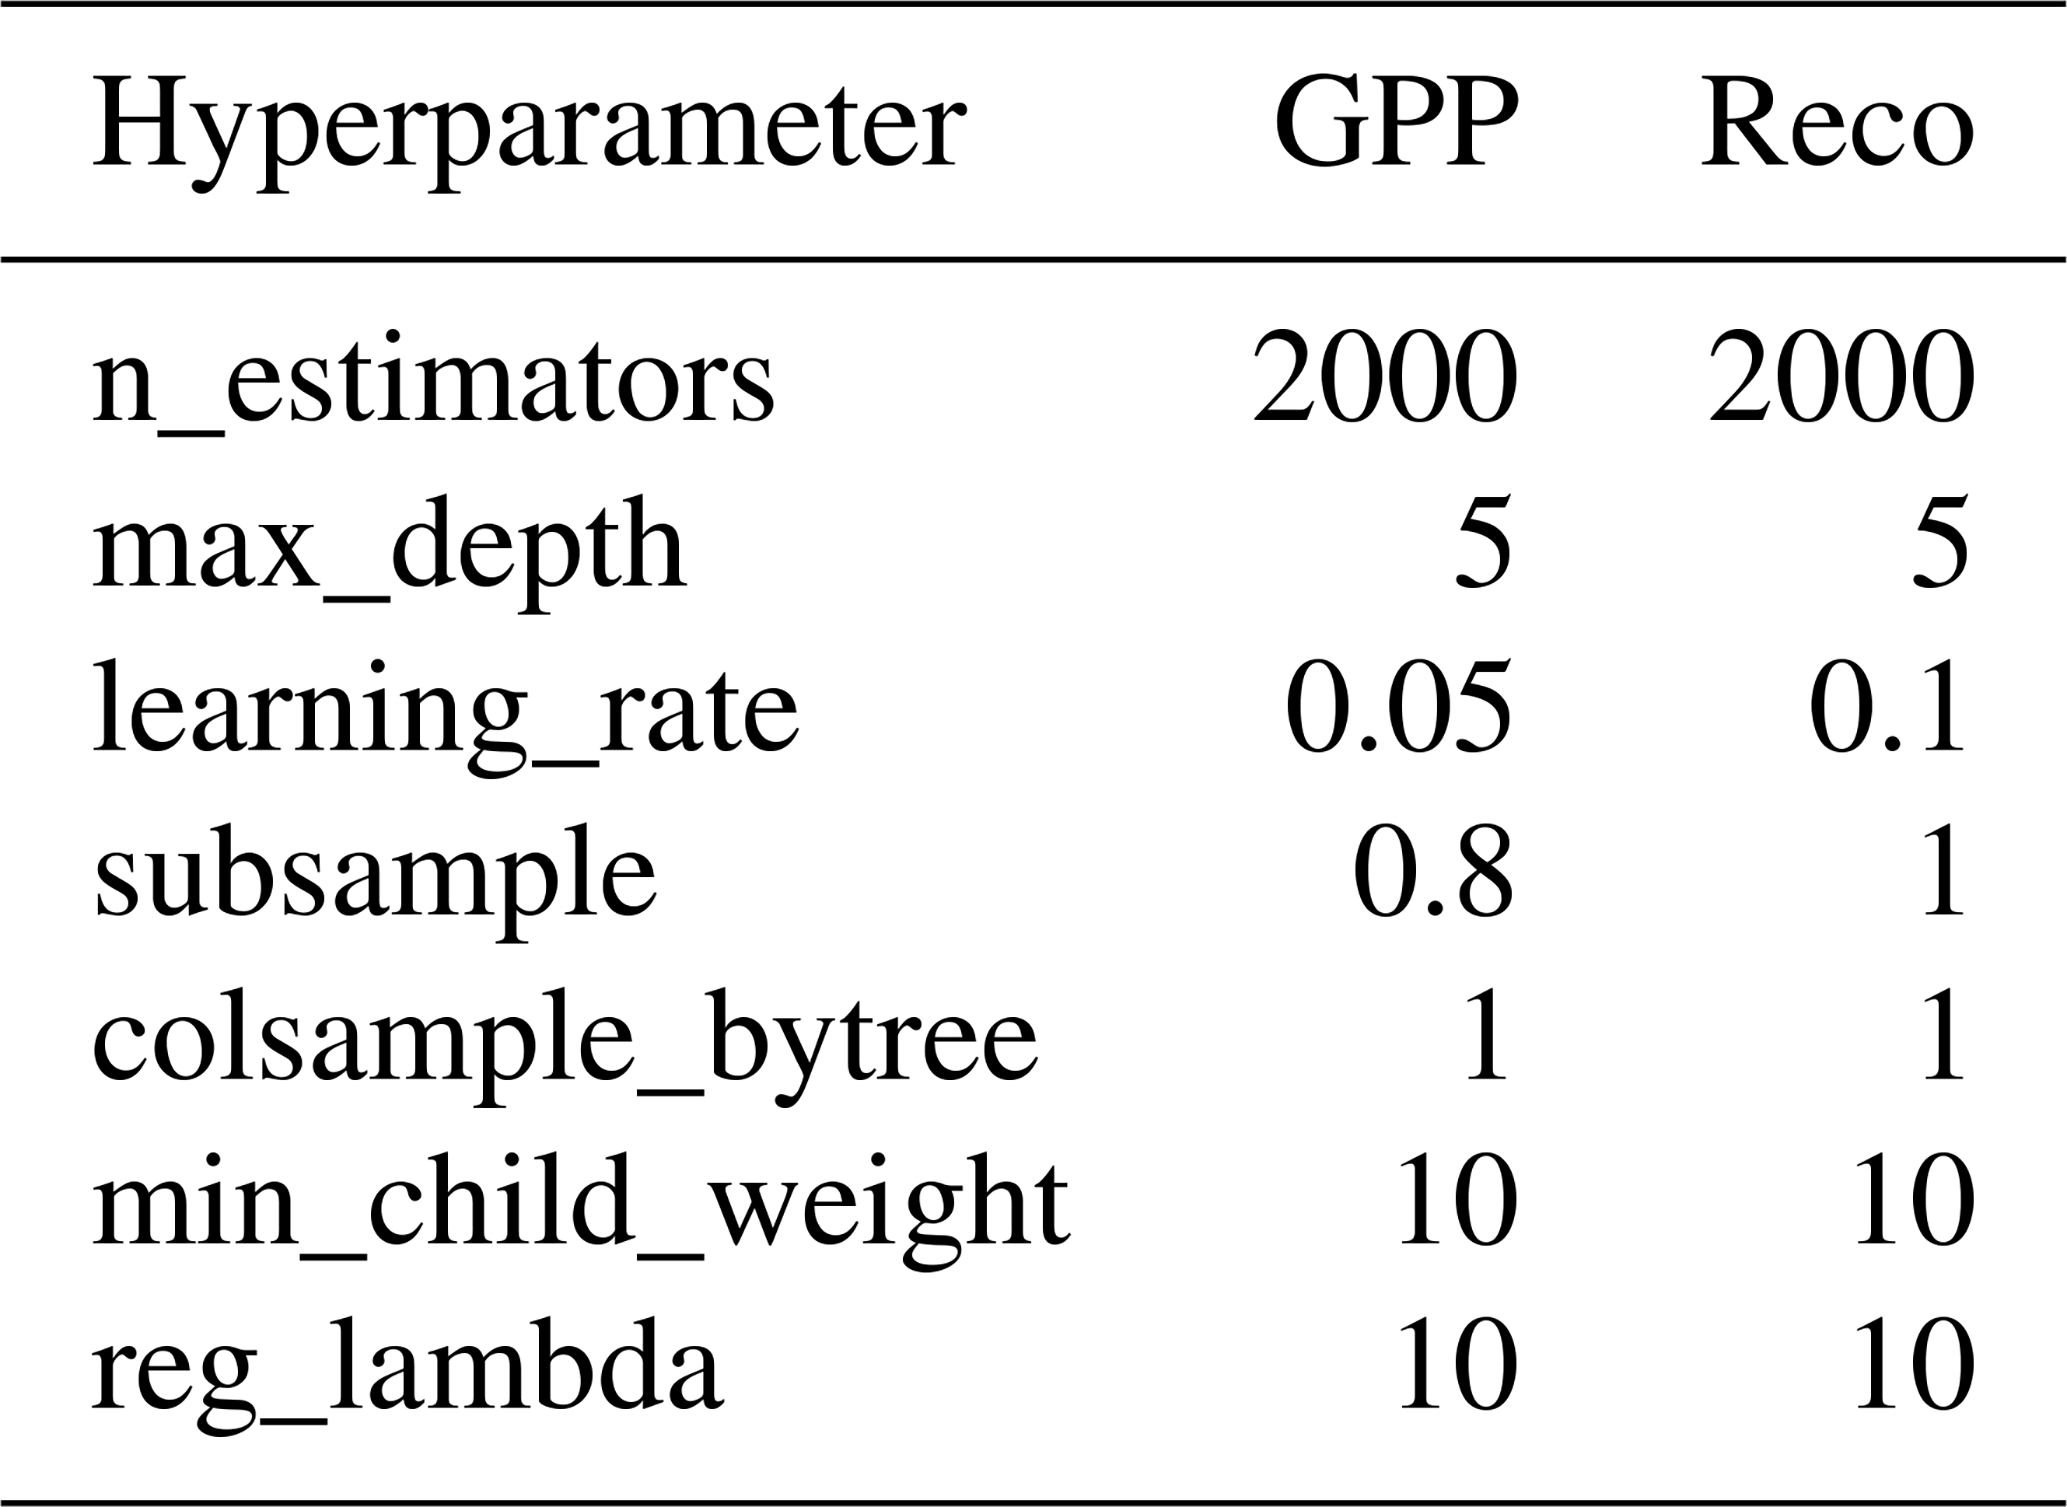
Table A4Monthly meteorological variables from 2005 to 2024. For each month, mean and standard deviation (SD), trends (unit yr−1; in non-italics positive trends, in italics negative trends) and significance from Mann-Kendall test (p values <0.05: *, <0.01: **) are shown.
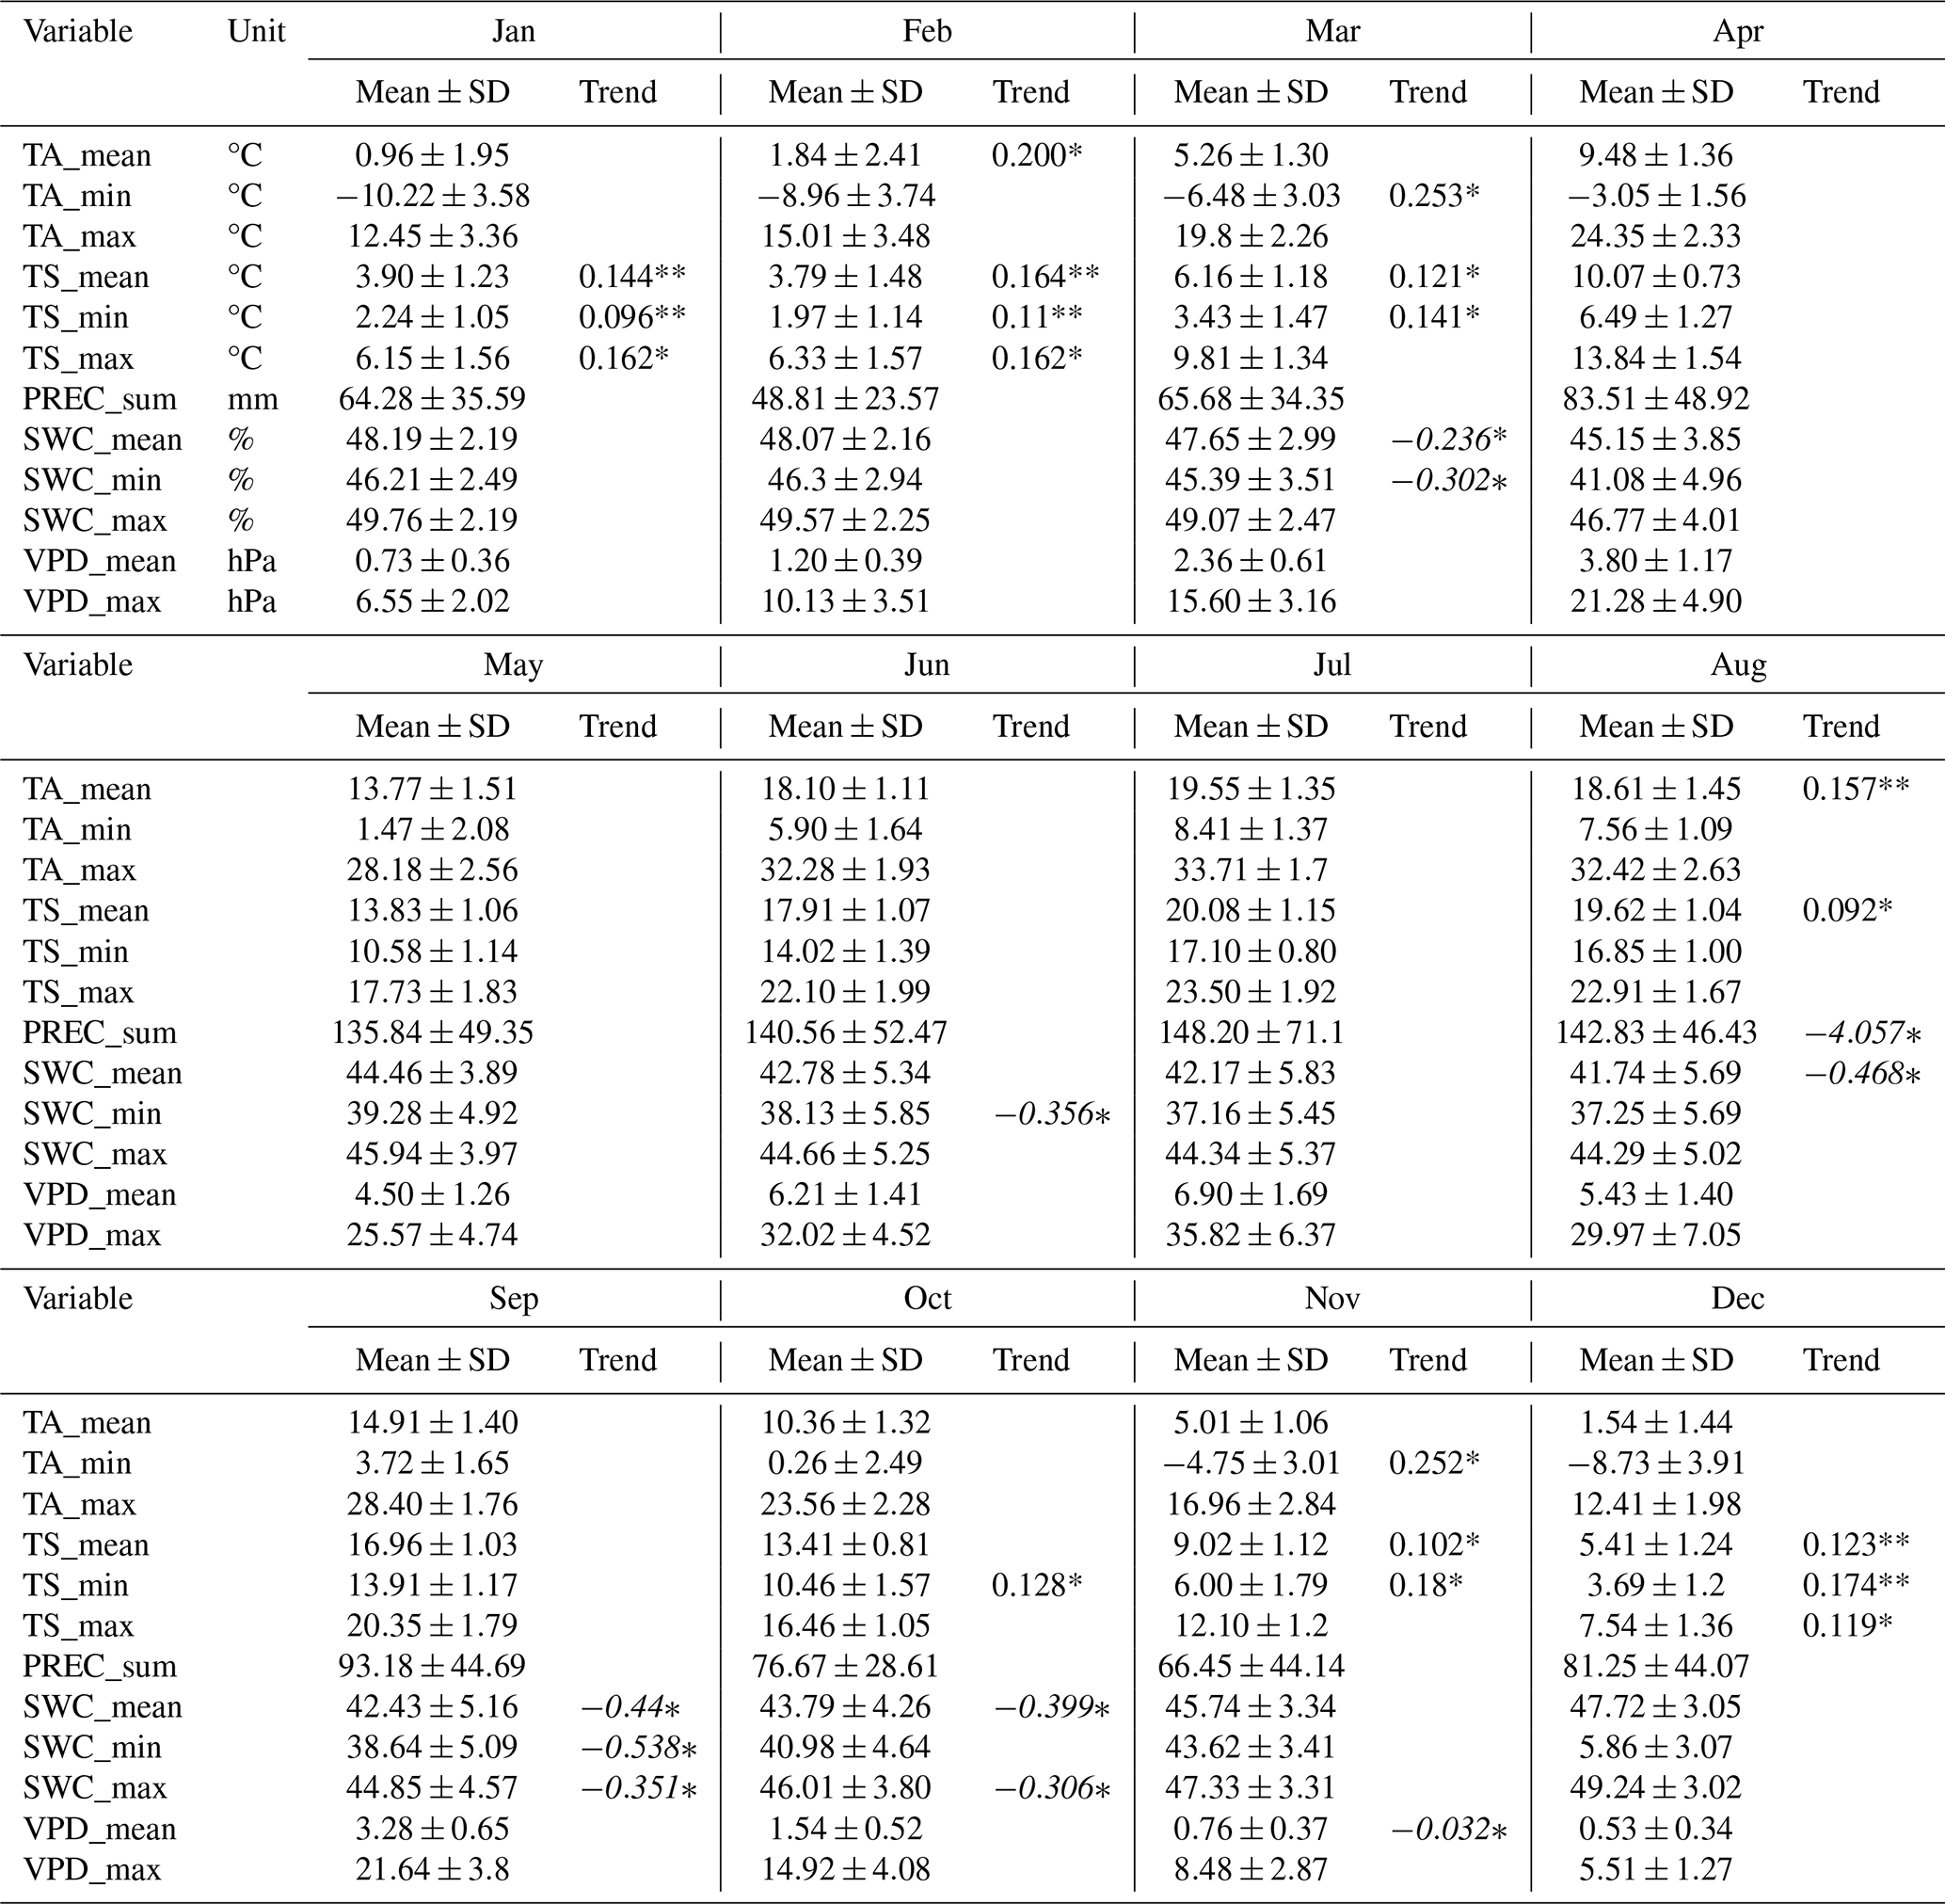
Table A5GPP and Reco from 2005 to 2024 under three different scenarios: for the 16th (U_16), 50th (U_50), and 84th (U_84) percentile of the USTAR threshold distribution respectively.
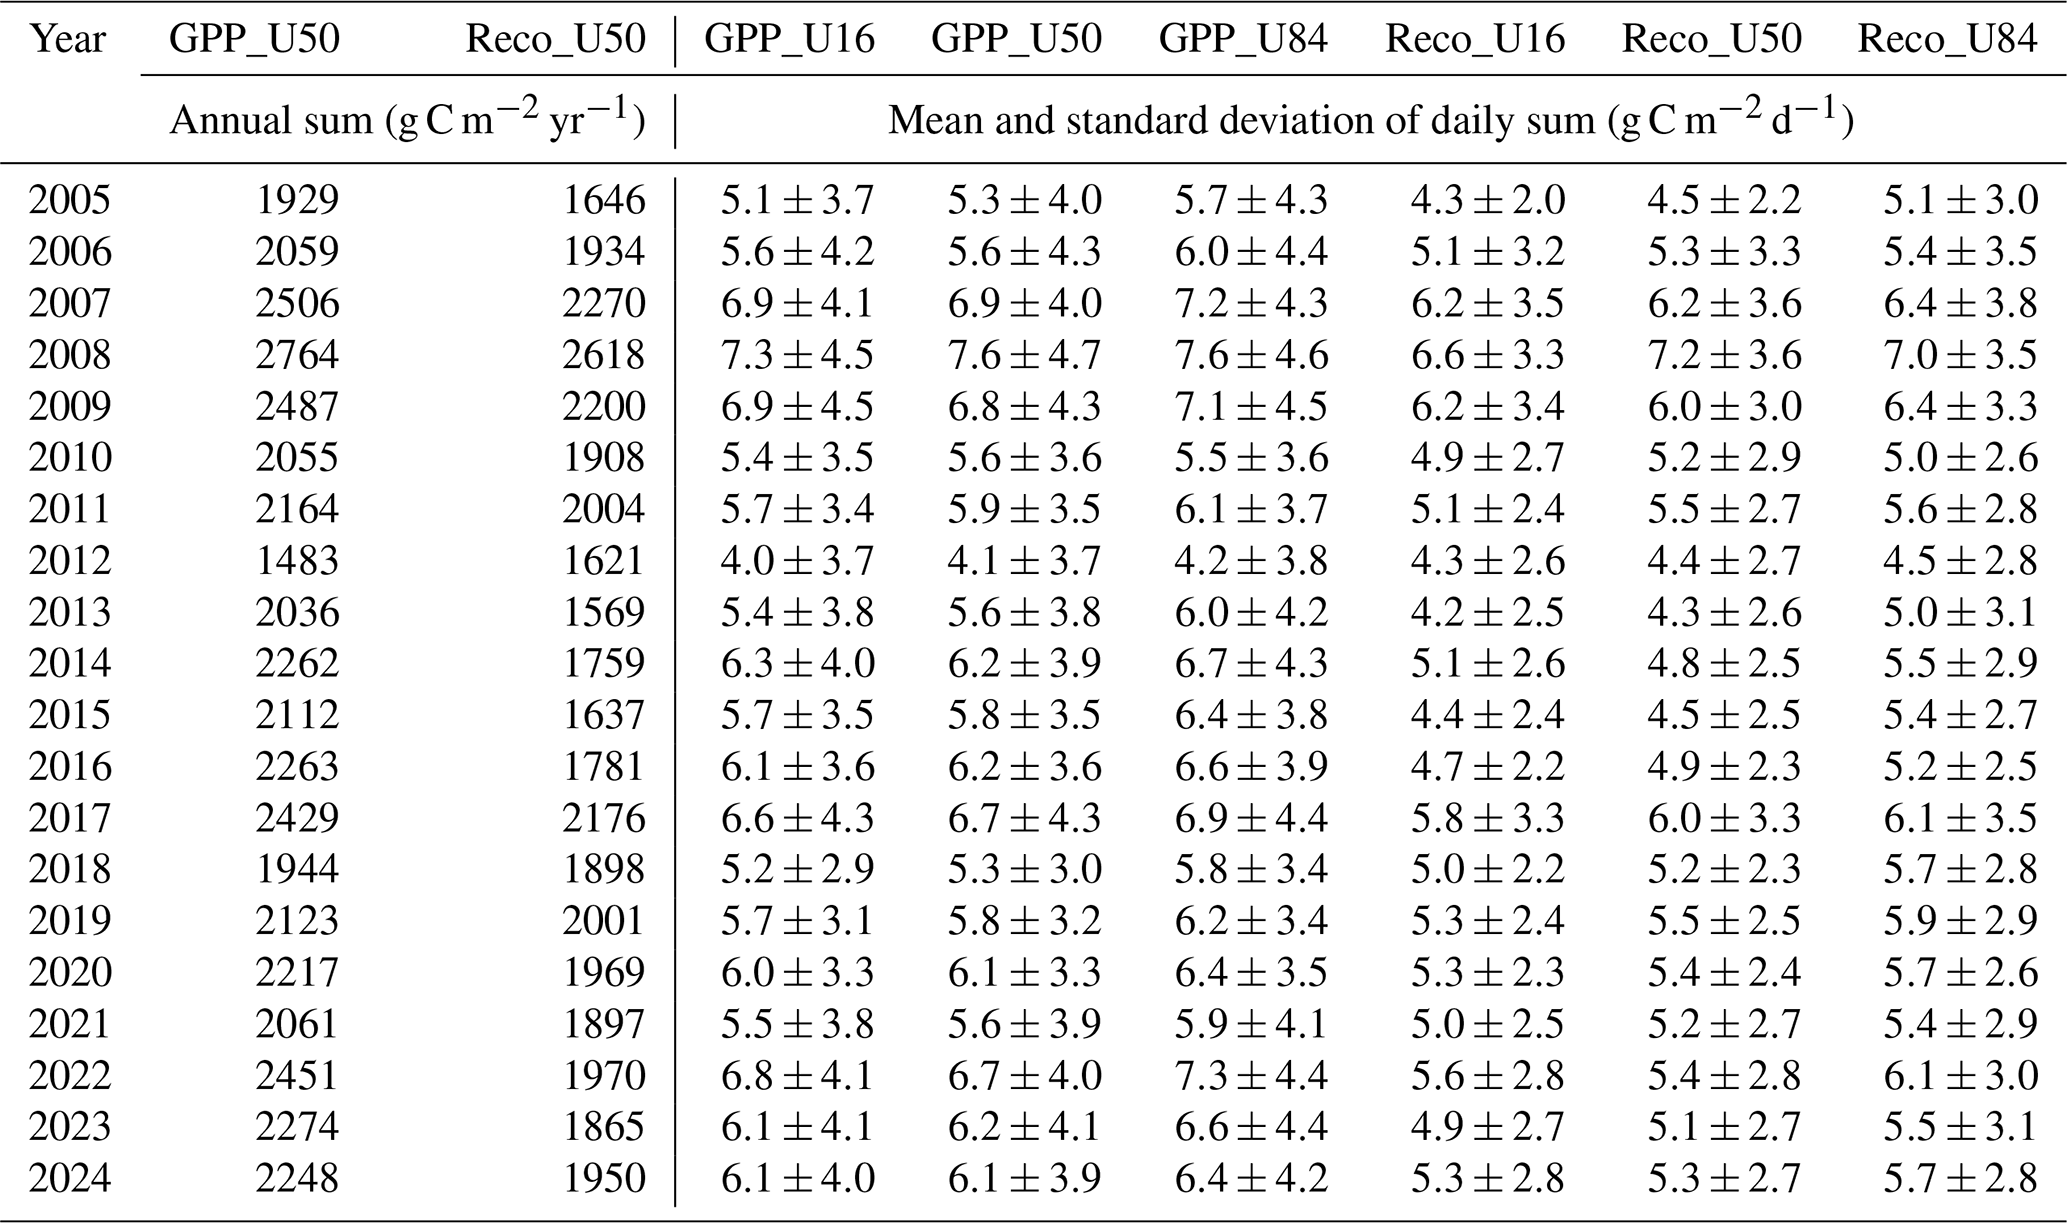
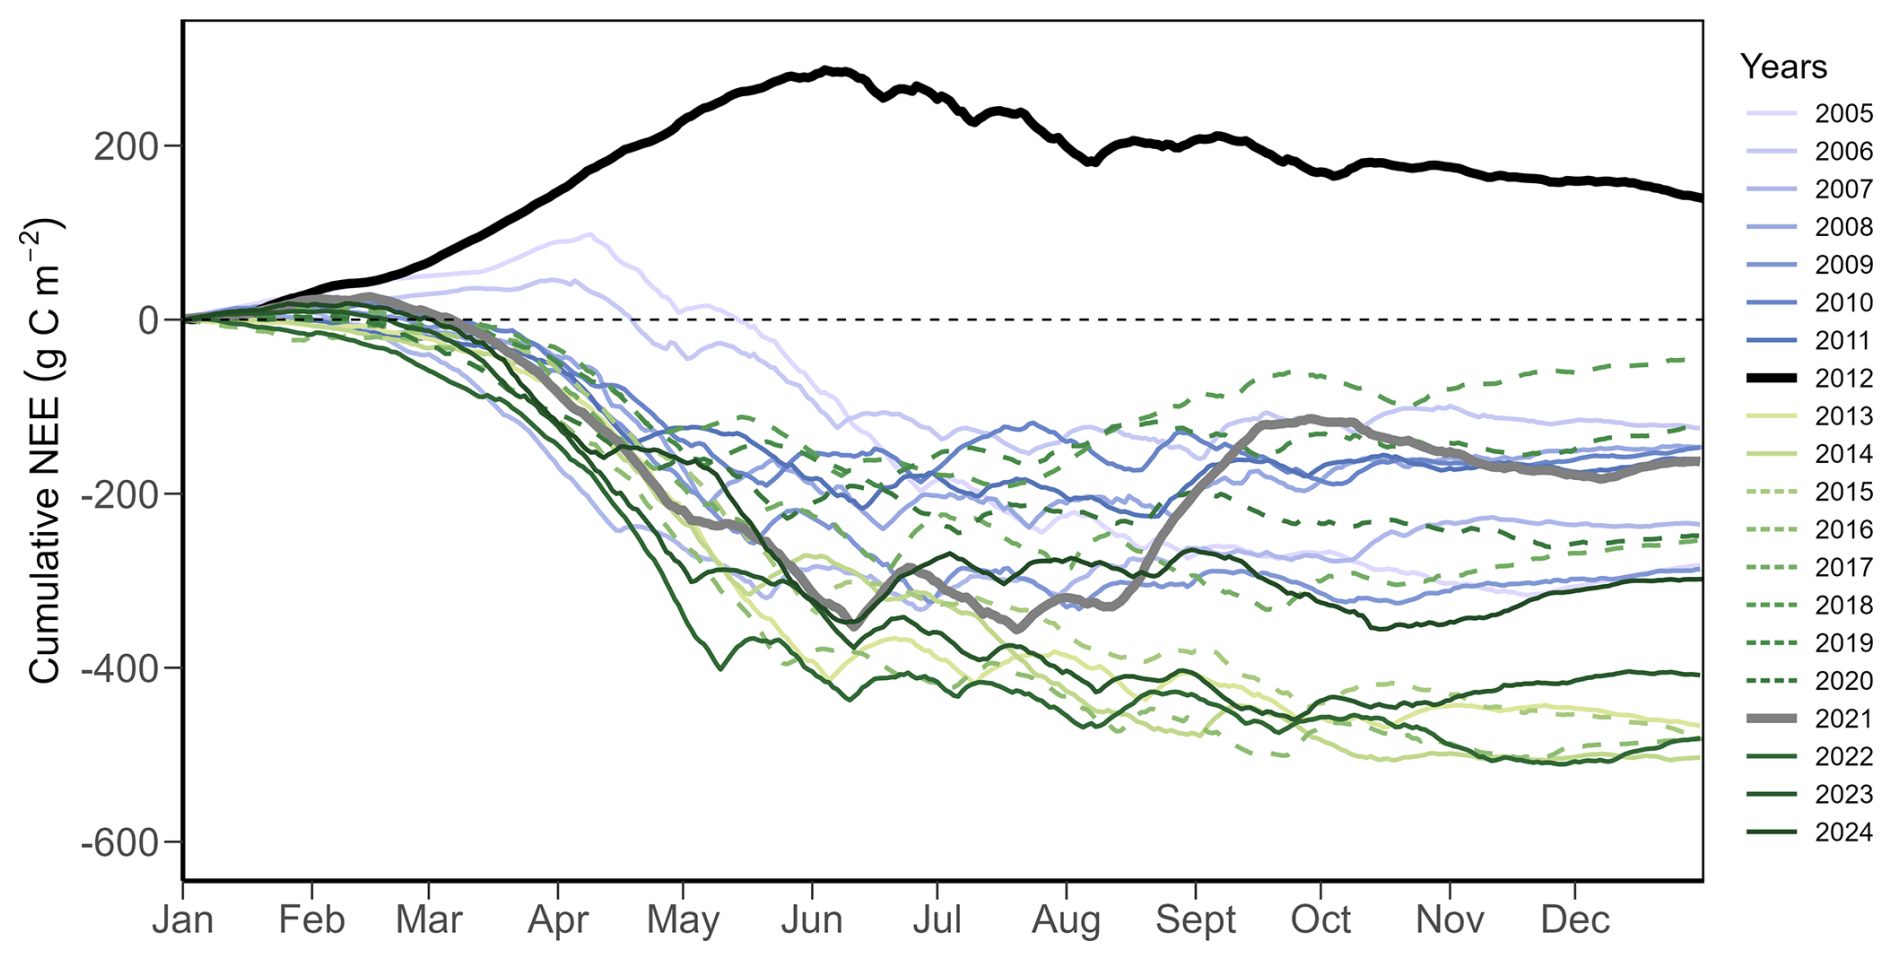
Figure A1Annual cumulative sum of daily net ecosystem CO2 exchange (NEE) for the years 2005 to 2024. Years during the N2O mitigation experiment (2015 to 2020; see Methods and Feigenwinter et al., 2023a) are shown with dashed lines, years with sward renewals (2012 and 2021) are shown in thicker black and grey lines, respectively.
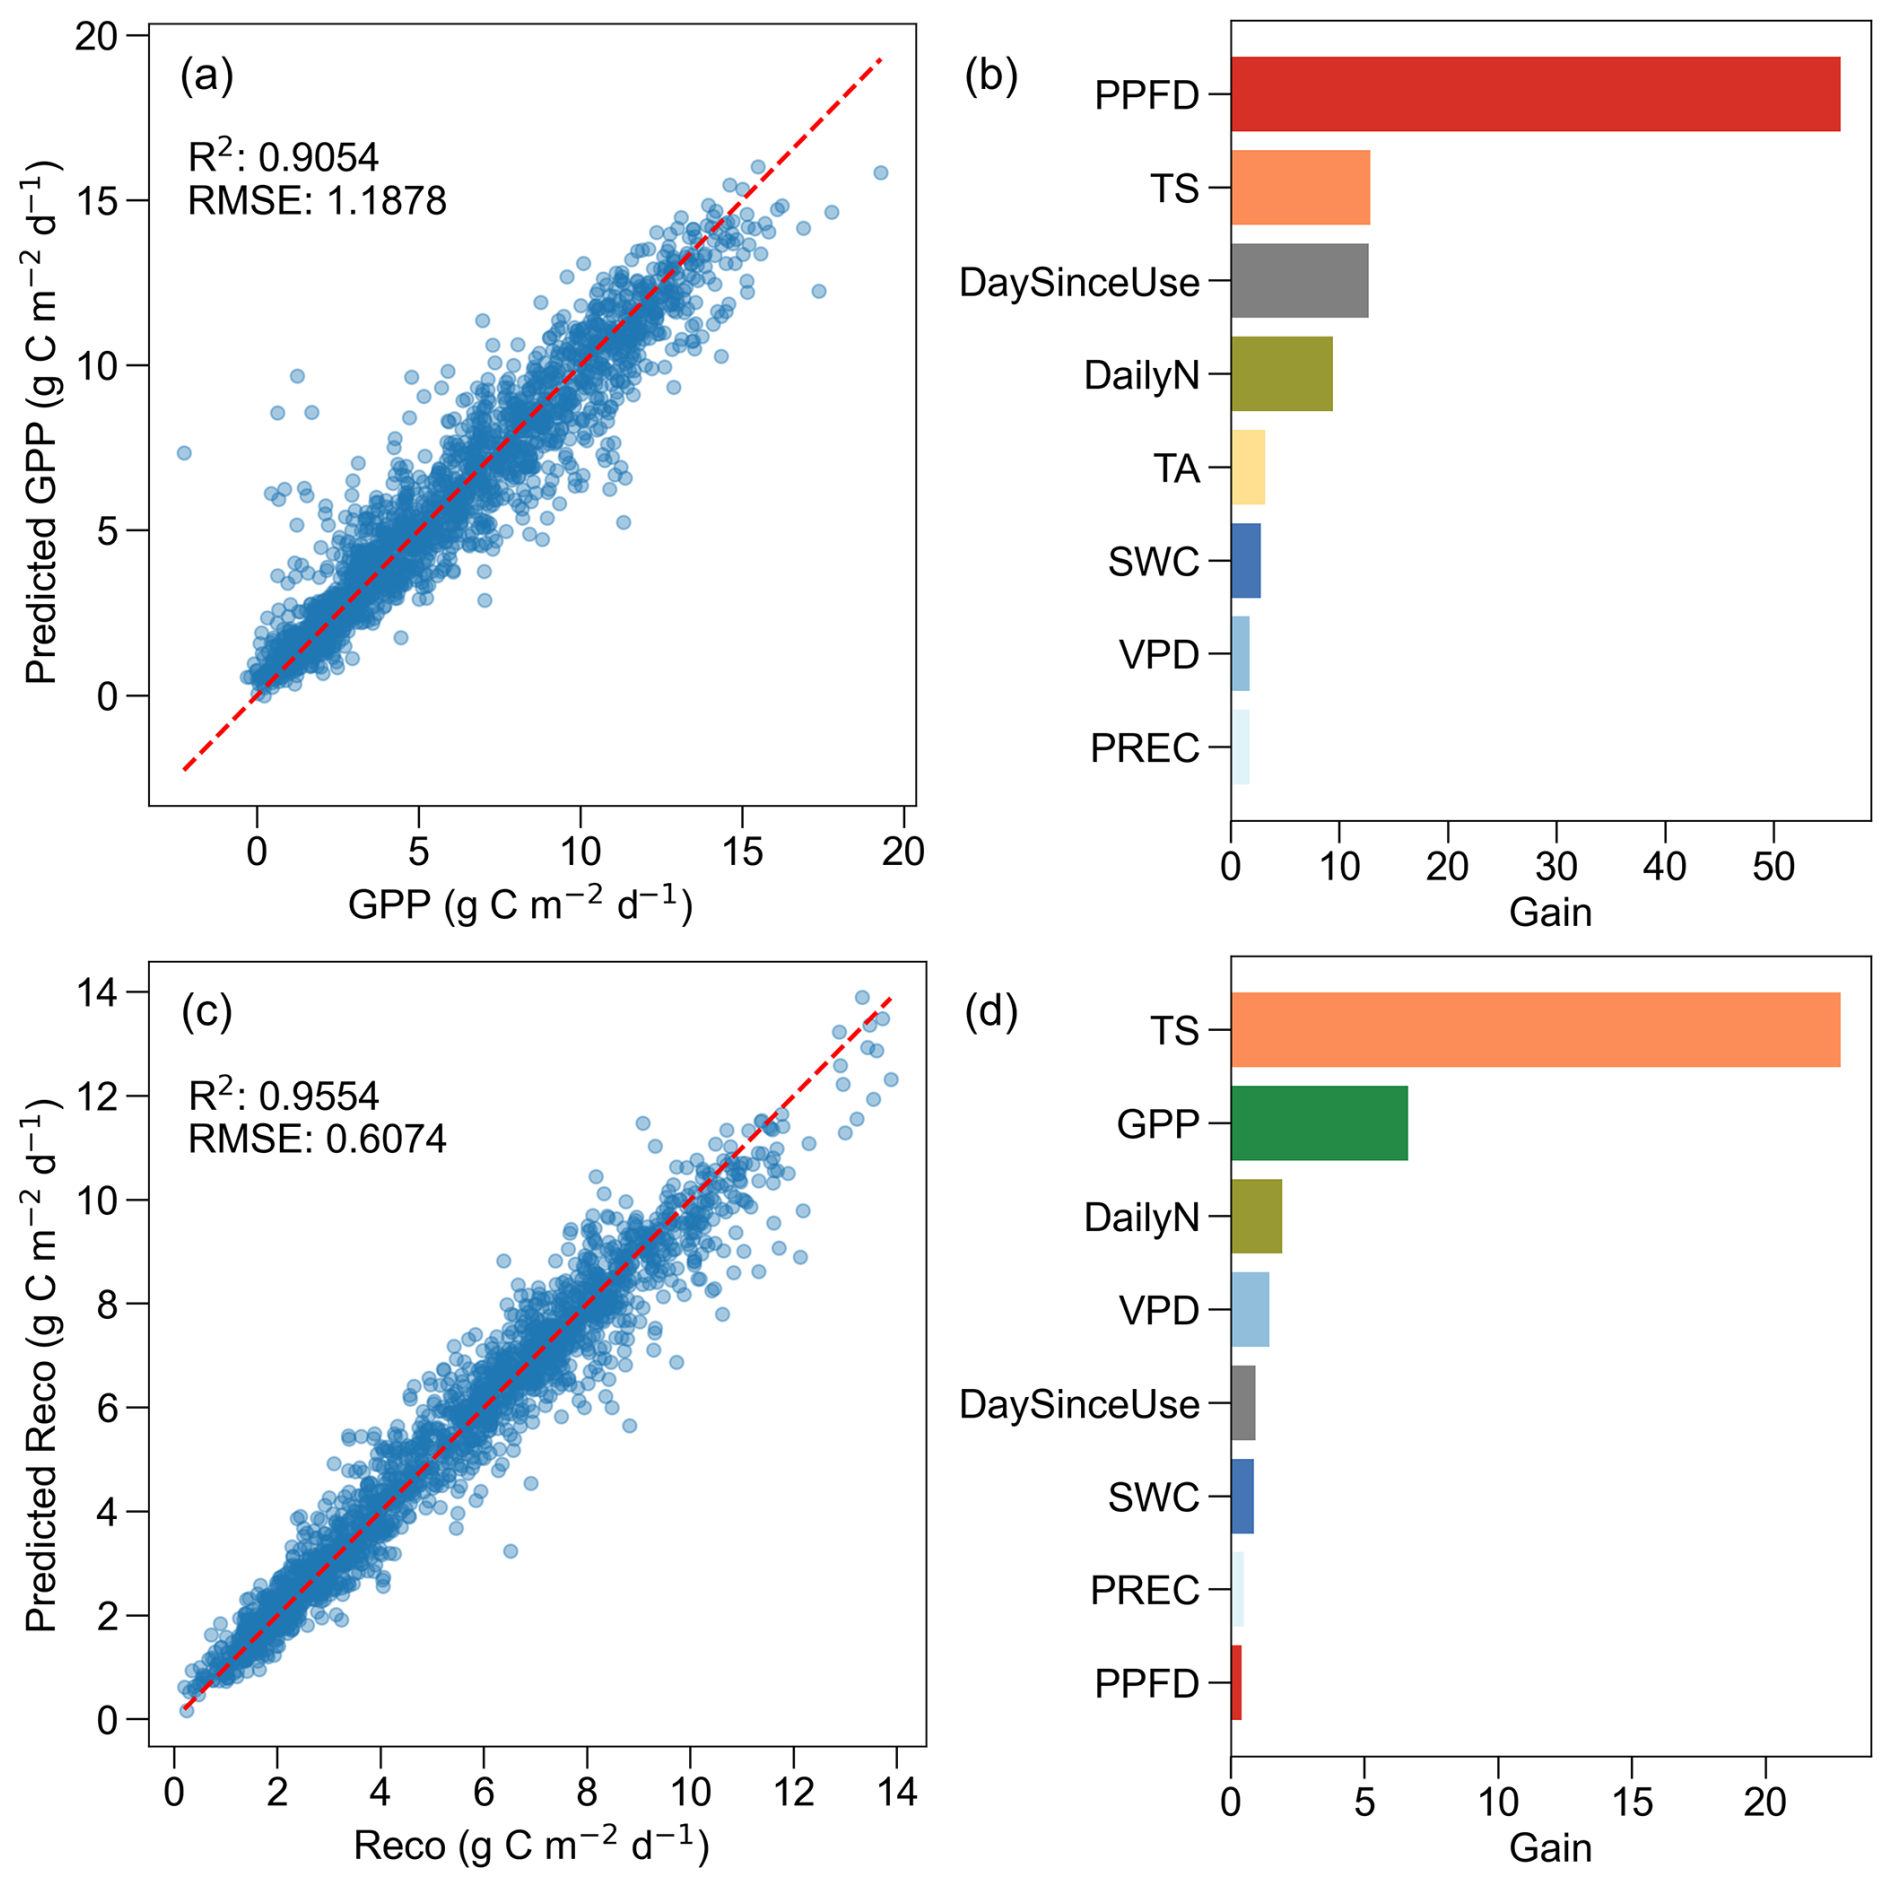
Figure A2Performance and feature importance of XGBoost models for daily gross primary production (GPP) and ecosystem respiration (Reco). (a) Predicted versus actual GPP with model coefficient of determination (R2) and root mean square error (RMSE) for the testing set, (b) feature importance (gain) for the GPP model, (c) predicted versus actual Reco with model R2 and RMSE for the testing set, and (d) feature importance (gain) for the Reco model. In panels (a) and (c), red dashed lines represent 1:1 lines. In panels (b) and (d), higher gain values indicate higher importance of the features on model predictions. Features have the same colour code as in Fig. 4: photosynthetic photon flux density (PPFD, red), soil temperature (TS, orange), air temperature (TA, yellow), soil water content (SWC, dark blue), vapour pressure deficit (VPD, blue), precipitation (PREC, light blue), day since last mowing, grazing or renewal (DaySinceUse, grey), daily fertilizer nitrogen input (DailyN, moss green), and gross primary production (GPP, green).
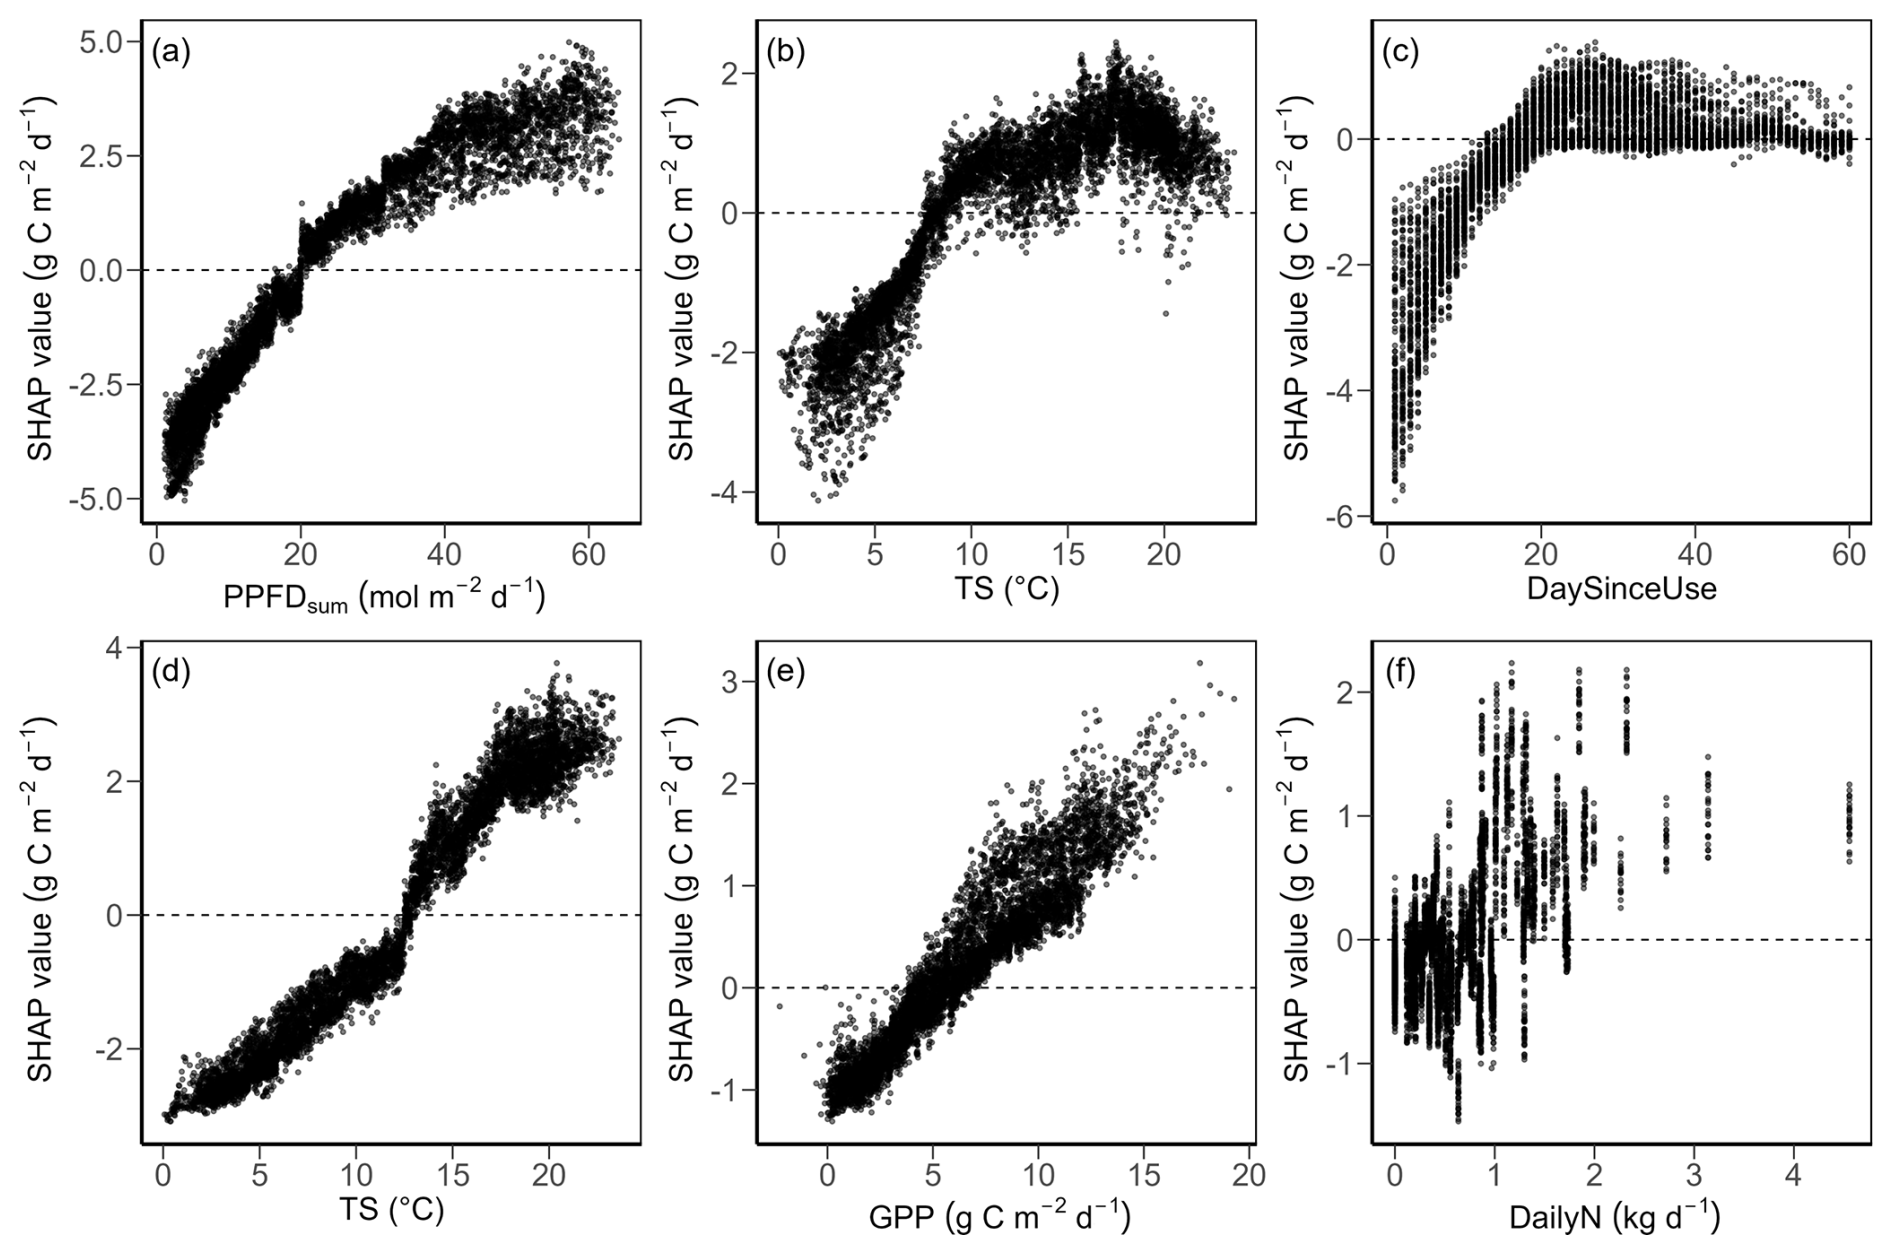
Figure A3Partial dependence plots for the top three drivers of daily GPP (a–c) and Reco (d–f). (a) Total photosynthetic photon flux density (PPFD), (b) soil temperature (TS), and (c) day since last mowing, grazing or renewal (DaySinceUse, zoomed into first 60 d after management) vs. GPP. (d) Soil temperature (TS), (e) gross primary production (GPP), and (f) daily fertilization nitrogen input (DailyN)) vs. Reco. SHAP values are the results of SHAP analysis 1 (Fig. 4). The mean prediction at SHAP value zero (dashed lines) corresponds to GPP of 6.1 g C m−2 d−1 and Reco of 5.3 g C m−2 d−1. Positive SHAP values represent positive effects of the drivers on GPP or Reco relative to the mean prediction, while negative values indicate negative effects from the mean prediction.
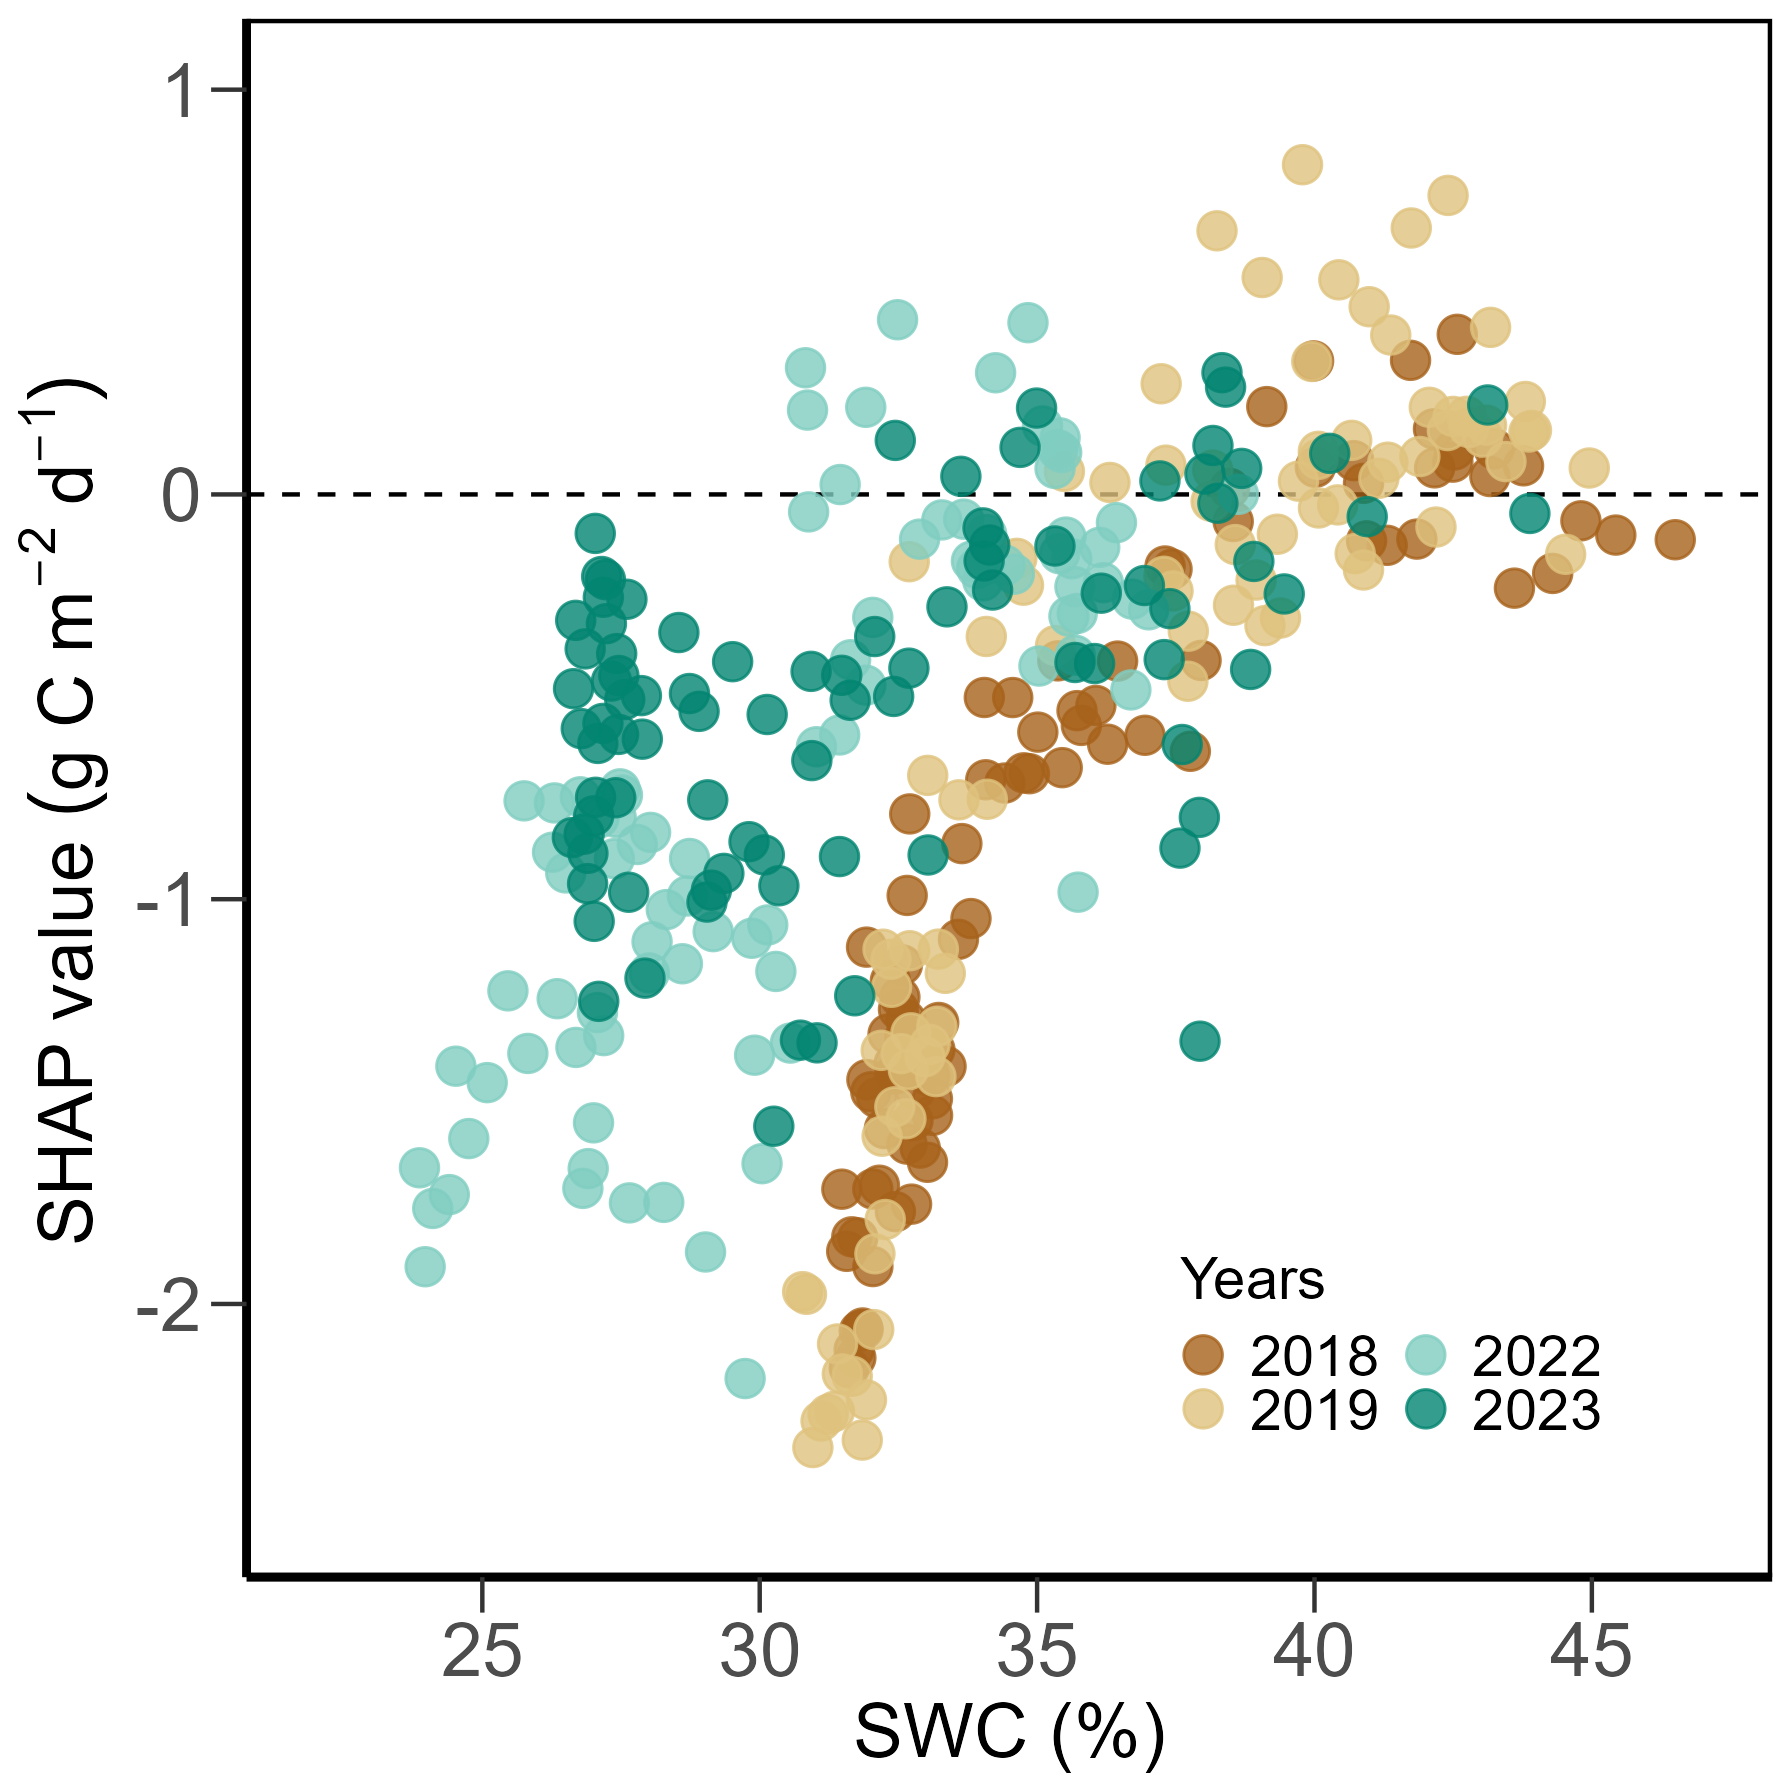
Figure A4Partial dependence plot of SHAP values of volumetric soil water content (SWC) for predicted daily gross primary production (GPP) in the peak growing seasons (June, July, August) during the years with extreme conditions 2018, 2019, 2022, and 2023 (see Fig. 2) from SHAP analysis 2 (Fig. 6). The mean prediction at SHAP value zero (dashed line) corresponds to a GPP of 9.7 g C m−2 d−1. Positive SHAP values represent positive effects of SWC on GPP relative to the mean prediction, while negative values indicate negative effects from the mean prediction. Different colours represent different years.
The R and Python scripts used for the data analyses and visualizations are available upon request from the corresponding author. All scripts used in producing the PI dataset are openly available in Zenodo (https://doi.org/10.5281/zenodo.16058144, Hörtnagl, 2025b) and Github (https://github.com/holukas/dataset_ch-cha_flux_product, last access: 26 February 2026).
Data used in this study are openly available for download in the ETH Zurich Research Collection at https://doi.org/10.3929/ethz-b-000745429 (Wang et al., 2026).
YW, IF, and NB: conceptualization of the study. YW, IF, and LH: data curation. YW: formal analysis, visualization, and writing (original draft preparation). IF and NB: supervision. AKG and NB: project administration. NB: funding acquisition. All authors: methodology and writing (reviewing and editing).
The contact author has declared that none of the authors has any competing interests.
Publisher's note: Copernicus Publications remains neutral with regard to jurisdictional claims made in the text, published maps, institutional affiliations, or any other geographical representation in this paper. The authors bear the ultimate responsibility for providing appropriate place names. Views expressed in the text are those of the authors and do not necessarily reflect the views of the publisher.
The technical assistance for the maintenance of the eddy covariance station by Peter Plüss, Thomas Baur, Philip Meier, Patrick Koller, Florian Käslin, Paul Linwood, Markus Staudinger, Peter Ravelhofer, and Martin Rüegg is greatly acknowledged. Big thanks also go to all the scientists who were responsible for the Chamau site during the 20 years of this study: Matthias Zeeman, Werner Eugster, Lutz Merbold, Dennis Imer, and Kathrin Fuchs. We also thank Lukas Stocker and the staff from LBBZ Schluechthof team for managing the fields around the flux station. We acknowledge fruitful discussions with Wei Qiu, University of Washington, Seattle, USA, about machine learning models, in particular on SHAP analyses. AI tools (ChatGPT-4o, Grammarly, DeepL, and Google NotebookLM) were used to improve writing and visualization. All outputs were critically reviewed by the authors to ensure accuracy and integrity. We thank Georg Wohlfahrt, Andreas Ibrom, and an anonymous referee for their constructive comments and valuable suggestions to improve this manuscript.
This research has been supported by SNF projects InsuranceGrass (grant no. 100018L_200918) and ICOS-CH Phase 3 (grant no. 20FI20_198227). Nina Buchmann and Yi Wang are part of the SPEED2ZERO, a Joint Initiative co-financed by the ETH Board.
This paper was edited by Mirco Migliavacca and reviewed by Georg Wohlfahrt, Andreas Ibrom, and one anonymous referee.
Ammann, C., Flechard, C. R., Leifeld, J., Neftel, A., and Fuhrer, J.: The carbon budget of newly established temperate grassland depends on management intensity, Agric. Ecosyst. Environ., 121, 5–20, https://doi.org/10.1016/j.agee.2006.12.002, 2007.
Ammann, C., Neftel, A., Jocher, M., Fuhrer, J., and Leifeld, J.: Effect of management and weather variations on the greenhouse gas budget of two grasslands during a 10-year experiment, Agric. Ecosyst. Environ., 292, 106814, https://doi.org/10.1016/j.agee.2019.106814, 2020.
Anav, A., Friedlingstein, P., Beer, C., Ciais, P., Harper, A., Jones, C., Murray-Tortarolo, G., Papale, D., Parazoo, N. C., Peylin, P., Piao, S., Sitch, S., Viovy, N., Wiltshire, A., and Zhao, M.: Spatiotemporal patterns of terrestrial gross primary production: A review, Rev. Geophys., 53, 785–818, https://doi.org/10.1002/2015RG000483, 2015.
Aubinet, M., Vesala, T., and Papale, D. (Eds.): Eddy Covariance: A Practical Guide to Measurement and Data Analysis, Springer Netherlands, Dordrecht, https://doi.org/10.1007/978-94-007-2351-1, 2012.
Bai, Y. and Cotrufo, M. F.: Grassland soil carbon sequestration: Current understanding, challenges, and solutions, Science, 377, 603–608, https://doi.org/10.1126/science.abo2380, 2022.
Barneze, A. S., Whitaker, J., McNamara, N. P., and Ostle, N. J.: Interactions between climate warming and land management regulate greenhouse gas fluxes in a temperate grassland ecosystem, Sci. Total Environ., 833, 155212, https://doi.org/10.1016/j.scitotenv.2022.155212, 2022.
Bengtsson, J., Bullock, J. M., Egoh, B., Everson, C., Everson, T., O'Connor, T., O'Farrell, P. J., Smith, H. G., and Lindborg, R.: Grasslands-more important for ecosystem services than you might think, Ecosphere, 10, e02582, https://doi.org/10.1002/ecs2.2582, 2019.
Bloor, J. M. G. and Bardgett, R. D.: Stability of above-ground and below-ground processes to extreme drought in model grassland ecosystems: Interactions with plant species diversity and soil nitrogen availability, Perspect. Plant Ecol. Evol. Syst., 14, 193–204, https://doi.org/10.1016/j.ppees.2011.12.001, 2012.
Breiman, L.: Random Forests, Mach. Learn., 45, 5–32, https://doi.org/10.1023/A:1010933404324, 2001.
Burba, G. G., McDermitt, D. K., Grelle, A., Anderson, D. J., and Xu, L.: Addressing the influence of instrument surface heat exchange on the measurements of CO2 flux from open-path gas analyzers, Glob. Change Biol., 14, 1854–1876, https://doi.org/10.1111/j.1365-2486.2008.01606.x, 2008.
Cai, W. and Prentice, I. C.: Recent trends in gross primary production and their drivers: analysis and modelling at flux-site and global scales, Environ. Res. Lett., 15, 124050, https://doi.org/10.1088/1748-9326/abc64e, 2020.
CH2025: Climate CH2025 – Switzerland's Future Climate. Federal Office of Meteorology and Climatology MeteoSwiss, & ETH Zurich, 24 pp., https://doi.org/10.18751/climate/scenarios/ch2025/brochure/1.0/en, 2025.
Chang, J., Ciais, P., Gasser, T., Smith, P., Herrero, M., Havlík, P., Obersteiner, M., Guenet, B., Goll, D. S., Li, W., Naipal, V., Peng, S., Qiu, C., Tian, H., Viovy, N., Yue, C., and Zhu, D.: Climate warming from managed grasslands cancels the cooling effect of carbon sinks in sparsely grazed and natural grasslands, Nat. Commun., 12, 118, https://doi.org/10.1038/s41467-020-20406-7, 2021.
Chen, T. and Guestrin, C.: XGBoost: A scalable tree boosting system, in: Proceedings of the 22nd ACM SIGKDD International Conference on Knowledge Discovery and Data Mining, New York, NY, USA, 785–794, https://doi.org/10.1145/2939672.2939785, 2016.
Craven, D., Isbell, F., Manning, P., Connolly, J., Bruelheide, H., Ebeling, A., Roscher, C., van Ruijven, J., Weigelt, A., Wilsey, B., Beierkuhnlein, C., de Luca, E., Griffin, J. N., Hautier, Y., Hector, A., Jentsch, A., Kreyling, J., Lanta, V., Loreau, M., Meyer, S. T., Mori, A. S., Naeem, S., Palmborg, C., Polley, H. W., Reich, P. B., Schmid, B., Siebenkäs, A., Seabloom, E., Thakur, M. P., Tilman, D., Vogel, A., and Eisenhauer, N.: Plant diversity effects on grassland productivity are robust to both nutrient enrichment and drought, Philos. T. Roy. Soc. B, 371, 20150277, https://doi.org/10.1098/rstb.2015.0277, 2016.
Davi, H., Dufrêne, E., Francois, C., Le Maire, G., Loustau, D., Bosc, A., Rambal, S., Granier, A., and Moors, E.: Sensitivity of water and carbon fluxes to climate changes from 1960 to 2100 in European forest ecosystems, Agric. For. Meteorol., 141, 35–56, https://doi.org/10.1016/j.agrformet.2006.09.003, 2006.
Deventer, M. J., Roman, T., Bogoev, I., Kolka, R. K., Erickson, M., Lee, X., Baker, J. M., Millet, D. B., and Griffis, T. J.: Biases in open-path carbon dioxide flux measurements: Roles of instrument surface heat exchange and analyzer temperature sensitivity, Agric. For. Meteorol., 296, 108216, https://doi.org/10.1016/j.agrformet.2020.108216, 2021.
Drewer, J., Anderson, M., Levy, P. E., Scholtes, B., Helfter, C., Parker, J., Rees, R. M., and Skiba, U. M.: The impact of ploughing intensively managed temperate grasslands on N2O, CH4 and CO2 fluxes, Plant Soil, 411, 193–208, https://doi.org/10.1007/s11104-016-3023-x, 2017.
Eugster, W. and Merbold, L.: Eddy covariance for quantifying trace gas fluxes from soils, SOIL, 1, 187–205, https://doi.org/10.5194/soil-1-187-2015, 2015.
European Academies Science Advisory Council (EASAC) (Ed.): Regenerative agriculture in Europe: a critical analysis of contributions to European Union farm to fork and biodiversity strategies, EASAC Secretariat, Deutsche Akademie der Naturforscher Leopoldina - German National Academy of Sciences, Halle (Saale), 58 pp., 2022.
European Commission: Approved 28 CAP strategic plans (2023–2027), Directorate-General for Agriculture and Rural Development, https://agriculture.ec.europa.eu/system/files/2023-06/approved-28-cap-strategic-plans-2023-27.pdf (last access: 20 July 2025), 2023.
Eurostat: Share of main land types in utilised agricultural area (UAA) by NUTS 2 regions, https://ec.europa.eu/eurostat/databrowser/view/tai05/default/table?lang=en (last access: 20 July 2025), 2020.
Eurostat: Permanent agricultural grassland in Europe, https://ec.europa.eu/eurostat/statistics-explained/index.php?title=Permanent_agricultural_grassland_in_Europe (last access: 20 July 2025), 2023.
FAO: Climate-Smart Agriculture, https://www.fao.org/climate-smart-agriculture/en/ (last access: 22 October 2025), 2019.
Federal Statistical Office (FSO): Die Landwirtschaftsflächen der Schweiz – 1985–2018, Geoinformation Section, GEO, https://www.bfs.admin.ch/bfs/de/home/statistiken/raum-umwelt/erhebungen/area.assetdetail.36277900.html (last access: 20 July 2025), 2021.
Feigenwinter, I., Hörtnagl, L., and Buchmann, N.: N2O and CH4 fluxes from intensively managed grassland: The importance of biological and environmental drivers vs. management, Sci. Total Environ., 903, 166389, https://doi.org/10.1016/j.scitotenv.2023.166389, 2023a.
Feigenwinter, I., Hörtnagl, L., Zeeman, M. J., Eugster, W., Fuchs, K., Merbold, L., and Buchmann, N.: Large inter-annual variation in carbon sink strength of a permanent grassland over 16 years: Impacts of management practices and climate, Agric. For. Meteorol., 340, 109613, https://doi.org/10.1016/j.agrformet.2023.109613, 2023b.
Feigenwinter, I., Wang, Y., Hörtnagl, L., Turco, F., Maier, R., and Buchmann, N.: High N2O emissions after grassland destruction, in preparation, 2026.
Finger, R., Swinton, S. M., Benni, N. E., and Walter, A.: Precision farming at the nexus of agricultural production and the environment, Annu. Rev. Resour. Econ., 11, 313–335, https://doi.org/10.1146/annurev-resource-100518-093929, 2019.
Finn, J. A., Suter, M., Haughey, E., Hofer, D., and Luscher, A.: Greater gains in annual yields from increased plant diversity than losses from experimental drought in two temperate grasslands, Agric. Ecosyst. Environ., 258, 149–153, https://doi.org/10.1016/j.agee.2018.02.014, 2018.
Fischer, E. M. and Knutti, R.: Detection of spatially aggregated changes in temperature and precipitation extremes, Geophys. Res. Lett., 41, 547–554, https://doi.org/10.1002/2013GL058499, 2014.
Fu, Z., Ciais, P., Bastos, A., Stoy, P. C., Yang, H., Green, J. K., Wang, B., Yu, K., Huang, Y., Knohl, A., Šigut, L., Gharun, M., Cuntz, M., Arriga, N., Roland, M., Peichl, M., Migliavacca, M., Cremonese, E., Varlagin, A., Brümmer, C., Gourlez de la Motte, L., Fares, S., Buchmann, N., El-Madany, T. S., Pitacco, A., Vendrame, N., Li, Z., Vincke, C., Magliulo, E., and Koebsch, F.: Sensitivity of gross primary productivity to climatic drivers during the summer drought of 2018 in Europe, Philos. T. Roy. Soc. B, 375, 20190747, https://doi.org/10.1098/rstb.2019.0747, 2020.
Fuchs, K., Hörtnagl, L., Buchmann, N., Eugster, W., Snow, V., and Merbold, L.: Management matters: testing a mitigation strategy for nitrous oxide emissions using legumes on intensively managed grassland, Biogeosciences, 15, 5519–5543, https://doi.org/10.5194/bg-15-5519-2018, 2018.
Gharun, M., Hörtnagl, L., Paul-Limoges, E., Ghiasi, S., Feigenwinter, I., Burri, S., Marquardt, K., Etzold, S., Zweifel, R., Eugster, W., and Buchmann, N.: Physiological response of Swiss ecosystems to 2018 drought across plant types and elevation, Philos. T. Roy. Soc. B, 375, 20190521, https://doi.org/10.1098/rstb.2019.0521, 2020.
Gilgen, A. K. and Buchmann, N.: Response of temperate grasslands at different altitudes to simulated summer drought differed but scaled with annual precipitation, Biogeosciences, 6, 2525–2539, https://doi.org/10.5194/bg-6-2525-2009, 2009.
Gilmanov, T. G., Soussana, J. F., Aires, L., Allard, V., Ammann, C., Balzarolo, M., Barcza, Z., Bernhofer, C., Campbell, C. L., Cernusca, A., Cescatti, A., Clifton-Brown, J., Dirks, B. O. M., Dore, S., Eugster, W., Fuhrer, J., Gimeno, C., Gruenwald, T., Haszpra, L., Hensen, A., Ibrom, A., Jacobs, A. F. G., Jones, M. B., Lanigan, G., Laurila, T., Lohila, A., G.Manca, Marcolla, B., Nagy, Z., Pilegaard, K., Pinter, K., Pio, C., Raschi, A., Rogiers, N., Sanz, M. J., Stefani, P., Sutton, M., Tuba, Z., Valentini, R., Williams, M. L., and Wohlfahrt, G.: Partitioning European grassland net ecosystem CO2 exchange into gross primary productivity and ecosystem respiration using light response function analysis, Agric. Ecosyst. Environ., 121, 93–120, https://doi.org/10.1016/j.agee.2006.12.008, 2007.
Gou, R., Chi, J., Liu, J., Luo, Y., Shekhar, A., Mo, L., and Lin, G.: Atmospheric water demand constrains net ecosystem production in subtropical mangrove forests, J. Hydrol., 630, 130651, https://doi.org/10.1016/j.jhydrol.2024.130651, 2024.
Grillakis, M. G.: Increase in severe and extreme soil moisture droughts for Europe under climate change, Sci. Total Environ., 660, 1245–1255, https://doi.org/10.1016/j.scitotenv.2019.01.001, 2019.
Hartmann, A. A., Barnard, R. L., Marhan, S., and Niklaus, P. A.: Effects of drought and N-fertilization on N cycling in two grassland soils, Oecologia, 171, 705–717, https://doi.org/10.1007/s00442-012-2578-3, 2013.
He, L., Chen, J. M., Croft, H., Gonsamo, A., Luo, X., Liu, J., Zheng, T., Liu, R., and Liu, Y.: Nitrogen availability dampens the positive impacts of CO2 fertilization on terrestrial ecosystem carbon and water cycles, Geophys. Res. Lett., 44, 11590-11600, https://doi.org/10.1002/2017GL075981, 2017.
Heimsch, L., Lohila, A., Tuovinen, J.-P., Vekuri, H., Heinonsalo, J., Nevalainen, O., Korkiakoski, M., Liski, J., Laurila, T., and Kulmala, L.: Carbon dioxide fluxes and carbon balance of an agricultural grassland in southern Finland, Biogeosciences, 18, 3467–3483, https://doi.org/10.5194/bg-18-3467-2021, 2021.
Heimsch, L., Vira, J., Fer, I., Vekuri, H., Tuovinen, J.-P., Lohila, A., Liski, J., and Kulmala, L.: Impact of weather and management practices on greenhouse gas flux dynamics on an agricultural grassland in Southern Finland, Agric. Ecosyst. Environ., 374, 109179, https://doi.org/10.1016/j.agee.2024.109179, 2024.
Henwood, W. D.: An overview of protected areas in the temperate grasslands biome, Parks, 8, 3–8, 1998.
Hermann, M., Wernli, H., and Röthlisberger, M.: Drastic increase in the magnitude of very rare summer-mean vapor pressure deficit extremes, Nat. Commun., 15, 7022, https://doi.org/10.1038/s41467-024-51305-w, 2024.
Hofer, D., Suter, M., Buchmann, N., and Lüscher, A.: Nitrogen status of functionally different forage species explains resistance to severe drought and post-drought overcompensation, Agric. Ecosyst. Environ., 236, 312–322, https://doi.org/10.1016/j.agee.2016.11.022, 2017.
Horst, T. W.: A simple formula for attenuation of eddy fluxes measured with first-order-response scalar sensors, Bound.-Lay. Meteorol., 82, 219–233, https://doi.org/10.1023/A:1000229130034, 1997.
Hörtnagl, L.: diive v0.87.1, Zenodo [code], https://doi.org/10.5281/zenodo.15648669, 2025a.
Hörtnagl, L.: holukas/dataset_ch-cha_flux_product: FP2025.3, Zenodo [code], https://doi.org/10.5281/zenodo.16058144, 2025b.
Hörtnagl, L., Barthel, M., Buchmann, N., Eugster, W., Butterbach-Bahl, K., Díaz-Pinés, E., Zeeman, M., Klumpp, K., Kiese, R., Bahn, M., Hammerle, A., Lu, H., Ladreiter-Knauss, T., Burri, S., and Merbold, L.: Greenhouse gas fluxes over managed grasslands in Central Europe, Glob. Change Biol., 24, 1843–1872, https://doi.org/10.1111/gcb.14079, 2018.
Hörtnagl, L., Feigenwinter, I., Wang, Y., Buchmann, N., Merbold, L., Zeeman, M., Fuchs, K., and Eugster, W.: Eddy covariance ecosystem fluxes, meteorological data and detailed management information for the intensively managed grassland site Chamau in Switzerland, collected between 2005 and 2024: CH-CHA FP2025.3 (2005–2024), ETH Zurich [data set], https://doi.org/10.3929/ethz-b-000747025, 2025.
IPCC: Climate Change 2021 – The Physical Science Basis: Working Group I Contribution to the Sixth Assessment Report of the Intergovernmental Panel on Climate Change, Cambridge University Press, Cambridge, https://doi.org/10.1017/9781009157896, 2023.
Isbell, F., Craven, D., Connolly, J., Loreau, M., Schmid, B., Beierkuhnlein, C., Bezemer, T. M., Bonin, C., Bruelheide, H., de Luca, E., Ebeling, A., Griffin, J. N., Guo, Q., Hautier, Y., Hector, A., Jentsch, A., Kreyling, J., Lanta, V., Manning, P., Meyer, S. T., Mori, A. S., Naeem, S., Niklaus, P. A., Polley, H. W., Reich, P. B., Roscher, C., Seabloom, E. W., Smith, M. D., Thakur, M. P., Tilman, D., Tracy, B. F., van der Putten, W. H., van Ruijven, J., Weigelt, A., Weisser, W. W., Wilsey, B., and Eisenhauer, N.: Biodiversity increases the resistance of ecosystem productivity to climate extremes, Nature, 526, 574–577, https://doi.org/10.1038/nature15374, 2015.
Jia, G., Shevliakova, E., Artaxo, P., De-Docoudré, N., Houghton, R., House, J., Kitajima, K., Lennard, C., Popp, A., Sirin, A., Sukumar, R., Verchot, L., and Sporre, M.: Land–Climate interactions, in: Special Report on Climate Change and Land, IPCC, 133–206, 2019.
Keenan, T. F., Gray, J., Friedl, M. A., Toomey, M., Bohrer, G., Hollinger, D. Y., Munger, J. W., O'Keefe, J., Schmid, H. P., Wing, I. S., Yang, B., and Richardson, A. D.: Net carbon uptake has increased through warming-induced changes in temperate forest phenology, Nat. Clim. Change, 4, 598–604, https://doi.org/10.1038/nclimate2253, 2014.
Keenan, T. F., Luo, X., Stocker, B. D., De Kauwe, M. G., Medlyn, B. E., Prentice, I. C., Smith, N. G., Terrer, C., Wang, H., Zhang, Y., and Zhou, S.: A constraint on historic growth in global photosynthesis due to rising CO2, Nat. Clim. Change, 13, 1376–1381, https://doi.org/10.1038/s41558-023-01867-2, 2023.
Kendall, M. G.: Rank correlation methods, 2nd edn., Hafner Publishing Co., Oxford, England, vii, 196 pp., ISBN-13 978-0195208375, 1955.
Knauer, J., Cuntz, M., Smith, B., Canadell, J. G., Medlyn, B. E., Bennett, A. C., Caldararu, S., and Haverd, V.: Higher global gross primary productivity under future climate with more advanced representations of photosynthesis, Sci. Adv., 9, eadh9444, https://doi.org/10.1126/sciadv.adh9444, 2023.
Krebs, L., Hörtnagl, L., Scapucci, L., Gharun, M., Feigenwinter, I., and Buchmann, N.: Net ecosystem CO2 exchange of a subalpine spruce forest in Switzerland over 26 years: Effects of phenology and contributions of abiotic drivers at daily time scales, Glob. Change Biol., 31, e70371, https://doi.org/10.1111/gcb.70371, 2025.
Li, H., Zhang, F., Li, J., Guo, X., Zhou, H., and Li, Y.: Differential responses of CO2 and latent heat fluxes to climatic anomalies on two alpine grasslands on the northeastern Qinghai–Tibetan Plateau, Sci. Total Environ., 900, 165863, https://doi.org/10.1016/j.scitotenv.2023.165863, 2023a.
Li, L., Fan, W., Kang, X., Wang, Y., Cui, X., Xu, C., Griffin, K. L., and Hao, Y.: Responses of greenhouse gas fluxes to climate extremes in a semiarid grassland, Atmos. Environ., 142, 32–42, https://doi.org/10.1016/j.atmosenv.2016.07.039, 2016.
Li, L., Zheng, Z., Biederman, J. A., Qian, R., Ran, Q., Zhang, B., Xu, C., Wang, F., Zhou, S., Che, R., Dong, J., Xu, Z., Cui, X., Hao, Y., and Wang, Y.: Drought and heat wave impacts on grassland carbon cycling across hierarchical levels, Plant Cell Environ., 44, 2402–2413, https://doi.org/10.1111/pce.13767, 2021.
Li, Y., Korhonen, P., Kykkänen, S., Maljanen, M., Virkajärvi, P., and Shurpali, N. J.: Management practices during the renewal year affect the carbon balance of a boreal legume grassland, Front. Sustain. Food Syst., 7, 1158250, https://doi.org/10.3389/fsufs.2023.1158250, 2023b.
Lipper, L., Thornton, P., Campbell, B. M., Baedeker, T., Braimoh, A., Bwalya, M., Caron, P., Cattaneo, A., Garrity, D., Henry, K., Hottle, R., Jackson, L., Jarvis, A., Kossam, F., Mann, W., McCarthy, N., Meybeck, A., Neufeldt, H., Remington, T., Sen, P. T., Sessa, R., Shula, R., Tibu, A., and Torquebiau, E. F.: Climate-smart agriculture for food security, Nat. Clim. Change, 4, 1068–1072, https://doi.org/10.1038/nclimate2437, 2014.
Liu, Z., Chen, Z., Yang, M., Hao, T., Yu, G., Zhu, X., Zhang, W., Ma, L., Dou, X., Lin, Y., Luo, W., Han, L., Sun, M., Chen, S., Dong, G., Gao, Y., Hao, Y., Jiang, S., Li, Y., Li, Y., Liu, S., Shi, P., Tan, J., Tang, Y., Xin, X., Zhang, F., Zhang, Y., Zhao, L., Zhou, L., and Zhu, Z.: Precipitation consistently promotes, but temperature oppositely drives carbon fluxes in temperate and alpine grasslands in China, Agric. For. Meteorol., 344, 109811, https://doi.org/10.1016/j.agrformet.2023.109811, 2024.
Lundberg, S. M. and Lee, S.-I.: A unified approach to interpreting model predictions, in: Advances in Neural Information Processing Systems, arXiv, https://doi.org/10.48550/arXiv.1705.07874, ISBN 978-1-5108-6096-4, 2017.
Lundberg, S. M., Erion, G., Chen, H., DeGrave, A., Prutkin, J. M., Nair, B., Katz, R., Himmelfarb, J., Bansal, N., and Lee, S.-I.: From local explanations to global understanding with explainable AI for trees, Nat. Mach. Intell., 2, 56–67, https://doi.org/10.1038/s42256-019-0138-9, 2020.
Madani, N., Parazoo, N. C., Kimball, J. S., Ballantyne, A. P., Reichle, R. H., Maneta, M., Saatchi, S., Palmer, P. I., Liu, Z., and Tagesson, T.: Recent amplified global gross primary productivity due to temperature increase is offset by reduced productivity due to water constraints, AGU Adv., 1, e2020AV000180, https://doi.org/10.1029/2020AV000180, 2020.
Maier, R., Hörtnagl, L., and Buchmann, N.: Greenhouse gas fluxes (CO2, N2O and CH4) of pea and maize during two cropping seasons: Drivers, budgets, and emission factors for nitrous oxide, Sci. Total Environ., 849, 157541, https://doi.org/10.1016/j.scitotenv.2022.157541, 2022.
Mann, H. B.: Nonparametric tests against trend, Econometrica, 13, 245–259, https://doi.org/10.2307/1907187, 1945.
Merbold, L., Eugster, W., Stieger, J., Zahniser, M., Nelson, D., and Buchmann, N.: Greenhouse gas budget (CO2, CH4 and N2O) of intensively managed grassland following restoration, Glob. Change Biol., 20, 1913–1928, https://doi.org/10.1111/gcb.12518, 2014.
MeteoSwiss: Klimabulletin Jahr 2022, https://www.meteoschweiz.admin.ch/service-und-publikationen/publikationen/berichte-und-bulletins/2022/klimabulletin-jahr-2022.html (last access: 20 July 2025), 2023.
MeteoSwiss: Klimabulletin Jahr 2023, https://www.meteoschweiz.admin.ch/service-und-publikationen/publikationen/berichte-und-bulletins/2023/klimabulletin-jahr-2023.html (last access: 20 July 2025), 2024.
Molnar, C.: Interpreting Machine Learning Models with SHAP: A Guide with Python Examples and Theory on Shapley Values, Christoph Molnar c/o MUCBOOK, Heidi Seibold, 208 pp., 2023.
Moncrieff, J., Clement, R., Finnigan, J., and Meyers, T.: Averaging, detrending, and filtering of eddy covariance time series, in: Handbook of Micrometeorology: A Guide for Surface Flux Measurement and Analysis, edited by: Lee, X., Massman, W., and Law, B., Springer Netherlands, Dordrecht, 7–31, https://doi.org/10.1007/1-4020-2265-4_2, 2005.
Myneni, R. B., Keeling, C. D., Tucker, C. J., Asrar, G., and Nemani, R. R.: Increased plant growth in the northern high latitudes from 1981 to 1991, Nature, 386, 698–702, https://doi.org/10.1038/386698a0, 1997.
Norby, R. J., Warren, J. M., Iversen, C. M., Medlyn, B. E., and McMurtrie, R. E.: CO2 enhancement of forest productivity constrained by limited nitrogen availability, P. Natl. Acad. Sci. USA, 107, 19368–19373, https://doi.org/10.1073/pnas.1006463107, 2010.
Pastorello, G., Trotta, C., Canfora, E., Chu, H., Christianson, D., Cheah, Y.-W., Poindexter, C., Chen, J., Elbashandy, A., Humphrey, M., Isaac, P., Polidori, D., Reichstein, M., Ribeca, A., van Ingen, C., Vuichard, N., Zhang, L., Amiro, B., Ammann, C., Arain, M. A., Ardö, J., Arkebauer, T., Arndt, S. K., Arriga, N., Aubinet, M., Aurela, M., Baldocchi, D., Barr, A., Beamesderfer, E., Marchesini, L. B., Bergeron, O., Beringer, J., Bernhofer, C., Berveiller, D., Billesbach, D., Black, T. A., Blanken, P. D., Bohrer, G., Boike, J., Bolstad, P. V., Bonal, D., Bonnefond, J.-M., Bowling, D. R., Bracho, R., Brodeur, J., Brümmer, C., Buchmann, N., Burban, B., Burns, S. P., Buysse, P., Cale, P., Cavagna, M., Cellier, P., Chen, S., Chini, I., Christensen, T. R., Cleverly, J., Collalti, A., Consalvo, C., Cook, B. D., Cook, D., Coursolle, C., Cremonese, E., Curtis, P. S., D’Andrea, E., da Rocha, H., Dai, X., Davis, K. J., Cinti, B. D., Grandcourt, A. d., Ligne, A. D., De Oliveira, R. C., Delpierre, N., Desai, A. R., Di Bella, C. M., Tommasi, P. d., Dolman, H., Domingo, F., Dong, G., Dore, S., Duce, P., Dufrêne, E., Dunn, A., Dušek, J., Eamus, D., Eichelmann, U., ElKhidir, H. A. M., Eugster, W., Ewenz, C. M., Ewers, B., Famulari, D., Fares, S., Feigenwinter, I., Feitz, A., Fensholt, R., Filippa, G., Fischer, M., Frank, J., Galvagno, M., Gharun, M., Gianelle, D., Gielen, B., Gioli, B., Gitelson, A., Goded, I., Goeckede, M., Goldstein, A. H., Gough, C. M., Goulden, M. L., Graf, A., Griebel, A., Gruening, C., Grünwald, T., Hammerle, A., Han, S., Han, X., Hansen, B. U., Hanson, C., Hatakka, J., He, Y., Hehn, M., Heinesch, B., Hinko-Najera, N., Hörtnagl, L., Hutley, L., Ibrom, A., Ikawa, H., Jackowicz-Korczynski, M., Janouš, D., Jans, W., Jassal, R., Jiang, S., Kato, T., Khomik, M., Klatt, J., Knohl, A., Knox, S., Kobayashi, H., Koerber, G., Kolle, O., Kosugi, Y., Kotani, A., Kowalski, A., Kruijt, B., Kurbatova, J., Kutsch, W. L., Kwon, H., Launiainen, S., Laurila, T., Law, B., Leuning, R., Li, Y., Liddell, M., Limousin, J.-M., Lion, M., Liska, A. J., Lohila, A., López-Ballesteros, A., López-Blanco, E., Loubet, B., Loustau, D., Lucas-Moffat, A., Lüers, J., Ma, S., Macfarlane, C., Magliulo, V., Maier, R., Mammarella, I., Manca, G., Marcolla, B., Margolis, H. A., Marras, S., Massman, W., Mastepanov, M., Matamala, R., Matthes, J. H., Mazzenga, F., McCaughey, H., McHugh, I., McMillan, A. M. S., Merbold, L., Meyer, W., Meyers, T., Miller, S. D., Minerbi, S., Moderow, U., Monson, R. K., Montagnani, L., Moore, C. E., Moors, E., Moreaux, V., Moureaux, C., Munger, J. W., Nakai, T., Neirynck, J., Nesic, Z., Nicolini, G., Noormets, A., Northwood, M., Nosetto, M., Nouvellon, Y., Novick, K., Oechel, W., Olesen, J. E., Ourcival, J.-M., Papuga, S. A., Parmentier, F.-J., Paul-Limoges, E., Pavelka, M., Peichl, M., Pendall, E., Phillips, R. P., Pilegaard, K., Pirk, N., Posse, G., Powell, T., Prasse, H., Prober, S. M., Rambal, S., Rannik, U., Raz-Yaseef, N., Rebmann, C., Reed, D., Dios, V. R. d., Restrepo-Coupe, N., Reverter, B. R., Roland, M., Sabbatini, S., Sachs, T., Saleska, S. R., Sánchez-Cañete, E. P., Sanchez-Mejia, Z. M., Schmid, H. P., Schmidt, M., Schneider, K., Schrader, F., Schroder, I., Scott, R. L., Sedlák, P., Serrano-Ortíz, P., Shao, C., Shi, P., Shironya, I., Siebicke, L., Šigut, L., Silberstein, R., Sirca, C., Spano, D., Steinbrecher, R., Stevens, R. M., Sturtevant, C., Suyker, A., Tagesson, T., Takanashi, S., Tang, Y., Tapper, N., Thom, J., Tomassucci, M., Tuovinen, J.-P., Urbanski, S., Valentini, R., van der Molen, M., van Gorsel, E., van Huissteden, K., Varlagin, A., Verfaillie, J., Vesala, T., Vincke, C., Vitale, D., Vygodskaya, N., Walker, J. P., Walter-Shea, E., Wang, H., Weber, R., Westermann, S., Wille, C., Wofsy, S., Wohlfahrt, G., Wolf, S., Woodgate, W., Li, Y., Zampedri, R., Zhang, J., Zhou, G., Zona, D., Agarwal, D., Biraud, S., Torn, M., and Papale, D.: The FLUXNET2015 dataset and the ONEFlux processing pipeline for eddy covariance data, Sci. Data, 7, 225, https://doi.org/10.1038/s41597-020-0534-3, 2020.
Pedregosa, F., Varoquaux, G., Gramfort, A., Michel, V., Thirion, B., Grisel, O., Blondel, M., Prettenhofer, P., Weiss, R., Dubourg, V., Vanderplas, J., Passos, A., Cournapeau, D., Brucher, M., Perrot, M., and Duchesnay, É.: Scikit-learn: Machine Learning in Python, J. Mach. Learn. Res., 12, 2825–2830, 2011.
Peichl, M., Leahy, P., and Kiely, G.: Six-year stable annual uptake of carbon dioxide in intensively managed humid temperate grassland, Ecosystems, 14, 112–126, https://doi.org/10.1007/s10021-010-9398-2, 2011.
Piao, S., Friedlingstein, P., Ciais, P., Viovy, N., and Demarty, J.: Growing season extension and its impact on terrestrial carbon cycle in the Northern Hemisphere over the past 2 decades, Glob. Biogeochem. Cycles, 21, https://doi.org/10.1029/2006GB002888, 2007.
Python Software Foundation: Python 3.11.11, Python Software Foundation, https://www.python.org (last access: 20 July 2025), 2024.
Qiu, W., Chen, H., Dincer, A. B., Lundberg, S., Kaeberlein, M., and Lee, S.-I.: Interpretable machine learning prediction of all-cause mortality, Commun. Med., 2, 1–15, https://doi.org/10.1038/s43856-022-00180-x, 2022.
R Core Team: R: A Language and Environment for Statistical Computing, R Foundation for Statistical Computing, Vienna, Austria, https://www.R-project.org/ (last access: 20 July 2025), 2024.
Reichstein, M., Falge, E., Baldocchi, D., Papale, D., Aubinet, M., Berbigier, P., Bernhofer, C., Buchmann, N., Gilmanov, T., Granier, A., Grunwald, T., Havrankova, K., Ilvesniemi, H., Janous, D., Knohl, A., Laurila, T., Lohila, A., Loustau, D., Matteucci, G., Meyers, T., Miglietta, F., Ourcival, J.-M., Pumpanen, J., Rambal, S., Rotenberg, E., Sanz, M., Tenhunen, J., Seufert, G., Vaccari, F., Vesala, T., Yakir, D., and Valentini, R.: On the separation of net ecosystem exchange into assimilation and ecosystem respiration: review and improved algorithm, Glob. Change Biol., 11, 1424–1439, https://doi.org/10.1111/j.1365-2486.2005.001002.x, 2005.
Reichstein, M., Bahn, M., Ciais, P., Frank, D., Mahecha, M. D., Seneviratne, S. I., Zscheischler, J., Beer, C., Buchmann, N., Frank, D. C., Papale, D., Rammig, A., Smith, P., Thonicke, K., van der Velde, M., Vicca, S., Walz, A., and Wattenbach, M.: Climate extremes and the carbon cycle, Nature, 500, 287–295, https://doi.org/10.1038/nature12350, 2013.
Richter, F., Suter, M., Lüscher, A., Buchmann, N., El Benni, N., Feola-Conz, R., Hartmann, M., Jan, P., and Klaus, V. H.: Effects of management practices on the ecosystem-service multifunctionality of temperate grasslands, Nat. Commun., 15, 3829, https://doi.org/10.1038/s41467-024-48049-y, 2024.
Rogger, J., Hörtnagl, L., Buchmann, N., and Eugster, W.: Carbon dioxide fluxes of a mountain grassland: Drivers, anomalies and annual budgets, Agric. For. Meteorol., 314, 108801, https://doi.org/10.1016/j.agrformet.2021.108801, 2022.
Roth, K.: Bodenkartierung und GIS-basierte Kohlenstoffinventur von Graslandboden: Untersuchungen an den ETH-Forschungs-stationen Chamau und Fruebuel (ZG, Schweiz), Inst. Geogr. Univ. Zurich Master's Thesis, 2006.
Sabbatini, S., Mammarella, I., Arriga, N., Fratini, G., Graf, A., Hörtnagl, L., Ibrom, A., Longdoz, B., Mauder, M., Merbold, L., Metzger, S., Montagnani, L., Pitacco, A., Rebmann, C., Sedlák, P., Šigut, L., Vitale, D., and Papale, D.: Eddy covariance raw data processing for CO2 and energy fluxes calculation at ICOS ecosystem stations, Int. Agrophys., 32, 495–515, https://doi.org/10.1515/intag-2017-0043, 2018.
Schaub, S., Finger, R., Leiber, F., Probst, S., Kreuzer, M., Weigelt, A., Buchmann, N., and Scherer-Lorenzen, M.: Plant diversity effects on forage quality, yield and revenues of semi-natural grasslands, Nat. Commun., 11, 768, https://doi.org/10.1038/s41467-020-14541-4, 2020.
Schaub, S., Finger, R., Buchmann, N., Steiner, V., and Klaus, V. H.: The costs of diversity: higher prices for more diverse grassland seed mixtures, Environ. Res. Lett., 16, 094011, https://doi.org/10.1088/1748-9326/ac1a9c, 2021.
Scherrer, S. C., Hirschi, M., Spirig, C., Maurer, F., and Kotlarski, S.: Trends and drivers of recent summer drying in Switzerland, Environ. Res. Commun., 4, 025004, https://doi.org/10.1088/2515-7620/ac4fb9, 2022.
Schils, R. L. M., Aarts, H. F. M., Bussink, D. W., Conijn, J. G., Corre, V. J., Dam, A. M. van, Hoving, I. E., Meer, H. G. van der, and Velthof, G. L.: Grassland renovation in the Netherlands; agronomic, environmetal and economic issues, Grassl. Resowing Grass-Arable Crops Rotat., 9–24, 2007.
Schils, R. L. M., Bufe, C., Rhymer, C. M., Francksen, R. M., Klaus, V. H., Abdalla, M., Milazzo, F., Lellei-Kovács, E., Berge, H. ten, Bertora, C., Chodkiewicz, A., Damatîrca, C., Feigenwinter, I., Fernández-Rebollo, P., Ghiasi, S., Hejduk, S., Hiron, M., Janicka, M., Pellaton, R., Smith, K. E., Thorman, R., Vanwalleghem, T., Williams, J., Zavattaro, L., Kampen, J., Derkx, R., Smith, P., Whittingham, M. J., Buchmann, N., and Price, J. P. N.: Permanent grasslands in Europe: Land use change and intensification decrease their multifunctionality, Agric. Ecosyst. Environ., 330, 107891, https://doi.org/10.1016/j.agee.2022.107891, 2022.
Schwalm, C. R., Williams, C. A., Schaefer, K., Arneth, A., Bonal, D., Buchmann, N., Chen, J., Law, B. E., Lindroth, A., Luyssaert, S., Reichstein, M., and Richardson, A. D.: Assimilation exceeds respiration sensitivity to drought: A FLUXNET synthesis, Glob. Change Biol., 16, 657–670, https://doi.org/10.1111/j.1365-2486.2009.01991.x, 2010.
Sen, P. K.: Estimates of the regression coefficient based on Kendall's tau, J. Am. Stat. Assoc., 63, 1379–1389, 1968.
Shekhar, A., Buchmann, N., Humphrey, V., and Gharun, M.: More than three-fold increase in compound soil and air dryness across Europe by the end of 21st century, Weather Clim. Extrem., 44, 100666, https://doi.org/10.1016/j.wace.2024.100666, 2024.
Shi, L., Lin, Z., Tang, S., Peng, C., Yao, Z., Xiao, Q., Zhou, H., Liu, K., and Shao, X.: Interactive effects of warming and managements on carbon fluxes in grasslands: A global meta-analysis, Agric. Ecosyst. Environ., 340, 108178, https://doi.org/10.1016/j.agee.2022.108178, 2022.
Soussana, J.-F., Loiseau, P., Vuichard, N., Ceschia, E., Balesdent, J., Chevallier, T., and Arrouays, D.: Carbon cycling and sequestration opportunities in temperate grasslands, Soil Use Manag., 20, 219–230, https://doi.org/10.1111/j.1475-2743.2004.tb00362.x, 2004.
SUPER-G: PG Portraits, https://www.super-g.eu/pg-portraits/ (last access: 20 July 2025), 2018.
Terrer, C., Jackson, R. B., Prentice, I. C., Keenan, T. F., Kaiser, C., Vicca, S., Fisher, J. B., Reich, P. B., Stocker, B. D., Hungate, B. A., Peñuelas, J., McCallum, I., Soudzilovskaia, N. A., Cernusak, L. A., Talhelm, A. F., Van Sundert, K., Piao, S., Newton, P. C. D., Hovenden, M. J., Blumenthal, D. M., Liu, Y. Y., Müller, C., Winter, K., Field, C. B., Viechtbauer, W., Van Lissa, C. J., Hoosbeek, M. R., Watanabe, M., Koike, T., Leshyk, V. O., Polley, H. W., and Franklin, O.: Nitrogen and phosphorus constrain the CO2 fertilization of global plant biomass, Nat. Clim. Change, 9, 684–689, https://doi.org/10.1038/s41558-019-0545-2, 2019.
Teuling, A. J., Seneviratne, S. I., Stöckli, R., Reichstein, M., Moors, E., Ciais, P., Luyssaert, S., van den Hurk, B., Ammann, C., Bernhofer, C., Dellwik, E., Gianelle, D., Gielen, B., Grünwald, T., Klumpp, K., Montagnani, L., Moureaux, C., Sottocornola, M., and Wohlfahrt, G.: Contrasting response of European forest and grassland energy exchange to heatwaves, Nat. Geosci., 3, 722–727, https://doi.org/10.1038/ngeo950, 2010.
Wall, A. M., Campbell, D. I., Mudge, P. L., Rutledge, S., and Schipper, L. A.: Carbon budget of an intensively grazed temperate grassland with large quantities of imported supplemental feed, Agric. Ecosyst. Environ., 281, 1–15, https://doi.org/10.1016/j.agee.2019.04.019, 2019.
Wall, A. M., Campbell, D. I., Mudge, P. L., and Schipper, L. A.: Temperate grazed grassland carbon balances for two adjacent paddocks determined separately from one eddy covariance system, Agric. For. Meteorol., 287, 107942, https://doi.org/10.1016/j.agrformet.2020.107942, 2020.
Walter, A., Finger, R., Huber, R., and Buchmann, N.: Smart farming is key to developing sustainable agriculture, P. Natl. Acad. Sci. USA, 114, 6148–6150, https://doi.org/10.1073/pnas.1707462114, 2017.
Wang, N., Quesada, B., Xia, L., Butterbach-Bahl, K., Goodale, C. L., and Kiese, R.: Effects of climate warming on carbon fluxes in grasslands – A global meta-analysis, Glob. Change Biol., 25, 1839–1851, https://doi.org/10.1111/gcb.14603, 2019.
Wang, Y., Klaus, V. H., Gilgen, A. K., and Buchmann, N.: Temperate grasslands under climate extremes: Effects of plant diversity on ecosystem services, Agric. Ecosyst. Environ., 379, 109372, https://doi.org/10.1016/j.agee.2024.109372, 2025.
Wang, Y., Feigenwinter, I., Hörtnagl, L., Gilgen, A. K., and Buchmann, N.: Dataset including 20 years of daily CO2 fluxes, meteorological data, and management information during regrowth periods from the intensively managed grassland site Chamau, ETH Zurich [data set], https://doi.org/10.3929/ethz-b-000745429, 2026.
Webb, E. K., Pearman, G. I., and Leuning, R.: Correction of flux measurements for density effects due to heat and water vapour transfer, Q. J. R. Meteorol. Soc., 106, 85–100, https://doi.org/10.1002/qj.49710644707, 1980.
White, R. P., Murray, S., Rohweder, M., Prince, S., and Thompson, K.: Pilot Analysis of Global Ecosystems: Grassland Ecosystems, World Resources Institute Washington, DC, USA, 2000.
Wilczak, J. M., Oncley, S. P., and Stage, S. A.: Sonic Anemometer Tilt Correction Algorithms, Bound.-Lay. Meteorol., 99, 127–150, https://doi.org/10.1023/A:1018966204465, 2001.
Winck, B., Klumpp, K., and Bloor, J. M. G.: Interactive effects of management and temperature anomalies on CO2 fluxes recorded over 18 years in a temperate upland grassland system, Agric. For. Meteorol., 362, 110343, https://doi.org/10.1016/j.agrformet.2024.110343, 2025.
Winck, B. R., Bloor, J. M. G., and Klumpp, K.: Eighteen years of upland grassland carbon flux data: reference datasets, processing, and gap-filling procedure, Sci. Data, 10, 311, https://doi.org/10.1038/s41597-023-02221-z, 2023.
Winkler, K., Fuchs, R., Rounsevell, M., and Herold, M.: Global land use changes are four times greater than previously estimated, Nat. Commun., 12, 2501, https://doi.org/10.1038/s41467-021-22702-2, 2021.
Wohlfahrt, G., Hammerle, A., Haslwanter, A., Bahn, M., Tappeiner, U., and Cernusca, A.: Seasonal and inter-annual variability of the net ecosystem CO2 exchange of a temperate mountain grassland: Effects of weather and management, J. Geophys. Res.-Atmos., 113, D08110, https://doi.org/10.1029/2007JD009286, 2008.
Woo, D. K., Riley, W. J., Grant, R. F., and Wu, Y.: Site-specific field management adaptation is key to feeding the world in the 21st century, Agric. For. Meteorol., 327, 109230, https://doi.org/10.1016/j.agrformet.2022.109230, 2022.
World Bank: Climate-Smart Agriculture, https://www.worldbank.org/en/topic/climate-smartagriculture (last access: 22 October 2025), 2024.
Wutzler, T., Lucas-Moffat, A., Migliavacca, M., Knauer, J., Sickel, K., Šigut, L., Menzer, O., and Reichstein, M.: Basic and extensible post-processing of eddy covariance flux data with REddyProc, Biogeosciences, 15, 5015–5030, https://doi.org/10.5194/bg-15-5015-2018, 2018.
Xia, J., Niu, S., Ciais, P., Janssens, I. A., Chen, J., Ammann, C., Arain, A., Blanken, P. D., Cescatti, A., Bonal, D., Buchmann, N., Curtis, P. S., Chen, S., Dong, J., Flanagan, L. B., Frankenberg, C., Georgiadis, T., Gough, C. M., Hui, D., Kiely, G., Li, J., Lund, M., Magliulo, V., Marcolla, B., Merbold, L., Montagnani, L., Moors, E. J., Olesen, J. E., Piao, S., Raschi, A., Roupsard, O., Suyker, A. E., Urbaniak, M., Vaccari, F. P., Varlagin, A., Vesala, T., Wilkinson, M., Weng, E., Wohlfahrt, G., Yan, L., and Luo, Y.: Joint control of terrestrial gross primary productivity by plant phenology and physiology, P. Natl. Acad. Sci. USA, 112, 2788–2793, https://doi.org/10.1073/pnas.1413090112, 2015.
Xu, C., McDowell, N. G., Fisher, R. A., Wei, L., Sevanto, S., Christoffersen, B. O., Weng, E., and Middleton, R. S.: Increasing impacts of extreme droughts on vegetation productivity under climate change, Nat. Clim. Change, 9, 948–953, https://doi.org/10.1038/s41558-019-0630-6, 2019.
Zeeman, M. J., Hiller, R., Gilgen, A. K., Michna, P., Plüss, P., Buchmann, N., and Eugster, W.: Management and climate impacts on net CO2 fluxes and carbon budgets of three grasslands along an elevational gradient in Switzerland, Agric. For. Meteorol., 150, 519–530, https://doi.org/10.1016/j.agrformet.2010.01.011, 2010.
Zhou, G., Luo, Q., Chen, Y., He, M., Zhou, L., Frank, D., He, Y., Fu, Y., Zhang, B., and Zhou, X.: Effects of livestock grazing on grassland carbon storage and release override impacts associated with global climate change, Glob. Change Biol., 25, 1119–1132, https://doi.org/10.1111/gcb.14533, 2019.
Zscheischler, J., Reichstein, M., Harmeling, S., Rammig, A., Tomelleri, E., and Mahecha, M. D.: Extreme events in gross primary production: a characterization across continents, Biogeosciences, 11, 2909–2924, https://doi.org/10.5194/bg-11-2909-2014, 2014.