the Creative Commons Attribution 4.0 License.
the Creative Commons Attribution 4.0 License.
 | 04 Mar 2026
Spatializing Net Ecosystem Exchange in the Brazilian Amazon biome using the JULES model and vegetation properties
Amauri C. Prudente Jr.
Luiz A. T. Machado
Felipe S. Silva
Tercio Ambrizzi
Paulo Artaxo
Santiago Botia
Luan P. Cordeiro
Cleo Q. Dias Jr.
Edmilson Freitas
Demerval S. Moreira
Christopher Pöhlker
Ivan M. C. Toro
Luciana V. Rizzo
The large extension and diversity of the Brazilian Amazon biome hampers the assessment of the regional-scale carbon budget based solely on local observations. Considering the shortage of observations, this study aims to examine the carbon fluxes throughout the Brazilian Amazon biome using a process-based model (JULES, Joint UK land environment simulator). A sensitivity analysis detected five critical model parameters for the Amazon tropical broadleaf evergreen forest, optimized using carbon flux and meteorological data from four forest sites. The simulations with the new parametrization were compared with JULES default parameter values and with simulations of the Vegetation Photosynthesis and Respiration Model (VPRM). Net ecosystem exchange (NEE) and gross primary production (GPP) estimates were improved at all sites, reaching a Root Mean Squared Error (RMSE) about 30 % lower in comparison to the default version. The optimized parameter values varied among the four sites, indicating that a single parameterization for the whole Amazonia may not be adequate. JULES model parameters were spatialized for the Brazilian Amazonia, based on canopy height and leaf area index gridded data. Applying JULES with spatially dependent parameterization for the year 2021 resulted in a carbon sink of −1.34 Pg C yr−1. Regional differences were observed in the carbon fluxes, with a carbon source of 0.75 kg C m−2 yr−1 in the southwest and north, likely explained by increased ecosystem respiration in older and taller forests.
- Article
(5798 KB) - Full-text XML
-
Supplement
(3575 KB) - BibTeX
- EndNote


The Amazon forest is one of the largest carbon reservoirs in the world, being relevant to the global environment, biodiversity, and climate regulation (Brienen et al., 2015). Amazon forests are responsible for 16 % of the gross primary production in terrestrial ecosystems, storing approximately 90 Pg C in above and below-ground vegetation biomass (Saatchi et al., 2011; Malhi et al., 2021). The region's critical role in the global carbon budget is at risk, as carbon dynamics are being significantly impacted by climate change, including rising air temperatures and increased hydric stress (Liu et al., 2017; Gatti et al., 2021). These effects can lead to a decrease in the leaf area index (LAI) and an increase in plant respiration (Meir et al., 2008) and hence influence the sign of the net carbon exchange, shifting areas from a sink to a source of carbon.
Accurate estimates of carbon fluxes are crucial for understanding how the Amazon will evolve under the impacts of climate change. Because the Amazon forest is ecologically and structurally heterogeneous, carbon fluxes between the biosphere and the atmosphere vary markedly across the region, making site-specific estimates essential for capturing this spatial diversity (Restrepo-Coupe et al., 2013). The traditional method of carbon flux measurement is the Eddy-covariance (Baldochi, 2003), which quantifies the Net Ecosystem Exchange (NEE) by measuring the CO2 turbulent exchange and correcting for canopy storage. NEE represents the difference between the gross primary production (GPP) of vegetation and emissions from the ecosystem respiration (Reco) (Hayek et al., 2018). However, Eddy-covariance measurements are insufficient to represent the vast diversity of ecosystems and vegetation in the Brazilian Amazon biome (Aguirre-Gutierrez et al., 2025). This limitation arises due to logistical challenges, the substantial investment required for installation and equipment, and the need for highly skilled labor to ensure proper maintenance (Andreae et al., 2015). Considering the limitation of expanding flux towers throughout the Amazon biome, process-based and data-driven models have been applied in different studies to estimate NEE in different parts of the Amazon, such as the Vegetation Photosynthesis and Respiration Model (VPRM) (Mahadevan et al., 2008), FluxCom (Nelson et al., 2024; Chen et al., 2024), and the Organizing Carbon and Hydrology in Dynamic Ecosystems (ORCHIDEE model) (Verbeeck et al., 2011).
One of the comprehensive land surface models used to simulate biophysical processes is the Joint UK Land Environment Simulator (JULES; Best et al., 2011). JULES is a community land surface model used both as a standalone system and as the land surface component of the Met Office Unified Model. It is considered the state-of-the-art for large-scale simulations (Moreira et al., 2013; Harper et al., 2018). JULES has a tiled model of sub-grid heterogeneity able to reproduce energy, water, carbon, and momentum fluxes (Best et al., 2011; Clark et al., 2011). The model was progressively updated, enhancing the number of plant functional types (PFT): five PFTs (HadGEM3, Clark et al., 2011), nine PFTs (Harper et al., 2016), more recently 13 PFTs (UKESM1, Harper et al., 2018), and additionally four non-vegetation land cover types. Currently, JULES is used to simulate carbon fluxes in different biome types, as applied for agriculture (Osborne et al., 2015; Williams et al., 2017) and tropical forests (Moreira et al., 2013; Restrepo-Coupe et al., 2017; Caen et al., 2022).
Although JULES has been widely used in various studies to estimate carbon fluxes in tropical regions, a lack of specific parameterizations remains a challenge to simulate plant-soil-atmosphere interactions. Harper et al. (2016) introduced a PFT specific to tropical forests, but this parameterization has not been thoroughly tested or validated across different regions of the Amazon. Additionally, the most sensitive parameters in this region have not been deeply evaluated. In general, studies to estimate NEE using process-based models have not accounted for the large differences of vegetation characteristics across this territory (Ometto et al., 2023). Based on these aspects, this study aims to characterize the seasonal and spatial variability of carbon fluxes between the biosphere and atmosphere in the Brazilian Amazon biome. Here, we present an improvement of the JULES parameterization specifically for the Brazilian Amazon, performing a sensitivity analysis of the model parameters using Eddy-covariance tower sites in different regions of the Brazilian Amazon biome. Model parameters were spatialized using two ancillary datasets – canopy height and LAI – to estimate regional differences in NEE in the Brazilian Amazon biome.
The current study combined observational datasets and modeling. Section 2.1 describes the study area and the tower flux sites in the Brazilian Amazon Basin. Section 2.2 describes the main features of the JULES model. Section 2.3 describes the meteorological and edaphological datasets used as input for the JULES run and the Eddy covariance dataset used to validate the model optimization. Section 2.4 describes the gridded data used for simulations in the Brazilian Amazon biome. Section 2.5 describes the JULES model procedures adopted in this study – including the sensitivity analyses and calibration steps – as well as the remote sensing data and the regression approach used to extrapolate the JULES model parameters across the Amazon Basin. Section 2.6 describes the VPRM model that was used to compare with the JULES model at the tower sites.
2.1 Study area
The study area corresponds to the Brazilian Amazon biome, covering 4 212 472 km2. We compiled carbon flux data from five Eddy-covariance towers to evaluate JULES simulations (Fig. 1). From east to west and north to south, these sites are: The Amazon Tall Tower Observatory (ATTO), the Tapajos National Forest (K67, K83), the Reserva Jarú (RJA), and the Reserva Cuieiras near Manaus (K34). The equatorial forest was represented by 4 towers (ATTO, K34, K67, K83), and RJA represented the southern Amazonia (Restrepo-Coupe et al., 2021). The K34 tower is located 60 km north of the city of Manaus (Araújo et al., 2002; Restrepo-Coupe et al., 2013) (Table 1). The Santarem moist tropical forest (sites K67 and K83) is located at the confluence of the Amazon and Tapajós rivers, in the northeast Brazilian Amazon. The ATTO tower is the most recent tower built in the Amazon region, based 150 km northeast of the city of Manaus (Andreae et al., 2015). In the southern Amazon region, the RJA tower is located in a forest reserve in the state of Rondônia, characterized as Aw: Tropical savanna climate with dry season in the Köppen-Geiger climate classification (Peel et al., 2007). Some of these flux towers are still operational, while others have been discontinued. As such, observations from each tower are available for different periods ranging from 2001 to 2021, sometimes with intermittent measurements. For the current study, data from different years were used in the JULES model calibration (see Table 1). A complete year of data was selected for each site, comprising the most reliable set of observations in terms of both data coverage and quality assurance. Using a single year of data for each site provided similar conditions for model parameter optimisation at the different sites. To minimise the influence of atypical atmospheric conditions, years with extreme dryness or wetness were avoided during the model optimization process. The towers K34, K67, RJA, and ATTO were used in model calibration. The K83 tower was used as an independent reference point to validate the spatialization model. This tower was selected as independent data based on the availability and quality of observational data over a period of one year.
Table 1Description of five different eddy covariance towers based on Amazon region (Restrepo-Coupe et al., 2021). LAI data is from ERA5 and Canopy Height data is from the Global Canopy Forest (Simardi et al., 2011).
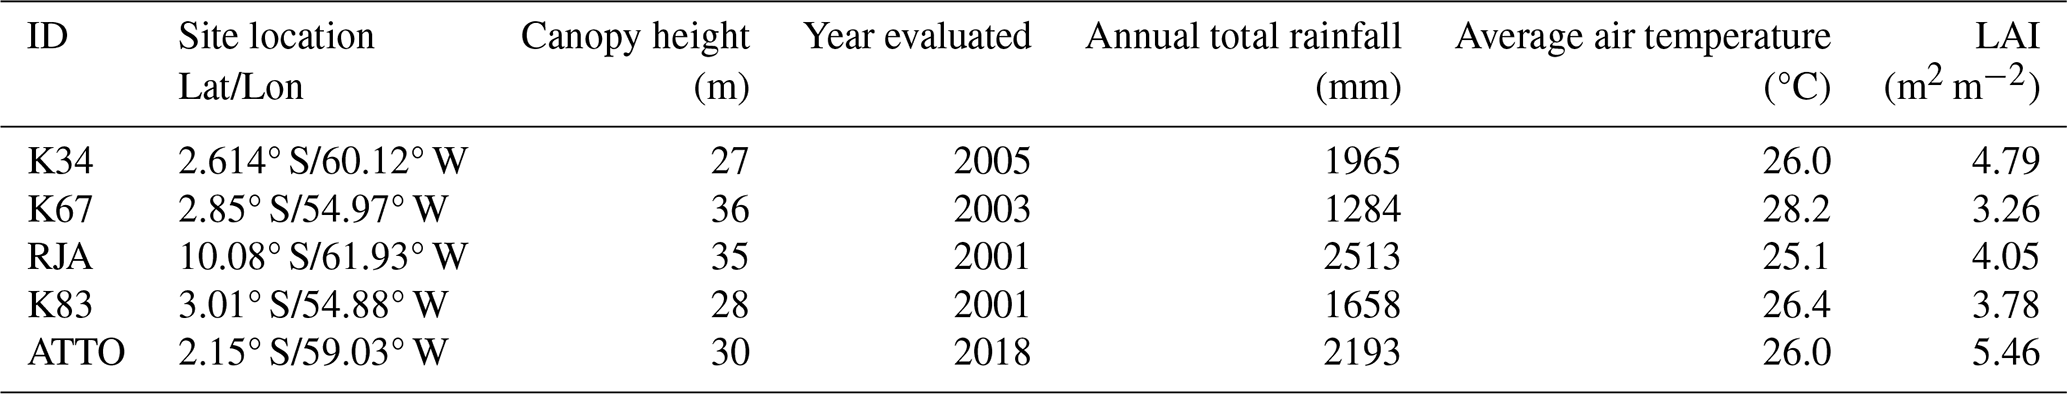
All the Eddy-covariance flux towers are located in upland (terra firme) forest sites, with canopy heights in the range 27–36 m and LAI in the range 3.26–5.46 m2 m−2 (Table 1), respectively comprising 61 % and 85 % of the distribution of values in the study area (Fig. 1). The five flux towers considered in this study represent upland forests in regions with subtle differences in climate regime and in the level of stress associated with deforestation and climate change pressures. While the K34 and ATTO towers are located in pristine forest reserves in the Western Amazonia, the RJA tower sits in a forest reserve surrounded by agricultural areas in Southwestern Amazonia. The K67 and K83 towers sit in a forest reserve near the deforestation frontier in the Eastern Amazonia. Therefore, this set of flux towers spans diverse upland forest communities, which cover more than 80 % of the Amazon biome (Moraes et al., 2021). However, it is important to acknowledge that this set of flux towers is not representative of all Amazonian ecosystems, like seasonally flooded, swamp, or white sand forests.
Figure 1Eddy-covariance towers across the Brazilian Amazon biome (red symbols) used to validate JULES simulation. Gridded background colors denote the spatial distribution of leaf area index (m2 m−2) on the left panel and canopy height (m) on the right panel (refer to Sect. 2.4). The black symbol indicates the tower used to validate the spatialization of JULES parameters. LAI data is from ERA5, and canopy height data is from the Global Canopy Forest (Simardi et al., 2011).
2.2 JULES model description
JULES is a land surface model that can simulate carbon fluxes punctually or in a grid with a temporal resolution of one hour. The JULES version utilized in this study was 7.0, based on nine plant functional types (PFT), including tropical forests (Harper et al., 2016). JULES requires hourly meteorological data as input, as described in Sect. 2.3. Also, it requires an edaphic dataset, which is also described in Sect. 2.3. JULES estimates GPP and Reco based on the limitation factor of three potential photosynthesis rates (Collatz et al., 1991, 1992). This topic presents the main equations to estimate GPP and Reco, defining the most relevant parameters to quantify carbon fluxes. A more detailed description of the equations used by JULES to estimate carbon fluxes is provided in the Supplement Sect. S1.
The model considers three potentially-limiting photosynthesis rates: Light limitation rate (Wl); Rubisco limitation rate (Wc); and transport of photosynthetic products for C3 and PEP Carboxylase limitation for C4 plants (We). Wl and Wc depend on the maximum rate of carboxylation of Rubisco (Vcmax), which is calculated using an optimal temperature range for each plant functional type (Tupp and Tlow), as described by Clark et al. (2011) (Eq. 1):
where Tc is the canopy (leaf) temperature in degrees Celsius, ft is the standard Q10 temperature dependence (see Eq. S2 in the Supplement), and Vcmax at 25 °C is calculated based on leaf nitrogen content (kg N kg C−1) in each canopy layer (i) (see Eq. S3).
With Vcmax it is possible to calculate two potential photosynthesis rates: Wc and We:
where Vcmax (mol CO2 m−2 s−1) is the maximum rate carboxylation of Rubisco, ci is the leaf internal carbon dioxide partial pressure (Pa), Γ is the CO2 compensation point in the absence of mitochondrial respiration (Pa), Oa is the partial pressure of atmospheric oxygen, and Kc and Ko are the Michaelis-Menten parameters for CO2 and O2, respectively.
where P* is the surface air pressure.
The light-limited rate (Wl) relies on the quantum efficiency for photosynthesis (α, in mol CO2 mol−1 PAR):
where ω is the leaf scattering coefficient for PAR, and IPARis the incident photosynthetically active radiation (PAR, mol m−2 s−1).
The three potentially limiting rates are essential to calculate the rate of gross photosynthesis, which is the smoothed minimum of the three limited rates previously calculated, as described in the Supplement (Eq. S7). GPP is calculated based on the integration of leaf photosynthesis (Al, see Eq. S11), taking into account every canopy level adopted by Harper et al. (2016), assuming a multi-layer canopy with sunlit and shaded leaves in each layer.
The CO2 concentration at the leaf surface or within the leaf is determined from the leaf humidity deficit, calculated using the leaf-surface vapor pressure deficit (D), together with two parameters characteristic of each plant functional type (f0 and Dcrit) (Eq. 5):
where Cs is the leaf surface CO2 concentration.
The total ecosystem respiration, Reco, is calculated as the sum of different respiration components. Leaf dark respiration (Rd) is defined as a proportion of Vcmax (Eq. 6).
where fd is the dark respiration coefficient. To calculate the total plant respiration, JULES considers the sum of two processes: maintenance and growth respiration (Rpm and Rpg, Eqs. 7 and 12, respectively)
where Nl, Ns, and Nr are the nitrogen contents of leaf, stem, and root, respectively, and β is the soil moisture stress factor based on Cox et al. 1998 (see Eqs. S9 and S10). To calculate the nitrogen contents of leaves, stems, and roots, LAI and canopy height are important elements (Eqs. 8–10):
where nm is the mean leaf nitrogen concentration (kg N (kg C)−1), R and S are the quantity of carbon present in roots and respiring stem, L is the leaf area index (m2 m−2), and σl is the specific leaf density (kg C m−2 per unit of LAI). The nitrogen contents of roots and stems are assumed to be multiples, μrl and μsl, of the mean leaf nitrogen concentration, assuming: μrl= 1.0 for all PFTs, μsl= 0.1 for woody plants (trees and shrubs), and μsl= 1.0 for grasses. To calculate the respiring stemwood, the pipe model of Shinozaki et al. (1964) was utilized, taking into account canopy height and LAI (Eq. 11):
Where nsl is a constant of proportionality from Friend et al. (1993), and h is the canopy height.
To calculate the growth respiration, it is necessary to consider the maintenance respiration and also the estimated GPP (Eq. 12)
where rg is the growth respiration coefficient, set as 0.25 for all plant functional types (Clark et al., 2011; Harper et al., 2016).
Finally, NEE is calculated by JULES as the difference between GPP and total ecosystem respiration (plant and soil respiration, Reco, Eq. 13):
2.3 Ancillary environmental data
The JULES model requires the meteorological variables listed in Table 2 as input. In-situ meteorological forcing data from each flux tower (Restrepo-Coupe et al., 2021; Andreae et al., 2015) were used for model calibration (Sect. 2.4.2) and cross-validation using K83 tower data. For the spatialization of carbon fluxes, meteorological data from reanalysis were applied, as will be described in Sect. 2.4. Soil information required by JULES was obtained from the EMBRAPA database (Reatto et al., 2004), which provides soil texture data (silt, sand, and clay content) at a 30 m resolution down to a depth of 120 cm below the surface. To convert soil texture into the parameters required to run JULES (Table 3), we applied equations from Marthews et al. (2014). The edaphological parameters in the model are static.
Table 2Meteorological variables required by JULES and their respective definitions and units.
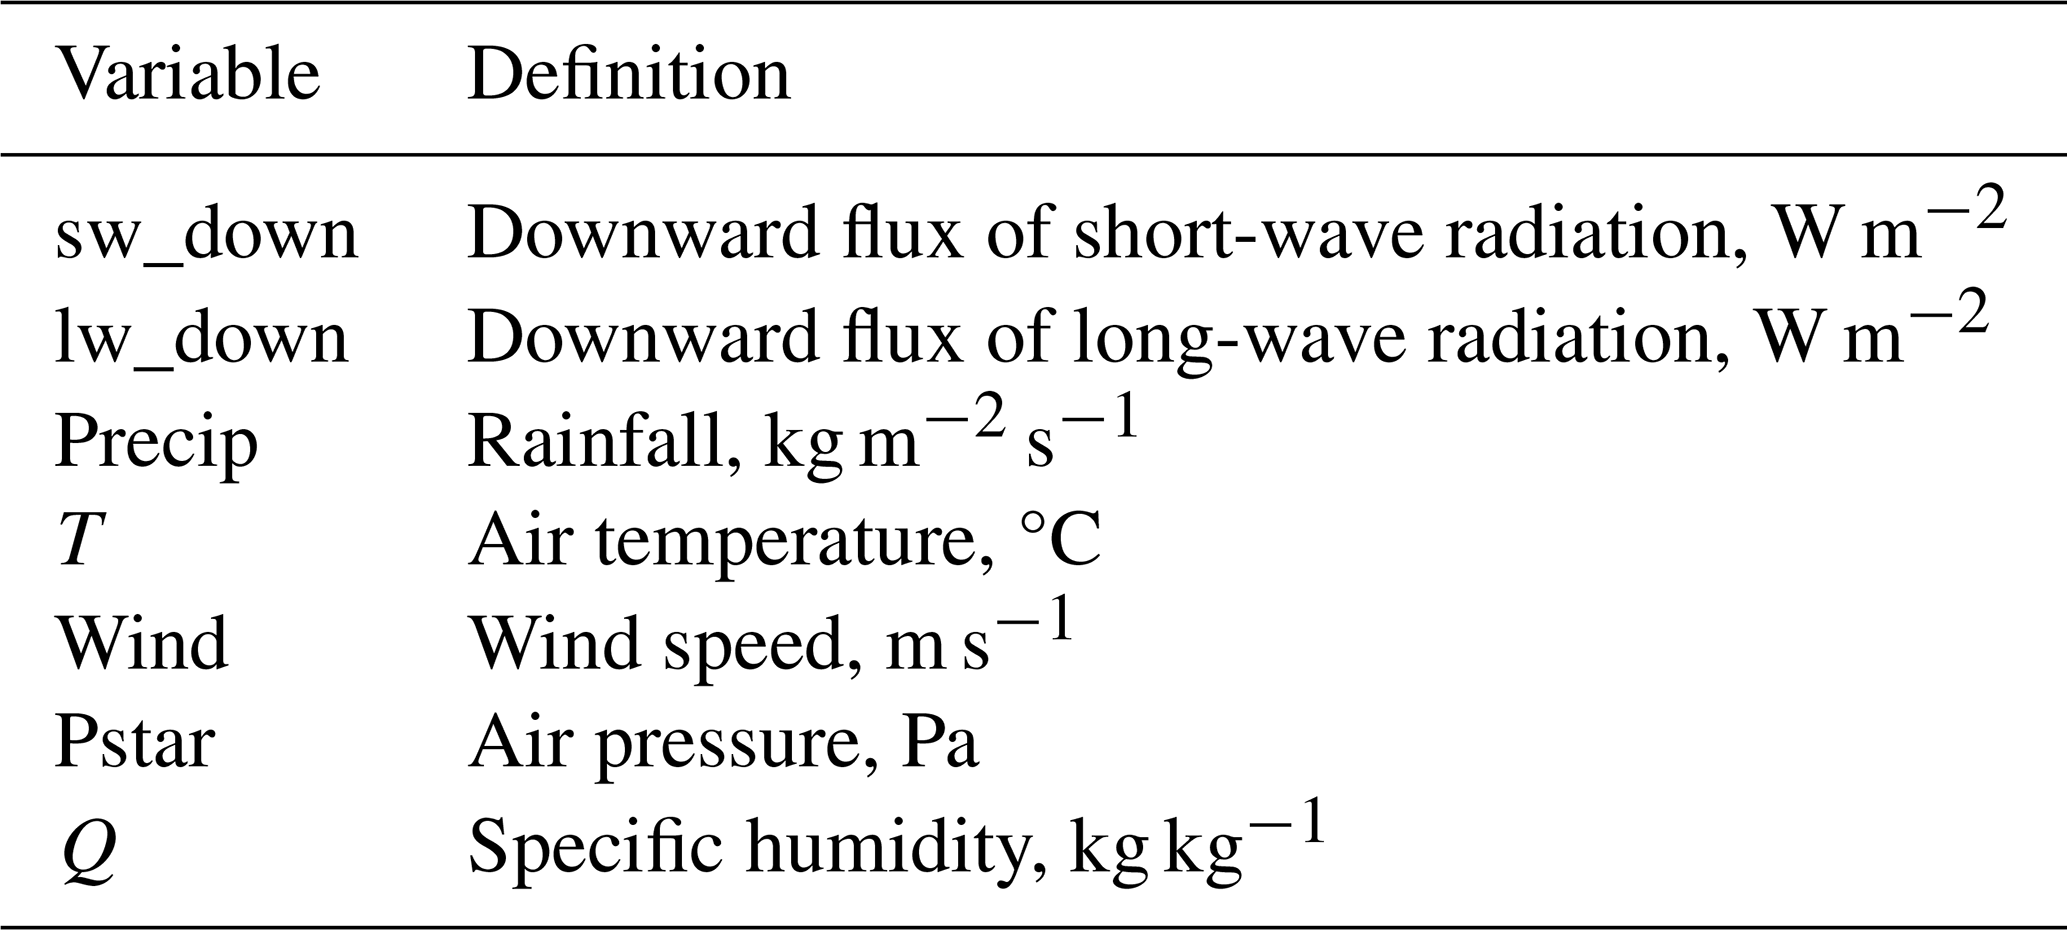
Table 3Soil physical parameters required for JULES with their respective definitions and units for five different sites in the Amazon region.
Concerning the carbon fluxes, the variables utilized to calibrate and evaluate JULES simulations were NEE, GPP, and Reco. It is important to mention that the direct observation from the Eddy-covariance tower measurement is NEE. NEE was partitioned following Botía et al. (2022) and Restrepo-Coupe et al. (2017), assuming that nighttime NEE corresponds to nighttime Reco. Nighttime Reco was used as the daytime respiration, while daytime GPP was calculated from the difference between GPP and NEE (NEE = Reco − GPP). NEE data was available every 60 min for all flux towers, except for the ATTO tower, available every 30 min.
2.4 Gridded data
In addition to the in situ observational data, gridded datasets were used in JULES model simulations and as benchmarks for the simulated carbon fluxes. Meteorological data from the ERA5 reanalysis (Hersbach et al., 2020) were used to force the JULES model in spatialized runs (refer to Sect. 2.5.3). ERA5 has hourly temporal resolution and a spatial resolution of 0.25° × 0.25°, which was resampled to 1° × 1°, providing data for the variables listed in Table 2. This resolution was proposed in view of the computational limitations to run JULES for the Brazilian Amazon biome.
Gridded data of vegetation properties and land use were also used in the spatialized model runs, extrapolating model parameters across the Brazilian Amazon biome. Canopy height was collected in the Global Forest Canopy dataset (Simardi et al., 2011). This dataset represents the tree canopy heights with a resolution of 927 m based on a fusion of spaceborne-lidar data (2005) from the Geoscience Laser Altimeter System (GLAS) and ancillary geospatial data. Canopy heights retrieved from the gridded product were similar to local observations at the 5 tower fluxes considered in this study. LAI data from the ERA5 Land monthly reanalysis were used, with a resolution of 11 132 m. In ERA5, LAI is calculated using the land surface model of the European Centre for Medium-Range Weather Forecasts, known as CTESSEL (Boussetta et al., 2013), with the assimilation of a 9-year monthly climatology derived from satellite-based data from MODIS (Moderate Resolution Imaging Spectroradiometer). Therefore, the LAI product from ERA5 describes a fixed vegetation state. Land use and land cover data were provided by MapBiomas, collection 9, with a spatial resolution of 30 m (Souza et al., 2020). The percentage of PFTs type in each grid cell was based on the MapBiomas land cover dataset (refer to the Supplement, Sect. S3.1, Table S3.1). All data were resampled to the 1° × 1° resolution and utilized in different versions of models approached in this study, as described in Sect. 2.5.3
Two gridded datasets on carbon fluxes were used as benchmarks for the simulations conducted in this study: FluxCom-X (Nelson et al., 2024) and the European Carbon Tracker CT 2022 (Jacobson et al., 2023). European Carbon Tracker provided hourly NEE at a resolution of 0.1° in latitude by 0.2° in longitude, calculated by the Simple Biosphere model Version 4 (SiB4), which is driven by meteorology variables from the European Centre for Medium-Range Weather Forecasts (ECMWF) Reanalysis 5th Generation (ERA5) dataset. To retrieve NEE from the CT 2022 carbon fluxes, the optimized biological flux was used (i.e., excluding Carbon flux from fuel and fire), and lateral fluxes from rivers were removed, following Friedlingstein et al. (2022). FluxCom-X, providing estimates with 0.05° spatial and hourly temporal resolution, is produced using a data-driven approach using an ensemble of machine-learning methods, combining local observations from Eddy-covariance flux towers, satellite observations, and meteorological reanalysis data. In the Brazilian Amazon biome, FluxCom-X assimilates data from only two flux towers: K67 and K83. The scarcity of flux data in the Amazon hinders the model training, resulting in decreased model performance in this region when compared to other terrestrial ecosystems worldwide. Overestimation of the carbon sink (strongly negative NEE) in tropical regions is a well-known bias of the FluxCom-X dataset (Nelson et al., 2024).
2.5 JULES model procedures
In this section, we described the procedures necessary to optimize and spatialize NEE using JULES for the Brazilian Amazon biome. In the first topic, we describe a local sensitivity analysis to select the most sensitive parameters of JULES at a specific point in the Brazilian Amazon biome. The second topic will present the calibration of the most sensitive parameters. The third topic will describe the method utilized to spatialize JULES in the Brazilian Amazon biome. Considering the large number of grid points required to simulate the Brazilian Amazon region, a spin-up procedure would be very computationally expensive, considering that many years of simulation would be necessary to reach the equilibrium in the soil carbon stocks and humidity. To initialize the JULES simulations, we adopted the strategy employed by Moreira et al. (2013), which consists of initializing the model with soil moisture fields and carbon stocks as close as possible to observations. The carbon pool was not altered during the simulation, and carbon levels varied in accordance with seasonal changes throughout the year. Also, we considered the soil texture obtained in the EMBRAPA database (described in Sect. 2.3) as a source that closely matches the observed data, and this can reduce the uncertainties in the water balance.
2.5.1 Sensitivity analysis
The first step in process-based model calibration and local sensitivity analysis is to understand how the modulation of GPP and Reco is influenced by the model parameters. This study initially assessed the sensitivity of the 21 core parameters of the JULES model by varying their values within the minimum and maximum expected ranges (Table S1). The underlying hypothesis was that the heterogeneity of the Amazon forest would lead to variation in these parameters. Understanding their impact on NEE helps identify which parameters are critical for parameterization and should not be treated as fixed values, as is done in the default JULES model PFT parameterization.
The local sensitivity analysis was developed for 2018 using the location of the ATTO tower as a reference. Each JULES parameter was perturbed within its maximum and minimum expected range, as shown in Table S1. The effect of these changes on NEE calculations was quantified using the mean absolute deviation (MAD, g C m−2 d−1) (Eq. 14) and Δvar (%) (Eq. 15). MAD and Δvar depend on the difference of NEE computed using the maximum and minimum value of a specific parameter (all others are maintained fixed with the default value). The calculation is computed considering each day of simulation and averaged over the year. Δvar is computed by Eq. (15). Since Δvar is based on square differences, this metric is sensitive to outliers. We applied the Grubbs' test (Grubbs, 1969) with a significance level of 95 % to remove the NEE outliers. After this procedure, each parameter was classified by relevance based on the largest Δvar values, identifying the most sensitive parameters. Supplement Fig. S1 presents the NEE monthly simulations for 2018, considering the impact of changes in the most relevant parameters compared to observed data (retrieved from the Eddy-covariance towers). The simulations were performed by varying each relevant parameter individually, using different values within the specified minimum and maximum range.
where ymax is the NEE daily value simulated with the maximum parameter; ymin is the NEE daily value simulated with the minimum parameter; ydefault is the daily value simulated using the default version of JULES default (Fig. S2), and N is the number of observations, removing days with outliers (352 d).
We considered the five most sensitive parameters (Fig. 2): canopy height (canht); scale factor for dark respiration (fd), which is a coefficient between 0 and 1 associated with leaf dark respiration (Eq. 6); quantum efficiency for photosynthesis (α, mol CO2 mol−1 PAR) (Eq. 4); the maximum ratio of internal to external CO2 (f0), necessary to simulate leaf CO2 concentration based on leaf humidity deficit, and the upper-temperature threshold for photosynthesis (tupp, Eq. 1). The sensitivity analysis has shown that variations in canopy height between 19 and 50 m can lead to variations of almost 200 % in NEE. The variation of the dark respiration scaling factor, for potential values found in Amazonia, can also lead to differences in NEE of the order of 140 %. The quantum efficiency, the maximum ratio of internal to external CO2, and the upper temperature for photosynthesis can lead to variations in NEE of 45 %, 16 %, and 13 %, respectively (refer to Table S2).

Figure 2Variation in (%) (Δvar) of JULES parameters relative to the default version of JULES at the ATTO tower, representing the Amazon biome during 2018. The abbreviations were defined in Table S1.
The set of parameters selected in the sensitivity analysis was similar to Raoult et al. (2016), who calibrated JULES for different plant functional types using GPP to evaluate the new parameterization. The reason behind the high sensitivity of NEE towards the parameter canht can be explained by its influence on calculating Maintenance Respiration (Eq. 11, Sect. 2.2), as canht is necessary to estimate stem wood respiration (Clark et al., 2011). Another factor behind the high sensitivity of canht is its linear relationship with roughness length (Best et al., 2011), which strongly influences mechanically driven turbulence and the efficiency of CO2 exchange between the land surface and the atmosphere (Khanna and Medvigy, 2014).The parameter fd is relevant for estimating the dark respiration coefficient (Eq. 6, Sect. 2.2) and is associated with the content of nitrogen in the estimation of the maintenance respiration (Eq. 11, Sect. 2.2). Alpha is a parameter associated to estimating the rate of light-limited photosynthesis (Eq. 3, Sect. 2.2), f0 is a relevant parameter for estimating hydric stress and the stomata regulation (Eq. 5, Sect. 2.2), and tupp is required to estimate Vcmax for different temperatures (Eq. 1, Sect. 2.2). The parameters α, tupp, and f0 were also found to be important for modeling GPP by Raoult et al. (2016) and Li et al. (2016) in their work on GPP optimization using JULES. Parameters related to light-limitation of photosynthesis, such as the α were also sensitive in other Dynamic Vegetation models. Zhu et al. (2025), working with the ORCHIDEE model in the Amazon region, demonstrated high sensitivity in the parameter α self-thinning, which controls tree mortality induced by light competition. Another relevant parameter observed by Zhu et al. (2025) was related to the nitrogen use of photosynthesis, which, in the JULES model, is the fd parameter. In this study, following canopy height, the fd parameter is the most sensitive parameter of JULES, followed by α. Although JULES and ORCHIDEE models differ in their parametrization, the convergence of certain parameters highlights the importance of nitrogen and radiation in simulating carbon fluxes in tropical trees. Consequently, optimizing these parameters improves the spatial representation of carbon fluxes across the Brazilian Amazon biome, accounting for its vegetation heterogeneity.
2.5.2 Calibration and validation
After the local sensitivity analysis, which defined the most important parameters for GPP and Reco, JULES was optimized by comparing simulations with observed data at each site described in Sect. 2.2. For this attempt, we employed the Nelder-Mead method (Nelder and Mead, 1965) for optimization, utilizing the SciPy implementation (Harris et al., 2020) and NumPy (Virtanen et al., 2020) to process the data. The Nelder-Mead method is a numerical method used to find the minimum or maximum of an objective function in a multidimensional space (Dakhlaoui, 2014). This method was successfully applied in studies of calibration and evaluation of different models as described by Zohou et al. (2021). NEE was the control variable in the calibration process, since it is directly retrieved from Eddy-covariance measurements without assumptions on flux partitioning. Canopy height was set to the corresponding values at each site (Table 1), and the four most sensitive parameters were adjusted within physiological limits to minimize daily model-observation error (Table S4). The statistical index adopted to evaluate the error in this study was the root mean square error (RMSE) (Loague and Green, 1991, Eq. 16).
where yi is the predicted value of NEE, pi is the observed value of NEE, and n is the number of observations.
Another statistical metric used to analyze the accuracy of the simulations during the year was the index of agreement (d) proposed by Willmott et al. (2012), given by
where P is the average value of NEE. When d is close to 1, this indicates a high accuracy level.
It was necessary to delimit maximum and minimum values for each parameter according to the physiological characteristics of tropical species (Table S4). Within the delimited values of reference, the optimization was developed starting from the JULES parameter default values (Harper et al., 2016). Important to mention that the Nelder-Mead method does not generate uncertainties for fitted parameters at a confidence level.
2.5.3 Spatializing JULES in the Amazon biome
The optimization of the JULES model parameters for different forest sites in Amazonia showed significant differences, reflecting the heterogeneity of vegetation characteristics categorized in the PFT Broadleaf Evergreen Trees – tropical (BET-TR). This motivated the spatial extrapolation of JULES model parameters across the Amazon Basin using remote sensing data as predictors.
Following the calibration of sensitive parameters for each flux tower, it was possible to spatialize the parameter values across the Amazon biome. As such, we developed a spatially dependent parameterization of the BET-TR PFT in JULES. The spatialization model was based on linear regressions, having each sensible parameter as the target variable, and two remote-sensed vegetation properties as predictors: canopy height and LAI. The reasons behind the choice of these variables include: data availability and expected correlations between these properties and the 5 most sensitive parameters (Li et al., 2016; Moudrý et al., 2024). Also, canopy height and LAI can be considered constant in the short term, describing a fixed vegetation state. Moreover, these two variables are required as input for JULES simulations: canopy height as a plant functional type parameter, and LAI as an initial condition for simulations.
With independent linear regressions on canopy height and LAI, it was possible to extrapolate the model parameters to the whole Brazilian Amazon biome. Different configurations for linear regression models were tested for each JULES parameter, following one of the general formats of Eqs. (18a) and (18b):
where P represents JULES model parameters (tupp, α, f0_io, and fd); x, y are the coordinates of each model grid cell; a, b, are regression coefficients to be determined. The regression models were fitted to the parameters optimized at four forest sites described in Sect. 2.1 (K34, ATTO, K67, and RJA), using the maximum likelihood method. The choice of the regression model configuration for each JULES parameter was based on a compromise between the regression model residuals and the physical consistency of the extrapolated values. Section S3 shows the reasoning behind the choice of each regression model. A leave-one-out cross-validation was applied to evaluate calibration across regions of the Brazilian Amazon biome (Wallach et al., 2018), using predictions from spatialized linear models based on canopy height and LAI.
To represent variations in carbon fluxes throughout the year, simulations were performed with one-degree resolution across the Brazilian Amazon biome. The months selected were April and September 2021, representing a wet and a dry season month in the Amazon Region, respectively. The meteorological dataset required for JULES to simulate GPP, respiration, and NEE (Sect. 2.1, Table 2) was provided by ERA5 reanalysis data at an hourly scale and resampled to a 1° × 1° resolution.
It is important to highlight that the spatially dependent parameterization was used only for the BET-TR PFT, representing 71 % of the Brazilian Amazon biome. For other PFTs present in the Amazon Basin, the default values were used for all parameters (Harper et al., 2016). The canopy height for BET-TR was provided by the Global Forest Canopy dataset (Sect. 2.4), while for the other types of vegetation, we used the default values by Clark et al. (2011) and Harper et al. (2016). In the case of C4 grass that has relevance in the arc of deforestation, we utilized a canopy height of 15 cm, which is typical for cattle farms in this region (Fernandes et al., 2015). In the case of soybean, a relevant crop cultivated in the northern region of the state of Mato Grosso, we considered the sowing date in September and the harvest in February, as described by the Mato Grosso Institution of Agricultural Economics (De Lima Filho, 2021). To assign a PFT for each model grid, a correspondence was established between JULES land functional types and land use data from MapBiomas collection 9 (Souza et al., 2020) (Sect. S3.1, Table S3). Since MapBiomas data have a resolution of 30 m, it was necessary to calculate the percent contribution of each land use class present in each 1° model cell grid (Fig. S3). A description of all procedures utilized to spatialize JULES is described in Fig. S16 (see Sect. S4).
2.6 VPRM model
The Vegetation Photosynthesis and Respiration Model (VPRM) (Mahadevan et al., 2008) is a satellite data-driven model designed to estimate GPP and ecosystem respiration. GPP is calculated using a light-use efficiency method that combines meteorological inputs (e.g., temperature and photosynthetically active radiation) with remote sensing indices such as the Enhanced Vegetation Index (EVI) and the Land Surface Water Index (LSWI). These indices are derived from the MODIS Surface Reflectance 8-Day L3 Global 500 m (MOD09A1) product, which was collected within a ±0.1° area around each tower evaluated in this study (ATTO, K34, K67, K83, RJA; see Table 1 for descriptions). MODIS data was interpolated to the daily frequency using a curve smoothing technique (LOWESS filter). Ecosystem respiration is modeled us a linear function of temperature. VPRM's key parameters include λ0 (maximum light-use efficiency), PAR0 (light saturation constant), α and β (coefficients controlling Reco temperature dependence), as well as the temperature thresholds Tmin, Tmax, Topt, and Tlow. In this study, the parameter values employed were those calibrated by Botía et al. (2022) for the Amazon forest.
3.1 Calibration and evaluation of JULES
After the identification of the model parameters with the highest sensitivity in the ATTO tower, utilized as reference for the local sensitive analysis for the Brazilian Amazon biome, the JULES model was calibrated for each flux tower, following the methods described in Sect. 2.5.2. Table 4 shows the JULES default values for the BET-TR PFT parameters (Harper et al., 2016) along with the optimized values considering local measurements in the Amazon. The optimized values showed a strong variability, even among the equatorial forest sites. This explains the motivation for the spatialization of JULES parameters for the BET-TR plant functional type.
Table 4New parameterization of JULES optimized by Nelder-Mead in each simulated site in this study. Four parameters were optimized: upper-temperature threshold for photosynthesis (tupp), quantum efficiency (α), scale factor for dark respiration (fd), and maximum ratio of internal to external CO2 (f0). Canopy height (canht) was retrieved from observations at each site.
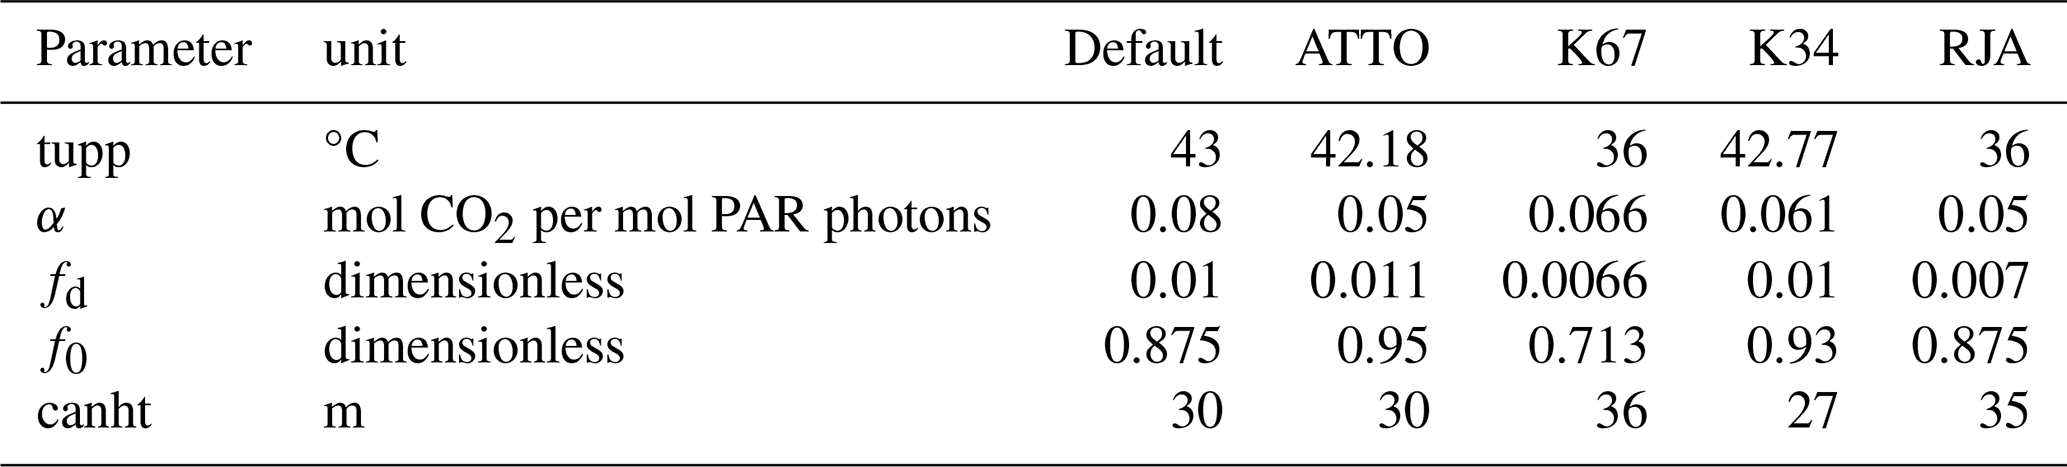
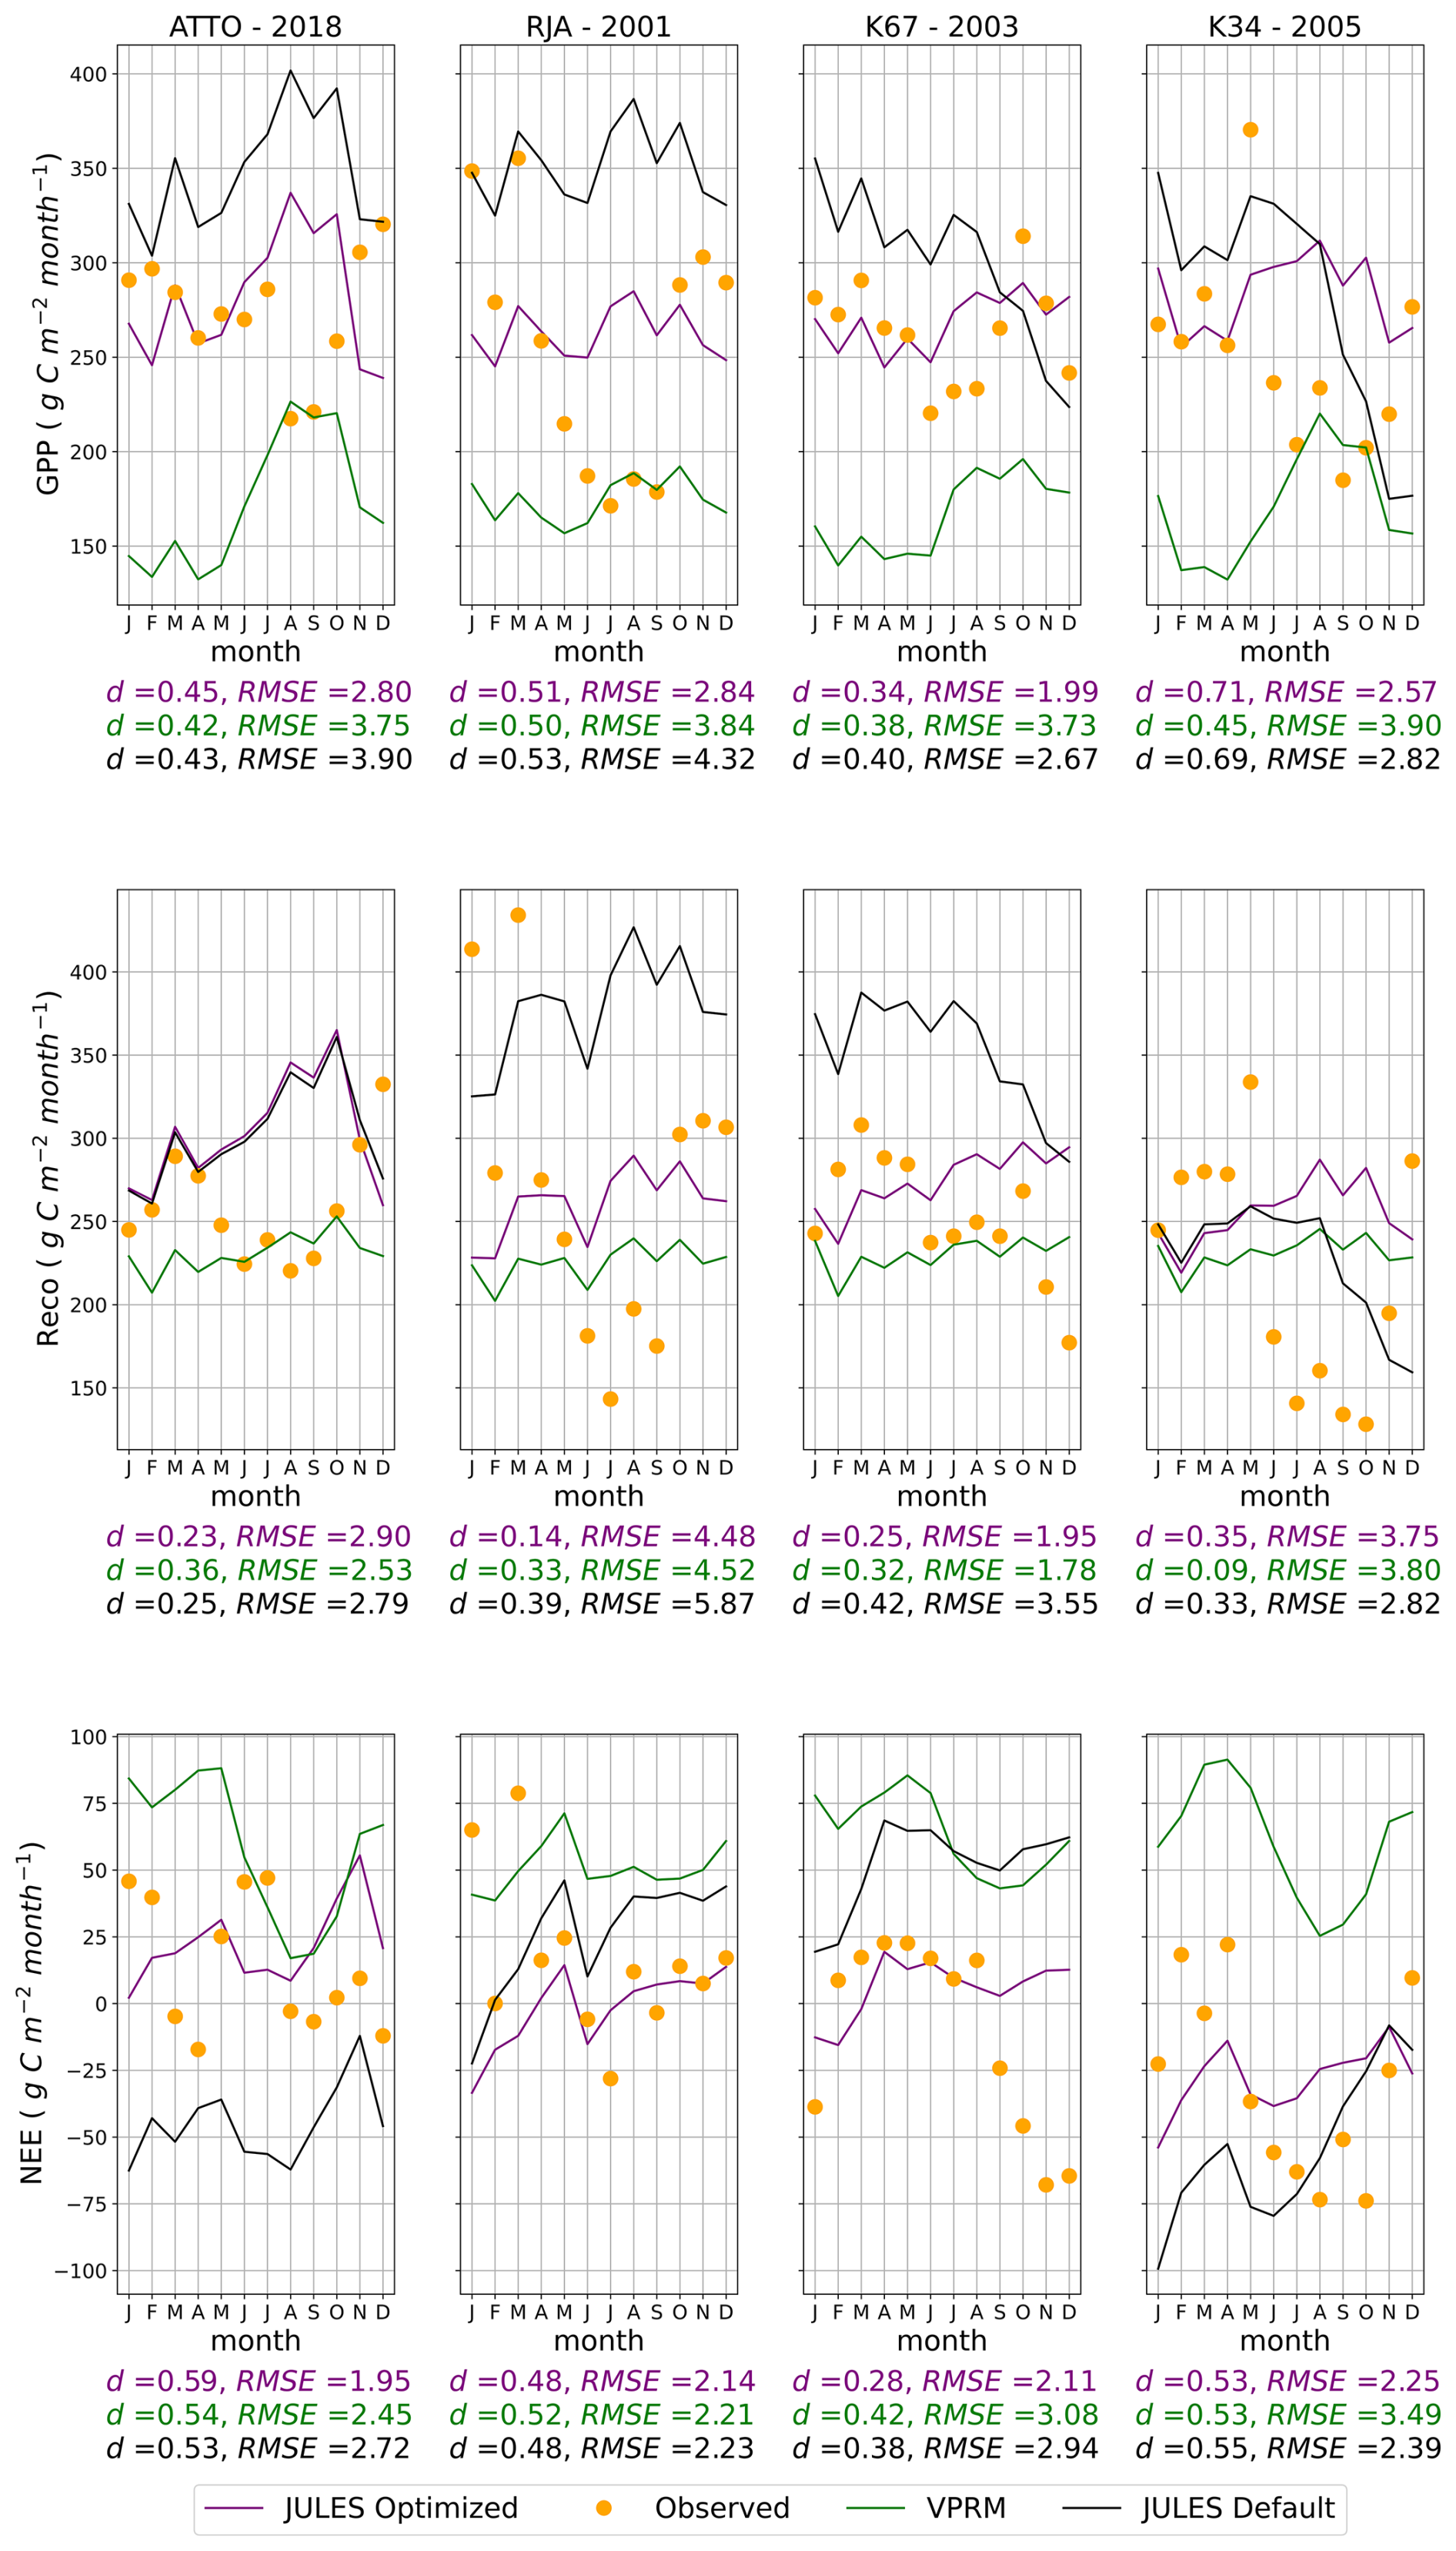
Figure 3GPP, Reco, and NEE simulations using different model setups and observations at each flux tower in Amazonia. The observed data in the plots is the aggregate value for each month of the year, and the RMSE error described is the daily average during the year in g C m−2 d−1.
Figure 3 shows the simulated fluxes for GPP, Reco, and NEE using optimized JULES parameters, JULES default parameters, and simulations with the VPRM model. Observations are also depicted as a reference. The statistical metrics RMSE and d (Eqs. 16 and 17) were calculated in each case to assess the performance of each model setup in reproducing the observations. The new parameterization reduced RMSE for GPP and NEE in all flux towers, in comparison to the default parameter values and to the VPRM results. However, the optimized parameter values did not improve the Reco simulations. It is important to note that NEE was the control variable in the calibration process so that the GPP and Reco partitioned fluxes were indirectly optimized. NEE was used as the control variable because it is directly measured in the flux towers, without assumptions regarding the partition into GPP and respiration.
The seasonality of the carbon fluxes was also improved using the JULES optimized parameters (Fig. 3). Although the JULES optimized version did not capture the GPP increase during the dry-to-wet transition (October–December), it reduced GPP errors compared to the default version and VPRM in each season of the year. Model limitations in representing dry-season effects were also noted by Restrepo-Coupe et al. (2013), who reported distinct dynamics at the RJA tower, located near pasture and under a rainfall regime unlike the equatorial sites ATTO, K67, and K34. In most process-based vegetation models, GPP is strongly associated with hydric stress, which may not be adequate for some Amazonian regions where leaf phenology and litter fall dynamics could play an important role (Restrepo-Coupe et al., 2017; Botía et al., 2022). JULES optimized was the version that better represented the observed carbon sink (NEE < 0) between September and January at the K67 tower. Reco was overestimated in November and December, due to the direct relation between the dark respiration coefficient (fd) and Vcmax (Clark et al., 2011, Eq. 1). Despite the limitations in the reproduction of the carbon seasonality, the optimization of JULES parameters resulted in improved estimates for annual means in NEE, reducing the bias in comparison to the default parameter values.
VPRM demonstrated weaknesses in simulating GPP seasonality, and the error magnitude in NEE was higher than in the optimized JULES model and, in some regions (K67 and K34), even higher than its default version. Botía et al. (2022), comparing different models at the ATTO tower, reported that VPRM demonstrated low efficiency in capturing carbon seasonality in this region. This was attributed to the lack of model representation of hydric stress, as the only water scaling source was the Water Scale Index, derived from remotely sensed Land Surface Water Index using MODIS reflectance data (Chandrasekar et al., 2010; Gourdji et al., 2022).
3.2 Spatialization of JULES parameters
Considering the variability of the optimized parameters for different sites of the Brazilian Amazon biome (Table 5), simple linear regression models were developed to extrapolate the parameter values for the whole Brazilian Amazon. As predictors, vegetation characteristics described in Sect. 2.5.3, namely LAI and canopy height, were used. Table 5 shows the linear regression models developed for the JULES parameters with the highest sensitivity. Section S3 details the rationale for each regression model and includes maps of spatialized JULES parameters and their relationships with vegetation characteristics.
Table 5Parameterization based on the spatialization in the Amazon region for four JULES parameters in Tower K83.
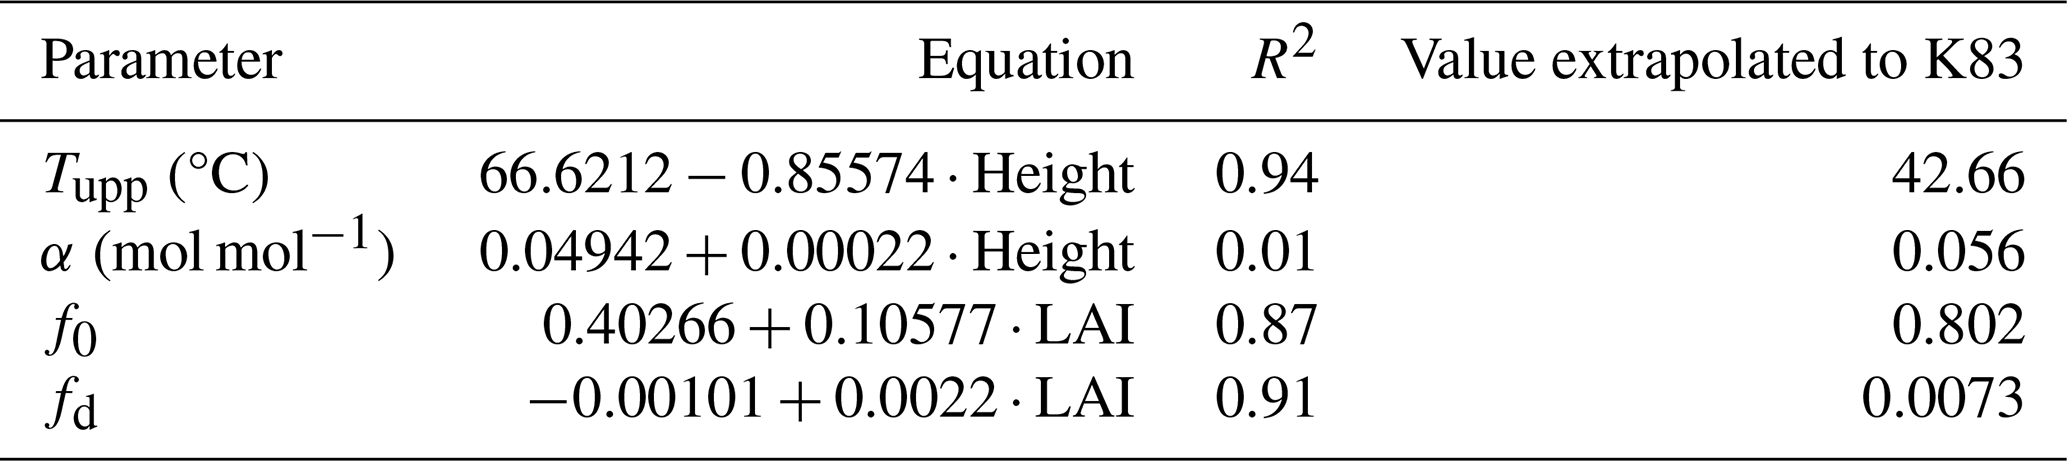
The relationship between each parameter and the selected predictor is shown in Fig. 4. Canopy height was selected for tupp and α, while LAI was selected for f0 and fd. Tupp showed an inversely proportional relationship with the canopy height (Fig. S5), which is consistent with the fact that low-canopy plants like C4 grasses typically have higher temperature thresholds for photosynthesis. The parameter α did not show a clear relationship with any of the predictors, resulting in a rather constant behavior against canopy height (Fig. S7). Canopy height was chosen as a predictor for α to obtain the expected lower quantum yields for C3 and C4 plants (0.055 mol1 mol−1, Skillman, 2008) (Fig. S6). The correlation between α and canopy height is weak; however, given the narrow variation of α in the Amazon (0.05–0.06 mol1 mol−1 for C3 species, consistent with Skillman, 2008), this low correlation exerts minimal influence on the final result. Parameter f0 was positively associated with LAI (Fig. S9), consistent with the fact that f0 is expected to be lower in the arc of deforestation compared to forest sites. For the fd parameter, the selected predictor was LAI (Fig. S11), which is expected to have a positive relationship with fd, given the greater photorespiration efficiency in C4 plants.
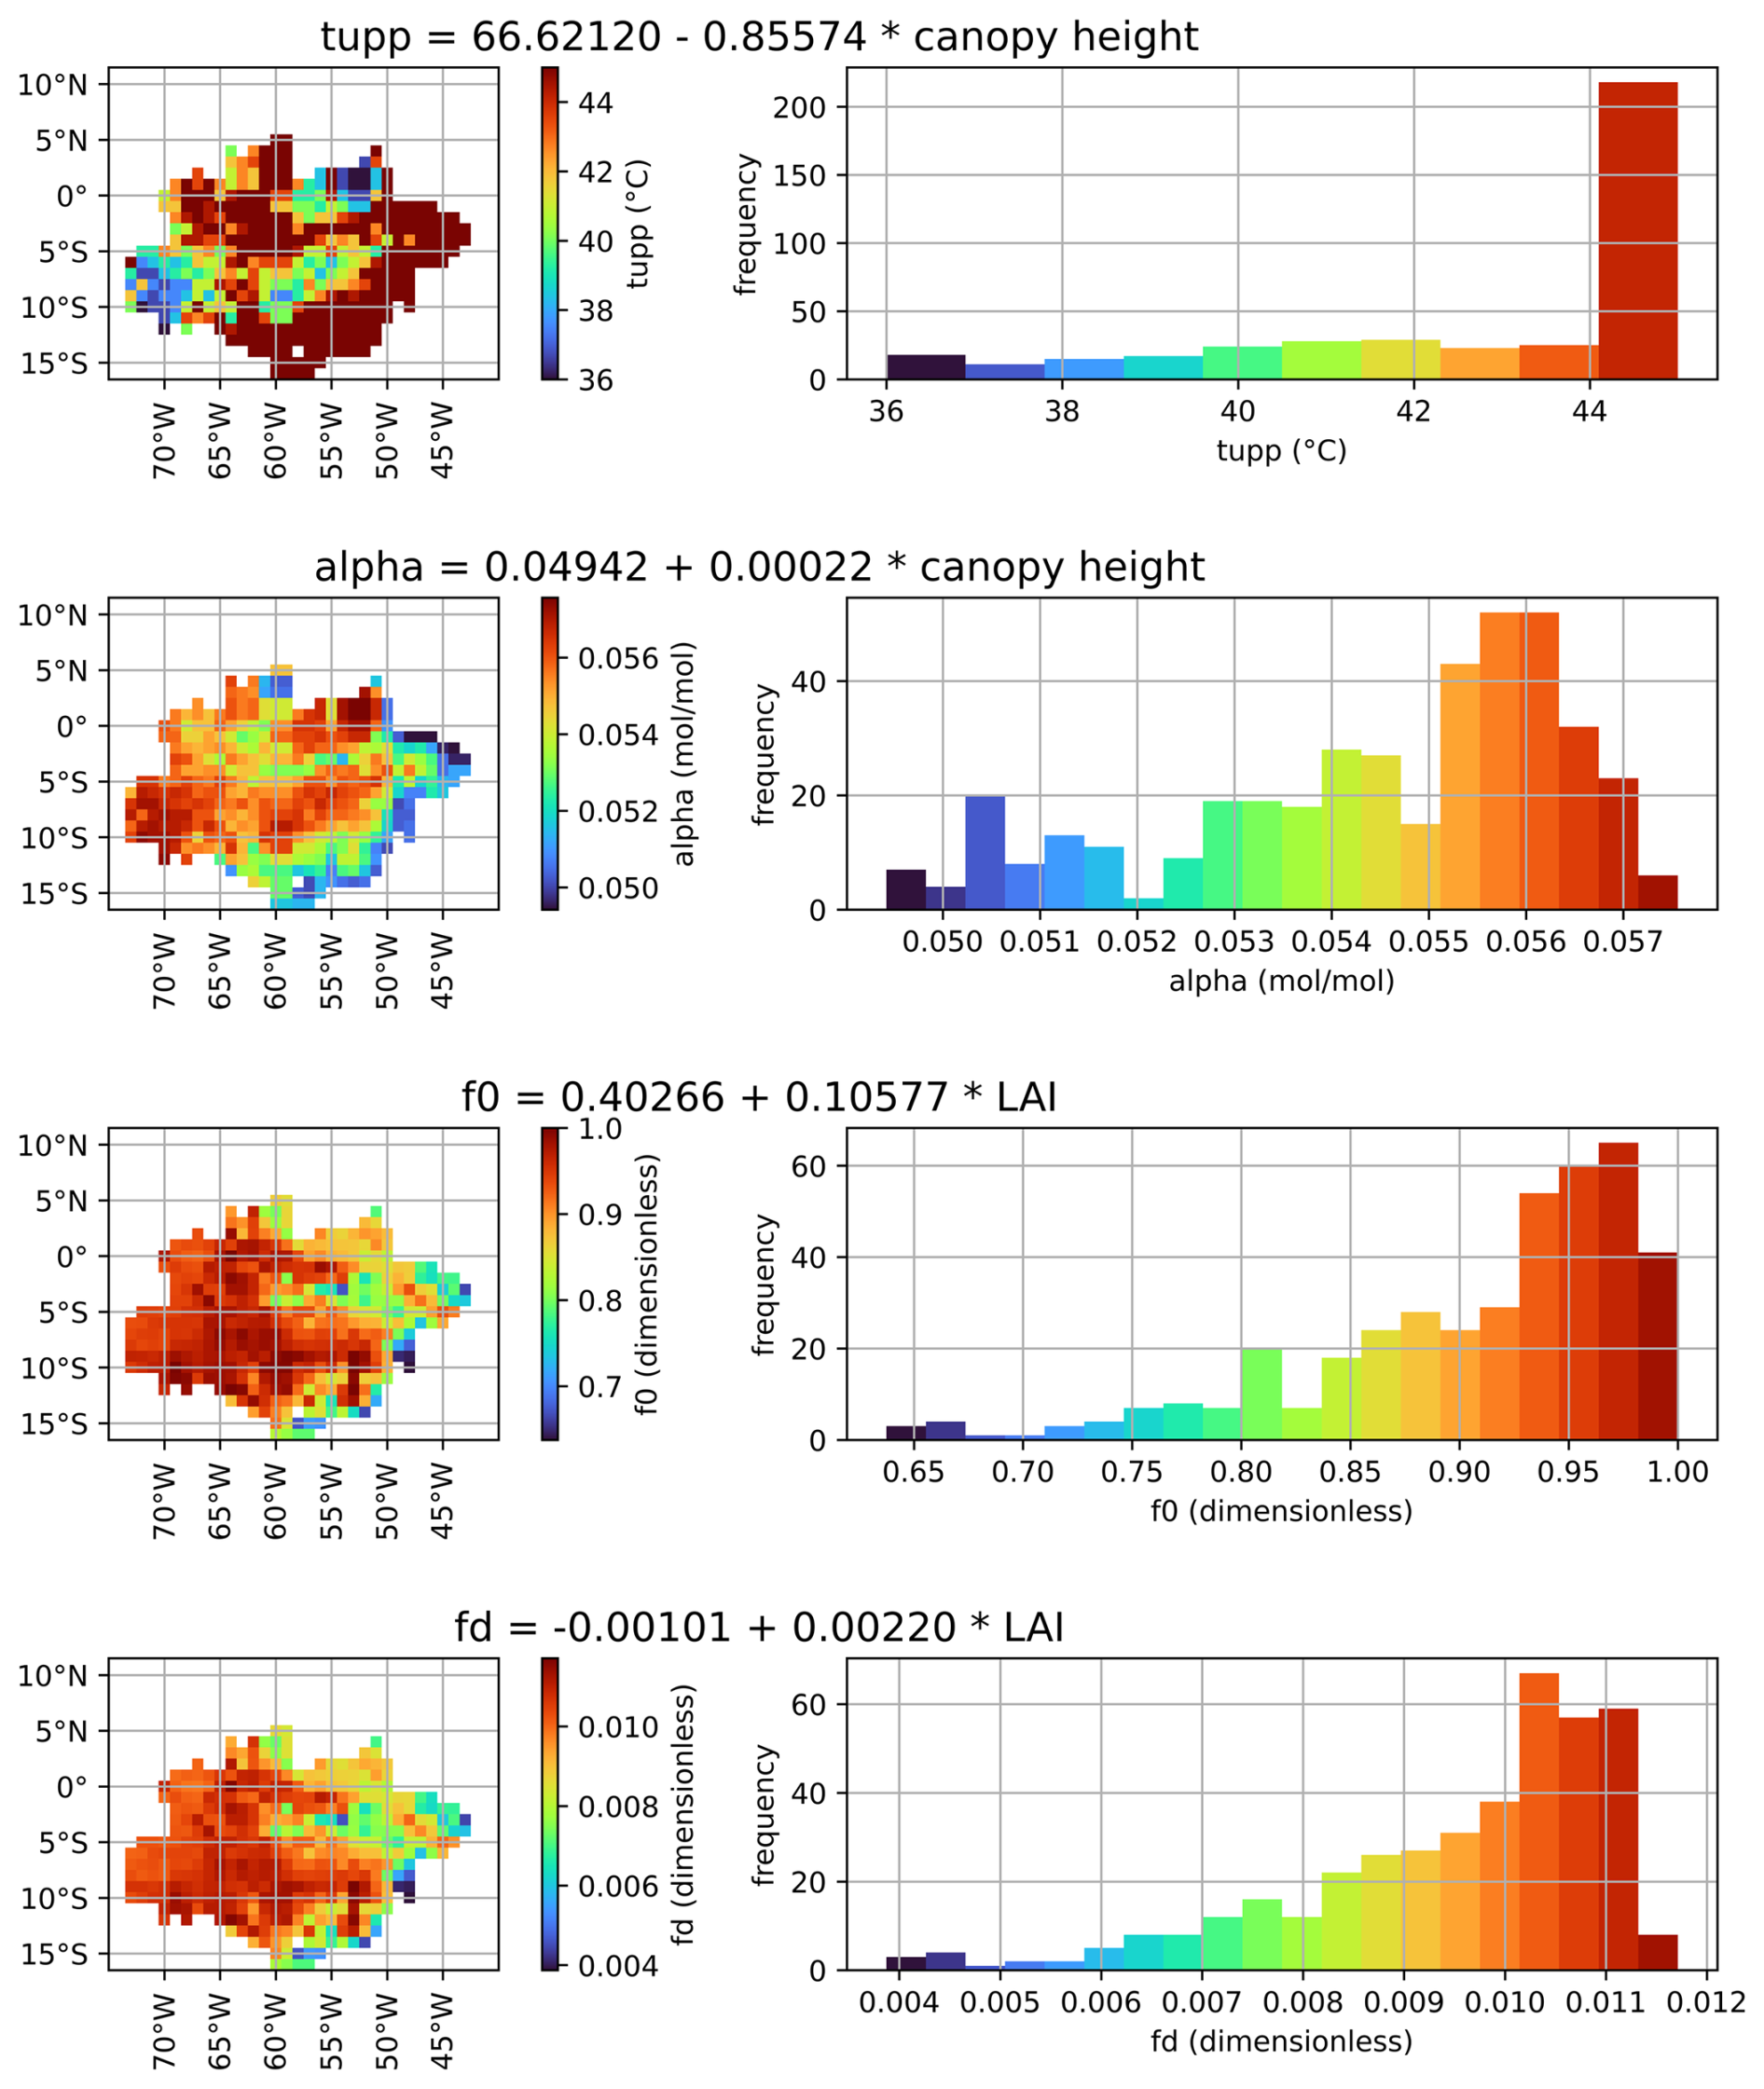
Figure 4Spatialization of the parameters tupp (upper-temperature threshold for photosynthesis), α (quantum efficiency), f0 (maximum ratio of internal to external CO2), and fd (scale factor for dark respiration) for the Amazon biome using linear regression models based on canopy height or LAI.
The regression equations were used to obtain the parameter values at the K83 tower site, which was left aside during the spatialization process. Using a canopy height of 28 m and an average LAI value of 3.78, as described in Sect. 2.4, the parameter values obtained for K83 were used in a JULES simulation for the year 2001, predicting the GPP, Reco, and NEE fluxes depicted in Fig. 5.
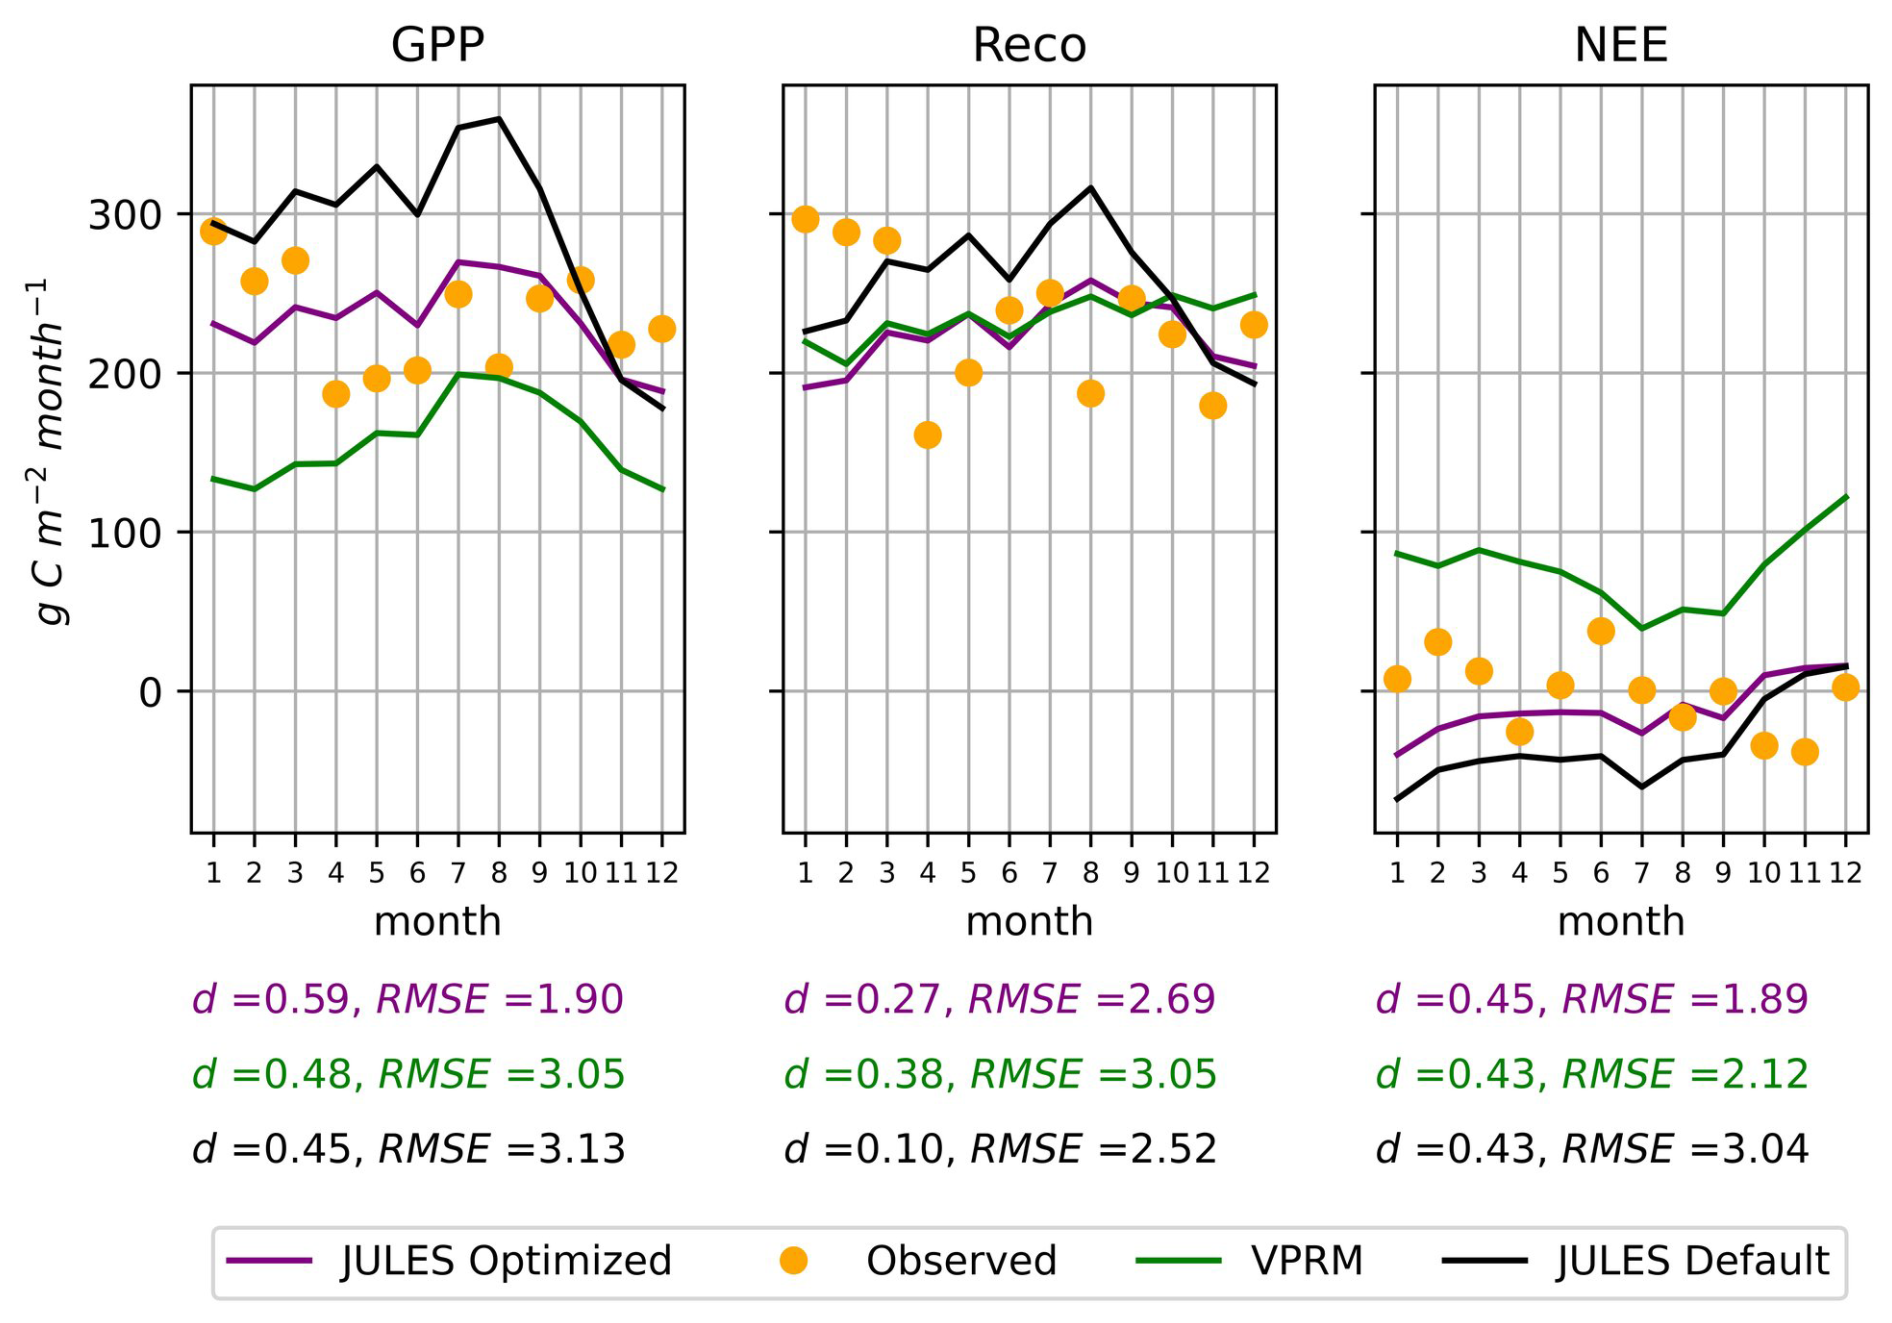
Figure 5GPP, Reco, and NEE fluxes in the independent Tower of validation K83, for the year 2001. The observed data in the plots is the accumulated during each month of the year, and the RMSE error described is the daily average during the year in g C m−2 d−1.
The most relevant aspect was the improvement in GPP, reducing the RMSE in 37 % in comparison to the default version of JULES and 39 % in comparison to the VPRM model. Observations at the K83 tower showed a weak annual cycle in the carbon fluxes, which was satisfactorily reproduced by the models. Overall, this validation process indicates that the method used for the spatialization of JULES parameters provided satisfactory estimates in a forest site that was left out of the regression models.
3.3 Spatial variability of carbon fluxes in Amazonia
After validation with an independent tower (K83), we were confident in using JULES to estimate carbon fluxes across the entire Brazilian Amazon biome for the year 2021. This year was chosen to allow comparison of the simulated carbon fluxes with recently released or updated global datasets. The simulations used the spatialized values of the 5 most sensitive parameters of the BET-TR JULES PFT (Fig. 4). Default parameter values were used for other PFTs in the Amazon Basin. Although JULES did not accurately reproduce carbon flux seasonal cycles (Fig. 3), assessing the spatial variability of NEE under contrasting meteorological conditions remains essential to evaluate model responses. Figure 6 highlights the results from two representative months of the wet (April) and dry (September) seasons in Amazonia.
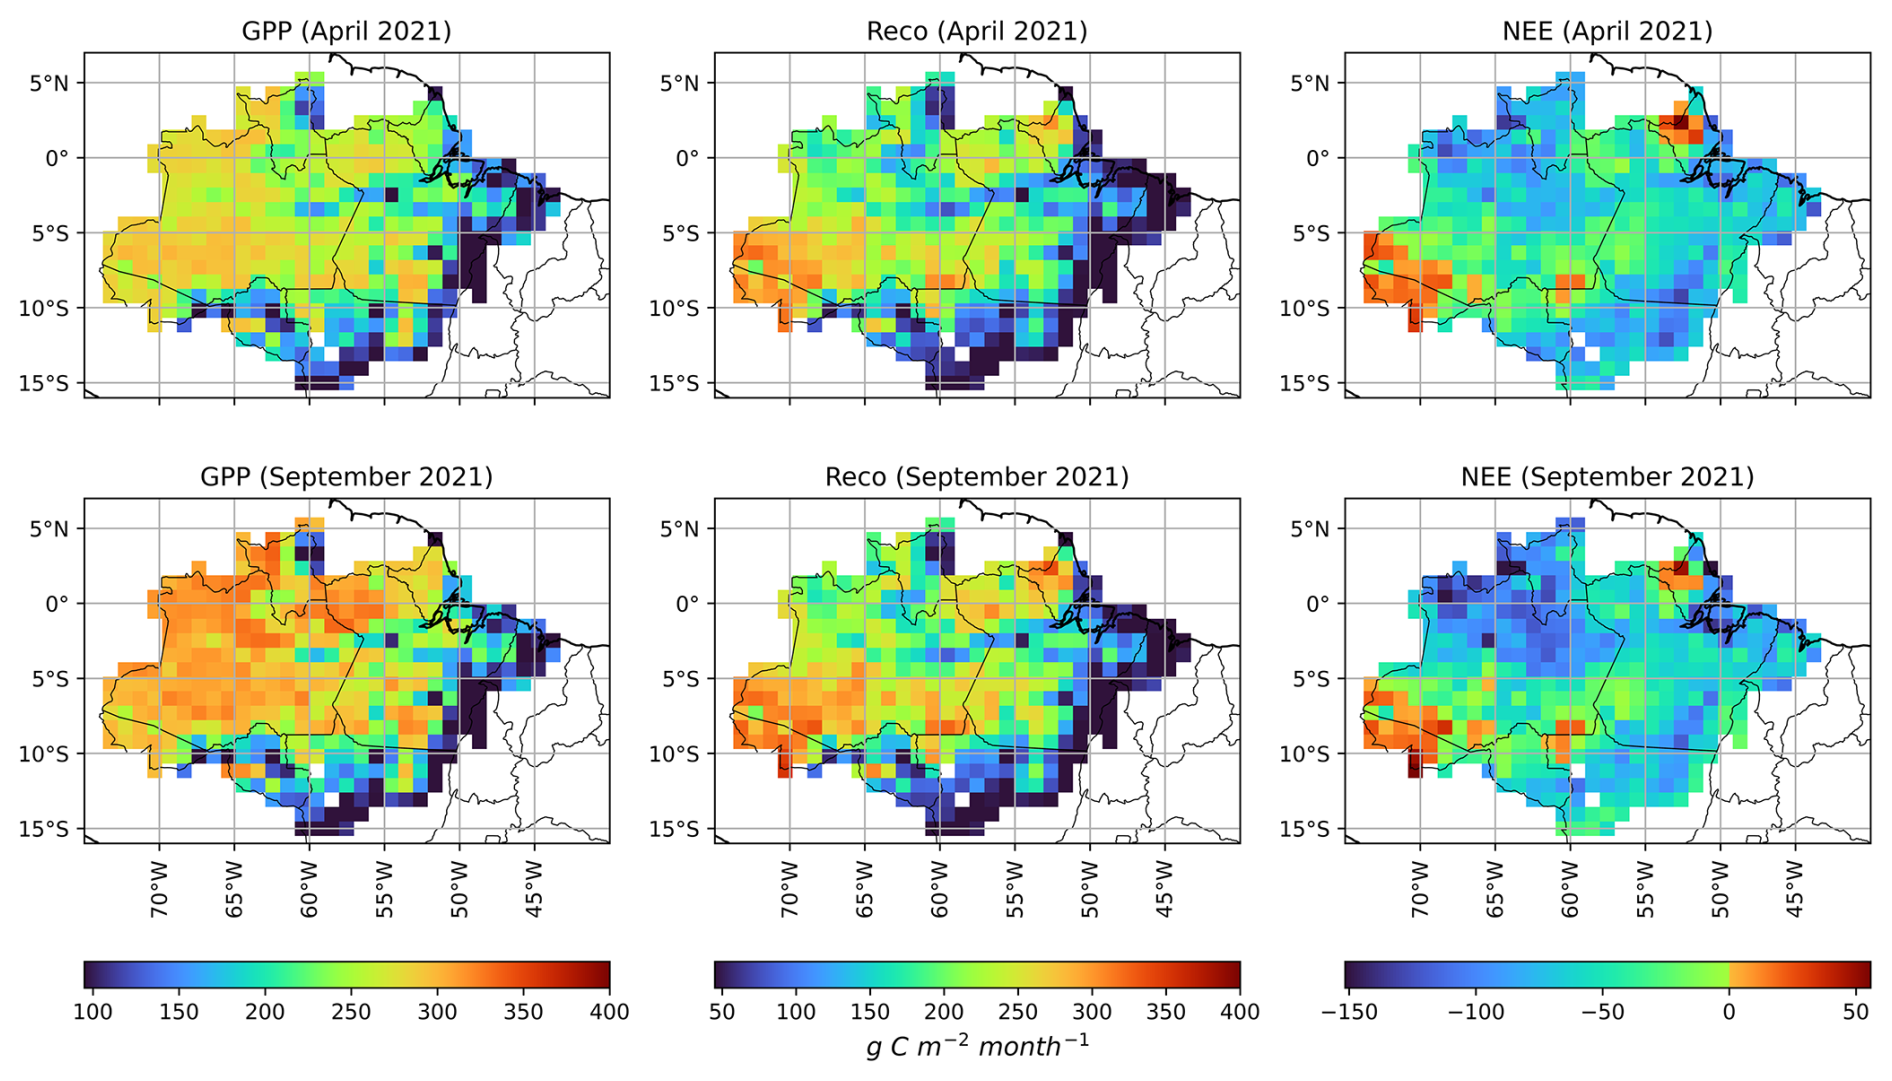
Figure 6Monthly accumulated GPP, Reco, and NEE for April and September, representing the wet and dry seasons in the Brazilian Amazon biome in 2021. The carbon fluxes were simulated by JULES, using spatially dependent vegetation parameters.
The mean GPP in April was 223 g C m−2 month−1, while the mean Reco was 170 g C m−2 month−1, characterizing a carbon sink (NEE) of −53 g C m−2 month−1. During the dry season month (September), there was an increase in GPP, reaching a mean of 240 g C m−2 month−1, and in Reco, with a mean of 182 g C m−2 month−1, increasing the carbon sink to −58 g C m−2 month−1. The fact that GPP was not reduced by water limitation during the dry season was also observed by Restrepo-Coupe et al. (2013), who observed an increase in GPP during the dry season based on observations at the flux towers K34, K67, and K83.
The Reco value estimated by JULES is underestimated in the wet season (April) when compared to Botía et al. (2022), which reported a mean value of 350 g C m−2 month−1 for the wet season at the ATTO tower. In the dry season, however, Reco estimates were similar to the values reported by Botía et al. (2022) (200 g C m−2 month−1) in the same region. This aspect suggests that further improvements are needed to better reproduce the seasonality of Reco, particularly in the Amazon basin.
To further evaluate the spatialized model results, the simulated NEE fluxes for the year 2021 were compared to the following estimates (Fig. 7): (i) European Carbon Tracker CT 2022 (Jacobson et al., 2023); (ii) FluxCom-X (Nelson et al., 2024); (iii) JULES simulation using fixed average values for the BET-TR parameters, considering the optimized values presented in Table 4; (iv) JULES simulation using default parameter values (Harper et al., 2016).
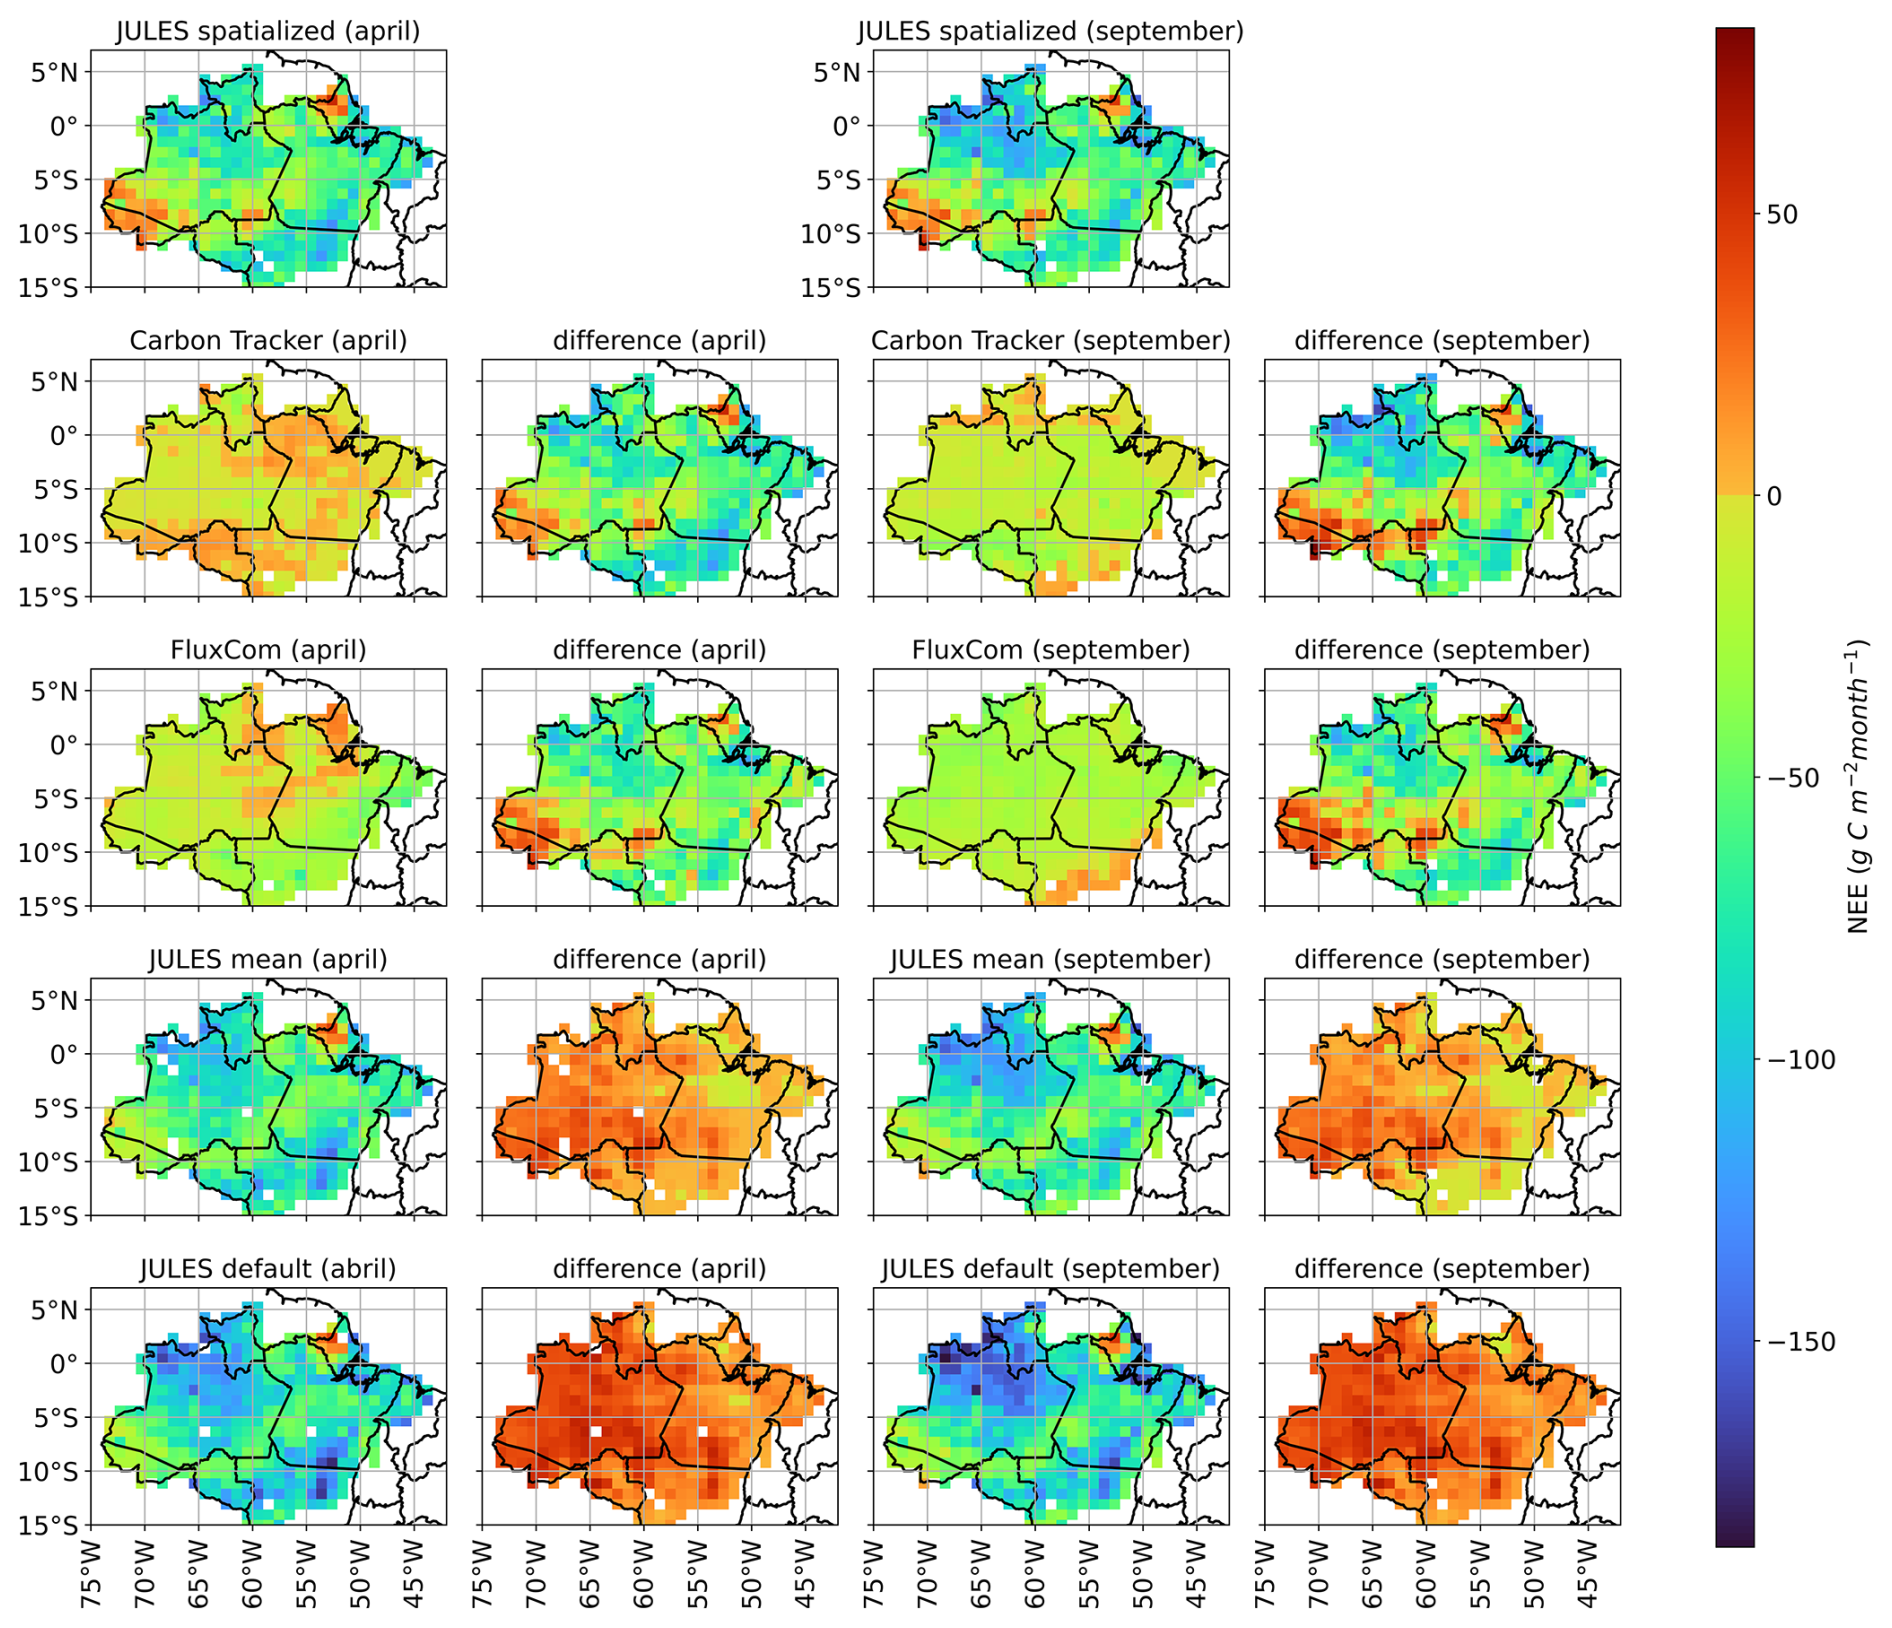
Figure 7Comparison of NEE fluxes for April (wet season) and September (dry season) of 2021 using different modeling approaches: JULES model with spatialized vegetation parameters (spatialized JULES); European Carbon Tracker, FluxCom-X, JULES model using the spatially constant mean values of optimized vegetation parameters (mean JULES), and JULES model using default vegetation parameter values (default JULES). Differences between spatialized JULES and the other estimates are also presented. Positive and negative differences indicate a stronger carbon source or sink, respectively.
Figure 7 clearly shows that the three different modelling approaches using JULES (optimized, default, and spatially dependent parameters) result in an increase in the estimated carbon sink in Amazonia (i.e., more negative NEE values) during both the wet and dry seasons, when compared to Carbon Tracker and FluxCom-X. It is worth noting that the carbon sink overestimation was smaller for the JULES run with spatialized parameters. The JULES run with spatialized vegetation parameters reveals spatial structures in the NEE fluxes, such as the less intense carbon sink observed in the far western Amazonian region (Acre state). Although direct carbon flux measurements are unavailable for this region, optimized Carbon Tracker estimates suggest a less intense carbon sink or even a carbon source (NEE > 0) during the wet season (Fig. 7). Another spatial pattern revealed in the JULES spatialized was a reduced carbon sink in northern Amazonia (Amapa state and northern Para state), where the Carbon Tracker and the FluxCom-X datasets also detected reduced carbon sinks or even carbon sources.
The regions of Acre and Amapa demonstrated a high carbon source. What these regions have in common is canopy heights above average, with trees reaching above 35 m in Amapa (Fig. 1). Compared to FluxCom-X, JULES simulated a stronger carbon sink across the Brazilian Amazon biome during both the wet and dry months, except in forests located in the states of Amapa and Acre (Fig. 7). This feature was also observed in the JULES run using average vegetation parameters for Amazonia. The increased carbon sink simulated by JULES was driven by greater GPP estimates. The updated parametrization of tupp and f0 may explain the higher GPP values estimated by JULES. In this study, the tupp parameter ranged between 36 and 45 °C (Fig. 4), while in previous studies using JULES version 2.1, tupp was set as 36 °C (Restrepo-Coupe et al., 2017). Greater tupp values softened the temperature controls of photosynthesis, resulting in higher GPP estimates, especially in the dry season. Another factor that may have contributed to GPP increases in JULES simulations is the higher f0 values in calibrated regions such as ATTO (0.95) and K34 (0.93), compared to the default value of 0.875 (Harper et al., 2016). The modification of f0 led to a reduction in water stress, mainly in the northern region of the State of Mato Grosso. Moreover, f0 may also help explain the simulated carbon source in the states of Amapá and Acre, as the calibration procedure indicated an f0 value near 0.7 in regions with more sparsely spaced trees (LAI < 4.0), which can contribute to an increase of Reco, as shown in Fig. 3.
Although JULES simulations overestimated the carbon sink, they showed a similar seasonal trend compared to the Carbon Tracker estimates, with an increase in magnitude of the carbon sink from April to September. The states of Acre and Amapa showed similar patterns to Carbon Tracker, both representing a reduced carbon sink in these areas (less than 50 g C m−2 month−1) (Fig. 7). This similarity can be explained by the effects of the spatialization of JULES parameters, mainly in regions with tall trees, such as the case of forests of Amapa and Acre. In the wet month, Carbon Tracker indicated a broader carbon source across the Amazon compared to FluxCom-X, which showed sources mainly in April in Amapa, parts of the Amazon basin, Acre, and deforested areas of Roraima (Fig. 7). During September, Carbon Tracker was similar to FluxCom-X in representing a carbon sink across most of the Brazilian Amazon biome. However, FluxCom-X showed a carbon source in the arc of deforestation, which was not indicated by either JULES or Carbon Tracker.
After applying the spatialization procedure and comparing with different models, the JULES model was run for the entire year 2021. Monthly accumulated NEE values were summed up from each 1° × 1° pixel to estimate NEE for the Brazilian Amazon biome, resulting in −1.34 Pg C yr −1. It is important to mention that this value represents the sum of different regions within the Amazon biome (Fig. 8). The one-year accumulation revealed that the most concentrated carbon sources are located in the states of Amapa and Acre, with values exceeding 0.75 kg C m−2 yr−1 of carbon released to the atmosphere. Some regions stood out as strong carbon sinks (below −1.0 kg C m−2 yr−1), such as the forest in the north of the State of Mato Grosso (longitude 53° W and latitude 12° S) and the forest of São Gabriel da Cachoeira (longitude 74° W and latitude 0° N). The forests in the Amazon basin also demonstrated a high carbon sink (−0.25 to 1.0 kg C m−2 yr −1) during 2021.
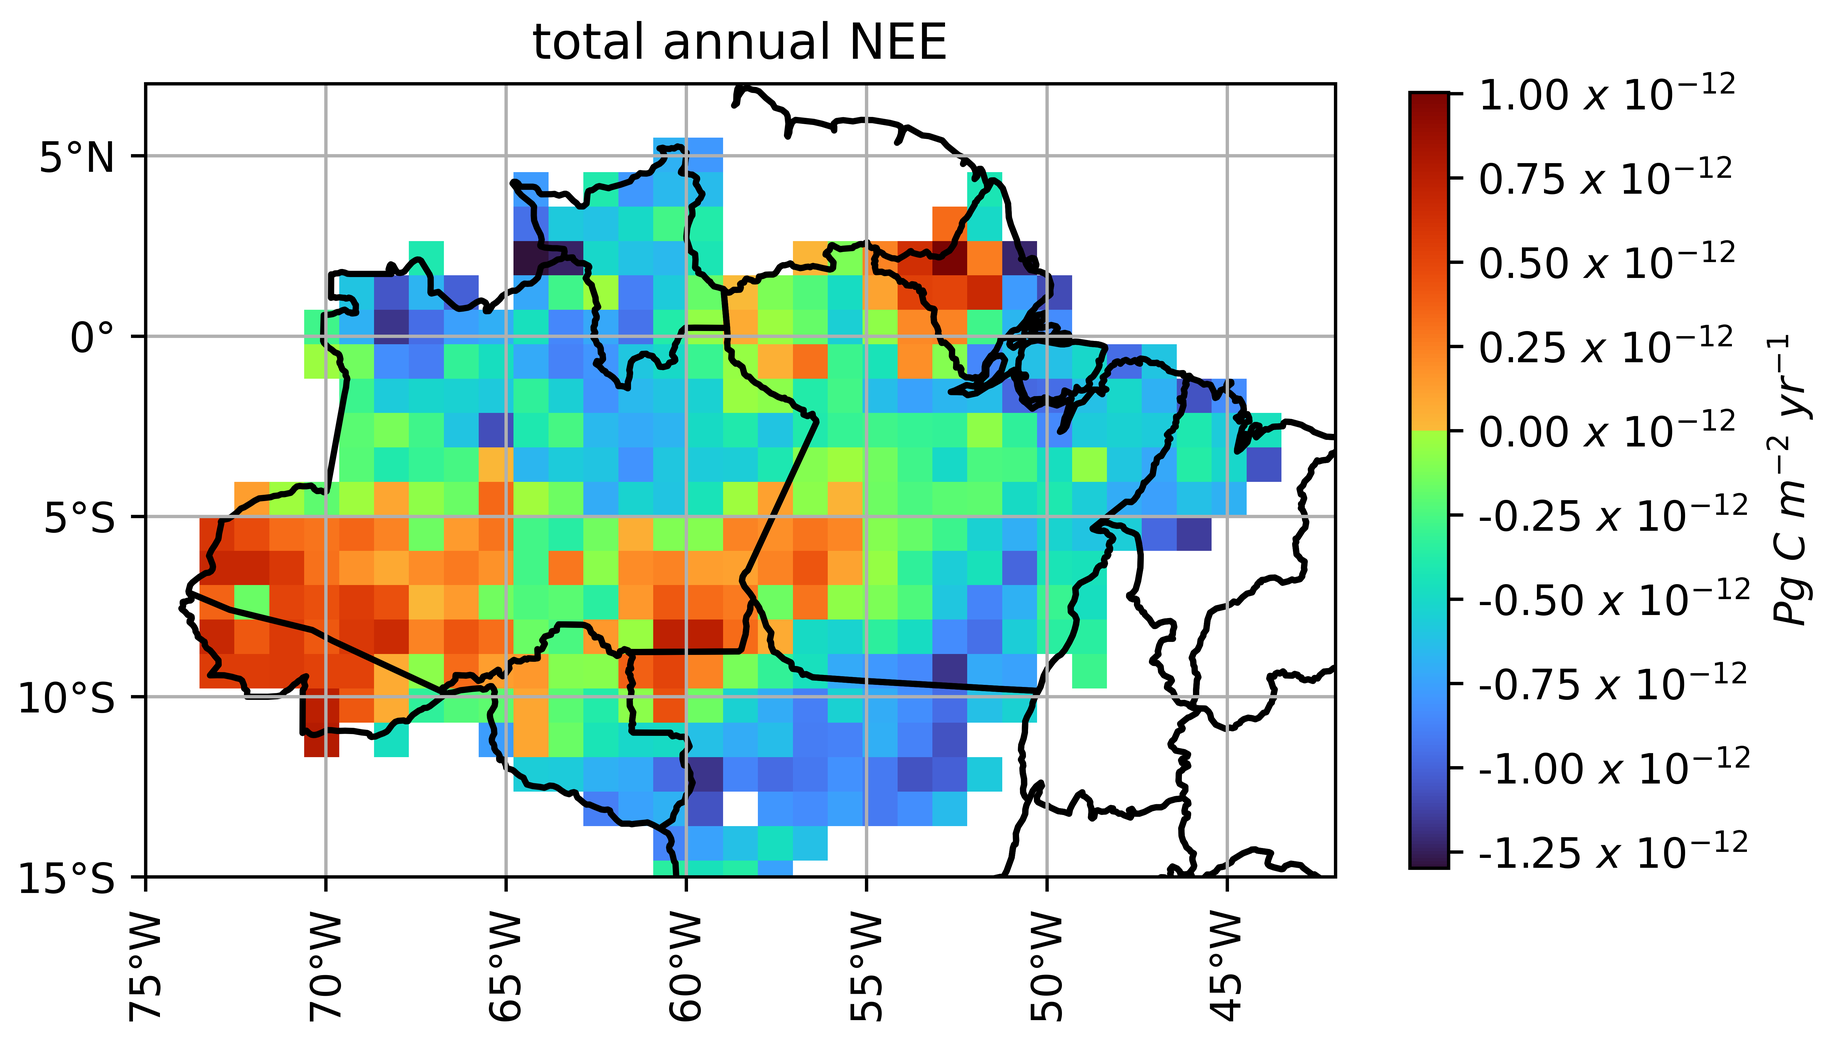
Figure 8NEE accumulated in kg C m−2 during 2021 in the Brazilian Amazon biome in the spatialized JULES model.
This section will discuss some relevant results demonstrated in this study. The first aspect is related to the new parametrization of the JULES model in four different sites of the Brazilian Amazon biome, taking into account the adjustment of the most sensitive parameters of JULES. The Nelder-Mead method optimized the JULES model, and the resulting parameters were spatialized using linear regressions. The second aspect of the discussion is related to the NEE estimation utilizing the JULES spatialized. In this aspect, JULES spatialized demonstrated a carbon sink of −1.34 Pg C m−2 in the year 2021, showing a strong carbon source in the states of Acre and Amapa, regions characterized by specific climatic and vegetation characteristics, respectively.
4.1 JULES optimization
The optimization of JULES for four parameters at the four flux tower sites in this study showed convergence in their values, consistent with the findings of Clark et al. (2011) for tupp value (36 °C) for Santarém and Jarú, and the f0 value for Jarú (0.875). Additionally, the f0 value calibrated for Santarém in this study was close to that reported by Raoult et al. (2016), which was 0.765. The tupp values for ATTO and K34 were similar to those reported by Harper et al. (2016), who increased tupp to 43 °C for tropical forests. The parameter fd was similar to the value reported by Harper et al. (2016) for ATTO and K34, however, it was lower than 0.01 for Santarém and Jarú, with values of 0.0066 and 0.007, respectively. The α parameter was lower than that in all previous JULES calibration studies for each of the towers. However, the results of this study for α parameter are in line with the values near 0.05 and 0.06 mol PAR mol CO reported by Skillman (2008), who analyzed different types of C3 plants, including Broadleaf Evergreen Trees. This could be explained by the way that the default version overestimated GPP in comparison to the calibrated version (Fig. 4).
The cross-validation procedure also showed that the α parameter did not show a linear relationship with canopy height or LAI (Fig. S13). This may be explained by the fact that the values for each tower were nearly constant, with a difference of only 0.0018 mol PAR mol CO, while the other parameters exhibited greater variability between sites. In practical terms, the spatialization of the α parameter was almost the same as using its mean value all over the study area. The spatialized JULES also showed lower RMSE for NEE compared to the VPRM model in every tower approached in this study, including the validation tower. This can be explained by the greater complexity of how JULES estimates GPP and, particularly, Reco. VPRM uses a simpler approach, relying on a linear regression in which air temperature is the sole independent variable (Gourdji et al., 2022). In contrast, JULES estimates GPP and Reco with more sophisticated equations that account for factors such as water stress, nitrogen content in different plant components (Best et al., 2011; Clark et al., 2011), photosynthesis light saturation (Eq. 3), and CO2 leaf concentration (Eq. 5). The optimization of the parameters α, tupp, f0, and fd explain the improvement in the performance compared to the default version and to the VPRM model.
4.2 NEE estimates using JULES spatialized
The first relevant aspect that spatialized JULES was able to reproduce was the increase of GPP during the dry season, showing that water may not be a limitation for carbon assimilation in the Amazonian dry season (Figs. 3 and 6). Restrepo-Coupe et al. (2013) also observed the same feature by comparing different Eddy-covariance towers spread in the Brazilian Amazon biome. One potential improvement to this methodology would be to consider parameters, primarily the leaf area index (LAI), which varies throughout the seasonal cycle. This is because the photosynthetic capacity of the canopy and leaf phenology are among the main seasonal drivers in this region (Restrepo-Coupe et al., 2013). Using different parameterizations throughout the year would provide a more accurate description of the effect of leaf phenology in different zones and seasons to cover the heterogeneity of trees. This is particularly important for the emergence of leaves, which open their stomata more frequently for photosynthesis than older leaves approaching senescence (Wu et al., 2016). The absence of phenology representation in some process-based models was noted by Restrepo-Coupe et al. (2017) and Botía et al. (2022), who observed a tendency for these models to underestimate GPP during the dry season. In contrast, the spatialization method used in this study, incorporating varying parameters based on LAI and canopy height, improved the model's ability to simulate GPP and Reco with greater diversity (Fig. 6).
The spatialized JULES generated values of NEE between 0.75 and −1.25 kg C m−2 yr−1. This range includes the mean value reported by Lian et al. (2023), which estimated an average value of NEE in the South American Forest of −0.205 kg C m−2 yr−1 using a Random Forest Model applied in a global system. The spatialized JULES also demonstrated that the major focus of carbon sources was located in the states of Amapa and Acre (Fig. 7). The forest of Amapa has tall trees (> 35 m) and a low leaf area index (< 4.5 m2 m−2), considering that this region has the major above-ground biomass of the Amazon biome, reaching 518 Mg ha−1 (Ometto et al., 2023). The spatialization reduced the tupp and f0, which may lead to a reduction in GPP in relation to Reco, generating a carbon source in this region. A possible explanation is increased Reco in mature and tall forests, such as those found in the Amapa region. West (2020) observed in a review of studies with different tree species that the costs of respiration increase over the years while GPP remains constant, which could explain the net carbon source. The costs are based on adjustments in morphology and anatomy to construct new structures in the xylem, roots, and leaves to support the high amount of biomass. Concerning the state of Acre, there is a climatic condition that can explain the carbon source in this region, since annual rainfall is lower than 2000 mm (Silva et al., 2020), which can increase the cost of maintenance and hence the respiration to avoid hydric stress. It is important to have Eddy-covariance measurements in this region to confirm the trend of the carbon source.
The total NEE estimated for the Brazilian Amazon biome demonstrated a carbon sink (NEE) of −1.34 Pg C yr −1. The result obtained in this study falls between estimates by Chen et al. (2024), who reported annual NEE for the Amazon of −0.94 (Trendy-v11 model) and −3.46 Pg C yr−1 (FluxCom-RS model) for 2001-2015. It is important to mention that the FluxCom version utilized to analyze the NEE across the Brazilian Amazon biome (Fig. 7) is a new version with the X-BASE database (Nelson et al., 2024) in comparison to the FluxCom-RS utilized by Chen et al. (2024). The new version of FluxCom reduced the global NEE in relation to FluxCom-RS (−21 to −7 Pg C yr−1). Trendy v-11 is a dataset that provides global gridded carbon fluxes data from 16 different types of vegetation dynamics models (Sitch et al., 2024). Our result was closer to Trendy than to the FluxCom-RS, which can be favorable considering the uncertainties in the NEE partitioning in FluxCom-RS, with the Reco partitioned by the NEE instead of subtracting GPP to get NEE (Jung et al., 2020). Due to this reason, FluxCom-RS underestimated Reco and tends to estimate a higher carbon sink. JULES is included in Trendy v-11, however, the version utilized to simulate carbon fluxes was JULES 5.1 (Wiltshire et al., 2021). In this version, JULES has only five Plant Function Types, and the version we utilized to simulate carbon flux is v7.0. In this version, we use the parametrization specific to Tropical Evergreen Broadleaf trees (Harper et al., 2016). One parameter modified in this version was tupp (36 °C in Clark et al., 2011 to 43 °C in Harper et al., 2016). This could be a reason that the carbon sink in the Brazilian Amazon biome is larger than the JULES version in Trendy v-11, because this parameter is relevant for GPP. Due to this aspect, in Sect. S5, we compared the default JULES, the spatialized version, and the Trendy v-11 configuration based on Clark et al. (2011). It was possible to observe that Harper et al. (2016) tend to overestimate the carbon sink, while the spatialized version aligns with ATTO observations for 2018 (Fig. S17).
In comparison with the annual value obtained by the mean and default versions of JULES (Harper et al., 2016), the default version obtained a carbon sink of −3.08 Pg C yr−1 (see Fig. S18), while the mean version obtained a carbon sink of −2.06 Pg C yr−1 (see Fig. S19). The default version of JULES presented a value similar to that obtained by FluxCom-RS (−3.46 Pg C yr−1). This can demonstrate that the calibration procedure adopted in this study improved the carbon simulations by JULES despite the lack of FluxCom-RS equations to simulate Reco. Another piece of evidence demonstrating the improvements made by the calibration procedure is that the mean value of the optimized parameters reduced the carbon sink in the Brazilian Amazon biome by 33.12 % compared to the default value. The spatialised version of JULES reduced the carbon sink of the Brazilian Amazon biome by 56.49 % compared to the default version. Also, reduced by 34.96 % in comparison to the mean version, reaching a value closest to that provided by Trendy-v11 (−0.94 Pg C yr−1) by Chen et al. (2024). This reduction in the carbon sink can mainly be explained by the regions of Acre, as shown in Figs. S18 and S19 for the default and mean versions, respectively. This can be considered the effect of the method of spatializing the sensitivity parameters f0 and fd, which are directly related to water stress (Clark et al., 2011), as characterised in this region. The same aspect can explain why the spatialised version of JULES demonstrated a high carbon source in the south of the Amazonian state (> 0.50 kg C m−2 yr−1), which the default and mean parametrizations did not capture (between 0 and 0.25 kg C m−2 yr−1). However, it is worth noting that the state of Amapá demonstrates a carbon source in all three versions of JULES, reaching 0.75 kg C m−2yr−1. This suggests that the height of the tree canopy in this region contributes to the carbon source.
The result of −1.34 Pg C yr−1 was a stronger sink than found by other studies related to the Amazon region, as Botía et al. (2025) (−0.33 Pg C yr−1) and Rosan et al. (2024) (−0.34 Pg C yr−1), however, some aspects need to be considered. The first aspect is related to the number of years evaluated in these studies in relation to our study. We have just evaluated the year 2021 instead of other studies that evaluated more than ten years, as the case of Chen et al. (2024), and nine years, as the case Botía et al. (2025). In order to assess uncertainties and the importance of interannual variability in NEE, future studies could perform simulations for additional years, using the spatialization of parameters developed here. The second aspect is that the carbon flux obtained by Botía et al. (2025) (Net Land Flux) is the sum of river fluxes and NEE. In our simulation, we have just the NEE obtained by vegetation, similar to the paper by Chen et al. (2024), which generated a NEE of −0.94 Pg C yr−1 using the Trendy-v11 and 3.46 Pg C yr−1 using the FluxCom-RS. The third aspect is related to the fire emissions that can contribute to reducing the carbon sink; this value can vary from 0.09 Pg C yr−1 (Rosan et al., 2024) to 0.41 Pg C yr−1 (Gatti et al., 2021).
Another factor contributing to discrepancies among models is that some process-based models tend to overestimate the carbon sink in tropical forests, as reported by Restrepo-Coupe et al. (2017) and Botía et al. (2022). The distance between models particularly occurs when compared with process-based and inversion models, such as Carbon Tracker. The reason can be explained by the incorrect assumption of water limitation and the lack of leaf phenology in model formulations (Gonçalves et al., 2020). Also, JULES demonstrated a higher sink in other types of vegetation presented in the Amazon biome as C4 grass (Harper et al., 2016) and C3 crops (Williams et al., 2017; Prudente et al., 2022), in regions such as the states of Mato Grosso, Roraima, and east of Pará (Fig. 8). In a region predominantly composed of C4 grass (longitude 49.5° W, latitude 7.5° S), with 84.5 % of C4 grass (see Fig. S3), JULES simulated a carbon sink of −250 g C m−2 yr−1 (Fig. 8). The carbon sink value is stronger (more negative) than that reported by Bezerra et al. (2022), who obtained an annual NEE of −215 g C m−2 yr−1 at an Eddy-Covariance tower in Brazil's Northeast, working with Urochloa brizantha cv Marandu, the main pasture in the arc of deforestation. This indicates that tropical grassland can be considered a carbon sink mainly in regions with a latitude near 15 to 0° S, with similar radiation levels during different seasons of the year. However, it is important to point out that the improvement of grassland parameterization is out of the scope of the current study. One step that can improve the estimation of NEE in the arc of deforestation is the calibration and evaluation of crops, which can reduce the carbon sink in the regions of Mato Grosso and Roraima. Another area for improvement in future studies would be to use other canopy height databases, such as those based on airborne lidar observations, to improve the spatialization of plant physiological parameters
The spatialized JULES demonstrated a stronger carbon sink in comparison to FluxCom-X and the European Carbon Tracker in the Amazon basin, deforestation arc, and North of Mato Grosso, although it estimated a higher carbon source in the states of Acre and Amapá. However, the new optimization and the spatialization approach showed improvements over the version used by Harper et al. (2016), which applied average optimized parameters. Studies on spatializing carbon fluxes in the Amazon using process-based models are scarce; however, Zhu et al. (2025) reported similar sensitivities in ORCHIDEE model parameters. The similarities were related to light and nitrogen limitations and highlighted flux heterogeneity when accounting for vegetation differences. Despite some similar conclusions, the methodologies differed substantially. Our study uses Eddy-covariance towers and a statistical model to spatialize carbon fluxes based on sensitive, calibrated parameters and vegetation properties. By contrast, Zhu et al.'s (2025) study uses satellite observations of tree aboveground biomass and gross primary production (GPP) at a very different spatial scale. In addition to reducing the estimated carbon sink, it also highlighted the influence of vegetation heterogeneity on the spatial distribution of carbon budget across the Amazon biome, particularly in the states of Amapá and Acre.
This study presented a new method to estimate NEE from an optimized land surface model, with parameters spatialized using two vegetation properties: Canopy height and LAI. The first aspect presented in this study was to demonstrate the most sensitive parameters for NEE, which were canht, tupp, α, f0, and fd. The optimization of selected JULES parameters for the PFT BET-TR led to a reduction in both RMSE and the d-index across all four analyzed towers, when compared to the default parameter values and the VPRM model. Our spatialization attempt was validated in an independent tower, resulting in a better performance compared to VPRM and to the default version of JULES. In general, the spatialized JULES model showed a stronger carbon sink in the northern Amazon region and across the Amazon basin compared to FluxCom-X and Carbon Tracker, particularly during the dry season. The spatialized version of JULES also indicated significant carbon source regions (> 75 g C m−2 month−1) in Amapá and Acre. This highlights the importance of considering how forests with tall canopy height (> 35 m), such as those in Amapá, and the influence of climate conditions, as observed in Acre, contribute to the overall carbon budget. The spatialized JULES resulted in a NEE estimate of −1.34 Pg C in 2021, which is a value that approaches those of dynamic vegetation models for the Amazon biome.
Despite the advances presented in this study, some aspects still need more robust explanations. One is related to the strong carbon source in the regions of Amapá and Acre, simulated by JULES in 2021. Further investigation of the carbon balance in these regions is needed. It is important to note that this study developed an optimization of JULES using a limited number of Eddy-covariance towers. While this approach improved model simulations, further improvements could be achieved by installing additional towers in different forest types across the Amazon region, especially in regions with tall canopy heights (> 35 m). Another aspect that could be improved is the simulation of regions dominated by agricultural land uses, such as soybean, maize, and pasture. These areas, particularly in northern Mato Grosso, are relevant because the model currently simulates them as carbon sinks. Despite the development of JULES-crop, this model is not coupled in the most recent version of JULES, a feature that could improve simulations in agricultural zones. Additionally, calibration and evaluation using Eddy-covariance towers in croplands and pastures could improve model performance in the deforestation arc. Despite these limitations, this study highlights the relevance of spatializing NEE using vegetation indices, demonstrating how this approach can improve the estimation of carbon fluxes in the Brazilian Amazon biome by identifying source and sink regions in relation to forest height and density.
The dataset covering all simulations described in this report is available at this link: http://ftp.lfa.if.usp.br/ftp/public/LFA_Processed_Data/articles_database/Prudente_2025/ (last access: 4 February 2026).
The supplement related to this article is available online at https://doi.org/10.5194/bg-23-1771-2026-supplement.
ACPJ wrote the initial manuscript and ran the JULES model for the Brazilian Amazon biome. ACPJ, together with LATM, LVR, SB, and FSS, designed the methodology. DSM assisted in adapting JULES for the Amazon region. LPC ran VPRM model for different sites across the Brazilian Amazon biome. CQDJ provided meteorological data measured in the ATTO tower. LATM, LVR, PEAN, TA and EF provided Amanan's computers to run JULES. LATM, CP, SB and PEAN consolidated funding for the postdoctoral position and an exchange period at the Max Planck Institute for Biogeochemistry in Jena. LATM, LVR, XX, SB helped with the data curation and the interpretation of the results. IMCT helped to improve observed carbon fluxes at different sites in the Amazon region. FSS contributed to developing scripts to run JULES and to designed figures presented in the manuscript. LATM, LVRM, XX, SB, FSS, EF, CQDJ and IVCT contributed to review the manuscript.
The contact author has declared that none of the authors has any competing interests.
Publisher's note: Copernicus Publications remains neutral with regard to jurisdictional claims made in the text, published maps, institutional affiliations, or any other geographical representation in this paper. The authors bear the ultimate responsibility for providing appropriate place names. Views expressed in the text are those of the authors and do not necessarily reflect the views of the publisher.
The authors acknowledge the use of the 90 Amanan's Clusters, a collaborative facility supplied under the Institute of Astronomy, Geophysics and Atmosphere Science of the University of São Paulo. Also, the Max Planck Institute of Biogeochemistry for the ATTO towers data availability and the São Paulo Research Foundation to fund the projects 2023/06623-1 and 2022/07974-0.
Funding sources include the support of the RCGI – Research Centre for Greenhouse Gas Innovation hosted by the University of São Paulo and sponsored by FAPESP – São Paulo Research Foundation (process number 2020/15230-5) and the thematic project “Synergistic effects of climate change and land use on carbon source and sink of Amazon Forest ecosystem” (project number 2022/07974-0). FAPESP also funds the projects 2023/06623-1, 2023/04358-9 and 2024/12950-8. Also, the CNPq – National Council for Scientific and Technological Development, to fund the project 304819/2022-0.
This paper was edited by Marijn Bauters and reviewed by two anonymous referees.
Aguirre-Gutiérrez, J., Rifai, S. W., Deng, X., Ter Steege, H., Thomson, E., Corral-Rivas, J. J., Guimares, A.F., Muller, S., Klipel, J., Fauset, S., Resende, A. F., Wallin, G., Joly, C. A., Abernethy, K., Adu-Bredu, S., Silva, C. A., Oliveira, E. A., Almeida, D. R. A., Alvarez-Davila, E., Asner, G. P., Baker, T. R., Benchimol, M., Bentley, L. P., Berenguer, E., Blanc, L., Bonal, D., Bordin, K., Borges de Lima, R., Both, S., Cabezas Duarte, J., Cardoso, D., de Lima, H. C., Cavalheiro, L., Cernusak, L. A., dos Santos Prestes, N. C. C., da Silva Zanzini, A. C., da Silva, R. J., dos Santos Alves da Silva, R., de Andrade Iguatemy, M., De Sousa Oliveira, T. C., Dechant, B., Derroire, G., Dexter, K. G., Rodrigues, D. J., Espírito-Santo, M., Fernandes Silva, L., Domingues, T. F., Ferreira, J., Simon, M. F., Girardin, C. A. J., Hérault, B., Jeffery, K. J., Ashtamoorthy, S. K., Sivadasan, A. K., Klitgaard, B., Laurance, W. F., Dan, M. L., Magnusson, W. E., Campos-Filho, E. M., dos Santos, R. M., Manzatto, A. G., Silveira, M., Marimon-Junior, B. H., Martin, R. E., Mascia Vieira, D. L., Metzker, T., Milliken, W., Moonlight, P., Moraes de Seixas, M. M., Morandi, P. S., Muscarella, R., Nava-Miranda, M. G., Nyirambangutse, B., Oliveira Silva, J., Oliveras Menor, I., Pena Rodrigues, P. J. F., Pereira de Oliveira, C., Pereira Zanzini, L., Peres, C. A., Punjayil, V., Quesada, C. A., Réjou-Méchain, M., Riutta, T., Rivas-Torres, G., Rosa, C., Salinas, N., Scarton Bergamin, R., Schwantes Marimon, B., Shenkin, A., Silva Rodrigues, P. M., Simões Figueiredo, A. E., Souza Garcia, Q., Spósito, T., Storck-Tonon, D., Sullivan, M. J. P., Svátek, M., Vieira Santiago, W. T., Teh, Y. A., Theruvil Parambil Sivan, P., Trindade Nascimento, M., Veenendaal, E., Zo-Bi, I. C., Dago, M. R., Traoré, S., Patacca, M., Badouard, V., Chaves e Carvalho, S. de P., White, L. J. T., Zhang-Zheng, H., Zibera, E., Zwerts, J. A., Burslem, D. F. R. P., Silman, M., Chave, J., Enquist, B. J., Barlow, J., Phillips, O. L., Coomes, D. A., and Malhi, Y.: Canopy functional trait variation across Earth's tropical forests, Nature, 1–8, https://doi.org/10.5281/zenodo.14509493, 2025.
Araújo, A. C., Nobre, A. D., Kruijt, B., Elbers, J. A., Dallarosa, R., Stefani, P., von Randow, C., Manzi, A.O., Culf, A.D., Gash, J.H.C., Valentini, R., and Kabat, P.: Comparative measurements of carbon dioxide fluxes from two nearby towers in a central Amazonian rainforest: The Manaus LBA site, Journal of Geophysical Research: Atmospheres, 107, LBA 58-1–LBA 58-20, https://doi.org/10.1029/2001JD000676, 2002.
Andreae, M. O., Acevedo, O. C., Araùjo, A., Artaxo, P., Barbosa, C. G. G., Barbosa, H. M. J., Brito, J., Carbone, S., Chi, X., Cintra, B. B. L., da Silva, N. F., Dias, N. L., Dias-Júnior, C. Q., Ditas, F., Ditz, R., Godoi, A. F. L., Godoi, R. H. M., Heimann, M., Hoffmann, T., Kesselmeier, J., Könemann, T., Krüger, M. L., Lavric, J. V., Manzi, A. O., Lopes, A. P., Martins, D. L., Mikhailov, E. F., Moran-Zuloaga, D., Nelson, B. W., Nölscher, A. C., Santos Nogueira, D., Piedade, M. T. F., Pöhlker, C., Pöschl, U., Quesada, C. A., Rizzo, L. V., Ro, C.-U., Ruckteschler, N., Sá, L. D. A., de Oliveira Sá, M., Sales, C. B., dos Santos, R. M. N., Saturno, J., Schöngart, J., Sörgel, M., de Souza, C. M., de Souza, R. A. F., Su, H., Targhetta, N., Tóta, J., Trebs, I., Trumbore, S., van Eijck, A., Walter, D., Wang, Z., Weber, B., Williams, J., Winderlich, J., Wittmann, F., Wolff, S., and Yáñez-Serrano, A. M.: The Amazon Tall Tower Observatory (ATTO): overview of pilot measurements on ecosystem ecology, meteorology, trace gases, and aerosols, Atmos. Chem. Phys., 15, 10723–10776, https://doi.org/10.5194/acp-15-10723-2015, 2015.
Baldocchi, D. D.: Assessing the eddy covariance technique for evaluating carbon dioxide exchange rates of ecosystems: past, present and future, Global Change Biology, 9, 479–492, https://doi.org/10.1046/j.1365-2486.2003.00629.x, 2003.
Best, M. J., Pryor, M., Clark, D. B., Rooney, G. G., Essery, R. L. H., Ménard, C. B., Edwards, J. M., Hendry, M. A., Porson, A., Gedney, N., Mercado, L. M., Sitch, S., Blyth, E., Boucher, O., Cox, P. M., Grimmond, C. S. B., and Harding, R. J.: The Joint UK Land Environment Simulator (JULES), model description – Part 1: Energy and water fluxes, Geosci. Model Dev., 4, 677–699, https://doi.org/10.5194/gmd-4-677-2011, 2011.
Bezerra, B. G., e Silva, C. M. S., Mendes, K. R., Mutti, P. R., Fernandes, L. S., Marques, T. V., and Lucio, P. S.: CO2 exchanges and evapotranspiration of a grazed pasture under tropical climate conditions, Agricultural and Forest Meteorology, 323, 109088, https://doi.org/10.1016/j.agrformet.2022.109088, 2022.
Botía, S., Komiya, S., Marshall, J., Koch, T., Gałkowski, M., Lavric, J., Gomes-Alves, E., Walter, D., Fisch, G., Pinho, D. M., Nelson, B. W., Martins, G., Luijkx, I. T., Koren, G., Florentie, L., Araújo, A. C., Sá, M., Andreae, M. O., Heimann, M., Peters, W., and Gerbig, C.: The CO2 record at the Amazon Tall Tower Observatory: A new opportunity to study processes on seasonal and inter-annual scales, Global Change Biology, 28, 588–611, https://doi.org/10.1111/gcb.15905, 2022.
Botía, S., Munassar, S., Koch, T., Custodio, D., Basso, L. S., Komiya, S., Lavric, J. V., Walter, D., Gloor, M., Martins, G., Naus, S., Koren, G., Luijkx, I. T., Hantson, S., Miller, J. B., Peters, W., Rödenbeck, C., and Gerbig, C.: Combined CO2 measurement record indicates Amazon forest carbon uptake is offset by savanna carbon release, Atmos. Chem. Phys., 25, 6219–6255, https://doi.org/10.5194/acp-25-6219-2025, 2025.
Boussetta, S., Balsamo, G., Beljaars, A., Kral, T., and Jarlan, L.: Impact of a satellite-derived leaf area index monthly climatology in a global numerical weather prediction model, International Journal of Remote Sensing, 34, 3520–3542, https://doi.org/10.1080/01431161.2012.716543, 2013.
Brienen, R. J., Phillips, O. L., Feldpausch, T. R., Gloor, E., Baker, T. R., Lloyd, J., Lopes-Gonzalez, G., Monteagudo-Mendoza, A., Malhi, Y., Lewis, L. S., Vasques Martinez, R., Alexiades, M., Alvarez Davila, E., Alvares Loyaza, P., Andrade, A., Aragão, L. E. O. C., Muramaki, A. A., Arets, E. J. M. M., Arroyo, L., Aymard, C. G. A., Banki, O. S., Baraloto, C., Barroso, J., Donal, D., and Zagt, R. J.: Long-term decline of the Amazon carbon sink, Nature, 519, 344–348, https://doi.org/10.1038/nature14283, 2015.
Caen, A., Smallman, T. L., de Castro, A. A., Robertson, E., von Randow, C., Cardoso, M., and Williams, M.: Evaluating two land surface models for Brazil using a full carbon cycle benchmark with uncertainties, Climate Resilience and Sustainability, 1, e10, https://doi.org/10.1002/cli2.10, 2022.
Chandrasekar, K., Sesha Sai, M. V. R., Roy, P. S., and Dwevedi, R. S.: Land Surface Water Index (LSWI) response to rainfall and NDVI using the MODIS Vegetation Index product, International Journal of Remote Sensing, 31, 3987–4005, https://doi.org/10.1080/01431160802575653, 2010.
Chen, B., Xu, X., Wang, S., Yang, T., Liu, Z., and Falk, S.: Carbon dioxide fertilization enhanced carbon sink offset by climate change and land use in Amazonia on a centennial scale, Science of The Total Environment, 955, 176903, https://doi.org/10.1016/j.scitotenv.2024.176903, 2024.
Clark, D. B., Mercado, L. M., Sitch, S., Jones, C. D., Gedney, N., Best, M. J., Pryor, M., Rooney, G. G., Essery, R. L. H., Blyth, E., Boucher, O., Harding, R. J., Huntingford, C., and Cox, P. M.: The Joint UK Land Environment Simulator (JULES), model description – Part 2: Carbon fluxes and vegetation dynamics, Geosci. Model Dev., 4, 701–722, https://doi.org/10.5194/gmd-4-701-2011, 2011.
Collatz, G. J., Ball, J. T., Grivet, C., and Berry, J. A.: Physiological and environmental regulation of stomatal conductance, photosynthesis and transpiration: a model that includes a laminar boundary layer, Agricultural and Forest Meteorology, 54, 107–136, https://doi.org/10.1016/0168-1923(91)90002-8, 1991.
Collatz, G. J., Ribas-Carbo, M., and Berry, J. A.: Coupled photosynthesis-stomatal conductance model for leaves of C4 plants, Functional Plant Biology, 19, 519–538, https://doi.org/10.1071/PP9920519, 1992.
Dakhlaoui, H.: Vers une procédure de calage automatique plus efficiente du modèle HBV, Doctoral dissertation, Université de Tunis El Manar, https://www.scirp.org/reference/referencespapers.aspx?referenceid=3080780 (last access: 3 February 2026), 2014.
De Lima Filho, R. R.: Produtor de soja deve ter um bom lucro na safra 2021/22, AgroANALYSIS, 41, 15–17, 2021.
Fernandes, L. D. O., Reis, R. D. A., Paes, J. M. V., Teixeira, R. M. A., Queiroz, D. S., Paschoal, J. J., and Paschoal, J. J.: Desempenho de bovinos da raça Gir em pastagem de Brachiaria brizantha submetidos a diferentes manejos, Revista Brasileira de Saúde e Produção Animal, 16, 36–46, https://doi.org/10.1590/S1519-99402015000100004, 2015.
Friedlingstein, P., O'Sullivan, M., Jones, M. W., Andrew, R. M., Gregor, L., Hauck, J., Le Quéré, C., Luijkx, I. T., Olsen, A., Peters, G. P., Peters, W., Pongratz, J., Schwingshackl, C., Sitch, S., Canadell, J. G., Ciais, P., Jackson, R. B., Alin, S. R., Alkama, R., Arneth, A., Arora, V. K., Bates, N. R., Becker, M., Bellouin, N., Bittig, H. C., Bopp, L., Chevallier, F., Chini, L. P., Cronin, M., Evans, W., Falk, S., Feely, R. A., Gasser, T., Gehlen, M., Gkritzalis, T., Gloege, L., Grassi, G., Gruber, N., Gürses, Ö., Harris, I., Hefner, M., Houghton, R. A., Hurtt, G. C., Iida, Y., Ilyina, T., Jain, A. K., Jersild, A., Kadono, K., Kato, E., Kennedy, D., Klein Goldewijk, K., Knauer, J., Korsbakken, J. I., Landschützer, P., Lefèvre, N., Lindsay, K., Liu, J., Liu, Z., Marland, G., Mayot, N., McGrath, M. J., Metzl, N., Monacci, N. M., Munro, D. R., Nakaoka, S.-I., Niwa, Y., O'Brien, K., Ono, T., Palmer, P. I., Pan, N., Pierrot, D., Pocock, K., Poulter, B., Resplandy, L., Robertson, E., Rödenbeck, C., Rodriguez, C., Rosan, T. M., Schwinger, J., Séférian, R., Shutler, J. D., Skjelvan, I., Steinhoff, T., Sun, Q., Sutton, A. J., Sweeney, C., Takao, S., Tanhua, T., Tans, P. P., Tian, X., Tian, H., Tilbrook, B., Tsujino, H., Tubiello, F., van der Werf, G. R., Walker, A. P., Wanninkhof, R., Whitehead, C., Willstrand Wranne, A., Wright, R., Yuan, W., Yue, C., Yue, X., Zaehle, S., Zeng, J., and Zheng, B.: Global Carbon Budget 2022, Earth Syst. Sci. Data, 14, 4811–4900, https://doi.org/10.5194/essd-14-4811-2022, 2022.
Friend, A. D., Schugart, H. H., and Running, S. W.: A physiology-based gap model of forest dynamics, Ecology, 74, 792–797, https://doi.org/10.2307/1940806, 1993.
Gatti, L. V., Basso, L. S., Miller, J. B., Gloor, M., Gatti Domingues, L., Cassol, H. L. G., Tejada, G., Aragão, L. E. O. C., Nobre, C., Peters, W., Marani, L., Arai, E., Sanches, A. H., Corrala, S. M., Anderson, L., Von Randow, C., Correia, C. S. C., Crispim, S. P., and Neves, R. A. L.: Amazonia as a carbon source linked to deforestation and climate change, Nature, 595, 388–393, https://doi.org/10.1038/s41586-021-03629-6, 2021.
Gonçalves, N. B., Lopes, A. P., Dalagnol, R., Wu, J., Pinho, D. M., and Nelson, B. W.: Both near-surface and satellite remote sensing confirm drought legacy effect on tropical forest leaf phenology after 2015/2016 ENSO drought, Remote Sensing of Environment, 237, 111489, https://doi.org/10.1016/j.rse.2019.111489, 2020.
Gourdji, S. M., Karion, A., Lopez-Coto, I., Ghosh, S., Mueller, K. L., Zhou, Y., Williams, C. A., Baker, I. T., Haynes, K. D., and Whetstone, J. R.: A modified Vegetation Photosynthesis and Respiration Model (VPRM) for the eastern USA and Canada, evaluated with comparison to atmospheric observations and other biospheric models, Journal of Geophysical Research: Biogeosciences, 127, e2021JG006290, https://doi.org/10.1029/2021JG006290, 2022.
Grubbs, F. E.: Procedures for detecting outlying observations in samples, Technometrics, 11, 1–21, https://doi.org/10.1080/00401706.1969.10490657, 1969.
Harper, A. B., Cox, P. M., Friedlingstein, P., Wiltshire, A. J., Jones, C. D., Sitch, S., Mercado, L. M., Groenendijk, M., Robertson, E., Kattge, J., Bönisch, G., Atkin, O. K., Bahn, M., Cornelissen, J., Niinemets, Ü., Onipchenko, V., Peñuelas, J., Poorter, L., Reich, P. B., Soudzilovskaia, N. A., and Bodegom, P. V.: Improved representation of plant functional types and physiology in the Joint UK Land Environment Simulator (JULES v4.2) using plant trait information, Geosci. Model Dev., 9, 2415–2440, https://doi.org/10.5194/gmd-9-2415-2016, 2016.
Harper, A. B., Wiltshire, A. J., Cox, P. M., Friedlingstein, P., Jones, C. D., Mercado, L. M., Sitch, S., Williams, K., and Duran-Rojas, C.: Vegetation distribution and terrestrial carbon cycle in a carbon cycle configuration of JULES4.6 with new plant functional types, Geosci. Model Dev., 11, 2857–2873, https://doi.org/10.5194/gmd-11-2857-2018, 2018.
Harris, C. R., Millman, K. J., Van Der Walt, S. J., Gommers, R., Virtanen, P., Cournapeau, D., and Oliphant, T. E.: Array programming with NumPy, Nature, 585, 357–362, https://doi.org/10.1038/s41586-020-2649-2, 2020.
Hayek, M. N., Wehr, R., Longo, M., Hutyra, L. R., Wiedemann, K., Munger, J. W., Bonal, D., Saleska, S. R., Fitzjarrald, D. R., and Wofsy, S. C.: A novel correction for biases in forest eddy covariance carbon balance, Agr. Forest Meteorol., 250–251, 90–101, https://doi.org/10.1016/j.agrformet.2017.12.186, 2018.
Hersbach, H., Bell, B., Berrisford, P., Hirahara, S., Horányi, A., Muñoz-Sabater, J., Nicolas, J., Peubey, C., Radu, R., Schepers, D., Simmons, A., Soci, C., Abdalla, S., Abellan, X., Balsamo, G., Bechtold, P., Biavati, G., Bidlot, J., Bonavita, M., De Chiara, G., Dahlgren, P., Dee, D., Diamantakis, M., Dragani, R., Flemming, J., Forbes, R., Fuentes, M., Geer, A., Haimberger, L., Healy, S., Hogan, R. J., Hólm, E., Janisková, M., Keeley, S., Laloyaux, P., Lopez, P., Lupu, C., Radnoti, G., de Rosnay, P., Rozum, I., Vamborg, F., Villaume, S., and Thépaut, J.-N.: The ERA5 global reanalysis, Quarterly Journal of the Royal Meteorological Society, 146, 1999–2049, https://doi.org/10.1002/qj.3803, 2020.
Jacobson, A. R., Schuldt, K. N., Tans, P., Andrews, A., Miller, J. B., Oda, T., Basu, S., Mund, J., Weir, B., Ott, L., Aalto, T., Abshire, J. B., Aikin, K., Aoki, S., Apadula, F., Arnold, S., Baier, B., Bartyzel, J., Beyersdorf, A., Biermann, T., Biraud, S. C., Boenisch, H., Brailsford, G., Brand, W. A., Chen, G., Chen, H., Chmura, L., Clark, S., Colomb, A., Commane, R., Conil, S., Couret, C., Cox, A., Cristofanelli, P., Cuevas, E., Curcoll, R., Daube, B., Davis, K. J., De Wekker, S., Della Coletta, J., Delmotte, M., DiGangi, E., DiGangi, J. P., di Sarra, A. G., Dlugokencky, E., Elkins, J. W., Emmenegger, L., Fang, S., Fischer, M. L., Forster, G., Frumau, A., Galkowski, M., Gatti, L. V., Gehrlein, T., Gerbig, C., Gheusi, F., Gloor, E., Gomez-Trueba, V., Goto, D., Griffis, T., Hammer, S., Hanson, C., Haszpra, L., Hatakka, J., Heimann, M., Heliasz, M., Hensen, A., Hermansen, O., Hintsa, E., Holst, J., Ivakhov, V., Jaffe, D. A., Jordan, A., Joubert, W., Karion, A., Kawa, S. R., Kazan, V., Keeling, R. F., Keronen, P., Kneuer, T., Kolari, P., Komínková, K., Kort, E., Kozlova, E., Krummel, P., Kubistin, D., Labuschagne, C., Lam, D. H. Y., Lan, X., Langenfelds, R. L., Laurent, O., Laurila, T., Lauvaux, T., Lavric, J., Law, B. E., Lee, J., Lee, O. S. M., Lehner, I., Lehtinen, K., Leppert, R., Leskinen, A., Leuenberger, M., Levin, I., Levula, J., Lin, J., Lindauer, M., Loh, Z., Lopez, M., Luijkx, I. T., Lunder, C. R., Machida, T., Mammarella, I., Manca, G., Manning, A., Manning, A., Marek, M. V., Martin, M. Y., Matsueda, H., McKain, K., Meijer, H., Meinhardt, F., Merchant, L., Mihalopoulos, N., Miles, N. L., Miller, C. E., Mitchell, L., Mölder, M., Montzka, S., Moore, F., Moossen, H., Morgan, E., Morgui, J.-A., Morimoto, S., Müller-Williams, J., Munger, J. W., Munro, D., Myhre, C. L., Nakaoka, S.-I., Necki, J., Newman, S., Nichol, S., Niwa, Y., Obersteiner, F., O'Doherty, S., Paplawsky, B., Peischl, J., Peltola, O., Piacentino, S., Pichon, J.-M., Pickers, P., Piper, S., Pitt, J., Plass-Dülmer, C., Platt, S. M., Prinzivalli, S., Ramonet, M., Ramos, R., Reyes-Sanchez, E., Richardson, S. J., Riris, H., Rivas, P. P., Ryerson, T., Saito, K., Sargent, M., Sasakawa, M., Scheeren, B., Schuck, T., Schumacher, M., Seifert, T., Sha, M. K., Shepson, P., Shook, M., Sloop, C. D., Smith, P., Stanley, K., Steinbacher, M., Stephens, B., Sweeney, C., Thoning, K., Timas, H., Torn, M., Tørseth, K., Trisolino, P., Turnbull, J., van den Bulk, P., van Dinther, D., Vermeulen, A., Viner, B., Vitkova, G., Walker, S., Watson, A., Wofsy, S. C., Worsey, J., Worthy, D., Young, D., Zaehle, S., Zahn, A., and Zimnoch, M.: CarbonTracker CT2022, NOAA Global Monitoring Laboratory [data set], https://doi.org/10.25925/z1gj-3254, 2023.
Jung, M., Schwalm, C., Migliavacca, M., Walther, S., Camps-Valls, G., Koirala, S., Anthoni, P., Besnard, S., Bodesheim, P., Carvalhais, N., Chevallier, F., Gans, F., Goll, D. S., Haverd, V., Köhler, P., Ichii, K., Jain, A. K., Liu, J., Lombardozzi, D., Nabel, J. E. M. S., Nelson, J. A., O'Sullivan, M., Pallandt, M., Papale, D., Peters, W., Pongratz, J., Rödenbeck, C., Sitch, S., Tramontana, G., Walker, A., Weber, U., and Reichstein, M.: Scaling carbon fluxes from eddy covariance sites to globe: synthesis and evaluation of the FLUXCOM approach, Biogeosciences, 17, 1343–1365, https://doi.org/10.5194/bg-17-1343-2020, 2020.
Khanna, J. and Medvigy, D.: Strong control of surface roughness variations on the simulated dry season regional atmospheric response to contemporary deforestation in Rondônia, Brazil, Journal of Geophysical Research: Atmospheres, 119, 13-067, https://doi.org/10.1002/2014JD022278, 2014.
Li, J., Wang, Y. P., Duan, Q., Lu, X., Pak, B., Wiltshire, A., and Ziehn, T.: Quantification and attribution of errors in the simulated annual gross primary production and latent heat fluxes by two global land surface models, Journal of Advances in Modeling Earth Systems, 8, 1270–1288, https://doi.org/10.1002/2015MS000583, 2016.
Lian, Y., Li, H., Renyang, Q., Liu, L., Dong, J., Liu, X., and Zhang, H.: Mapping the net ecosystem exchange of CO2 of global terrestrial systems, International Journal of Applied Earth Observation and Geoinformation, 116, 103176, https://doi.org/10.1016/j.jag.2022.103176, 2023.
Liu, J., Bowman, K. W., Schimel, D. S., Parazoo, N. C., Jiang, Z., Lee, M., Bloom, A. A., Wunch, D., Frankenberg, C., Sun, Y., O'Dell, C. W., Gurney, K. R., Menemenlis, D., Gierach, M., Crisp, D., and Eldering, A.: Contrasting carbon cycle responses of the tropical continents to the 2015–2016 El Nino, Science, 358, 6360, https://doi.org/10.1126/science.aam5690, 2017.
Loague, K. and Green, R. E.: Statistical and graphical methods for evaluating solute transport models: overview and application, Journal of Contaminant Hydrology, 7, 51–73, https://doi.org/10.1016/0169-7722(91)90038-3, 1991.
Mahadevan, P., Wofsy, S. C., Matross, D. M., Xiao, X., Dunn, A. L., Lin, J. C., and Gottlieb, E. W.: A satellite-based biosphere parameterization for net ecosystem CO2 exchange: Vegetation Photosynthesis and Respiration Model (VPRM), Global Biogeochemical Cycles, 22, https://doi.org/10.1029/2006GB002735, 2008.
Malhi, G. S., Kaur, M., and Kaushik, P.: Impact of climate change on agriculture and its mitigation strategies: A review, Sustainability, 13, 1318, https://doi.org/10.3390/su13031318, 2021.
Marthews, T. R., Quesada, C. A., Galbraith, D. R., Malhi, Y., Mullins, C. E., Hodnett, M. G., and Dharssi, I.: High-resolution hydraulic parameter maps for surface soils in tropical South America, Geosci. Model Dev., 7, 711–723, https://doi.org/10.5194/gmd-7-711-2014, 2014.
Meir, P., Metcalfe, D. B., Costa, A. C. L., and Fisher, R. A.: The fate of assimilated carbon during drought: impacts on respiration in Amazon rainforests, Philos. Trans. R. Soc. B, 363, 1498, https://doi.org/10.1098/rstb.2007.0021, 2008.
Moraes, R. M., Correa, S. B., Doria, C. R. C., Duponchelle, F., Miranda, G., Montoya, M., Nobre, C., Encalada, A., Anderson, E., Roca Alcazar, F. H., Bustamante, M., Mena, C., Peña-Claros, M., Poveda, G., Rodriguez, J. P., Saleska, S., Trumbore, S., Val, A. L., Villa Nova, L., Abramovay, R., Alencar, A., Rodríguez Alzza, C., Armenteras, D., Artaxo, P., Athayde, S., Barretto Filho, H. T., Barlow, J., Berenguer, E., Bortolotto, F., Costa, F. A., Costa, M. H., Cuvi, N., Fearnside, P. M., Ferreira, J., Flores, B. M., Frieri, S., Gatti, L. V., Guayasamin, J. M., Hecht, S., Hirota, M., Hoorn, C., Josse, C., Lapola, D. M., Larrea, C., Larrea-Alcazar, D. M., Lehm Ardaya, Z., Malhi, Y., Marengo, J. A., Melack, J., Moraes, R. M., Moutinho, P., Murmis, M. R., Neves, E. G., Paez, B., Painter, L., Ramos, A., Rosero-Peña, M. C., Schmink, M., Sist, P., ter Steege, H., Val, P., van der Voort, H., Varese, M., and Zapata-Ríos, G.: Amazonian ecosystems and their ecological functions, Science Panel for the Amazon, https://www.theamazonwewant.org/amazon-assessment-report-2021 (last access: 3 February 2026), 2021.
Moreira, D. S., Freitas, S. R., Bonatti, J. P., Mercado, L. M., Rosário, N. M. É., Longo, K. M., Miller, J. B., Gloor, M., and Gatti, L. V.: Coupling between the JULES land-surface scheme and the CCATT-BRAMS atmospheric chemistry model (JULES-CCATT-BRAMS1.0): applications to numerical weather forecasting and the CO2 budget in South America, Geosci. Model Dev., 6, 1243–1259, https://doi.org/10.5194/gmd-6-1243-2013, 2013.
Moudrý, V., Gábor, L., Marselis, S., Pracná, P., Barták, V., Prošek, J., and Wild, J.: Comparison of three global canopy height maps and their applicability to biodiversity modeling: Accuracy issues revealed, Ecosphere, 15, e70026, https://doi.org/10.1002/ecs2.70026, 2024.
Nelder, J. A. and Mead, R.: A simplex method for function minimization, the Computer Journal, 7, 308–313, https://doi.org/10.1093/comjnl/7.4.308, 1965.
Nelson, J. A., Walther, S., Gans, F., Kraft, B., Weber, U., Novick, K., Buchmann, N., Migliavacca, M., Wohlfahrt, G., Šigut, L., Ibrom, A., Papale, D., Göckede, M., Duveiller, G., Knohl, A., Hörtnagl, L., Scott, R. L., Dušek, J., Zhang, W., Hamdi, Z. M., Reichstein, M., Aranda-Barranco, S., Ardö, J., Op de Beeck, M., Billesbach, D., Bowling, D., Bracho, R., Brümmer, C., Camps-Valls, G., Chen, S., Cleverly, J. R., Desai, A., Dong, G., El-Madany, T. S., Euskirchen, E. S., Feigenwinter, I., Galvagno, M., Gerosa, G. A., Gielen, B., Goded, I., Goslee, S., Gough, C. M., Heinesch, B., Ichii, K., Jackowicz-Korczynski, M. A., Klosterhalfen, A., Knox, S., Kobayashi, H., Kohonen, K.-M., Korkiakoski, M., Mammarella, I., Gharun, M., Marzuoli, R., Matamala, R., Metzger, S., Montagnani, L., Nicolini, G., O'Halloran, T., Ourcival, J.-M., Peichl, M., Pendall, E., Ruiz Reverter, B., Roland, M., Sabbatini, S., Sachs, T., Schmidt, M., Schwalm, C. R., Shekhar, A., Silberstein, R., Silveira, M. L., Spano, D., Tagesson, T., Tramontana, G., Trotta, C., Turco, F., Vesala, T., Vincke, C., Vitale, D., Vivoni, E. R., Wang, Y., Woodgate, W., Yepez, E. A., Zhang, J., Zona, D., and Jung, M.: X-BASE: the first terrestrial carbon and water flux products from an extended data-driven scaling framework, FLUXCOM-X, Biogeosciences, 21, 5079–5115, https://doi.org/10.5194/bg-21-5079-2024, 2024.
Ometto, J. P., Gorgens, E. B., de Souza Pereira, F. R., Sato, L., de Assis, M. L. R., Cantinho, R., and Keller, M.: A biomass map of the Brazilian Amazon from multisource remote sensing, Scientific Data, 10, 668, https://doi.org/10.1038/s41597-023-02575-4, 2023.
Osborne, T., Gornall, J., Hooker, J., Williams, K., Wiltshire, A., Betts, R., and Wheeler, T.: JULES-crop: a parametrisation of crops in the Joint UK Land Environment Simulator, Geosci. Model Dev., 8, 1139–1155, https://doi.org/10.5194/gmd-8-1139-2015, 2015.
Peel, M. C., Finlayson, B. L., and McMahon, T. A.: Updated world map of the Köppen-Geiger climate classification, Hydrol. Earth Syst. Sci., 11, 1633–1644, https://doi.org/10.5194/hess-11-1633-2007, 2007.
Prudente Jr., A. C., Vianna, M. S., Williams, K., Galdos, M. V., and Marin, F. R.: Calibration and evaluation of JULES-crop for maize in Brazil, Agronomy Journal, 114, 1680–1693, https://doi.org/10.1002/agj2.21066, 2022.
Raoult, N. M., Jupp, T. E., Cox, P. M., and Luke, C. M.: Land-surface parameter optimisation using data assimilation techniques: the adJULES system V1.0, Geosci. Model Dev., 9, 2833–2852, https://doi.org/10.5194/gmd-9-2833-2016, 2016.
Reatto, A., Martins, É. D. S., Farias, M. F. R., and Silva, A. V. D., and Carvalho Júnior, O. A. D.: Mapa pedológico digital-SIG atualizado do Distrito Federal escala 1 : 100.000 e uma síntese do texto explicativo, Technical report, Embrapa Cerrados, http://www.infoteca.cnptia.embrapa.br/infoteca/handle/doc/566388 (last access: 3 February 2026), 2004.
Restrepo-Coupe, N., da Rocha, H. R., Hutyra, L. R., da Araujo, A. C., Borma, L. S., Christoffersen, B., and Saleska, S. R.: What drives the seasonality of photosynthesis across the Amazon basin? A cross-site analysis of eddy flux tower measurements from the Brasil flux network, Agricultural and Forest Meteorology, 182, 128–144, https://doi.org/10.1016/j.agrformet.2013.04.031, 2013.
Restrepo-Coupe, N., da Rocha, H. R., Hutyra, L. R., da Araujo, A. C., Borma, L. S., Christoffersen, B., Cabral, O. M. R., de Camargo, P. B., Cardoso, F. L., da Costa, A. C. L., Fitzjarrald, D. R., Goulden, M. L., Kruijt, B., Maia, J. M. F., Malhi, Y. S., Manzi, A. O., Miller, S. D., Nobre, A. D., von Randow, C., Abreu Sá, L. D., and Saleska, S. R.: Do dynamic global vegetation models capture the seasonality of carbon fluxes in the Amazon basin? A data-model intercomparison, Global Change Biology, 23, 191–208, https://doi.org/10.1111/gcb.13442, 2017.
Restrepo-Coupe, N., da Rocha, H. R., Hutyra, L. R., de Araujo, A. C., Borma, L. S., Christoffersen, B., Cabral, O., de Camargo, P. B., Cardoso, F. L., Costa, A. C. L., Fitzjarrald, D. R., Goulden, M. L., Kruijt, B., Maia, J. M. F., Malhi, Y. S., Manzi, A. O., Miller, S. D., Nobre, A. D., von Randow, C., and Saleska, S. R.: LBA-ECO CD-32 Flux Tower Network Data Compilation, Brazilian Amazon: 1999–2006, V2, ORNL DAAC [data set], https://doi.org/10.3334/ORNLDAAC/1842, 2021.
Rosan, T. M., Sitch, S., O'Sullivan, M., Basso, L. S., Wilson, C., Silva, C., Gloor, E., Fawcett, D., Heinrich, V., Souza, J. G., Bezerra, F. G. S., von Randow, C., Mercado, L. M., Gatti, L., Wiltshire, A., Friedlingstein, P., Pongratz, J., Schwingshackl, C., Williams, M., Smallman, L., Knauer, J., Arora, V., Kennedy, D., Tian, H., Yuan, W., Jain, A. K., Falk, S., Poulter, B., Arneth, A., Sun, Q., Zaehle, S., Walker, A. P., Kato, E., Yue, X., Bastos, A., Ciais, P., Wigneron, J.-P., Albergel, C., and Aragão, L. E. O. C.: Synthesis of the land carbon fluxes of the Amazon region between 2010 and 2020, Communications Earth & Environment, 5, 46, https://doi.org/10.5281/zenodo.10423522, 2024.
Saatchi, S. S., Harris, N. L., Brown, S., Lefsky, M., Mitchard, E. T. A., Salas, W., Zutta, B.R., Buermann, W., Lewis, S.L., Hagen, S., Petrova, S., White, L., Silman, M., and Morel, A.: Benchmark map of forest carbon stocks in tropical regions across three continents, Proc. Natl. Acad. Sci., 108, 9899–9904, https://doi.org/10.1073/pnas.1019576108, 2011.
Shinozaki, K., Yoda, K., Hozumi, K., and Kira, T.: A quantitative analysis of plant form – the pipe model theory, I. Basic Analyses, Japanese Journal of Ecology, 14, 97–105, https://doi.org/10.18960/seitai.14.3_97, 1964.
Silva, D. S., Blanco, C. J. C., dos Santos Junior, C. S., and Martins, W. L. D.: Modeling of the spatial and temporal dynamics of erosivity in the Amazon, Modeling Earth Systems and Environment, 6, 513–552, https://doi.org/10.1007/s40808-019-00697-6, 2020.
Simardi, M., Pinto, N., Fisher, J. B., and Baccini, A.: Mapping forest canopy height globally with spaceborne lidar, Journal of Geophysical Research: Biogeosciences, 116, https://doi.org/10.1029/2011JG001708, 2011.
Sitch, S., O'Sullivan, M., Robertson, E., Friedlingstein, P., Albergel, C., Anthoni, P., Arneth, A., Arora, V. K., Bastos, A., Bastrikov, V., Bellouin, N., Canadell, J. G., Chini, L., Ciais, P., Falk, S., Harris, I., Hurtt, G., Ito, A., Jain, A. K., Jones, M. W., Joos, F., Kato, E., Kennedy, D., Klein Goldewijk, K., Kluzek, E., Knauer, J., Lawrence, P. J., Lombardozzi, D., Melton, J. R., Nabel, J. E. M. S., Pan, N., Peylin, P., Pongratz, J., Poulter, B., Rosan, T. M., Sun, Q., Tian, H., Walker, A. P., Weber, U., Yuan, W., Yue, X., and Zaehle, S.: Trends and drivers of terrestrial sources and sinks of carbon dioxide: An overview of the TRENDY project, Global Biogeochemical Cycles, 38, https://doi.org/10.1029/2024GB008102, 2024.
Skillman, J. B.: Quantum yield variation across the three pathways of photosynthesis: not yet out of the dark, Journal of Experimental Botany, 59, 1647–1661, https://doi.org/10.1093/jxb/ern029, 2008.
Souza Jr., C. M., Shimbo, J. Z., Rosa, M. R., Parente, L. L., Alencar, A. A., Rudorff, B. F. T., and Azevedo, T.: Reconstructing three decades of land use and land cover changes in brazilian biomes with landsat archive and earth engine, Remote Sensing, 12, 2735, https://doi.org/10.3390/rs12172735, 2020.
Verbeeck, H., Peylin, P., Bacour, C., Bonal, D., Steppe, K., and Ciais, P.: Seasonal patterns of CO2 fluxes in Amazon forests: Fusion of eddy covariance data and the ORCHIDEE model, Journal of Geophysical Research: Biogeosciences, 116, https://doi.org/10.1029/2010JG001544, 2011.
Virtanen, P., Gommers, R., Oliphant, T. E., Haberland, M., Reddy, T., Cournapeau, D., Burovski, E., Peterson, P., Weckesser, W., Bright, J., van der Walt, S. J., Brett, M., Wilson, J., Millman, K. J., Mayorov, N., Nelson, A. R. J., Jones, E., Kern, R., Larson, E., Carey, C. J., Polat, İ., Feng, Y., Moore, E. W., and VanderPlas, J.: SciPy 1.0: fundamental algorithms for scientific computing in Python, Nature Methods, 17, 261–272, https://doi.org/10.1038/s41592-019-0686-2, 2020.
Wallach, D., Makowski, D., Jones, J. W., and Brun, F.: Working with dynamic crop models: Methods, tools and examples for agriculture and environment. Academic Press, ISBN 978-0128117569,, 2018.
West, P. W.: Do increasing respiratory costs explain the decline with age of forest growth rate?, Journal of Forestry Research, 31, 693–712, https://doi.org/10.1007/s11676-019-01020-w, 2020.
Williams, K., Gornall, J., Harper, A., Wiltshire, A., Hemming, D., Quaife, T., Arkebauer, T., and Scoby, D.: Evaluation of JULES-crop performance against site observations of irrigated maize from Mead, Nebraska, Geosci. Model Dev., 10, 1291–1320, https://doi.org/10.5194/gmd-10-1291-2017, 2017.
Willmott, C. J., Robeson, S. M., and Matsuura, K.: A refined index of model performance, International Journal of Climatology, 32, 2088–2094, https://doi.org/10.1002/joc.2419, 2012.
Wiltshire, A. J., Burke, E. J., Chadburn, S. E., Jones, C. D., Cox, P. M., Davies-Barnard, T., Friedlingstein, P., Harper, A. B., Liddicoat, S., Sitch, S., and Zaehle, S.: JULES-CN: a coupled terrestrial carbon–nitrogen scheme (JULES vn5.1), Geosci. Model Dev., 14, 2161–2186, https://doi.org/10.5194/gmd-14-2161-2021, 2021.
Wu, J., Albert, L. P., Lopes, A. P., Restrepo-Coupe, N., Hayek, M., Wiedemann, K. T., Guan, K., Stark, S. C., Christoffersen, B., Prohaska, N., Tavares, J. V., Marostica, S., Kobayashi, H., Ferreira, M. L., Campos, K. S., da Silva, R., Brando, P. M., Dye, D. G., Huxman, T. E., Huete, A. R., Nelson, B. W., and Saleska, S. R.: Leaf development and demography explain photosynthetic seasonality in Amazon evergreen forests, Science, 351, 972–976, https//doi.org/ 10.1126/science.aad5068, 2016.
Zohou, P. J., Alamou, A. E., Obada, E., Biao, I. E., and Ezin, E. C.: An automatic optimization technique for the calibration of a physically based hydrological rainfall-runoff model, Journal of Geoscience and Environment Protection, 9, 1– 20, https://doi.org/10.4236/gep.2021.93001, 2021.
Zhu, L., Ciais, P., Yao, Y., Goll, D., Luyssaert, S., Martínez Cano, I., Fendrich, A., Li, L., Yang, H., Saatchi, S., Dalagnol, R., and Li, W.: Spatially varying parameters improve carbon cycle modeling in the Amazon rainforest with ORCHIDEE r8849, Geosci. Model Dev., 18, 4915–4933, https://doi.org/10.5194/gmd-18-4915-2025, 2025.