the Creative Commons Attribution 4.0 License.
the Creative Commons Attribution 4.0 License.
 | 18 Mar 2026
The 3D submicron-scale skeletal reconstruction of Nannoconus (Cretaceous calcareous nannofossil) – Insights into biomineralization
Rajkumar Chowdhury
Redhouane Boudjehem
Baptiste Suchéras-Marx
Maxime Dupraz
Anico Kulow
Julio Cesar da Silva
Jean Louis Hazemann
Marie-Pierre Aubry
Javier Pérez
Alejandro Fernandez-Martinez
Fabienne Giraud
Nannoconus (∼ 5–20 µm) was a major planktonic producer in the Early Cretaceous seas (∼ 150–120 Ma). The heavy calcitic skeletons (micaliths; ∼ 200–1400 picogram) of this extinct nannoplankton genus have contributed to massive carbonate accumulations for over ∼ 30 million years. The micalith microstructure is characterized by an interlocking arrangement of calcitic lamellae spanned around a central canal. The biomineralization process involved in producing the sophisticated micalith is investigated for the first time. Ptychography X-ray computed tomography (PXCT) with synchrotron radiation is applied to an isolated micalith, to obtain a 3D set of tomographic images with ∼ 40 nm spatial resolution. This 3D set was processed to virtually segment the individual calcitic lamella and reconstruct the full micalith through constraining different lengths and angles. The lamellae are repetitively stacked in two distinct inclinations, one following the other, and producing segments combined to form the entire micalith. Individual lamellae were calcified in a “template” of organic layer containing amino acid(s)/biomolecule(s), responsible for creating the interlocking arrangement. Our study of Nannoconus provides a simple yet potent approach to the analysis of biomineralized microstructures characterized by the repetitive arrangement of calcitic units as commonly seen in the calcareous nannoplankton.
- Article
(5348 KB) - Full-text XML
- BibTeX
- EndNote


Calcareous nannofossils (∼ 1–30 µm) are biomineralized calcitic remains of marine planktonic unicellular algae (Siesser and Winter, 1994) and are abundant in the sedimentary archives. Initially rare, calcareous nannofossils became increasingly abundant in marine sediments to reach an optimum in the Cretaceous, around ∼ 120 Ma (Suchéras-Marx et al., 2019) and they profoundly altered the dynamics of the carbonate and oceanic carbon cycle (Erba, 2006). Among extinct calcareous nannoplankton Nannoconus was the major carbonate producer in the Early Cretaceous seas (∼ 152–120 Ma) (Bown, 2005) with large size (∼ 5–20 µm) and heavy mass (∼ 200–1400 pg; Sect. 4.2, chapter 4 of Chowdhury, 2025) for a calcitic micalith (individual piece that composes the skeleton, Aubry, 2025), contributing to massive carbonate accumulations over ∼ 30 million years. The massive production of biocalcite may have significantly altered marine chemistry, upon transfer to the oceanic sedimentary record, with possible consequences on the marine biosphere at a time of important planktonic diversification (Hart et al., 2003; Kooistra et al., 2007). Despite the importance of this group, knowledge of the organism which produced the calcitic micalith is non-existent. Currently, based on 2D scanning electron microscopy (SEM) studies, two different concepts of micalith construction coexist (Aubry, 1974, 2025; Van Niel, 1993). However, neither concept explains the skeletal microstructure and provides information on the parameter(s) controlling the shape of the micalith. High-resolution characterization of the three-dimensional microstructural organization of the micalith, as documented here for Nannoconus globulus Brönnimann, 1955 provides insights into the biomineralization process.
With advances in imaging techniques, several high-resolution characterization methods have been successfully applied to biocalcite produced by extant planktonic algae or preserved as fossils. These techniques include AFM (Henriksen et al., 2004), 3D-FIB-SEM (Hoffmann et al., 2015) and cryo-electron tomography (Walker et al., 2020). In addition, several X-ray scattering methods with synchrotron radiation have been applied, such as 2D (Suchéras-Marx et al., 2016a) and 3D (Walker et al., 2024) X-ray microfluorescence, X-ray Coherent Diffraction (Beuvier et al., 2019). Ptychographic X-ray computed tomography (PXCT) (Dierolf et al., 2010) is a non-destructive tomographic reconstruction imaging method that can be applied to characterize fossilized biocalcite. In this study, we performed the PXCT experiment using synchrotron radiation at the SWING Beamline of the SOLEIL (French synchrotron). Our primary focus was on a well-preserved micalith of Nannoconus to investigate its microstructural arrangement at the nano-scale resolution. The experiments generated tomographic volumes of our specimen with a 3D spatial resolution of approximately 30 nm. Subsequently, we analyzed these volumes using image visualization software and successfully reconstructed the complete 3D micalith of a single Nannoconus specimen, specifically N. globulus, for the first time. This strategy serves as a methodological framework for reconstructing the Nannoconus micalith structure in general and to address the validity of the two concepts proposed in the literature. The knowledge of the structural constraint of the 3D micalith arrangement obtained from the aforementioned reconstruction is used to provide insights into the Nannoconus biomineralization process.
Nannoconus is a genus (Kamptner, 1931) of the family of Nannoconaceae (Reinhardt, 1966) (Appendix B). Lees and Bown (2016) assigned this family to the order of Braarudosphaerales Aubry, 2013 which they emended. Nannoconus belongs to the micalithophores, a group independent from the coccolithophores, which unites calcareous nannoplankton with individual pieces of the skeleton (micaliths) consisting of “identical, adjoining segments that are stacks of lamellae of similar shape” (Aubry, 2025, Sect. 3.2.3).
Nannoconus is a genus which spans from the latest Jurassic (Tithonian, ∼ 145 Ma) through the Late Cretaceous (Campanian, ∼ 72 Ma) (Perch-Nielsen, 1985). However, in the Tethys domain, it is only abundant until the end of the Aptian (∼ 113 Ma), which is the end of the climax of Nannoconus (Erba, 1994). This represents a duration of ∼ 30 Myr, during which the micaliths exhibit a great morphological diversity (Derès and Achéritéguy, 1980).
2.1 Morphology
Several species of the genus Nannoconus have been described, mainly differing in the shape of their micaliths. These include cylindrical, globular, hour-glass, and conical shapes (Fig. 1a–d). Van Niel (1993) introduced several terms to describe their general morphology (Fig. 1e and f). The wall encloses the central canal which runs along the longitudinal axis of the micalith with two terminal openings known as apertures. Several morphogroups of Nannoconus have been defined based on the general shape and size of the micalith (Brönnimann, 1955; Bouché, 1965; Derès and Achéritéguy, 1972; Aubry, 1974), the shape of the central canal (Brönnimann, 1955; Bouché, 1965), the thickness and construction of the wall (Brönnimann, 1955; Bouché, 1965; Derès and Achéritéguy, 1972; Aubry, 1974), the shape and the size of the terminal openings (Brönnimann, 1955; Bouché, 1965; Derès and Achéritéguy, 1972; Aubry, 1974).
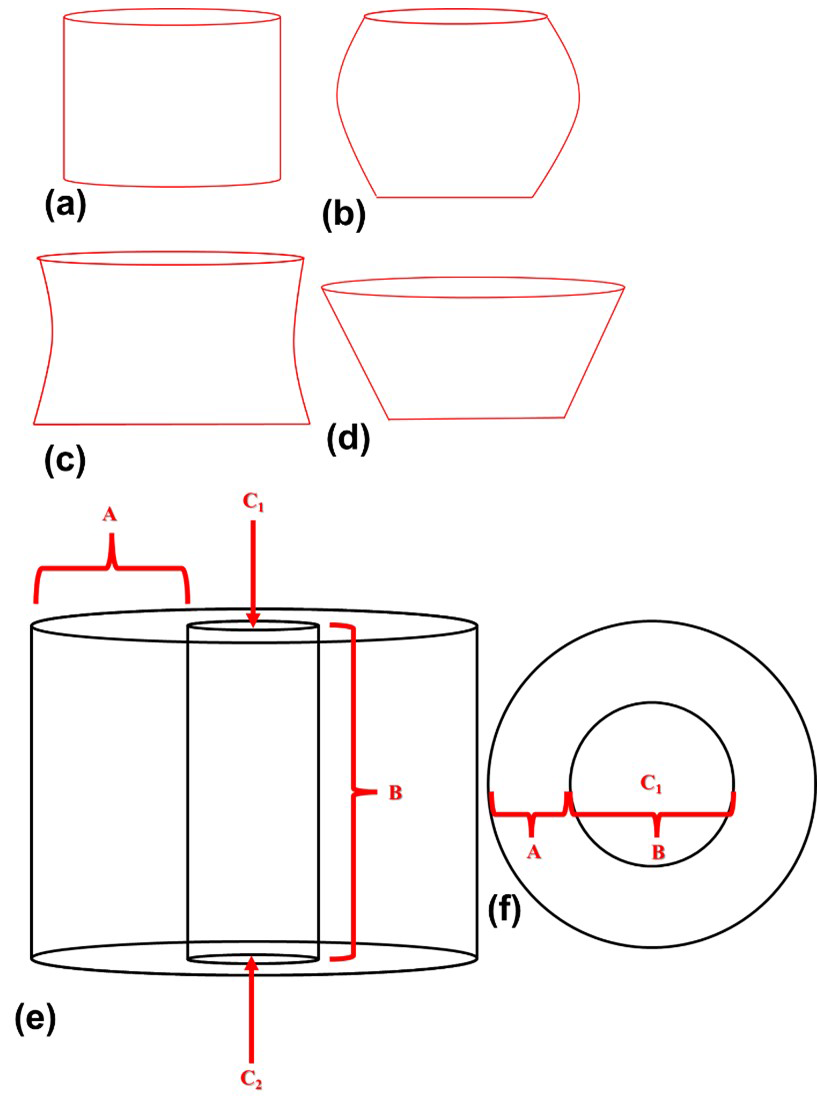
Figure 1Schematic diagrams illustrating the different micalith morphologies of four species of Nannoconus. These are (a) cylindrical, (b) globular, (c) hour-glass, and (d) conical as observed in Nannoconus truittii, N. globulus, N. abundans, and N. steinmannii, respectively. (e, f) Longitudinal and transverse views, respectively, of the schematic illustration of a cylindrical micalith. In this figure, A and B represent the wall and the central canal, respectively. C1 and C2 are the two terminal apertures. It should be noted that the shape of the central canal varies with the general morphology of the micalith.
2.2 Microstructure
Different terminologies, reviewed by Van Niel (1994), continue to be used to describe the wall of Nannoconus. “Lamella/ae” is used here in agreement with Aubry (2025). The interlocking lamellae are semi-circular (Stradner and Grün, 1973) to sub-rhombohedral (Van Niel, 1994) with length ∼ 0.5–1 µm and thickness ∼ 0.1–0.5 µm (Kamptner, 1931; Trejo, 1960; Derès and Achéritéguy, 1972; Van Niel, 1993, 1994). Two distinct types of lamellae (green and yellow lines in Fig. 2a) build the micalith. Each lamella is characterized by a specific inclination, measured from a horizontal line (blue line in Fig. 2b).
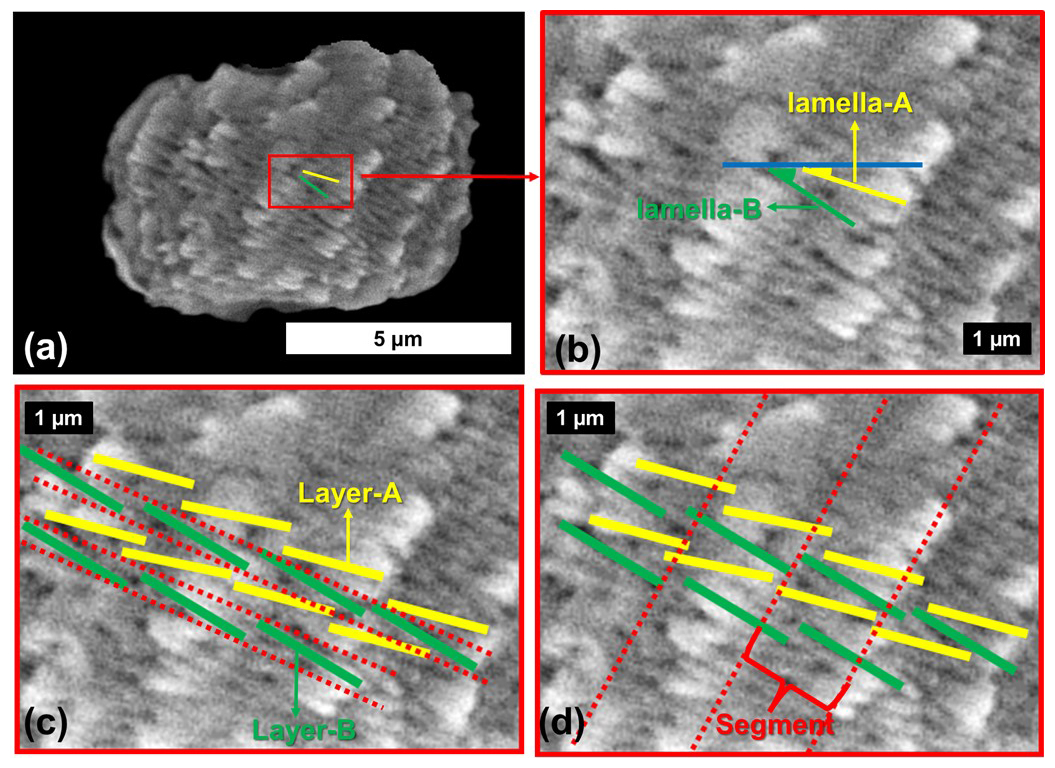
Figure 2Scanning electron microscopic (SEM) image of Nannoconus globulus. (a) Longitudinal view. The solid green and yellow lines inside the red box highlight the two distinct types of lamellae, lamella-A and -B. (b) Closer view of a lamella-A and a lamella-B shown in (a), with the inclinations measured from the blue horizontal line. (c) Arrangement of lamellae-A and-B in two layers (-A is yellow and -B is green). The red-dotted line separates the two consecutive layers. (d) Oblique arrangement of the segments composed of alternating lamella-A (yellow) and -B (green). Consecutive segments are individualized by red dotted lines. Lamella/ae is the term selected to describe the structure of micaliths (Aubry, 2025). It is the equivalent of “plate” in the terminology of Stradner and Grün (1973) and Van Niel (1993).
Based on 2D scanning electron microscopy (SEM) studies, some authors (Aubry, 1974, 2025; Van Niel, 1993) attempted to explain the micalith microstructural arrangement; two different concepts have been proposed. The first concept is based on a layering of two types of lamellae (Van Niel, 1993; Lees and Bown, 2016), the second concept is based on an organization of lamellae into segments (Aubry, 2013, 2025). They can be summarized by the following two models:
2.2.1 Model-1
In Van Niel (1993), the lamellae with a lower angle of inclination (yellow) are termed lamellae-A and the lamellae with a higher angle of inclination (green) are termed lamellae-B. Lamellae-A and -B form two distinct types of layers (Fig. 2c) referred to here as layer-A and layer-B, respectively. The micalith can be understood as a combination of these two types of spiralling layers of lamellae alternatively arranged one after another. This can be explained in Fig. 2c: first, a layer-B (green lines) is placed, followed by a layer-A (yellow lines). Over layer-A, another layer-B is again placed. Delimitation of layers is marked by red dotted lines (Fig. 2c). Van Niel (1993) distinguished nine different morphogroups among Nannoconus (Appendix B), based on the various inclination(s) of lamella-B and the width(s) between two consecutive layers of lamella-A. In a SEM image of the species N. globulus in Covington and Wise (1987, pl. 12, Fig. 2) it is possible to count six lamellae with two distinct angles of inclination in the part where the lamellae are well-preserved (Fig. A1a and b in the Appendix). This part constitutes about half of the circular aperture (180°). Thus, the total number of lamellae in the full circular aperture (360°) would be = 12, with six lamellae-A and six lamellae-B. Considering that each of these lamellae belongs to a separate layer, there are six layer-A and six layer-B, i.e., a total of 12 layers in the whole micalith.
2.2.2 Model-2
As suggested by Aubry (2025), the micalith is a combination of identical, imbricated segments. These segments are formed by stacking lamellae (Fig. 2d) of similar shape (Fig. 12d; Aubry, 2025). Lamella-B (green line) and lamella-A (yellow line) are organized two by two to form duos. Duos of lamellae are stacked to compose a segment. Therefore, the spiral combination of several such segments forms the entire micalith. Three such segments are delineated by red dotted lines in Fig. 2d. In a SEM image (Fig. A1c in the Appendix) of N. globulus referred to above (in model-1), six segments can be delineated from the well-preserved part of the micalith. As this part constitutes about of the circular aperture (180°), the total number of segments in the full circular aperture would be 6⋅2 = 12. Therefore, the total number of the segments in the full micalith of Nannoconus = 12.
3.1 Material
Six specimens representing five different species of Nannoconus have been used for the Ptychographic X-ray Computed Tomography (PXCT) experiment. They are from the Aptian calcareous sediments of the DSDP Leg-93-Site 603 (continental rise of the western margin of the North Atlantic) Core 44, interval 115–116 cm (Covington and Wise, 1987). They have been selected for their good state of preservation as determined through scanning electron microscopy (SEM) images and shown in Fig. A2 in the Appendix. Here, “good state of preservation” refers to micaliths which are structurally fully intact without any breakage and devoid of post-depositional growth of calcite that often obscures the microstructure of nannofossils. We focus this study on the species N. globulus to illustrate the microstructural arrangement and the 3D reconstruction of the micalith. This globular micalith exhibits a well-defined interlocking pattern of lamellae.
3.2 Sample Preparation
The PXCT experiment required the picking of an individual specimen of N. globulus with a silica needle (Fig. A3a and b in the Appendix) (modified from Suchéras-Marx et al., 2016b). The needle was then placed in a metal holder (Fig. A3c in the Appendix), directly placed at the experimental station of the beamline.
3.3 Ptychography computed X-ray tomography (PXCT)
Ptychography is an advanced X-ray imaging technique that involves capturing a series of far-field diffraction patterns from overlapping areas of a sample. These diffraction patterns are then used in a computational phase retrieval algorithm to reconstruct a high-resolution two-dimensional image. In the field of PXCT, ptychography is combined with tomography. This process involves performing ptychographic experiment at different tomography angles, which produce highly spatially resolved, detailed tomographic projections. As a result, PXCT offers a thorough three-dimensional (3D) representation of the microstructure of a sample, achieving nanometric resolution. This enhances the ability to analyse complex materials at a microstructural level. After obtaining the 3D images, it is essential to examine the resulting high-resolution tomographic volume of biocalcite using advanced 3D image analysis techniques. Methods such as image segmentation and visualization (Reznikov et al., 2020) are necessary to extract relevant microstructural properties from the sample.
The experiments were performed at the SWING beamline at SOLEIL-Synchrotron, Paris, France. The photon energy was of 8.00 keV, and the sample-to-detector position was set to 6.484 m. The ptychography experiments were carried out with a beam size of about 4 µm at the sample position and a scanning step size of 1.0 µm. One hundred and sixty-four positions were collected and distributed as concentric circles within a rectangular field of view of 20 µm × 10 µm (H×V). We used a region of interest of 1000 × 1000 pixels of an EIGER-4M in-vacuum detector from DECTRIS with a pixel size of 75 µm. For the PXCT experiments (Dierolf et al., 2010), 632 tomographic projections were acquired between 0 and 180°, with exposure time of 100 ms, as 8 interlaced sub-tomograms. The resulting diffraction patterns were transformed into real space projections using the Ptycho-Shelves (Wakonig et al., 2020) suite from the cSAXS team at Paul Scherrer Institute, with a starting probe model previously determined experimentally using a Siemens Star ptychographic scan. The final volume was determined from the tomographic projections using the Matlab tomography package within PtychoShelves.
4.1 Descriptive parameters
The combination of the tomographic image slices, obtained from PXCT, reveals the external and internal views of the N. globulus micalith. These observations are presented here to understand the shape of the micalith and the arrangement of the lamellae and to propose a set of standard parameters that can be used to describe other Nannoconus morphogroups. In the following, cylindrical coordinates are used to describe the micalith microstructure in terms of the positions and orientations of the constituting lamellae (Fig. 3a–d). For this geometric description, the lowest and the highest points of the micalith in longitudinal orientation are defined as base and apex, respectively (Fig. 3a). The z-axis is parallel to the longitudinal view of the micalith, passing through the central canal. The total vertical length between the base and apex is given by L (Fig. 3a). The Radial axis, r, corresponds to a vector going from the center of mass of a lamella to the center of the central canal, and it is perpendicular to the z-axis. The radius (r) is the length of the radial axis, measured from the z-axis to the center of mass of the lamella (Fig. 3a). It changes throughout the whole micalith from the base to the apex. It is minimum at the base of the micalith (Fig. 3a). Starting from the base, the radius increases, reaching a maximum and decreasing towards the apex, giving the micalith a globular shape. This also indicates that the radius is maximum at rd of the length (measured longitudinally) between the base and the apex.
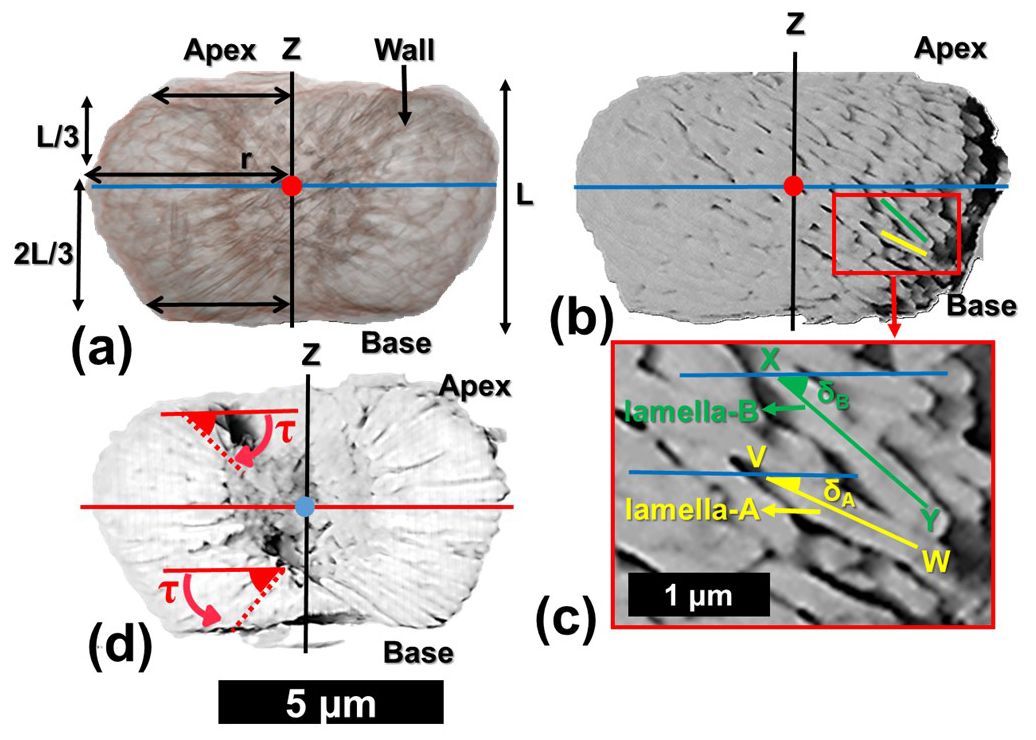
Figure 3Description of the parameters for the reconstruction of the 3D micalith microstructure of N. globulus using the results of the PXCT experiment. (a) Internal view of N. globulus. The microstructure is interpreted using a cylindrical coordinate system. The red dot indicates the radial axis (perpendicular to the plane of the paper), and the blue line represents an axis perpendicular to the radius. The z-axis, marked by the black line, passes longitudinally through the central canal. The length of the red arrows corresponds to the radius, measured from the z-axis to the end of the wall of the micalith. The radius increases initially from the base for rd of the length (L) of the Nannoconus, and then decreases towards the apex for the remaining rd of the length (L). (b) External view of the same specimen of N. globulus, in the cylindrical coordinate system. (c) Magnified skeletal microstructure of the part delineated by the red box in (b), illustrating the two lamellae types: lamella-A (yellow) and lamella-B (green). Their inclinations, δA and δB respectively, correspond to the angles measured between the blue line (axis perpendicular to the radius) and each lamella. (d) Cross-section of N. globulus across the length. The angle measured between the lamella and the radial axis (red line) defines the tilt. The tilts of the lamellae at the base (lower z) are opposite in direction with respect to the lamellae at the apex (upper z).
Two angles define the spatial orientation of each lamella. Based on the SEM images, the first angle defined by Van Niel (1993) is the Inclination (δ), which, in the cylindrical coordinates (described before), corresponds to the angle formed between a lamella and an axis corresponding to the radius (blue line in Fig. 3b). On the basis of this inclination angle (δ), two distinct sets of lamellae (Fig. 3c) can be distinguished: the lamella with low inclination (δA, yellow line given by VW), is named lamella-A. The lamella with high inclination (δB, green line given by XY), is termed lamella-B (Fig. 3c). Lamella-A and lamella-B together form twin lamellae. The term “twin lamellae” describes the repeating pair of lamellae (i.e., lamella-A and lamella-B), with alternating inclinations that together construct the full micalith of Nannoconus. The other angle (Fig. 3d), called Tilt (τ), corresponds to the angle formed between a lamella and an axis perpendicular to the radius (red line in Fig. 3d). Tilt values are of opposite sign for lamellae placed in the upper (high z) or lower (low z) parts of the micalith (Fig. 3d).
4.2 Segmentation of a lamella
The first step in our analysis of the PXCT data was to isolate one lamella (Fig. 4a–g). The experiment resulted in a series of tomographic image slices for the whole micalith. These images reveal overlapping lamellae within the interior of the micalith, likely resulting from diagenetic alteration. Although the specimen was considered “well-preserved” based on SEM images, the high spatial resolution of the PXCT reveals clear diagenetic effects within the Nannoconus micalith. As a result, individual lamellae are sometimes difficult to segment (i.e., virtually separate) in the tomographic images. The spatial resolution of the PXCT data (∼ 30–40 nm) is of the same scale as the thickness of the lamellae themselves and therefore insufficient for distinctly segmenting a single lamella. To overcome this problem, all the images were filtered using Contrast Limited Adaptive Histogram Equalization (CLAHE) (Reza, 2004). This increased the contrast of the images and hence helped to delineate the boundaries between the lamellae more clearly. After this contrast enhancement, a single lamella was segmented by selecting by hand regions of interest for each slice (Fig. 4a–d). This resulted in a 3D volume of the lamella that was exported and used to reconstruct the structure of the micalith using our two models (Fig. 4e and f). Given the high amount of data, the convex hull (Appendix B; Ky, 1959) of the 3D volume of the segmented lamella (Fig. 4g) was generated using Python routines and utilized for the reconstruction of the models. However, this manual segmentation approach is not applicable to the entire Nannoconus because: (a) It is extremely time consuming to manually segment numerous lamellae of Nannoconus from ∼ 300 tomographic image slices. (b) The lamellae frequently overlap with each other, due to post-depositional overgrowth, making them difficult to distinguish for segmentation. Hence, we have segmented a distinctly identifiable lamella and utilized it as a unit to reconstruct the entire micalith. As described earlier, Nannoconus belongs to order Braarudosphaerales Aubry 2013, 2025; which is defined (Aubry, 2013) as “consisting of identical, imbricated segments that are stacks of lamellae of similar shape”. Therefore, it can be inferred that Nannoconus lamellae are also of “similar” shape/morphology. To verify this, we have segmented another lamella (Fig. 4h) from a different part of the micalith; its convex hull is given in Fig. 4i. Both segmented lamellae present a similar shape/morphology (Fig. 4g and i). They are of triangular, flat shape, ∼ 2.00 µm long and ∼ 0.50 µm thick. We conclude from this morphological similarity between two lamellae taken from different parts of the micalith, that the entire micalith of N. globulus is composed of morphologically similar lamellae.
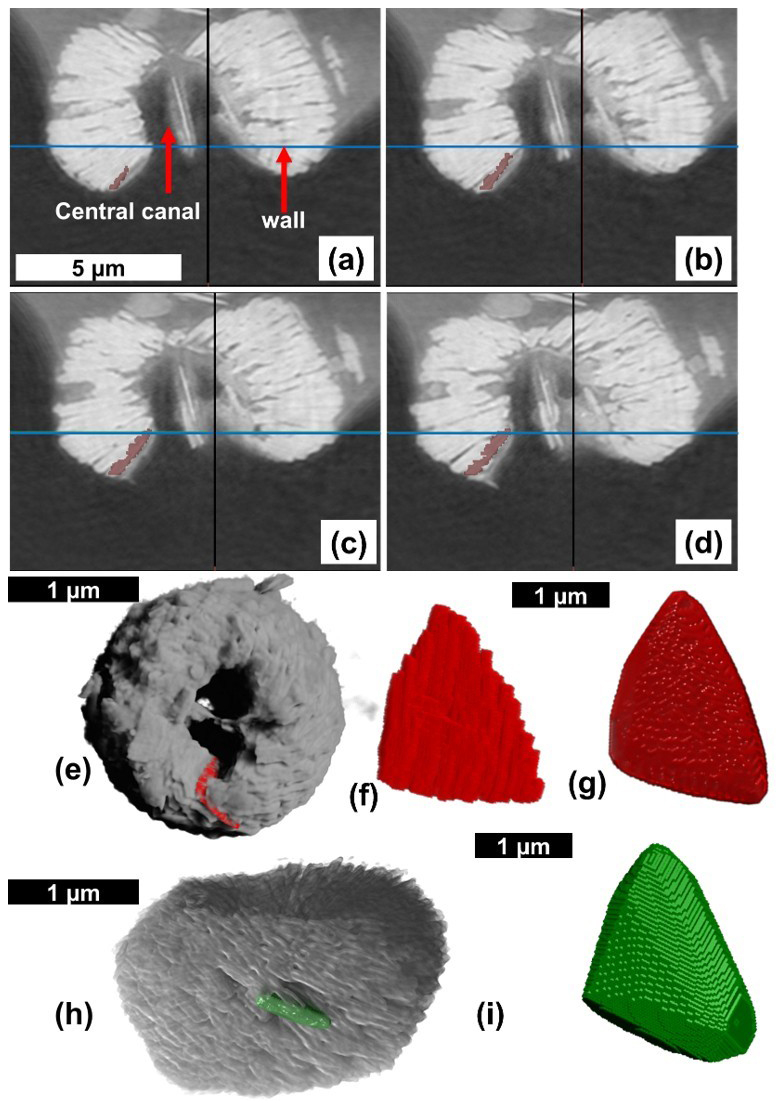
Figure 4Procedures describing the segmentation/virtual separation of a lamella from the result of the PXCT analysis of N. globulus. (a–d) Four consecutive tomographic images obtained from the PXCT analysis of N. globulus with the wall and central canal. The object present within the central canal is possibly a lamella detached from the wall. (e) The marked lamella (red colour) is shown within the micalith. (f) Isolated individual lamella after the segmentation. (g) Convex hull of the lamella, with smooth edges and surfaces. Convex hull (See Appendix B) is the mathematical representation of an envelope covering the segmented lamella. (h) Another segmented lamella (green colour) located within the micalith. (i) Convex hull of the latter segmented lamella, (i.e., seen in h).
4.3 Reconstruction
We developed a code (Chowdhury et al., 2025) using Python script (Van Rossum and Drake, 2009) directly in a console attached to the image visualization software to reconstruct the micalith using the segmented lamella. The process of the micalith reconstruction from the segmented lamella can be described as:
4.3.1 Generation of inclination and tilt
The lamella (given by ABC in Fig. 5a), of triangular and flat shape, is rotated in two perpendicular directions in a cylindrical coordinate system to set values for inclination and tilt. The procedure is as follows:
-
The rotation with the radial axis as the axis of rotation generates the inclination, δ, of the lamella (Fig. 5b and d).
-
The rotation with the axis perpendicular to the radial axis (Fig. 5c and d) as the axis of rotation generates the tilt, τ, of the lamella.

Figure 5Generation of the inclination and tilt in the segmented lamella. (a) The segmented lamella, given by ABC, is placed in the cylindrical coordinate system with one vertical z-axis (black line) and two radial axes (red and blue lines). (b) The rotation of the lamella, where the radius (red line) is the axis of rotation, creates inclination, and the rotation angle is measured between the lamella and the blue line. (c) The rotation of the lamella, where the axis perpendicular to the radius (blue line) is the axis of rotation, creates tilt, and the rotation angle is measured between the lamella and the red line. It should be noted that the axes of rotation for creating inclination and tilt are perpendicular to the lines from which the individual angle of inclination and tilt are measured. (d) The combination of two perpendicular rotations in the cylindrical coordinate, creates the inclination and tilt in the segmented lamella.
4.3.2 Formation of points in spiral axes
The micalith being conceptualized as a combination of spiral layers/segments, it is now necessary to create the layers/segments utilizing the segmented lamellae. A series of points forming spiral axes was generated to place individual lamellae, creating layers/segments. The points of a series are defined following cylindrical coordinates (Fig. 6a): (i) The radius, r, (= distance from the z-axis to the center of mass of the lamella), (ii) the azimuth, Θ, (= angle around the z-axis), (iii) the vertical distance, z (= perpendicular to the radius and along the axis of rotation of the azimuth).
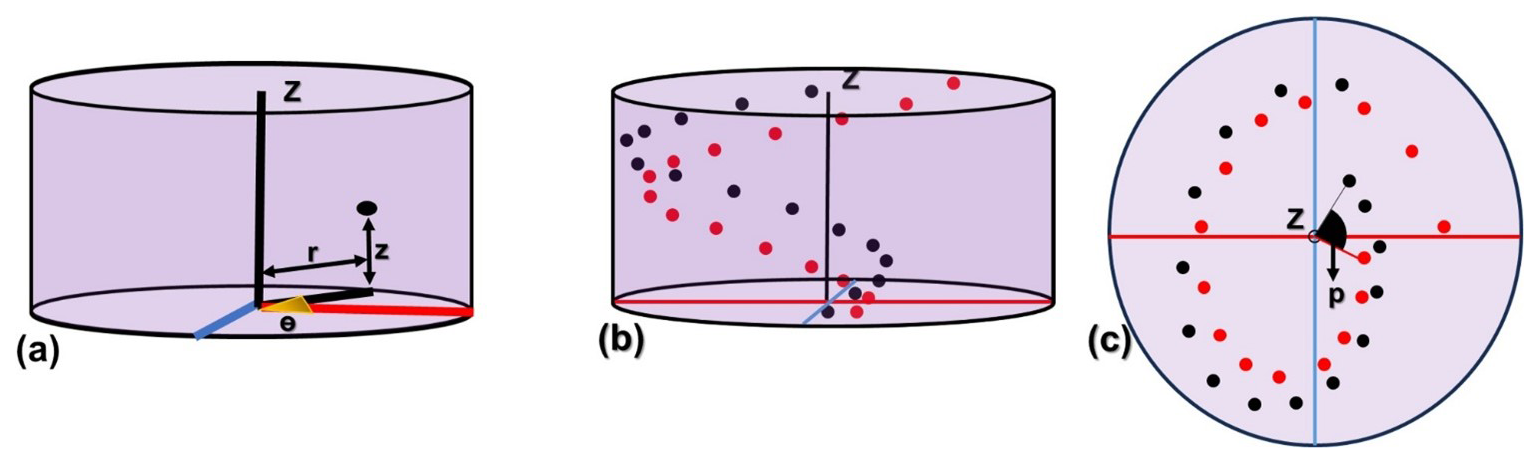
Figure 6Presentation of the series of points in spiral axes to form the layers and segments in the cylindrical coordinate system. (a) radius (r), azimuth (Θ), and vertical distance (z) that define a point in the cylindrical coordinate system. The red line represents the radial axis, and the blue line represents a line perpendicular to it. (b, c) Longitudinal and transverse views, respectively, of the two series of points defined by the black and red dots in the cylindrical coordinate system, representing two consecutive layers/segments. Here, “p” marks the angular separation between the two series of points.
Values of r, Θ, and z are generated so that the lamellae fully occupy the space, forming a compact micalith in visual accordance with the 3D reconstruction obtained from the PXCT data. Here, the first and last points represent the base and the apex of the micalith, respectively. Considering that the total number of points in the series is n, an ith point (ri, Θi, zi), [where i<n] in the series is represented by the following equations:
This results in a globular shape for the micalith.
R= Initial radius, rstep= (Maximum radius − Minimum radius).
Θ = Initial azimuth, Θstep = angular separation between two consecutive lamellae = (Final azimuth − Initial azimuth)
Z = Initial vertical distance, zstep = (Final vertical distance-Initial vertical distance)
This results in a series of points with individual parameters, given by: [].
The difference between the final and the initial azimuths of the points of the series is expressed as the angle of rotation (S). As a series of points is equivalent to a layer/segment of the micalith, the angle of rotation of the series also represents the angle of rotation of a layer/segment. This angle of rotation (S) of a series/layer, is given by:
A set of spiral axes (i.e., a series of points), each with the same number (n) of points, is needed to create the other layers/segments for the entire micalith reconstruction. Two such consecutive series of points (in red and black colors respectively) are presented in Fig. 6b and c. The points (r, Θ, z) of all consecutive series are defined following the Eqs. (1), (2), and (3). The initial radius (R) and the vertical distance (V) is the same for all the consecutive series of points. However, the initial azimuth (Θ) is different for each of the series and depends on the angular separation between two consecutive series of points. If the angular separation between two consecutive series of points is given by p, then, the value of “p” can be calculated as:
where N is the total number of series (i.e., the total number of layers/segments) for the full micalith reconstruction. As the azimuth of the first point in the first series is Θ1, therefore the azimuth of the first point of the second series will be (Θ1+p). The Ith series of points in N numbers of series (I<N) can be represented as:
4.3.3 Creation of a layer and a segment
The segmented lamella is assigned to each point in the series, creating a layer and segment composed of lamellae. The inclination of the lamella is added by rotating it, as described in Fig. 5a and b. In the case of forming a layer (following model-1 of the microstructural arrangement), all the lamellae (n) are assigned a single value of angle of inclination (δA or δB). This suggests that rotating all the lamellae of the series with an inclination of δA or δB formed layer-A or layer-B, respectively. For generating a segment (following model-2 of the microstructural arrangement), the lamellae are alternatingly assigned two distinct angles (δA and δB) of inclination, indicating rotation of the alternative lamellae of the series with inclinations of δA and δB.
Considering that the first and the last points of the layer/segment represent the base and the apex of the micalith, the tilt associated with the two points are τb and τa, respectively. The tilt values consistently change from τb at the base to τa at the apex. Thus, the value of tilt for ith point (i<n) of the series (i.e., layer/segment) is given by the following equation:
tilt-increment = .
The value of the tilt is given to each lamella in the layer/segment by rotating it as described in Fig. 5a and c.
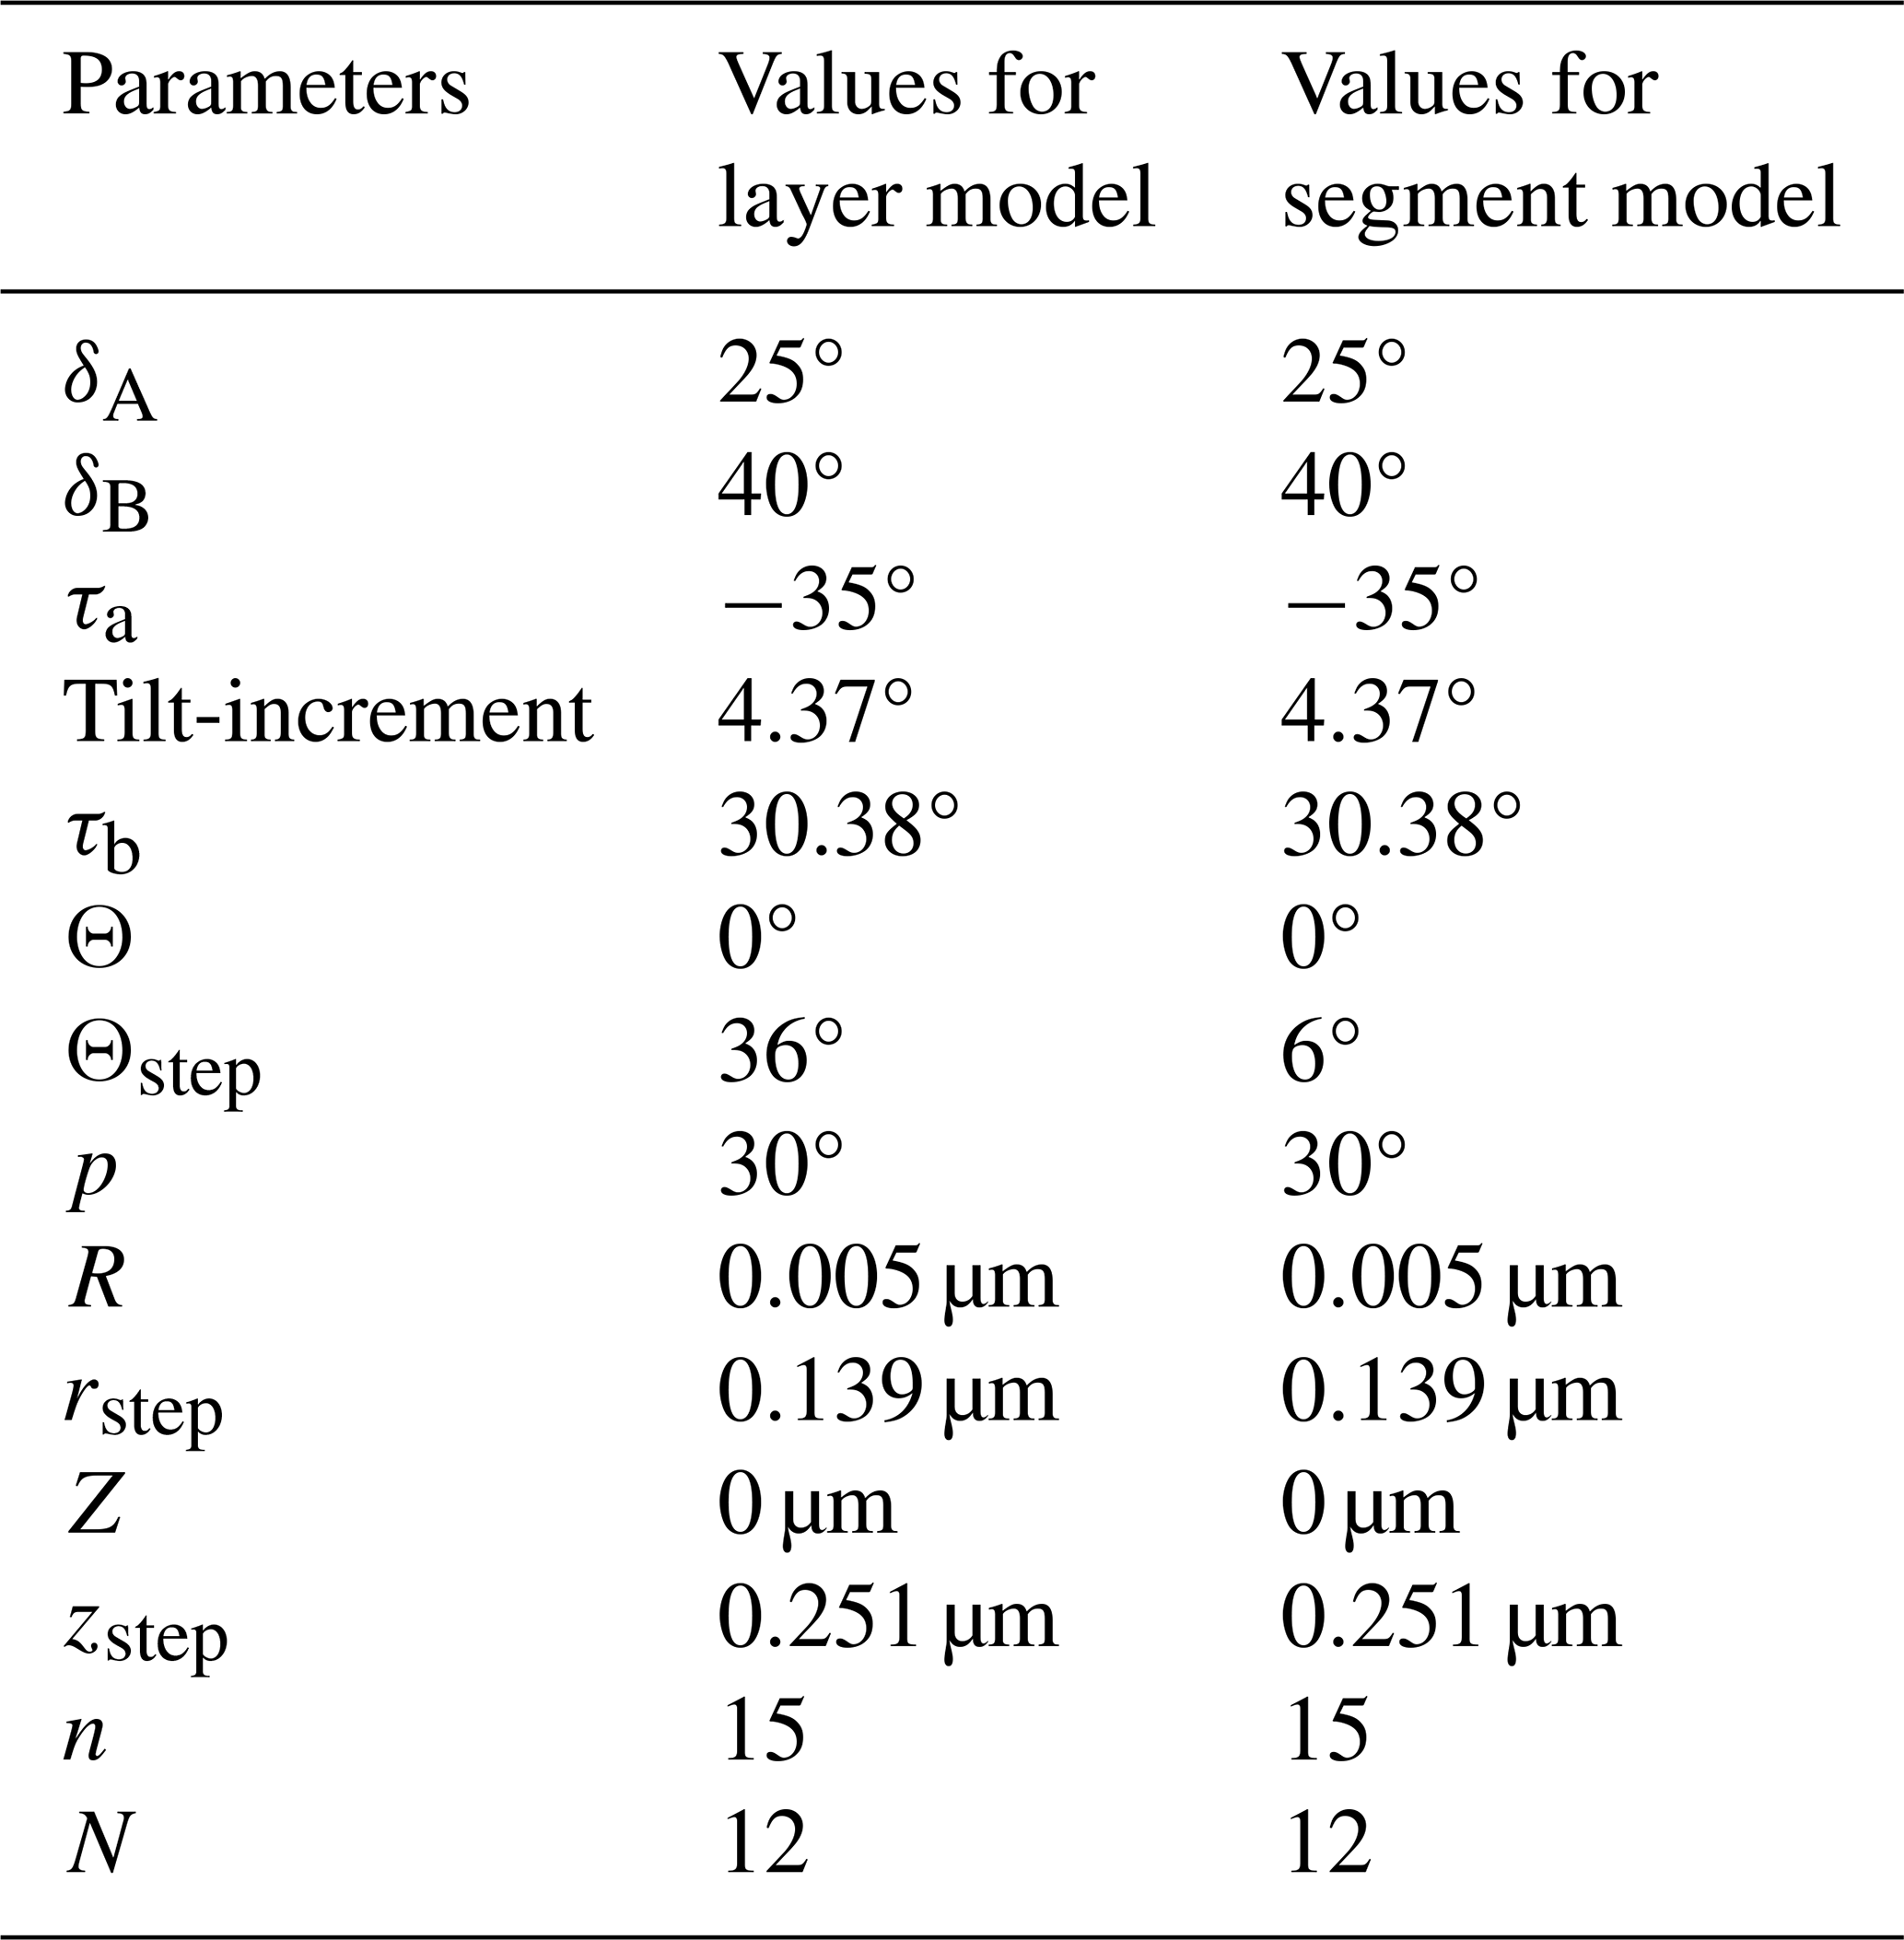
The descriptions of all parameters lead to the next step in the reconstruction of the full micalith. The two micalith reconstruction models of the microstructural arrangement have been termed the layer model and the segment model, respectively. It is explained earlier (in Sect. 2.2.1 and 2.2.2) how the total number (N) of layers/segments in the whole micalith of N. globulus is determined as 12. Thus, the angular separation between two consecutive layers/segments will, therefore, be (from Eq. 5). However, the values of initial and final azimuths, initial radius and vertical distance, rstep, zstep, and the total number of lamellae (n) in a layer/segment are impossible to calculate without the segmentation of a layer/segment. As it is very difficult to separate one layer/segment of lamellae from the micalith, we have applied several trials with different combinations of these values and have taken those values that create a space-filling layer/segment with the separated lamella. Importantly, the physical overlap between two consecutive lamellae is effectively close to zero. After the trials, the values of different angles and lengths are taken such that the lamellae merely touch each other without any physical overlap. Therefore, a single voxel contains only one lamella. The results suggest that the total number of lamellae in one layer/segment (n) is 15. All the values of the parameters used to reconstruct the layers/segments, following different equations given in Sect. 4.3.2, are given in Table 1.
Table 1Values of the parameters for reconstructing layers/segments of N. globulus.
4.3.4 Layer Model
The values of each of the cylindrical coordinates (ri, Θi, zi), inclinations (δA and δB), and tilt (τi) for individual lamella in the first layer (layer-A) are provided in Table 2. The relative changes of these values for each of the lamellae across the length (L) are graphically represented in Fig. A4 in the Appendix. A total of 12 layers (six layer-A and six layer-B) are created, alternatively putting I = 0 to I = 11 in series I and using the values of parameters (layer model) of Table 1. Two successive layers of -A and -B and the full micalith reconstruction are shown in Fig. 7a–d.
Table 2Values of the radius, azimuth, vertical distance, inclination, and tilt of all the 15 lamellae of the first reconstructed layer-A of N. globulus. The lamellae are labelled sequentially from A1 to A15.
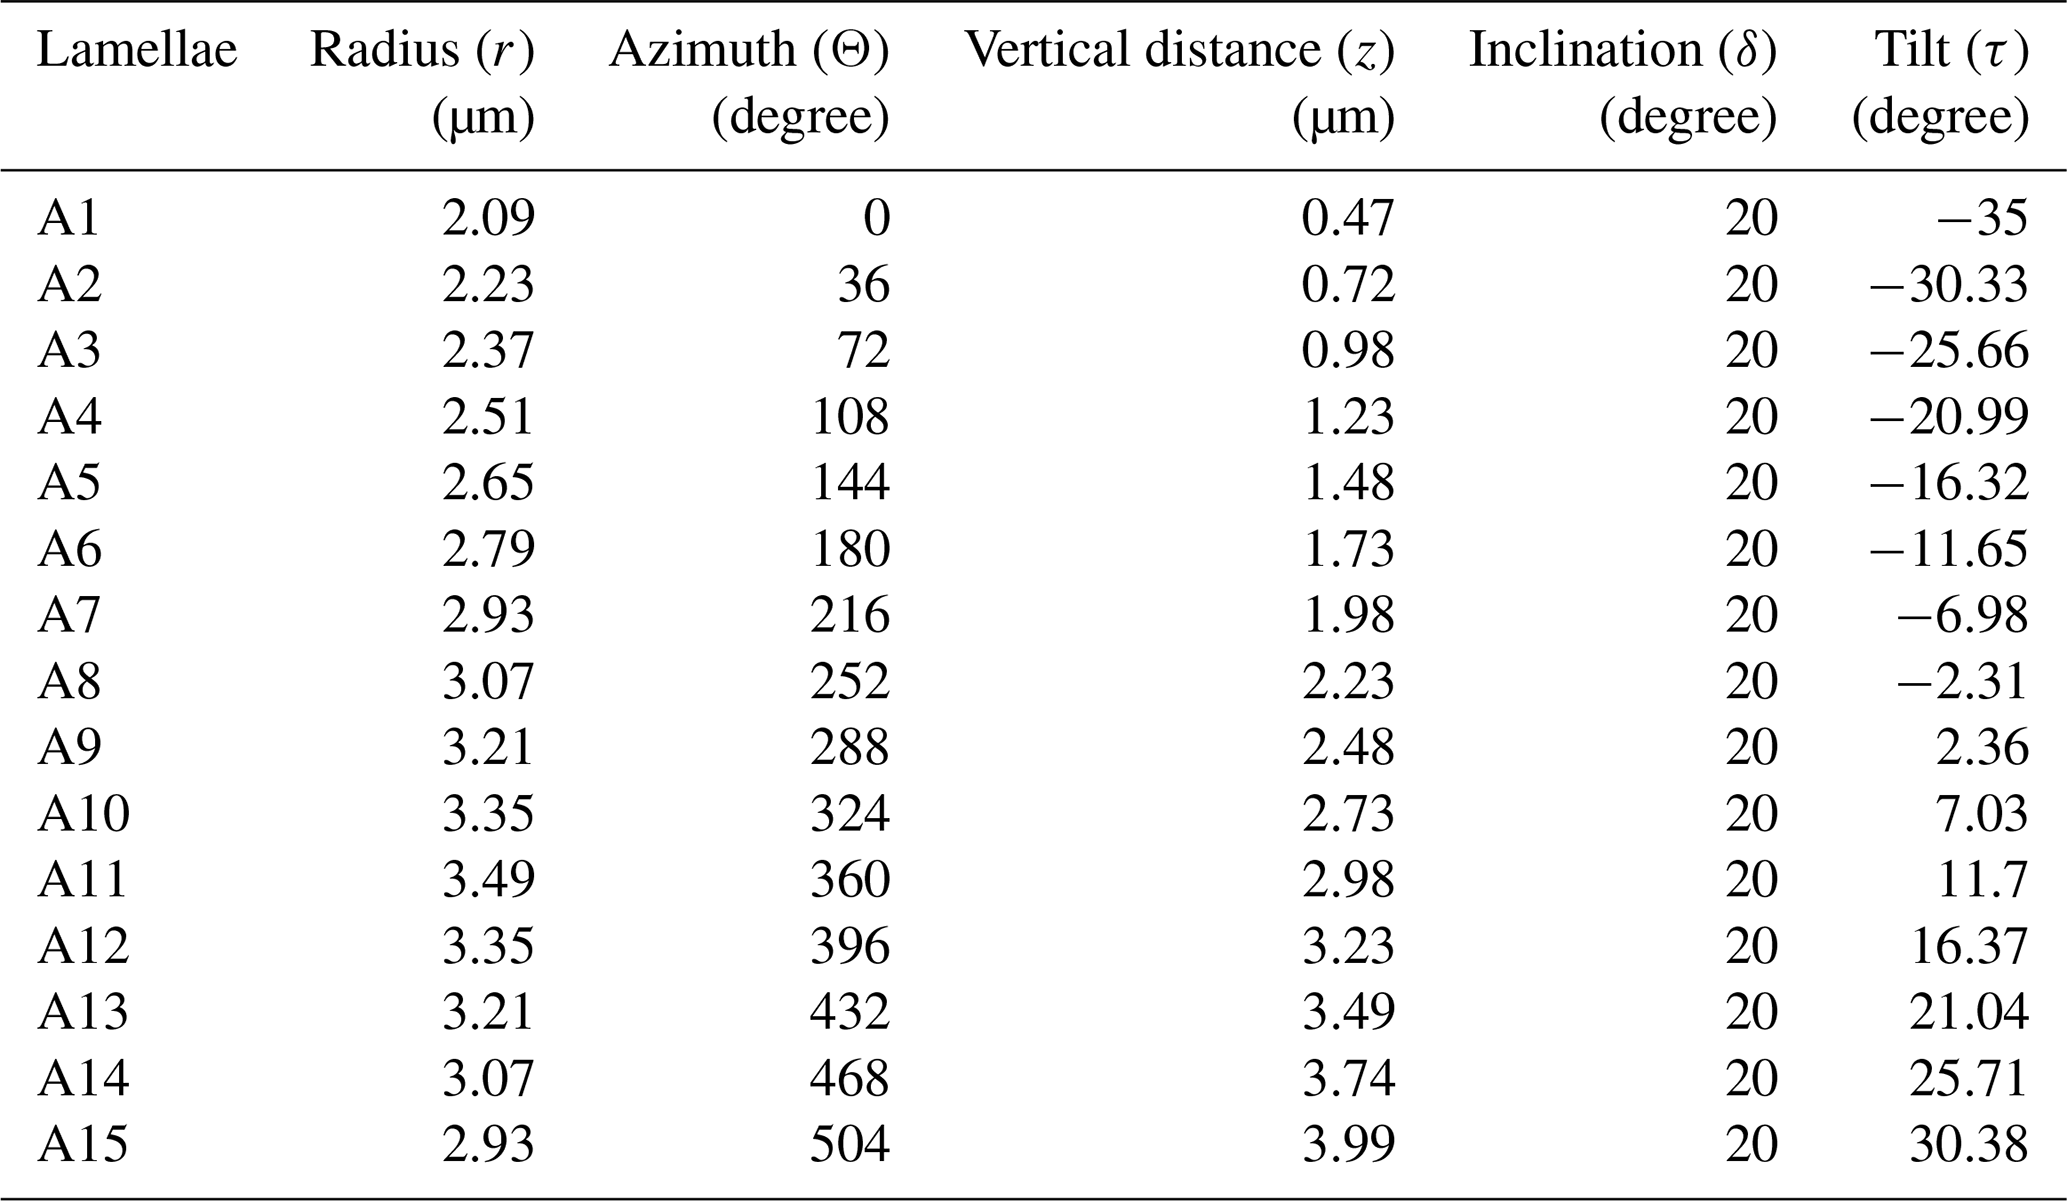
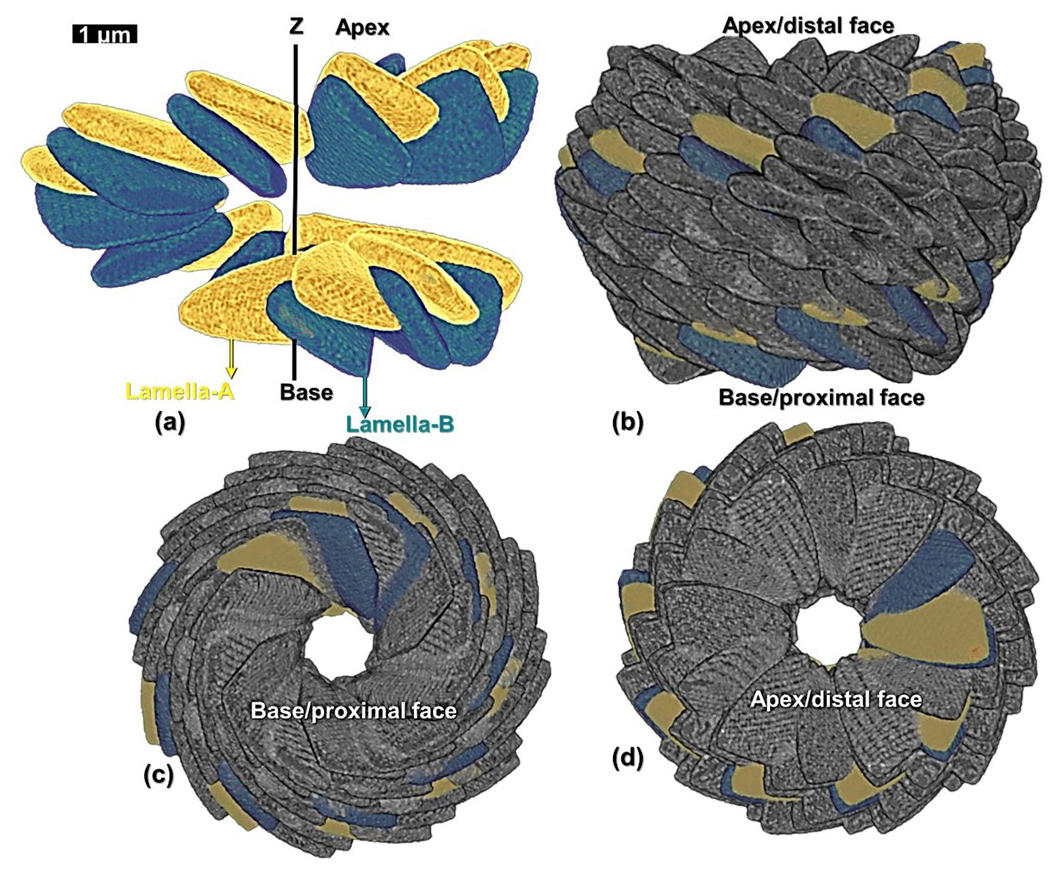
Figure 7Reconstruction of the micalith of N. globulus using the layer model. (a) Longitudinal view of the two layers formed by lamella-A (yellow) and -B (green). (b, c, d) Longitudinal, basal and apical views, respectively, of the combination of 12 such reconstructed layers forming the entire micalith. The first two layers of lamellae-A and B are also shown. “Proximal” and “distal” (Aubry, 2013) terms refer to the orientation of the micalith on the cell. Proximal face: face closest to the cell membrane and distal face: face farthest from the cell membrane.
4.3.5 Segment Model
Values of each of the cylindrical coordinates (ri, Θi, zi), inclination (δA and δB), and tilt (τi) for individual lamella of the first reconstructed segment are given in Table 3. The graphical representation of their relative changes across the length (L) are presented in Fig. A5 in the Appendix. A total of 12 segments were generated using I = 0 to I = 11 in series I and the values of parameters (segment model) of Table 1. A segment with the lamella-A and -B and the full skeletal reconstruction are shown in Fig. 8a–d.
Table 3Values of the radius, azimuth, vertical distance, inclination, and tilt of all the 15 lamellae of the first reconstructed segment of N. globulus. The lamellae-A and -B are sequentially marked from A1 to A8 and B1 to B7, respectively.
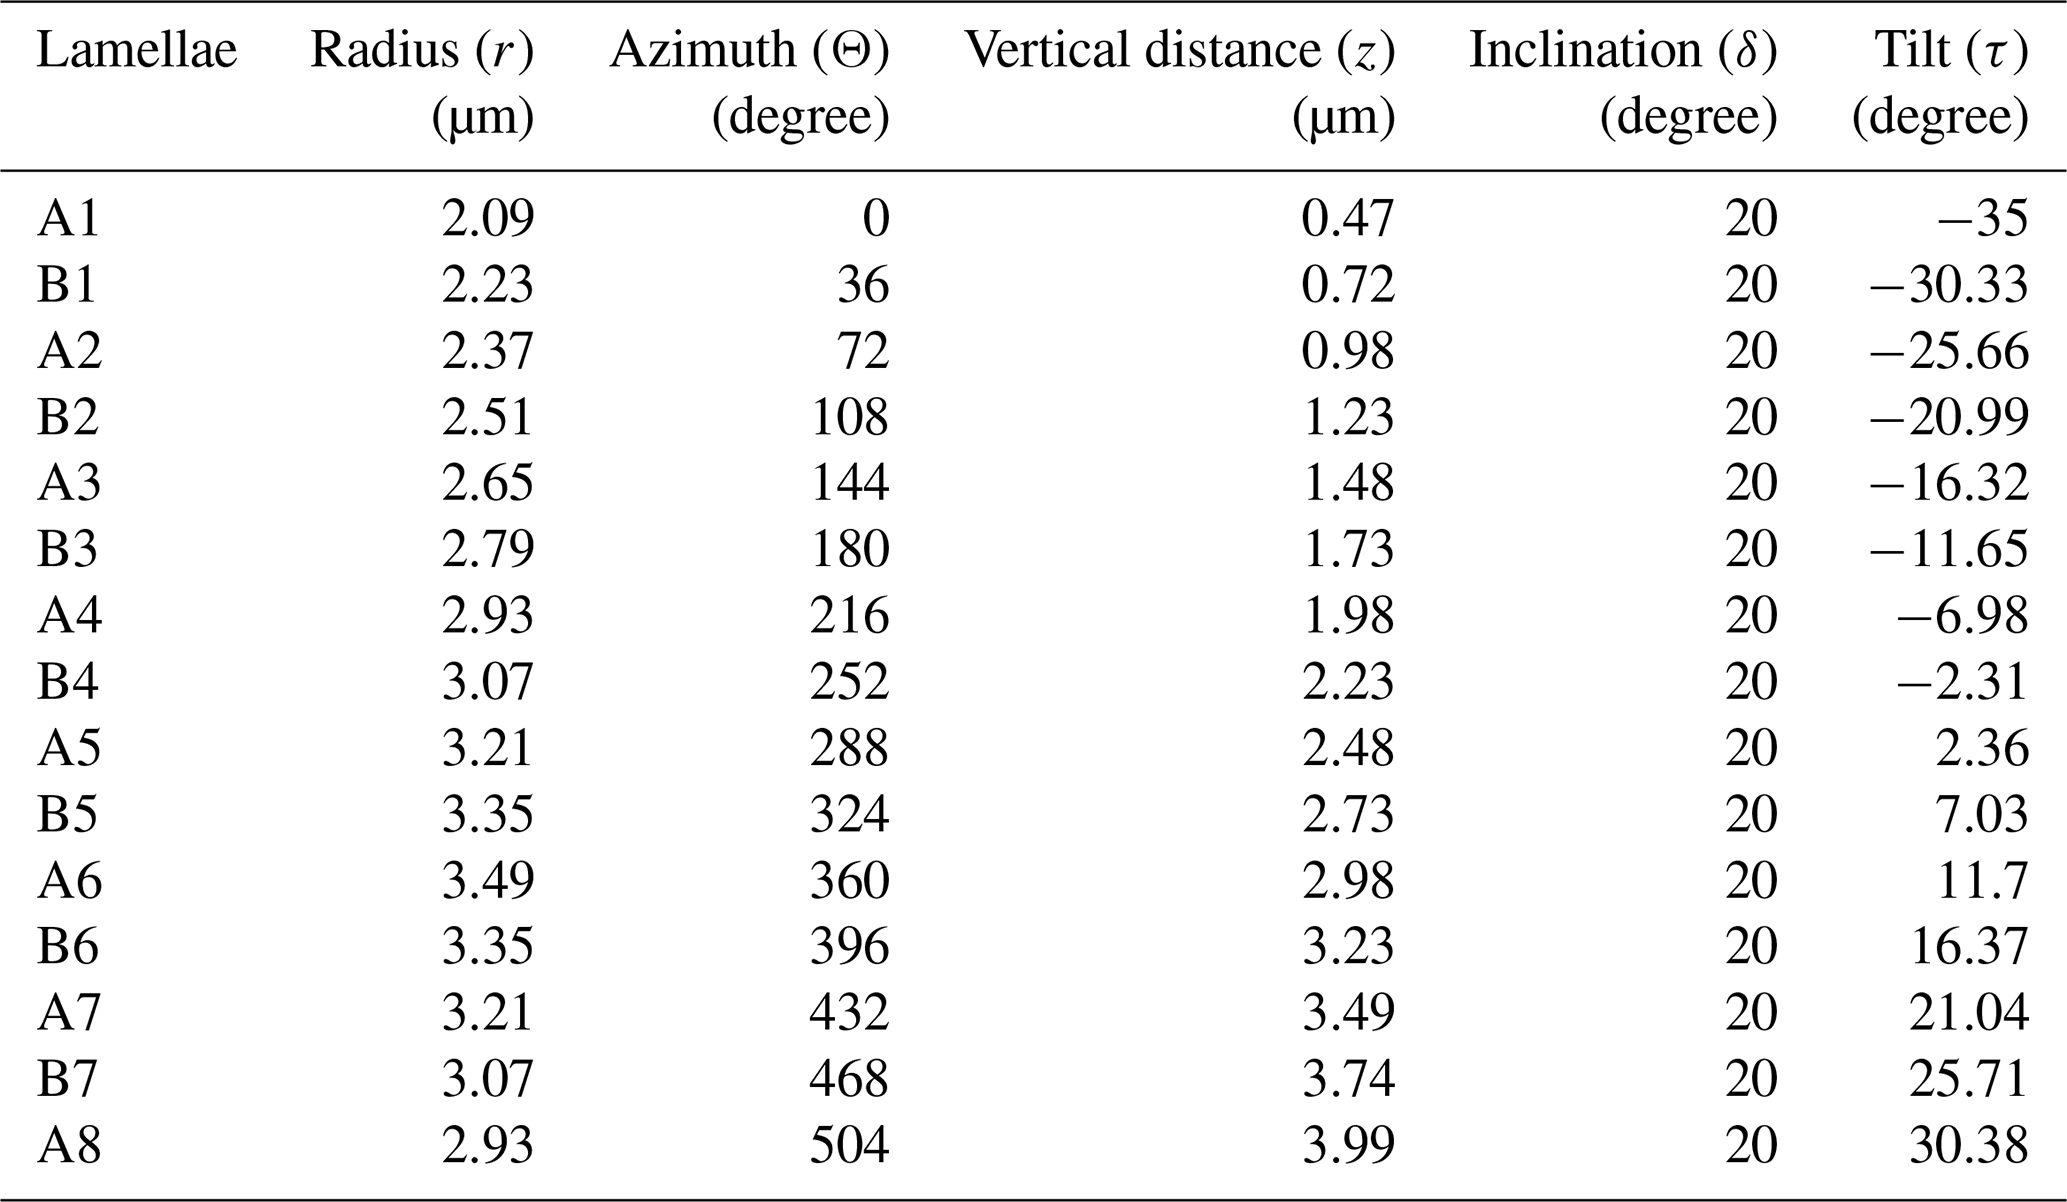
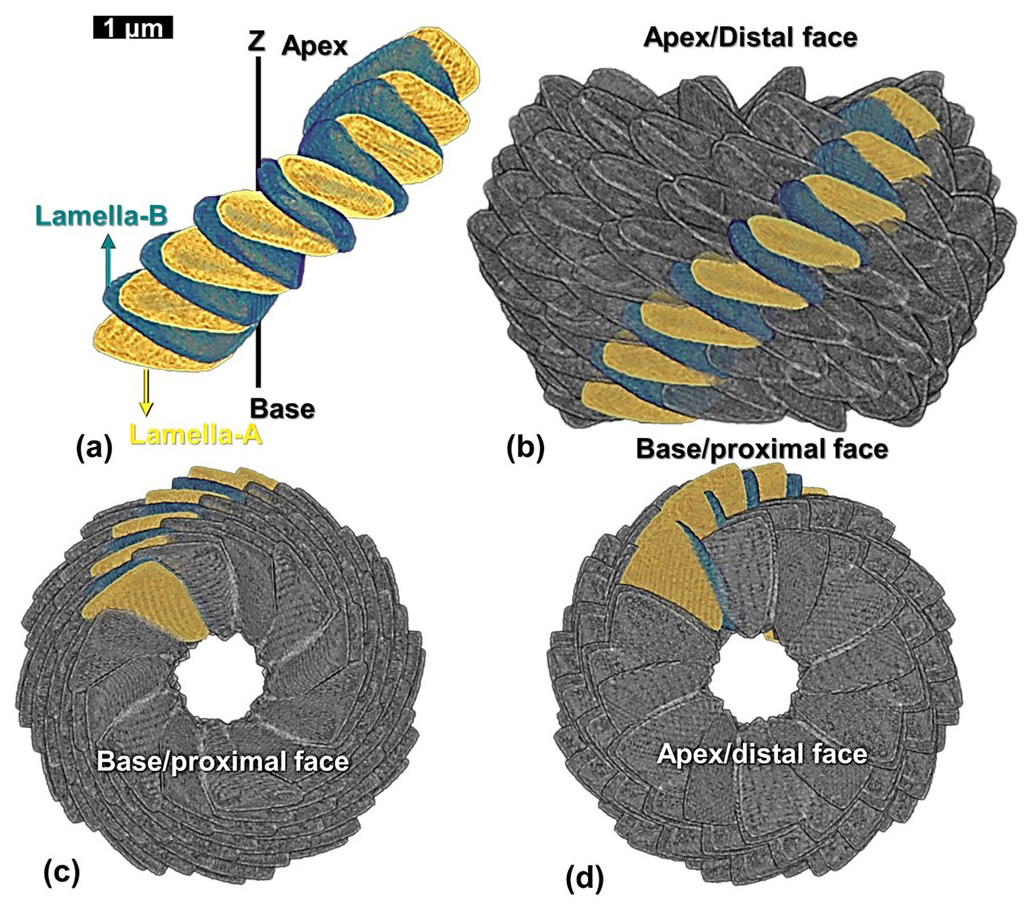
Figure 8Reconstruction of the micalith of N. globulus using the segment model. (a) Longitudinal view with alternating, properly oriented, lamella-A (yellow) and -B (green). (b, c, d) Longitudinal, basal and apical views, respectively, of the combination of 12 such reconstructed segments forming the entire micalith. A segment containing alternatively placed lamella-A and -B is highlighted. See Fig. 7 for terminology regarding the orientation of the micalith.
5.1 Which of the two models best explains the Nannoconus micalith?
PXCT provides successful 3D reconstruction of the Nannoconus micalith structure, whatever the considered model (layer or segment). Indeed, similar reconstructions (Fig. 9a and b) of the micalith were obtained, which structurally resembles the real specimen (Fig. 9c). However, each of these two models of the microstructural arrangement suggests a distinct biomineralization process to form the entire micalith. The first model implies that the micalith is formed by lamellae organized in successive layers, whereas the second one involves a primarily organization of lamellae in segments, each defined by the stacking of lamellae. To resolve this issue, we supplement our study with careful observation of SEM images of other Nannoconus species available in the literature. In particular, on SEM images of one of the youngest species, N. funiculus (reported at ∼ 90 Ma; Lees and Bown, 2016), the layered structure is distinctively visible, but layers are clearly organized in segments, as it is visible on Fig. A6a, in the Appendix. Clear segment boundaries are also observed in several species (Fig. A6a–d in the Appendix), from the oldest one (N. compressus, reported at ∼ 140 Ma; Bralower et al., 1989; Fig. A6d, in the Appendix) to the youngest one (Fig. A6a, in the Appendix). In many recrystallized or overgrown specimens, the individual layers are no longer visible; they have fused to form sorts of bricks, but the organisation in segments remains (Fig. A6d, in the Appendix). Another argument favoring the segment model is that, as described earlier, the genus Nannoconus belongs to the family Nannoconaceae (Reinhardt, 1966), which is included in the order Braarudosphaerales (Lees and Bown, 2016). This order also includes the family Braarudosphaeraceae which shares a strong evolutionary link with Nannoconaceae, and therefore with Nannoconus as described by Lees and Bown (2016) and Aubry (2025). According to Lees and Bown (2016), the pentaliths of the family Braarudosphaeraceae are characterized by “five segments formed from stacks of non-imbricated laminae/elements”, whereas Nannoconaceae are defined by “numerous stacked, imbricating elements.” Here, “laminae/elements” refers to lamellae. Braarudosphaera bigelowii, an extant species of Braarudosphaeraceae with fossil representatives first occurring 100 Myr ago, calcifies a pentagonal micalith with the combination of five trapezoidal segments (Fig. 4 in Hagino et al., 2016) composed of parallel “lamellae stacked in segments” (Aubry, 2013). Given the close evolutionary relationship between these two families, it is reasonable to hypothesize that Nannoconaceae (and therefore, Nannoconus) may have calcified via a similar process, where imbricating lamellae were indeed stacked into segments.
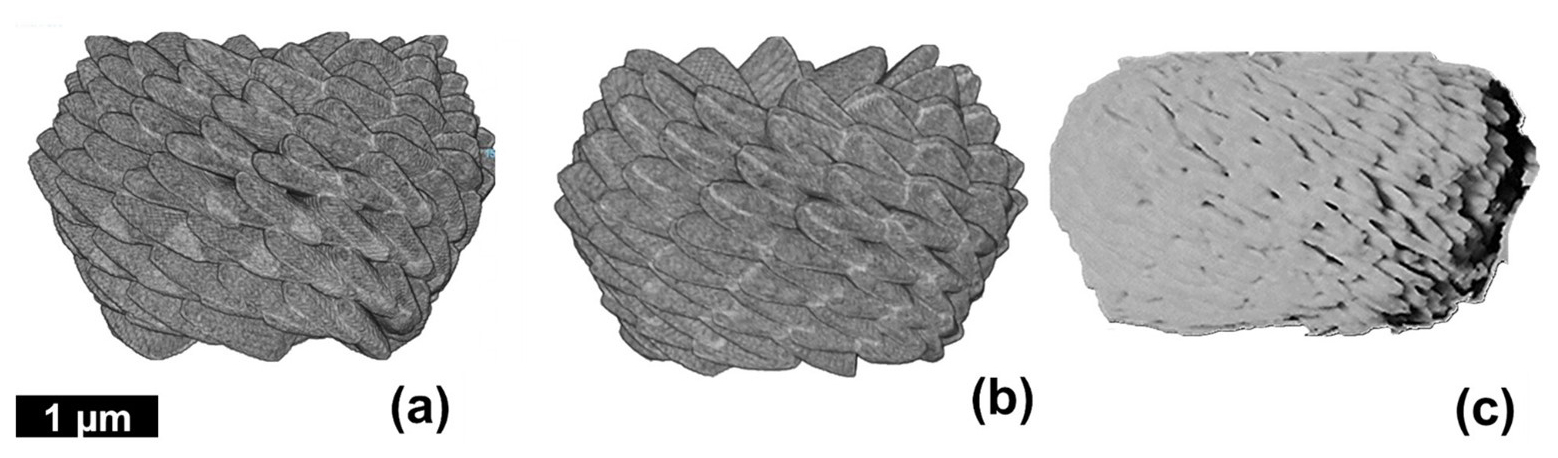
Figure 9Two different reconstructions of the micalith of N. globulus. (a) reconstruction based on the layer model and (b) reconstruction based on the segment model. Similar skeletal reconstruction is also proposed (at low resolution) by Aubry (2025, Fig. 12d). (c) External view of the specimen of N. globulus used in the PXCT experiment (see also Fig. 3b).
5.2 Which parameters control Nannoconus's micalith morphology?
Considering the segment model, we now try to show which parameters control the inter-specific morphological variability observed within the Nannoconus group during the ∼ 30 Myr of the Early Cretaceous. The parameters that can potentially control the morphology of the micalith are the angle of rotation of the segment and the radius. The angle of rotation of each segment (Eq. 4 in Sect. 4.3.2) is set at 90° in the reconstruction by the segment model. With the same total numbers of segments (N=12) and lamellae in each segment (n=15) used in the segment model, we have applied three different angles of rotation to individual segments: 30, 60 and 180°. All the angles of rotation we have used resulted in reconstructed micaliths of similar shape (Fig. 10a–d). It may be inferred from this that the angle of rotation of the segments does not affect the general shape of the micalith.
Figure 10Four complete reconstructed Nannoconus micaliths based on the segment model with four different angles of rotation of each segment. (a–d) These angles of rotation are 30, 60, 90, and 180° respectively. Two consecutive segments for each reconstructed micalith are marked in green and yellow.
The other parameter that can potentially affect the morphology of the micalith is the radius. As we discussed earlier, the specific way of changing the radius with the length (see Eq. 1) resulted in the globular shape of the micalith. Thus, different ways of changing the radius would give rise to different micalith morphologies. Five different morphologies (globular, hour-glass, conical, barrel-shaped, cylindrical; Fig. 11) of micaliths have been reconstructed by applying the same segment model and using for each the same values of all parameters (Table 1) except for the radius (Table 4); We obtained reconstructions that resemble the morphologies of Nannoconus real species. Thus, it is determined that the radius is the parameter that controls the inter-specific morphological variability of Nannoconus. However, other than radius, the total number of segments forming the micalith could also vary for different species of Nannoconus. It should be kept in mind that in this discussion, the number of segments is accepted to be 12 based on a SEM image of only one species, that is N. globulus. A comparative study of SEM images of different species of Nannoconus could be useful to investigate whether the number of segments in micaliths is species-dependent.
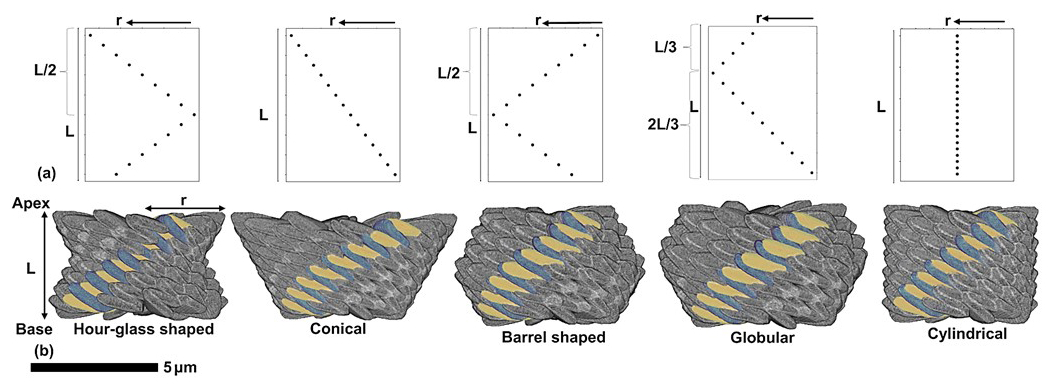
Figure 11Five different micalith morphologies of Nannoconus, each with distinct variation of radius (r) across the length (L). (a) Graphical expressions of five different variations of radius along the length of the reconstructed micalith, as shown in Table 4. Each of the points on the graphs indicate individual lamella of a segment. (b) Micaliths reconstructed following each of the possibilities, using the segment model, with each micalith highlighting a segment containing both types of lamellae-A (yellow) and -B (green).
Table 4Five possible variations in radius along the length (from base to apex) of the reconstructed micalith of Nannoconus are presented, each associated with distinct skeletal morphologies (as shown in Fig. 11). Corresponding species of Nannoconus exhibiting these respective morphologies are also provided.
Applying the reconstruction model developed in this study, we successfully produced a three-dimensional micalith of Nannoconus. More generally, this approach will enable us to constrain variations in skeletal morphology not only at the genus level but also at the ordinal level (Braarudosphaerales), thereby allowing an assessment of whether specific skeletal morphologies were preferentially selected over the long evolutionary history of this order (∼ 150 Ma). Recent research (Aubry, 2025) suggests that the importance of this order lies in its distinct skeletal structure, indicating both a taxonomic specificity and a unique biological position within the calcareous nannoplankton group.
5.3 How were the segments of the Nannoconus micalith biomineralized?
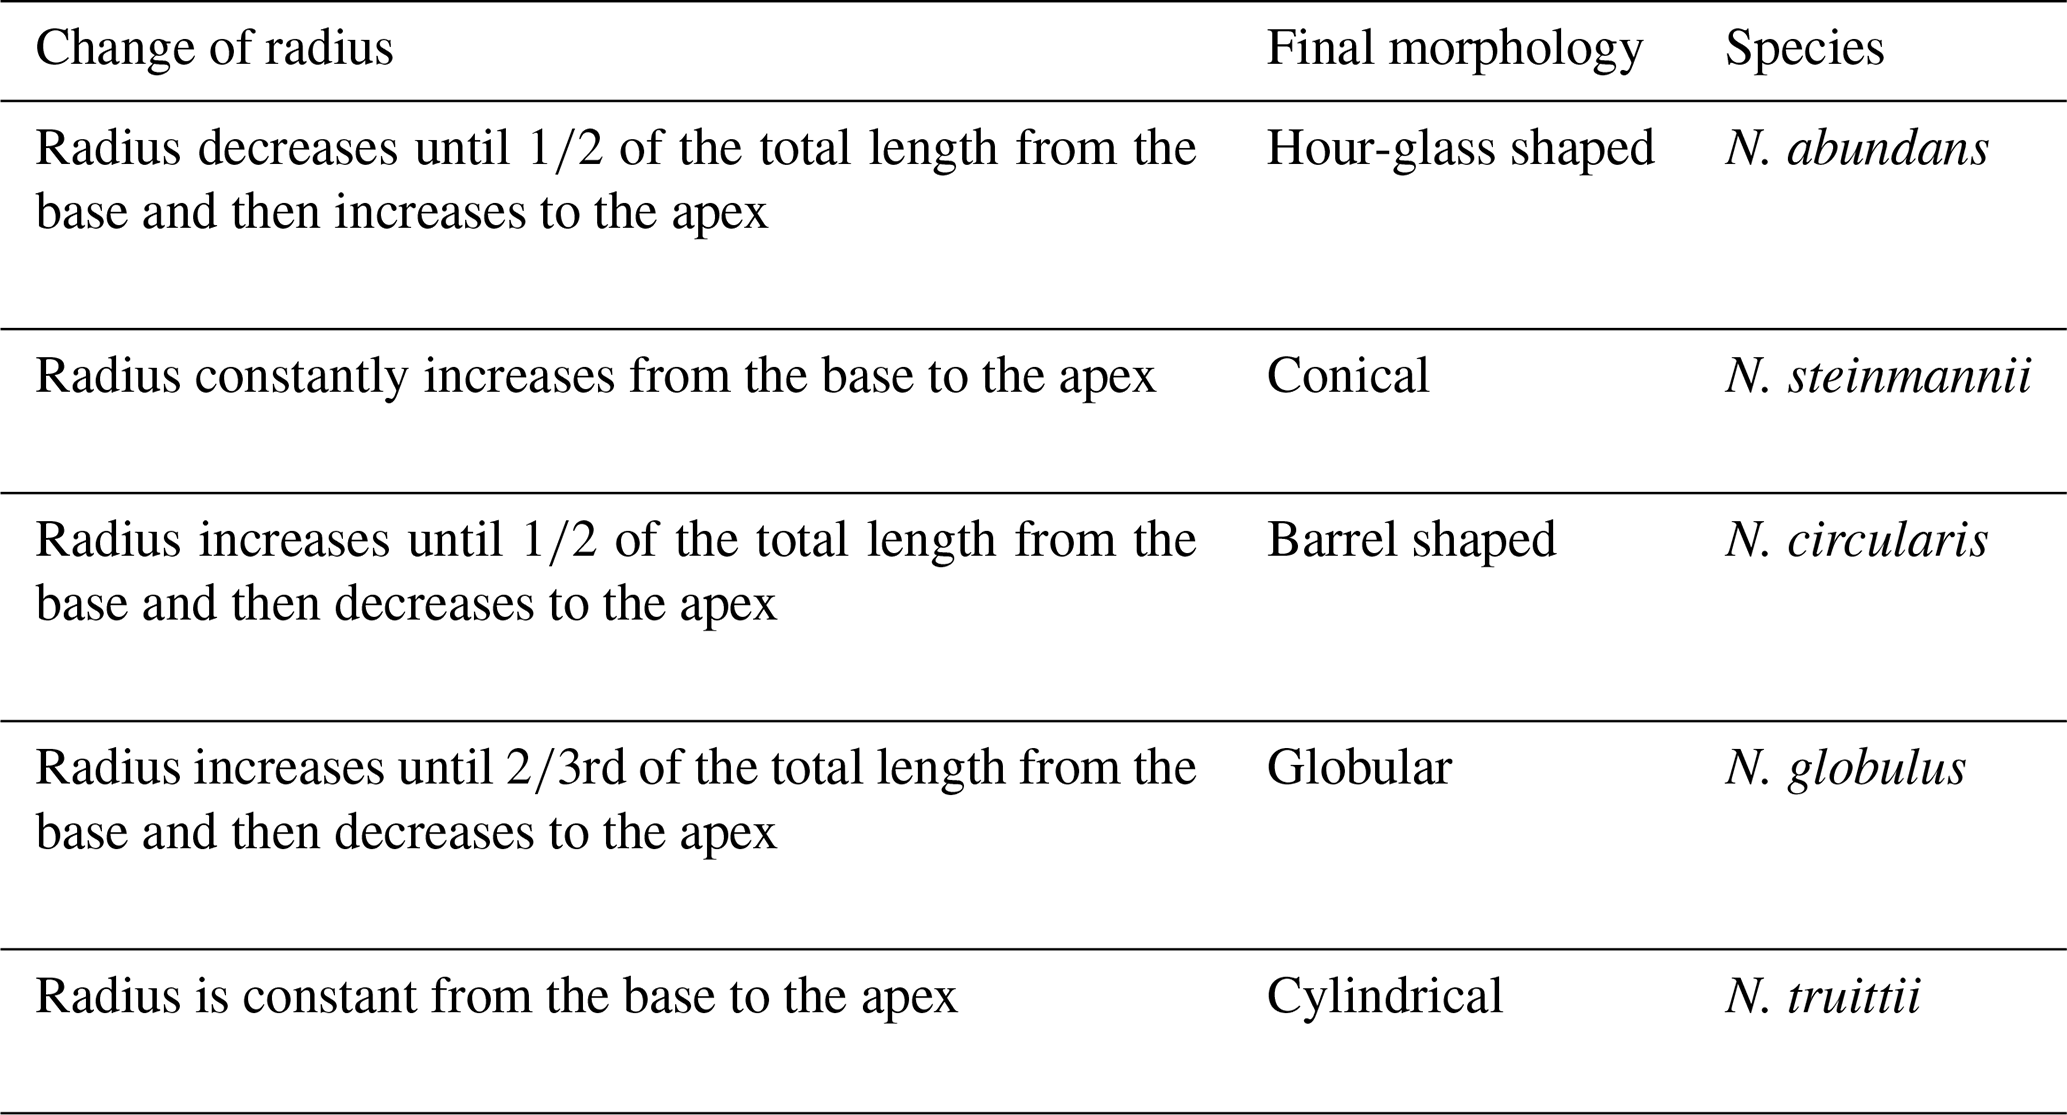
A mineralization process involved in the formation of a Nannoconus micalith would likely include four components: (a) the lay out of the duos of calcitic lamellae and (b) their organization into segments, and, also, their acquisition of (c) a tilt and of (d) an inclination. The extant species Braarudosphaera bigelowii provides a model for the layout of the mineral lamellae and their organization into segments. The mineralization of its pentaliths is an extracellular process mediated by an organic template divided into five symmetrical parts in the shape of the segments and by extremely thin layers of organic matter between the calcitic lamellae (Hagino et al., 2016; Fig. A7a, b). Applying this to Nannoconus globulus, we may hypothesize that the mineralization would have involved an organic template divided into 12 symmetrical parts (each a segment), with very thin layers of organic matter controlling the formation of the lamellae (Fig. A7c). A complication in Nannoconus compared to Braarudosphaera is the association of the lamellae in duos with different inclination and tilt.
The inclination and tilt are explained by two mutually perpendicular rotations of the lamellae (see Sect. 4.3.1) in the Nannoconus micalith. Such specific rotational directions (i.e., clockwise and anti-clockwise) are commonly observed in biomineralized skeletons produced by marine organisms; for example, the coiling of gastropod's shell (Ueshima and Asami, 2003), the overlapping of the chambers generated by foraminifera (Schiebel and Hemleben, 2017), microstructural imbrications of the calcite units in the coccoliths produced by calcareous nannoplankton (Young et al., 1999; Aubry, 2013, 2025). These rotations are influenced by biomolecules such as proteins, amino acids, and polysaccharides (Young and Henriksen, 2003; Yu et al., 2005; Jiang et al., 2017, 2018, 2019).
An in vitro experiment to examine the acquisition of chirality by skeletons consisting of calcium carbonates (Jiang et al., 2018) provides insightful means by which the Nannoconus lamellae may have acquired inclination and tilt. These authors have observed that the addition of chiral acidic amino acid Aspartine to a supersaturated calcium- and carbonate-containing growth solution results in the formation of “small vaterite helicoid-shaped suprastructures with subunit inclinations and spiralling curves chiral platelets oriented in the right-handed direction” (op. cit., p. 2). The growth of the superstructure occurs layer-by-layer with the amino acid intervening between two consecutive (“mother-daughter”) mineral layers, and also rotating the daughter layer clockwise (Fig. 6A and B in Jiang et al., 2018) which produces a difference in inclination of the platelets between the coupled layers. Thus, because of the presence of amino acid between two consecutive layers, the “inclination” of the platelets in the new layers increases continuously during growth.
The amino acid induced rotation of the layered vaterite structurally resembles the interlocking arrangement of the lamellae of a Nannoconus micalith. (the lamellae of the micalith are the equivalent of the “platelets” of the suprastructure in the experiment above). However, the reconstruction of the Nannoconus micalith shows that not only one but two rotations of the lamellae in two mutually perpendicular directions are necessary to develop the interlocking pattern (as discussed in Sect. 4.3.1). By comparing the layer-by-layer grown vaterite, we may hypothesize on the presence of a layer of amino acid(s) or any other biomolecule(s) to have controlled the two rotations between two successive lamellae of a Nannoconus micalith, creating the tilt and the inclination. These consecutive lamellae could correspond, respectively, to the mother-daughter layers in the vaterite experiment. For two such consecutive lamellae in a segment we refer to the preceding (equivalent to “mother layer” of Jiang et al., 2018) and succeeding (equivalent to “daughter layer” of Jiang et al., 2018) lamellae as the “inferior” and “superior” lamellae, respectively (Fig. 12). The rotational directions to generate the inclination and the tilt are shown in the inferior and superior lamellae in Fig. 12. The required arrangements for these two lamellae are: (1) for the inclination, the opposite directions (both clock and anti-clockwise) of successive rotations (shown by the black bold arrows in Fig. 12a), and, (2) for the tilt, the same direction (anti-clockwise) of successive rotations (shown by the black dashed arrows in Fig. 12b). The opposite rotational directions in the inferior and superior lamellae generate the two lamellar types i.e., lamella-A and -B. Therefore, both the clock and anti-clockwise rotational directions occur simultaneously during biomineralization of the superior lamella over the inferior lamella, generating the interlocking arrangement of the constituting segments. These hypothetical explanations strengthen our initial hypothesis of the presence of an amino acid(s)/biomolecule(s) rich layer between two consecutive lamellae. An organic substrate of amino acid(s)/biomolecule(s) could correspond to the organic “template” (see above) for the calcification of the micaliths of Nannoconus. These organic layers, if originally present in the micalith, are very unlikely to be preserved in the fossil record. Yet, a preliminary study with confocal Raman micro-spectroscopy on micaliths of Nannoconus yielded a spectral signal (Fig. A8 in the Appendix), possibly indicative of preserved organic matter within them (Giraud et al., research in progress). Further investigations using tomographic technique with a resolution finer than the PXCT, such as atom probe tomography (resolution ∼ 0.5 nm), is required to confirm the preservation of in situ organic matter within the micalith of Nannoconus.
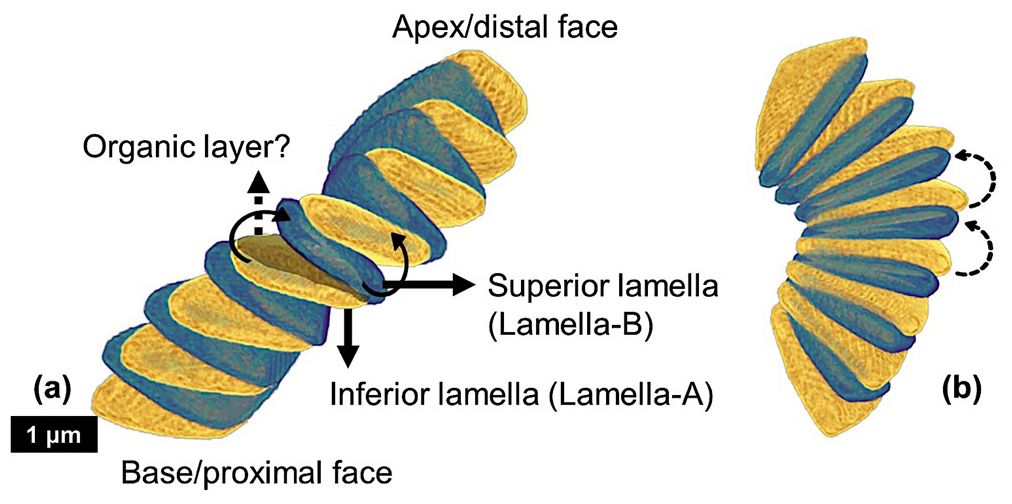
Figure 12Reconstructed segment of N. globulus with the proposed inferior and superior lamellae, along with the hypothesized intervening organic layer in between. (a) The two black bold arrows show the two opposite directions of rotation (clock and anti-clockwise), which create distinct inclinations in the two successive lamellae, generating the lamella-A (yellow) and -B (green). (b) Same segment, with two dashed black arrows presenting anti-clockwise rotations in two successive lamellae, generating the tilt in them.
The aim of this study was to obtain a sound understanding of the structure of the Nannoconus micalith as a first step towards understanding the mineralization process in an extinct genus that dominated the Early Cretaceous Tethys epicontinental nannoplankton communities for over 30 Myr. A set of Ptychography X-ray computed tomography (PXCT) with synchrotron radiation at the SWING Beamline of SOLEIL (French synchrotron) was applied on several well-preserved micaliths of different Nannoconus species to document the microstructural arrangement of the crystal components (lamellae) at the nanometer level (finer than the thickness of a single lamella). For the first time, a 3D micalith reconstruction has been achieved for one specimen of Nannoconus. We present here the result of the experiment obtained from a hand-picked specimen of Nannoconus globulus. The result was a series of tomographic image slices (3D resolution ∼ 40 nm) for the micalith. Then, one lamella, virtually separated from the image slices, was used to reconstruct the entire micalith of Nannoconus in the ORS-Dragonfly software. The interlocking arrangement of the lamellae results from two different angles, termed inclination and tilt, while changing radius (minimum ∼ 2.1 µm to maximum ∼ 3.5 µm) controls the micalith morphology. Thus, a single specimen provides sufficient geometric parameters to interpret 3D microstructure across species, and the resulting biomineralization inferences are applicable to Nannoconus species through different geological intervals. The 3D model of micalith reconstruction developed in the present study could be further applied to the reconstruction of the micalith of other genera within the order of Braarudosphaerales to investigate if a particular micalith morphology has been favored during the long evolutionary history of this order. PXCT 3D reconstruction of the Nannoconus micalith structure, combined with existing 2D SEM observation, supports the interpretation of the Nannoconus micalith as being composed of “segments”. Further research can now be undertaken based on the hypothesis that the biomineralization of the lamellae of the Nannoconus segments is “templated” by organic layers containing amino acid(s)/biomolecule(s). We hypothesize that during the biomineralization of the lamellae, amino acid(s)/biomolecule(s) have induced clockwise and anti-clockwise rotations, creating the inclination and tilt and therefore generating the interlocking arrangement of the lamellae. Biomolecule(s)-driven naturally produced microstructures characterized by the repetition of units such as the 3D arrangement of the lamellae of the Nannoconus micalith, are often extensively investigated for designing biomimetic materials. Such materials with artificially enhanced physico-chemical properties (e.g., hardness, solubility) are implemented in research with specialisation to catalysis and biomedicine, therefore making this publication relevant and important, outside the study of calcareous nannoplankton.
Figure A1Three-quarter view of the distal face of N. globulus in scanning electron microscopy (SEM). (a) Six lamellae in the 180° transect of the apex (given by the red curve) are highlighted. Three of lamellae-A and three of lamellae-B are numbered in green and yellow colours, respectively. (b) Magnified view of the part delineated by the red box in (a) with all the six lamellae: three lamellae-A (yellow) and three lamellae-B (green). (c) Boundaries between six segments highlighted by red-dotted lines in the same 180° transect of the apex of the N. globulus. SEM image modified from Covington and Wise (1987).
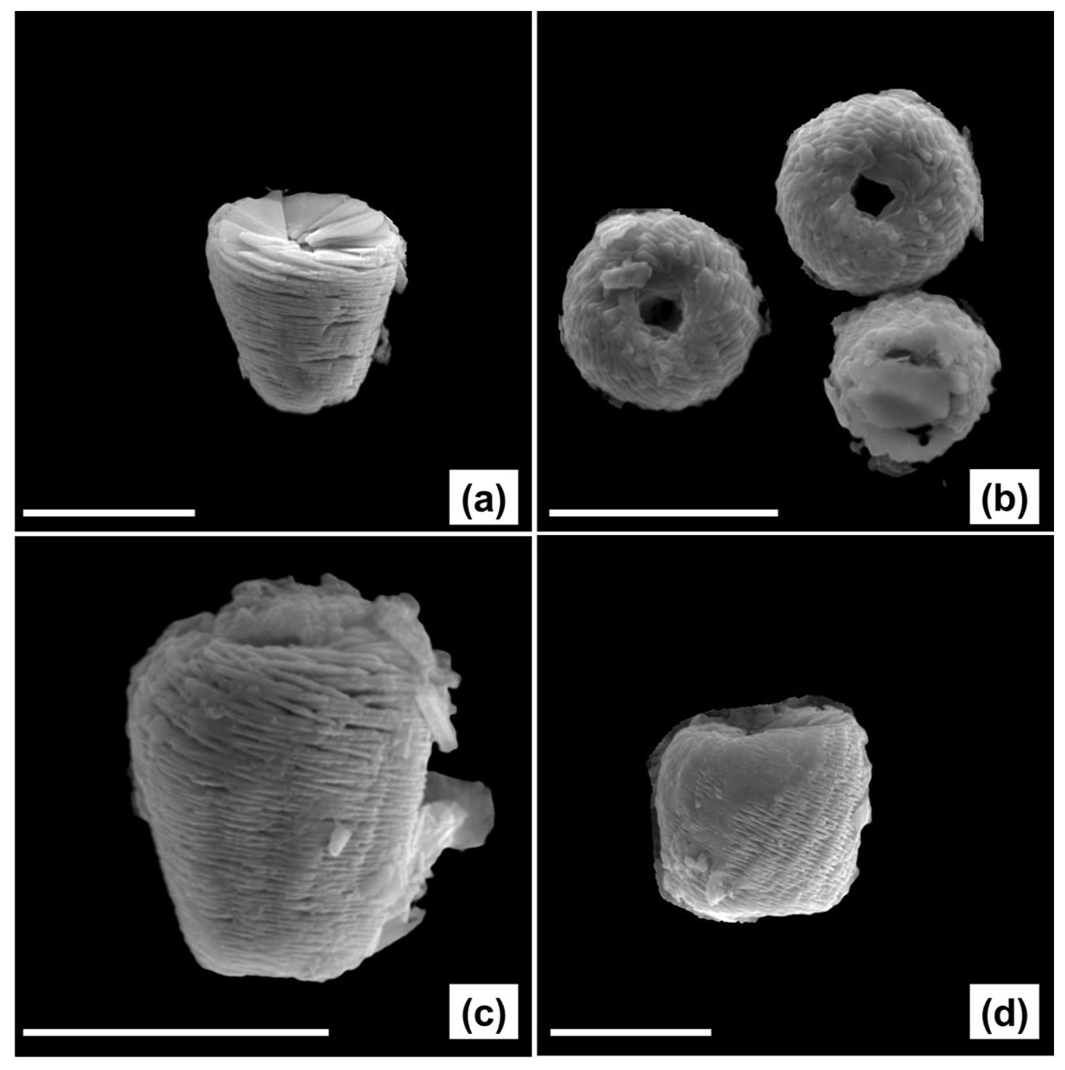
Figure A2SEM images of well-preserved specimens of Nannoconus, from DSDP Leg-93-Site 603 (continental rise of the western margin of the North Atlantic) Core 44, interval 115–116 cm. Individual lamellae can be clearly distinguished in each of the specimens thanks to their good preservation. Identification: (a) N. steinmannii, (b) N. globulus, (c) N. kamptneri, (d) N. circularis. The white line represents 10 µm.
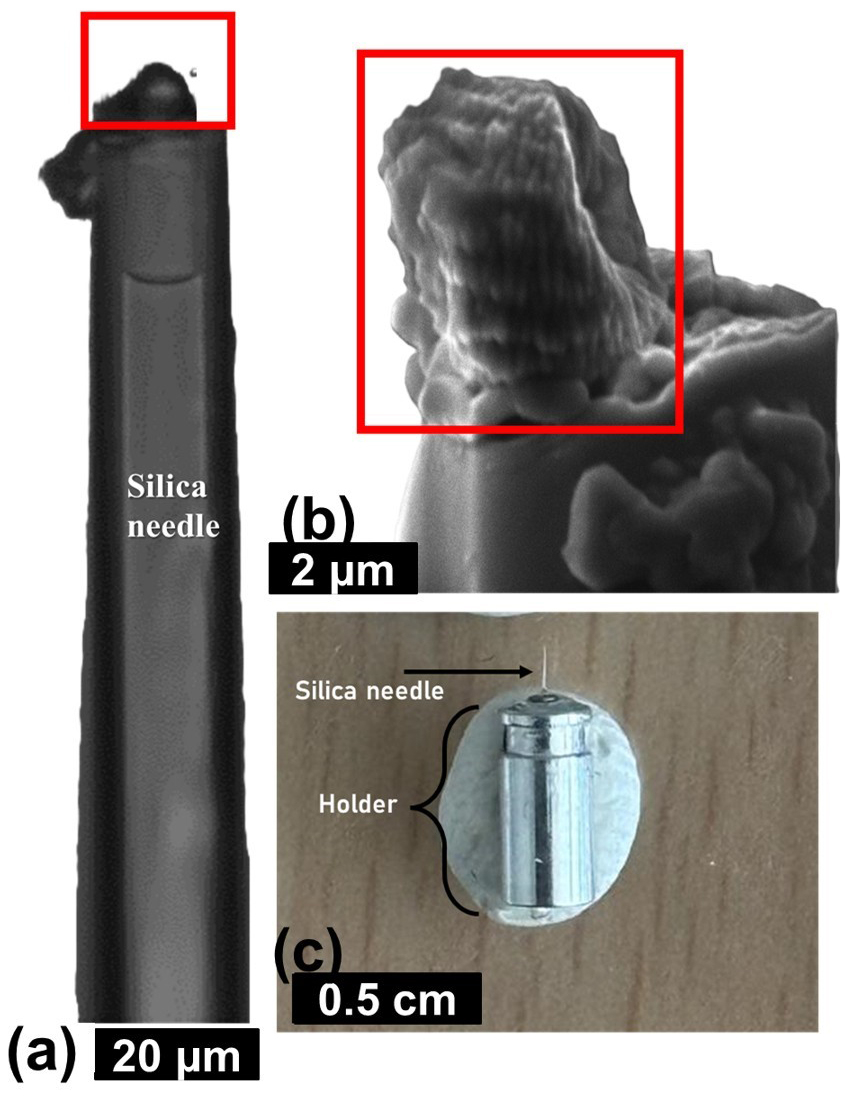
Figure A3Procedures used for the sample preparation of synchrotron-based ptychography X-ray computed tomography experiment, applied on N. globulus. (a) A specimen of N. globulus (inside the red box) is manually picked with a silica needle. (b) SEM image of the specimen. (c) The needle with a Nannoconus resting at its tip is placed in a metal holder that fits in the experimental station of the beamline of the synchrotron radiation centre.

Figure A4Graphical representation showing the variation of parameters along the length (L) of the first reconstructed layer (layer-A) composed of lamella-A, of N. globulus. The black points in the graphs, mark individual lamellae.
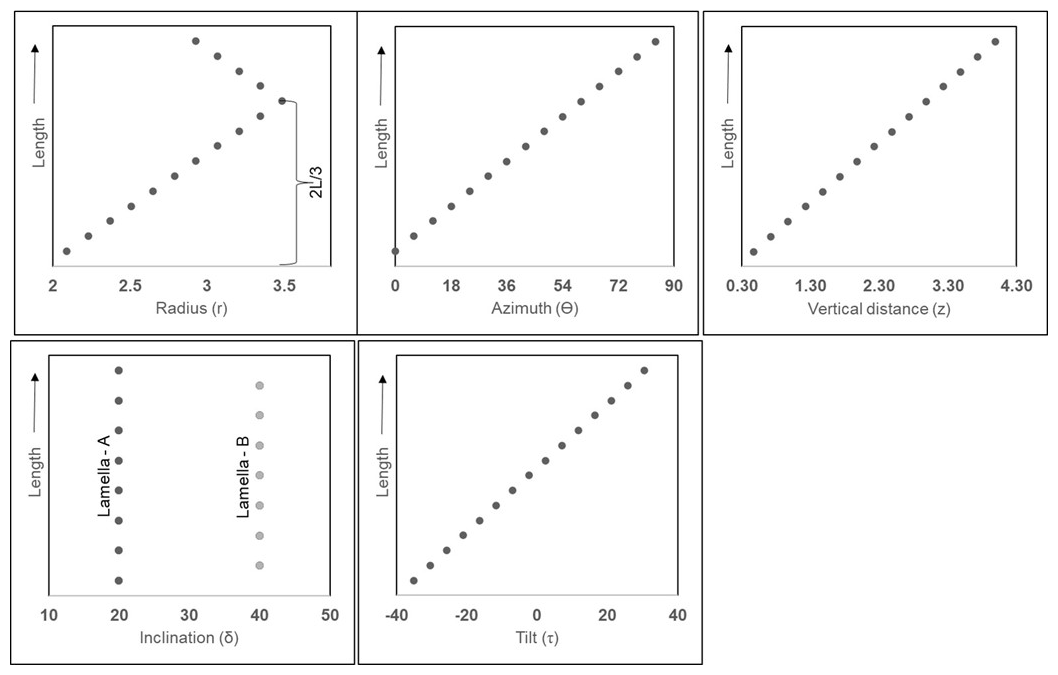
Figure A5Graphical representation showing the variation of parameters along the length (L) of the first reconstructed segments composed of lamella-A and -B of N. globulus. The black points in the graphs, mark individual lamellae.
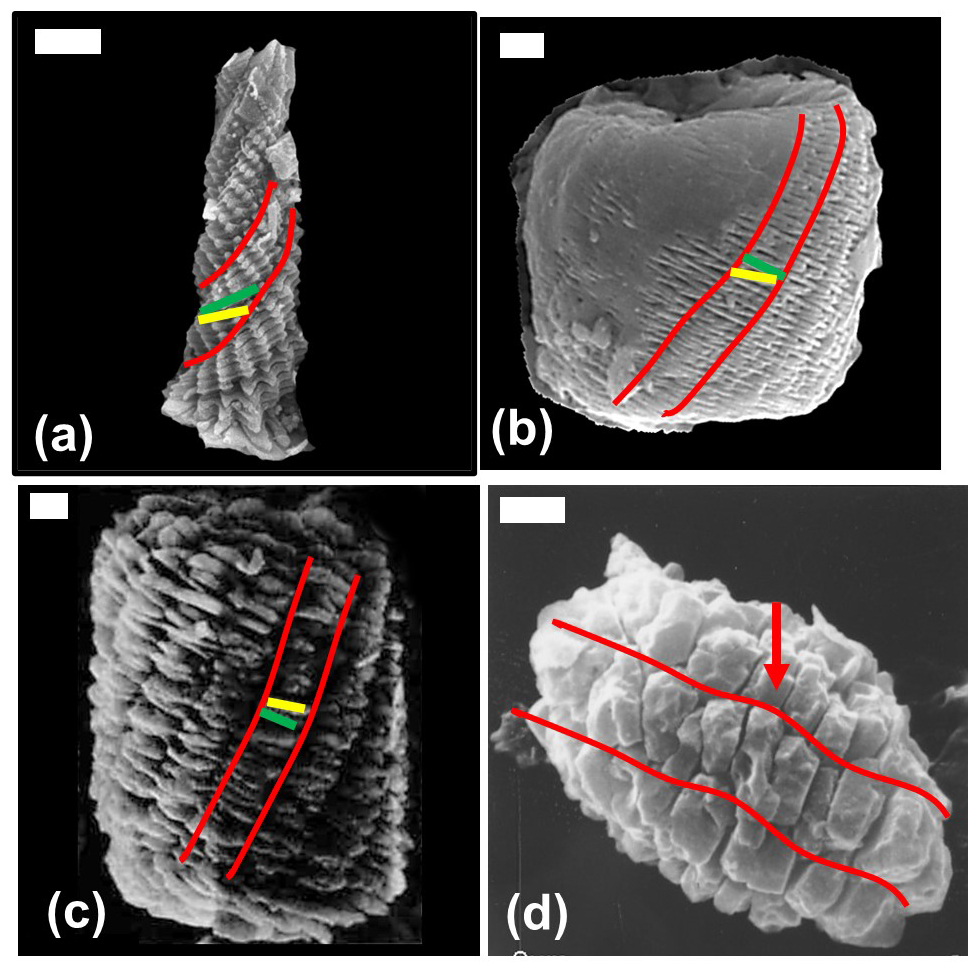
Figure A6SEM images of different species of Nannoconus, with the segments, marked in red lines along with lamella-A (yellow line) and -B (green line). (a) N. funiculus; adapted from Lees and Bown (2016). (b) N. globulus, from DSDP Leg-93-Site 603 (continental rise of the western margin of the North Atlantic; Core 44, interval 115–116 cm) presented in Fig. A2d in this study. (c) N. truittii; adapted from Hattner and Wise (1980), as available in the Nannotax3 website (Young et al., 2022). (d) N. compressus; adapted from Bown and Cooper (1998). The red arrows indicate lamellae that have fused and thickened due to overgrowth. The two types of lamellae (i.e., -A and -B) cannot be distinguished separately. This specimen, however, has preserved the organization of the segments. The white bar represents 1 µm.
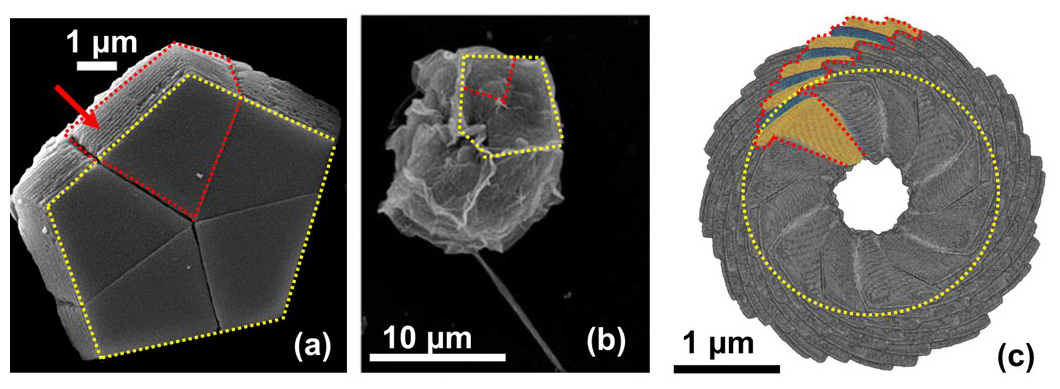
Figure A7Comparison between a pentagonal pentalith of B. bigelowii and the reconstructed micalith of N. globulus. (a) SEM image of the pentalith, adapted from Bown (2010). The yellow dotted lines mark the boundaries of the pentalith and the red dotted lines represent a segment. The red arrow indicates the parallel stacking of the lamellae, forming a segment. (b) The organic substrate, acts as template for calcification. The yellow dotted lines represent the boundary of the substrate that resembles the pentalith. The substrate is divided into five parts, with one part marked by the red dotted lines, mimicking the shape of a segment. Image adapted from Hagino et al. (2016), © 2016 Elsevier B.V. (c) The basal view of the reconstructed micalith of N. globulus. The yellow dotted circle represents the hypothetical organic substrate, acting as template for the calcification of the micalith. The substrate is divided into 12 parts (as Nannoconus micalith is considered to have 12 segments), with the boundaries of one part marked by the red dotted lines.
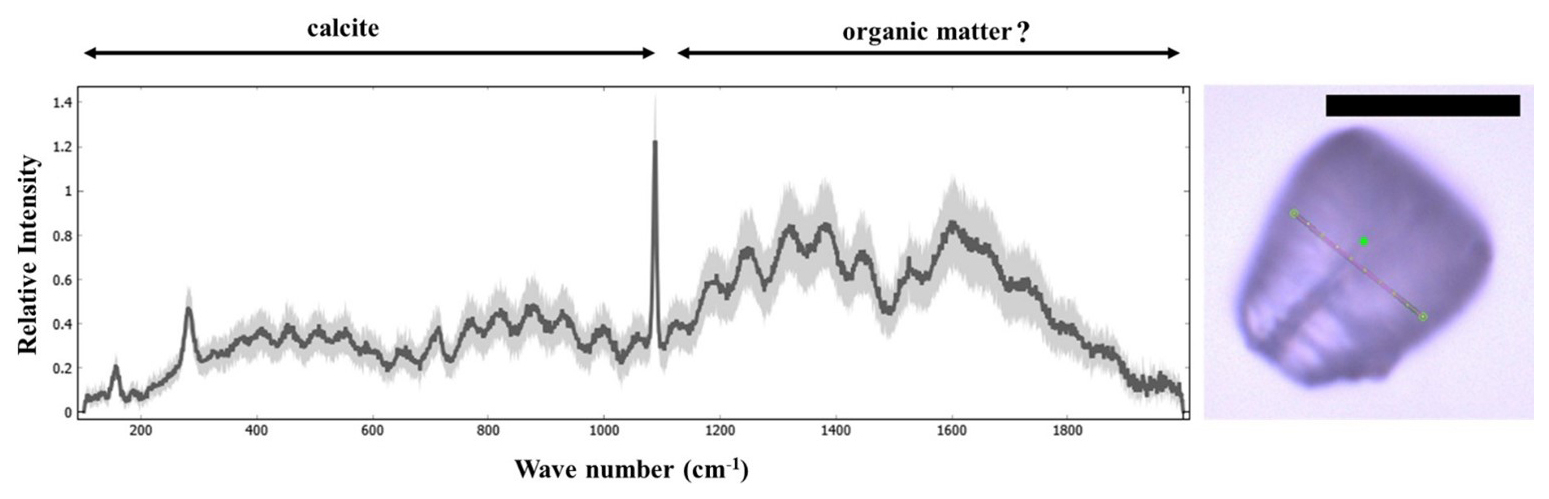
Figure A8Confocal Raman spectra of Nannoconus displaying two regions corresponding to the compositional CaCO3 and the “organic matter” preserved within the micalith. The photomicrograph in optical microscopy (PPL) of the N. steinmannii is given on the right, with a red line showing the scanning path for the spectra. The black scale bar represents 10 µm. PPL: plane-polarized light. The Raman spectra were obtained using a LabRAM Soleil Horiba Raman micro spectrometer with 532 nm wavelength laser-excitation and 1 µm spot size. A laser power of 1.1 mW was used to confirm that there is no damage to the specimens induced by the laser. The laser beam was focused on the sample through a hole of 50 µm using an objective at 100× magnification. The specimen was subjected to linear scans along the surface (5–10 µm) and also inside the specimen (4–5 µm). A total 25 scans were recorded, each with an acquisition time of 2 s. Peaks were fitted in the spectrum using Gaussian functions in Quasar software (Toplak et al., 2017) as a part of the analyses. The spectra have been normalized to the maximum intensity. The black spectrum represents the average of all 25 recorded spectra of the Nannoconus.
| Term | Description |
| Taxonomy | A formal hierarchical biological classification scheme of any organism, also known as Linnaean Taxonomy. This is given by Life< Domain<Kingdom<Phylum<Class< Order<Family<Genus<Species |
| Order | The 6th rank of the taxonomic classification. |
| Genus | The 8th rank in the taxonomic classification, the plural of genus is genera. |
| Species | The 9th and the final rank of the taxonomic classification. |
| Morphogroups | An informal term to classify organisms based on similar morphological criteria. |
| Convex Hull | A mathematical representation of an envelope/elastic cover covering a large set of data, defining a shape in space. |
The code for the micalith reconstruction of Nannoconus globulus for both the layer and segment models is available in the repository: https://doi.org/10.5281/zenodo.14925063 (Chowdhury et al., 2025).The segmentation, reconstruction, and visualization of the results have been done in Dragonfly software version 2024.2 for [windows]. Comet Technologies Canada Inc., Montreal, Canada; software available at https://www.theobjects.com/dragonfly (last access: 18 March 2025).
The underlying research dataset analyzed in the current publication, i.e., the PXCT images of Nannoconus globulus, is currently being considered for further publication(s) in preparation. The dataset will be made publicly accessible in a reliable repository following the publication(s). Until then, the dataset is available from the corresponding author upon reasonable request.
Rock samples and associated nannofossil samples used for the experiment are curated at the Collections de Géologie de l'Observatoire des Sciences de l'Univers de Grenoble (OSUG), with an appropriate UJF-ID number. OSUG-COLLECTIONS is a database of rocks, minerals, and fossils, https://web.collections.osug.fr (last access: 4 March 2026), OSUG, UGA. https://doi.org/10.17178/OSUG-COLLECTIONS.all (OSUG, 2021).
RC prepared the sample with inputs from BSM, FG, AK, and AFM, applied the image segmentation, co-developed the reconstruction code with AFM, and wrote the original draft. JCdS, JLH, and AK helped in the initial conceptualization of the experiment. MPA intensely contributed to the conceptualization of the segment model of the reconstruction. RC, RB, BSM, MD, AK, JP, FG, and AFM performed the experiments in the synchrotron radiation centre. FG and AFM jointly supervised RC in this work and acquired all the relevant funding. All the co-authors contributed significant inputs for the review and editing.
The contact author has declared that none of the authors has any competing interests.
Publisher's note: Copernicus Publications remains neutral with regard to jurisdictional claims made in the text, published maps, institutional affiliations, or any other geographical representation in this paper. The authors bear the ultimate responsibility for providing appropriate place names. Views expressed in the text are those of the authors and do not necessarily reflect the views of the publisher.
We acknowledge SOLEIL for providing access to synchrotron radiation on the SWING beamline through proposals 20211643 and 20221681. We are indebted to Isaline Demangel, Angela Fraguas, Jeremy Young, and an anonymous referee for their constructive comments on this work, and to the editor for improving its presentation.
This work was supported by the Tellus Program of CNRS-INSU, OSUG@2020, and IODP-France.
This paper was edited by Chiara Borrelli and reviewed by Jeremy Young, Angela Fraguas, Isaline Demangel, and one anonymous referee.
Aubry, M. P.: Remarques sur la systématique des Nannoconus de la craie, Cahiers de Micropaleontology, 4, ISBN 978-2-22201-737-0, 1974.
Aubry, M. P.: Cenozoic Coccolithophores: Braarudosphaerales, Atlas of Micropaleontology series Micropaleontology Press, New York, 336 pp., ISBN 978-0-9766734-4-4, 2013.
Aubry, M. P.: Biomineralization in the Calcareous Nannoplankton Phenotypic Expressions Across Life Cycles, Geometric Control on Diversification, and Origin, Minerals, 15, 322, https://doi.org/10.3390/min15030322 2025.
Beuvier, T., Probert, I., Beaufort, L., Suchéras-Marx, B., Chushkin, Y., Zontone, F., and Gibaud, A.: X-ray nanotomography of coccolithophores reveals that coccolith mass and segment number correlate with grid size, Nat. Commun., 10, 751, https://doi.org/10.1038/s41467-019-08635-x, 2019.
Bouché, P.: Eléments pour une définition d'un stratotype du Barrémien. Etat des connaissances sur les Nannofossiles calcaires du Crétacé inférieur, Mémoires du Bureau de Recherches Géologiques et Minières, 34, 451–459, 1965.
Bown, P. R.: Cenozoic calcareous nannofossil biostratigraphy, ODP Leg 198 Site 1208 (Shatsky Rise, northwest Pacific Ocean), in: Proceedings of the Ocean Drilling Program, scientific results, 1–44, http://www-odp.tamu.edu/publications/198_SR/104/104.htm (last access: 4 March 2026), 2005.
Bown, P. R.: Calcareous nannofossils from the Paleocene/Eocene Thermal Maximum interval of southern Tanzania (TDP Site 14), Journal of Nannoplankton Research, 31, 11–38, 2010.
Bown, P. and Cooper, M.: Jurassic, Calcareous nannofossil biostratigraphy, British Micropalaeontological Society Publication Series, 34–85, https://shorturl.at/teID7 (last access: 4 March 2025), 1998.
Bralower, T. J., Monechi, S., and Thierstein, H. R.: Calcareous nannofossil zonation of the Jurassic-Cretaceous boundary interval and correlation with the geomagnetic polarity timescale, Mar. Micropaleontol., 14, 153–235, 1989.
Brönnimann, P.: Microfossils incertae sedis from the Upper Jurassic and Lower Cretaceous of Cuba, Micropaleontology, 28–51, https://doi.org/10.2307/1484409, 1955.
Chowdhury, R.: Chemical and physical characterization of Nannoconus, the main planktonic bio-producer of carbonates in the cretaceous seas: insights into biomineralization processes, PhD Thesis, Université Grenoble Alpes, https://theses.hal.science/tel-05080049 (last access: 3 March, 2026), 2025.
Chowdhury, R., Fernandez-Martinez, A., and Giraud, F.: Code for the 3D submicron-scale skeletal reconstruction of Nannoconus, Zenodo [code], https://doi.org/10.5281/zenodo.14925063, 2025.
Covington, J. M. and Wise, S. W.: Calcareous nannofossil biostratigraphy of a lower Cretaceous Deep-sea fan complex: Deep-Sea Drilling Project Leg-93 Site-603, Lower Continental Rise, Initial Reports of the Deep Sea Drilling Project, 93, 617–660, 1987.
Derès, F. and Achéritéguy, J.: Contribution à l'étude des Nannoconidés dans le Crétacé inférieur du Bassin d'Aquitaine, Mémoires du Bureau de Recherches Géologiques et Minières, 77, 153–159, 1972.
Derès, F. and Achéritéguy, J.: Biostratigraphie des Nannoconides, B. Cent. Rech. Expl., 4, 1–53, 1980.
Dierolf, M., Menzel, A., Thibault, P., Schneider, P., Kewish, C. M., Wepf, R., Bunk, O., and Pfeiffer, F.: Ptychographic X-ray computed tomography at the nanoscale, Nature, 467, 436–439, https://doi.org/10.1038/nature09419, 2010.
Erba, E.: Nannofossils and superplumes: The Early Aptian “nannoconid crisis”, Paleoceanography, 9, 483–501, https://doi.org/10.1029/94PA00258, 1994.
Erba, E.: The first 150 million years history of calcareous nannoplankton: Biosphere–geosphere interactions, Palaeogeogr. Palaeocl., 232, 237–250, https://doi.org/10.1016/j.palaeo.2005.09.013, 2006.
Hagino, K., Tomioka, N., Young, J. R., Takano, Y., Onuma, R., and Horiguchi, T.: Extracellular calcification of Braarudosphaera bigelowii deduced from electron microscopic observations of cell surface structure and elemental composition of pentaliths, Mar. Micropaleontol., 125, 85–94, https://doi.org/10.1016/j.marmicro.2016.04.002, 2016.
Hart, M., Hylton, M., Oxford, M., Price, G., Hudson, W., and Smart, C.: The search for the origin of the planktic Foraminifera, J. Geol. Soc., 160, 341–343, 2003.
Hattner, J. G. and Wise, S. W.: Upper Cretaceous calcareous nannofossil biostratigraphy of South Carolina, South Carolina Geology, 24, 41–117 1980.
Henriksen, K., Young, J. R., Brown, P. R., and Stipp, S. L. S.: Coccolith biomineralisation studied with atomic force microscopy, Palaeontology, 47, 725–743, https://doi.org/10.1111/j.0031-0239.2004.00385.x, 2004.
Hoffmann, R., Kirchlechner, C., Langer, G., Wochnik, A. S., Griesshaber, E., Schmahl, W. W., and Scheu, C.: Insight into Emiliania huxleyi coccospheres by focused ion beam sectioning, Biogeosciences, 12, 825–834, https://doi.org/10.5194/bg-12-825-2015, 2015.
Jiang, W., Pacella, M. S., Athanasiadou, D., Nelea, V., Vali, H., Hazen, R. M., Gray, J. J., and McKee, M. D.: Chiral acidic amino acids induce chiral hierarchical structure in calcium carbonate, Nat. Commun., 8, 15066, https://doi.org/10.1038/ncomms15066, 2017.
Jiang, W., Pacella, M. S., Vali, H., Gray, J. J., and McKee, M. D.: Chiral switching in biomineral suprastructures induced by homochiral L-amino acid, Science advances, 4, eaas9819, https://doi.org/10.1126/sciadv.aas9819, 2018.
Jiang, W., Yi, X., and McKee, M. D.: Chiral biomineralized structures and their biomimetic synthesis, Mater. Horiz., 6, 1974–1990, 2019.
Kamptner, E.: Nannoconus steinmanni nov. gen., nov. spec., ein merkwürdiges gesteinsbildendes Mikrofossil aus dem jüngeren Mesozoikum der Alpen, Paläont. Z., 13, 288–298, 1931.
Kooistra, W. H., Gersonde, R., Medlin, L. K., and Mann, D. G.: The origin and evolution of the diatoms: their adaptation to a planktonic existence, Evolution of primary producers in the sea, 207–249, https://doi.org/10.1016/B978-012370518-1/50012-6, 2007.
Ky, F.: Convex sets and their applications, Argonne National Laboratory, https://books.google.fr/books?id=QKkrAAAAYAAJ (last access: 4 March 2026), 1959.
Lees, J. A. and Bown, P. R.: New and intriguing calcareous nannofossils from the Turonian (Upper Cretaceous) of Tanzania, Journal of Nannoplankton Research, 36, 83–95, 2016.
OSUG: OSUG-COLLECTIONS is a database of rocks, minerals and fossils, OSUG, UGA, https://doi.org/10.17178/OSUG-COLLECTIONS.all, 2021.
Perch-Nielsen, K.: Mesozoic calcareous nannofossils, in: Plankton Stratigraphy, edited by: Bolli H. M., Saunders J. B., and Perch-Nielsen K., Cambridge University Press, Cambridge, 329–426, ISBN 9780521367196, 1985.
Reinhardt, P.: Zur Taxionomie und Biostratigraphie des fossilen Nannoplanktons aus dem Malm, der Kreide und dem Alttertiär Mitteleuropas: mit 1 Tabelle, PhD Thesis, Dt. Verlag für Grundstoffindustrie, https://d-nb.info/457917237 (last access: 4 March, 2026), 1966.
Reza, A. M.: Realization of the contrast limited adaptive histogram equalization (CLAHE) for real-time image enhancement, J. VLSI Sig. Proc. Syst., 38, 35–44, 2004.
Reznikov, N., Buss, D. J., Provencher, B., McKee, M. D., and Piché, N.: Deep learning for 3D imaging and image analysis in biomineralization research, J. Struct. Biol., 212, 107598, https://doi.org/10.1016/j.jsb.2020.107598, 2020.
Schiebel, R. and Hemleben, C.: Planktic foraminifera in the modern ocean, Springer, https://doi.org/10.1007/978-3-662-50297-6, 2017.
Siesser, W. G. and Winter, A.: Coccolithophores, Cambridge University Press, ISBN 0-521-38050-2, 1994.
Stradner, H. and Grün, W.: On Nannoconus abundans nov. spec. and on laminated calcite growth in Lower Cretaceous nannofossils, Verhandlungen der Geologischen Bundesanstalt, 2, 267–283, 1973.
Suchéras-Marx, B., Giraud, F., Simionovici, A., Daniel, I., and Tucoulou, R.: Perspectives on heterococcolith geochemical proxies based on high-resolution X-ray fluorescence mapping, Geobiology, 14, 390–403, https://doi.org/10.1111/gbi.12177, 2016a.
Suchéras-Marx, B., Giraud, F., Lena, A., and Simionovici, A.: Picking nannofossils: How and why, J. Micropalaeontol., 36, 219–221, https://doi.org/10.1144/10.1144jmpaleo2016-013, 2016b.
Suchéras-Marx, B., Mattioli, E., Allemand, P., Giraud, F., Pittet, B., Plancq, J., and Escarguel, G.: The colonization of the oceans by calcifying pelagic algae, Biogeosciences, 16, 2501–2510, https://doi.org/10.5194/bg-16-2501-2019, 2019.
Toplak, M., Birarda, G., Read, S., Sandt, C., Rosendahl, S., Vaccari, L., Demšar, J., and Borondics, F.: Infrared orange: connecting hyperspectral data with machine learning, Synchrotron Radiation News, 30, 40–45, 2017.
Trejo, H.: La familia Nannoconidae y su alcance estratigrafico en America: Boletin de la Asociacion Mexicana de Geologos Petroleros, 12, https://shorturl.at/CljTB (last access: 4 March 2026), 1960.
Ueshima, R. and Asami, T.: Single-gene speciation by left–right reversal, Nature, 425, 679–679, 2003.
Van Niel, B.: A review of the terminology used to describe the genus Nannoconus (calcareous nannofossil, incertae sedis), Cahiers de Micropaléontologie, 9, 29–55, 1994.
Van Niel, B. E.: Early Cretaceous Nannoconus(calcareous nannofossil, incertae sedis) in NW Europe, University of London, University College London (United Kingdom), https://discovery.ucl.ac.uk/id/eprint/1317948 (last access: 4 March 2026), 1993.
Van Rossum, G. and Drake, F. L.: Python 3 Reference Manual, CreateSpace, Scotts Valley, CA, ISBN 1441412697, 2009.
Wakonig, K., Stadler, H.-C., Odstrčil, M., Tsai, E. H., Diaz, A., Holler, M., Usov, I., Raabe, J., Menzel, A., and Guizar-Sicairos, M.: PtychoShelves, a versatile high-level framework for high-performance analysis of ptychographic data, J. Appl. Crystallogr., 53, 574–586, 2020.
Walker, J., Marzec, B., Ozaki, N., Clare, D., and Nudelman, F.: Morphological development of Pleurochrysis carterae coccoliths examined by cryo-electron tomography, J. Struct. Biol., 210, 107476, https://doi.org/10.1016/j.jsb.2020.107476, 2020.
Walker, J. M., Greene, H. J. M., Moazzam, Y., Quinn, P. D., Parker, J. E., and Langer, G.: An uneven distribution of strontium in the coccolithophore Scyphosphaera apsteinii revealed by nanoscale X-ray fluorescence tomography, Environ. Sci.-Proc. Imp., 26, 966–974, https://doi.org/10.1039/d3em00509g, 2024.
Young, J. R. and Henriksen, K.: Biomineralization within vesicles: the calcite of coccoliths, Rev. Mineral. Geochem., 54, 189–215, 2003.
Young, J. R., Davis, S. A., Bown, P. R., and Mann, S.: Coccolith Ultrastructure and Biomineralisation, J. Struct. Biol., 126, 195–215, https://doi.org/10.1006/jsbi.1999.4132, 1999.
Young, J .R., Bown P. R., and Lees J. A.: Nannotax3 website, International Nannoplankton Association, https://www.mikrotax.org/Nannotax3 (last access: 29 September 2025), 2022.
Yu, S.-H., Cölfen, H., Tauer, K., and Antonietti, M.: Tectonic arrangement of BaCO3 nanocrystals into helices induced by a racemic block copolymer, Nat. Mater., 4, 51–55, 2005.
- Abstract
- Introduction
- The Nannoconus micalith
- Materials and Methods
- Results
- Discussion
- Conclusion
- Appendix A
- Appendix B: Glossary for different terms used in this publication
- Code availability
- Data availability
- Sample availability
- Author contributions
- Competing interests
- Disclaimer
- Acknowledgements
- Financial support
- Review statement
- References