the Creative Commons Attribution 4.0 License.
the Creative Commons Attribution 4.0 License.
 | 18 Mar 2026
Carbon soil stock change in an intensive crop field near Paris reveals significant carbon losses over a decade
Nicolas P. A. Saby
Bruna Winck
Maryam Gebleh
Pauline Buysse
Jean-Philippe Chenu
Céline Ratié
Claudy Jolivet
Carmen Kalalian
Florent Levavasseur
Jose-Luis Munera-Echeverri
Sébastien Lafont
Denis Loustau
Dario Papale
Giacomo Nicolini
Dominique Arrouays
Soil is a large pool of carbon (C), storing globally twice as much carbon as the atmosphere and three times as much as vegetation. Soil organic carbon (SOC) stocks are significantly impacted by land-use changes, either negatively when forests or grasslands are converted into crops or positively when the opposite occurs. This context underpins the “4per1000” initiative, which aims to promote SOC storage in soils as a mitigation strategy. However, intensive cropping and climate change may lead to losses of organic and inorganic carbon from soils, which calls for long-term observations of soil organic carbon stocks in reference ecosystems worldwide. To address this, a harmonised reference soil sampling protocol was developed for all ecosystem sites within the European Integrated Carbon Observing System (ICOS) research infrastructure, starting in 2017 with revisits planned every 5–10 years. This study presents a first case at the French cropland site FR-Gri (wheat–maize–barley–oilseed rape rotation), assessing SOC stock in 2019 with the ICOS protocol, which was combined with earlier SOC stock sampling data from the European project CarboEurope. A significant soil decompaction was observed over the 13.5 years in the 0–30 cm layer. Bulk density decreased by 22 % in the 0–5 cm layer (from 1.31 to 1.02 g cm−3) and by 5 % in the 5–30 cm layer (from 1.53 to 1.45 g cm−3), likely due to the adoption of reduced tillage since 2004. SOC content increased by 10 % in the 0–5 cm layer but declined by 6.2 % in the 5–30 cm layer. The SOC stocks based on equivalent soil mass (ESM) increased by 7.6 % in the 0–5 cm layer, but decreased by 11 % and 9 % in the 5–30 cm and 30–60 cm layers, respectively. Overall, the ESM-based SOC stock in the 0–60 cm layer decreased by approximately 0.95 ± 0.22 kg C m−2 (or 9 Mg C ha−1) between 2005 and 2019, corresponding to 0.65 % yr−1 relative to the initial SOC stock (∼ 11 kg C m−2 in the 0–60 cm layer). This leads to an average yearly decrease rate of 0.072 ± 0.017 kg C m−2 yr−1 (or 0.72 ± 0.17 Mg C ha−1 yr−1), consistent with previous studies. To further interpret this trend, we applied the soil carbon cycling model AMG to simulate soil carbon dynamics down to a 30 cm depth from 2005 onwards. Based on site-specific exports and imports and estimated residue returns, the model predicted a SOC stock decline larger than the observed one in the 0–30 cm depth, stabilising around 2028, assuming management stays the same in the future. By 2040, SOC stocks are projected to decline to 6.9 kg C m−2, representing an approximate 15 % reduction from the 2005 baseline. Furthermore, the AMG simulation was also consistent with the carbon flux balance reported by Loubet et al. (2011) for the period between 2006 and 2010. The observed decrease in SOC stocks may be attributed to a shift towards larger exports, lower residue returns, and reduced carbon imports at this site compared to past management practices. This study highlights the importance of high-quality SOC stock change monitoring, as developed within the ICOS research infrastructure.
- Article
(3706 KB) - Full-text XML
-
Supplement
(1559 KB) - BibTeX
- EndNote


Soil is one of the largest reservoirs of carbon (C) and nitrogen (N) in the terrestrial biosphere. Globally, soils store approximately 1500–2400 Gt of organic C (SOC) in the upper meter (Batjes, 1996; Sanderman et al., 2017) and a comparable amount as inorganic C to a depth of 2 m (Zamanian et al., 2021), far exceeding the carbon stored in the atmosphere and vegetation combined (Antón et al., 2021). Hence, minor changes in SOC stocks can have substantial impacts on atmospheric carbon dioxide (CO2) concentrations and climate feedbacks (Minasny et al., 2017).
Agricultural management is a major driver of SOC dynamics through its control of organic matter inputs, soil disturbance, and residue incorporation, in interaction with climate and soil properties (Paustian et al., 2016). Intensive farming practices, such as simplified crop rotations, frequent tillage, and high fertiliser use, have commonly been associated with SOC losses by accelerating organic matter decomposition and reducing C inputs to soils (Autret et al., 2016; Schmidt et al., 2011; Six et al., 2002). Conversely, management practices that enhance C inputs (mineral fertilisation, diversified crop rotation, cover crops, organic amendments) and reduce soil disturbance (reduced-tillage and no-tillage) have been shown to promote SOC accumulation or slow SOC losses (Lal, 2004; Poeplau and Don, 2015; Schmidt et al., 2011). Based on a review of practices, it has been hypothesised that generalising C storing practices could increase C sequestration in the upper metre of agricultural soils by 2 to 3 Pg C yr−1, which roughly corresponds to 4 per 1000 per year of the current C stock (Minasny et al., 2017). However, such estimates remain highly uncertain and variable in space, while major concerns remain on the persistence of soil carbon gains over time as soils approach a new equilibrium (Baveye et al., 2018; Franzluebbers et al., 2012).
In Europe, current bottom-up inventories show croplands as a net C source of 10 ± 9 g C m−2 yr−1, whereas grasslands and forests act as net C sinks of 57 ± 34 and 20 ± 12 g C m−2 yr−1, respectively (Schrumpf et al., 2011; Schulze et al., 2009). However, top-down estimates of terrestrial C budgets indicate that European terrestrial ecosystems are an overall sink of approximately −100 Tg C yr−1, but with considerable associated uncertainties of ±360 Tg C yr−1 (Petrescu et al., 2021). Accurately quantifying temporal changes in SOC stocks remains a significant source of uncertainty in terrestrial carbon budgets.
Reliable monitoring of SOC stocks requires accurate quantification of the bulk density (BD), the fine earth fraction (FE, the fraction of soil below 2 mm), and the carbon content, throughout the soil profile (Molteni and Corti, 1998), as well as a sufficiently dense sampling design to reduce uncertainty associated with spatial variability (Batjes, 1996). Bulk density measurements are often complex and time-consuming, particularly in rocky soils, and are therefore frequently estimated using pedotransfer functions (PTFs). However, the use of PTF-derived BD can introduce systematic bias, particularly when rock fragments (RF) are inadequately accounted for, or when circular predictors such as SOC content are used (Schrumpf et al., 2011; Xu et al., 2015). But bulk density can substantially vary over decades, in response to management practices, soil compaction and decompaction, erosion, and climate-driven soil processes such as wetting–drying cycles, freeze–thaw dynamics, and shrink–swell behaviour of clay soils (Hopkins et al., 2009). Because BD directly determines soil mass, such variations critically affect estimates of SOC stock over time.
To address this issue, Ellert and Bettany (1995) proposed the equivalent soil mass (ESM) method as an alternative to the fixed depth (FD) method for measuring SOC stock changes. In the FD method, SOC stock changes are evaluated at constant soil depths and can induce significant biases when BD varies over time (Beem-Miller et al., 2016). In the ESM approach, SOC stocks are evaluated for a constant soil mass per unit area, thereby compensating for changes in BD by adjusting the soil depth accordingly (Ellert and Bettany, 1995; von Haden et al., 2020; VandenBygaart and Angers, 2006; Wendt and Hauser, 2013). Differences between FD and ESM can represent up to 10 % of SOC changes and overwhelm variations caused by tillage and crop residue removal rates (Du et al., 2017; Xiao et al., 2020). As comparing SOC stocks on the same soil mass per unit area is recognised as a better practice than the FD approach, this methodology was included as the reference method by FAO and IPCC (FAO, 2019; IPCC, 2019).
Soil organic C stocks are key estimates within the Integrated Carbon Observation System (ICOS), a European Research Infrastructure Consortium (Heiskanen et al., 2022). As of 2025, ICOS includes 45 high-quality and standardised ecosystem sites (Class 1 and 2 stations), covering the diversity of European soils and ecosystems. Within ICOS, SOC stocks have been measured since 2017 and will be re-measured every 10 years to quantify changes in SOC stock over time. To ensure unbiased and robust estimates with a limited number of samples (Arrouays et al., 2018; Don et al., 2007; Saby et al., 2008), ICOS adopts a Design-Based (DB) approach (Brown, 1992; Collins, 1992) with randomly selected sampling points (Arrouays et al., 2018; Brus and de Gruijter, 1997; de Gruijter et al., 2006; Loustau et al., 2017). At each ICOS site the measured soil stock change over time can then be compared to the integrated CO2 fluxes at the site boundaries over that period, which comprise the net ecosystem productivity, imports to and exports from the site, and lixiviated fluxes (Aubinet et al., 2009; Ceschia et al., 2010; Loubet et al., 2011). Soil carbon cycling models such as DAYCENT (Parton et al., 1998), STICS (Brisson et al., 1998), RothC (Coleman and Jenkinson, 1996), or AMG (Clivot et al., 2019) are essential tools to understand further the observed SOC dynamics based on site-specific managements, and in particular exports, imports, and residue returns. Models are also key in providing long-term simulation of SOC stock dynamics and scenario analysis.
Given the 10-year resampling interval, evaluations of SOC stock changes entirely based on the ICOS protocol, will only become available starting from 2027. However, before ICOS, several European sites were sampled from 2005 to 2010 using a systematic grid-based sampling design within the EU CarboEurope project (Schrumpf et al., 2011), providing a unique opportunity to assess SOC stock changes, while explicitly addressing methodological challenges related to sampling design, bulk density variability, and SOC stock calculation approaches. At the Grignon ICOS ecosystem station (FR-Gri), a cropland site, SOC stock was measured in 2005 using a grid-based design and later in 2019, using the ICOS protocol. The objectives of this study are to (1) quantify SOC stock change between 2005 and 2019 at the FR-Gri station, (2) compare SOC stock changes estimates obtained using the equivalent soil mass and fixed depth approaches, (3) discuss the uncertainties related to these estimations, mainly those related to sampling design, and (4) compare the observed SOC stock changes with predictions from the AMG soil carbon model (Clivot et al., 2019) and with previously established carbon flux balance estimations at the same site by Loubet et al. (2011).
2.1 Study site
The study was conducted at the Grignon station, an ICOS ecosystem site (ICOS code FR-Gri, class 2 since 2021). It is a crop field of 19 ha located 40 km west of Paris, in northern France (48.9° N, 1.95° E; elevation 125 m) (Fig. 1). During the study period (2005–2019), the mean annual air temperature and rainfall were 11.2 °C and 586 mm, respectively. The site has a gentle north-eastward slope of approximately 1 %. Agricultural fields mostly surround the south and west of the study area. The surface soil (0–15 cm layer) is classified as silt loam, with a particle-size distribution of 98 g kg−1 sand, 713 g kg−1 silt, and 189 g kg−1 clay. The effective soil depth (A + B horizons) varies from approximately 0.4 m in the north-east to over 1 m in the south-west. Soils across the parcel exhibit calcic horizons, with average CaCO3 contents of 3 % in the 0–50 cm layer and 20 % in the 50–100 cm layer, and an alkaline soil pH of 7.6 (Table S1 in the Supplement). The OC content in the surface layers was around 20 g C kg as reported in 2011 (Loubet et al., 2011).
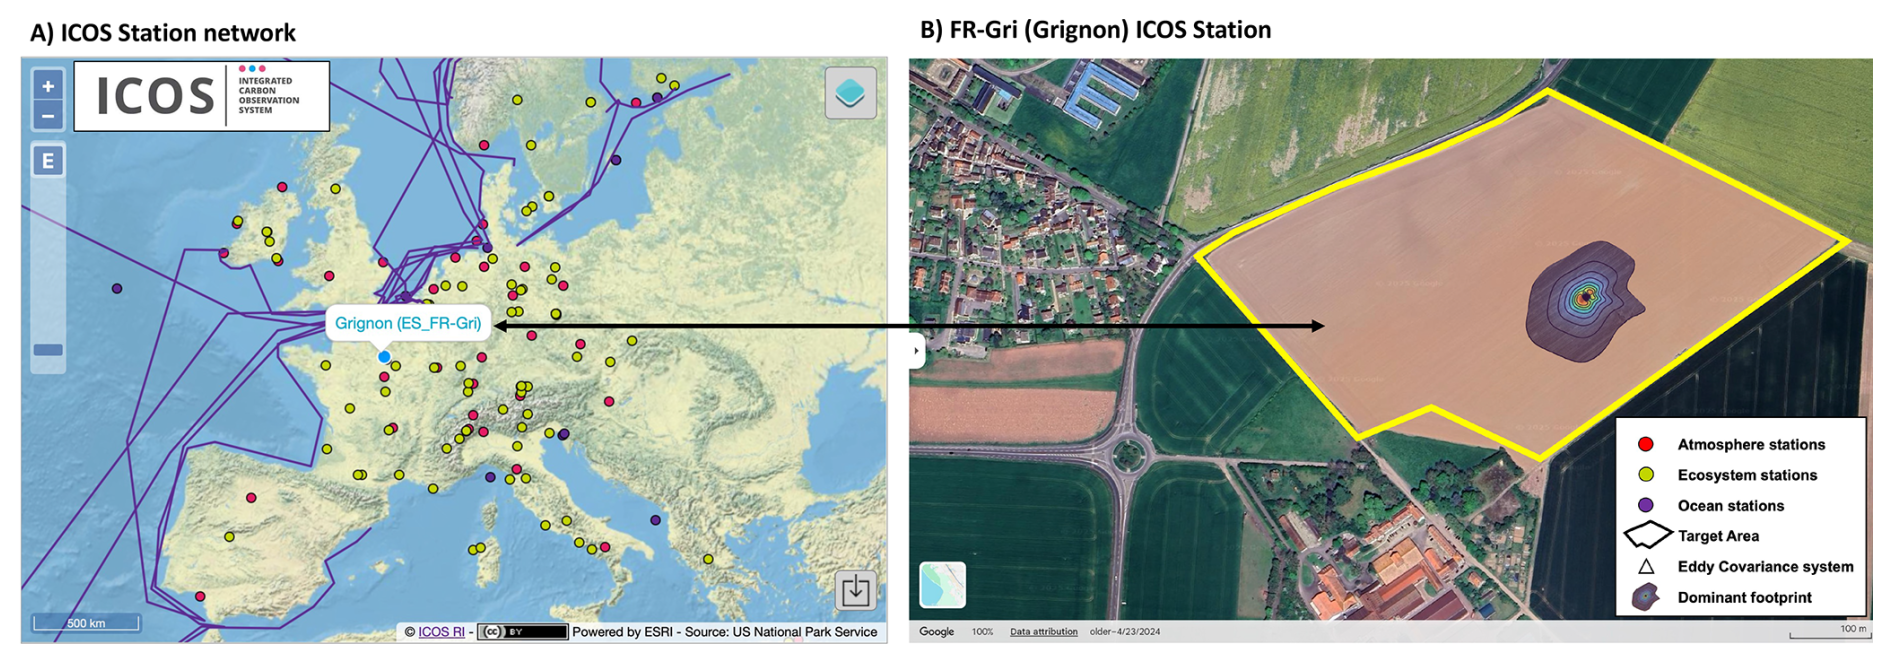
Figure 1(A) Map of the ICOS station network across Europe, showing atmosphere (red), ecosystem (green), and ocean (blue) stations. The Grignon site (FR-Gri) is highlighted. Sources: ESRI, TomTom, FAO, USGS; Powered by Esri. (B) The 19 ha field site at FR-Gri, shown in a Google Maps image, with the target area outlined in yellow. The eddy covariance system (white triangle) is located centrally, surrounded by its dominant flux footprint (shaded gradient area). The site, with a mixed farm with cattle and sheep housed in the southern buildings, has been cultivated for over 100 years, although the exact start year is unknown. The site was highly fertilised with sewage sludge in the 1980s. Imagery © Airbus, Map data © Google.
In 2004, as part of implementing reduced tillage in the crop rotation system, the soil was scarified to a depth of 50 cm to reduce compaction. Since then, most tillage operations have been restricted to the superficial layer (0–15 cm), using a stubble cultivator or a clod crusher. Two additional scarification events were carried out: one in 2010 (to a depth of 25 cm) and another in 2012 (to a depth of 40 cm). Additionally, the soil is disturbed to a depth of 5 or 10 cm during seeding operations.
The crops in the rotation system are winter wheat, silage maize (preceded by a mustard catch crop), and winter barley, with two years of oilseed rape during the period (Table 1). These crops are herbaceous, with C3 (wheat, barley, triticale, oilseed rape, mustard) or C4 (maize) plants. Crop production is primarily exported as grain or silage (maize), but residues are also exported for animal feed and bioenergy purposes. The average carbon export was 470 ± 54 g C m−2 yr−1 (Table 1). The field received regular applications of slurry and manure, with an average carbon input of 114 ± 13 g C m−2 yr−1. The average above-ground biomass crop residues left on the field were evaluated using the exported biomass and allometric coefficients (Clivot et al., 2019). They represent 151 ± 17 g C m−2 yr−1, approximately one-third of the exported carbon, which is slightly higher than the amount imported. The biomass of mustard was not measured but taken equal to the mean estimated biomass of mustard in France, −2 Mg DM ha−1 (Soleilhavoup and Crisan, 2021).
Table 1Crop rotation, yield, exports and imports, and nitrogen (N) applied over the 15 years between the two sampling campaigns at the FR-Gri site. Carbon export was evaluated based on the farmer's record of grain, straw, and silage exports. The aerial crop residue return was evaluated based on the exports and the allometric coefficient of the AMG model, as explained in the manuscript. A 0.44 g C g−1 dry biomass carbon content was assumed to compute the exports and imports. Organic nitrogen was mainly cattle slurry and, on a few occasions, manure. Mineral fertilisation was mainly urea-ammonium-nitrate.
2.2 Soil sampling schemes
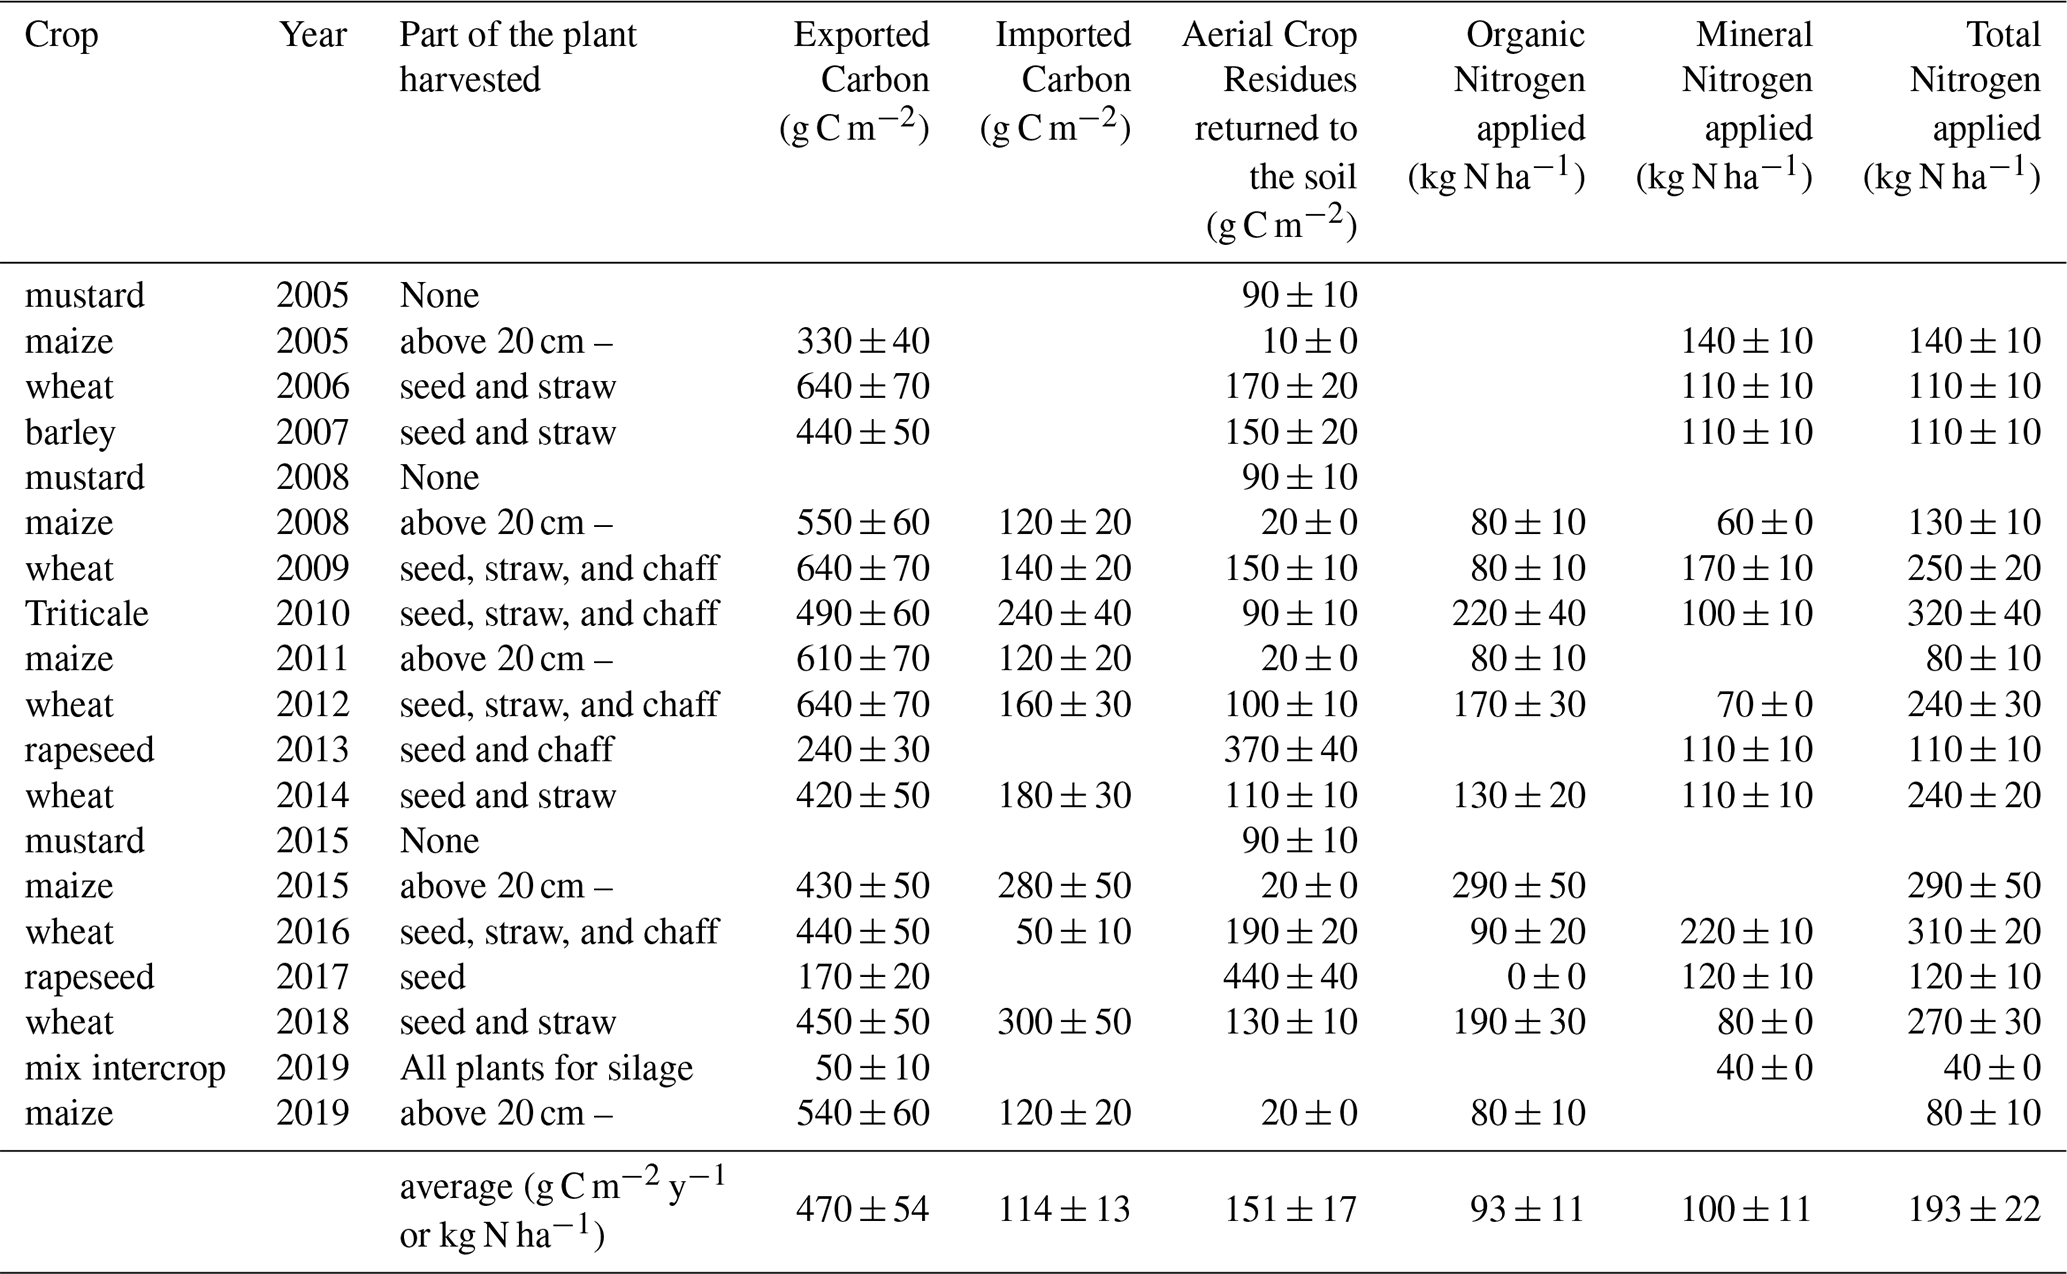
The two campaigns were conducted in different areas around the eddy covariance system. The 2005 campaign focused on an area representative of the eddy covariance mast's maximum footprint, while the 2019 campaign encompassed the entire 19 ha field. The footprint determined using the Kljun approach (Kljun et al., 2004, 2015) was well within the 19 ha field (Fig. 1), except for some stable nights when it extended into the surroundings. Two different soil sampling strategies were employed during the 2005 and 2019 campaigns (Fig. 2). In the 2005 campaign, 100 soil cores were taken using a systematic sampling grid (7 × 7 m), and samples were collected with both 8.3 and 8.7 cm inner diameter corers in December 2005, during winter wheat dormancy. Soil cores were divided into seven layers (0–5, 5–10, 10–20, 20–30, 30–40, 40–50, and 50–60 cm). The 2005 campaign results were reported in Schrumpf et al. (2011). In the 2019 campaign, 99 soil samples (20 locations × 5 depths − 1) were collected in March, following the ICOS protocol (Arrouays et al., 2018; Loustau et al., 2017), which consists of a stratified simple random sampling design. One sample, located between 60 and 100 cm, was not reachable due to the high rock density. The field was at that time covered with a mix of catch crops (oats, field bean, pea, clover, and flax). The studied area was divided into 10 geographically compact equal-area strata (Walvoort et al., 2010). Within each stratum, two primary sampling points (SP-I) were randomly selected (simple random) for a total of 20 SP-I plots. At each SP-I, five secondary sampling points (SP-II) were randomly selected within a buffer area of 10 m, where the soil was sampled using a 5.5 cm inner diameter corer. Each core was separated into sub-samples at depths of 0–5, 5–15, 15–30, 30–60, and 60–100 cm. Finally, cores were mixed to form a composite sample at each primary location and each layer. The spatial stratification and sampling point distribution were performed using the R package “spcosa” (Walvoort et al., 2010). To ensure comparability between the 2005 and 2019 sampling campaigns, all SOC stock change analyses presented in this study was restricted to a spatially comparable subset of the field exhibiting similar pedological properties in 2005 and 2019 (Fig. S4in the Supplement). A detailed spatial comparison between the two sampling campaigns, including clustering analyses and sensitivity tests across different spatial subsets, is provided in the Supplement (Figs. S1–S5).
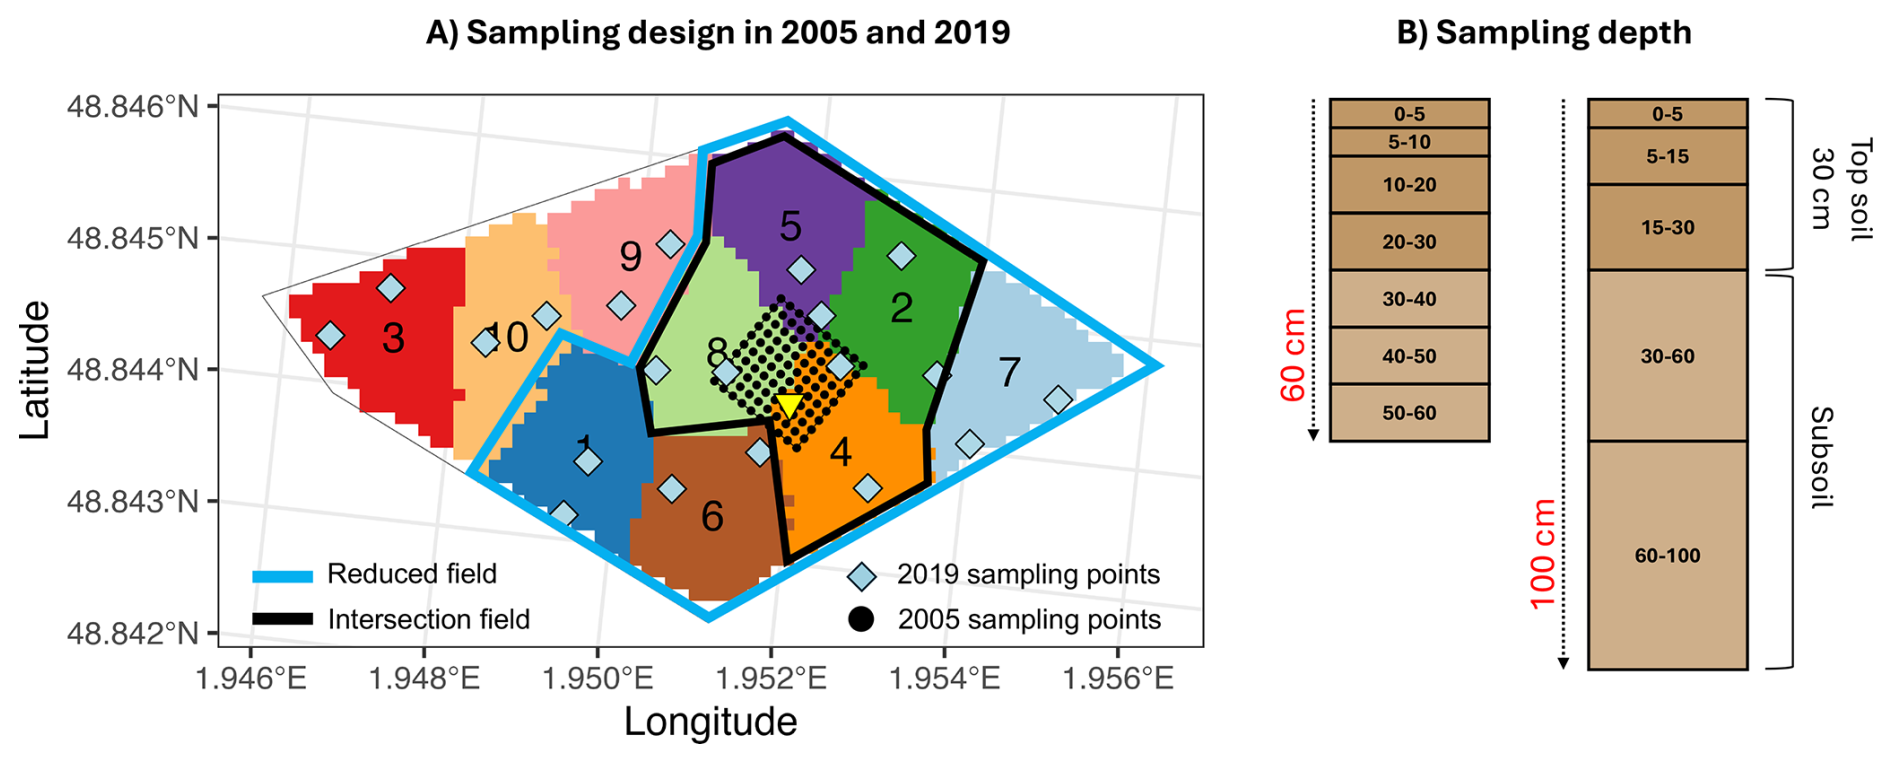
Figure 2(A) Map of the study area showing the spatial distribution of sampling zones and soil core depth segmentation. Soil sampling was conducted at two times: in 2005 (black circles) and 2019 (blue diamonds). For the 2019 sampling, the field was stratified into 10 strata (coloured polygons, labelled 1–10), and the sampling points were randomly located within each stratum. The 2005 sampling followed a grid-based sampling design that partially covered strata 2, 4, 5, and 8, with the majority of the sampling concentrated in strata 8 and 4. Blue polygon represents the “Reduced field” and black polygon the “Intersection field”. (B) Segmentation of soil cores into depth intervals for two different sampling protocols: 60 cm cores (six layers: 0–5, 5–10, 10–20, 20–30, 30–40, and 50–60 cm) and 100 cm cores (five layers: 0–5, 5–15, 15–30, 30–60, and 60–100 cm). Latitude and longitude are shown in WGS 84 coordinates.
2.3 Soil samples preparation and analyses
In the 2005 campaign, all soil samples were preserved at 4 °C before processing. The coarse fraction – rock (RF) (∅ > 4 mm) and root fractions (∅ > 1 mm) – were separated from the samples and subsequently air-dried at 40 °C. The remaining samples were sieved to < 2 mm to obtain the fine earth (FE) fraction and the coarse fraction (> 2 mm). Subsequently, each fraction was weighted (Schrumpf et al., 2011). In the 2019 campaign, samples from SP-II plots were air-dried at 30 °C and then sieved to separate the FE fraction (< 2 mm). The root and rock fractions were oven-dried at 70 and 105 °C, respectively, before weighing. Subsequently, the FE fraction from each depth interval of the five SP-II plots was proportionally mixed (based on the weight contribution of each layer) to create a composite sample (SP-I). The BD, residual water and FE fraction were computed from the SP-II samples, then averaged at the SP-I level, and the C content was measured on the SP-I composite samples. See Arrouays et al. (2018) and ICOS protocol (Loustau et al., 2017) for more information. In both campaigns, the FE fraction was then split into three subsamples to measure the C content (air-dried sample), residual water (after drying at 105 °C) and soil bulk density (BD). Soil organic carbon (SOC) content (C, g kg−1) was determined in the air-dried FE fraction by dry combustion (ISO 10694), which measures the total carbon content in the soil. Overall, the soil preparation and analysis methods used in 2005 and 2019 were very similar. Carbonate (CaCO3, g kg−1) was measured by determining the loss of carbon dioxide (CO2) after acidification with hydrochloric acid in 2019. The inorganic carbon content was also determined in 2019: when CaCO3 content was lower than 700 g kg−1, the soil inorganic carbon (SIC) content was calculated as C = 0.12 × CaCO3. When the CaCO3 content exceeded 700 g kg−1, to avoid a deterioration in the accuracy of organic carbon deduced from total carbon, samples were first treated with HCl to eliminate carbonates, and then total carbon was determined as previously explained. The SOC content was then computed as the total carbon content minus the inorganic carbon content.
2.4 Soil data pre-processing
Before statistical analysis, missing values in the 2005 dataset were imputed using Ordinary Kriging interpolation (Goovaerts, 1997), which leverages spatial autocorrelation to provide unbiased and minimum variance estimates of missing data points. Using spatial coordinates, the target variables were estimated based on interpolated values derived from a fitted variogram model (Nugget + Spherical) and up to 35 neighbouring data points within a 100-unit radius. For the 2019 dataset, which had only a single missing value, we used the average value of the corresponding soil layer.
2.5 Soil carbon stocks calculation using the fixed-depth (FD) approach
The soil carbon stock SOCstock (kg C m−2) across the soil layers was calculated following Poeplau et al. (2017):
where n is the number of layers in which the soil core was divided down to 60 cm, i is the layer index, (g) is the mass of fine earth in the layer, and (g) is the total soil mass of the layer (including rocks and roots), BDi (g cm−3) is the bulk density of the layer, Δzi is the layer thickness (cm), and SOCi (g C kg−1) is the SOC content in the FE fraction in the layer. The factor of converts SOC content from g kg−1 to kg kg−1, and the factor of 10 000 converts cm−2 to m−2. The bulk density in each soil layer is defined as the ratio of to the soil core volume :
where Si is the sampled surface. Equations (1) and (2) correspond to Eqs. (1) and (2) in Schrumpf et al. (2011) and were used to compute the stocks for the 2005 samples. We note that when combining Eqs. (1) and (2), the mass of soil and the layer thickness Δzi disappear. In the ICOS stock calculation protocol, the bulk density is therefore no longer used. The SOC stocks are computed based on the surface sampled Si and the mass of fine earth only. By further simplifying the converting factors, one gets:
In Eq. (3), a term can be identified as the fine earth in each layer, FEi = (kg m−2), which gives the fine earth over the 0–60 cm profile:
We note here that these equations are adapted for core sampling. When sampling soils with pits, some corrections need to be introduced in Eqs. (1)–(3) to account for large stones and large roots in the pit. The inorganic carbon stock SICstock is computed in a similar way as the SOCstock but replacing the OC content in the FE fraction SOCi by the inorganic carbon content SICi. Finally, the cumulative SOC was computed after summing the stocks per layer.
2.6 Harmonisation of soil layers in both sampling campaigns
To ensure comparability between campaigns, the soil sampling depth (Fig. 2) of each campaign was harmonised into three coarser layers: 0–5, 5–30, and 30–60 cm. Bulk density, rock fragments, and carbon content were aggregated using a thickness-weighted mean to account for variable layer depths, while SOC stocks and fine earth mass were calculated as cumulative sums across the respective layers. All subsequent SOC stock calculations and statistical analyses were performed on these layers. Additional layers are provided in the Supplement.
2.7 Soil carbon stocks calculation using the equivalent soil mass (ESM) and SOC stocks changes
To properly estimate SOC stocks evolution, one needs to consider changes in SOC content of the soil (SOC) but also the potential changes in BDi due to compaction or decompaction, which may change the fine earth mass FEi in each sampling depth (Lipiec and Hatano, 2003). Additionally, soil erosion driven by rainfall or wind can export soil particles – mainly silt and clay – out of the field. Erosion is thought to be negligible at the FR-Gri site due to a slight slope and systematic winter inter-cropping. Decompaction may have happened since the site was converted to reduced tillage from 2000 onwards (Loubet et al., 2011), but compaction in subsoil may also occur due to repeated surface traffic by heavy machinery (Liebhard et al., 2025; Lu et al., 2021). To consider possible changes in BDi, the SOC stock evolution was estimated using the equivalent soil mass method (ESM), where the SOC stock is integrated down to a varying depth corresponding to a reference soil mass that is set equal for each campaign (Ellert and Bettany, 1995; von Haden et al., 2020; Lee et al., 2009; Wendt and Hauser, 2013). This approach has the advantage of accounting for a common sampling bias with the hydraulic corer, which is soil compaction.
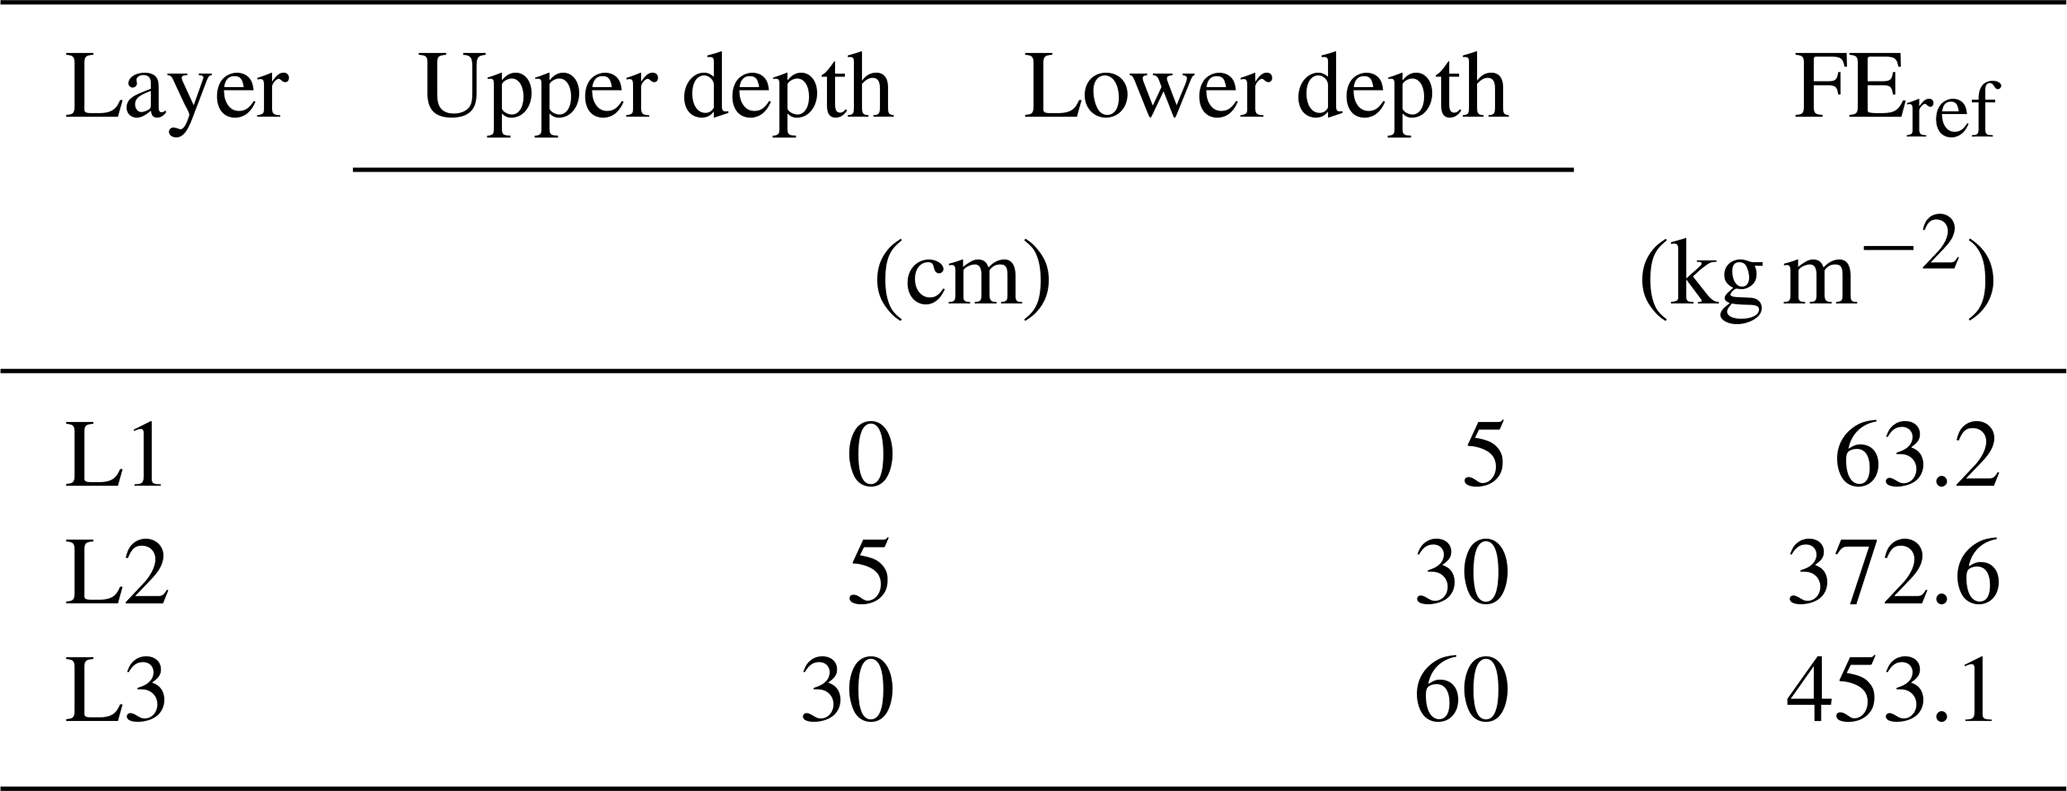
The ESM-based SOC stock was computed using the R function “SimpleESM” (Ferchaud et al., 2023), which implements the classical ESM method (Ellert and Bettany, 1995) and ESM2, a model-based approach incorporating cubic splines (Wendt and Hauser, 2013). The reference fine earth mass (FEref) was derived from the median values in the 2005 dataset for the aggregated soil layers: 0–5, 5–30, and 30–60 cm (Table 1). The total FE in the 0–60 cm layer ranged from 852 to 967 kg m−2 in 2005, and from 831 to 953 kg m−2 in 2019 (Table S4).
In the “classical” ESM approach (Ellert and Bettany, 1995), SOC stock is calculated by 1 mm increments (Autret et al., 2016; Mary et al., 2020). In brief, soil depth is discretised into elementary layers of 1 mm thickness, with FE density (g cm−3) and carbon content (g kg−1) assigned to each 1 mm layer. Since both FE density and the SOC content are typically reported as average values over macro-layers (e.g., 0–5 cm), these values are assumed to be constant within each 1 mm sublayer. Subsequently, FEi and SOC are then computed cumulatively until the FEref is reached. This approach is referred to as “ESM non model” by Peng et al. (2024). The ESM2 approach is based on the “material coordinate system” (Lee et al., 2009; McBratney and Minasny, 2010) or the “cumulative coordinates approach” (Rovira et al., 2015). This method uses a post hoc model – a cubic spline interpolation – to mathematically adjust SOC measurements to a common fine earth mass (von Haden et al., 2020; Wendt and Hauser, 2013). As both ESM and ESM2 methods yielded similar results (Fig. S6), only ESM outcomes are reported in the following.
2.8 Statistical inference for assessment of the carbon stock change
Unequal variance t tests (Welch's t test) were applied to assess significant differences between the two campaigns' means of SOC stocks estimated by FD and ESM approaches and other soil variables. The Welch's t-test value was calculated as:
where is the estimated mean of the soil property X, is the estimated sampling variance of the estimated mean, and indexes stand for the campaign years. A design-based approach was used to estimate the means and sampling variances (de Gruijter et al., 2006). The sampling variances of the two campaigns were estimated separately and considered unequal. For the 2019 campaign, a stratified random sampling with equal area strata was used. With the same number of sites per stratum, the mean and the sampling variance are estimated as:
where Xi is the measured soil property at location i, N is the total number of samples over all strata, is the sampling variance of stratum h, = is the weight of stratum h, and H is the number of strata.
For systematic random sampling (2005 campaign), the mean estimate is simple (Eq. 6), but there is no unbiased estimate of the sampling variance. We implemented the approximation suggested by Brus and Saby (2016), where the systematic random sample is treated as a stratified simple random sample. The sampling units were thus clustered by 2 based on their spatial coordinates into H = clusters (n = 100) using a k-means algorithm. The 2 sampling units of a cluster were treated as a simple random sample from a stratum, and the variance was estimated with Eq. (7) with H = 50. The weights were computed by = , where nh = 2 is the number of units per cluster. The 95 % confidence interval is given by:
where is the 2.5 quantile of a t distribution where (N−H) approximates the degrees of freedom. For the 2005 campaign, degree of freedom N−H = 100 − 50 = 50. In 2019, when the Complete field was considered, there were H = 10 strata of 2 units each, leading to a total number of sampling points N = 20 (called SP-I in ICOS), leading to N−H = 10. When part of the field was considered, both the number of samples and H diminished leading to N−H < 10. In 2005 and 2019, Eqs. (7)–(9) where used to compute the carbon stock statistics for each sampling depth available and over aggregated layers 0–15, 15–30, and 30–60 cm. We also computed the minimum detectable difference (MDD) based on a t test with 95 % confidence and 90 % power (α = 0.05, β = 0.10).
Finally, we performed an additional statistical analysis to quantify the magnitude of SOC stock changes between 2005 and 2019 by calculating effect sizes using Hedges' g. This metric is a standardised mean difference method that includes a correction for small sample sizes (Hedges, 1981), which was especially the case when using the Reduced and Intersection fields, leading to 14 and 8 samples, respectively. Confidence intervals for effect-size estimates were computed using 20000 nonparametric bootstraps with resampling and the bias-corrected and accelerated (BCa) method (Canty et al., 2024; Efron, 1987; Kirby and Gerlanc, 2013). Negative values of Hedges' g indicate a reduction in SOC stocks from 2005 to 2019, while positive values indicate an increase. If the confidence intervals (CIs) include zero, it suggests that there is no significant difference in SOC stocks between the two sampling years. These analyses were performed using the R package “bootES” (Kirby and Gerlanc, 2013).
See Eqs. (S1)–(S5) in the Supplement.
2.9 Simulation of carbon stock evolution with the AMG model
We computed the SOC stock changes using the agricultural soil carbon model AMG (Clivot et al., 2019) to compare with measured changes in SOC stock in the surface soil layer (0–30 cm). AMG is a relatively simple soil carbon model that simulates SOC stocks by partitioning the soil carbon into three pools: (1) a pool receiving organic C inputs from crop residues, roots, and exogenous organic matter (EOM), (2) an active organic C pool subject to decomposition, and (3) a stable organic C pool. As stable C presents slow turnover, considering the timescale of the simulation, this pool is considered inert in the model and does not decompose nor receive new C inputs.
A proportion (ha) of all the C inputs to the soil is allocated to the active C pool, while the remaining proportion (1 − ha) is considered mineralised. The active C pool decomposes following first-order kinetics, with a rate constant k that depends on climate variables (annual temperature, precipitation, potential evapotranspiration) and soil properties (clay content, carbonate content, pH, and C : N ratio). The C inputs to the soil include aboveground crop residues and organic amendments from manure and slurry as listed in Table 1, plus the belowground crop residues and rhizodeposition estimated from allometric equations based on the aboveground biomass (Clivot et al., 2019, 2023). Roots and rhizodeposition C inputs down to a considered depth i are computed as:
where DMAG is the above-ground biomass, SRR is the shoot-to-root-ratio, 0.4 is the carbon content of the roots (40 %), 1.65 is a factor accounting for the dead roots and rhizodeposition, assumed to be 65 % of the living roots C, and (1−βi) accounts for the roots' distribution in the soil, where β is a crop-dependent parameter.
The SOC stock changes were simulated on an annual timestep over the period 2005–2040, considering the 0–30 cm depth layer, which generally corresponds to the managed soil layer in cropland systems, where most crop roots and residue inputs occur. The baseline SOC stock in the 0–30 cm layer was set to 8.25 kg C m−2, based on measurements from 2005. The proportion of stable organic carbon pool was set to 65 % (Cs = 0.65), as Clivot et al. (2019) proposed for agricultural fields with a long-term history of cultivation. To assess model sensitivity, we performed additional simulations by varying key management and environmental factors and comparing to a base scenario: (1) residue returns to the soil were increased to 100 % of the available residues, (2) organic amendments were either eliminated (set to zero) or doubled (multiplied by two), (3) meteorological conditions were set to the pre-2005 period by repeating the 1987–2004 weather data for the 2005–2040 period, and (4) the proportion of stable organic carbon pool (Cs) was set to 0.63 and 0.75 as independent estimates on a nearby soil reported by Kanari et al. (2022) to illustrate the model's response to this critical soil carbon parameter. In the base scenario, (1) the residue returns and (2) the organic amendments were set according to Table 1, (3) the meteorological conditions were those measured at the site between 2005 and 2019, and then repeated to 2040, and (4) Cs was set to 0.65.
2.10 Carbon flux balance derived from Eddy Covariance measurements
The carbon flux balance was estimated from 2006 to 2010 in Loubet et al. (2011), based on the Eddy Covariance (EC) micrometeorological method. The net biome productivity (NBP), representing the carbon balance of the field, was computed as:
where NEE is the net ecosystem exchange of CO2 flux over time, Forga.fert is the carbon input through organic fertilisation, Fseeds is the carbon input through seedling, Fleach is the organic and inorganic carbon losses by lixiviation, and Fharvest is the carbon export through harvest. See Loubet et al. (2011) for details. We limited the carbon balance study to the 2006–2010 period published in Loubet et al. (2011). Indeed, computing the full period 2005–2019 carbon balance requires filling a year gap in 2018 and processing the leaching flux, which implies crop and leaching modelling, as well as an uncertainty analysis that goes beyond the scope of this manuscript.
3.1 Summary statistics of soil properties
Statistical analysis confirmed a significant decompaction from 2005 to 2019, evidenced by a reduction in bulk density, particularly in the 0–5 cm (p < 0.001) and 5–30 cm (p < 0.001) layers (Fig. 3, Table S5). BD decreased by ∼ 25 % in the 0–5 cm layer and by ∼ 5 % in the 5–30 cm layer, while the 30–60 cm layer presented a slight but non-significant increase. Similar results were observed for the fine earth density (Table S4). For the entire 0–60 cm profile, the average soil stock (FE0−60 cm) in 2005 was 882.5 kg m−2, which was about 5 % greater than in 2019 (840.1 kg m−2), while the soil mass in the 0–5 layer decreased by approximately 25 %. The SOC contents varied from 2005 to 2019 (Fig. 3, Table S5). In the 0–5 cm layer, SOC contents were significantly higher in 2019 than in 2005 by around 2.2 ± 0.57 g C kg−1 (p = 0.002). In contrast, SOC content in the 5–30 cm layer was significantly lower by 6.2 % in 2019 compared to 2005, with a mean difference of −1.14 ± 028 g C kg−1 (p < 0.001). In the 30–60 cm layer, SOC contents remained statistically unchanged −0.14 ± 0.31 g C kg−1, p = 0.66).
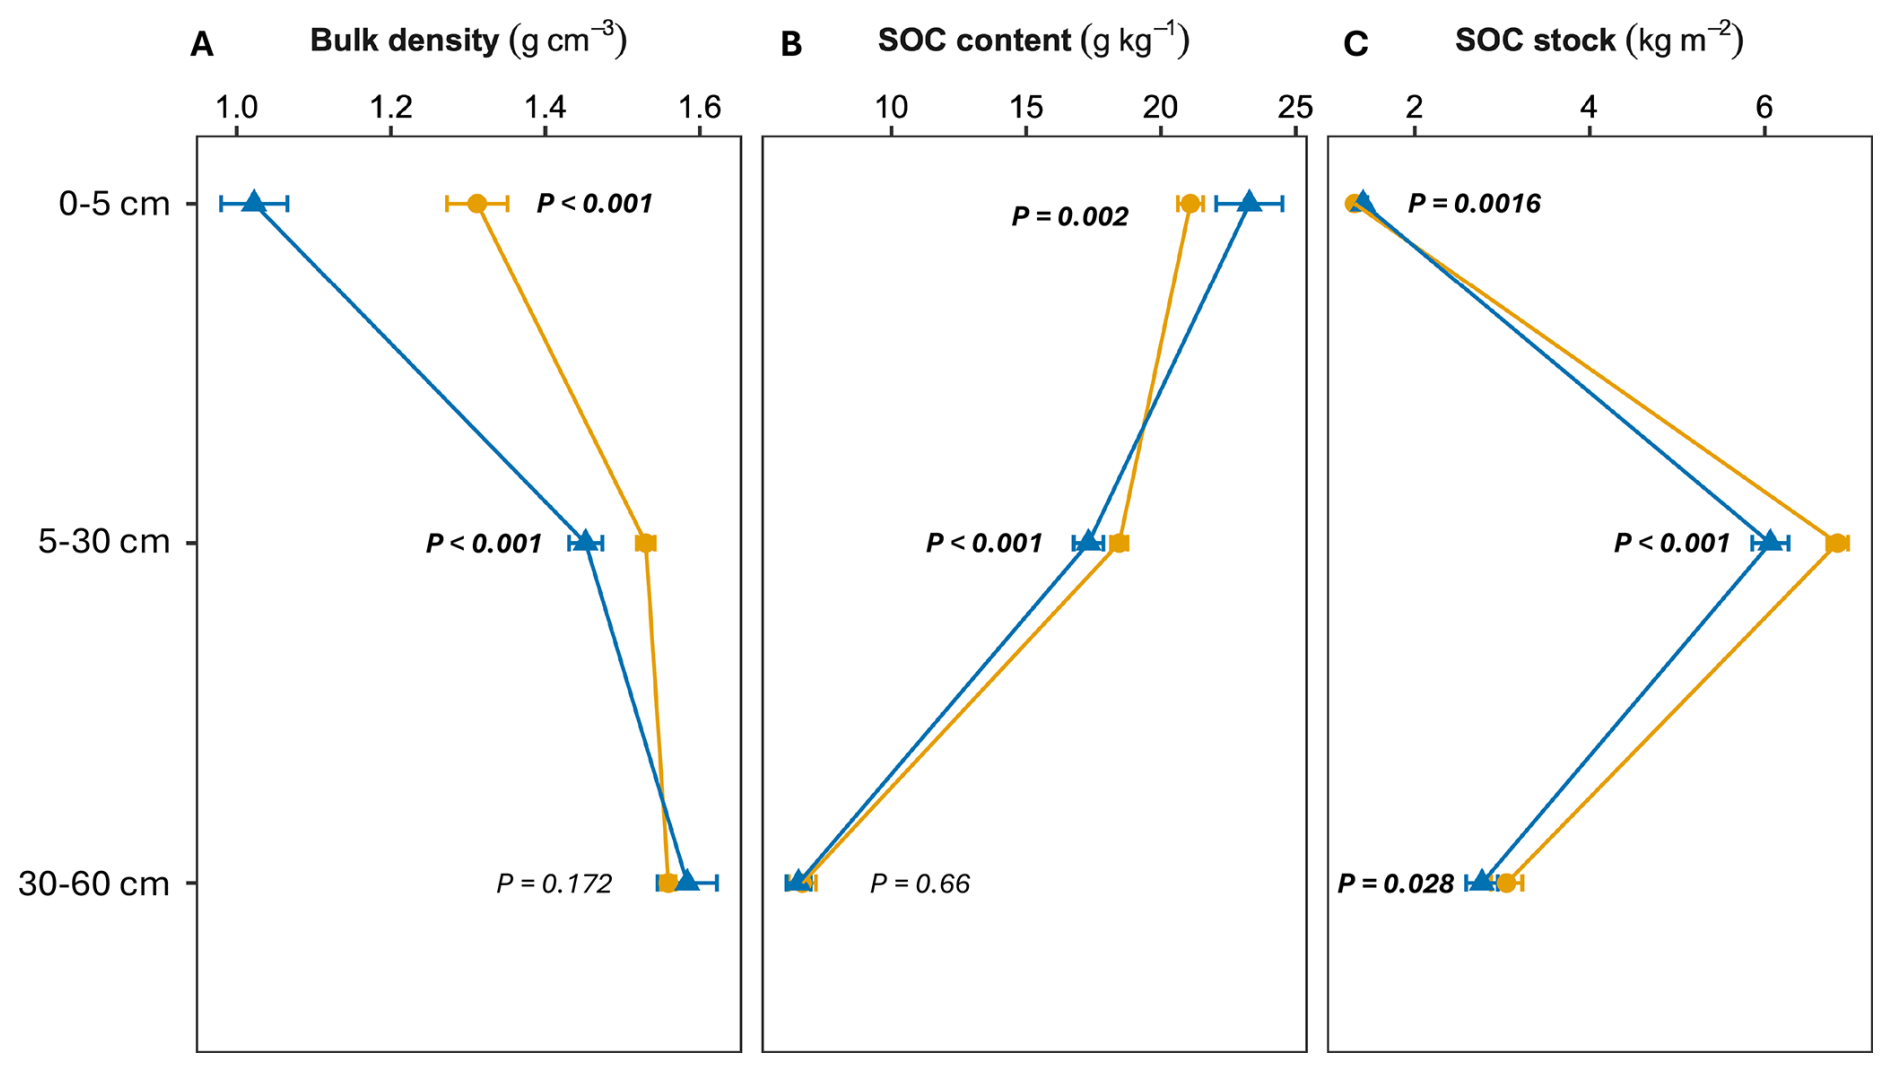
Figure 3Mean of bulk density, soil organic carbon (SOC) contents, and ESM-based SOC stocks with their corresponding confidence intervals (CIs) in the 2005 and 2019 campaigns across three soil layers (0–5, 5–30, 30–60 cm). Mind that the layer depths given here do not correspond to real depths since the ESM method implies varying depths with time. The mass-equivalent depths of SOC stocks are shown in Fig. 5B.
3.2 Differences between FD and ESM-based SOC stocks
FD and ESM approaches were statistically similar in 2005 across the three soil layers (Fig. 4A), and only significantly different in 0–5 cm soil layer in 2019 (Fig. 4B). Both approaches did not differ when comparing the cumulative SOC stocks up to ∼ 60 cm (all p > 0.5, Fig. 4C–D).
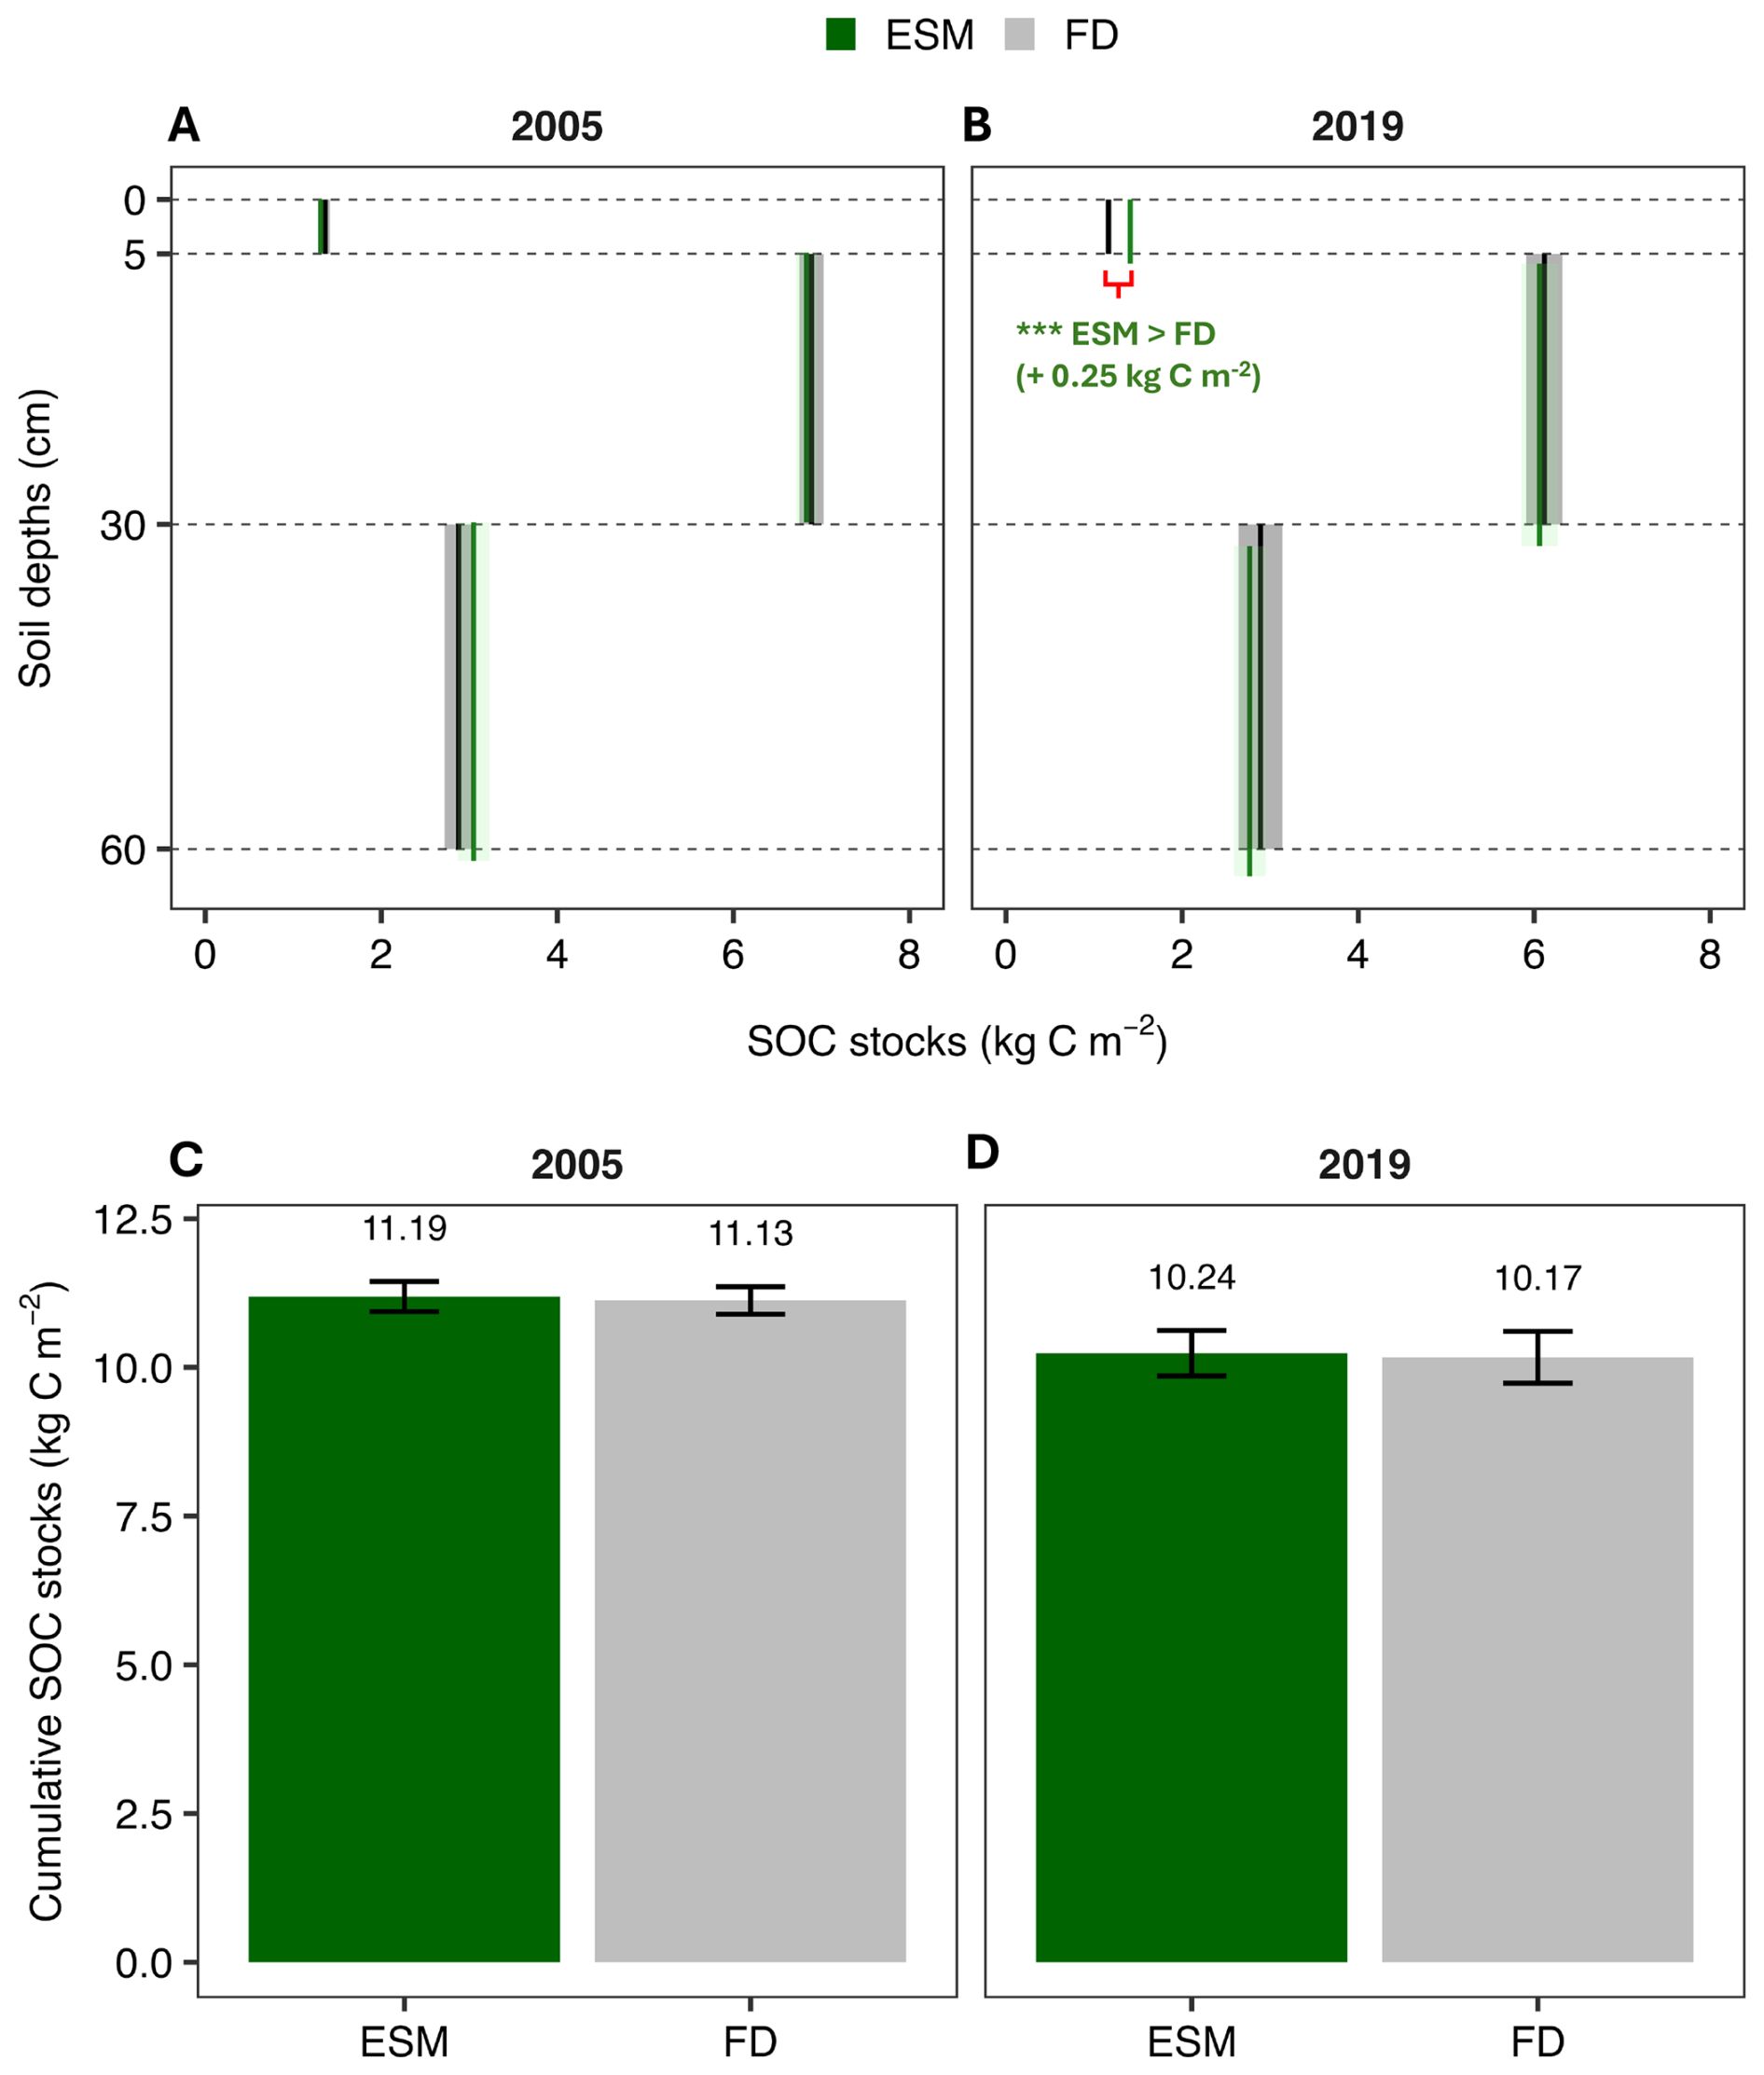
Figure 4Soil Organic Carbon stocks and corresponding confidence intervals (error bars and shaded ribbons) estimated using Fixed Depth (FD) and Equivalent Soil Mass (ESM) approaches. Panels (A) and (B) show SOC stocks per depth range for 2005 and 2019. Solid lines (vertical) represent mean SOC stocks across the entire depth range. Dashed horizontal grey lines represent the fixed soil depth layers aggregated into 0–5, 5–30, and 30–60 cm. If the thickness of the ESM-adjusted depth falls outside the upper or lower bounds of the fixed soil depth, it indicates that a depth adjustment was made during the ESM computation. Panels (C) and (D) show cumulative SOC stocks over the 0–60 cm layer for 2005 and 2019. Asterisks denote significant differences between SOC stocks estimate methods: p < 0.001 ().
3.3 Soil carbon stock changes over time
The mass-equivalent depth (Fig. 5B) varied between years according to the reference soil mass shown in Table 2. On average, the mass-equivalent depths in 2019 were 0–6, 6–33, and 33–65 cm. In 2005, the soil depth adjustment was minimal compared to the sampling depth, with an increase of 2 ± 0.7 cm in the third layer (30–62 cm). The ESM estimates indicated a cumulative loss of soil organic carbon over the three layers of −0.95 ± 0.20 kg C m−2 between 2005 and 2019 (Fig. 5A). In the first layer 0–5 cm layer a higher SOC stock was measured in 2019 compared to 2005 (+0.10 ± 0.02 kg C m−2). The second layer (sampling depth of 5–30 cm) showed a lower SOC stock in 2019, with a SOC stock changes of about 0.8 ± 0.10 kg C m−2. In the deeper layer (sampling depth of 30–60 cm), SOC stock changes showed a less significant reduction of about 0.28 ± 0.11 kg C m−2. Effect-size comparisons between the two campaigns across the three layers confirmed the significance of the SOC changes between 2005 and 2019 (Fig. S8). A finer vertical analysis (Fig. S9) indicates that the SOC stocks in 2019 were higher in the layer L1 (∼ 0–5 cm), then decreased between layer L3 and L5 (∼ 20 and ∼ 40 cm), before increasing again in layers L6 and L7 (∼ 40–60 cm).
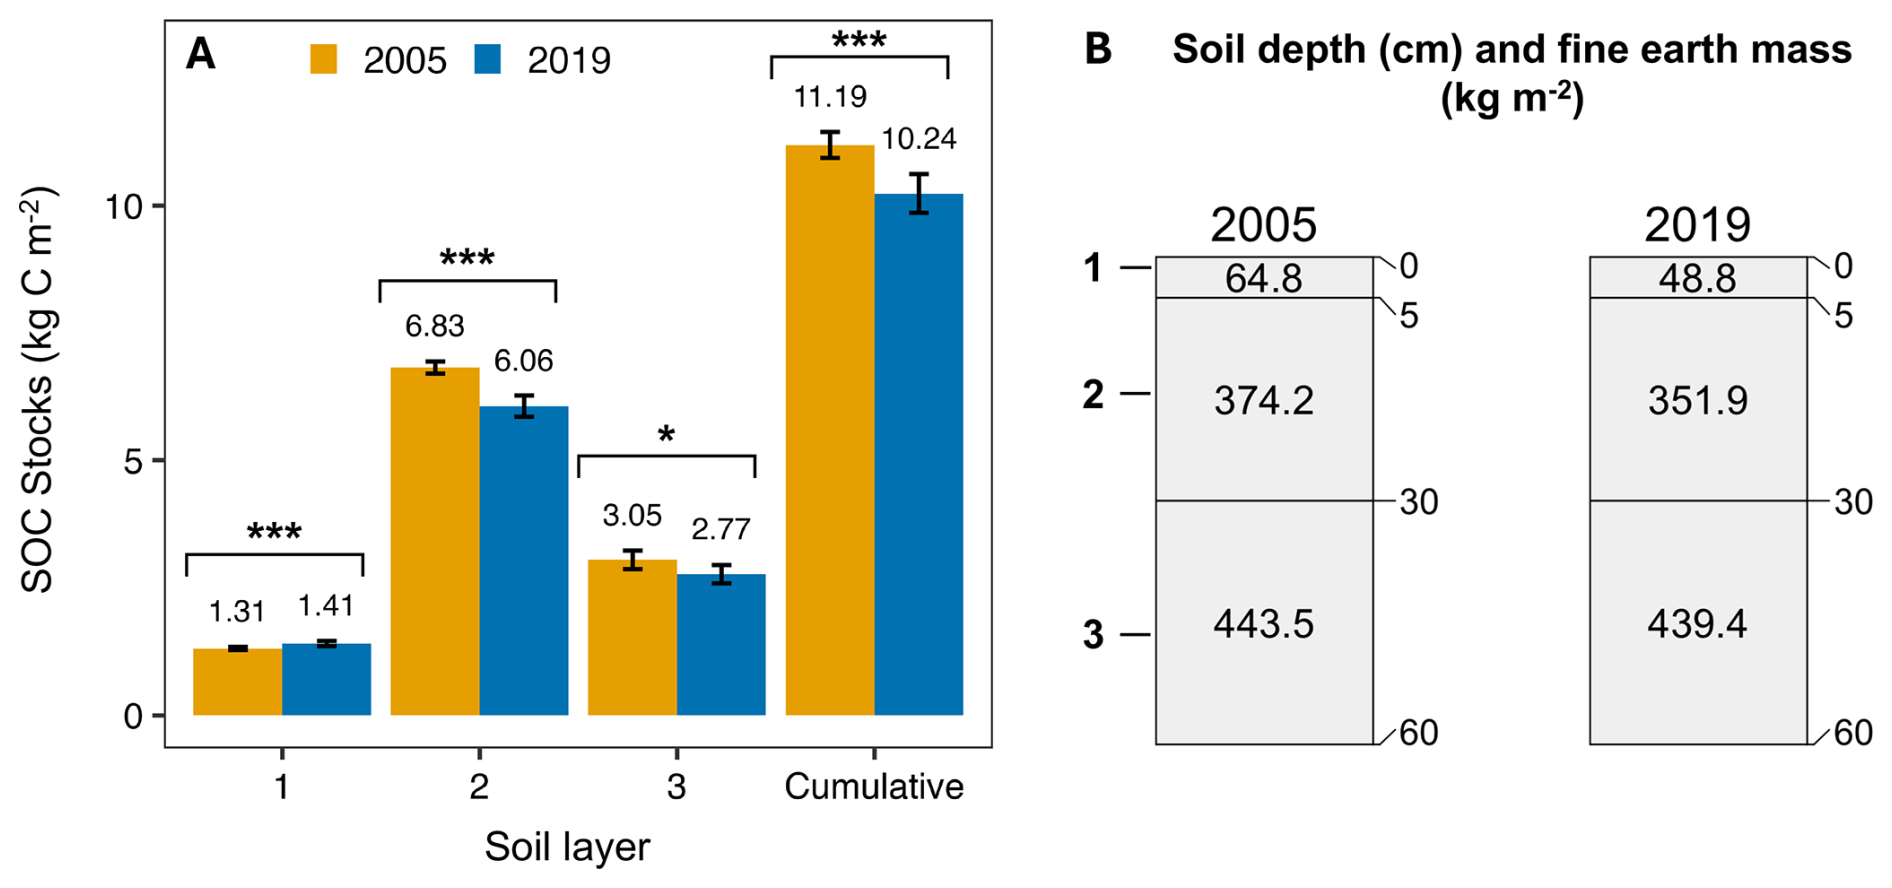
Figure 5Mean soil organic carbon (SOC) stocks (kg C m−2) estimated using the Equivalent Soil Mass (ESM) approach, along with their corresponding confidence intervals (error bars), for the 2005 and 2019 campaigns (A). Adjusted soil depth (cm) and fine earth mass (kg m−2) are also shown in panel (B). Asterisks denote significant differences between campaigns: P < 0.001 (), P < 0.01 (), P < 0.05 (*).
Table 2Reference fine earth mass (FEref) per layer used in the equivalent soil mass approach (ESM).
3.4 Cumulative SOC stocks
Across the 13.25-year monitoring period, the cumulative SOC stocks up to the sampling fixed-depth 0–60 cm exhibited a statistically significant decline (p < 0.05) of around 0.95 ± 0.22 kg C m−2 (p < 0.001; MDD < observed differences, Table 3). A similar decline was found using the ESM and the FD. Overall, both SOC estimation approaches indicate an average SOC loss of approximately 72 ± 16 g C m−2 yr−1 over the 13.25-year period. In terms of proportional reduction relative to the 2005 baseline, ESM-based SOC stocks decreased by −8.2 % in the ∼ 0–30 cm layer and −8.5 % in the ∼ 0–60 cm layer. These losses translate to annualised losses of approximately −0.62 % yr−1 to −0.89 % yr−1, when referenced to the 2005 SOC stocks baseline.
Table 3Summary of soil organic carbon (SOC) stock changes between 2005 and 2019 in the “Reduced field” at the FR-Gri site, assessed for the 0–30 and 0–60 cm soil layers using both the Equivalent Soil Mass (ESM) and Fixed-Depth (FD) approaches. SOC changes are reported in absolute terms (kg C m−2) following by their standard error, relative change (% of initial stock), and as annualised rates. The Minimum Detectable Difference (MDD) represents the smallest true difference that can be statistically detected given the observed variability and sample size. If the observed SOC stock changes exceeds the MDD and p < 0.05, the change is considered detectable. If SOC stock changes is less than the MDD, the change is not statistically distinguishable. A large MDD reflects high variability or limited sensitivity, whereas a small MDD indicates high precision in detecting SOC stock changes. These estimates were also used as input parameters for the AMG model simulations.
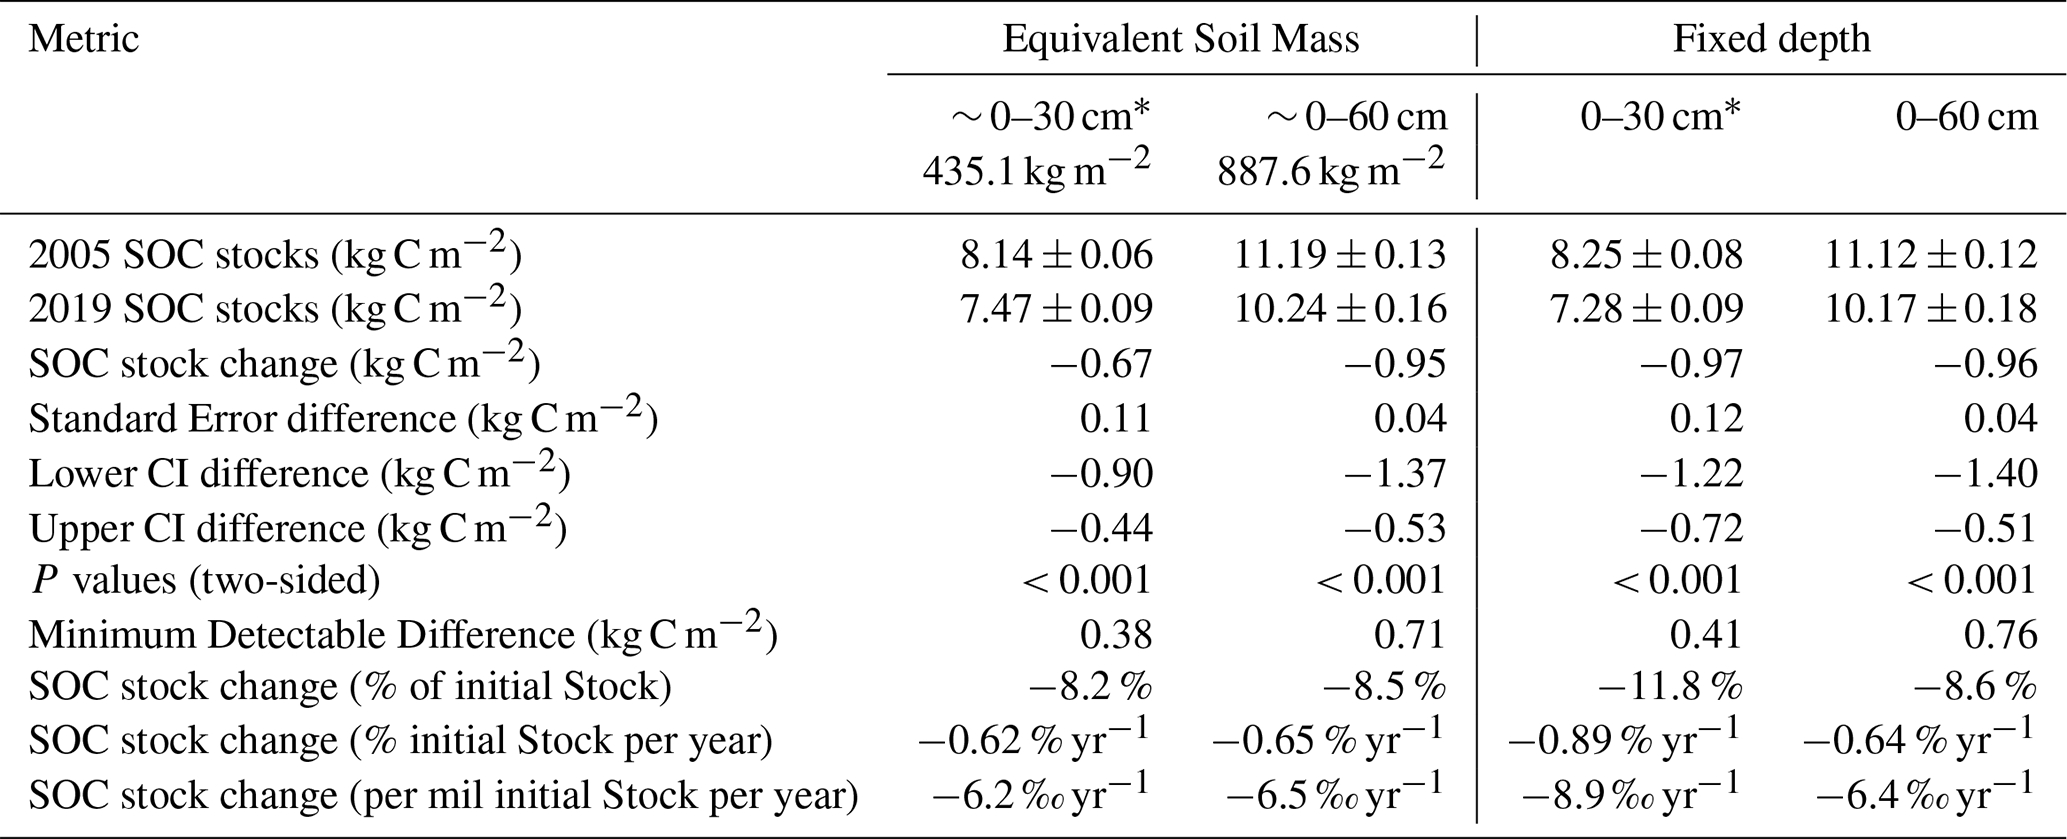
* SOC stocks from 2005 at 0–30 and 0–60 cm were inserted as input variables in the AMG model.
3.5 Comparison of measured SOC stock changes with estimations obtained with the AMG model
The AMG model was used to simulate the soil organic carbon stock evolution from 2005 to 2040 in the 0–30 cm layer, based on the cropping system, imports and exports, computing the plant residues return based on allometric relationships. Under current cropland management practices, the model evidenced a declining trend of SOC stocks (Fig. 6), which aligns with the decrease observed with the ESM approach in the 0–30 cm layer. The AMG model simulated a SOC stock decrease from 8.24 kg C m−2 in 2005 to 7.25 kg C m−2 in 2019, reflecting a cumulative loss of approximately −0.99 kg C m−2 (−12 %) over 13.25 years. This modelled SOC loss is larger than the mean SOC stock change estimated using the ESM approach in the 0–30 cm layer (−0.67 kg C m−2), and slightly outside the associated confidence intervals (95 % CI: −0.90 to −0.44 kg C m−2; Table 3). SOC stocks appear to approach a quasi-steady-state from 2027 onwards, with fluctuations of ± 0.02 to ± 0.04 kg C m−2 yr−1. By 2040, SOC stocks are projected to decrease to 6.94 kg C m−2, representing an approximate 15 % reduction from the 2005 baseline. Both the AMG model and measured SOC stocks were consistent with the flux balance approach reported by Loubet et al. (2011), during the early period from 2006 to 2010. The overall loss over a 22-year period (2005–2027) would then be of around 1.3 kg C m−2, or 13 Mg C ha−1, which amounts to 0.059 Mg ha−1 yr−1. Overall, the sensitivity analysis across five scenarios shows the same declining patterns in SOC, with cumulative losses ranging from 5 % to 18 % by 2019, and from 6 % to 23 % by 2040. Increasing the residue return leads to a stabilisation of the SOC stock near 7.15 instead of 6.95 kg C m−2, while doubling the organic carbon amendment would lead to an equilibrium of 7.48 kg C m−2. On the contrary, suppressing the organic carbon amendment would lead to a stabilisation of 6.34 kg C m−2. The simulation with the climate corresponding to 1998–2005 (with a slightly colder temperature −0.3 °C when compared to 2005–2019) had a non-detectable effect on the simulated soil C stock (Fig. 6).
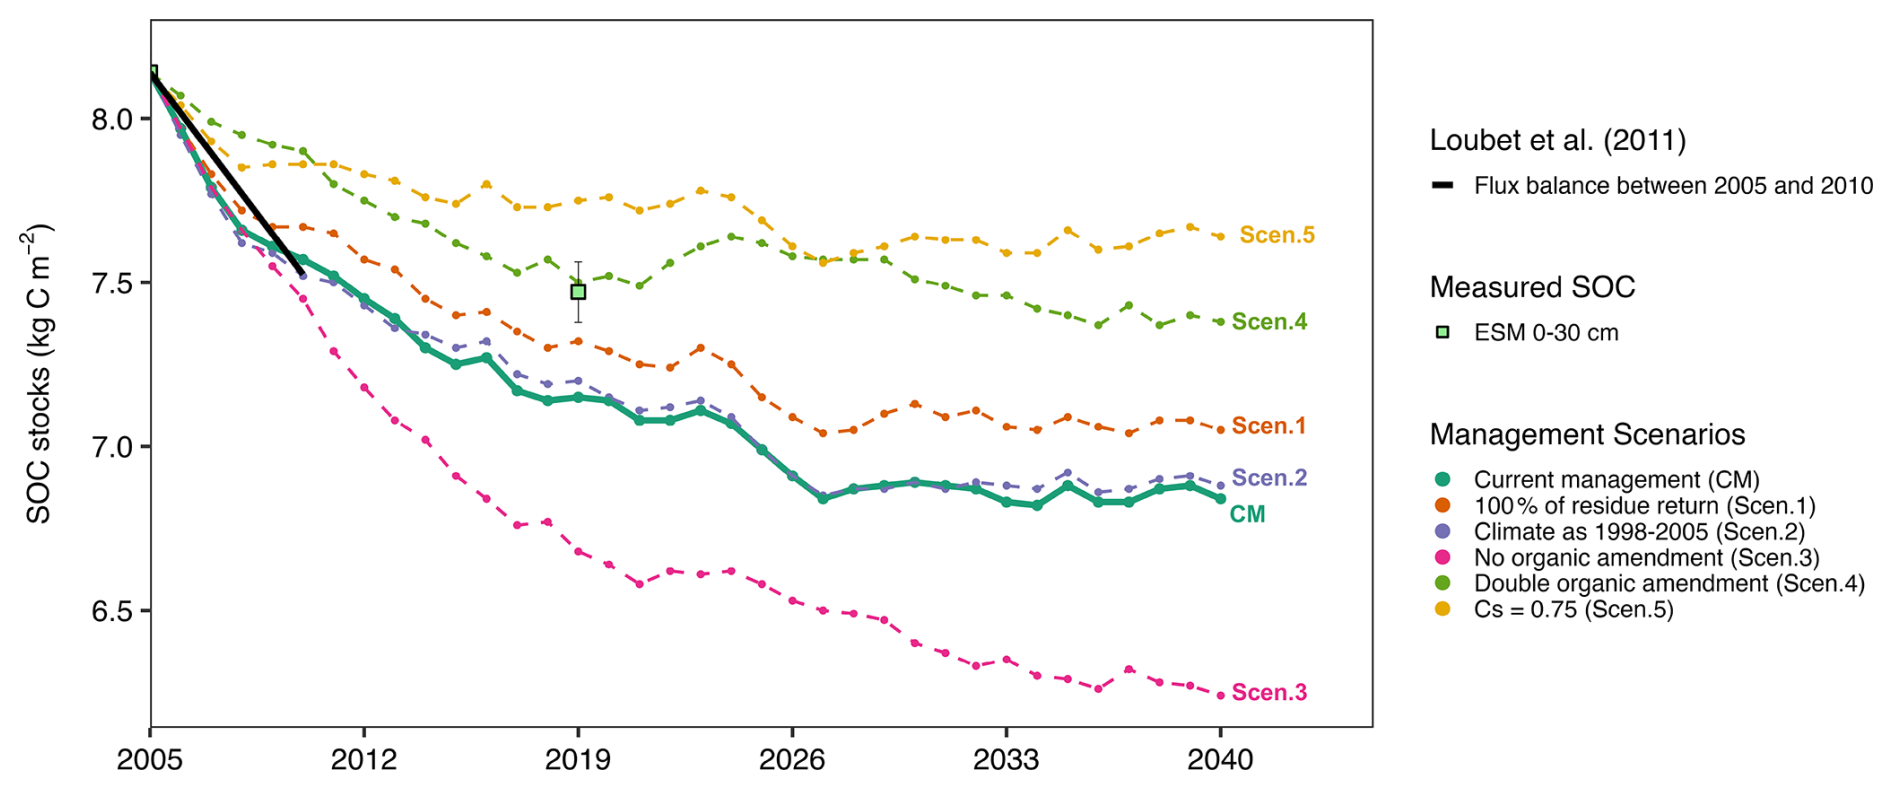
Figure 6Soil organic carbon (SOC) stock in the 0–30 cm layer simulated by the AMG model under the current management (CM) and five alternative scenarios (Scen.1–Scen.5; coloured lines). Measured SOC stocks from soil inventories in 2005 and 2019, computed using the equivalent soil mass (ESM) approach, are shown as light-green squares; error bars indicate the sampling standard error. Flux balance over the 2006–2010 period (black solid line) as published in Loubet et al. (2011). Cs denotes of the proportion of stable carbon pools in the model.
4.1 Effects of sampling depth and computation methods on organic carbon stock change estimates
Our results show that cumulative SOC stock changes between 2005 and 2019 under reduced tillage management were similar between the FD and ESM approaches only when SOC stocks were integrated over the full 0–60 cm profile, differing by just 3 % in this layer (p > 0.80). In contrast, SOC stock changes differed between approaches in the surface soil (≤ 30 cm). Previous studies have documented misleading interpretations of SOC stock increases with reduced or no-tillage when using the FD approach at shallow depths (≤ 30 cm) (Du et al., 2017; Xiao et al., 2020). Our results support this in the 0–5 cm layer, where FD indicates SOC stock losses while ESM shows gain (Table S5, Fig. S8). Indeed, FD approaches are prone to bias when soil bulk density or SOC content changes, irrespective of the soil management (von Haden et al., 2020).
Because BD often varies with management in agricultural soils, especially at shallow depths (≤ 30 cm), multilayer sampling and equivalent soil mass approaches are essential to capture the temporal response of SOC stock in shallow layers (Wendt and Hauser, 2013; Xiao et al., 2020). At the FR-Gri site, the topsoil (0–15 cm) is frequently disturbed by shallow tillage using a stubble cultivator or clod crusher, and deep tillage operations have occasionally been applied to depths of up to 40 cm. In addition to residue return, these practices influence BD and soil mass distribution, particularly within the upper 40 cm of the profile. Additionally, the potential compaction caused by repeated machinery traffic cannot be excluded (Hamza and Anderson, 2005), since the compaction tends to accumulate over time below 40 cm due to limited tillage operations of the subsoil (Zhang et al., 2024).
Roots may also alter BD, including in subsurface layers, by modifying the physical properties (e.g., aggregation, porosity) as roots efficiently explore deeper layers. In the FR-Gri site, we find a significant decrease of BD in the 0–5 and 5–30 cm layers and no significant change in the lower layer (30–60 cm) (Table S4). Likewise, roots may contribute to subsoil SOC stocks through root growth, biomass accumulation, and rhizodeposition. The rhizodeposition process may account for up to 65 % of root C and ∼ 10 % of total photosynthesised C, as shown for maize (Tardieu, 1988) and wheat (Zhang et al., 2020; Zou et al., 2022), which are the main crops at the FR-Gri site. Fan et al. (2016) reported that approximately 95 % of root biomass lies above 100 cm. In our field, 20 % of the SOC stock changes occurred in the 30–60 cm layer, confirming that sampling to at least 60 cm better captures root-related C inputs and reduces SOC bias estimate, as also emphasised by Baker et al. (2007) and Wendt and Hauser (2013). Furthermore, SOC stock estimates in deeper and multiple layers provide valuable insights into SOC dynamics across the profile, as mineralised carbon may percolate and accumulate in subsoil layers (Rumpel and Kögel-Knabner, 2011).
4.2 Possible causes of the observed SOC stock changes over 13.25 years
SOC stock losses in cropland systems under various management practices have been widely reported in European studies (De Rosa et al., 2024). A major cause of carbon losses is the imbalance between carbon imports and exports, which progressively leads to a shift in the carbon stock from one state to a new one, higher if the imbalance is an excess of imports or lower in the opposite case (Ingwersen et al., 2024; Poyda et al., 2019). Over the 13.25-year period (2005–2019), the FR-Gri site has experienced a decrease in SOC stock of 0.95 kg C m−2 [95 % CI: 0.51–1.4]. Our study evidenced that C losses in the intermediate soil layers (5–40 cm) are not offset by gains below down to 60 cm depth (∼ 0–5 and 40–60 cm).
Overall, the cropping system history at FR-Gri led to a carbon stock decrease of 72 ± 16 g C m−2 yr−1 over the observed 13.25-year period in the ∼ 0–60 cm soil layer, irrespective of the SOC estimation method. Our hypothesis is that SOC decline is primarily related to an imbalance during that period between carbon imports, limited by reduced crop residue return, and high biomass exports. The FR-Gri site has been under continuous cropland management for at least over 100 years, with reduced tillage and crop rotation introduced in the past 2 decades. In the 1980s, the field received an unquantified but large amount of organic matter inputs from wastewater treatment plants, which may explain the high carbon stocks observed in 2005.
Moreover, since 2004, increased export of wheat straw for bioenergy has reduced crop residue return, while organic amendments were limited (Table 1). This shift in management practices may have contributed to a long-term imbalance between C imports and exports, leading to SOC stock declines since, on average, the field exports were around threefold higher than imports and twice higher than the import and aerial residue return combined. The AMG simulations corroborate this hypothesis, showing a decrease mainly explained by the low residue return and limited organic C application, while the slight shift in meteorological conditions (+0.3 °C air temperature) during that period does not have any significant effect on the simulated soil C stock (Fig. 6).
Different patterns have been reported in long-term experiments conducted under similar pedoclimatic conditions. In a well-drained Haplic Luvisol under a temperate climate, Dimassi et al. (2014) showed that SOC stock changes under residue removal varied over time, with alternating phases of accumulation and depletion. The strongest depletion occurred around 2002 (−0.033 kg C m−2 yr−1), possibly reflecting lagged effects of residue removal between 1982 and 1994 and climate changes, whereas SOC stock increased in 2011 after residues were returned again after 1994. Furthermore, SOC stocks increase occurred in the upper soil layer (0–10 cm) and were offset by losses at depth (10–28 cm), resulting in near-neutral SOC stock changes over the profile. These trends were later confirmed by Mary et al. (2020) with additional sampling in 2017. Unlike the long-term experiments of Dimassi et al. (2014) and Mary et al. (2020), where surface gains largely compensated subsoil losses at the profile scale, SOC losses at FR-Gri were dominated by sustained carbon deficits in intermediate layers, resulting in a net negative balance. However, as we hypothesised here, Dimassi et al. (2014) suggested that crop management such as residues removal, crop rotation (C3 vs. C4) and catch crops mediates C sequestration under similar soil tillage.
The relatively high initial SOC stocks at FR-Gri reflects the previously high though unrecorded C inputs (from wastewater treatments plants) and lower residue exports. This may further contribute to the observed declining SOC stock, as C inputs decreased in the 2005–2016 period, even with substantial organic inputs. In terms of soil processes, SOC stock declines during this period likely reflect an imbalance between SOC mineralization and stabilization processes rates, likely triggered by high fresh plant inputs with low C : N ratio, organic amendments, nitrogen-rich fertilisation (193 kg N ha−1) and environmental conditions favouring microbial activity and SOC mineralisation (Bernard et al., 2022; Ceschia et al., 2010; Loubet et al., 201). The depleting effect of nitrogen-rich inputs was also observed by Dimassi et al. (2014), where SOC depleted under a crop rotation without C4 plant, and increased after the establishment of catch crop (oats/vetch).
Keel et al. (2019) reported ESM-based SOC stock losses ranging from 0.01 to 0.135 kg C m−2 yr−1 across various crop systems in Switzerland, with an average loss of 0.034 kg C m−2 yr−1 in the topsoil (∼ 0–20 cm). Their highest SOC stock losses were observed under a crop rotation similar to that of FR-Gri, with a comparable initial stock (∼ 7 kg C m−2 in the 0–20 cm layer), but implemented on an Orthic Luvisol. We notice that their C inputs from residue return and organic fertilisation (0.090–0.32 kg C m−2 yr−1) are comparable to ours (0.265 ± 0.030 kg C m−2), but they attributed the C losses to the recent grassland (with high SOC stock) to cropland (with low SOC stock) conversion, which may explain the doubled carbon stock change compared to this study.
The AMG model reproduced the observed SOC stock decline, though with a slightly greater magnitude, reinforcing the conclusion that the FR-Gri soil was not in carbon equilibrium and that a persistent negative C balance is the most plausible driver of SOC losses during that period (Fig. 6). The model projections suggest that the SOC stock should decline at the same rate until 2027 before stabilising. A sensitivity analysis shows that increasing the residue return would lead to a stabilisation of the SOC stock to 7.2 kg C m−2, compared to 6.95 kg C m−2 under current management, while doubling the organic carbon amendment would lead to an equilibrium of 7.5 kg C m−2.
Conversely, suppressing organic carbon amendments, which may be close to reality with the installation of a biogas plant on the farm, would lead to a stabilisation of 6.3 kg C m−2. Although not explicitly simulated in our study, digestate residues from biogas production could serve as an alternative organic amendment. While this residue typically contains lower content of labile organic carbon compared to fresh organic material, the remaining organic material tends to be more chemically recalcitrant and resistant to microbial decomposition. As a result, their incorporation in the soil may contribute to slight, but persistent, increases in SOC stocks over time (Keel et al., 2025; Thomsen et al., 2013).
Finally, the integrated carbon fluxes from 2006 to 2010 (Loubet et al., 2011) confirm a carbon loss from the soil comparable to those simulated by the AMG model (Fig. 6). Although the uncertainties on the integrated carbon fluxes are very large, the convergence between the two approaches corroborates a large soil carbon loss in the years 2005–2010, which is consistent with the decrease in organic carbon fertilisations and residue return during that period (Table 1) compared to previous years. We also note that the yearly carbon loss from Loubet et al. (2011) is not significantly different from the yearly carbon soil destocking found in the present study. In the north-western part of Switzerland, in a Cambisol soil, Leifeld et al. (2011) also compared the integrated carbon fluxes and soil sampling methods over 5 years on an intensive and an extensive grassland, both recently converted from intensive cropland. They concluded that the large uncertainties in both methods prevented detecting a significant change over 5 years in the intensive field. On the contrary, in the extensive field, they found a significant decrease of the SOC stock of −0.217 ± 0.143 kg C m−2 yr−1 by soil sampling, but a lower loss of −0.065 ± 0.092 g C m−2 yr−1 based on the integrated carbon fluxes method.
4.3 Uncertainties in soil carbon stock changes
We recognise the importance of distinguishing a true SOC stock change from artefacts introduced by differences in sampling designs in 2005 and 2019. To address this, the clustering of the soil based on 2019 soil properties (see Fig. S1 in the Supplement) provides an objective way to subset the 2019 dataset to compare with the 2005 campaign over a similar soil condition. The data-driven area selection corroborates the farmer's expert knowledge of the field heterogeneity. The robustness, across both design- and model-based approaches, alongside the clustering of the soil properties to identify distinct soil groups, increases our confidence that the observed differences reflect real changes in SOC stocks over time.
In the Reduced field (Fig. S4), the observed SOC stock change between 2005 and 2019 in the 0–60 cm layer was −0.95 ± 0.22 kg C m−2, exceeding the minimum detectable difference (MDD) of 0.73 kg C m−2 (p < 0.01), and this represents both significant and detectable changes given our sample size and design. In contrast, the Complete field (Fig. S4) did not show the same pattern, as the observed SOC changes fell below the MDD, indicating that the changes detected between 2005 and 2019 could be masked by spatial heterogeneity. For these reasons, the computations using the Complete field were not considered in this study due to the potential for Type II error (failing to detect a real effect).
The larger MDD when all strata are included in our comparisons reflect increased soil heterogeneity, particularly related to the potential presence of Calcisol (shallow soil with high rock fragments and SIC content) on the north-western part of the field. These factors not only affect the soil bulk density and fine earth mass, but also the soil capacity in stabilising carbon through the positive interactions between Calcium (Ca) and soil organic matter (Kleber et al., 2021). These factors also lead to a large variability in biomass production, with the Calcisol area which retains less water being less productive, as well observed by harvest maps (Loubet et al., 2011), hence leading to less carbon inputs in this are by residue return to the soil.
Additional uncertainty on the overall SOC stock change at the site may come from inorganic carbon losses. Indeed, previous measurements of carbon leaching at the FR-Gri site indicated that inorganic carbon, whose stock change could not be evaluated with the 2005 sampling data, may also contribute to significant soil carbon losses. Kindler et al. (2011) showed that, in 2010, the site was losing 28 g C m−2 yr−1 through leaching with a contribution of 21 g C m−2 yr−1 as dissolved inorganic carbon (DIC). Inorganic carbon leaching hence dominates at the site, with 75 % of the leached C being inorganic, indicating a clear carbonate dissociation to DIC leaching, due to H+. Although not measured directly as a soil stock change, we can therefore evaluate that carbonate leaching would lead to an additional inorganic soil carbon loss of 21 g C m−2 yr−1, leading to a total of 72 + 21 = 93 g C m−2 yr−1 carbon loss. The inorganic carbon loss would therefore represent a very significant amount of 22 % of the total carbon lost from the field, which could be induced by high nitrogen fertilisation (193 kg N ha−1 as half organic, half mineral, Table 1) and base cations exports by harvest (Raza et al., 2021; Song et al., 2022; Zamanian et al., 2021). We should however bear in mind that even if C is lost by DIC-DOC leaching from the 0–60 cm layer, it may lead to a deep C sequestration by formation of secondary CaCO3 (An et al., 2019; Liu et al., 2022).
Based on the uncertainties identified in this study, some key points should be considered for the next resampling campaign to improve the SOC stocks changes detectability. First, maintaining consistency in the sampled area and sampling protocols (including material used for sampling) across campaigns is critical to avoid confounding temporal changes with spatial variability. Second, sampling depth should also extend sufficiently deep (1 m) as SOC losses and gains vary across the soil profile. Third, accurate quantification of bulk density, rock fragment content, and fine earth mass remains essential, and consistent protocols should be applied across campaigns to ensure compatibility with equivalent soil mass approaches. Finally, Consistent recording of the meteorology, carbon fluxes and C inputs and outputs together with their uncertainties are also key to interpret the observations.
The application of the ICOS harmonised protocols fulfil all the above-mentioned key points and ensures methodological consistency and comparability across years, particularly when using equivalent soil mass approaches. Some additional observations that are not mandatory in ICOS may be very useful to further understand the soil carbon stock changes, and in particular organic and inorganic carbon leaching. Together, these considerations will enhance the ability of future resampling campaigns to robustly detect SOC stock changes and to disentangle management and environmental-driven effects from spatial and methodological sources of uncertainty.
A significant decompaction of the 0–5 cm soil layer was observed over the 13.25 years in this crop field, with an estimated 22 % decrease in bulk density in the 0–5 cm layer and a 5 % decrease in the 5–30 cm layer. This decompaction is likely due to reduced deep tilling and increased intercropping since 2004. However, despite the higher SOC content in 2019, the SOC stocks only increased in the 0–5 cm layer, but decreased in the 5–30 cm layer, with no changes in the 30–60 cm layer. Consequently, cumulative SOC stocks in the 0–60 cm layer decreased by 0.95 ± 0.22 kg C m−2, as estimated by the equivalent soil mass approach. As we observed a similar decrease when using a fixed depth approach in the 0–60 cm layer, we conclude that sampling at a depth of 60 cm in agricultural soils is a good way to minimise biases in soil carbon stock evolution estimates.
The annual decrease of cumulative SOC stock was 72 ± 16 g C m−2 yr−1, equivalent to a −0.65 % yr−1 rate of decline. This rate is consistent with earlier studies and supported by the AMG model simulation and flux balance approach over the 2005–2010 period for our site. Our study, therefore, suggests that reduced tillage, intercropping, and organic fertilisation may not be sufficient to prevent soil carbon losses when the initial SOC stock is high, as in our site. As confirmed by other studies, the losses observed here highlight the difficulty of achieving the 4 ‰ aspirational target in cropping systems representative of the Parisian Basin, which are characterised by relatively large SOC stocks and large exports.
While our study detected SOC changes between 2005 and 2019, important uncertainties remain. Notably, the shift from a regular-grid design in 2005 (N = 100, nested within the 2019 footprint) to a stratified random design in 2019 (N = 20 covering the entire C-flux footprint) may introduce artefacts related to soil heterogeneity and reduced statistical power. This calls for additional campaigns in the future with the same sampling design as in 2019. According to the AMG model runs, a change of around 0.3 kg C m−2 is expected between 2019 and 2028, which would be just above the standard error difference of 0.22 kg C m−2 found here, indicating that a sample in 2028 would be meaningful.
These uncertainties call for standardised, high-quality monitoring protocols such as those developed by the ICOS research infrastructure. Consistent sampling methodologies over time are needed to reliably assess the long-term impact of crop management on SOC stocks at sites like FR-Gri, and to improve our understanding of carbon dynamics in cropland systems. Integrating SOC stock data with CO2 flux measurements and lateral carbon fluxes will be crucial to exploring the underlying processes driving SOC changes.
The Level-2 data from the 2019 campaign are publicly available through the ICOS Carbon Portal (Buysse et al., 2025): https://hdl.handle.net/11676/gEj9nfPY-ImTFfWmZmjCmxg4. The raw data from both sampling campaigns, all input files (including the complete R project), and the R scripts used for data processing and analysis are available in Winck et al. (2026): https://doi.org/10.57745/IDYYFV.
The supplement related to this article is available online at https://doi.org/10.5194/bg-23-2059-2026-supplement.
BL conceptualised, supervised, acquired the funding for the study and administered the project. BL and MG co-wrote the original draft of the manuscript with contributions from all co-authors and revised it. NS and BW provided the formal analysis, provided the statistical expertise and scripts to compute the carbon stocks in the original manuscript, and co-wrote the manuscript. PB made the soil sampling and data curation for the 2019 campaign, curated the crop management data and reviewed the manuscript. JPC and NS participated in the ICOS database data curation. CD managed the soils storage in 2019, contributed to data curation, and reviewed the manuscript. CJ provided expertise on the soil sampling methodology. CK made data curation on the crop management data and reviewed the manuscript. FL computed the AMG and reviewed the manuscript. BW and JLME provided expertise on the ESM methodology and reviewed the manuscript. SL participated in data curation and reviewed the manuscript. DL and DP conceptualised the data acquisition and reviewed the manuscript. GN participated in the data curation. DA initiated the project, conceptualised, developed and provided expertise on the methodology and revised the manuscript.
The contact author has declared that none of the authors has any competing interests.
Publisher's note: Copernicus Publications remains neutral with regard to jurisdictional claims made in the text, published maps, institutional affiliations, or any other geographical representation in this paper. The authors bear the ultimate responsibility for providing appropriate place names. Views expressed in the text are those of the authors and do not necessarily reflect the views of the publisher.
We acknowledge the AgroParisTech Grignon farm and its director, Dominique Tristant, for letting us access their field and providing information on practices and yields, the direction of the infrastructure of INRAE for funding the ICOS FR-Gri site, and EU projects CarboEurope, NitroEurope and ECLAIRE for funding this work. Data processing, including the sample analysis, was supported by the ICOS Ecosystem Thematic Centre. Giacomo Nicolini acknowledges Horizon Europe for funding. Dario Papale thanks the EU - Next Generation EU Mission 4 for support. Bruna Winck acknowledges the financial support of the Agence Nationale de la Recherche.
We greatly acknowledge Marion Schrumpf from the Max Planck Institute and her team for sharing the 2005 soil sampling data. We also thank Eric Larmanou for helping in the field during the soil sampling campaign in 2005.
Giacomo Nicolini has been supported by the Horizon Europe funding (Open-Earth-Monitor Cyberinfrastructure project, 101059548). Dario Papale has been supported by the ITINERIS Project (IR0000032 - CUP B53C22002150006) funded under the EU - Next Generation EU Mission 4. Bruna Winck has been supported by the exploratory research program FairCarboN funded by the Agence Nationale de la Recherche under the France 2030 program, reference ANR-22-PEXF-0002 – project ALAMOD.
This paper was edited by Sara Vicca and reviewed by Moritz Laub and one anonymous referee.
An, H., Wu, X., Zhang, Y., and Tang, Z.: Effects of land-use change on soil inorganic carbon: A meta-analysis, Geoderma, 353, 273–282, https://doi.org/10.1016/j.geoderma.2019.07.008, 2019.
Antón, R., Arricibita, F. J., Ruiz-Sagaseta, A., Enrique, A., de Soto, I., Orcaray, L., Zaragüeta, A., and Virto, I.: Soil organic carbon monitoring to assess agricultural climate change adaptation practices in Navarre, Spain, Reg. Environ. Change, 21, https://doi.org/10.1007/s10113-021-01788-w, 2021.
Arrouays, D., Saby, N. P. A., Boukir, H., Jolivet, C., and Ratié, C.: Soil sampling and preparation for monitoring soil carbon, Int. Agrophys., 32, 633–643, https://doi.org/10.1515/intag-2017-0047, 2018.
Aubinet, M., Moureaux, C., Bodson, B., Dufranne, D., Heinesch, B., Suleau, M., Vancutsem, F., and Vilret, A.: Carbon sequestration by a crop over a 4-year sugar beet/winter wheat/seed potato/winter wheat rotation cycle, Agr. Forest Meteorol., 149, 407–418, https://doi.org/10.1016/j.agrformet.2008.09.003, 2009.
Autret, B., Mary, B., Chenu, C., Balabane, M., Girardin, C., Bertrand, M., Grandeau, G., and Beaudoin, N.: Alternative arable cropping systems: A key to increase soil organic carbon storage? Results from a 16 year field experiment, Agr. Ecosyst. Environ., 232, 150–164, https://doi.org/10.1016/j.agee.2016.07.008, 2016.
Baker, J. M., Ochsner, T. E., Venterea, R. T., and Griffis, T. J.: Tillage and soil carbon sequestration - What do we really know?, Agr. Ecosyst. Environ., 118, 1–5, https://doi.org/10.1016/j.agee.2006.05.014, 2007.
Batjes, N. H.: Total carbon and nitrogen in the soils of the world, Eur. J. Soil Sci., 47, 151–163, https://doi.org/10.1111/j.1365-2389.1996.tb01386.x, 1996.
Baveye, P. C., Berthelin, J., Tessier, D., and Lemaire, G.: The “4 per 1000” initiative: A credibility issue for the soil science community?, Geoderma, 309, 118–123, https://doi.org/10.1016/j.geoderma.2017.05.005, 2018.
Beem-Miller, J. P., Kong, A. Y. Y., Ogle, S., and Wolfe, D.: Sampling for Soil Carbon Stock Assessment in Rocky Agricultural Soils, Soil Sci. Soc. Am. J., 80, 1411–1423, https://doi.org/10.2136/sssaj2015.11.0405, 2016.
Bernard, L., Basile-Doelsch, I., Derrien, D., Fanin, N., Fontaine, S., Guenet, B., Karimi, B., Marsden, C., and Maron, P.: Advancing the mechanistic understanding of the priming effect on soil organic matter mineralisation, Funct. Ecol., 36, 1355–1377, https://doi.org/10.1111/1365-2435.14038, 2022.
Brisson, N., Mary, B., Ripoche, D., Jeuffroy, M. H., Ruget, F., Nicoullaud, B., Gate, P., Devienne-Barret, F., Antonioletti, R., Durr, C., Richard, G., Beaudoin, N., Recous, S., Tayot, X., Plenet, D., Cellier, P., Machet, J.-M., Meynard, J. M., and Delécolle, R.: STICS: a generic model for the simulation of crops and their water and nitrogen balances. I. Theory and parameterization applied to wheat and corn, Agronomie, 18, 311–346, https://doi.org/10.1051/agro:19980501, 1998.
Brown, A. L.: Design Experiments: Theoretical and Methodological Challenges in Creating Complex Interventions in Classroom Settings, J. Learn. Sci., 2, 141–178, https://doi.org/10.1207/s15327809jls0202_2, 1992.
Brus, D. J. and de Gruijter, J. J.: Random sampling or geostatistical modelling? Choosing between design-based and model-based sampling strategies for soil (with discussion), Geoderma, 80, 1–44, https://doi.org/10.1016/s0016-7061(97)00072-4, 1997.
Brus, D. J. and Saby, N. P. A.: Approximating the variance of estimated means for systematic random sampling, illustrated with data of the French Soil Monitoring Network, Geoderma, 279, 77–86, https://doi.org/10.1016/j.geoderma.2016.05.016, 2016.
Buysse, P., Loubet, B., Depuydl, J., Durand, B., and Kalalian, C.. ETC L2 ARCHIVE from Grignon, 2021-01-01–2025-10-01, ICOS RI [data set], https://hdl.handle.net/11676/gEj9nfPY-ImTFfWmZmjCmxg4 (last access: 24 January 2025), 2025.
Canty, A., Ripley, B., and Brazzale, A. R.: boot: Bootstrap Functions, Version 1.3-32, The Comprehensive R Archive Network (CRAN) [code], https://doi.org/10.32614/CRAN.package.boot, 2025.
Ceschia, E., Béziat, P., Dejoux, J. F., Aubinet, M., Bernhofer, C., Bodson, B., Buchmann, N., Carrara, A., Cellier, P., Di Tommasi, P., Elbers, J. A., Eugster, W., Grünwald, T., Jacobs, C. M. J., Jans, W. W. P., Jones, M., Kutsch, W., Lanigan, G., Magliulo, E., Marloie, O., Moors, E. J., Moureaux, C., Olioso, A., Osborne, B., Sanz, M. J., Saunders, M., Smith, P., Soegaard, H., and Wattenbach, M.: Management effects on net ecosystem carbon and GHG budgets at European crop sites, Agr. Ecosyst. Environ., 139, 363–383, https://doi.org/10.1016/j.agee.2010.09.020, 2010.
Clivot, H., Mouny, J.-C., Duparque, A., Dinh, J.-L., Denoroy, P., Houot, S., Vertès, F., Trochard, R., Bouthier, A., Sagot, S., and Mary, B.: Modeling soil organic carbon evolution in long-term arable experiments with AMG model, Environ. Modell. Softw., 118, 99–113, https://doi.org/10.1016/j.envsoft.2019.04.004, 2019.
Clivot, H., Duparque, A., Ferchaud, F., Lagrange, H., Levavasseur, F., Levert, M., Marsac, S., Mary, B., Mouny, J.-C., Piquemal, B., Sagot, S., Servain, F., Trochard, R., Cadoux, S., and Perrin, A.-S.: AMGv2 parameters, Version V2, Recherche Data Gouv [data set], https://doi.org/10.57745/MEQQIX, 2023.
Coleman, K. and Jenkinson, D. S.: RothC-26.3 – A Model for the turnover of carbon in soil, in: Evaluation of Soil Organic Matter Models, Springer Berlin Heidelberg, Berlin, Heidelberg, 237–246, https://doi.org/10.1007/978-3-642-61094-3_17, 1996.
Collins, A.: Toward a Design Science of Education, in: New Directions in Educational Technology, edited by: Scanlon, E. and O'Shea, T., Springer Berlin Heidelberg, Berlin, Heidelberg, 15–22, https://doi.org/10.1007/978-3-642-77750-9_2, 1992.
de Gruijter, J. J., Bierkens, M. F. P., Brus, D. J., and Knotters, M.: Sampling for Natural Resource Monitoring, Springer Berlin Heidelberg, Berlin, Heidelberg, 334 pp., https://doi.org/10.1007/3-540-33161-1, 2006.
De Rosa, D., Ballabio, C., Lugato, E., Fasiolo, M., Jones, A., and Panagos, P.: Soil organic carbon stocks in European croplands and grasslands: How much have we lost in the past decade?, Glob. Change Biol., 30, https://doi.org/10.1111/gcb.16992, 2024.
Dimassi, B., Mary, B., Wylleman, R., Labreuche, J. Ô., Couture, D., Piraux, F., and Cohan, J. P.: Long-term effect of contrasted tillage and crop management on soil carbon dynamics during 41 years, Agr. Ecosyst. Environ., 188, 134–146, https://doi.org/10.1016/j.agee.2014.02.014, 2014.
Don, A., Schumacher, J., Scherer-Lorenzen, M., Scholten, T., and Schulze, E.-D.: Spatial and vertical variation of soil carbon at two grassland sites – Implications for measuring soil carbon stocks, Geoderma, 141, 272–282, https://doi.org/10.1016/j.geoderma.2007.06.003, 2007.
Du, Z., Angers, D. A., Ren, T., Zhang, Q., and Li, G.: The effect of no-till on organic C storage in Chinese soils should not be overemphasized: A meta-analysis, Agr. Ecosyst. Environ., 236, 1–11, https://doi.org/10.1016/j.agee.2016.11.007, 2017.
Efron, B.: Better Bootstrap Confidence Intervals, J Am Stat Assoc, 82, 171–185, https://doi.org/10.1080/01621459.1987.10478410, 1987.
Ellert, B. H. and Bettany, J. R.: Calculation of organic matter and nutrients stored in soils under contrasting management regimes, Can. J. Soil Sci., 75, 529–538, https://doi.org/10.4141/cjss95-075, 1995.
Fan, J., McConkey, B., Wang, H., and Janzen, H.: Root distribution by depth for temperate agricultural crops, Field Crop. Res., 189, 68–74, https://doi.org/10.1016/j.fcr.2016.02.013, 2016.
FAO: Measuring and modelling soil carbon stocks and stock changes in livestock production systems: guidelines for assessment, Version 1, Livestock Environmental Assessment and Performance (LEAP) Partnership, Rome, 170 pp., ISBN 978-92-5-131408-1, 2019.
Ferchaud, F., Chlebowski, F., and Mary, B.: SimpleESM: R script to calculate soil organic carbon and nitrogen stocks at Equivalent Soil Mass,, 9 pp. Hal Open Science [code], https://hal.science/hal-04013158v2 (last access: 3 February 2026), 2023.
Franzluebbers, A. J., Paine, L. K., Winsten, J. R., Krome, M., Sanderson, M. A., Ogles, K., and Thompson, D.: Well-managed grazing systems: A forgotten hero of conservation, J. Soil Water Conserv., 67, https://doi.org/10.2489/jswc.67.4.100A, 2012.
Goovaerts, P.: Geostatistics for natural resources evaluation, Oxford University Press, New York, 483 pp., https://doi.org/10.1023/A:1007530422454, 1997.
Hamza, M. A. and Anderson, W. K.: Soil compaction in cropping systems, Soil Till. Res., 82, 121–145, https://doi.org/10.1016/j.still.2004.08.009, 2005.
Hedges, L. V.: Distribution theory for Glass's estimator of effect size and related estimators, J. Educ. Stat., 6, 107–128, https://doi.org/10.2307/1164588, 1981.
Heiskanen, J., Brummer, C., Buchmann, N., Calfapietra, C., Chen, H., Gielen, B., Gkritzalis, T., Hammer, S., Hartman, S., Herbst, M., Janssens, I. A., Jordan, A., Juurola, E., Karstens, U., Kasurinen, V., Kruijt, B., Lankreijer, H., Levin, I., Linderson, M. L., Loustau, D., Merbold, L., Myhre, C. L., Papale, D., Pavelka, M., Pilegaard, K., Ramonet, M., Rebmann, C., Rinne, J., Rivier, L., Saltikoff, E., Sanders, R., Steinbacher, M., Steinhoff, T., Watson, A., Vermeulen, A. T., Vesala, T., Vítkova, G., and Kutsch, W.: The Integrated Carbon Observation System in Europe, B. Am. Meteorol. Soc., 103, E855–E872, https://doi.org/10.1175/BAMS-D-19-0364.1, 2022.
Hopkins, D. W., Waite, I. S., McNicol, J. W., Poulton, P. R., Macdonald, A. J., and O'Donnell, A. G.: Soil organic carbon contents in long-term experimental grassland plots in the UK (Palace Leas and Park Grass) have not changed consistently in recent decades, Glob. Change Biol., 15, 1739–1754, https://doi.org/10.1111/j.1365-2486.2008.01809.x, 2009.
Ingwersen, J., Poyda, A., Kremer, P., and Streck, T.: Harvest residues: A relevant term in the carbon balance of croplands?, Agr. Forest Meteorol., 349, https://doi.org/10.1016/j.agrformet.2024.109935, 2024.
IPCC, Calvo Buendia, E., Tanabe, K., Kranjc, A., Baasansuren, J., Fukuda, M., Ngarize, S., Osako, A., Pyrozhenko, Y., Shermanau, P., and Federici, S. (Eds.): 2019 Refinement to the 2006 IPCC Guidelines for National Greenhouse Gas Inventories, IPCC, Switzerland, ISBN 978-4-88788-232-4, 2019.
Kanari, E., Cécillon, L., Baudin, F., Clivot, H., Ferchaud, F., Houot, S., Levavasseur, F., Mary, B., Soucémarianadin, L., Chenu, C., and Barré, P.: A robust initialization method for accurate soil organic carbon simulations, Biogeosciences, 19, 375–387, https://doi.org/10.5194/bg-19-375-2022, 2022.
Keel, S. G., Anken, T., Büchi, L., Chervet, A., Fliessbach, A., Flisch, R., Huguenin-Elie, O., Mäder, P., Mayer, J., Sinaj, S., Sturny, W., Wüst-Galley, C., Zihlmann, U., and Leifeld, J.: Loss of soil organic carbon in Swiss long-term agricultural experiments over a wide range of management practices, Agr. Ecosyst. Environ., 286, https://doi.org/10.1016/j.agee.2019.106654, 2019.
Keel, S. G., Budai, A., Elsgaard, L., Hardy, B., Levavasseur, F., Zhi, L., Mondini, C., Plaza, C., and Leifeld, J.: Efficiency of Plant Biomass Processing Pathways for Long-Term Soil Carbon Storage, Eur. J. Soil Sci., 76, https://doi.org/10.1111/ejss.70074, 2025.
Kindler, R., Siemens, J., Kaiser, K., Walmsley, D. C., Bernhofer, C., Buchmann, N., Cellier, P., Eugster, W., Gleixner, G., Grunwald, T., Heim, A., Ibrom, A., Jones, S. K., Jones, M., Klumpp, K., Kutsch, W., Larsen, K. S., Lehuger, S., Loubet, B., McKenzie, R., Moors, E., Osborne, B., Pilegaard, K., Rebmann, C., Saunders, M., Schmidt, M. W. I., Schrumpf, M., Seyfferth, J., Skiba, U., Soussana, J. F., Sutton, M. A., Tefs, C., Vowinckel, B., Zeeman, M. J., and Kaupenjohann, M.: Dissolved carbon leaching from soil is a crucial component of the net ecosystem carbon balance, Glob. Change Biol., 17, 1167–1185, https://doi.org/10.1111/j.1365-2486.2010.02282.x, 2011.
Kirby, K. N. and Gerlanc, D.: BootES: An R package for bootstrap confidence intervals on effect sizes, Behav. Res. Methods, 45, 905–927, https://doi.org/10.3758/s13428-013-0330-5, 2013.
Kleber, M., Bourg, I. C., Coward, E. K., Hansel, C. M., Myneni, S. C. B., and Nunan, N.: Dynamic interactions at the mineral–organic matter interface, Nature Reviews Earth & Environment, 2, 402–421, https://doi.org/10.1038/s43017-021-00162-y, 2021.
Kljun, N., Calanca, P., Rotach, M. W., and Schmid, H. P.: A Simple Parameterisation for Flux Footprint Predictions, Bound.-Lay. Meteorol., 112, 503–523, https://doi.org/10.1023/B:BOUN.0000030653.71031.96, 2004.
Kljun, N., Calanca, P., Rotach, M. W., and Schmid, H. P.: A simple two-dimensional parameterisation for Flux Footprint Prediction (FFP), Geosci. Model Dev., 8, 3695–3713, https://doi.org/10.5194/gmd-8-3695-2015, 2015.
Lal, R.: Carbon emission from farm operations, Environ. Int., 30, 981–990, https://doi.org/10.1016/j.envint.2004.03.005, 2004.
Lee, J., Hopmans, J. W., Rolston, D. E., Baer, S. G., and Six, J.: Determining soil carbon stock changes: Simple bulk density corrections fail, Agr. Ecosyst. Environ., 134, 251–256, https://doi.org/10.1016/j.agee.2009.07.006, 2009.
Leifeld, J., Ammann, C., Neftel, A., and Fuhrer, J.: A comparison of repeated soil inventory and carbon flux budget to detect soil carbon stock changes after conversion from cropland to grasslands, Glob. Change Biol., 17, 3366–3375, https://doi.org/10.1111/j.1365-2486.2011.02471.x, 2011.
Liebhard, G., Toth, M., Stumpp, C., Bodner, G., Klik, A., Zhang, X., Strohmeier, S., and Strauss, P.: Developing topsoil structure through conservation management to protect subsoil from compaction, Soil Tillage Res, 253, 106669, https://doi.org/10.1016/j.still.2025.106669, 2025.
Lipiec, J. and Hatano, R.: Quantification of compaction effects on soil physical properties and crop growth, Geoderma, 116, 107–136, https://doi.org/10.1016/S0016-7061(03)00097-1, 2003.
Liu, J., Wu, P., Zhao, Z., and Gao, Y.: Afforestation on cropland promotes pedogenic inorganic carbon accumulation in deep soil layers on the Chinese loess plateau, Plant Soil, 478, 597–612, https://doi.org/10.1007/s11104-022-05494-2, 2022.
Loubet, B., Laville, P., Lehuger, S., Larmanou, E., Fléchard, C., Mascher, N., Genermont, S., Roche, R., Ferrara, R. M., Stella, P., Personne, E., Durand, B., Decuq, C., Flura, D., Masson, S., Fanucci, O., Rampon, J. N., Siemens, J., Kindler, R., Gabrielle, B., Schrumpf, M., and Cellier, P.: Carbon, nitrogen and Greenhouse gases budgets over a four years crop rotation in northern France, Plant Soil, 343, 109–137, https://doi.org/10.1007/s11104-011-0751-9, 2011.
Loustau, D., Jolivet, C., Lafont, S., Loubet, B., Klumpp, K., Papale, D., and Arrouays, D.: ICOS Ecosystem Instructions for Soil Samples Collection and Preparation, Version 20230727, ICOS Ecosystem Thematic Centre, https://doi.org/10.18160/k3yc-td6h, 2017.
Lu, H., Li, S., Ma, M., Bastrikov, V., Chen, X., Ciais, P., Dai, Y., Ito, A., Ju, W., Lienert, S., Lombardozzi, D., Lu, X., Maignan, F., Nakhavali, M., Quine, T., Schindlbacher, A., Wang, J., Wang, Y., W rlind, D., Zhang, S., and Yuan, W.: Comparing machine learning-derived global estimates of soil respiration and its components with those from terrestrial ecosystem models, Environ. Res. Lett., 16, https://doi.org/10.1088/1748-9326/abf526, 2021.
Mary, B., Clivot, H., Blaszczyk, N., Labreuche, J., and Ferchaud, F.: Soil carbon storage and mineralization rates are affected by carbon inputs rather than physical disturbance: Evidence from a 47-year tillage experiment, Agr. Ecosyst. Environ., 299, https://doi.org/10.1016/j.agee.2020.106972, 2020.
McBratney, A. B. and Minasny, B.: Comment on “Determining soil carbon stock changes: Simple bulk density corrections fail” [Agric. Ecosyst. Environ. 134 (2009) 251–256], Agr. Ecosyst. Environ., 136, 185–186, https://doi.org/10.1016/j.agee.2009.12.010, 2010.
Minasny, B., Malone, B. P., McBratney, A. B., Angers, D. A., Arrouays, D., Chambers, A., Chaplot, V., Chen, Z.-S., Cheng, K., Das, B. S., Field, D. J., Gimona, A., Hedley, C. B., Hong, S. Y., Mandal, B., Marchant, B. P., Martin, M., McConkey, B. G., Mulder, V. L., O'Rourke, S., Richer-de-Forges, A. C., Odeh, I., Padarian, J., Paustian, K., Pan, G., Poggio, L., Savin, I., Stolbovoy, V., Stockmann, U., Sulaeman, Y., Tsui, C.-C., Vågen, T.-G., van Wesemael, B., and Winowiecki, L.: Soil carbon 4 per mille, Geoderma, 292, 59–86, https://doi.org/10.1016/j.geoderma.2017.01.002, 2017.
Molteni, F. and Corti, S.: Long-term fluctuations in the statistical properties of low-frequency variability:dynamical origin and predictability, Q. J. Roy. Meteor. Soc., 124, 495–526, 1998.
Parton, W. J., Hartman, M., Ojima, D., and Schimel, D.: DAYCENT and its and surface submodel: description and testing, Global Planet. Change, 19, 35–48, https://doi.org/10.1016/S0921-8181(98)00040-X, 1998.
Paustian, K., Lehmann, J., Ogle, S., Reay, D., Robertson, G. P., and Smith, P.: Climate-smart soils, Nature, 532, 49–57, https://doi.org/10.1038/nature17174, 2016.
Peng, Y., Chahal, I., Hooker, D. C., and Van Eerd, L. L.: Comparison of equivalent soil mass approaches to estimate soil organic carbon stocks under long-term tillage, Soil Till. Res., 238, https://doi.org/10.1016/j.still.2024.106021, 2024.
Petrescu, A. M. R., McGrath, M. J., Andrew, R. M., Peylin, P., Peters, G. P., Ciais, P., Broquet, G., Tubiello, F. N., Gerbig, C., Pongratz, J., Janssens-Maenhout, G., Grassi, G., Nabuurs, G.-J., Regnier, P., Lauerwald, R., Kuhnert, M., Balkovič, J., Schelhaas, M.-J., Denier van der Gon, H. A. C., Solazzo, E., Qiu, C., Pilli, R., Konovalov, I. B., Houghton, R. A., Günther, D., Perugini, L., Crippa, M., Ganzenmüller, R., Luijkx, I. T., Smith, P., Munassar, S., Thompson, R. L., Conchedda, G., Monteil, G., Scholze, M., Karstens, U., Brockmann, P., and Dolman, A. J.: The consolidated European synthesis of CO2 emissions and removals for the European Union and United Kingdom: 1990–2018, Earth Syst. Sci. Data, 13, 2363–2406, https://doi.org/10.5194/essd-13-2363-2021, 2021.
Poeplau, C. and Don, A.: Carbon sequestration in agricultural soils via cultivation of cover crops – A meta-analysis, Agr. Ecosyst. Environ., 200, 33–41, https://doi.org/10.1016/j.agee.2014.10.024, 2015.
Poeplau, C., Vos, C., and Don, A.: Soil organic carbon stocks are systematically overestimated by misuse of the parameters bulk density and rock fragment content, SOIL, 3, 61–66, https://doi.org/10.5194/soil-3-61-2017, 2017.
Poyda, A., Wizemann, H.-D., Ingwersen, J., Eshonkulov, R., Högy, P., Demyan, M. S., Kremer, P., Wulfmeyer, V., and Streck, T.: Carbon fluxes and budgets of intensive crop rotations in two regional climates of southwest Germany, Agr. Ecosyst. Environ., 276, 31–46, https://doi.org/10.1016/j.agee.2019.02.011, 2019.
Raza, S., Zamanian, K., Ullah, S., Kuzyakov, Y., Virto, I., and Zhou, J. B.: Inorganic carbon losses by soil acidification jeopardize global efforts on carbon sequestration and climate change mitigation, J. Clean. Prod., 315, https://doi.org/10.1016/j.jclepro.2021.128036, 2021.
Rovira, P., Sauras, T., Salgado, J., and Merino, A.: Towards sound comparisons of soil carbon stocks: A proposal based on the cumulative coordinates approach, Catena, 133, 420–431, https://doi.org/10.1016/j.catena.2015.05.020, 2015.
Rumpel, C. and Kögel-Knabner, I.: Deep soil organic matter – a key but poorly understood component of terrestrial C cycle, Plant Soil, 338, 143–158, https://doi.org/10.1007/s11104-010-0391-5, 2011.
Saby, N. P. A., Bellamy, P. H., Morvan, X., Arrouays, D., Jones, R. J. A., Verheijen, F. G. A., Kibblewhite, M. G., Verdoodt, A., Berenyiuveges, J., Freudenschuss, A., and Simota, C.: Will European soil-monitoring networks be able to detect changes in topsoil organic carbon content?, Glob. Change Biol., 14, 2432–2442, https://doi.org/10.1111/j.1365-2486.2008.01658.x, 2008.
Sanderman, J., Hengl, T., and Fiske, G. J.: Soil carbon debt of 12,000 years of human land use, P. Natl. Acad. Sci. USA, 114, 9575–9580, https://doi.org/10.1073/pnas.1706103114, 2017.
Schmidt, M. W. I., Torn, M. S., Abiven, S., Dittmar, T., Guggenberger, G., Janssens, I. A., Kleber, M., Kögel-Knabner, I., Lehmann, J., Manning, D. A. C., Nannipieri, P., Rasse, D. P., Weiner, S., and Trumbore, S. E.: Persistence of soil organic matter as an ecosystem property, Nature, 478, 49–56, https://doi.org/10.1038/nature10386, 6 October 2011.
Schrumpf, M., Schulze, E. D., Kaiser, K., and Schumacher, J.: How accurately can soil organic carbon stocks and stock changes be quantified by soil inventories?, Biogeosciences, 8, 1193–1212, https://doi.org/10.5194/bg-8-1193-2011, 2011.
Schulze, E. D., Luyssaert, S., Ciais, P., Freibauer, A., Janssens, I. A., Soussana, J. F., Smith, P., Grace, J., Levin, I., Thiruchittampalam, B., Heimann, M., Dolman, A. J., Valentini, R., Bousquet, P., Peylin, P., Peters, W., Rödenbeck, C., Etiope, G., Vuichard, N., Wattenbach, M., Nabuurs, G. J., Poussi, Z., Nieschulze, J., and Gash, J. H.: Importance of methane and nitrous oxide for Europe's terrestrial greenhouse-gas balance, Nat. Geosci., 2, 842–850, https://doi.org/10.1038/ngeo686, 2009.
Six, J., Conant, R. T., Paul, E. A., and Paustian, K.: Stabilization mechanisms of soil organic matter: Implications for C-saturation of soils, Plant Soil, 241, 155–176, 2002.
Soleilhavoup, M. and Crisan, M.: Enquête pratiques culturales en grandes cultures et prairies 2017 – principaux résultats (version modifiée), Agreste – Ministère de l’Agriculture et de l’Alimentation, Paris, France, https://agreste.agriculture.gouv.fr/agreste-web/disaron/Chd2009/detail/ (last access: 24 December 2025), 2021.
Song, X. D., Yang, F., Wu, H. Y., Zhang, J., Li, D. C., Liu, F., Zhao, Y. G., Yang, J. L., Ju, B., Cai, C. F., Huang, B. A., Long, H. Y., Lu, Y., Sui, Y. Y., Wang, Q. B., Wu, K. N., Zhang, F. R., Zhang, M. K., Shi, Z., Ma, W. Z., Xin, G., Qi, Z. P., Chang, Q. R., Ci, E., Yuan, D. G., Zhang, Y. Z., Bai, J. P., Chen, J. Y., Chen, J., Chen, Y. J., Dong, Y. Z., Han, C. L., Li, L., Liu, L. M., Pan, J. J., Song, F. P., Sun, F. J., Wang, D. F., Wang, T. W., Wei, X. H., Wu, H. Q., Zhao, X., Zhou, Q., and Zhang, G. L.: Significant loss of soil inorganic carbon at the continental scale, Natl. Sci. Rev., 9, https://doi.org/10.1093/nsr/nwab120, 2022.
Tardieu, F.: Analysis of the spatial variability of maize root density, I. Effect of wheel compaction on the spatial arrangement of roots, Plant Soil, 107, 259–266, https://doi.org/10.1007/bf02370555, 1988.
Thomsen, I. K., Olesen, J. E., Møller, H. B., Sørensen, P., and Christensen, B. T.: Carbon dynamics and retention in soil after anaerobic digestion of dairy cattle feed and faeces, Soil Biol. Biochem., 58, 82–87, https://doi.org/10.1016/j.soilbio.2012.11.006, 2013.
VandenBygaart, A. J. and Angers, D. A.: Towards accurate measurements of soil organic carbon stock change in agroecosystems, Can. J. Soil Sci., 86, 465–471, https://doi.org/10.4141/s05-106, 2006.
von Haden, A. C., Yang, W. H., and DeLucia, E. H.: Soils' dirty little secret: Depth-based comparisons can be inadequate for quantifying changes in soil organic carbon and other mineral soil properties, Glob. Change Biol., 26, 3759–3770, https://doi.org/10.1111/gcb.15124, 2020.
Walvoort, D. J. J., Brus, D. J., and de Gruijter, J. J.: An R package for spatial coverage sampling and random sampling from compact geographical strata by k-means, Comput. Geosci., 36, 1261–1267, https://doi.org/10.1016/j.cageo.2010.04.005, 2010.
Wendt, J. W. and Hauser, S.: An equivalent soil mass procedure for monitoring soil organic carbon in multiple soil layers, Eur. J. Soil Sci., 64, 58–65, https://doi.org/10.1111/ejss.12002, 2013.
Winck, B., Loubet, B., Saby, N., Gebleh, M., Buysse, P., Chenu, J.-P., Ratié, C., Jolivet, C., Kalalian, C., Levavasseur, F., Munera-Echeverri, J.-L., Lafont, S., Loustau, D., Papale, D., Nicolini, G., and Arrouays, D.: Data and R code for the manuscript “Carbon soil stock change in an intensive crop field near Paris reveals significant carbon losses over a decade”, Recherche Data Gouv [data set/code], https://doi.org/10.57745/IDYYFV, 2026.
Xiao, L., Zhou, S., Zhao, R., Greenwood, P., and Kuhn, N. J.: Evaluating soil organic carbon stock changes induced by no-tillage based on fixed depth and equivalent soil mass approaches, Agr. Ecosyst. Environ., 300, 106982, https://doi.org/10.1016/j.agee.2020.106982, 2020.
Xu, L., He, N. P., Yu, G. R., Wen, D., Gao, Y., and He, H. L.: Differences in pedotransfer functions of bulk density lead to high uncertainty in soil organic carbon estimation at regional scales: Evidence from Chinese terrestrial ecosystems, J. Geophys. Res.-Biogeo., 120, 1567–1575, https://doi.org/10.1002/2015JG002929, 2015.
Zamanian, K., Zhou, J. B., and Kuzyakov, Y.: Soil carbonates: The unaccounted, irrecoverable carbon source, Geoderma, 384, https://doi.org/10.1016/j.geoderma.2020.114817, 2021.
Zhang, B., Jia, Y., Fan, H., Guo, C., Fu, J., Li, S., Li, M., Liu, B., and Ma, R.: Soil compaction due to agricultural machinery impact: A systematic review, Land Degrad. Dev., 35, 3256–3273, https://doi.org/10.1002/ldr.5144, 2024.
Zhang, X. X., Whalley, P. A., Ashton, R. W., Evans, J., Hawkesford, M. J., Griffiths, S., Huang, Z. D., Zhou, H., Mooney, S. J., and Whalley, W. R.: A comparison between water uptake and root length density in winter wheat: effects of root density and rhizosphere properties, Plant Soil, 451, 345–356, https://doi.org/10.1007/s11104-020-04530-3, 2020.
Zou, J., Ziegler, A. D., Chen, D., McNicol, G., Ciais, P., Jiang, X., Zheng, C., Wu, J., Wu, J., Lin, Z., He, X., Brown, L. E., Holden, J., Zhang, Z., Ramchunder, S. J., Chen, A., and Zeng, Z.: Rewetting global wetlands effectively reduces major greenhouse gas emissions, Nat. Geosci., 15, 627–632, https://doi.org/10.1038/s41561-022-00989-0, 2022.