the Creative Commons Attribution 4.0 License.
the Creative Commons Attribution 4.0 License.
 | 10 Apr 2026
Wood density variation in European forest species: drivers and implications for multiscale biomass and carbon assessment in France
Henri Cuny
Jean-Daniel Bontemps
Nikola Besic
Antoine Colin
Lionel Hertzog
Amaël Le Squin
William Marchand
Cédric Vega
Jean-Michel Leban
Wood density is a key parameter for estimating forest biomass and carbon stocks. However, the magnitude and the drivers of wood density variation in temperate forests, and the implications of this variation for biomass and carbon assessments, are not well understood. This study provides a comprehensive analysis of wood density variation in trees of western temperate Europe and evaluates its impacts on forest aboveground biomass (AGB) estimates at multiple spatial scales. From an initial dataset comprising wood density measurements from 110 763 individual trees, representing 156 species across mainland France, we analysed a subset of 44 species accounting for 97 % of the growing stock and providing sufficient observations for modelling. We developed linear models of wood density based on tree, stand, site, and climatic variables, and successively examined the contributions of taxonomic identity, environmental factors and their interactions. We also constructed a model using variables potentially accessible through spatial layers (i.e., GIS-based data) at broad scales and fine resolutions, to assess their predictive capacity. Models were applied to French National Forest Inventory (NFI) data to estimate AGB across four spatial scales: the national level, biogeographical regions and subregions (both delineated through biophysical partitioning of the territory) and individual NFI plots. Our analysis revealed that variation in wood density stemmed primarily from interspecific differences (78.6 % of the total variance), with the remaining 21.4 % attributable to intraspecific variability. Our best performing model – combining variables on species identity, tree dimensions (such as diameter at breast height and total height), stand structure, site conditions and climate – explained 82 % of total wood density variation. It captured only a modest portion of intraspecific variability of wood density, which was found to be mainly driven by tree dimensions and mean annual temperature. In contrast, the model relying solely on environmental factors and the one based on GIS-layer variables accounted for 17 % and 31 % of the variation in wood density, respectively. While accounting for wood density variation had minimal impact on national-scale AGB estimates, it caused deviations of up to 30 % at finer scales, such as biogeographical subregions and individual NFI plots. These findings highlight the importance of incorporating wood density variation into forest biomass and carbon assessment, especially at regional to local scales. Given its dominant role, we recommend integrating species identity as much as possible to enhance the accuracy of forest biomass and carbon stock assessment across spatial scales.
- Article
(7609 KB) - Full-text XML
-
Supplement
(1513 KB) - BibTeX
- EndNote


Wood is a major component of terrestrial biomass (Groombridge and Jenkins, 2002), underpinning a wide range of ecological and economic functions (Chave et al., 2009), and mediating some of the largest carbon fluxes between land and atmosphere (Friedlingstein et al., 2023; Pan et al., 2024). A defining feature of wood is its intrinsic variability: properties such as colour, odour, texture, and density can vary markedly – not only between species, but also among individuals of the same species, and even within a single tree (Zobel and van Buijtenen, 1989). Among these traits, basic wood density – defined as the ratio of oven-dry mass to green volume and hereafter referred to simply as wood density – is particularly important and highly variable Zobel and van Buijtenen, 1989). In Europe, for example, wood density ranges from less than 300 kg m−3 in species like Salix alba, to around 600 kg m−3 in Fagus sylvatica, and exceeds 800 kg m−3 in Quercus ilex (Cuny et al., 2025; Zanne et al., 2009).
The evolutionary history of trees and their species identity are prominent determinants of global variation in wood density (Chave et al., 2006; Kerfriden et al., 2021; Li et al., 2024). Nonetheless, climatic variables such as regional variation in mean annual temperature and soil moisture do shape the global distribution of wood density, primarily through their effects on species composition and assemblage patterns (Mo et al., 2024; Yang et al., 2024). Wood density is also closely linked to species' demographic strategies: fast-growing species typically exhibit lower wood density than slow-growing ones (Chave et al., 2009; Fajardo et al., 2024; Nascimento et al., 2005; Sullivan et al., 2025).
At the intraspecific level, wood density varies with tree dimensions (Lachenbruch et al., 2011) and environmental conditions (Chave et al., 2009), particularly climate (Bouriaud et al., 2015; Dalla-Salda et al., 2009). For instance, maximum wood density has been shown to correlate with inter-annual variation in warm seasonal temperatures in several species, making it a valuable proxy for reconstructing past climates (Briffa et al., 1998; Hughes et al., 1984). Wood density is also linked to tree growth rate within species (Guilley et al., 2004; Saranpää, 2003; but see Fajardo et al., 2024; Fajardo, 2016), a relationship that has been used to predict wood properties in silvicultural planning (Houllier et al., 1995).
Because it reflects the amount of dry matter per unit volume, wood density is the key parameter for converting tree volume into biomass, and subsequently into carbon stocks, based on assumptions about carbon content (Doraisami et al., 2024). It thus plays a central role in standard calculation methodologies (Baker et al., 2004; Chave et al., 2004). While tree volume can be relatively easily estimated from external measurements such as stem diameter and height (Vallet et al., 2006), determining wood density requires additional sampling and laboratory analysis. As a result, despite its known variability, wood density is often simplified or overlooked in forest biomass and carbon assessment. Interspecific variation is sometimes partially accounted for, but intraspecific variation is generally ignored. For instance, in the Land Use, Land-Use Change, and Forestry (LULUCF) sector of IPCC national greenhouse gas inventories, Tier 1 guidelines provide average wood density values at the species or genus level (see Table 4.13 in Eggleston et al., 2006).
The Global Wood Density (GWD; Chave et al., 2009; Zanne et al., 2009) and Plant Trait (TRY; Kattge et al., 2020) databases currently represent the most comprehensive global datasets on wood density, covering approximately 8000 and 11 000 species, respectively. Their broad taxonomic and geographic scope is a major strength. However, these datasets compile values from heterogeneous sources, often based on limited and uneven sampling, and using sometimes poorly documented methodologies. This limits their ability to capture intraspecific variation and leads to data gaps, particularly for rare or regionally specific species (Flores and Coomes, 2011; Jenkins et al., 2003).
In France, national estimates of forest biomass and carbon stocks have so far relied on wood density values derived from an unpublished dataset (CARBOFOR project; Loustau, 2004). Some of these values originate from a 170-year-old source (Mathieu, 1855), updated to provide a single average value per species across approximately 50 species. However, these estimates are based on small and unbalanced samples – typically fewer than 10 mature trees per species – and fail to capture the diversity of conditions encountered in French forests, including variability in tree species, tree size, and environmental factors. This raises concerns about the accuracy and representativeness of the resulting biomass and carbon stock estimates.
Besides national inventories, remote sensing technologies are increasingly employed to map the spatial distribution of forest biomass and carbon (Liu et al., 2023; Santoro and Cartus, 2025; Schwartz et al., 2023). These approaches often rely on canopy height estimates derived from lidar or radar data (Pellissier-Tanon et al., 2024), which are converted into volume and biomass using allometric equations (Liu et al., 2023; Ma et al., 2024; Schwartz et al., 2023; Yang et al., 2022) or machine learning models (Su et al., 2025). However, this conversion is typically based on fixed assumptions that overlook wood density variability, introducing substantial uncertainties (Chave et al., 2019; Labrière et al., 2023) and, in some cases, systematic biases in biomass estimates (Phillips et al., 2019; Sæbø et al., 2022). As such, improving our understanding of wood density variation – both within and among species – is increasingly recognised as a critical step toward enhancing the accuracy of forest biomass and carbon mapping (Sæbø et al., 2022).
Although several recent studies have investigated wood density variation, most have concentrated on interspecific differences at the global scale (Mo et al., 2024; Yang et al., 2024) or within tropical forest ecosystems (Phillips et al., 2019; Sullivan et al., 2025). In contrast, the present study addresses wood density variation in temperate forests by explicitly disentangling interspecific and intraspecific components, and assessing for their impacts on forest biomass estimates at different spatial scales.
To this end, we used the XyloDensMap dataset, which comprises wood density measurements for 110 763 individual trees sampled across a network of forest plots evenly distributed throughout mainland France (Cuny et al., 2024, 2025). Based on this extensive and spatially representative dataset, our study pursued four main objectives: (1) quantify variation in wood density at the interspecific and intraspecific levels across temperate forest species; (2) identify and measure the intensity of the biotic and abiotic drivers of this variation; (3) map how this variation translates into the spatial distribution of wood density; (4) evaluate the impact of accounting for this spatial distribution on biomass and carbon estimates at multiple spatial scales.
To address these objectives, we developed linear models incorporating tree, stand, site, and climate variables. Models were used to quantify wood density variation at both interspecific and intraspecific levels and to identify its main drivers. They were subsequently applied to predict wood density for the 1 221 584 trees measured by the French National Forest Inventory (NFI) between 2005 and 2022. This enabled us to map wood density distribution across France and estimate aboveground forest biomass at four distinct spatial scales: national totals, totals for biogeographical regions and subregions – both delineated through biophysical partitioning of the territory – and individual NFI forest plots.
2.1 Dataset
2.1.1 The XyloDensMap dataset
The XyloDensMap open dataset comprises individual wood density measurements from 110 763 wood increment cores collected at breast height in mainland France (Cuny et al., 2024, 2025). Data were obtained by combining the spatially systematic sampling design of the French National Forest inventory (NFI) and a high-throughput method of wood density measurement by X-ray Computed Tomography (Freyburger et al., 2009; Jacquin et al., 2019). Owing to the systematic nature of the NFI's annual sampling framework (Bontemps and Bouriaud, 2024; Bouriaud et al., 2023), the XyloDensMap dataset is representative of the French forest, especially in terms of species diversity and tree size distribution (Cuny et al., 2025). Full details on sampling design, sample processing and wood density measurement are provided in the corresponding data descriptor (Cuny et al., 2025).
The XyloDensMap dataset provides four different wood density values, depending on whether anhydrous or green volume is used as a reference, and whether or not a weighting method is applied to calculate an average wood density representative of the entire stem cross-section (Williamson and Wiemann, 2010). The weighted mean basic wood density (hereafter called wood density) was used here. It corresponds to the ratio of dry mass to green volume that can be used for effective conversion of tree green volume into dry biomass under the assumption of the homogeneity of wood density in the whole tree (but see Billard et al., 2021).
2.1.2 Variables used to model wood density
The French NFI acquires tens of variables related to tree, stand, soil and flora characteristics. Based on correlation analysis (with consideration of the variance inflation factors, see below) and current knowledge of the drivers of wood density variability (see, e.g., Bergès et al., 2008; Bouriaud et al., 2004, 2015; Franceschini et al., 2013; Guilley et al., 2004; Mo et al., 2024; Yang et al., 2024), an initial selection was made on these variables to retain a subset of 16 variables available for all trees inventoried by the French NFI and of potential interest for modelling wood density (Table 1). Given that tree dimensions such as diameter at breast height (DBH) and total height are highly correlated with each other, we decided to rather use DBH and an indicator of tree slenderness, as estimated from the ratio between the total tree height (in m) and the square root of DBH (in cm) (Vallet et al., 2006).
Table 1Overview of the 20 candidate variables considered for wood density modelling (see Table S1 in the Supplement for details on the variables).
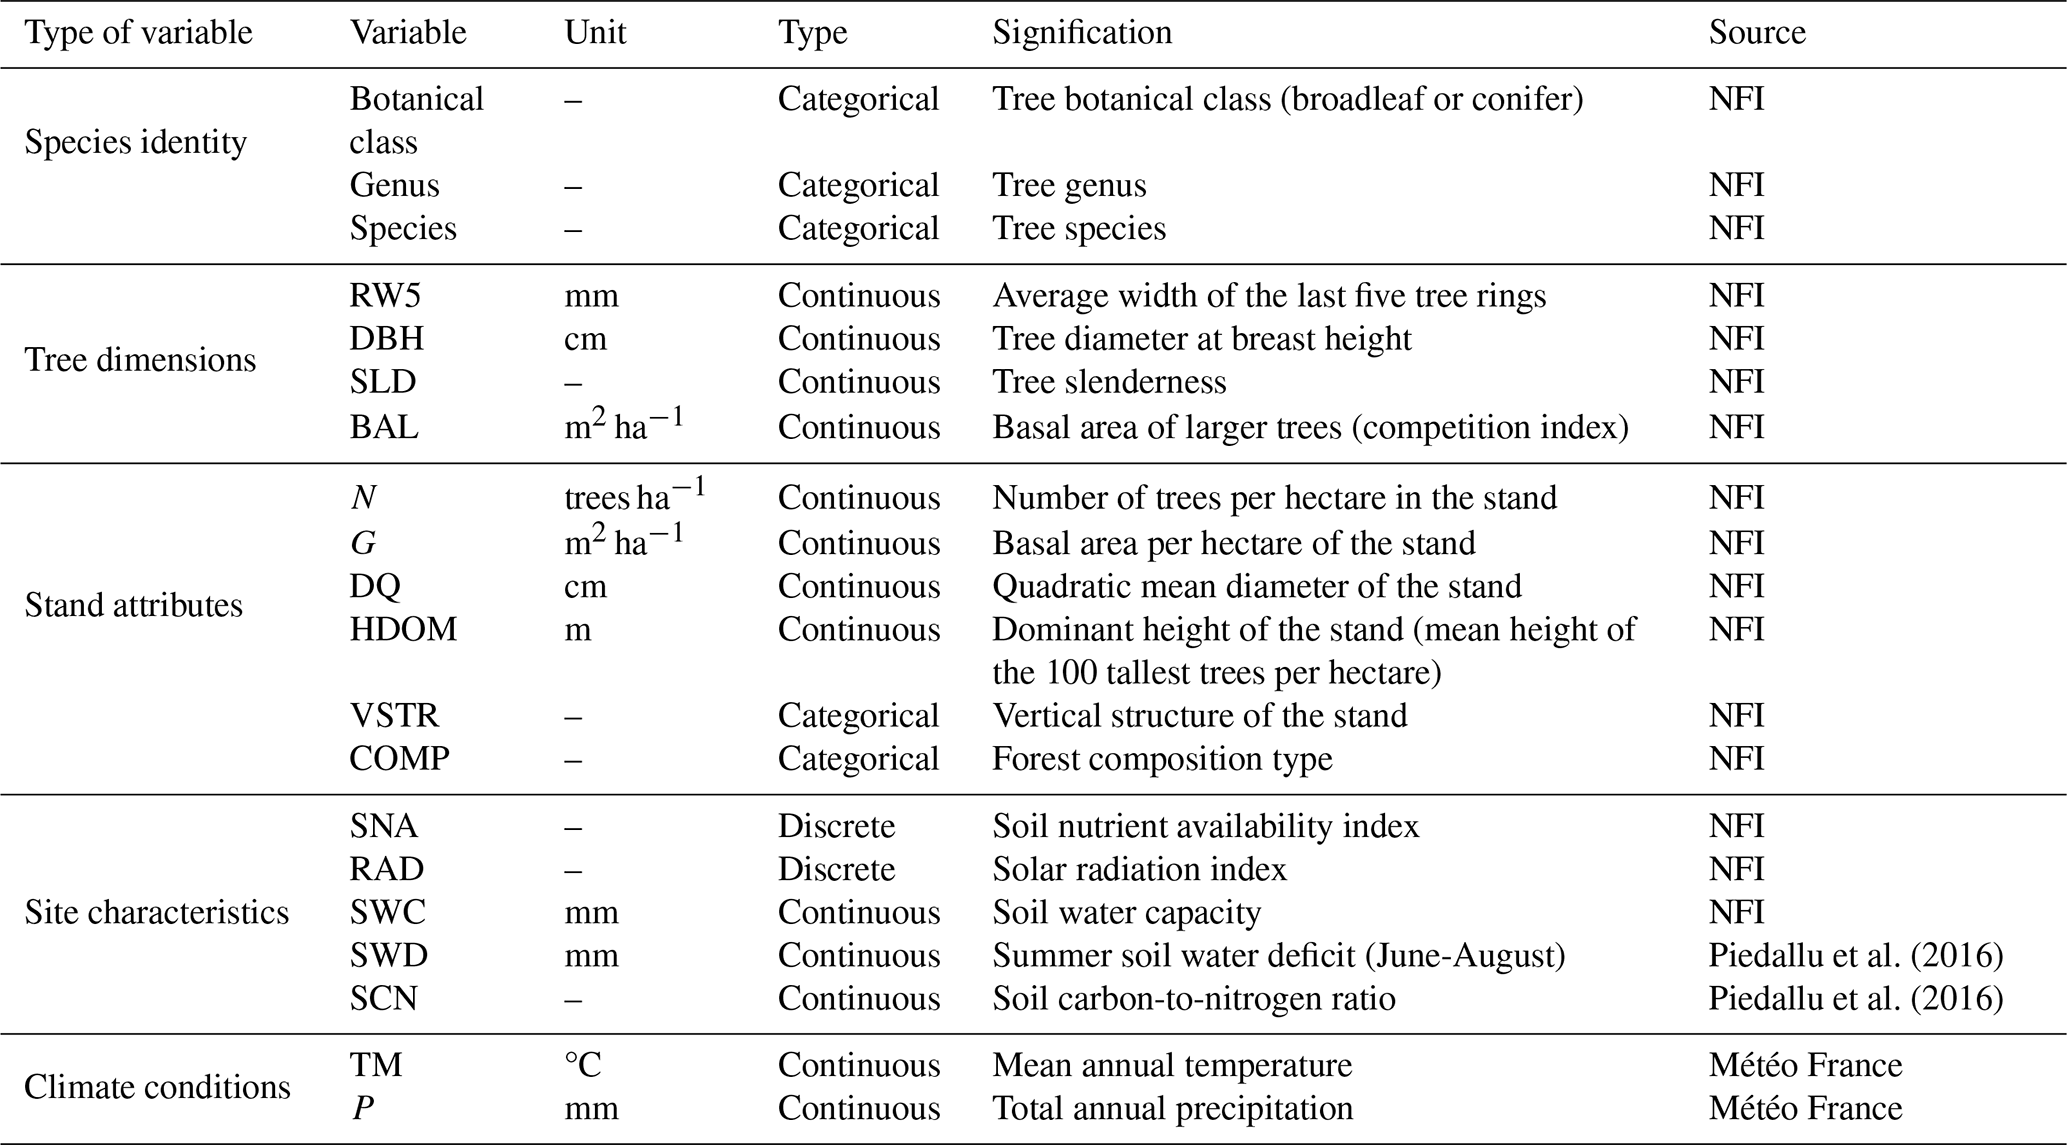
In addition, two soil variables – summer soil water deficit and carbon-to-nitrogen ratio (Piedallu et al., 2016) – and two climatic normals – mean annual temperature and total annual precipitation – averaged over the 1991–2020 period (Météo France, AURELHY model; see Canellas et al., 2014), all available at kilometric resolution, were extracted for each sample plot location. Thus, a total of 20 variables encompassing tree, stand, site, and climate characteristics were identified and considered for modelling wood density (Table 1; see Table S1 in the Supplement for details on variable calculations).
2.1.3 Data processing
The XyloDensMap dataset contains wood density records obtained from wood increment cores that can represent different proportions of the tree radius. Given the radial variability of wood density within stems (Lachenbruch et al., 2011), we retained only those increment cores that represented more than 50 % of the tree radius (amounting to 78 377 out of 110 763 cores) to ensure a more representative estimate of stem wood density.
Due to the systematic sampling of the French NFI, the number of wood density measurements in the XyloDensMap dataset is proportional to the abundance of tree species across space, which varies strongly (Bontemps et al., 2019), and has immediate consequence on the number of wood density measurements available for each species (Cuny et al., 2025). Because of this unbalanced distribution, models were built for a subset of species showing at least 150 wood density measurements for the sake of model training and testing. This resulted in a dataset with 75 256 individual wood density values for 44 tree species. Availability of the 19 candidate predictors and removal of a few outlier values (defined as exceeding four standard deviations above and below the mean) led to discard an additional 1107 wood density records, to reach 74 149 wood density values in the final subset of data considered for modelling (Table S2).
Selected species covered different wood structures types, with nine conifer species (tree rings mainly composed of tracheids with decreasing cell-diameter and increasing wall-thickness from early- to latewood) and 35 broadleaf species, including nine ring-porous species (tree rings containing many wide vessels in earlywood marking a sharp transition with dense latewood), 12 diffuse-porous species (vessels of similar size evenly distributed across a tree ring), and 14 semi ring-porous species (intermediate structure between ring-porous and diffuse-porous species). Selected tree species ensure a 97 % coverage of the forest growing stock in mainland France (as estimated with the French NFI data from the 2016–2019 collection years and the NFI estimation process, which can be run online at https://ocre-gp.ign.fr/ocre, last access: 18 March 2026).
2.1.4 Preliminary data exploration
All analyses presented in this study were performed using the R statistical software version 4.3.2 (R Core Team, 2023).
The mean wood density in the final selected dataset was 575 ± 112 kg m−3 (mean ± standard deviation), with individual values ranging from approximately 200 kg m−3 to over 1000 kg m−3. On average, broadleaf species exhibited higher wood density than conifers (612 ± 92 vs 438 ± 63 kg m−3). Boxplots by species highlighted large interspecific variation, with a gradient among broadleaf species from low-density genera such as Populus, Tilia, and Alnus, to high-density genera like Quercus (Fig. S1). Wood density ranged from 381 ± 47 kg m−3 in Populus spp. to 854 ± 67 kg m−3 in Quercus ilex. Among conifers, species from the genera Abies and Picea exhibited lower wood density compared to those from Pinus, and wood density ranged from 387 ± 44 kg m−3 in Picea abies to 534 ± 42 kg m−3 in Pinus halepensis.
These boxplots also revealed substantial intraspecific variation. For example, wood density in Quercus petraea – the broadleaf species with the largest growing stock in mainland France – ranged from 436 to 890 kg m−3. Similarly, Abies alba, the conifer species with the largest growing stock, showed wood density values ranging from 263 to 605 kg m−3. Density plots indicated that within each species, wood density followed a unimodal, bell-shaped distribution (Fig. S2).
Preliminary exploration of the covariate data shows moderate collinearity among a limited number of variables (Fig. S3). It also revealed potentially non-linear relationships between wood density and the variables related to tree dimensions (average width of the last five rings, tree diameter, tree slenderness, and basal area of larger trees), associated to a right-skewed distribution of these variables. A logarithm transformation of the predictors linearised the relationships and ensured more centred distributions (Fig. S4).
Correlation analyses revealed species-specific relationships between wood density and candidate variables, particularly those related to tree dimensions (notably average width of the last five rings, tree diameter and slenderness; Table S3). For example, the relationship between wood density and the average width of the last five tree rings was systematically positive in ring-porous broadleaf species and always negative for conifers, while for semi-ring porous and diffuse porous broadleaf species the direction of the relationship was negative or positive depending on the species.
2.2 Modelling approach
To detect the drivers of wood density variation and the magnitude of their effects, we fitted four linear models using the lm function in R, each incorporating different combinations of explanatory variables (Fig. 1). These models span a gradient of input type and resolution, from those leveraging fine attributes uniquely available through NFI field plot data, such as detailed tree- and stand-level characteristics, to models relying exclusively on coarser ecological and forest descriptors potentially accessible via GIS-layer data for remote sensing applications. This modelling framework was designed to disentangle the contributions of different predictive drivers and to assess how data type and granularity influence the accuracy of wood density estimates.
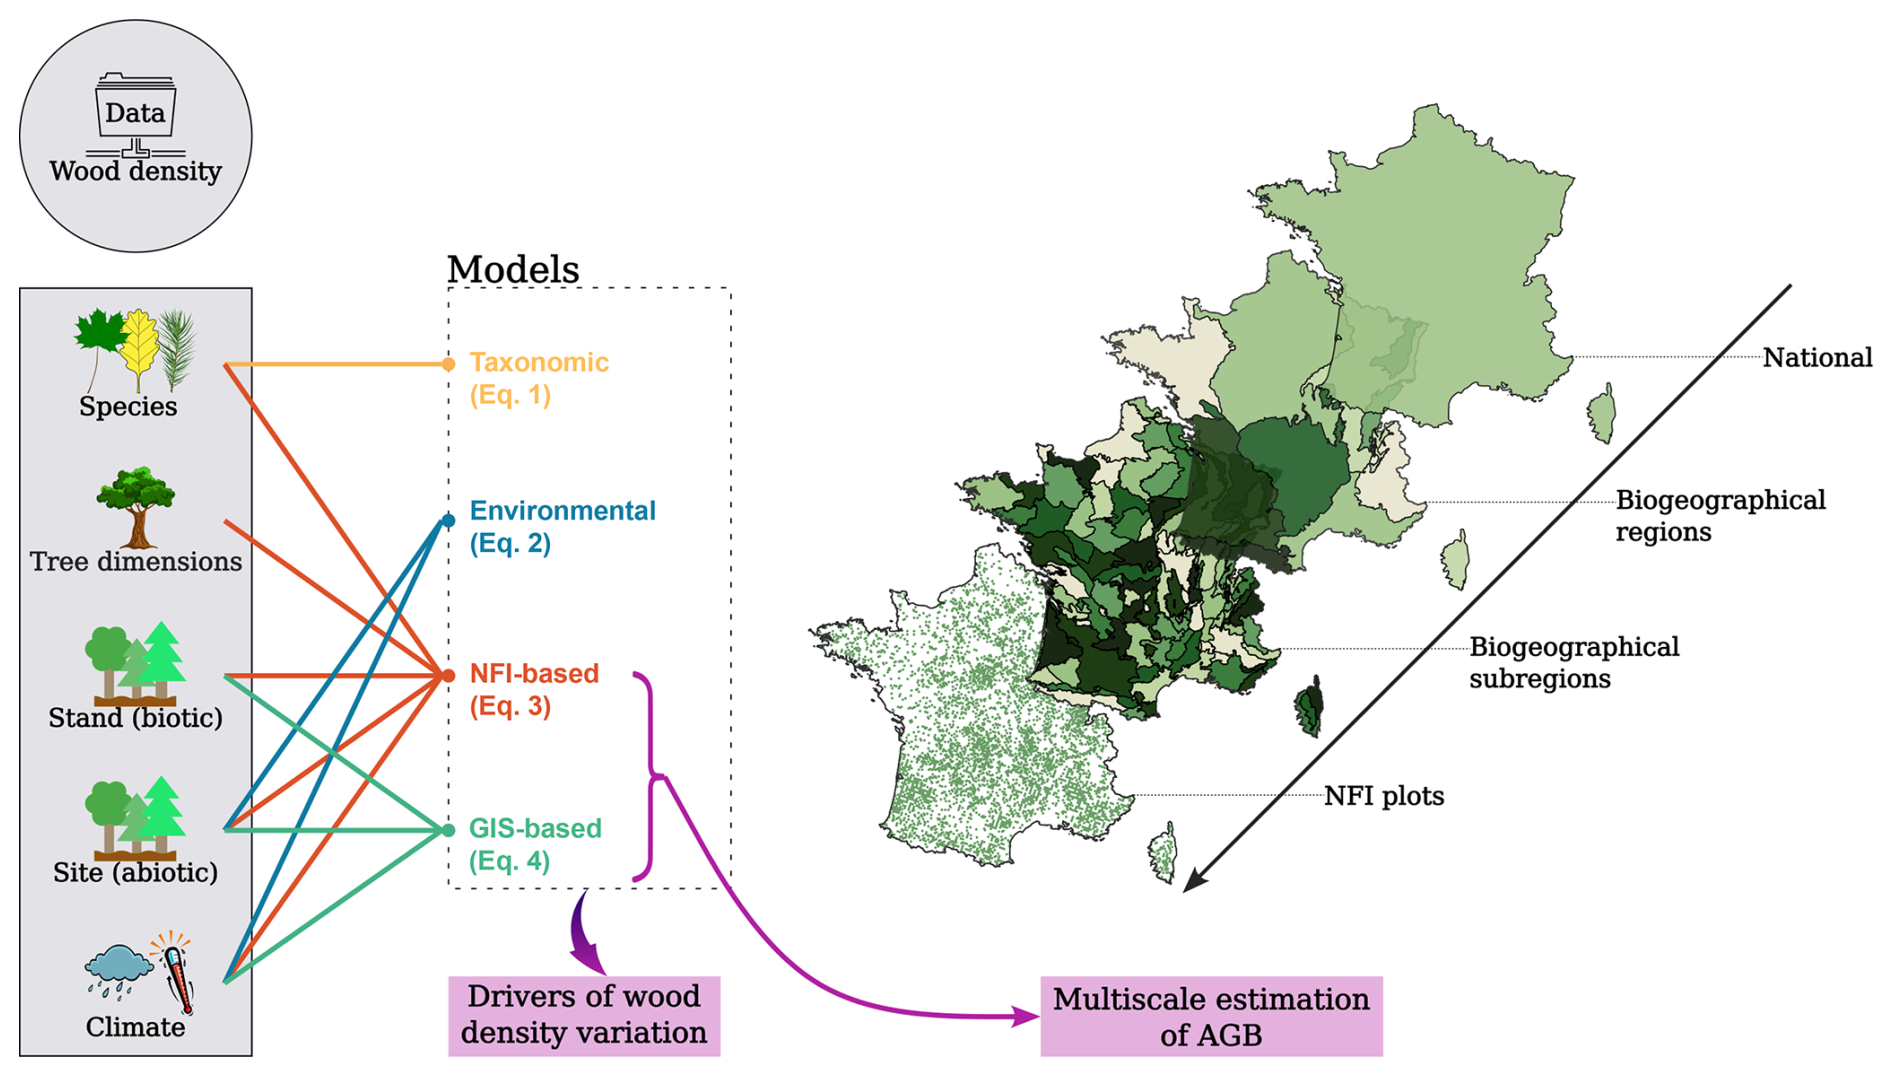
Figure 1Overview of the modelling framework. Data on wood density (dependent variable) and a suite of tree-, stand-, site-, and climate-level variables (shown in grey rectangle) were used to develop four statistical models aimed at identifying the main drivers of wood density variation. In parallel, two of these models (the “NFI-based model” and the “GIS-based model”), alongside a single mean coefficient, were applied to the French National Forest Inventory (NFI) data to predict wood density values and calculate forest aboveground biomass (AGB) stocks across four spatial scales.
2.2.1 Taxonomic model
To characterise interspecific variation in wood density and evaluate taxonomic influence, we developed a first linear model (hereafter referred to as the “taxonomic model”) incorporating the three following hierarchical taxonomic levels: botanical class, genus, and species. The model was expressed as follows:
where WDi is the wood density of individual i, α is the model intercept, and β1, β2, and β3 are the coefficients associated with botanical class (bc), genus (g), and species (sp), respectively. The residual error term εi is assumed to be normally distributed. To quantify the relative contribution of each taxonomic level to interspecific variability, we conducted a Type I analysis of variance (ANOVA) on this model using the anova function in R.
2.2.2 Environmental model
Environmental factors can influence wood density both interspecifically – through species composition – and intraspecifically – via tree development and stand conditions. To assess these effects independently of species identity, tree dimensions and stand characteristics, we constructed a second model (hereafter referred to as the “environmental model”) using only site and climate variables. The model was formulated as:
with WDi the wood density of individual i, α the model intercept, and β1, β2, β3, etc. the model coefficients associated with the covariates soil nutrient availability index (SNA), solar radiation index (RAD), soil water capacity (SWC), etc. that can be found in Table 1. εi is the normally distributed residual error term.
Although additional variables – including soil pH, annual number of frost days, annual number of rainy days, and the De Martonne aridity index – were initially tested, they were excluded due to high collinearity and negligible gains in model performance.
2.2.3 NFI-based model
To identify the most influential drivers of wood density variation, we developed a third model (hereafter referred to as the “NFI-based model”) combining species identity and environmental descriptors along with detailed NFI variables related to tree- and stand-characteristics. Stand dominant height was excluded due to its correlation with tree slenderness and was instead incorporated into a separate model (see below). Likewise, summer soil water deficit and carbon-to-nitrogen ratio, which are not directly available from NFI data, were excluded to avoid unnecessary model complexity, as their inclusion did not improve model performance. By integrating data at both the individual tree and stand scales, this model was designed to maximise precision in explaining wood density variation and to serve as a benchmark for comparison with other approaches. It is not, however, intended for direct spatial extrapolation, as the underlying data are restricted to NFI plots (e.g., detailed tree measurements) and cannot be generalised to broader scales or finer resolutions.
Log-transformations were applied to variables related to tree dimensions – average width of the last five tree rings (RW5), tree diameter at breast height (DBH), tree slenderness (SLD) and basal area of larger trees (BAL) – to linearise relationships and normalise distributions. For zero RW5 values (representing trees with ring widths thinner than the field measurement resolution), we applied the transformation log (RW5 + 0.1), with 0.1 corresponding to field measurement resolution. Likewise, log (BAL + 1) was used to accommodate zero BAL values (which represent the largest tree on the plot). To account for species-specific effects, interaction terms between tree species and each continuous predictor were incorporated. The model took the following form:
with WDi the wood density of individual i, α the model intercept for the tree of species sp, and β1, β2, β3, etc. the species-specific coefficients associated with the covariates (RW5, DBH, SLD, etc.) that can be found in Table 1. εi is the normally distributed residual error term. We assessed multicollinearity using the variance inflation factors (VIF) computed with the vif function from the R package car(Fox and Weisberg, 2019). All VIF values for the selected predictors were below 5, indicating acceptable levels of collinearity.
2.2.4 GIS-based model
A fourth model (hereafter referred to as the “GIS-based model”) was developed using variables potentially available at the national scale and at high spatial resolution through GIS layers. This model was designed to assess the feasibility of reconstructing wood density variation using data available at broad scales, without relying on detailed tree- or stand-level descriptors such as those provided by NFI data and incorporated in the “NFI-based model”. In addition to mean annual temperature and total annual precipitation, selected for their ready accessibility at broad scales and fine resolution, three further variables were incorporated, chosen either for their current availability or for their potential to be represented through GIS layers: stand dominant height (defined as the mean height of the 100 tallest trees per hectare), vertical stand structure (four classes determined from NFI data: regular forest, irregular forest, coppice, forest-coppice mix), and stand composition. Stand dominant height and vertical structure were derived from NFI field data but could also be estimated through remote sensing methods (Besic et al., 2025; Martin-Ducup et al., 2025; Schwartz et al., 2023). Stand composition is already available for the entirety of mainland France through the BD Forêt open access map that classifies forest cover into 32 forest types based on aerial photograph analyses (https://www.data.gouv.fr/fr/datasets/bd-foret-r/, last access: 18 March 2026). The “GIS-based model” was expressed as follows:
with WDi the wood density of individual i, α the model intercept, β1, β2 the model coefficients associated with the categorical covariates stand vertical structure (vstr) and stand composition (comp), and β3, β4, β5 the model coefficients associated with the continuous covariates mean annual temperature (TM), total annual precipitation (P), and stand dominant height (HDOM). εi is the normally distributed residual error term.
2.2.5 Model evaluation
We applied repeated spatial k-fold cross-validation to evaluate model performance and predictive ability (Roberts et al., 2017). In this approach, the dataset is partitioned into k spatial blocks; models are fitted on k-1 blocks and validated on the remaining block, with the procedure repeated until each block has served once for validation. In our case, biogeographical subregions served as spatial blocks. Biogeographical subregions – 86 classes in total – are defined by the French NFI as “sufficiently large geographical areas within which the combination of values taken by the factors determining forest production or the distribution of forest habitats is original” (Cavaignac, 2009; https://inventaire-forestier.ign.fr/spip.php?rubrique267, last access: 1 April 2026). Because they differ systematically in key factors shaping forest characteristics (e.g., soil type, climate), this design minimises autocorrelation between training and testing subsets. We used five folds (i.e., at each repetition of the biogeographical subregions were used for training and for testing, repeated five times), and repeated the entire procedure 100 times. In total, each model was evaluated across 500 iterations (5 folds × 100 repetitions). Implementation was carried out using the group_vfold_cv function of the rsample package (Frick et al., 2025). The final models were built using the whole dataset.
2.3 Model application
2.3.1 Predicting wood density on French NFI data
We computed wood density for the French NFI dataset – comprising 1 221 584 trees across 104 199 plots inventoried between 2005 and 2022 in mainland France – using three distinct approaches that reflect a gradient in how wood density variability is incorporated into aboveground biomass (AGB) estimates. First, we used the “NFI-based model” described in Eq. (3), which provides a detailed representation of wood density variation based on tree-, stand-, site-, and climate-level information. Second, we applied the “GIS-based model” outlined in Eq. (4), which captures wood density variation using coarser, yet highly resolved, predictors potentially accessible via GIS layers. Lastly, we applied a constant mean wood density uniformly across all trees, thereby ignoring wood density variation. This mean value was derived from the XyloDensMap dataset, based on wood density measurements from increment cores covering more than 50 % of the tree radius.
The “taxonomic model” and “environmental model” were excluded from direct prediction: the “taxonomic model” served to explore species identity and its influence (integrated into the “NFI-based model”), while the “environmental model” was used to isolate and refine environmental effects (also at least partially integrated in the “NFI-based model” and in the “GIS-based model”).
Models enabled wood density predictions for 97 % of the trees in the NFI dataset. For the remaining 3 % – trees belonging to species for which no model was developed – we used species-specific mean wood density values calculated from the XyloDensMap dataset (based on increment cores covering more than 50 % of the tree radius). For rare species present in the NFI data but not covered in the XyloDensMap dataset (0.04 % of trees), we used genus-level averages (0.01 % of trees), or, when genus-level data were unavailable, botanical class-level averages (broadleaf or conifer; 0.03 % of trees).
2.3.2 Estimating aboveground biomass and carbon at multiple scales in French forests
We used the three types of predicted wood density (“NFI-based model” predictions, “GIS-based model” predictions, constant mean) to calculate the AGB of each tree inventoried by the French NFI using the following Eq. (5):
where AGB is the tree aboveground biomass of individual i (in tons), AGV is the tree aboveground volume (stem and branches; in m3) calculated by French NFI using allometric equations (Vallet et al., 2006), and wood density is the corresponding wood density predicted according to one of the three approaches (in kg m−3).
The three AGB values calculated for each tree using the different wood density estimates were then integrated into the standard NFI processing workflow to estimate forest AGB stocks at four spatial scales: (1) at the national level; (2) across the 11 biogeographical regions and (3) 86 biogeographical subregions delineated by the French NFI based on biophysical partitioning of the territory (Cavaignac, 2009); and (4) for each of the 104 199 forest plots (700 m2 each) inventoried by the French NFI from 2005 to 2022 (Fig. 1). Biomass values were further expressed as carbon using a fixed wood carbon content of 47.5 %, which reflects a global average (Doraisami et al., 2022) and does not account for inter- or intra-specific variation.
2.3.3 Mapping wood density in France
The wood density predicted using the “NFI-based model” for each tree recorded in the NFI dataset was further used to calculate a community-wide mean wood density (CWD; Swenson and Enquist, 2007) for each NFI forest plot, in order to assess the implications of the spatial distribution of wood density on forest AGB assessments. To do this, estimated individual wood density values were averaged at the plot level, taking into account the weight of each tree in the statistical sampling (as provided by the French NFI) as well as the total aerial volume of each tree:
where CWD is the community-wide mean wood density (in kg m−3) for a plot of n individuals scaled to per hectare, WDi is the predicted wood density (in kg m−3) using the “NFI-based model”, AGVi is the aboveground volume (in m3) and wi is the statistical weight in NFI sampling design (in number of stems ha−1) of the ith tree.
3.1 Drivers of wood density variation
3.1.1 Taxonomic influence on wood density variation
The “taxonomic model” presented in Eq. 1 revealed that the botanical class alone explained 40.2 % of the variance in wood density. The finer levels (genus and species) contributed an additional 38.4 % of variance, with genus alone representing 30.8 % (Table S4; yet 32 % of studied species were alone in their genus). Altogether, species-level taxonomic information therefore explained 78.6 % of the total variation in wood density, highlighting the dominant role of interspecific differences. The remaining 21.4 % reflects intraspecific variability.
3.1.2 Environmental influence on wood density variation
The “environmental model” presented in Eq. (2) was intended to isolate the influence of environmental factors on wood density, deliberately excluding those related to species identity, tree dimensions, and stand structure. This model accounted for 17 % of the total variation in wood density, underscoring the limited explanatory power of environmental descriptors when considered in isolation. Among these, mean annual temperature exhibited a strong positive effect, increasing wood density by approximately 17.4 ± 0.3 kg m−3 °C−1. Soil nutrient availability, solar radiation, and summer soil water deficit exhibited positive effects, whereas total annual precipitation, soil water capacity, and the carbon-to-nitrogen ratio showed negative effects. Variable importance analysis identified mean annual temperature as the most influential factor in this model, with a relative importance of 37 %. It was followed by summer soil water deficit (25 %) and carbon-to-nitrogen ratio (17 %), while other variables contributed less (< 10 % each).
3.1.3 Identifying the main drivers of wood density variation
Variation in wood density was further analysed using the “NFI-based model” presented in Eq. (3), integrating variables related to tree, stand, site, and climate. This model explained 82 % of the total variance in wood density. Within the 21.4 % representing intraspecific variability, 18 % remained unexplained, while 3.4 % was attributable to interactions between species and covariates, thus accounting for a very modest share of intraspecific variation in wood density.
Results from the variable importance analysis showed that tree dimension variables – specifically the mean width of the last five annual rings, the diameter at breast height, and tree slenderness – were the most influential on intraspecific variation (Fig. 2). Mean annual temperature also contributed, though to a lesser extent, while the remaining variables had only marginal explanatory power.
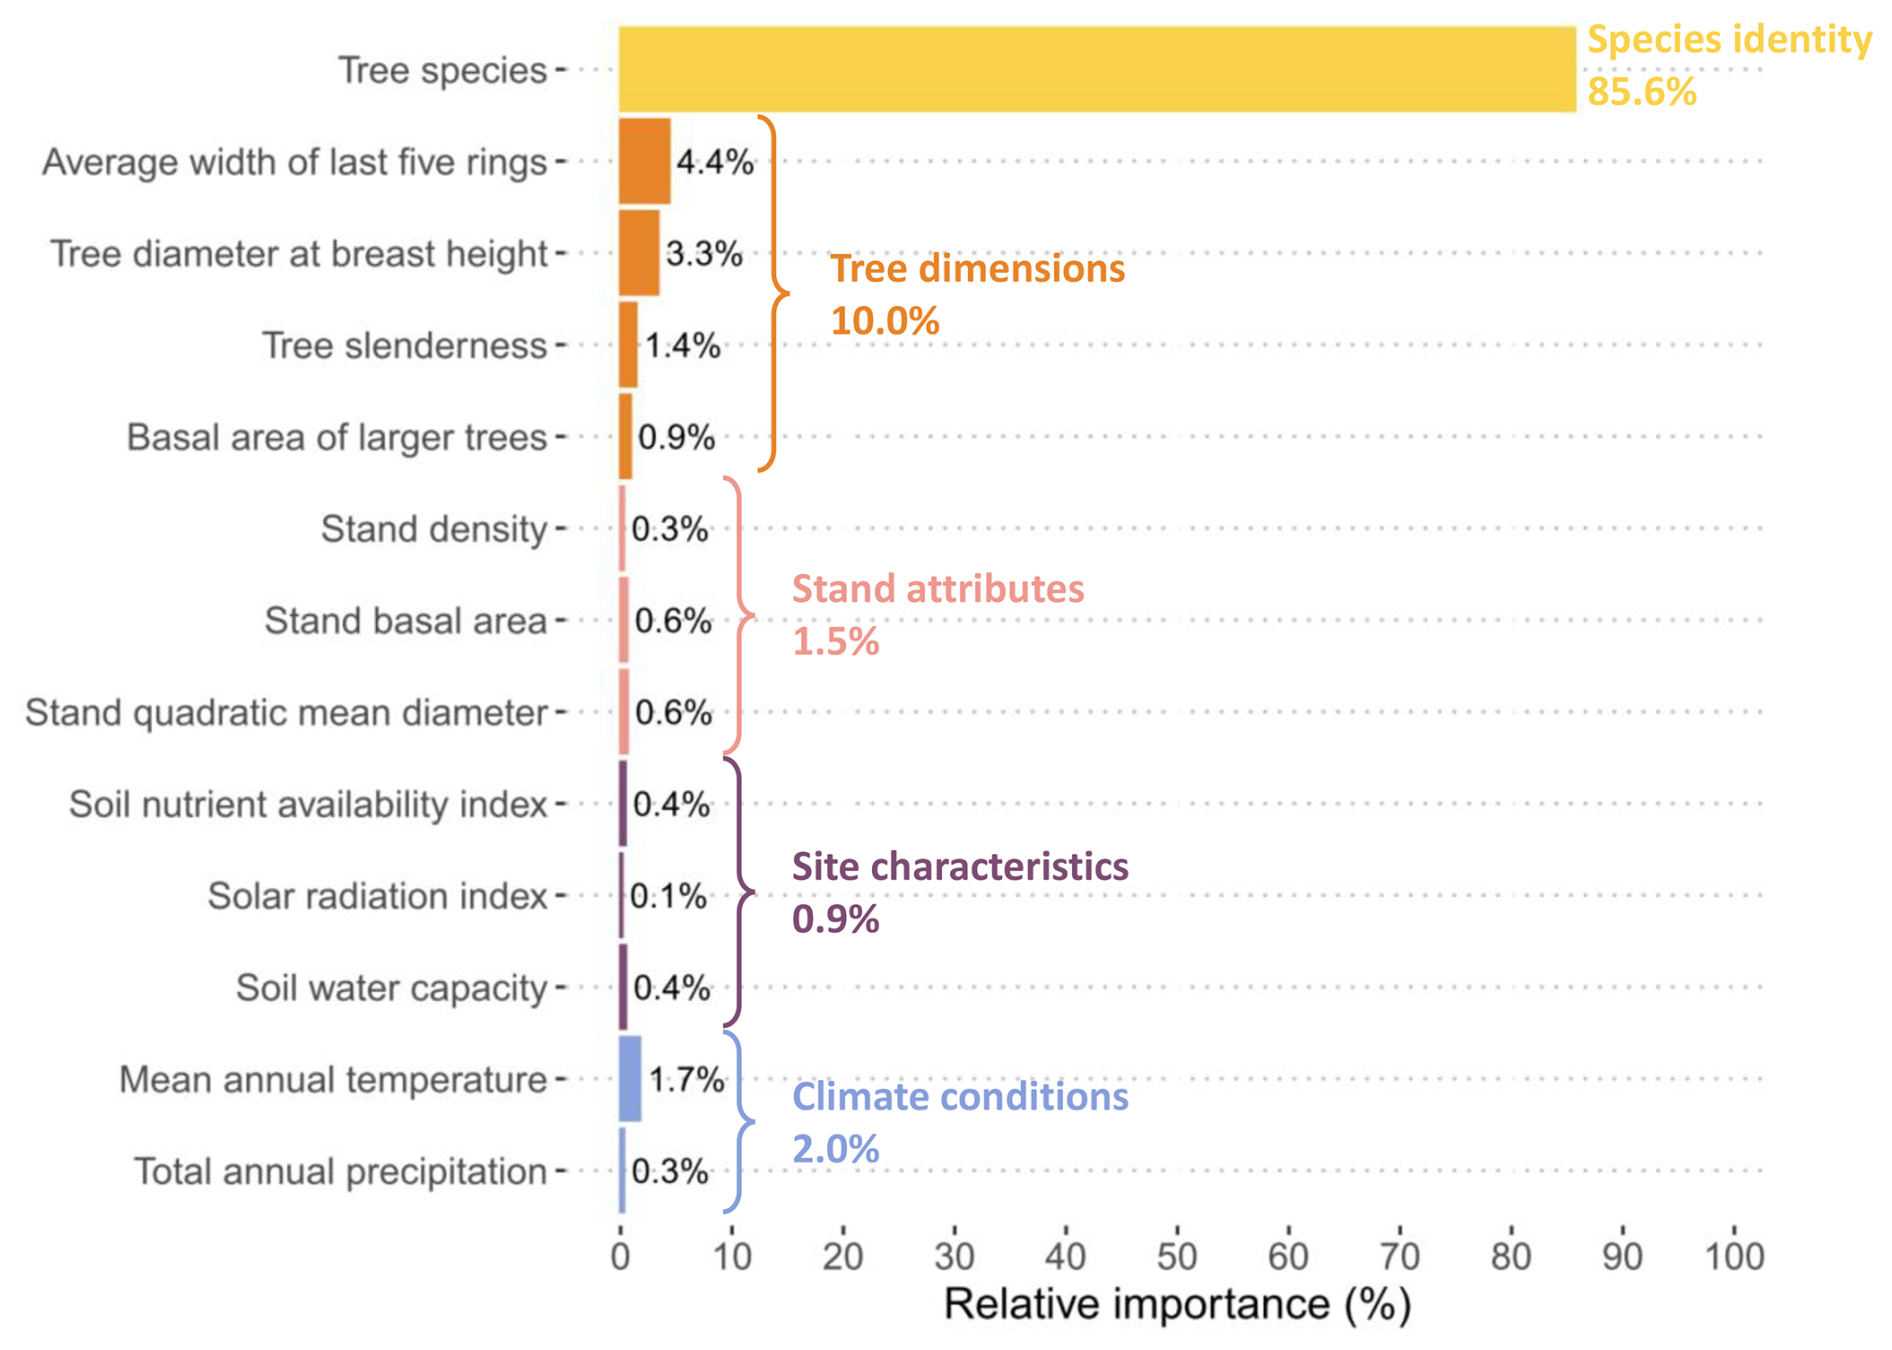
Figure 2Relative importance (in %) of predictive variables in the “NFI-based model” of wood density variation. Variable importance was estimated using the lmg method. For each continuous variable, a species-specific interaction term was included in the model. For average width of the last five rings, tree diameter at breast height, tree slenderness and basal area of larger trees, a log-transformation was applied.
3.1.4 Species-specific patterns of wood density variation
Looking at intraspecific variation in wood density, the significance of model coefficients in the “NFI-based model” supported the findings from the variable importance analysis. Across species, tree dimension variables were the most significant predictors – particularly the average width of the last five rings and tree slenderness, both significant for 32 out of 44 species, followed by the diameter at breast height, significant for 31 species (see Table S5). Mean annual temperature also showed a strong association with wood density, emerging as a significant predictor in more than half of the species examined (24 out of 44).
All coefficients of the “NFI-based model” are provided in Table S6. They revealed clear trends across tree botanical classes or wood structure types. For example, the effect (considering significant effects only) of the average width of the last five rings on wood density was always positive in ring-porous species, but systematically negative in diffuse porous and conifer species (Fig. 3). Among semi ring-porous species, the effect was negative solely for Populus tremula.
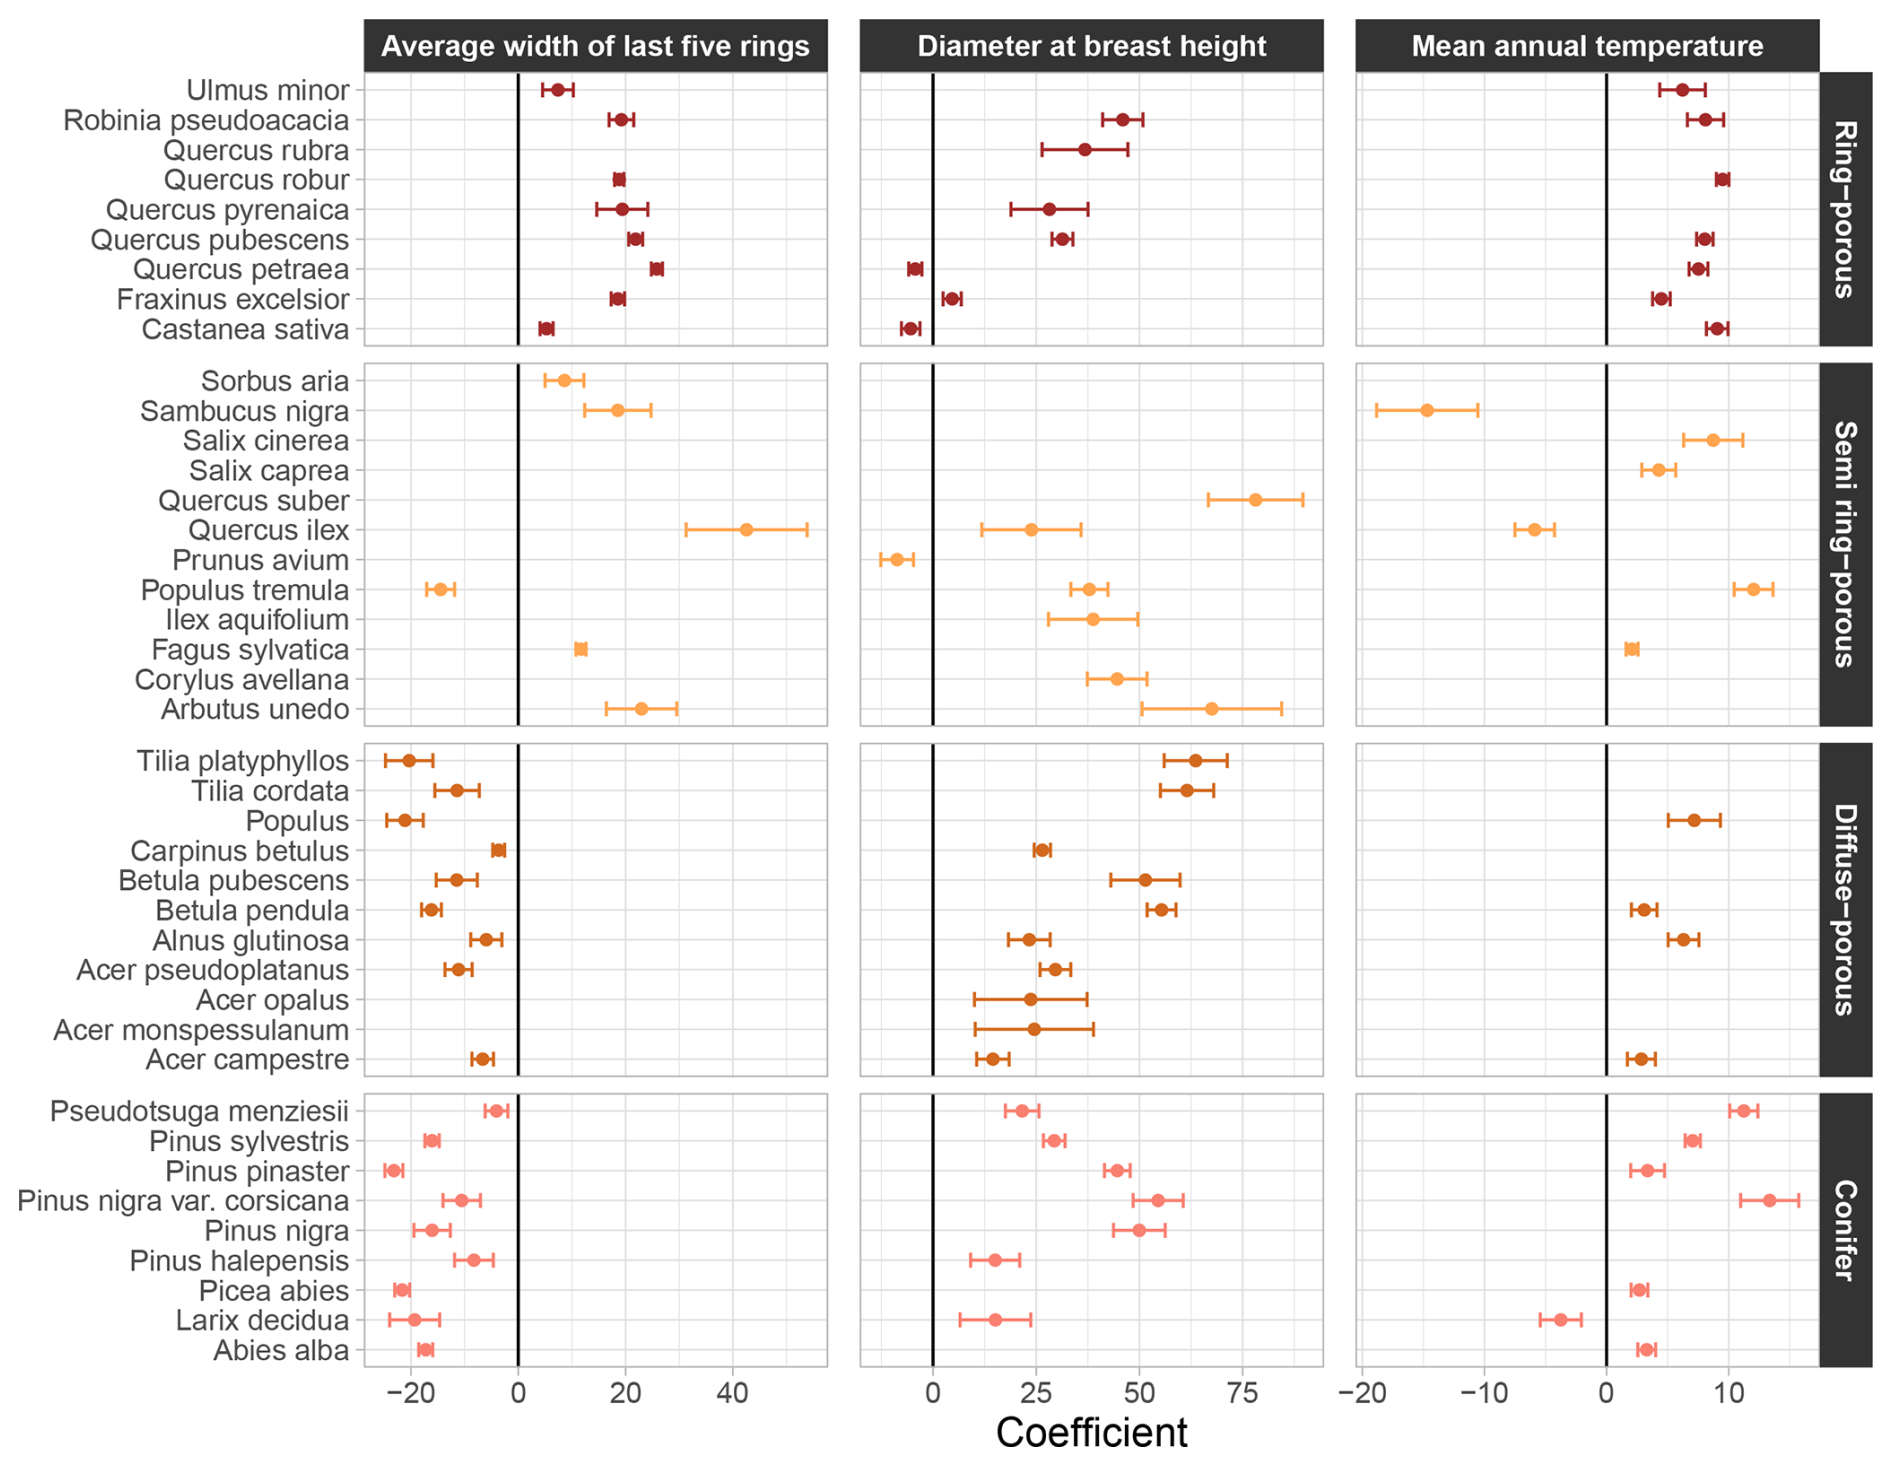
Figure 3Coefficients affected to the average width of the last five tree rings, the diameter at breast height and the mean annual temperature in the “NFI-based model” of wood density variation. Error bars represent the standard error around coefficients. Unsignificant coefficients are not shown. For the average width of the last five tree rings and the diameter at breast height, coefficients are on the log scale.
Regarding the tree diameter at breast height, the effect on wood density was positive across all species, except for Castanea sativa, Quercus petraea, and Prunus avium (Fig. 3). The effect of the tree slenderness was also positive in conifers, except for Abies alba, and mostly negative in broadleaf species, with the exception of Arbutus unedo, Carpinus betulus and Tilia cordata (Table S6).
The effect of mean annual temperature on wood density was found mainly positive across species, except for Quercus ilex, Sambucus nigra, and Larix decidua (Fig. 3). By contrast, the effect of soil water capacity was negative, with the exception of Quercus rubra, Sambucus nigra, and Pseudotsuga menziesii (Table S6). These results suggest that, within species, trees growing in warmer and drier regions tend to produce denser wood compared to those in cooler and wetter environments.
3.1.5 GIS-accessible drivers of wood density variation
The “GIS-based model” presented in Eq. (4) and using only variables potentially available via GIS layers accounted for 31 % of wood density variation. According to the lmg method, forest composition type emerged as the most influential predictor, with a relative importance of 68 %, in line with results from the “taxonomic model”. It was followed by the mean annual temperature (16 %), while stand structure, total annual precipitation and stand dominant height contributed less (7 %, 5 % and 4 %, respectively).
3.2 Model performance in predicting wood density variation
Repeated spatial k-fold cross-validation showed that the four models differed in predictive performance: the “taxonomic model” and “NFI-based model” produced consistent results across train and test datasets, indicating stable generalisation, whereas the “environmental model” and “GIS-based model” exhibited greater variability in their outcomes, suggesting that their predictive capacity is more sensitive to data partitioning and underlying spatial heterogeneity (Table 2).
Table 2Predictive performance of the four wood density models, evaluated on train and test datasets using repeated spatial k-fold cross-validation. Values are reported as mean ± standard deviation across 500 repetitions.
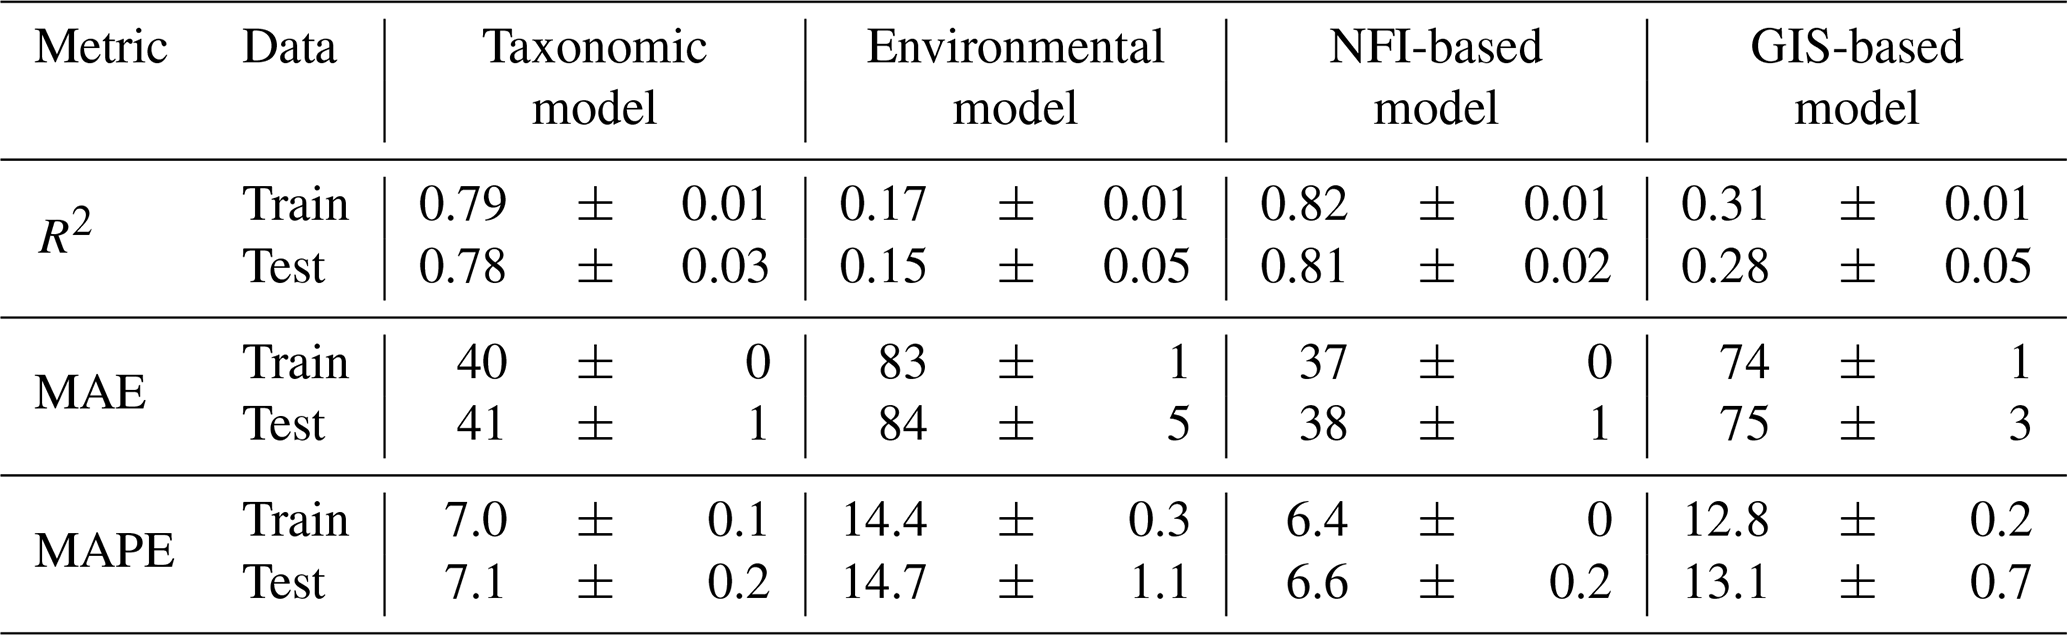
Among the different models evaluated, the “NFI-based model” logically achieved the highest performance, with an R2 of 0.81 and a mean absolute error (MAE) of 38 kg m−3 (6.6 %) on test data (Table 2). Reflecting the dominant role of tree species identity on wood density, the “taxonomic model” performed nearly as well, yielding an R2 of 0.78 and a MAE of 41 kg m−3 (7.1 %).
In contrast, the models lacking detailed tree-level information demonstrated lower performance: the “environmental model” exhibited limited predictive power, with an R2 of 0.15 and a MAE of 84 kg m−3 (14.7 %) on test data; the “GIS-based model” showed intermediate performance, with an R2 just of 0.28 and a MAE of 75 kg m−3 (12.7 %).
Despite differences in predictive accuracy, all models yielded globally unbiased estimates of wood density, as indicated by observed–predicted relationships following the 1:1 line, although dispersion was considerably greater for the “environmental model” and the “GIS-based model” (Fig. 4).
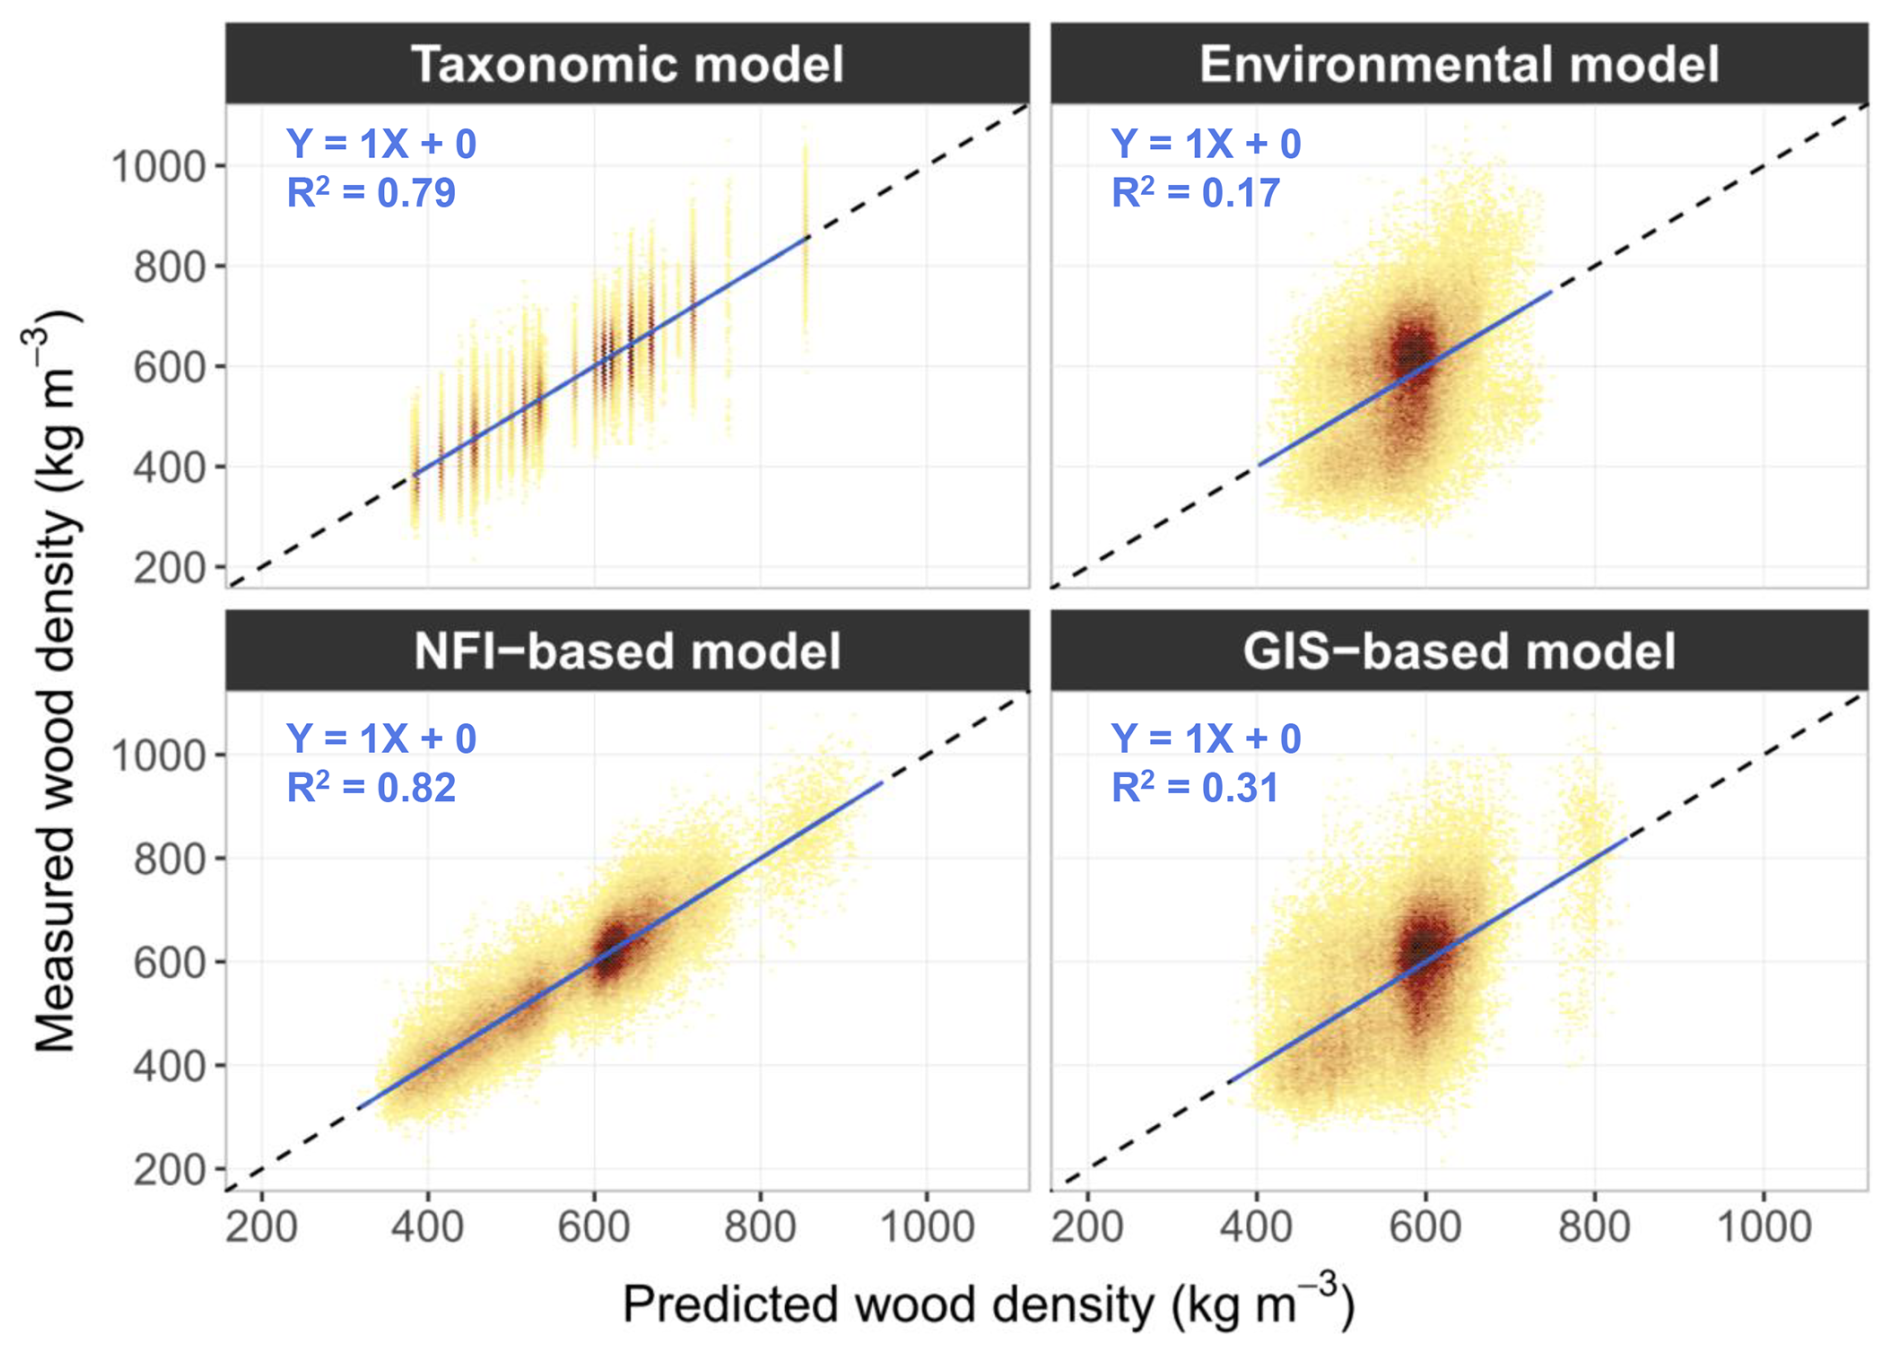
Figure 4Measured versus predicted values of wood density for the four models fitted on the full dataset. Colour depends on the density of points (the darker the colour, the denser the observations). The solid blue line represents the OLS regression between predicted and measured values, and the dashed black line represents the 1:1 reference line.
3.3 Simulation of wood density on French NFI data
Wood density values predicted on NFI data using the “NFI-based model” were consistent with both interspecific and intraspecific variations observed in the XyloDensMap dataset (Fig. 5; see Fig. S5 for more detailed results). On the one hand, interspecific variation was accurately reproduced in the simulated values. Among broadleaf species, the simulated values mimicked the trend from dense woods typical of the genus Quercus to lower densities found in genera such as Populus or Salix. For conifers, the simulations reflected the trend from denser woods in Pinus species to lighter woods in Abies and Picea. On the other hand, intraspecific variation was only partially reconstituted, which aligns with the relatively limited proportion of intraspecific wood density variation captured. In contrast, predictions from the “GIS-based model”, while able to reflect general density trends, failed to reproduce interspecific variation (Fig. 5), due to the absence of species-level information, which was not captured by the variables included in the model. The latter was found systematically biased across species (magnitude of 62 kg m−3 on average), with the bias negatively correlated with wood density, indicating a clear regression toward the mean. This led to bidirectional bias among broadleaved species, while conifers showed exclusively positive bias, suggesting a risk of systematic underestimation of wood density and biomass stocks in coniferous forests.
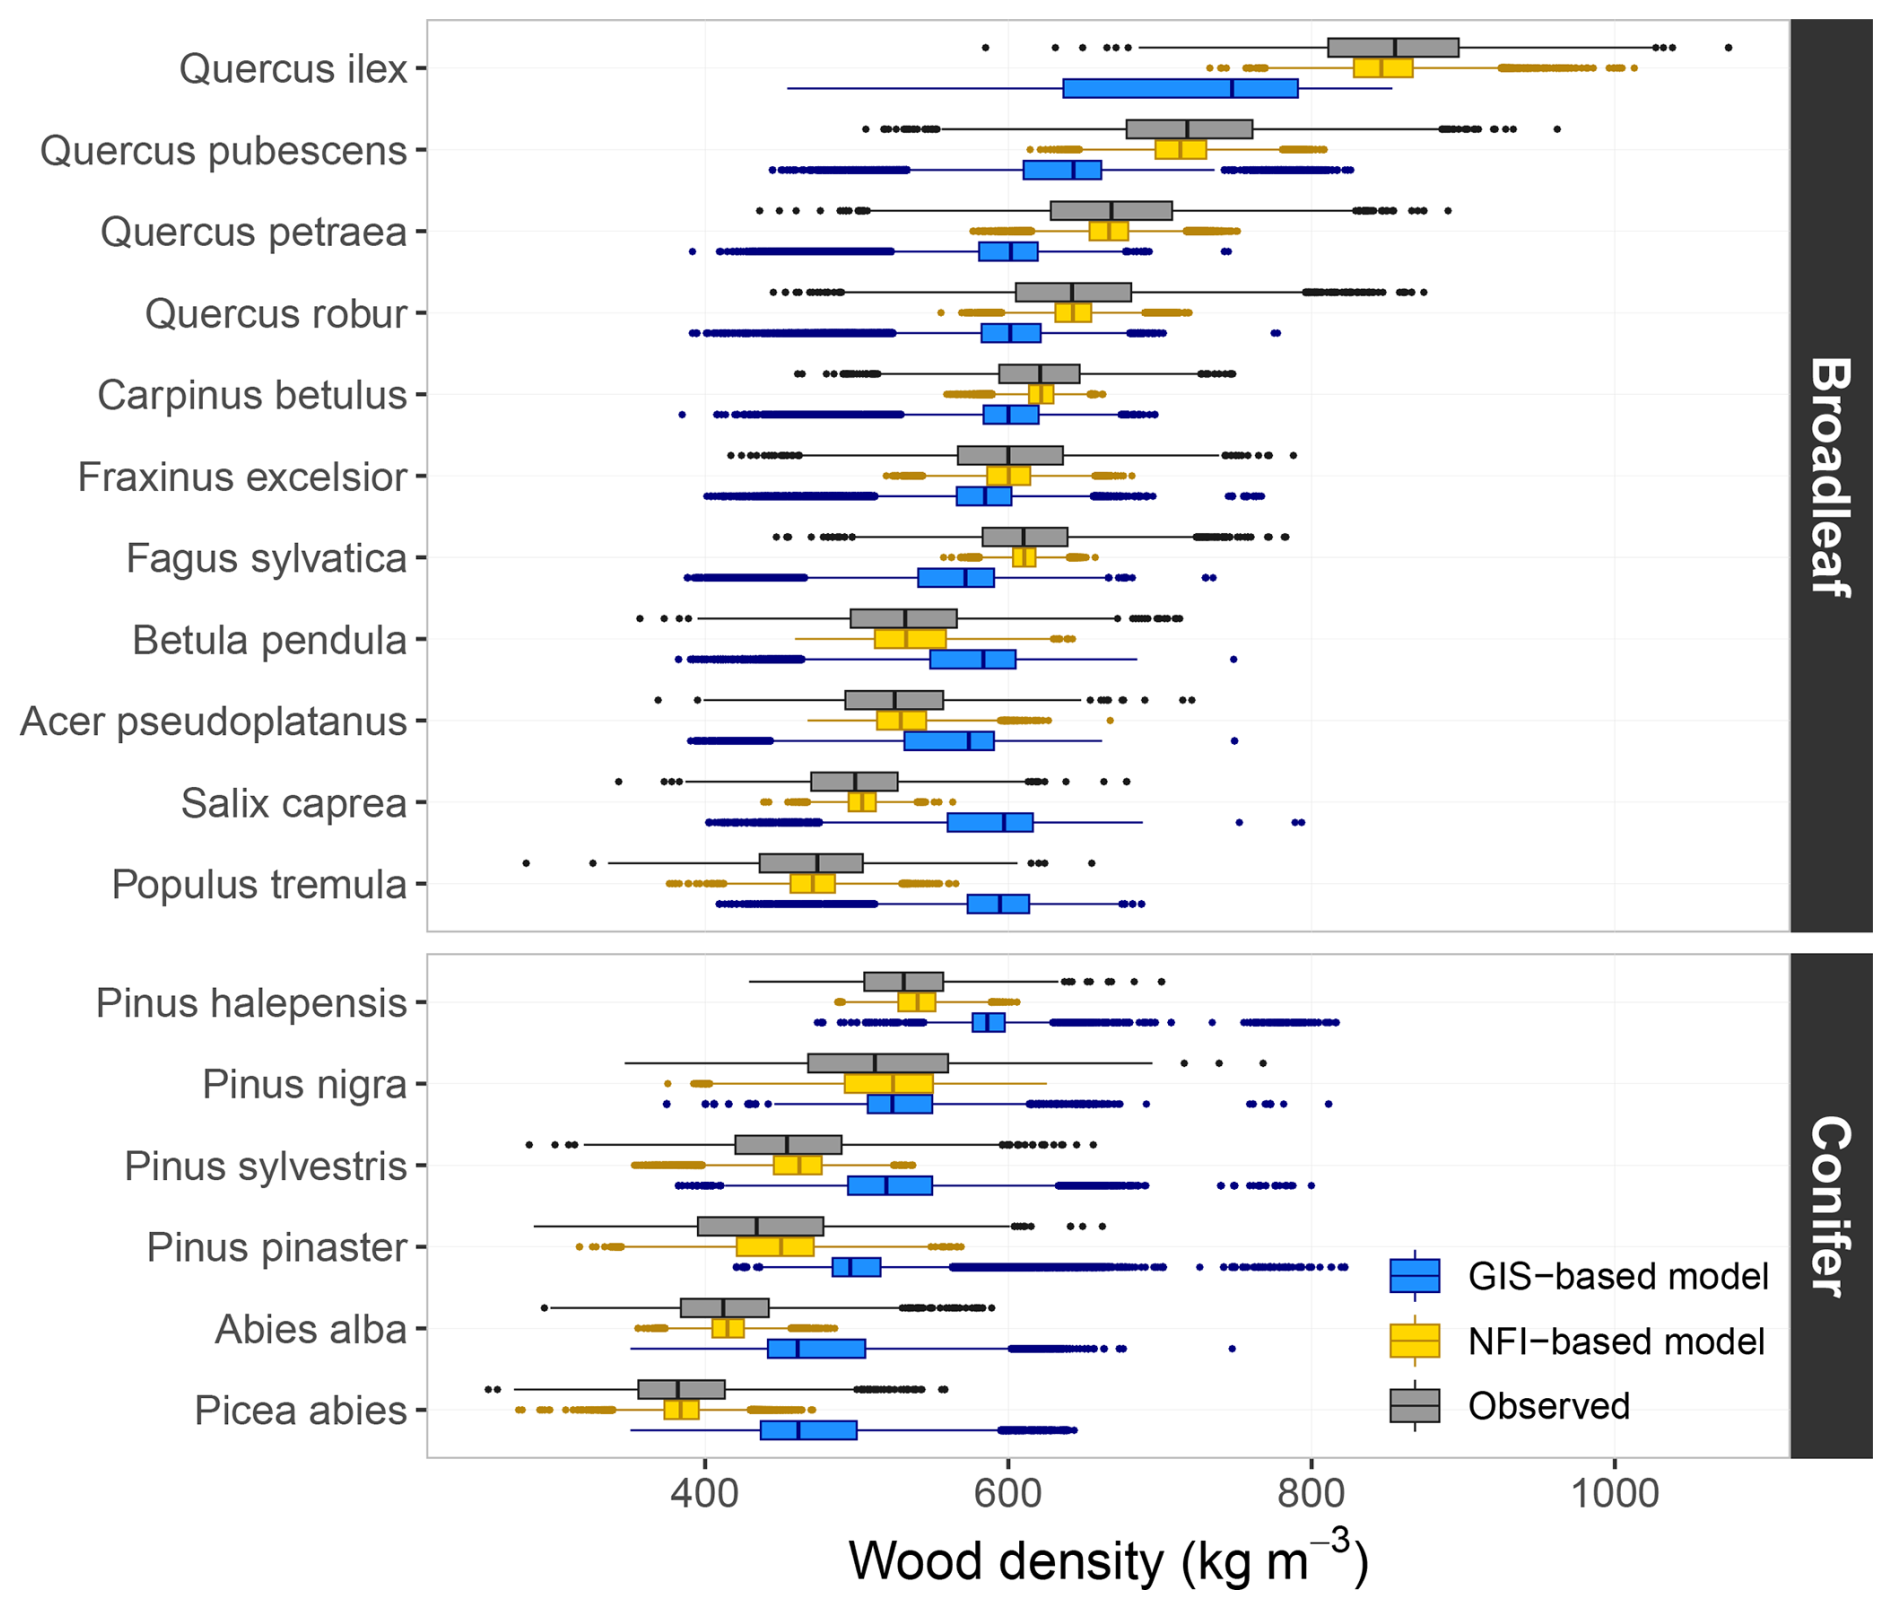
Figure 5Wood density values predicted on the French NFI dataset and values observed in the XyloDensMap data selected for modelling. Observed values correspond to measurements on wood increment cores, while predicted values were obtained from the “NFI-based model” (yellow) and the “GIS-based model” (blue) developed on these measurements. Results are shown for a subset of 17 species.
3.4 Spatial variation of wood density in mainland France
Mapping the community-wide mean wood density (CWD) derived from the individual estimates of the “NFI-based model” applied to forest plots inventoried by the French NFI revealed distinct spatial patterns across mainland France driven largely by forest species composition (Fig. 6). Mountainous regions in eastern France or the Aquitaine massif in the southwest, dominated by conifer species (Abies alba and Picea abies in eastern France, Pinus pinaster in south-western France), exhibited notably low CWD values. In contrast, lowland areas dominated by broadleaf species displayed higher CWD. The Mediterranean zone, where broadleaf species characterised by high wood density (notably Quercus ilex and Quercus pubescens) are prevalent, stood out as a region with particularly elevated CWD. These patterns further underscore the critical role of species-level taxonomic information in explaining wood density variation, in line with previous findings.
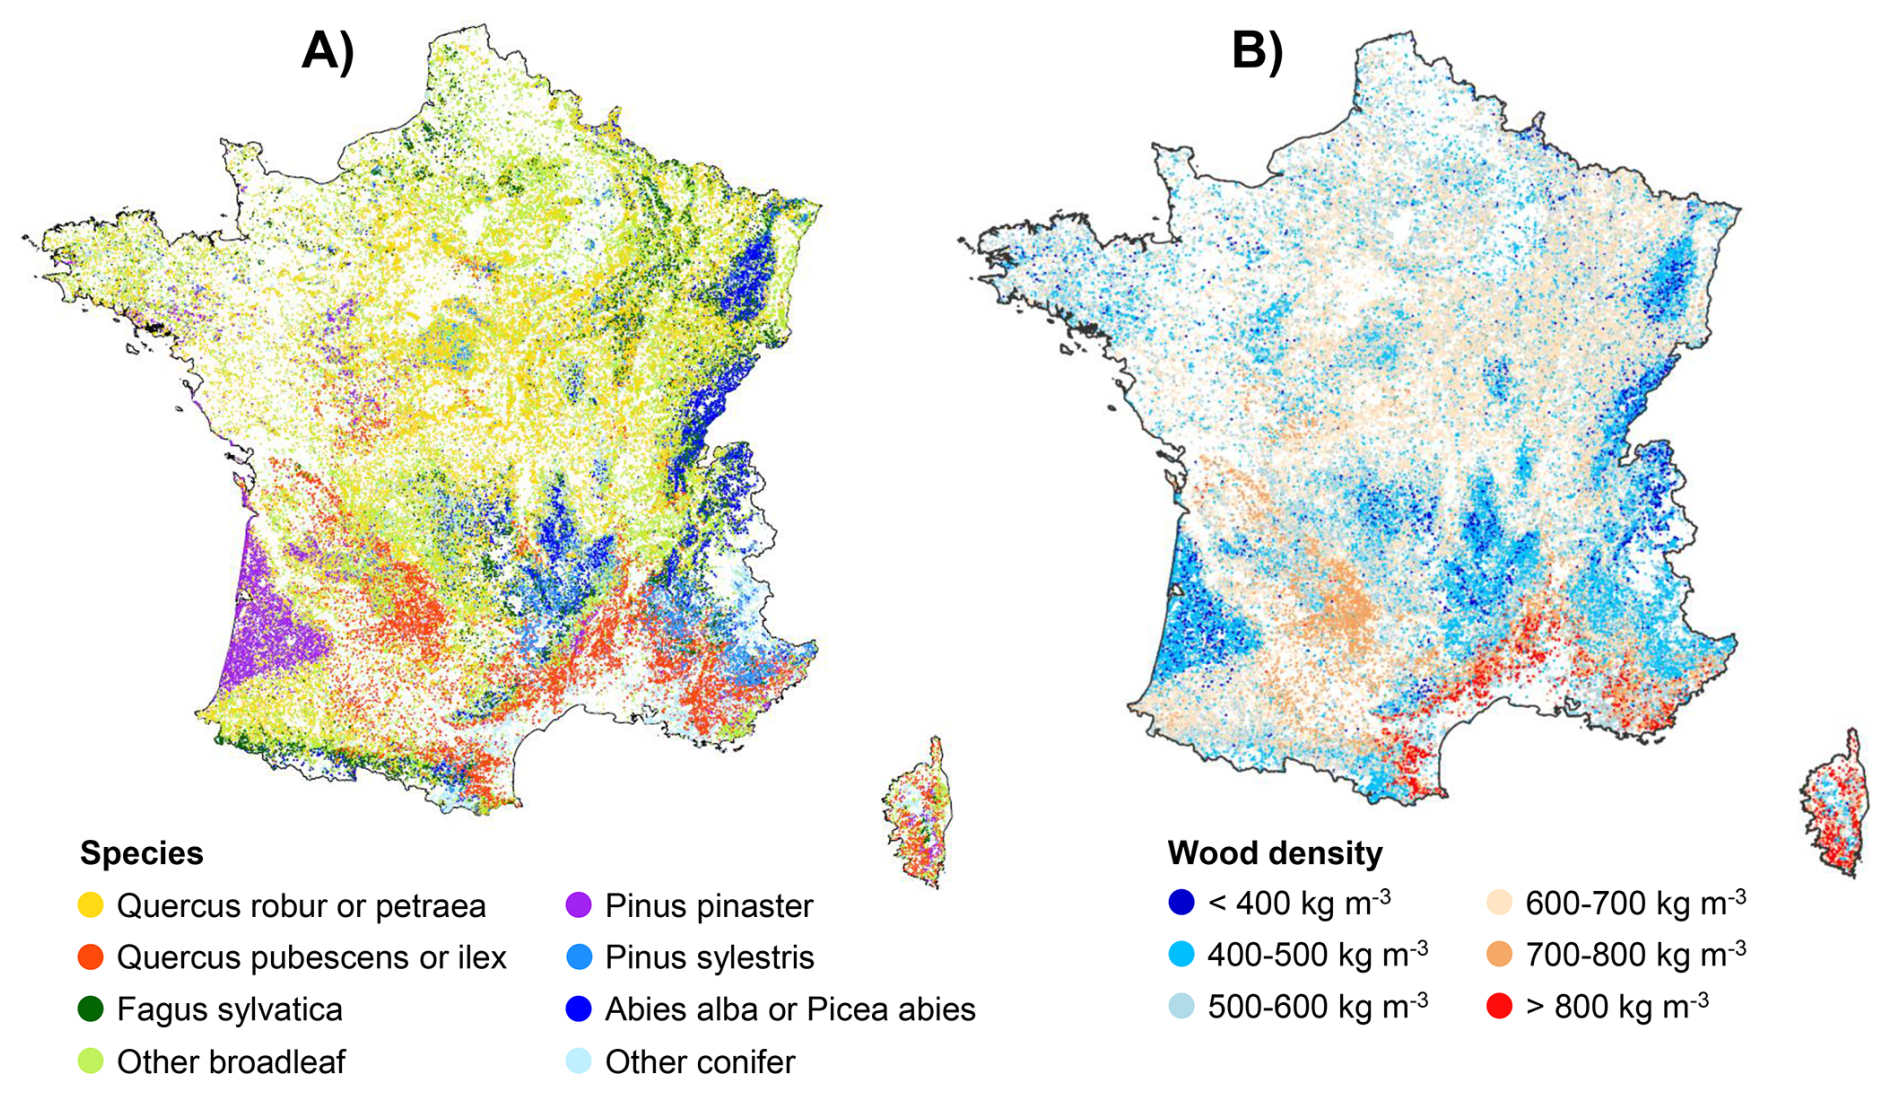
Figure 6Map of species distribution and community-wide mean wood density in mainland France. (A) Species distribution map (species with the highest percent canopy cover in the corresponding forest NFI plot) and (B) community-wide mean wood density map, based on the wood density predicted by the “NFI-based model” on each forest plot inventoried by the French NFI between 2005 and 2022.
3.5 Aboveground biomass and carbon estimates at multiple scales across French forests
The application of different methods to infer wood density on French NFI data led to very similar national estimate of aboveground biomass (AGB) and carbon stocks in French forests. The total forest AGB reached approximately 2.4 Gt of dry biomass (1.1 Gt of carbon), using either the individual wood density values predicted from the models (“NFI-based model” and “GIS-based model”), or the single average coefficient.
However, larger differences emerged at finer spatial scales. At the level of the 11 biogeographical regions, the mean absolute difference in AGB between estimates from the “NFI-based model” and those using the constant mean was around 8 %. This discrepancy increased to 10 %–15 % in mountainous regions (Vosges, Jura, Alps) and the Mediterranean zone (Fig. 7A). Although discrepancies were lower in other regions, they could still translate into substantial absolute differences depending on the magnitude of regional biomass. In the “Centre Nord semi-océanique” and “Massif Central” regions, which rank first and second in aboveground forest biomass, discrepancies of 4 % and 7 % were among the largest absolute differences, amounting to 20×106 t (9×10⁶ t of carbon) and 34×106 t (16×106 t of carbon), respectively. At the scale of the 86 biogeographical subregions, differences reached up to 30 %, therefore twice as much in magnitude. Notably, biomass estimate discrepancies surpassed 10 % in more than 25 % of the subregions, and exceeded 20 % in just under 10 % of them (Fig. 7B).
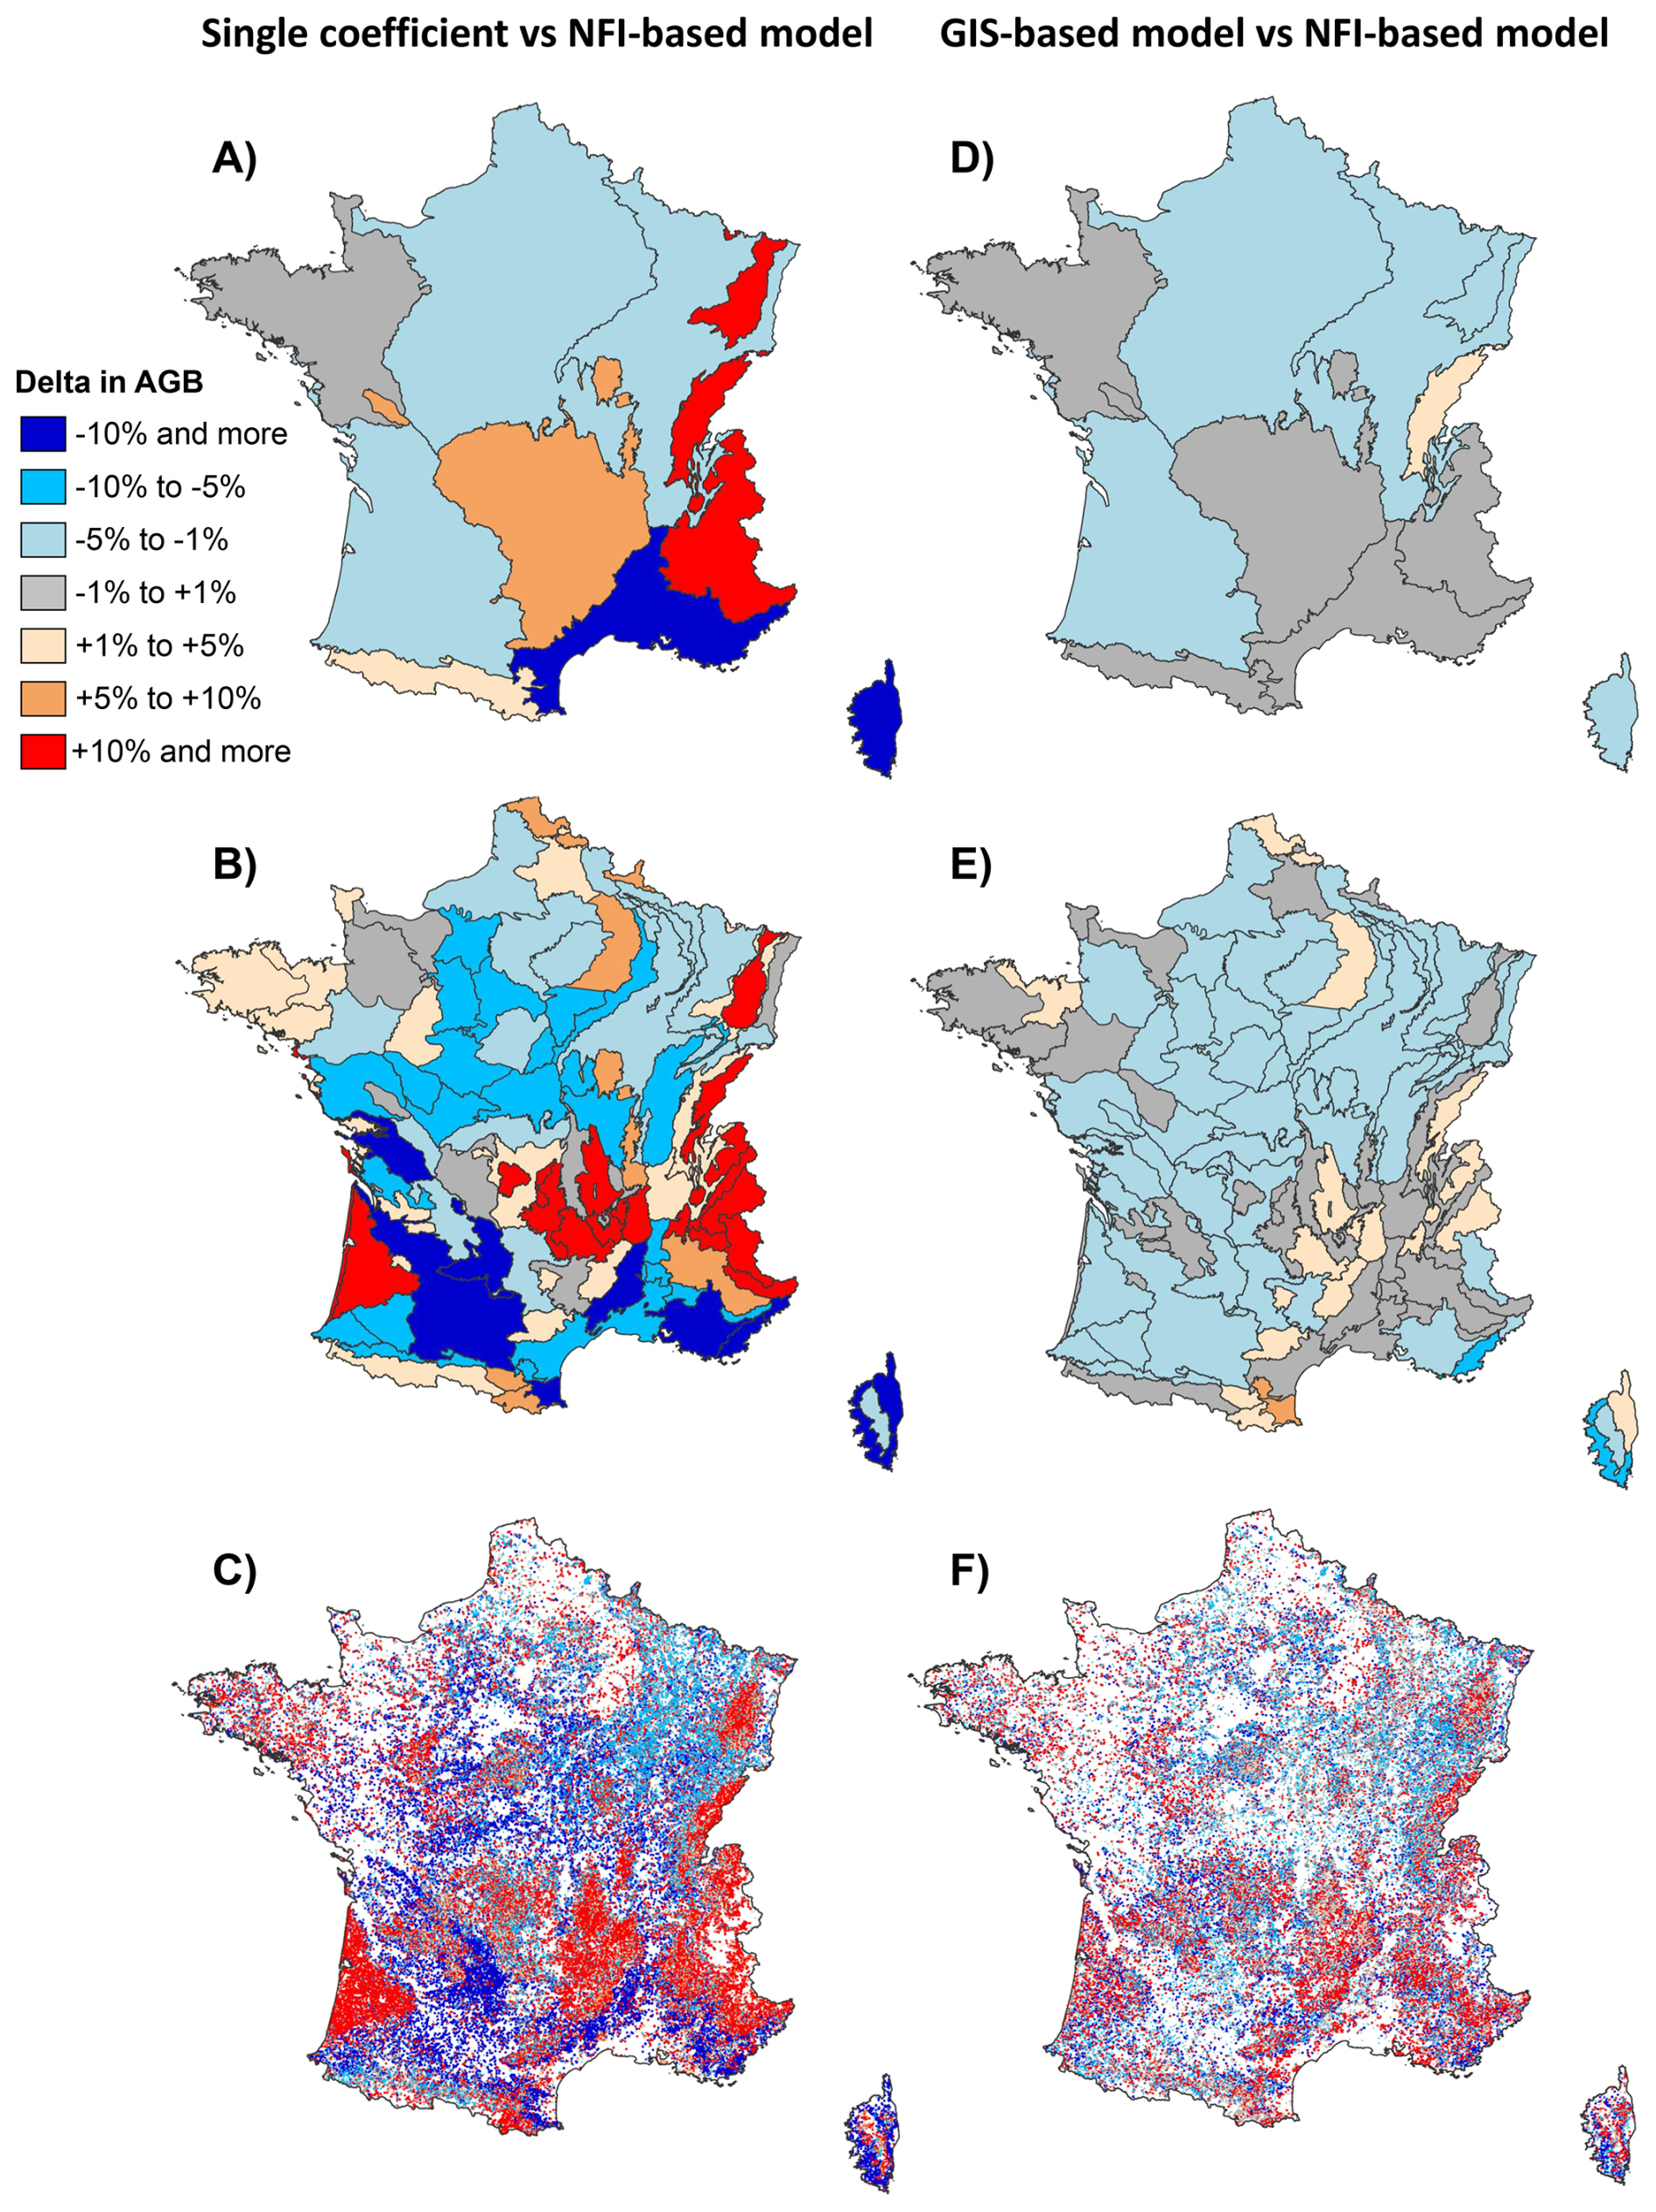
Figure 7Relative differences in forest aboveground biomass (AGB) stocks depending on the method used to predict wood density: the “NFI-based model”, the “GIS-based model” or a single average coefficient. All values represent relative differences with respect to the AGB estimated using the “NFIbased model”. Comparisons are presented across three spatial levels: biogeographical regions (A, D), biogeographical subregions (B, E), and forest plots inventoried by the French NFI (C, F). Maps on the left show the relative differences in AGB between estimates obtained using the average coefficient and those derived from the “NFI-based model”. Maps on the right display the relative differences between estimates derived from the “GIS-based model” and those from the “NFI-based model”.
At the NFI forest plot level, the average absolute difference in AGB between estimates derived from the “NFI-based model” and those obtained from the average coefficient was 15 %. About 60 % of plots exhibited differences greater than 10 %, 25 % showed differences above 20 %, and 13 % showed differences exceeding 30 % (Fig. 7C). Therefore, this difference tended to increase toward lower spatial scales, but remained in a comparable order of magnitude. This was found consistent with the low contribution of site and stand attributes that predominate at plot level, while tree species attributes are structured at a larger spatial scale (see Fig. 6).
The local magnitude and direction of the differences in AGB depended on the spatial distribution of wood density (Fig. 6). As an obvious rule, neglecting wood density variation led to an underestimation of AGB in forests composed of species characterised by high wood density and, on the contrary, to an overestimation of AGB in forests made up of species with low wood density. For example, AGB calculated using a single average coefficient was underestimated in the Mediterranean region populated by broadleaf species with high wood density such as Quercus ilex (average wood density =850 kg m−3; Figs. 6, 7C). On the other hand, it was overestimated in regions populated by conifer species with low wood density, such as Abies alba (average wood density =415 kg m−3) and Picea abies (average wood density =387 kg m−3) in eastern France and Pinus pinaster (average wood density =438 kg m−3) in southwestern France (Figs. 6, 7C).
Using wood density values predicted by the “GIS-based model” notably reduced discrepancies across all spatial scales. In the 11 biogeographical regions, the mean absolute difference in AGB between estimates derived from the “GIS-based model” and the “NFI-based model” was just 1 %, never exceeding 2 % in any region (Fig. 7D). Across the 86 subregions, the mean absolute difference was 2 %, with only two subregions exceeding 5 % (Fig. 7E). At the NFI plot scale, although discrepancies remained substantial, they were markedly reduced: differences approximated 10 % for around one-third of plots (compared to 60 % of the plots when using the average coefficient) and exceeded 20 % for about 9 % of plots (versus 25 % of the plots when using the average coefficient; (Fig. 7F). Thus, despite the systematic bias observed at the species level (Fig. 5), the “GIS-based model” contributes meaningfully to accounting for wood density variation from regional to local scales.
4.1 Characterising wood density variation in temperate forests
This study, based on a large dataset of wood density measurements collected using a standardised protocol across France, provides a comprehensive characterisation of variation in wood density at both interspecific and intraspecific levels across temperate forests. Our findings reveal substantial variability between species – 78.5 % of the total variance – but also within them, resulting in pronounced spatial patterns in the distribution of wood density.
Across the dataset, wood density values ranged from approximately 300 to 900 kg m−3, varying by a factor of two to three both within and between species. These patterns align with those observed in the GenTree dataset, which covers a broader European range, although based on fewer individual trees and species (Martínez-Sancho et al., 2020; see Cuny et al., 2025, for comparison of the two datasets).
4.2 The diversity in wood density observed in temperate French forests is comparable to that observed worldwide
While recent studies have primarily examined interspecific variation in wood density at the global scale (Mo et al., 2024; Yang et al., 2024) or within tropical forests (Phillips et al., 2019; Sullivan et al., 2025), our study highlights that temperate forests exhibit a degree of wood density variability comparable to their tropical counterparts, despite their lower species richness. Tropical species typically show mean wood density values between 300 and 900 kg m−3 (Lewis et al., 2013; Phillips et al., 2019; Reyes et al., 1992), with a pantropical mean of 619 kg m−3 In comparison, we found species-specific averages spanning from 380 to 850 kg m−3 and a mean value of 575 kg m−3 for French forests.
Intraspecific variation was also substantial. For instance, Quercus petraea exhibited wood density values ranging from approximately 400 to 900 kg m−3 in France – comparable to the full range observed across tropical zones. Moreover, intra-tree variation (e.g. from pith to bark, base to crown, or between stem and branches) can equal or exceed inter-individual variation within a species (Billard et al., 2021; Bouriaud et al., 2015; Franceschini et al., 2010, 2013).
4.3 What are the drivers of variation in wood density in temperate forests?
Recent global studies have shown that tree species and hydrothermal conditions (regional temperature and precipitation) are key drivers of wood density variation (Mo et al., 2024; Yang et al., 2024). Our results, based on more intensive sampling at a national scale, confirm that species composition is the dominant factor in temperate forests (Kerfriden et al., 2021), explaining nearly 80 % of the observed variation in wood density – similar to findings in tropical systems (Farias et al., 2023). While mean annual temperature did emerge as a significant predictor, its effect was moderate.
Environmental factors can indirectly influence wood density through species composition, tree dimensions, or stand characteristics. As a result, their effects may be partially captured by variables representing these features. For instance, tree-ring width is known to respond strongly to climatic conditions (George, 2014), and in turn, can significantly influence wood density (Guilley et al., 2004; Saranpää, 2003; Zobel and van Buijtenen, 1989). Including tree-ring width as a covariate in statistical models can therefore reduce the apparent influence of environmental variables on wood density, as it acts as a mediating factor (Bergès et al., 2008). Even so, when tree- and stand-level variables were excluded in favour of purely environmental predictors within the “environmental model”, the proportion of wood density variance explained by temperature and precipitation remained low, indicating that climatic conditions alone account for a limited share of the overall variation at this spatial scale. Mean annual temperature, however, showed a strong positive effect on wood density variation, both within species (even when tree-ring width was controlled for) and across the entire dataset.
This discrepancy with more global studies can likely be attributed to the spatial scale of analysis. At the global level, climatic gradients play a dominant role in shaping tree species distributions, from low wood density coniferous species in boreal forests to high wood density broadleaf species in tropical forests. In contrast, within a country like France, species distribution is also strongly influenced by silvicultural practices, which can uncouple species composition from local climatic conditions (Bontemps et al., 2019). As a result, the indirect effect of regional variation in climate conditions on wood density – via their influence on species composition – is likely more limited at this scale.
Beyond this spatial dimension, our study also differs from dendroclimatological research in its temporal focus. Dendroclimatology typically targets interannual variability through tree ring analyses, most often by analysing maximum latewood density responses to seasonal or extreme year anomalies, and in climatically stressful settings such as tree line or high latitude environments (Briffa et al., 1998; Hughes et al., 1984). In contrast, our approach investigates spatial variation in wood density averaged over the full lifespan of trees. By construction, this framework integrates long-term climatic fluctuations and reduces the influence of short-term climatic fluctuation. It therefore emphasises persistent spatial patterns in wood density across broad biogeographical gradients rather than year-to-year climatic sensitivity.
Regarding intraspecific variation in wood density, we found that variables related to tree size and growth rate (as estimated by the average width of the last five tree-rings) were the most important. The direction of the relationship between growth and wood density was consistent with known wood anatomical patterns. In ring-porous broadleaves (e.g. Quercus, Fraxinus), wider rings tend to contain more latewood, resulting in higher density. In contrast, in conifers, wider rings typically contain a greater proportion of earlywood, leading to lower density (Lachenbruch et al., 2011; Zobel and van Buijtenen, 1989). Our models reflected these patterns: we observed positive effects of ring width on wood density in ring-porous species, negative effects in conifers, and species-specific responses in diffuse- or semi-ring-porous species (e.g. positive in Fagus sylvatica, negative in Betula pendula), in line with previous findings (Lachenbruch et al., 2011).
The effect of tree diameter, identified as the third most influential predictor in the “NFI-based model” (Fig. 2), also merits attention due to its quasi-systematic positive association with wood density. Since tree volume and various mechanical properties scale as power functions of tree size (King, 1990), this trend likely reflects mechanical constraints inherent to tree growth. Moreover, the relationship may have practical relevance in forest ecosystems undergoing maturation (Bontemps et al., 2020).
4.4 Why intraspecific variation in wood density remains hard to capture
Despite consistent relationships with covariates, our models captured only a small part of the intraspecific variation in wood density. Several hypotheses may account for this.
First, average wood density – whether at the tree-ring or stem level – is known to be a relatively conserved trait under strong developmental control (Cuny and Rathgeber, 2016; Siefert et al., 2015; Swenson and Enquist, 2007), with high heritability and substantial additive genetic effects (Gaspar et al., 2008; Montes and Weber, 2009; Rozenberg et al., 2001; Soro et al., 2023). Even though growth traits such as ring width and stem size are correlated with wood density, they typically explain only a limited portion of its variation (Bouriaud et al., 2004). The remaining unexplained variance is often captured as a “tree effect” in statistical models, reflecting individual-level differences not accounted for by measured predictors (Bontemps et al., 2013; Franceschini et al., 2012; Guilley et al., 2004). Given the significance of this residual variability, advancing genetic mapping of tree populations and their diversity may offer a promising avenue for deeper insight (Porth and El-Kassaby, 2014), NFI providing an ideal framework for integrating such complementary measurements.
Second, certain potentially influential predictors (e.g., tree age and average tree-ring width) were excluded from the main analysis, as they were available only for a subset of trees (Cuny et al., 2025). However, when using this subset, incorporating these variables only led to a modest improvement in the performance of the “NFI-based model”, with an additional 1 % of captured intraspecific variation.
Finally, we investigated whether the limited explanatory power of our models could stem from the modelling approach itself. This hypothesis was first challenged by the comparison of model performance on train and test datasets, which revealed remarkably similar results (Table 2). To further assess this, we implemented an additional random forest model using the ranger package in R (Wright and Ziegler, 2017), capable of capturing nonlinear relationships and interactions. Using the same set of predictors as in the “NFI-based model”, the random forest model applied to the full dataset achieved comparable performance, with a mean absolute error of 36 kg m−3 and an R2 of 0.83 (Fig. S6). These findings suggest that linear models, despite their simplicity, are well suited to this type of analysis and remain appropriate for predictive applications, offering the added benefit of interpretability
4.5 What method should be used to infer wood density for forest biomass and carbon assessments? Scale matters
Our results show that the importance of the method chosen to infer wood density and ultimately calculate AGB depends largely on the spatial scale. At broad spatial scales (e.g., national forest biomass assessments), the choice of the method to infer wood density has little impact. Even simplified assumptions, such as using a single average wood density value, produced results consistent with those from more detailed models. However, it is important to note that the average coefficient used in this study was derived from comprehensive systematic sampling and weighted by species' contributions to total growing stock. As such, it is highly representative of French forests. Coefficients derived from other, less comprehensive datasets may lead to lower predictive performances.
At finer spatial scales, our findings demonstrate that using coarse coefficients that ignore wood density variability can introduce significant biases in forest biomass estimates. Paradoxically, detailed species-specific coefficients tend to be used at broad scales, while spatialised biomass and carbon estimates – particularly those derived from remote sensing – tend to rely on models that poorly account for wood density variation (Liu et al., 2023; Ma et al., 2024; Schwartz et al., 2023; Yang et al., 2022). These remote sensing techniques offer great potential for biomass mapping, as they can allow the estimation of tree volume and biomass from canopy height. However, currently available remote sensing products do not permit to identify tree species, which prevents to incorporate wood density in the derived estimations. As a result, coarse approximations are typically used to convert volume into biomass, which can lead to substantial biases compared to ground-based estimates (Phillips et al., 2019; Sæbø et al., 2022).
Our analyses indicate that detailed, tree-level data are essential for accurately modelling wood density variation. Climatic variables and general stand-level descriptors only partially capture this variability. Nonetheless, our “GIS-based model” demonstrated that incorporating such descriptors improves estimates of forest biomass and carbon stocks, even at fine spatial scales. Given that these variables are – or could be – available as GIS layers, this approach may be suitable for spatially explicit assessments of forest biomass and carbon stocks. In this study, the “GIS-based model” was applied to predict wood density at the tree level. However, biomass estimates derived from remote sensing approaches may not require such fine resolution. At the NFI plot level, the “GIS-based model” achieved an R2 of 0.48 (compared to 0.31 at the tree level), indicating that at broader scales this approach provides a relevant means of accounting for spatial variation in wood density.
Among all variables integrated into the “GIS-based model”, stand composition emerged as the most influential factor, reflecting the dominant role of species identity in determining wood density. We relied on the BD Forêt database to characterise stand composition. While this map is no longer fully up to date, its revision could enhance the accuracy of wood density estimates by better capturing current species distributions. Because the BD Forêt map is restricted to mainland France, we explored the potential for broader-scale application by testing the ForestPaths European tree genus map (early access version), which provides genus-level classification at 10 m resolution across Europe for the year 2020 (De Keersmaecker et al., 2025). In this test, we substituted the ForestPaths map for the BD Forêt map in the “GIS-based model”. The model yielded very similar performance (R2 = 0.29 at the tree level and R2 = 0.44 at the NFI plot level with ForestPaths, compared to 0.31 and 0.48 with BD Forêt), indicating that products such as the ForestPaths genus map may be highly valuable for capturing spatial variation in wood density at both fine resolution and broad spatial scales.
While our results underscore the potential of models based on GIS layers to account for spatial variation in wood density, they also reveal certain limitations. In particular, the exclusion of plot-level attributes revealed a clear process of regression toward the mean (Fig. 5), particularly concerning for coniferous forests, where the bias is unidirectional. The generality of this effect in GIS-based developments has been shown to have substantial implications for strategic forest planning (Ulvdal et al., 2025).
To evaluate whether current remote sensing biomass estimates for mainland France are biased by the absence of explicit consideration of spatial variation in wood density, we compared forest biomass estimates derived from our “NFI based model” with the European Space Agency (ESA) Biomass Climate Change Initiative map for 2020 (Santoro and Cartus, 2025). At the national scale, the comparison indicates good overall agreement (a 4.7 % difference in total biomass across mainland France, corresponding to 113×106 t, or 54×106 t of carbon), whereas at finer spatial scales, such as biogeographical subregions, notable discrepancies emerged (see Fig. 7). Importantly, these differences do not follow the direction that would be expected if they were primarily driven by unaccounted wood density variation. For example, ESA biomass estimates are higher than NFI estimates in the Mediterranean region, despite this region being characterised by comparatively high wood density. If wood density were the dominant source of bias, neglecting this high wood density should have resulted in lower biomass values from the remote-sensing product. The fact that the opposite pattern is observed indicates that wood density effects alone cannot explain the discrepancies. This suggests that other factors – such as differences in allometric assumptions, forest structure representation, or remote-sensing signal interpretation – likely contribute to the divergence in biomass estimates and merit further investigation.
As a general rule, because tree identity is the primary driver of wood density variation, incorporating species-specific hypotheses on wood density significantly improves biomass estimates. We therefore encourage remote sensing approaches to integrate interspecific variability wherever possible. This can be achieved either by complementing remote data with ground-based species inventories (Chave et al., 2019) or by leveraging recent advances in species recognition from processed imagery (Effendi et al., 2021; Ma et al., 2024).
In parallel, advances are emerging in the automated identification of tree species, spanning scales from individual trees to entire landscapes, with several initiatives carried out across metropolitan France. The recently released PureForest dataset exemplifies how large-scale airborne laser scanning (ALS) and high-resolution aerial imagery, combined with deep learning techniques, can provide benchmark references for robust species classification across dozens of taxa, thereby enabling scalable mapping efforts (Gaydon and Roche, 2025). Complementary studies based on multispectral satellite time series and advanced machine learning architectures have demonstrated promising classification performance in complex forest environments, highlighting the importance of dense temporal and spectral information for broad-scale species discrimination (Mouret et al., 2025). More broadly, multi-source approaches that integrate spectral, structural, and textural features derived from optical imagery and LiDAR data continue to progress, paving the way toward more accurate, robust and transferable species maps. Such methodological progress has the potential to improve biomass estimation by enabling finer representation of both tree volume and wood density in forest models (Karasiak et al., 2020).
-
This study provides new insights into wood density variation and its underlying drivers in temperate forests.
-
Species identity emerged as the dominant factor shaping wood density variation, leading to clear spatial patterns aligned with species distribution. Intraspecific variation was also substantial and influenced by tree size, growth rate, and mean annual temperature – although only partially captured by our models.
-
While accounting for wood density variation has limited impact on aboveground biomass estimates at the national scale – provided that representative coefficients are used – it significantly affects estimates at finer spatial resolutions.
-
Given the strong influence of tree species and the limited predictability of intraspecific variation, we recommend using detailed species-level average wood density coefficients for forest biomass and carbon stock assessment.
-
Considering the well-documented inter-individual variability in wood density, future efforts to characterise the genetic structure of tree populations at broad scales using high-throughput technologies may offer valuable insights, but remain a methodological challenge.
Data and codes used in this study are freely accessible at the following link: https://doi.org/10.6084/m9.figshare.c.8396739 (Cuny et al., 2026). The full XyloDensMap dataset is freely accessible at the following link: https://doi.org/10.6084/m9.figshare.c.7515396 (Cuny et al., 2024).
The supplement related to this article is available online at https://doi.org/10.5194/bg-23-2365-2026-supplement.
H.C. conducted the research, drew the figures and wrote the manuscript, in close coordination with J.-M.L. and J.-D.B. All authors critically reviewed the manuscript and approved the current version.
The contact author has declared that none of the authors has any competing interests.
Publisher's note: Copernicus Publications remains neutral with regard to jurisdictional claims made in the text, published maps, institutional affiliations, or any other geographical representation in this paper. The authors bear the ultimate responsibility for providing appropriate place names. Views expressed in the text are those of the authors and do not necessarily reflect the views of the publisher.
H.C. thanks Claire Bastick for help in integrating the aboveground biomass estimates in the calculation process of the French NFI, and Timothée Nayme for help in calculating stand dominant height.
This work was supported by project AI4FI as part of the French France 2030 program “Initiative d'Excellence Lorraine (LUE)”, reference ANR-15-IDEX-04-LUE. A.L.S. was funded by the project ALAMOD of the exploratory research program FairCarboN and received government funding managed by the Agence Nationale de la Recherche under the France 2030 program, reference ANR-22-PEXF-0002.
This paper was edited by Mirco Migliavacca and reviewed by Simon Besnard and one anonymous referee.
Baker, T. R., Phillips, O. L., Malhi, Y., Almeida, S., Arroyo, L., Di Fiore, A., Erwin, T., Killeen, T. J., Laurance, S. G., Laurance, W. F., Lewis, S. L., Lloyd, J., Monteagudo, A., Neill, D. A., Patiño, S., Pitman, N. C. A., M. Silva, J. N., and Vásquez Martínez, R.: Variation in wood density determines spatial patterns in Amazonian forest biomass, Glob. Change Biol., 10, 545–562, https://doi.org/10.1111/j.1365-2486.2004.00751.x, 2004.
Bergès, L., Nepveu, G., and Franc, A.: Effects of ecological factors on radial growth and wood density components of sessile oak (Quercus petraea Liebl.) in Northern France, Forest Ecol. Manag., 255, 567–579, https://doi.org/10.1016/j.foreco.2007.09.027, 2008.
Besic, N., Picard, N., Vega, C., Bontemps, J.-D., Hertzog, L., Renaud, J.-P., Fogel, F., Schwartz, M., Pellissier-Tanon, A., Destouet, G., Mortier, F., Planells-Rodriguez, M., and Ciais, P.: Remote-sensing-based forest canopy height mapping: some models are useful, but might they provide us with even more insights when combined?, Geosci. Model Dev., 18, 337–359, https://doi.org/10.5194/gmd-18-337-2025, 2025. .
Billard, A., Bauer, R., Mothe, F., Colin, F., Deleuze, C., and Longuetaud, F.: Vertical variations in wood basic density for two softwood species, Eur. J. Forest Res., 140, 1401–1416, https://doi.org/10.1007/s10342-021-01402-y, 2021.
Bontemps, J.-D. and Bouriaud, O.: Take five: about the beat and the bar of annual and 5-year periodic national forest inventories, Ann. Forest Sci., 81, 53, https://doi.org/10.1186/s13595-024-01268-1, 2024.
Bontemps, J.-D., Gelhaye, P., Nepveu, G., and Hervé, J.-C.: When tree rings behave like foam: moderate historical decrease in the mean ring density of common beech paralleling a strong historical growth increase, Ann. Forest Sci., 70, 329–343, https://doi.org/10.1007/s13595-013-0263-2, 2013.
Bontemps, J.-D., Hervé, J.-C., and Denardou, A.: Partition idéalisée et régionalisée de la composition en espèces ligneuses des forêts françaises, Écoscience, 26, 291–308, https://doi.org/10.1080/11956860.2019.1588511, 2019.
Bontemps, J.-D., Denardou, A., Hervé, J.-C., Bir, J., and Dupouey, J.-L.: Unprecedented pluri-decennial increase in the growing stock of French forests is persistent and dominated by private broadleaved forests, Ann. Forest Sci., 77, 1–20, https://doi.org/10.1007/s13595-020-01003-6, 2020.
Bouriaud, O., Bréda, N., Le Moguedec, G., and Nepveu, G.: Modelling variability of wood density in beech as affected by ring age, radial growth and climate, Trees, 18, 264–276, https://doi.org/10.1007/s00468-003-0303-x, 2004.
Bouriaud, O., Teodosiu, M., Kirdyanov, A. V., and Wirth, C.: Influence of wood density in tree-ring-based annual productivity assessments and its errors in Norway spruce, Biogeosciences, 12, 6205–6217, https://doi.org/10.5194/bg-12-6205-2015, 2015.
Bouriaud, O., Morneau, F., and Bontemps, J.-D.: Square-grid sampling support to reconcile systematicity and adaptivity in periodic spatial surveys of natural populations, J. Veg. Sci., 34, e13195, https://doi.org/10.1111/jvs.13195, 2023.
Briffa, K. R., Jones, P. D., Schweingruber, F. H., and Osborn, T. J.: Influence of volcanic eruptions on Northern Hemisphere summer temperature over the past 600 years, Nature, 393, 450–455, https://doi.org/10.1038/30943, 1998.
Canellas, C., Gibelin, A.-L., Lasségues, P., Kerdoncuff, M., Dandin, P., and Simon, P.: Les normales climatiques spatialisées Aurelhy 1981-2010: températures et précipitations, Météorol., 2014, 47–55, https://doi.org/10.4267/2042/53750, 2014.
Cavaignac, S.: Les sylvoécorégions (SER) de France métropolitaine, Etude de définition, Report, French National Forest Inventory, Nogent-sur-Vernisson, https://inventaire-forestier.ign.fr/IMG/pdf/Part1_rapport_ser.pdf (last access: 1 April 2026), 2009.
Chave, J., Condit, R., Aguilar, S., Hernandez, A., Lao, S., and Perez, R.: Error propagation and scaling for tropical forest biomass estimates, Philos. T. R. Soc. Lond. B, 359, 409–420, https://doi.org/10.1093/acprof:oso/9780198567066.003.0013, 2004.
Chave, J., Muller-Landau, H. C., Baker, T. R., Easdale, T. A., Steege, H. ter, and Webb, C. O.: Regional and phylogenetic variation of wood density across 2456 neotropical tree species, Ecol. Appl., 16, 2356–2367, https://doi.org/10.1890/1051-0761(2006)016[2356:RAPVOW]2.0.CO;2, 2006.
Chave, J., Coomes, D., Jansen, S., Lewis, S. L., Swenson, N. G., and Zanne, A. E.: Towards a worldwide wood economics spectrum, Ecol. Lett., 12, 351–366, https://doi.org/10.1111/j.1461-0248.2009.01285.x, 2009.
Chave, J., Davies, S. J., Phillips, O. L., Lewis, S. L., Sist, P., Schepaschenko, D., Armston, J., Baker, T. R., Coomes, D., Disney, M., Duncanson, L., Hérault, B., Labrière, N., Meyer, V., Réjou-Méchain, M., Scipal, K., and Saatchi, S.: Ground data are essential for biomass remote sensing missions, Surv. Geophys., 40, 863–880, https://doi.org/10.1007/s10712-019-09528-w, 2019.
Cuny, H. E. and Rathgeber, C. B.: Xylogenesis: coniferous trees of temperate forests are listening to the climate tale during the growing season but only remember the last words!, Plant Physiol., 171, 306–317, https://doi.org/10.1104/pp.16.00037, 2016.
Cuny, H., Leban, J.-M., Hervé, J.-C., Bontemps, J.-D., Kerfriden, B., Jacquin, P., Lacarin, M., Dauffy, V., Duprez, C., and Wurpillot, S.: XyloDensMap: a georeferenced dataset for the wood density of 110 000 trees from 156 European species in France, Figshare [data set], https://doi.org/10.6084/m9.figshare.c.7515396, 2024.
Cuny, H., Leban, J.-M., Hervé, J.-C., Bontemps, J.-D., Kerfriden, B., Jacquin, P., Lacarin, M., Dauffy, V., Duprez, C., and Wurpillot, S.: XyloDensMap: a georeferenced dataset for the wood density of 110,000 trees from 156 European species in France, Sci. Data, 12, 380, https://doi.org/10.1038/s41597-025-04645-1, 2025.
Cuny, H., Bontemps, J.-D., Besic, N., Colin, A., Hertzog, L., Le Squin, A., Marchand, W., Vega, C., and Leban, J.-M.: Dataset and R scripts for 'Wood density variation in European forest species: drivers and implications for multiscale biomass and carbon assessment in France', Figshare [code and data set], https://doi.org/10.6084/m9.figshare.c.8396739, 2026.
Dalla-Salda, G., Martinez-Meier, A., Cochard, H., and Rozenberg, P.: Variation of wood density and hydraulic properties of Douglas-fir (Pseudotsuga menziesii (Mirb.) Franco) clones related to a heat and drought wave in France, Forest Ecol. Manag., 257, 182–189, https://doi.org/10.1016/j.foreco.2008.08.019, 2009.
De Keersmaecker, W., Zanaga, D., Senf, C., Viana-Soto, A., Klapper, J., Blickensdörfer, L., Govaere, L., Lerink, B., Leyman, A., Schelhaas, M.-J., Teeuwen, S., Verkerk, P. J., and Van De Kerchove, R.: European Tree Genus Map 2020 (Early Access Release), Zenodo [data set], https://doi.org/10.5281/zenodo.13341104, 2025.
Doraisami, M., Kish, R., Paroshy, N. J., Domke, G. M., Thomas, S. C., and Martin, A. R.: A global database of woody tissue carbon concentrations, Sci. Data, 9, 284, https://doi.org/10.1038/s41597-022-01396-1, 2022.
Doraisami, M., Domke, G. M., and Martin, A. R.: Improving wood carbon fractions for multiscale forest carbon estimation, Carbon Balance Manag., 19, 25, https://doi.org/10.1186/s13021-024-00272-2, 2024.
Effendi, N. A. F. N., Zaki, N. A. M., Latif, Z. A., Suratman, M. N., Bohari, S. N., Zainal, M. Z., and Omar, H.: Unlocking the potential of hyperspectral and LiDAR for above-ground biomass (AGB) and tree species classification in tropical forests, Geocarto Int., 37, 8036–8061, https://doi.org/10.1080/10106049.2021.1990419, 2021.
Eggleston, H., Buendia, L., Miwa, K., Ngara, T., and Tanabe, K.: 2006 IPCC guidelines for national greenhouse gas inventories, https://www.ipcc.ch/report/2006-ipcc-guidelines-for-national-greenhouse-gas-inventories/ (last access: 18 March 2026), 2006.
Fajardo, A.: Wood density is a poor predictor of competitive ability among individuals of the same species, Forest Ecol. Manag., 372, 217–225, https://doi.org/10.1016/j.foreco.2016.04.022, 2016.
Fajardo, A., Siefert, A., and Laughlin, D. C.: Wood density and leaf size jointly predict woody plant growth rates across (but not within) species along a steep precipitation gradient, J. Ecol., 112, 374–388, https://doi.org/10.1111/1365-2745.14240, 2024.
Farias, H. L. S., Pequeno, P. A. C. L., Silva, W. R., Melo, V. F., Carvalho, L. C. D. S., Perdiz, R. D. O., Citó, A. C., Fearnside, P. M., and Barbosa, R. I.: Amazon forest biomass: intra-and interspecific variability in wood density drive divergences in Brazil's far north, iForest, 16, 95, https://doi.org/10.3832/ifor4137-016, 2023.
Flores, O. and Coomes, D. A.: Estimating the wood density of species for carbon stock assessments, Methods Ecol. Evol., 2, 214–220, https://doi.org/10.1111/j.2041-210X.2010.00068.x, 2011.
Fox, J. and Weisberg, S.: An R Companion to Applied Regression, Third edition, Sage, Thousand Oaks CA, ISBN 9781544336466, 2019.
Franceschini, T., Bontemps, J.-D., Gelhaye, P., Rittie, D., Herve, J.-C., Gegout, J.-C., and Leban, J.-M.: Decreasing trend and fluctuations in the mean ring density of Norway spruce through the twentieth century, Ann. Forest Sci., 67, 816–816, https://doi.org/10.1051/forest/2010055, 2010.
Franceschini, T., Bontemps, J.-D., and Leban, J.-M.: Transient historical decrease in earlywood and latewood density and unstable sensitivity to summer temperature for Norway spruce in northeastern France, Can. J. Forest Res., 42, 219–226, https://doi.org/10.1139/x11-182, 2012.
Franceschini, T., Longuetaud, F., Bontemps, J.-D., Bouriaud, O., Caritey, B.-D., and Leban, J.-M.: Effect of ring width, cambial age, and climatic variables on the within-ring wood density profile of Norway spruce Picea abies (L.) Karst., Trees, 27, 913–925, https://doi.org/10.1007/s00468-013-0844-6, 2013.
Freyburger, C., Longuetaud, F., Mothe, F., Constant, T., and Leban, J.-M.: Measuring wood density by means of X-ray computer tomography, Ann. Forest Sci., 66, 804–804, https://doi.org/10.1051/forest/2009071, 2009.
Frick, H., Chow, F., Kuhn, M., Mahoney, M., Silge, J., and Wickham, H.: rsample: General Resampling Infrastructure, CRAN [code], https://CRAN.R-project.org/package=rsample (last access: 1 April 2026), 2025.
Friedlingstein, P., O'Sullivan, M., Jones, M. W., Andrew, R. M., Bakker, D. C. E., Hauck, J., Landsch'́utzer, P., Le Quéré, C., Luijkx, I. T., Peters, G. P., Peters, W., Pongratz, J., Schwingshackl, C., Sitch, S., Canadell, J. G., Ciais, P., Jackson, R. B., Alin, S. R., Anthoni, P., Barbero, L., Bates, N. R., Becker, M., Bellouin, N., Decharme, B., Bopp, L., Brasika, I. B. M., Cadule, P., Chamberlain, M. A., Chandra, N., Chau, T.-T.-T., Chevallier, F., Chini, L. P., Cronin, M., Dou, X., Enyo, K., Evans, W., Falk, S., Feely, R. A., Feng, L., Ford, D. J., Gasser, T., Ghattas, J., Gkritzalis, T., Grassi, G., Gregor, L., Gruber, N., G'́urses, '́O., Harris, I., Hefner, M., Heinke, J., Houghton, R. A., Hurtt, G. C., Iida, Y., Ilyina, T., Jacobson, A. R., Jain, A., Jarníková, T., Jersild, A., Jiang, F., Jin, Z., Joos, F., Kato, E., Keeling, R. F., Kennedy, D., Klein Goldewijk, K., Knauer, J., Korsbakken, J. I., K'́ortzinger, A., Lan, X., Lefèvre, N., Li, H., Liu, J., Liu, Z., Ma, L., Marland, G., Mayot, N., McGuire, P. C., McKinley, G. A., Meyer, G., Morgan, E. J., Munro, D. R., Nakaoka, S.-I., Niwa, Y., O'Brien, K. M., Olsen, A., Omar, A. M., Ono, T., Paulsen, M., Pierrot, D., Pocock, K., Poulter, B., Powis, C. M., Rehder, G., Resplandy, L., Robertson, E., R'́odenbeck, C., Rosan, T. M., Schwinger, J., Séférian, R., Smallman, T. L., Smith, S. M., Sospedra-Alfonso, R., Sun, Q., Sutton, A. J., Sweeney, C., Takao, S., Tans, P. P., Tian, H., Tilbrook, B., Tsujino, H., Tubiello, F., van der Werf, G. R., van Ooijen, E., Wanninkhof, R., Watanabe, M., Wimart-Rousseau, C., Yang, D., Yang, X., Yuan, W., Yue, X., Zaehle, S., Zeng, J., and Zheng, B.: Global Carbon Budget 2023, Earth Syst. Sci. Data, 15, 5301–5369, https://doi.org/10.5194/essd-15-5301-2023, 2023.
Gaspar, M. J., Louzada, J. L., Aguiar, A., and Almeida, M. H.: Genetic correlations between wood quality traits of Pinus pinaster Ait., Ann. Forest Sci., 65, 1, https://doi.org/10.1051/forest:2008054, 2008.
Gaydon, C. and Roche, F.: Pureforest: A large-scale aerial lidar and aerial imagery dataset for tree species classification in monospecific forests, in: 2025 IEEE/CVF Winter Conference on Applications of Computer Vision (WACV), 5895–5904, https://doi.org/10.48550/arXiv.2404.12064, 2025.
George, S. S.: An overview of tree-ring width records across the Northern Hemisphere, Quaternary Sci. Rev., 95, 132–150, https://doi.org/10.1016/j.quascirev.2014.04.029, 2014.
Groombridge, B. and Jenkins, M. D.: World Atlas of Biodiversity: Earth's Living Resources in the 21st Century, University of California Press, California, USA, 340 pp., ISBN 0-520-23668-8, 2002.
Guilley, E., Hervé, J.-C., and Nepveu, G.: The influence of site quality, silviculture and region on wood density mixed model in Quercus petraea Liebl., Forest Ecol. Manag., 189, 111–121, https://doi.org/10.1016/j.foreco.2003.07.033, 2004.
Houllier, F., Leban, J.-M., and Colin, F.: Linking growth modelling to timber quality assessment for Norway spruce, Forest Ecol. Manag., 74, 91–102, https://doi.org/10.1016/0378-1127(94)03510-4, 1995.
Hughes, M., Schweingruber, F., Cartwright, D., and Kelly, P.: July–August temperature at Edinburgh between 1721 and 1975 from tree-ring density and width data, Nature, 308, 341–344, https://doi.org/10.1038/308341a0, 1984.
Jacquin, P., Mothe, F., Longuetaud, F., Billard, A., Kerfriden, B., and Leban, J.-M.: CarDen: A software for fast measurement of wood density on increment cores by CT scanning, Comput. Electron. Agric., 156, 606–617, https://doi.org/10.1016/j.compag.2018.12.008, 2019.
Jenkins, J. C., Chojnacky, D. C., Heath, L. S., and Birdsey, R. A.: National scale biomass estimators for United States tree species, Forest Sci., 49, 12–35, https://doi.org/10.1093/forestscience/49.1.12, 2003.
Karasiak, N., Fauvel, M., Dejoux, J.-F., Monteil, C., and Sheeren, D.: Optimal dates for deciduous tree species mapping using full years Sentinel-2 time series in south west France, ISPRS Ann. Photogramm. Remote Sens. Spatial Inf. Sci., 3, 469–476, https://doi.org/10.5194/isprs-annals-V-3-2020-469-2020, 2020.
Kattge, J., Bönisch, G., Díaz, S., Lavorel, S., Prentice, I. C., Leadley, P., Tautenhahn, S., Werner, G. D. A., Aakala, T., Abedi, M., Acosta, A. T. R., Adamidis, G. C., Adamson, K., Aiba, M., Albert, C. H., Alcántara, J. M., Alcázar C, C., Aleixo, I., Ali, H., Amiaud, B., Ammer, C., Amoroso, M. M., Anand, M., Anderson, C., Anten, N., Antos, J., Apgaua, D. M. G., Ashman, T.-L., Asmara, D. H., Asner, G. P., Aspinwall, M., Atkin, O., Aubin, I., Baastrup-Spohr, L., Bahalkeh, K., Bahn, M., Baker, T., Baker, W. J., Bakker, J. P., Baldocchi, D., Baltzer, J., Banerjee, A., Baranger, A., Barlow, J., Barneche, D. R., Baruch, Z., Bastianelli, D., Battles, J., Bauerle, W., Bauters, M., Bazzato, E., Beckmann, M., Beeckman, H., Beierkuhnlein, C., Bekker, R., Belfry, G., Belluau, M., Beloiu, M., Benavides, R., Benomar, L., Berdugo-Lattke, M. L., Berenguer, E., Bergamin, R., Bergmann, J., Bergmann Carlucci, M., Berner, L., Bernhardt-Römermann, M., Bigler, C., Bjorkman, A. D., Blackman, C., Blanco, C., Blonder, B., Blumenthal, D., Bocanegra-González, K. T., Boeckx, P., Bohlman, S., Böhning-Gaese, K., Boisvert-Marsh, L., Bond, W., Bond-Lamberty, B., Boom, A., Boonman, C. C. F., Bordin, K., Boughton, E. H., Boukili, V., Bowman, D. M. J. S., Bravo, S., Brendel, M. R., Broadley, M. R., Brown, K. A., Bruelheide, H., Brumnich, F., Bruun, H. H., Bruy, D., Buchanan, S. W., Bucher, S. F., Buchmann, N., Buitenwerf, R., Bunker, D. E., Bürger, J., Burrascano, S., Burslem, D. F. R. P., Butterfield, B. J., Byun, C., Marques, M., Scalon, M. C., Caccianiga, M., Cadotte, M., Cailleret, M., Camac, J., Camarero, J. J., Campany, C., Campetella, G., Campos, J. A., Cano-Arboleda, L., Canullo, R., Carbognani, M., Carvalho, F., Casanoves, F., Castagneyrol, B., Catford, J. A., Cavender-Bares, J., Cerabolini, B. E. L., Cervellini, M., Chacón-Madrigal, E., Chapin, K., Chapin, F. S., Chelli, S., Chen, S.-C., Chen, A., Cherubini, P., Chianucci, F., Choat, B., Chung, K.-S., Chytrý, M., Ciccarelli, D., Coll, L., Collins, C. G., Conti, L., Coomes, D., Cornelissen, J. H. C., Cornwell, W. K., Corona, P., Coyea, M., Craine, J., Craven, D., Cromsigt, J. P. G. M., Csecserits, A., Cufar, K., Cuntz, M., da Silva, A. C., Dahlin, K. M., Dainese, M., Dalke, I., Dalle Fratte, M., Dang-Le, A. T., Danihelka, J., Dannoura, M., Dawson, S., de Beer, A. J., De Frutos, A., De Long, J. R., Dechant, B., Delagrange, S., Delpierre, N., Derroire, G., Dias, A. S., Diaz-Toribio, M. H., Dimitrakopoulos, P. G., Dobrowolski, M., Doktor, D., Dřevojan, P., Dong, N., Dransfield, J., Dressler, S., Duarte, L., Ducouret, E., Dullinger, S., Durka, W., Duursma, R., Dymova, O., E-Vojtkó, A., Eckstein, R. L., Ejtehadi, H., Elser, J., Emilio, T., Engemann, K., Erfanian, M. B., Erfmeier, A., Esquivel-Muelbert, A., Esser, G., Estiarte, M., Domingues, T. F., Fagan, W. F., Fagúndez, J., Falster, D. S., Fan, Y., Fang, J., Farris, E., Fazlioglu, F., Feng, Y., Fernandez-Mendez, F., Ferrara, C., Ferreira, J., Fidelis, A., Finegan, B., Firn, J., Flowers, T. J., Flynn, D. F. B., Fontana, V., Forey, E., Forgiarini, C., François, L., Frangipani, M., Frank, D., Frenette-Dussault, C., Freschet, G. T., Fry, E. L., Fyllas, N. M., Mazzochini, G. G., Gachet, S., Gallagher, R., Ganade, G., Ganga, F., García-Palacios, P., Gargaglione, V., Garnier, E., Garrido, J. L., de Gasper, A. L., Gea-Izquierdo, G., Gibson, D., Gillison, A. N., Giroldo, A., Glasenhardt, M.-C., Gleason, S., Gliesch, M., Goldberg, E., Göldel, B., Gonzalez-Akre, E., Gonzalez-Andujar, J. L., González-Melo, A., González-Robles, A., Graae, B. J., Granda, E., Graves, S., Green, W. A., Gregor, T., Gross, N., Guerin, G. R., Günther, A., Gutiérrez, A. G., Haddock, L., Haines, A., Hall, J., Hambuckers, A., Han, W., Harrison, S. P., Hattingh, W., Hawes, J. E., He, T., He, P., Heberling, J. M., Helm, A., Hempel, S., Hentschel, J., Hérault, B., Hereş, A.-M., Herz, K., Heuertz, M., Hickler, T., Hietz, P., Higuchi, P., Hipp, A. L., Hirons, A., Hock, M., Hogan, J. A., Holl, K., Honnay, O., Hornstein, D., Hou, E., Hough-Snee, N., Hovstad, K. A., Ichie, T., Igić, B., Illa, E., Isaac, M., Ishihara, M., Ivanov, L., Ivanova, L., Iversen, C. M., Izquierdo, J., Jackson, R. B., Jackson, B., Jactel, H., Jagodzinski, A. M., Jandt, U., Jansen, S., Jenkins, T., Jentsch, A., Jespersen, J. R. P., Jiang, G.-F., Johansen, J. L., Johnson, D., Jokela, E. J., Joly, C. A., Jordan, G. J., Joseph, G. S., Junaedi, D., Junker, R. R., Justes, E., Kabzems, R., Kane, J., Kaplan, Z., Kattenborn, T., Kavelenova, L., Kearsley, E., Kempel, A., Kenzo, T., Kerkhoff, A., Khalil, M. I., Kinlock, N. L., Kissling, W. D., Kitajima, K., Kitzberger, T., Kjøller, R., Klein, T., Kleyer, M., Klimešová, J., Klipel, J., Kloeppel, B., Klotz, S., Knops, J. M. H., Kohyama, T., Koike, F., Kollmann, J., Komac, B., Komatsu, K., König, C., Kraft, N. J. B., Kramer, K., Kreft, H., Kühn, I., Kumarathunge, D., Kuppler, J., Kurokawa, H., Kurosawa, Y., Kuyah, S., Laclau, J.-P., Lafleur, B., Lallai, E., Lamb, E., Lamprecht, A., Larkin, D. J., Laughlin, D., Le Bagousse-Pinguet, Y., le Maire, G., le Roux, P. C., le Roux, E., Lee, T., Lens, F., Lewis, S. L., Lhotsky, B., Li, Y., Li, X., Lichstein, J. W., Liebergesell, M., Lim, J. Y., Lin, Y.-S., Linares, J. C., Liu, C., Liu, D., Liu, U., Livingstone, S., Llusià, J., Lohbeck, M., López-García, Á., Lopez-Gonzalez, G., Lososová, Z., Louault, F., Lukács, B. A., Lukeš, P., Luo, Y., Lussu, M., Ma, S., Maciel Rabelo Pereira, C., Mack, M., Maire, V., Mäkelä, A., Mäkinen, H., Malhado, A. C. M., Mallik, A., Manning, P., Manzoni, S., Marchetti, Z., Marchino, L., Marcilio-Silva, V., Marcon, E., Marignani, M., Markesteijn, L., Martin, A., Martínez-Garza, C., Martínez-Vilalta, J., Mašková, T., Mason, K., Mason, N., Massad, T. J., Masse, J., Mayrose, I., McCarthy, J., McCormack, M. L., McCulloh, K., McFadden, I. R., McGill, B. J., McPartland, M. Y., Medeiros, J. S., Medlyn, B., Meerts, P., Mehrabi, Z., Meir, P., Melo, F. P. L., Mencuccini, M., Meredieu, C., Messier, J., Mészáros, I., Metsaranta, J., Michaletz, S. T., Michelaki, C., Migalina, S., Milla, R., Miller, J. E. D., Minden, V., Ming, R., Mokany, K., Moles, A. T., Molnár, A., Molofsky, J., Molz, M., Montgomery, R. A., Monty, A., Moravcová, L., Moreno-Martínez, A., Moretti, M., Mori, A. S., Mori, S., Morris, D., Morrison, J., Mucina, L., Mueller, S., Muir, C. D., Müller, S. C., Munoz, F., Myers-Smith, I. H., Myster, R. W., Nagano, M., Naidu, S., Narayanan, A., Natesan, B., Negoita, L., Nelson, A. S., Neuschulz, E. L., Ni, J., Niedrist, G., Nieto, J., Niinemets, Ü., Nolan, R., Nottebrock, H., Nouvellon, Y., Novakovskiy, A., Nutrient Network, Nystuen, K. O., O'Grady, A., O'Hara, K., O'Reilly-Nugent, A., Oakley, S., Oberhuber, W., Ohtsuka, T., Oliveira, R., Öllerer, K., Olson, M. E., Onipchenko, V., Onoda, Y., Onstein, R. E., Ordonez, J. C., Osada, N., Ostonen, I., Ottaviani, G., Otto, S., Overbeck, G. E., Ozinga, W. A., Pahl, A. T., Paine, C. E. T., Pakeman, R. J., Papageorgiou, A. C., Parfionova, E., Pärtel, M., Patacca, M., Paula, S., Paule, J., Pauli, H., Pausas, J. G., Peco, B., Penuelas, J., Perea, A., Peri, P. L., Petisco-Souza, A. C., Petraglia, A., Petritan, A. M., Phillips, O. L., Pierce, S., Pillar, V. D., Pisek, J., Pomogaybin, A., Poorter, H., Portsmuth, A., Poschlod, P., Potvin, C., Pounds, D., Powell, A. S., Power, S. A., Prinzing, A., Puglielli, G., Pyšek, P., Raevel, V., Rammig, A., Ransijn, J., Ray, C. A., Reich, P. B., Reichstein, M., Reid, D. E. B., Réjou-Méchain, M., de Dios, V. R., Ribeiro, S., Richardson, S., Riibak, K., Rillig, M. C., Riviera, F., Robert, E. M. R., Roberts, S., Robroek, B., Roddy, A., Rodrigues, A. V., Rogers, A., Rollinson, E., Rolo, V., Römermann, C., Ronzhina, D., Roscher, C., Rosell, J. A., Rosenfield, M. F., Rossi, C., Roy, D. B., Royer-Tardif, S., Rüger, N., Ruiz-Peinado, R., Rumpf, S. B., Rusch, G. M., Ryo, M., Sack, L., Saldaña, A., Salgado-Negret, B., Salguero-Gomez, R., Santa-Regina, I., Santacruz-García, A. C., Santos, J., Sardans, J., Schamp, B., Scherer-Lorenzen, M., Schleuning, M., Schmid, B., Schmidt, M., Schmitt, S., Schneider, J. V., Schowanek, S. D., Schrader, J., Schrodt, F., Schuldt, B., Schurr, F., Selaya Garvizu, G., Semchenko, M., Seymour, C., Sfair, J. C., Sharpe, J. M., Sheppard, C. S., Sheremetiev, S., Shiodera, S., Shipley, B., Shovon, T. A., Siebenkäs, A., Sierra, C., Silva, V., Silva, M., Sitzia, T., Sjöman, H., Slot, M., Smith, N. G., Sodhi, D., Soltis, P., Soltis, D., Somers, B., Sonnier, G., Sørensen, M. V., Sosinski, E. E., Soudzilovskaia, N. A., Souza, A. F., Spasojevic, M., Sperandii, M. G., Stan, A. B., Stegen, J., Steinbauer, K., Stephan, J. G., Sterck, F., Stojanovic, D. B., Strydom, T., Suarez, M. L., Svenning, J.-C., Svitková, I., Svitok, M., Svoboda, M., Swaine, E., Swenson, N., Tabarelli, M., Takagi, K., Tappeiner, U., Tarifa, R., Tauugourdeau, S., Tavsanoglu, C., Te Beest, M., Tedersoo, L., Thiffault, N., Thom, D., Thomas, E., Thompson, K., Thornton, P. E., Thuiller, W., Tichý, L., Tissue, D., Tjoelker, M. G., Tng, D. Y. P., Tobias, J., Török, P., Tarin, T., Torres-Ruiz, J. M., Tóthmérész, B., Treurnicht, M., Trivellone, V., Trolliet, F., Trotsiuk, V., Tsakalos, J. L., Tsiripidis, I., Tysklind, N., Umehara, T., Usoltsev, V., Vadeboncoeur, M., Vaezi, J., Valladares, F., Vamosi, J., van Bodegom, P. M., van Breugel, M., Van Cleemput, E., van de Weg, M., van der Merwe, S., van der Plas, F., van der Sande, M. T., van Kleunen, M., Van Meerbeek, K., Vanderwel, M., Vanselow, K. A., Vårhammar, A., Varone, L., Vasquez Valderrama, M. Y., Vassilev, K., Vellend, M., Veneklaas, E. J., Verbeeck, H., Verheyen, K., Vibrans, A., Vieira, I., Villacís, J., Violle, C., Vivek, P., Wagner, K., Waldram, M., Waldron, A., Walker, A. P., Waller, M., Walther, G., Wang, H., Wang, F., Wang, W., Watkins, H., Watkins, J., Weber, U., Weedon, J. T., Wei, L., Weigelt, P., Weiher, E., Wells, A. W., Wellstein, C., Wenk, E., Westoby, M., Westwood, A., White, P. J., Whitten, M., Williams, M., Winkler, D. E., Winter, K., Womack, C., Wright, I. J., Wright, S. J., Wright, J., Pinho, B. X., Ximenes, F., Yamada, T., Yamaji, K., Yanai, R., Yankov, N., Yguel, B., Zanini, K. J., Zanne, A. E., Zelený, D., Zhao, Y.-P., Zheng, J., Zheng, J., Ziemińska, K., Zirbel, C. R., Zizka, G., Zo-Bi, I. C., Zotz, G., and Wirth, C.: TRY plant trait database – enhanced coverage and open access, Glob. Change Biol., 26, 119–188, https://doi.org/10.1111/gcb.14904, 2020.
Kerfriden, B., Bontemps, J.-D., and Leban, J.-M.: Variations in temperate forest stem biomass ratio along three environmental gradients are dominated by interspecific differences in wood density, Plant Ecol., 222, 289–303, https://doi.org/10.1007/s11258-020-01106-0, 2021.
King, D. A.: The adaptive significance of tree height, Am. Nat., 135, 809–828, https://doi.org/10.1086/285075, 1990.
Labrière, N., Davies, S. J., Disney, M. I., Duncanson, L. I., Herold, M., Lewis, S. L., Phillips, O. L., Quegan, S., Saatchi, S. S., Schepaschenko, D. G., Scipal, K., Sist, P., and Chave, J.: Toward a forest biomass reference measurement system for remote sensing applications, Glob. Change Biol., 29, 827–840, https://doi.org/10.1111/gcb.16497, 2023.
Lachenbruch, B., Moore, J. R., and Evans, R.: Radial Variation in Wood Structure and Function in Woody Plants, and Hypotheses for Its Occurrence, in: Size- and Age-Related Changes in Tree Structure and Function, edited by: Meinzer, F. C., Lachenbruch, B., and Dawson, T. E., Springer Netherlands, Dordrecht, 121–164, https://doi.org/10.1007/978-94-007-1242-3_5, 2011.
Lewis, S. L., Sonké, B., Sunderland, T., Begne, S. K., Lopez-Gonzalez, G., van der Heijden, G. M. F., Phillips, O. L., Affum-Baffoe, K., Baker, T. R., Banin, L., Bastin, J.-F., Beeckman, H., Boeckx, P., Bogaert, J., De Cannière, C., Chezeaux, E., Clark, C. J., Collins, M., Djagbletey, G., Djuikouo, M. N. K., Droissart, V., Doucet, J.-L., Ewango, C. E. N., Fauset, S., Feldpausch, T. R., Foli, E. G., Gillet, J.-F., Hamilton, A. C., Harris, D. J., Hart, T. B., de Haulleville, T., Hladik, A., Hufkens, K., Huygens, D., Jeanmart, P., Jeffery, K. J., Kearsley, E., Leal, M. E., Lloyd, J., Lovett, J. C., Makana, J.-R., Malhi, Y., Marshall, A. R., Ojo, L., Peh, K. S.-H., Pickavance, G., Poulsen, J. R., Reitsma, J. M., Sheil, D., Simo, M., Steppe, K., Taedoumg, H. E., Talbot, J., Taplin, J. R. D., Taylor, D., Thomas, S. C., Toirambe, B., Verbeeck, H., Vleminckx, J., White, L. J. T., Willcock, S., Woell, H., and Zemagho, L.: Above-ground biomass and structure of 260 African tropical forests, Philos. T. R. Soc. B, 368, 20120295, https://doi.org/10.1098/rstb.2012.0295, 2013.
Li, F., Qian, H., Sardans, J., Amishev, D. Y., Wang, Z., Zhang, C., Wu, T., Xu, X., Tao, X., and Huang, X.: Evolutionary history shapes variation of wood density of tree species across the world, Plant Divers., 46, 283–293, https://doi.org/10.1016/j.pld.2024.04.002, 2024.
Liu, S., Brandt, M., Nord-Larsen, T., Chave, J., Reiner, F., Lang, N., Tong, X., Ciais, P., Igel, C., Pascual, A., Guerra-Hernandez, J., Li, S., Mugabowindekwe, M., Saatchi, S., Yue, Y., Chen, Z., and Fensholt, R.: The overlooked contribution of trees outside forests to tree cover and woody biomass across Europe, Sci. Adv., 9, eadh4097, https://doi.org/10.1126/sciadv.adh4097, 2023.
Loustau, D.: Projet CARBOFOR: Séquestration de Carbone dans les grands écosystèmes forestiers en France. Quantification, spatialisation, vulnérabilité et impacts de différents scénarios climatiques et sylvicoles, http://www.gip-ecofor.org/gicc/?p=_592 (last access: 18 March 2026), 2004.
Ma, T., Zhang, C., Ji, L., Zuo, Z., Beckline, M., Hu, Y., Li, X., and Xiao, X.: Development of forest aboveground biomass estimation, its problems and future solutions: A review, Ecol. Indic., 159, 111653, https://doi.org/10.1016/j.ecolind.2024.111653, 2024.
Martin-Ducup, O., Dupuy, J.-L., Soma, M., Guerra-Hernandez, J., Marino, E., Fernandes, P. M., Just, A., Corbera, J., Toutchkov, M., Sorribas, C., Bock, J., Piboule, A., Pirotti, F., and Pimont, F.: Unlocking the potential of Airborne LiDAR for direct assessment of fuel bulk density and load distributions for wildfire hazard mapping, Agr. Forest Meteorol., 362, 110341, https://doi.org/10.1016/j.agrformet.2024.110341, 2025.
Martínez-Sancho, E., Slámová, L., Morganti, S., Grefen, C., Carvalho, B., Dauphin, B., Rellstab, C., Gugerli, F., Opgenoorth, L., Heer, K., Knutzen, F., von Arx, G., Valladares, F., Cavers, S., Fady, B., Alía, R., Aravanopoulos, F., Avanzi, C., Bagnoli, F., Barbas, E., Bastien, C., Benavides, R., Bernier, F., Bodineau, G., Bastias, C. C., Charpentier, J.-P., Climent, J. M., Corréard, M., Courdier, F., Danusevicius, D., Farsakoglou, A.-M., del Barrio, J. M. G., Gilg, O., González-Martínez, S. C., Gray, A., Hartleitner, C., Hurel, A., Jouineau, A., Kärkkäinen, K., Kujala, S. T., Labriola, M., Lascoux, M., Lefebvre, M., Lejeune, V., Le-Provost, G., Liesebach, M., Malliarou, E., Mariotte, N., Matesanz, S., Michotey, C., Milesi, P., Myking, T., Notivol, E., Pakull, B., Piotti, A., Plomion, C., Pringarbe, M., Pyhäjärvi, T., Raffin, A., Ramírez-Valiente, J. A., Ramskogler, K., Robledo-Arnuncio, J. J., Savolainen, O., Schueler, S., Semerikov, V., Spanu, I., Thévenet, J., Mette Tollefsrud, M., Turion, N., Veisse, D., Vendramin, G. G., Villar, M., Westin, J., and Fonti, P.: The GenTree Dendroecological Collection, tree-ring and wood density data from seven tree species across Europe, Sci. Data, 7, 1, https://doi.org/10.1038/s41597-019-0340-y, 2020.
Mathieu, A.: Description des bois des essences forestières les plus importantes, Grimblot et veuve Raybois, Nancy, 1855.
Mo, L., Crowther, T. W., Maynard, D. S., van den Hoogen, J., Ma, H., Bialic-Murphy, L., Liang, J., de-Miguel, S., Nabuurs, G.-J., Reich, P. B., Phillips, O. L., Abegg, M., Adou Yao, Y. C., Alberti, G., Almeyda Zambrano, A. M., Alvarado, B. V., Alvarez-Dávila, E., Alvarez-Loayza, P., Alves, L. F., Amaral, I., Ammer, C., Antón-Fernández, C., Araujo-Murakami, A., Arroyo, L., Avitabile, V., Aymard, G. A., Baker, T. R., Bałazy, R., Banki, O., Barroso, J. G., Bastian, M. L., Bastin, J.-F., Birigazzi, L., Birnbaum, P., Bitariho, R., Boeckx, P., Bongers, F., Boonman, C. C. F., Bouriaud, O., Brancalion, P. H. S., Brandl, S., Brearley, F. Q., Brienen, R., Broadbent, E. N., Bruelheide, H., Bussotti, F., Gatti, R. C., César, R. G., Cesljar, G., Chazdon, R., Chen, H. Y. H., Chisholm, C., Cho, H., Cienciala, E., Clark, C., Clark, D., Colletta, G. D., Coomes, D. A., Valverde, F. C., Corral-Rivas, J. J., Crim, P. M., Cumming, J. R., Dayanandan, S., de Gasper, A. L., Decuyper, M., Derroire, G., DeVries, B., Djordjevic, I., Dolezal, J., Dourdain, A., Engone Obiang, N. L., Enquist, B. J., Eyre, T. J., Fandohan, A. B., Fayle, T. M., Feldpausch, T. R., Ferreira, L. V., Finér, L., Fischer, M., Fletcher, C., Frizzera, L., Gamarra, J. G. P., Gianelle, D., Glick, H. B., Harris, D. J., Hector, A., Hemp, A., Hengeveld, G., Hérault, B., Herbohn, J. L., Herold, M., Hietz, P., Hillers, A., Honorio Coronado, E. N., Hui, C., Ibanez, T., Imai, N., Jagodziński, A. M., Jaroszewicz, B., Johannsen, V. K., Joly, C. A., Jucker, T., Jung, I., Karminov, V., Kartawinata, K., Kearsley, E., Kenfack, D., Kennard, D. K., Kepfer-Rojas, S., Keppel, G., Khan, M. L., Killeen, T. J., Kim, H. S., Kitayama, K., Köhl, M., Korjus, H., Kraxner, F., Kucher, D., Laarmann, D., Lang, M., Lewis, S. L., Li, Y., Lopez-Gonzalez, G., Lu, H., Lukina, N. V., Maitner, B. S., Malhi, Y., Marcon, E., Marimon, B. S., Marimon-Junior, B. H., Marshall, A. R., Martin, E. H., McCarthy, J. K., Meave, J. A., Melo-Cruz, O., Mendoza, C., Mendoza-Polo, I., Miscicki, S., Merow, C., Mendoza, A. M., Moreno, V. S., Mukul, S. A., Mundhenk, P., Nava-Miranda, M. G., Neill, D., Neldner, V. J., Nevenic, R. V., Ngugi, M. R., Niklaus, P. A., Ontikov, P., Ortiz-Malavasi, E., Pan, Y., Paquette, A., Parada-Gutierrez, A., Parfenova, E. I., Park, M., Parren, M., Parthasarathy, N., Peri, P. L., Pfautsch, S., Picard, N., Piedade, M. T. F., Piotto, D., Pitman, N. C. A., Poorter, L., Poulsen, A. D., Poulsen, J. R., Pretzsch, H., Arevalo, F. R., Restrepo-Correa, Z., Richardson, S. J., Rodeghiero, M., Rolim, S. G., Roopsind, A., Rovero, F., Rutishauser, E., Saikia, P., Salas-Eljatib, C., Saner, P., Schall, P., Schelhaas, M.-J., Schepaschenko, D., Scherer-Lorenzen, M., Schmid, B., Schöngart, J., Searle, E. B., Seben, V., Serra-Diaz, J. M., Sheil, D., Shvidenko, A. Z., Da Silva, A. C., Silva-Espejo, J. E., Silveira, M., Singh, J., Sist, P., Slik, F., Sonké, B., Sosinski, E. E., Souza, A. F., Stereńczak, K. J., Svenning, J.-C., Svoboda, M., Swanepoel, B., Targhetta, N., Tchebakova, N., ter Steege, H., Thomas, R., Tikhonova, E., Umunay, P. M., Usoltsev, V. A., Valencia, R., Valladares, F., Van Bodegom, P. M., van der Plas, F., Van Do, T., van Nuland, M. E., Vasquez, R. M., Verbeeck, H., Viana, H., Vibrans, A. C., Vieira, S., von Gadow, K., Wang, H.-F., Watson, J. V., Werner, G. D. A., Wittmann, F., Woell, H., Wortel, V., Zagt, R., Zawiła-Niedźwiecki, T., Zhang, C., Zhao, X., Zhou, M., Zhu, Z.-X., Zo-Bi, I. C., and Zohner, C. M.: The global distribution and drivers of wood density and their impact on forest carbon stocks, Nat. Ecol. Evol., 1–18, https://doi.org/10.1038/s41559-024-02564-9, 2024.
Montes, C. S. and Weber, J. C.: Genetic variation in wood density and correlations with tree growth in Prosopis africana from Burkina Faso and Niger, Ann. Forest Sci., 66, 1–9, https://doi.org/10.1051/forest/2009060, 2009.
Mouret, F., Morin, D., Planells, M., and Vincent-Barbaroux, C.: Tree Species Classification at the Pixel Level Using Deep Learning and Multispectral Time Series in an Imbalanced Context, Remote Sens., 17, 1190, https://doi.org/10.3390/rs17071190, 2025.
Nascimento, H. E. M., Laurance, W. F., Condit, R., Laurance, S. G., D'Angelo, S., and Andrade, A. C.: Demographic and life-history correlates for Amazonian trees, J. Veg. Sci., 16, 625–634, https://doi.org/10.1111/j.1654-1103.2005.tb02405.x, 2005.
Pan, Y., Birdsey, R. A., Phillips, O. L., Houghton, R. A., Fang, J., Kauppi, P. E., Keith, H., Kurz, W. A., Ito, A., and Lewis, S. L.: The enduring world forest carbon sink, Nature, 631, 563–569, https://doi.org/10.1038/s41586-024-07602-x, 2024.
Pellissier-Tanon, A., Ciais, P., Schwartz, M., Fayad, I., Xu, Y., Ritter, F., De Truchis, A., and Leban, J.-M.: Combining satellite images with national forest inventory measurements for monitoring post-disturbance forest height growth, Front. Remote Sens., 5, 1432577, https://doi.org/10.3389/frsen.2024.1432577, 2024.
Phillips, O. L., Sullivan, M. J. P., Baker, T. R., Monteagudo Mendoza, A., Vargas, P. N., and Vásquez, R.: Species Matter: Wood Density Influences Tropical Forest Biomass at Multiple Scales, Surv. Geophys., 40, 913–935, https://doi.org/10.1007/s10712-019-09540-0, 2019.
Piedallu, C., Gégout, J.-C., Lebourgeois, F., and Seynave, I.: Soil aeration, water deficit, nitrogen availability, acidity and temperature all contribute to shaping tree species distribution in temperate forests, J. Veg. Sci., 27, 387–399, https://doi.org/10.1111/jvs.12370 (last access: 18 March 2026), 2016.
Porth, I. and El-Kassaby, Y. A.: Assessment of the genetic diversity in forest tree populations using molecular markers, Diversity, 6, 283–295, https://doi.org/10.3390/d6020283, 2014.
R Core Team: R: A Language and Environment for Statistical Computing, https://www.R-project.org/ (last access: 1 April 2026), 2023.
Reyes, G., Brown, S., Chapman, J., and Lugo, A.: Wood densities of tropical tree species, US Department of Agriculture, Forest Service, Southern Forest Experiment Station, New Orleans, LA, https://doi.org/10.2737/SO-GTR-88, 1992.
Roberts, D. R., Bahn, V., Ciuti, S., Boyce, M. S., Elith, J., Guillera-Arroita, G., Hauenstein, S., Lahoz-Monfort, J. J., Schröder, B., Thuiller, W., Warton, D. I., Wintle, B. A., Hartig, F., and Dormann, C. F.: Cross-validation strategies for data with temporal, spatial, hierarchical, or phylogenetic structure, Ecography, 40, 913–929, https://doi.org/10.1111/ecog.02881, 2017.
Rozenberg, P., Franc, A., Bastien, C., and Cahalan, C.: Improving models of wood density by including genetic effects: a case study in Douglas-fir, Ann. Forest Sci., 58, 385–394, https://doi.org/10.1051/forest:2001132, 2001.
Sæbø, J. S., Socolar, J. B., Sánchez, E. P., Woodcock, P., Bousfield, C. G., Uribe, C. A. M., Edwards, D. P., and Haugaasen, T.: Ignoring variation in wood density drives substantial bias in biomass estimates across spatial scales, Environ. Res. Lett., 17, 054002, https://doi.org/10.1088/1748-9326/ac62ae, 2022.
Santoro, M. and Cartus, O.: ESA Biomass Climate Change Initiative (Biomass_cci): Global datasets of forest above-ground biomass for the years 2007, 2010, 2015, 2016, 2017, 2018, 2019, 2020, 2021 and 2022, v6.0, https://doi.org/10.5285/95913FFB6467447CA72C4E9D8CF30501, 2025.
Saranpää, P.: Wood density and growth, in: Wood Quality and its Biological Basis, edited by: Barnett, J. R. and Jeronimidis, G., Blackwell Publishing, CRC Press LLC, ISBN 978-1-84127-319-8, 2003.
Schwartz, M., Ciais, P., De Truchis, A., Chave, J., Ottlé, C., Vega, C., Wigneron, J.-P., Nicolas, M., Jouaber, S., Liu, S., Brandt, M., and Fayad, I.: FORMS: Forest Multiple Source height, wood volume, and biomass maps in France at 10 to 30 m resolution based on Sentinel-1, Sentinel-2, and Global Ecosystem Dynamics Investigation (GEDI) data with a deep learning approach, Earth Syst. Sci. Data, 15, 4927–4945, https://doi.org/10.5194/essd-15-4927-2023, 2023.
Siefert, A., Violle, C., Chalmandrier, L., Albert, C. H., Taudiere, A., Fajardo, A., Aarssen, L. W., Baraloto, C., Carlucci, M. B., Cianciaruso, M. V., de L. Dantas, V., de Bello, F., Duarte, L. D. S., Fonseca, C. R., Freschet, G. T., Gaucherand, S., Gross, N., Hikosaka, K., Jackson, B., Jung, V., Kamiyama, C., Katabuchi, M., Kembel, S. W., Kichenin, E., Kraft, N. J. B., Lagerström, A., Bagousse-Pinguet, Y. L., Li, Y., Mason, N., Messier, J., Nakashizuka, T., Overton, J. McC., Peltzer, D. A., Pérez-Ramos, I. M., Pillar, V. D., Prentice, H. C., Richardson, S., Sasaki, T., Schamp, B. S., Schöb, C., Shipley, B., Sundqvist, M., Sykes, M. T., Vandewalle, M., and Wardle, D. A.: A global meta-analysis of the relative extent of intraspecific trait variation in plant communities, Ecol. Lett., 18, 1406–1419, https://doi.org/10.1111/ele.12508, 2015.
Soro, A., Lenz, P., Roussel, J.-R., Larochelle, F., Bousquet, J., and Achim, A.: The phenotypic and genetic effects of drought-induced stress on apical growth, ring width, wood density and biomass in white spruce seedlings, New Forest, 54, 789–811, https://doi.org/10.1007/s11056-022-09939-5, 2023.
Su, Y., Schwartz, M., Fayad, I., García, M., Zavala, M. A., Tijerín-Triviño, J., Astigarraga, J., Cruz-Alonso, V., Liu, S., Zhang, X., Chen, S., Ritter, F., Besic, N., d'Aspremont, A., and Ciais, P.: Canopy height and biomass distribution across the forests of Iberian Peninsula, Sci. Data, 12, 678, https://doi.org/10.1038/s41597-025-05021-9, 2025.
Sullivan, M. J. P., Phillips, O. L., Galbraith, D., Almeida, E., de Oliveira, E. A., Almeida, J., Dávila, E. Á., Alves, L. F., Andrade, A., Aragão, L., Araujo-Murakami, A., Arets, E., Arroyo, L., Cruz, O. A. M., Baccaro, F., Baker, T. R., Banki, O., Baraloto, C., Barlow, J., Barroso, J., Berenguer, E., Blanc, L., Blundo, C., Bonal, D., Bongers, F., Bordin, K. M., Brienen, R. J. W., Broggio, I. S., Burban, B., Cabral, G., Camargo, J. L., Cardoso, D., Carniello, M. A., Castro, W., de Lima, H. C., Cavalheiro, L., Ribeiro, S. C., Ramos, S. C. P., Moscoso, V. C., Chave, J., Coelho, F., Comiskey, J. A., Valverde, F. C., Costa, F., Coutinho, I. A. C., da Costa, A. C. L., de Medeiros, M. B., del Aguila Pasquel, J., Derroire, G., Dexter, K. G., Disney, M., do Espírito Santo, M. M., Domingues, T. F., Dourdain, A., Duque, A., Rangel, C. D., Elias, F., Esquivel-Muelbert, A., Farfan-Rios, W., Fauset, S., Feldpausch, T., Fernandes, G. W., Ferreira, J., Nunes, Y. R. F., Figueiredo, J. C. G., Cabreara, K. G., Gonzalez, R., Hernández, L., Herrera, R., Honorio Coronado, E. N., Huasco, W. H., Iguatemy, M., Joly, C. A., Kalamandeen, M., Killeen, T., Klipel, J., Klitgaard, B., Laurance, S. G., Laurance, W. F., Levesley, A., Lewis, S. L., Lima Dan, M., Lopez-Gonzalez, G., Magnusson, W., Malhi, Y., Malizia, L., Malizia, A., Manzatto, A. G., Peña, J. L. M., Marimon, B. S., Marimon Junior, B. H., Martínez-Villa, J. A., Reis, S. M., Metzker, T., Milliken, W., Monteagudo-Mendoza, A., Moonlight, P., Morandi, P. S., Moser, P., Müller, S. C., Nascimento, M., Negreiros, D., Lima, A. N., Vargas, P. N., Oliveira, W. L., Palacios, W., Pallqui Camacho, N. C., Gutierrez, A. P., Pardo Molina, G., Pedra de Abreu, K. M., Peña-Claros, M., Pena Rodrigues, P. J. F., Pennington, R. T., Pickavance, G. C., Pipoly, J., Pitman, N. C. A., Playfair, M., Pontes-Lopes, A., Poorter, L., Prestes, N. C. C. dos S., Ramírez-Angulo, H., Réjou-Méchain, M., Reynel Rodriguez, C., Rivas-Torres, G., Rodrigues, P. M. S., de Jesus Rodrigues, D., de Sousa, T. R., Rodrigues Pinto, J. R., Rodriguez M., G. M., Roucoux, K., Ruokolainen, K., Ryan, C. M., Revilla, N. S., Salomão, R., Santos, R. M., Sarkinen, T., Scabin, A., Bergamin, R. S., Schietti, J., de Meira Junior, M. S., Serrano, J., Silman, M., Silva, R. C., Silva, C. V. J., Silva, J. O., Silveira, M., Simon, M. F., Soto-Shareva, Y. C., Souza, P., Souza, R., Sposito, T., Talbot, J., ter Steege, H., Terborgh, J., Thomas, R., Toledo, M., Torres-Lezama, A., Trujillo, W., van der Hout, P., Veloso, M. das D. M., Vieira, S. A., Vilanova, E., Villalobos Cayo, J. M., Villela, D. M., Viscarra, L. J., Vos, V. A., Wortel, V., Ishida, F. Y., Zuidema, P. A., and Zwerts, J. A.: Variation in wood density across South American tropical forests, Nat. Commun., 16, 2351, https://doi.org/10.1038/s41467-025-56175-4, 2025.
Swenson, N. G. and Enquist, B. J.: Ecological and evolutionary determinants of a key plant functional trait: wood density and its community-wide variation across latitude and elevation, Am. J. Bot., 94, 451–459, https://doi.org/10.3732/ajb.94.3.451, 2007.
Ulvdal, P., Ståhl, G., Sängstuvall, L., Eriksson, O., and Öhman, K.: Long-term strategic forest planning based on biased remote sensing predictions, Forest Monit., 2, https://doi.org/10.62320/fm.v2i1.25, 2025.
Vallet, P., Dhôte, J.-F., Le Moguédec, G., Ravart, M., and Pignard, G.: Development of total aboveground volume equations for seven important forest tree species in France, Forest Ecol. Manag., 229, 98–110, https://doi.org/10.1016/j.foreco.2006.03.013, 2006.
Williamson, G. B. and Wiemann, M. C.: Measuring wood specific gravity…Correctly, Am. J. Bot., 97, 519–524, https://doi.org/10.3732/ajb.0900243, 2010.
Wright, M. N. and Ziegler, A.: ranger: A Fast Implementation of Random Forests for High Dimensional Data in C and R, J. Stat. Softw., 77, 1–17, https://doi.org/10.18637/jss.v077.i01, 2017.
Yang, H., Wang, S., Son, R., Lee, H., Benson, V., Zhang, W., Zhang, Y., Zhang, Y., Kattge, J., Boenisch, G., Schepaschenko, D., Karaszewski, Z., Stereńczak, K., Moreno-Martínez, Á., Nabais, C., Birnbaum, P., Vieilledent, G., Weber, U., and Carvalhais, N.: Global patterns of tree wood density, Glob. Change Biol., 30, e17224, https://doi.org/10.1111/gcb.17224, 2024.
Yang, Q., Su, Y., Hu, T., Jin, S., Liu, X., Niu, C., Liu, Z., Kelly, M., Wei, J., and Guo, Q.: Allometry-based estimation of forest aboveground biomass combining LiDAR canopy height attributes and optical spectral indexes, Forest Ecosyst., 9, 100059, https://doi.org/10.1016/j.fecs.2022.100059, 2022.
Zanne, A. E., Lopez-Gonzalez, G., Coomes, D. A., Ilic, J., Jansen, S., Lewis, S. L., Miller, R. B., Swenson, N. G., Wiemann, M. C., and Chave, J.: Data from: Towards a worldwide wood economics spectrum (5), DRYAD [data set], https://doi.org/10.5061/DRYAD.234, 2009.
Zobel, B. J. and van Buijtenen, J. P.: Wood Variation and Wood Properties, in: Wood Variation, Springer, Berlin, Heidelberg, https://doi.org/10.1007/978-3-642-74069-5, 1989.