the Creative Commons Attribution 4.0 License.
the Creative Commons Attribution 4.0 License.
 | 03 Jun 2026
Colored and fluorescent DOM in the sea-surface microlayer: response to a phytoplankton bloom and photodegradation in a mesocosm study
Claudia Thölen
Jochen Wollschläger
Michael G. Novak
Rüdiger Röttgers
Oliver Zielinski
A month-long mesocosm study at the Institute for Chemistry and Biology of the Marine Environment (Wilhelmshaven, Germany) examined how a phytoplankton bloom and photodegradation influence the composition of colored and fluorescent dissolved organic matter (CDOM and FDOM, respectively) in the sea-surface microlayer (SML) and underlying water (ULW). The SML, a thin (<1000 µm) interface between ocean and atmosphere, plays a key role in air-sea exchange processes, but temporal mechanisms behind organic matter enrichment remain unclear. To isolate biogeochemical processes from environmental variability, daily SML and ULW samples were analyzed using spectral fluorometric and photometric methods, with supporting data e.g. on irradiance, temperature, and chlorophyll-a. The study covered bloom onset, peak, and decay of two partially overlying phytoplankton blooms. Samples were taken alternatively in the morning and in the afternoon, varying the exposure time to UV-light. Changes in composition and quality of organic matter were tracked using CDOM/FDOM derived metrics. Changes in the FDOM component composition were investigated using PERMANOVA. The significant influence of the bloom phases and the layer (SML or ULW) on the component composition was confirmed, however, their interaction was not significant. Protein-like FDOM components increased in both layers during bloom progression, while humic-like FDOM components decreased throughout the study. It is likely that the change in FDOM component composition is a joint result of the influences of the phytoplankton bloom and photodegradation effects. Based on the slope ratio (SR) of CDOM absorption slopes S275–295 and S350–400, photodegradation was identified as the dominant sink of organic matter over microbial activity. While some CDOM/FDOM derived metrics indicated stronger photodegradation effects in the SML, a consistently enhanced photodegradation signal could not be conclusively confirmed due to co-occurring enrichment, passive accumulation, and degradation processes.
- Article
(5345 KB) - Full-text XML
- BibTeX
- EndNote


The thin boundary layer between ocean and atmosphere, the sea-surface microlayer (SML), is highly relevant for marine biogeochemistry (Cunliffe et al., 2013; Liss and Duce, 2009; Wurl et al., 2011). It influences climate-related processes (Engel et al., 2017; Wurl et al., 2017), marine carbon cycling (Reinthaler et al., 2008), air-sea gas exchange (Mustaffa et al., 2020; Pereira et al., 2018), physical surface processes, like wave formation (Gade et al., 2013), and aerosol production (van Pinxteren et al., 2017; Wilson et al., 2015). Hunter (2009) defined the SML by its distinct physical and chemical properties differing to the underlying water (ULW). Organic compounds in the SML are often enriched due to physical accumulation from the ULW, in situ production, or atmospheric deposition (Cunliffe et al., 2013). Literature shows that an SML enriched in organic matter (OM) can hinder gas, light, momentum, and heat exchange between ocean and atmosphere (Cunliffe et al., 2013; Engel et al., 2017; Wurl et al., 2017). After disruption, the SML can be reestablished within minutes (Dragcevic and Pravdic, 1981; Jaeger et al., 2025) driven in part by rising air bubbles, that scavenge and transport surface-active OM, including dissolved OM (DOM), back to the surface (Hardy, 1982; Sabbaghzadeh et al., 2017).
DOM is one of the most complex and heterogeneous organic mixtures, representing the largest pool of reduced carbon on earth (Dittmar and Stubbins, 2014; McCarthy et al., 1993). DOM is operationally identified as OM produced by natural metabolic processes of plants and animals, passing through a filter with the pore size of 0.2–0.7 µm (Nelson and Siegel, 2013). Optical properties of DOM allow implications about its molecular weight (Peuravuori and Pihlaja, 1997), production (Coble, 1996), composition, transformation, and degradation processes (Coble, 1996; Drozdowska et al., 2017; Stedmon and Bro, 2008). It can serve as a tracer for photochemical and biological processes (Coble, 1996; Repetea and Aluwihare, 2024). Colored DOM (CDOM) has an exponentially decreasing absorption spectra in the ultraviolet (UV)-visible region which changes based on its composition. In coastal waters, terrestrial inputs typically decrease the spectral slope (S), whereas new productivity or intense photodegradation increases it (Moran and Zepp, 1997). Together with other optical metrics, spectral slopes are commonly used to characterize CDOM transformation processes such as photodegradation and microbial activity (Coble, 2013; Rickard et al., 2022). Specific DOM fluoresces after excitation, hence fluorescent DOM (FDOM). Distinct fluorophores are associated with microbial activity and autochthonous production or more refractory FDOM produced by degradation processes or terrestrial input (Coble, 2013; Kowalczuk et al., 2013; Nieto-Cid et al., 2006). These bio-optical methods offer rapid and sensitive means to track short-term dynamics of relevant biological and chemical drivers behind DOM enrichment in the SML (Stramski et al., 2019).
Pathways of CDOM and FDOM from the ULW into the SML or vice versa have been investigated in the past but rarely on short temporal and spatial scales. CDOM exhibits surface-active properties and numerous studies report a frequent enrichment of CDOM concentration in the SML compared to the ULW (Blough, 1997; Drozdowska et al., 2017; Miranda et al., 2018; Obernosterer et al., 2005; Tilstone et al., 2010; Wurl et al., 2009; Zäncker et al., 2017). Similar enrichment patterns have been observed for FDOM, including correlations with surface active substances (Frew et al., 2002). FDOM measurements in the Yellow Sea and East China Sea imply a continuous supply of OM from the ULW into the SML (Yang et al., 2022), while Galgani and Engel (2016) reported a local light-induced microbial release of DOM directly in the SML. Phytoneuston and bacteria inhabit the SML and contribute to its biofilm-like features (Hardy, 2009; Hardy and Apts, 1984; Obernosterer et al., 2005; Reinthaler et al., 2008; Wurl et al., 2016). During phytoplankton blooms biopolymer production and OM exudation, can further enrich the SML with surface-active compounds (Barthelmeß and Engel, 2022; Wurl et al., 2016, 2018).
For this study, it was hypothesized that the CDOM/FDOM signatures differ between the SML and ULW and provide information on the transformation processes of DOM in each layer.
Solar radiation, particularly in the UV range, degrades DOM into smaller fractions (Zepp et al., 1998). As the SML is directly exposed to elevated solar radiation, photochemical degradation processes of OM play an important role for the biogeochemical processes within the SML (Blough, 1997). Surfactants can affect the radiation penetration depth (Carlucci et al., 1985), so the biofilm-like matrix of the SML may serve as UV protection for microbial and planktonic life in the ULW (Tilstone et al., 2010; Wurl et al., 2016). Photodegradation strength presumably decreases over depth, as water itself and the water constituents, such as CDOM add to the UV-light absorption in the water column (Mason et al., 2016). Several studies have found differences in the photodegradation of DOM in the SML and the ULW (Drozdowska et al., 2017; Galgani and Engel, 2016; Miranda et al., 2018; Yang et al., 2022), although ULW samples were often collected at depths ≥1 m. The expectation and hypothesis of this study were that photodegradation affects the DOM in the SML stronger than in the ULW, especially regarding the production of OM during the phytoplankton blooms.
Heterogeneity and dynamics in the open sea make it difficult to differentiate between transport processes, environmental drivers, and biogeochemical processes. Mesocosm studies provide controlled conditions and reduced complexity. In a mesocosm study, conducted by the BASS (Biogeochemical Processes and Air-Sea Exchange in the Sea-Surface Microlayer) DFG research group (Bibi et al., 2025a), the effects of an induced phytoplankton bloom on the SML and ULW were investigated. External sources of DOM such as wet atmospheric deposition and inflow were excluded. Within the enclosed system, potential sources of DOM for the SML included the induced phytoplankton bloom, microbial activity, dry deposition, evaporation, and mixing with the ULW (Fig. 1). Observable sinks included photodegradation and microbial consumption. Of these, the induced phytoplankton bloom (as a source) and photodegradation (as a sink) form the focus of this study. The primary objective was to use observations of bio-optical properties (absorption and fluorescence) to assess DOM transformation in the SML relative to the ULW.
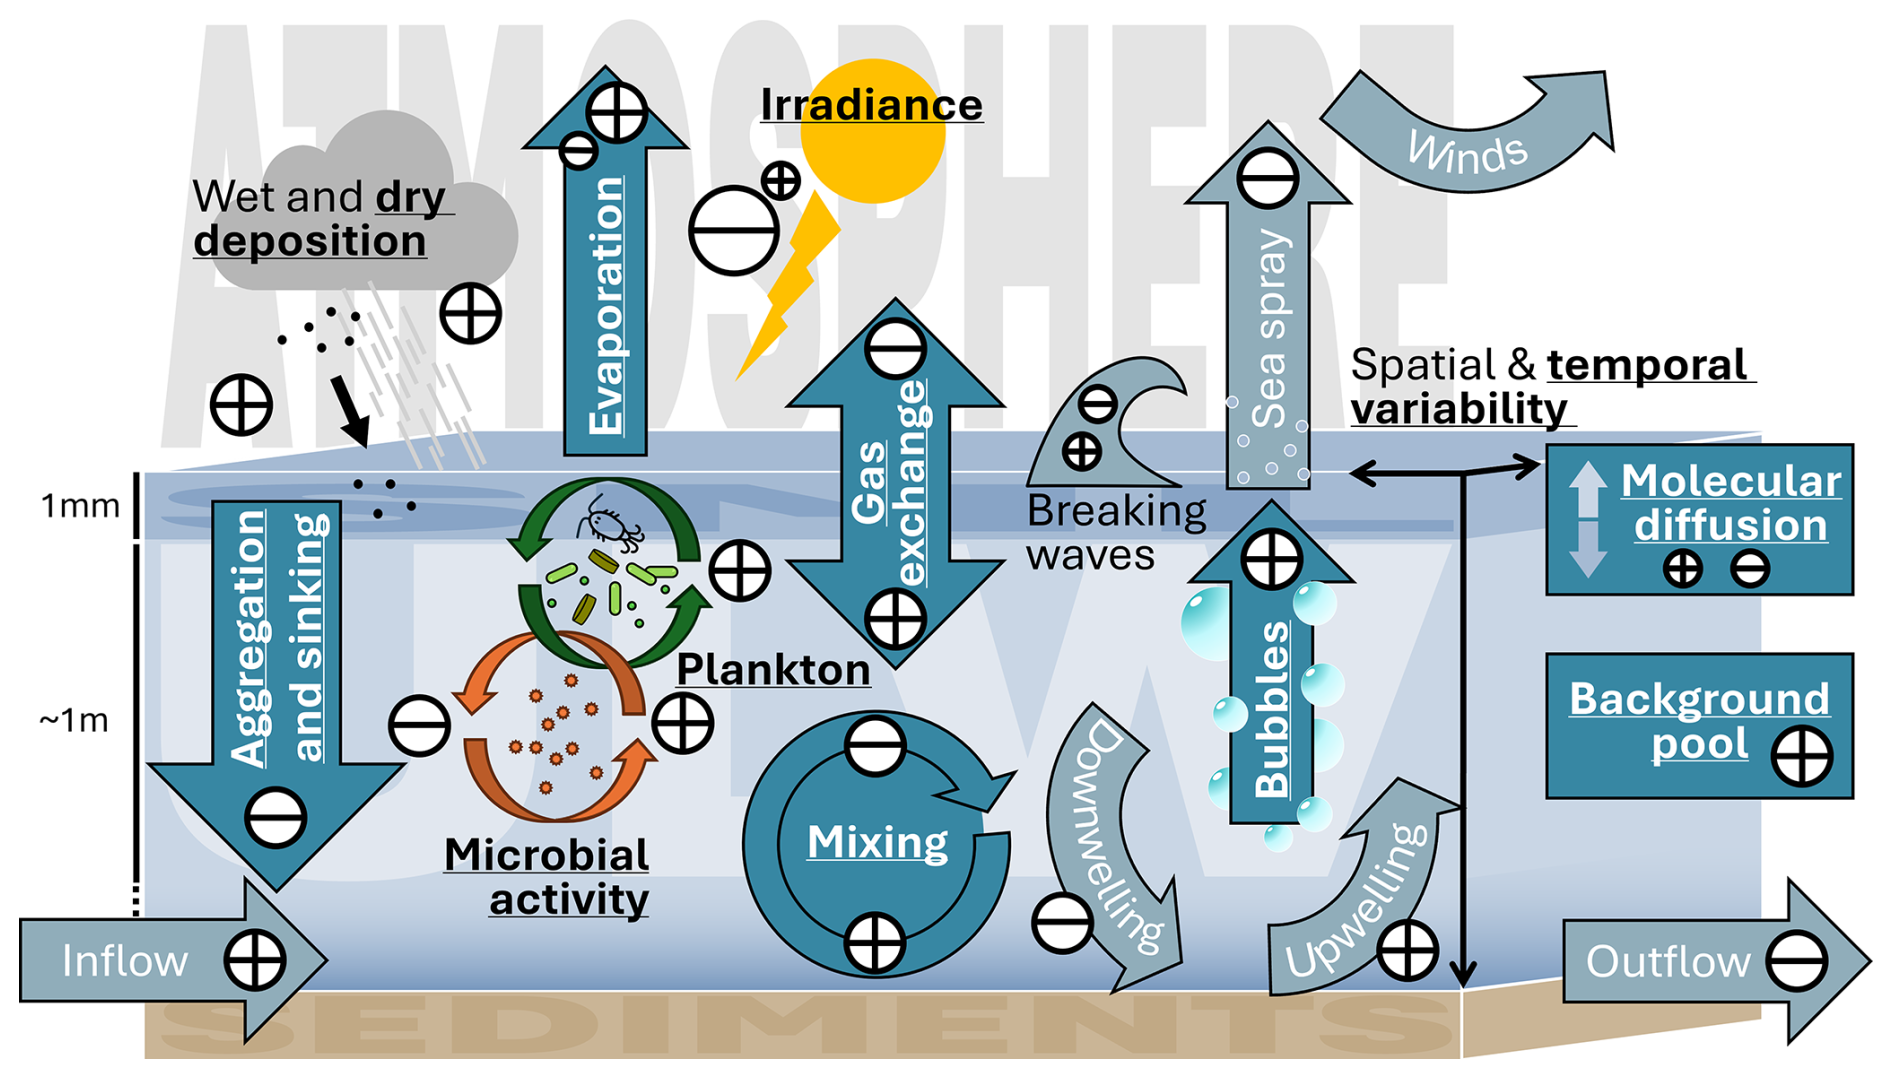
Figure 1Pathways and processes of sources (+) and sinks (−) of colored and fluorescent dissolved organic matter into the sea-surface microlayer (SML) from the atmosphere, the underlying water down to 1 m (ULW), and the deeper water column. Some processes act simultaneously as both source and sink depending on conditions and the timescale considered. Pathways and processes which were observable in this mesocosm study have been printed bold, underlined and colored in a darker shade of blue compared to the pathways and processes which are excluded in this mesocosm study.
2.1 Mesocosm study
The mesocosm study was conducted for a month from 18 May until 15 June 2023 in the Sea Surface Facility (SURF) of the Institute of Chemistry and Biology of the Marine Environment (ICBM) in Wilhelmshaven, Germany. The on-land facility contains an 8 m long, 1.5 m wide and 0.8 m deep outdoor basin with bright concrete walls and a retractable roof, which was closed at night and during rain events. The basin was filled with North Sea water from the adjacent Jade Bay. Homogeneity of the ULW in the basin was achieved by constant mixing of the water column, using flow pumps placed along the sides of the basin. Please refer to Bibi et al. (2025a) for a detailed description and pictures of the mesocosm facility. The phytoplankton bloom in the basin was triggered by the addition of nutrients (nitrogen, phosphorus and silicate) to the basin (Bibi et al., 2025a). Daily SML and ULW samples were collected alternating in the morning, about 1 h after sunrise (morning samples, AM), and in the afternoon, about 10 h after sunrise (afternoon samples, PM). The alternation of sampling times intended to capture a potential effect of sun-exposure duration on DOM transformations. The SML was collected via glass plate sampling (Cunliffe and Wurl, 2014). The ULW was sampled via a submerged tube and a connected syringe suction system at 0.4 m depth (Fig. A5). The removed sample volume was refilled with Jade Bay water every day. Next to the SURF basin, an irradiance radiometer (Ramses, TriOS, Germany) was mounted on a pole and measured continuously for the wavelengths between 319–956 nm in a 1 min interval. Chlorophyll-a as proxy for phytoplankton biomass was measured at 1 min resolution in the ULW with a fluorometer (Cyclops 7, Turner Designs, USA) integrated into a FerryBox (4h-Jena, Germany) at approx. 0.4 m depth. From the collected ULW samples, concentrations of chlorophyll-a were quantified via high performance liquid chromatography (HPLC) and used to calibrate the continuous FerryBox chlorophyll-a fluorescence measurement. Chlorophyll-a values were smoothed using a 2 h window with the LOESS (locally weighted regression) method. The available SML sample volume was insufficient for HPLC analysis. However, chlorophyll-a concentrations could be estimated from Quantitative-Filter-Technique Integrating-Cavity Absorption-Meter (QFT-ICAM, Röttgers et al., 2016) measurements via the absorption line height at around 670 nm (Roesler and Barnard, 2013; Wollschläger et al., 2014). Additionally, the absorption of non-algal particles (NAP) was derived by the particulate absorption at 750 nm in the QFT-ICAM for SML and ULW. CTDs (conductivity, temperature and depth, Sea & Sun Technology, Germany) constantly recorded temperature and salinity at depths of approx. 2 and 40 cm below the surface. A FlowCam (Yokogawa Fluid Imaging Technologies, USA) was used to quantify and identify particles (2–300 µm) via imaging (Clayton et al., 2026). Bacterial abundance was measured every third day and dissolved organic carbon (DOC) and surfactants were measured every day for SML and ULW using a voltammetry technique (797 VA Computrace, including 863 Compact Autosampler, Metrohm Switzerland) with a hanging drop mercury electrode (Ćosović and Vojvodic, 1987). For a more detailed description of the study setup, methods, and its parameters please refer to Bibi et al. (2025a).
2.2 CDOM and FDOM analysis
The SML and ULW samples were divided into smaller subsamples for the different analyses of all involved groups. 80 mL of each sample were filtered through pre-flushed 0.7 µm Whatman GF/F and 0.2 GHP membrane filters for CDOM and FDOM analysis (40 mL each).
The CDOM samples were stored dark in pre-combusted brown bottles at 4 °C until measurement within weeks of the study. CDOM absorbance was measured from 200–700 nm with three liquid waveguide capillary cells (LWCC, WPI, USA) of different pathlengths (10, 50, 250 cm) to increase the measurement sensitivity following the protocol of Röttgers et al. (2024) using a spectral detector (Model 1310076U1, Avantes, Netherlands). The blank-corrected absorbance spectra were converted into Napierian absorption coefficients (Bricaud et al., 1981).
The FDOM samples were filtered into clear 40 mL SUPELCO bottles, which were acid-washed twice and combusted at 500 °C for 5 h following the protocol of Oliver Ferdinand (personal communication, 2023). The samples were stored dark at 4 °C and measured within a few days of the study. FDOM excitation-emission matrices (EEMs) were obtained using an Aqualog (HORIBA, Jobin Yvon, Japan) with a 10 s integration time, high CCD gain, a bandpass of 5 nm for both excitation and emission, an excitation range from 240–500 nm, and an emission range on the CCD chip from 209–619 nm. The Aqualog measures fluorescence as well as absorption. The raw exported Aqualog data was corrected for errors and lamp shifts, by moving the entire EEM spectra for 3 nm on the emission axis, as the water Raman signal of 350 nm was detected at 394 nm, instead of 397 nm. Additionally, single emission spectra were corrupted by showing periodic peaks which were removed by deleting this emission spectra and integrating over it to regain the values at this emission wavelength. The corrected EEMs were decomposed by PARAFAC (Murphy et al., 2013) into their underlying fluorophore components using the drEEM and NWAY toolbox (version 0.6.5) in MATLAB (R2020b). The script was adapted following the recommendation of Murphy et al. (2013). Before running PARAFAC, the respective blank measurement (purified water standard cuvette, Starna, Type: 3/Q/10/WATER) was subtracted from the sample measurement and the resulting EEM was corrected for the inner-filter effect (Kothawala et al., 2013; Parker and Rees, 1962). The fluorescence intensity of the corrected EEM was normalized using the Raman scatter peak of water at an excitation of 350 nm and an emission of 371–428 nm (Lawaetz and Stedmon, 2009). The PARAFAC routine first handles the Rayleigh and Raman scatter, masking both from the EEM and interpolating the now blank spaces. The data was normalized and then examined for outliers by using the outliertest-function. Five out of 58 samples were excluded due to exceptionally high fluorescence intensities in the protein-like area of the EEM. A 4-component model was validated with the validation style S4C6T3 for the split half analysis with nonnegativity constraints and 1−8e as the convergence criteria with 50 random starts and a maximum number of 2500 iterations. The resulting final model had a core consistency of 88.11 and the explained percentage was 99.55 %. The model was then uploaded to OpenFluor (Murphy et al., 2014) and used to find similar fluorophores in published datasets.
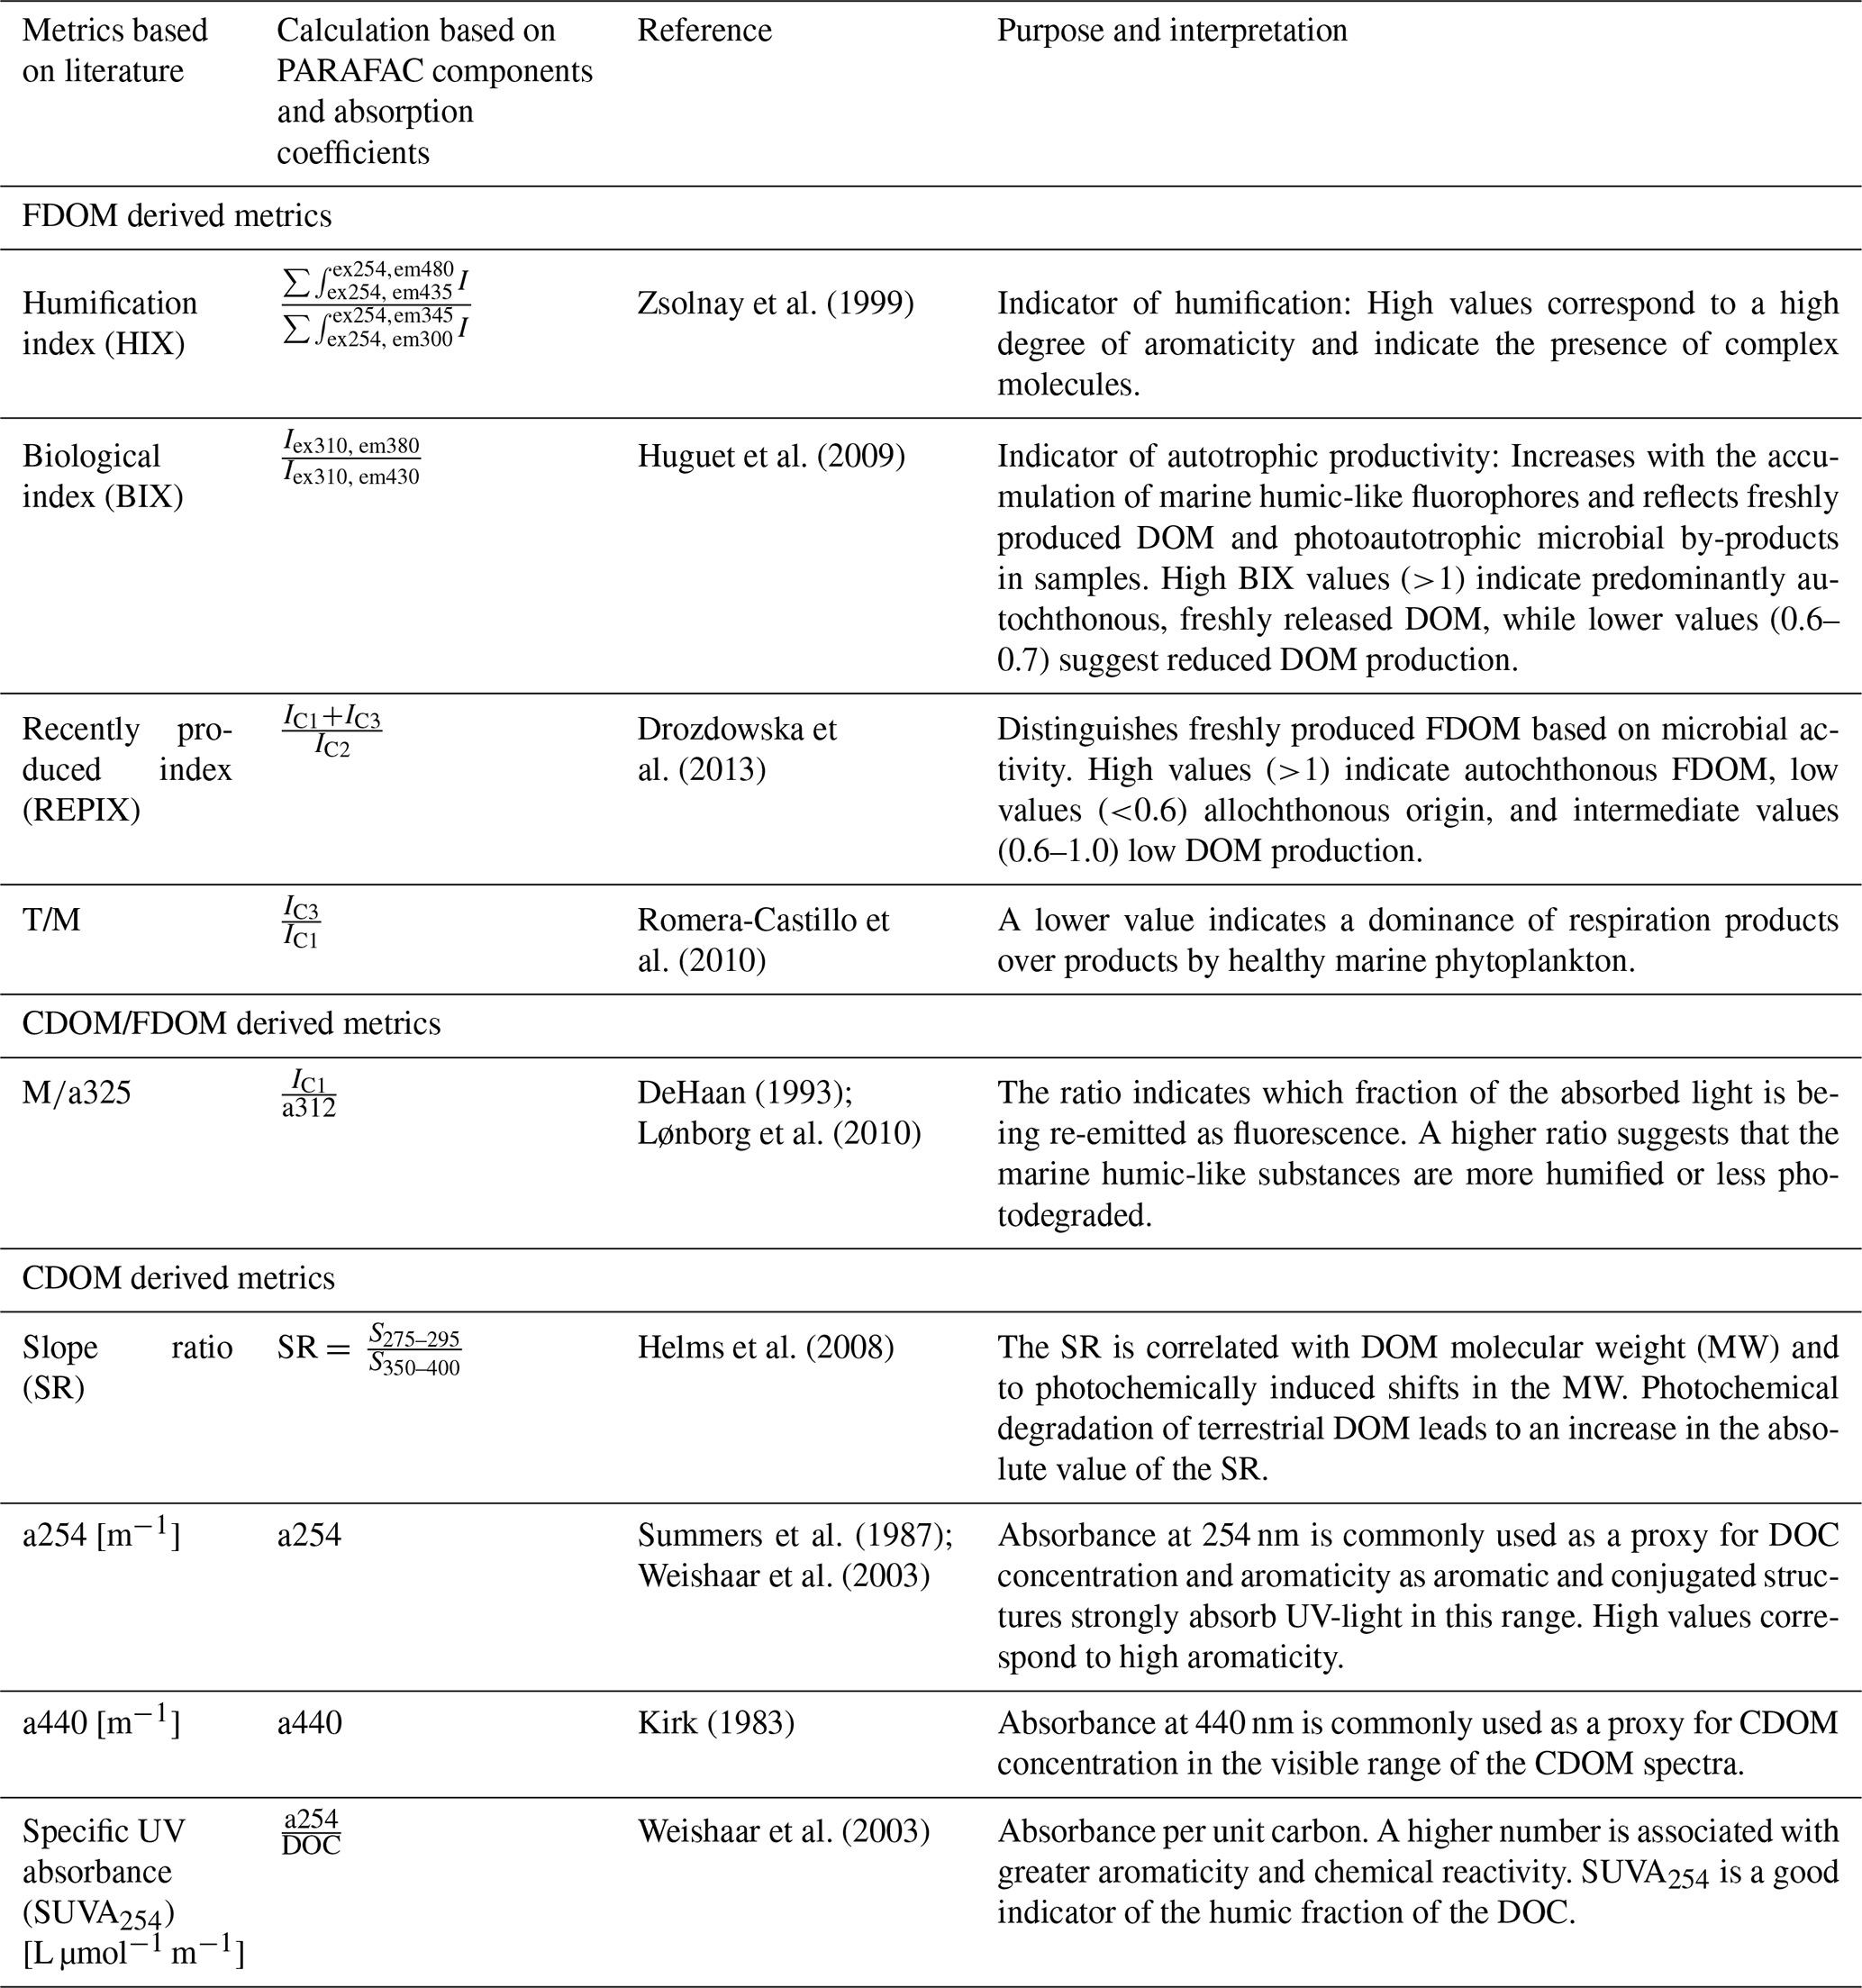
Established indices like the humification index (HIX, Zsolnay et al., 1999) and the biological index (BIX, Huguet et al., 2009) require the total fluorescence intensity of a set pair of excitation and emission wavelengths. Therefore, the corrected EEMs were prepared (blank subtraction, inner-filter effect, Rayleigh-masking, Raman-normalization), just like for the PARAFAC analysis but were then used to calculate the respective metrics in a custom MATLAB routine. A variety of metrics like indices and ratios can be derived from FDOM fluorescence intensity serving as proxies for DOM molecular weight, source, and state (Álvarez-Salgado et al., 2023; Hansen et al., 2016; Huguet et al., 2009; Zsolnay et al., 1999). From the established metrics, those that have previously been applied to coastal waters and are applicable to aid in answering the proposed hypotheses are used in this study (for an overview please refer to Table 1). Metrics calculated from specific FDOM components were obtained using their PARAFAC derived equivalents. Coble (1996) described fluorescence at an excitation of 312 nm and an emission of 380–420 nm as peak M, representing marine humic-like fluorescence. Based on this study's PARAFAC results (Fig. 4, Table 2) the equivalent to this component peaked at an excitation of 312 nm and an emission of 405 nm. The fluorescence intensity value at this peak (C1) was used for the calculation of literature-based metrics using peak M.
Table 1CDOM/FDOM derived metrics used for this study. If specific literature based FDOM components are used for the original calculation they are translated into the PARAFAC derived components of this study. Iλex,λem is the fluorescence intensity at the given wavelengths. IC1, IC2 and IC3 refer to the intensity of the obtained PARAFAC components in this study. The components (C1–C4) are further described in Table 2.
2.3 Statistics
To assess whether the phytoplankton bloom phase and other environmental variables had significant influences on the FDOM component composition in the SML and the ULW, a two-way PERMANOVA (PERmutational Multivariate ANalysis of Variance) was performed in RStudio (Version 1.4.1103) using Bray-Curtis dissimilarities with 9999 permutations (Anderson, 2001; Bray and Curtis, 1957) (Tables 3, 4). Multivariate patterns were visualized by non-metric multidimensional scaling (nMDS) based on the same distance matrix (Clarke, 1993) (Fig. 5).
To compare selected metrics between the SML and ULW, differences in the layer means were assessed using paired t-tests or Wilcoxon signed-rank tests depending on normality (Lilliefors, 1967). Temporal trends were quantified by linear regression, and differences in slopes were assessed using linear mixed-effects models with day as a random effect (Pinheiro and Bates, 2000). Variability between layers was compared using the Brown-Forsythe approach (Brown and Forsythe, 1974). Bootstrap resampling (n=1000) was used to estimate 95 % confidence intervals for differences in R2 (Efron, 1979). Additionally, the average enrichment factor (Ø EF, Eq. 1), was calculated to indicate whether a metric was generally enriched in the SML (Ø EF > 1) or in the ULW (Ø EF < 1) (Table 5).
where ISMLand IULW are the intensities of a given metric in the SML and the ULW, respectively.
3.1 Environmental variables during the mesocosm study: chlorophyll-a, non-algal particles, temperature, salinity, bacterial abundance, surfactant concentration, and incident light
Since OM transformation processes are influenced by environmental conditions, selected descriptive variables from the mesocosm study are presented here alongside the CDOM/FDOM results. Based on chlorophyll-a dynamics and nutrient availability, three bloom phases were distinguished: an onset phase from the beginning of the study until 27 May, a peak phase from 27 May to 5 June, and a decay phase from 5 June to the end of the study on 15 June (Bibi et al., 2025a). The phytoplankton biomass in the mesocosm is strongly coupled with the nutrient availability. Three times during the onset phase (26 May, 30 May and 1 June) nutrients were added to the basin (Bibi et al., 2025a). NO was elevated during the onset phase (up to ∼ 12 µmol L−1), followed by a rapid and near-complete decline at the beginning of the bloom, pronounced Si(OH)4 peaks after the two silicate additions (up to ∼ 17 µmol L−1), and persistently low NO and PO concentrations during the bloom and decay phases despite repeated nutrient adjustments, with consistently higher N:P ratios in the ULW compared to the SML.
In the ULW, chlorophyll-a concentrations were elevated during the first two days of the mesocosm study, initially exceeding 5 µg L−1 before dropping to about 1.2 µg L−1 (Fig. 2a). After 22 May, the concentration gradually increased until the nutrient addition on 26 May, which triggered the first bloom peak on 28 May. After further nutrient additions on 30 May and 1 June, chlorophyll-a reached a second peak on 3 June (11.4 µg L−1), after which it declined to 1–2 µg L−1 within a week.
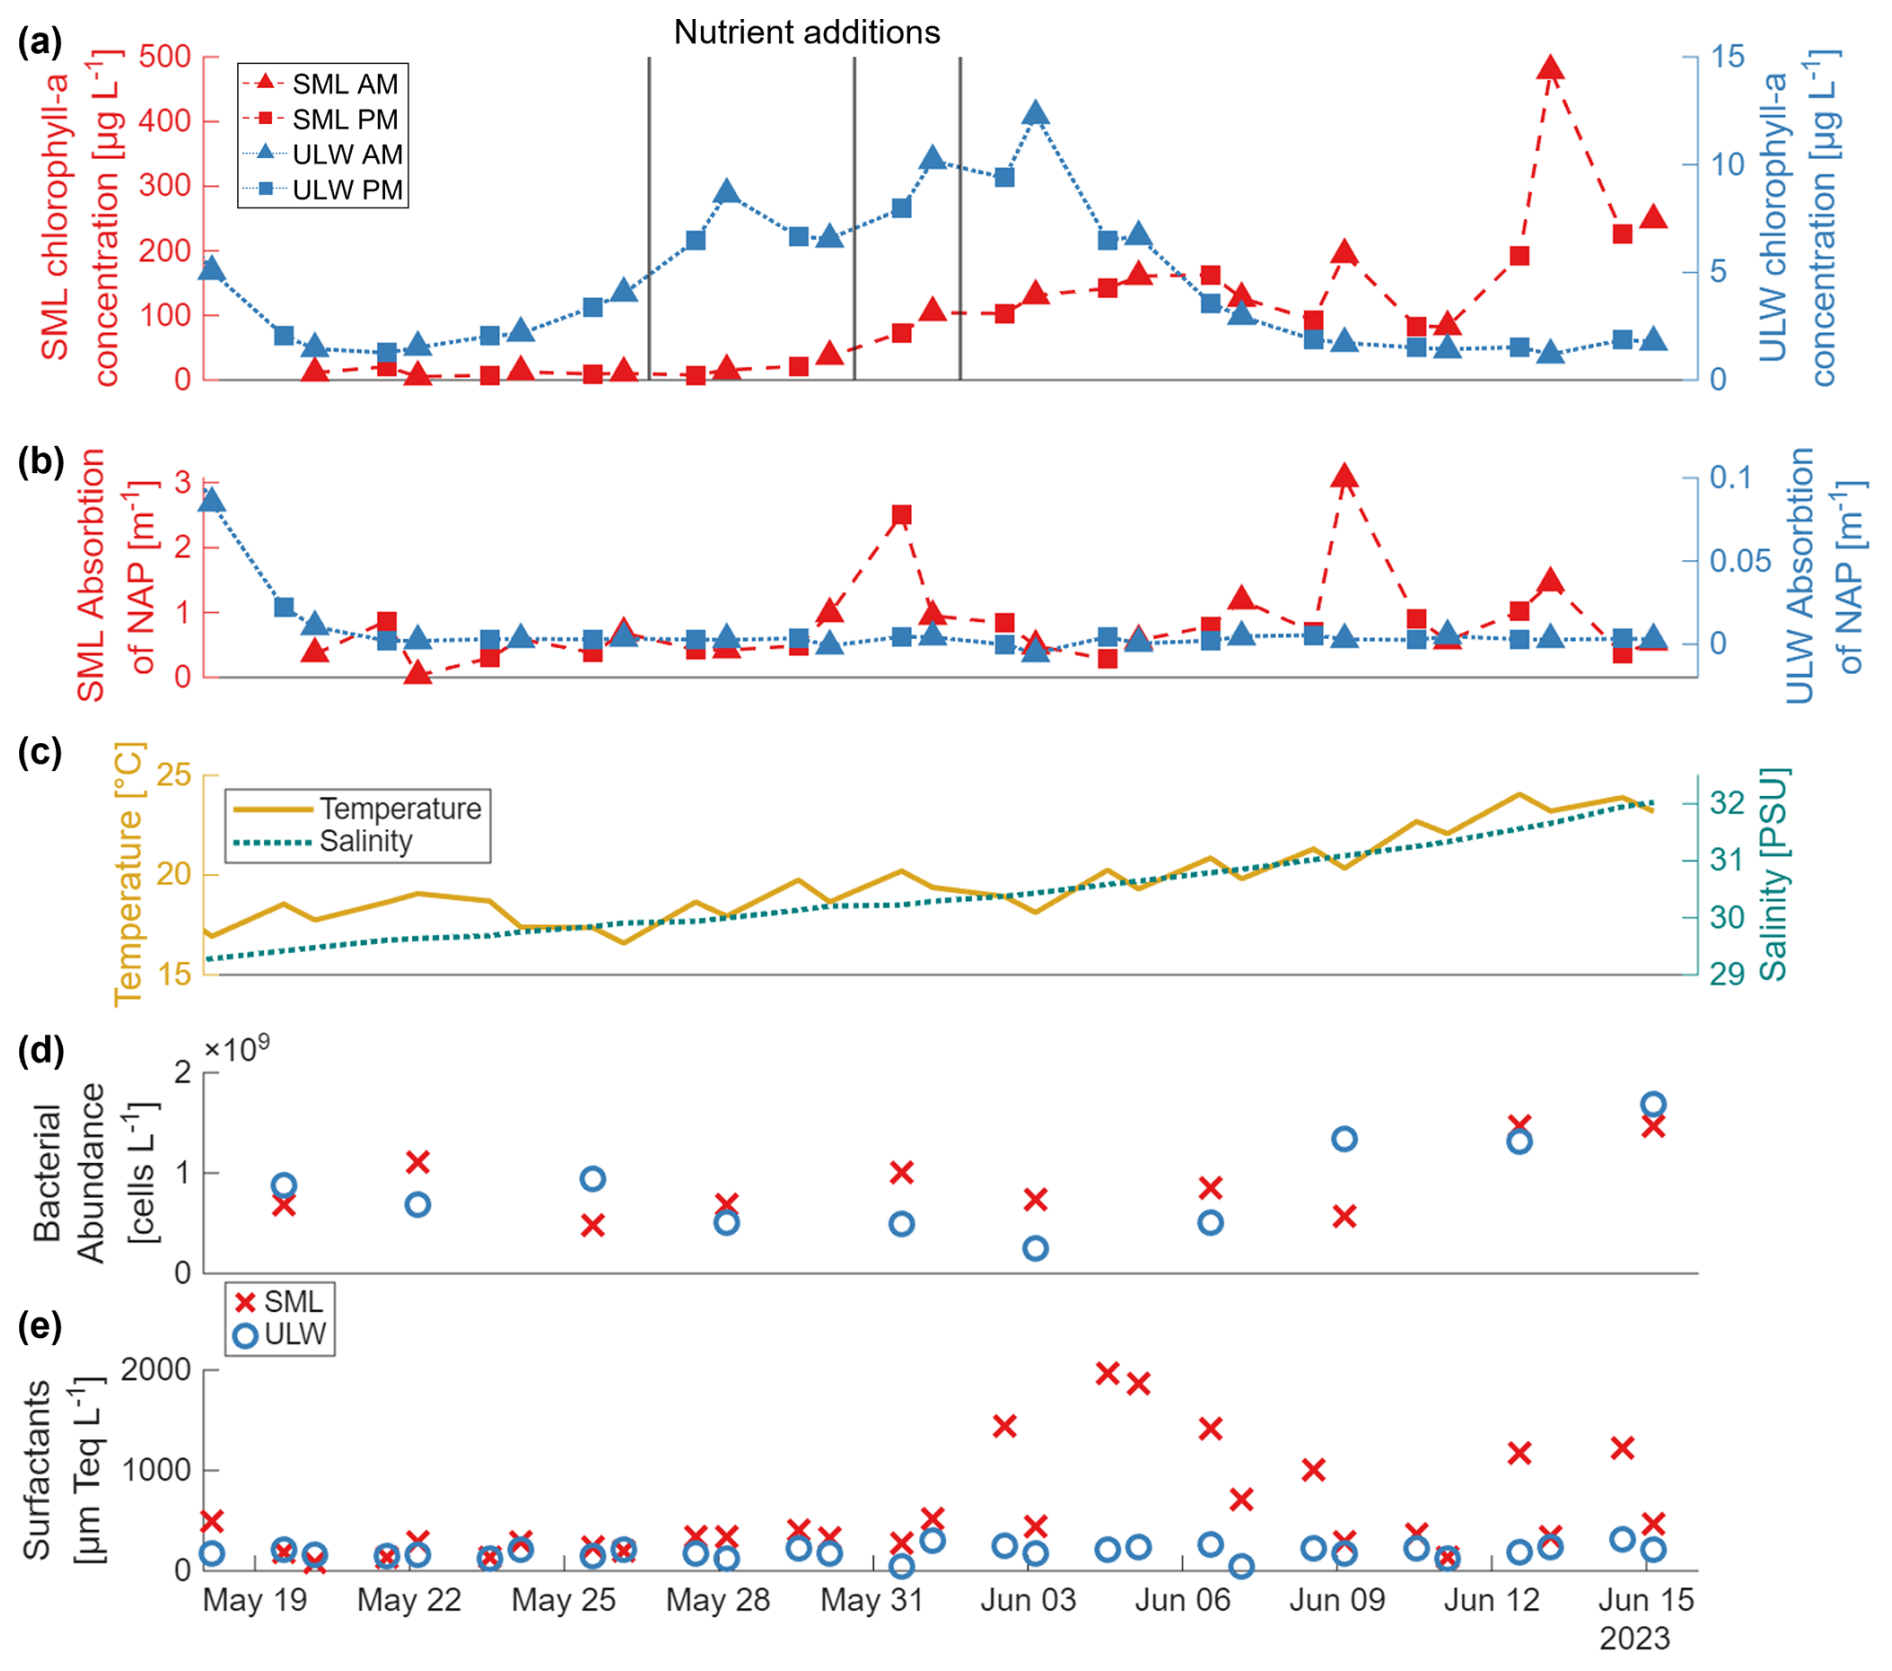
Figure 2(a) Concentration of chlorophyll-a in µg L−1 and (b) absorption of non-algal particles (NAP) in m−1 measured via the absorption line height at 670 nm, and the absorption at 750 nm, respectively, on a filter pad (QFT-ICAM, Röttgers et al., 2016) for the sea-surface microlayer (SML, red, left y-axis) and the underlying water (ULW, blue, right y-axis). Triangles are the morning samples; squares represent the afternoon samples. Nutrient additions are marked as black vertical lines on 26 May, 30 May and 1 June. (c) Temperature in °C (yellow, solid line, left y-axis) and salinity in PSU (green, dashed line, right y-axis) measured by a CTD (Sea & Sun Technology, Germany) in the mesocosm basin in about 0.4 m depth. (d) Bacterial abundance in cells L−1 for the SML (red) and the ULW (blue). (e) Surfactant concentrations in µm Teq (Triton-X equivalent) L−1 (left y-axis) for the SML (red) and the ULW (blue). Temperature, salinity, bacterial abundance and surfactant data are adapted from Bibi et al. (2025a).
In contrast, chlorophyll-a concentrations in the SML were consistently and significantly higher and more variable than in the ULW (Ø EF = 47.95, Table A1). The first measurement on 20 May already showed concentrations around 10 µg L−1, while ULW concentrations had dropped to ∼ 1 µg L−1. SML chlorophyll-a concentrations continued to rise with a delayed increase relative to the ULW, exceeding 100 µg L−1 by 31 May. Towards the end of the study, chlorophyll-a concentrations in the SML reached ∼ 250 µg L−1, with a pronounced peak of ∼ 500 µg L−1 on 13 June. According to Bibi et al. (2025a), the first chlorophyll-a peak was dominated by the coccolithophore Gephyrocapsa huxleyi (Emiliania huxleyi), one of the most abundant and globally occurring coccolithophore species (Balch, 2018), while the second peak was caused by Cylindrotheca closterium, a widely distributed diatom typically found in nutrient-rich coastal waters.
Absorption by NAP was consistently and significantly higher in the SML than in the ULW (Ø EF = 40.18, Table A1) , with particularly elevated values during the bloom and decay phases (Fig. 2b). Chlorophyll-a and NAP were significantly correlated in the SML but not in the ULW (Fig. A2).
Temperature and salinity values at 0.4 m depth in the mesocosm basin both generally increased during the study. While the temperature showed diurnal changes, it rose from about 17 °C on 18 May to about 24 °C on 16 June, as summer was progressing in Germany. The salinity increased almost linearly from about 29.3 to 32.2 PSU in the same period (Fig. 2c), due to evaporation.
Bacterial abundances ranged between ∼ 2.5 × 10⁸ and 1.7 × 10⁹ cells L−1 in the ULW and between ∼ 4.8 × 10⁸ and 1.5 × 10⁹ cells L−1 in the SML (Fig. 2d). Overall, no significant difference in free-living bacterial cell numbers between the two layers was observed (Table A1). However, temporal variations followed the phytoplankton bloom development, with lower cell numbers around the bloom peak and higher abundances in the post-bloom phase. A detailed description of bacterial dynamics during the study is provided in Bibi et al. (2025a).
Data for the surfactant concentration was provided by Bibi et al. (2025a, b). In Fig. 2e, a clear distinction between SML and ULW is visible, as the SML is almost always significantly enriched in surfactants (Ø EF = 3.35, Table A1). The development of surfactants in the SML follows the bloom with some delay, while the concentration in the ULW stays relatively stable.
Morning samples, which were taken about 1 h after sunrise, were always less irradiated than the afternoon samples, which were taken about 10 h after sunrise (Fig. 3). The maximum integrated light exposure for the morning samples was approx. 4 × 10⁴ W m−2, while maximum incident light of the afternoon samples was approx. 6 × 10⁷ W m−2. During the first days of the study, 18 May to 25 May, there was more variance in the incident light due to cloud coverage and rain events. During rain events the roof of SURF was closed which blocked the UVA partition of the total incident light. From 5 June, the incident light during the day was quite similar at high levels of 6 × 10⁷ W m−2 every day until the end of the study.
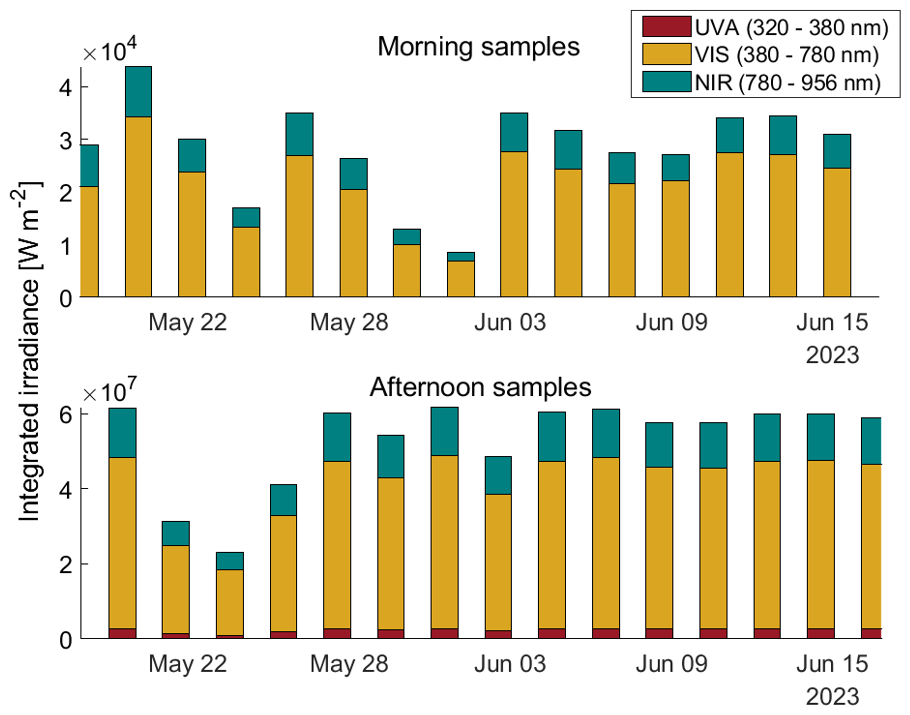
Figure 3Integrated irradiance in W m−2 measured with a TriOS Ramses irradiance radiometer from midnight of each sampling day until the sampling time. The total measured irradiance range (319–956 nm) is split into its fractions of ultraviolet-A (UVA, 320 to 380 nm, red) visual (VIS, 380 to 780 nm, yellow) and near-infrared (NIR, 780 to 956 nm, teal). Upper panel: integrated irradiance during morning samples (∼ 1 h after sunrise); lower panel: afternoon samples (∼ 10 h after sunrise).
3.2 FDOM PARAFAC results
The validated PARAFAC model identified four FDOM components within the mesocosm samples, hereafter named as C1, C2, C3 and C4 (Table 2, Fig. 4). C1 (Excitation (Ex) < 240/312 nm, Emission (Em) 410 nm) corresponds to the marine humic-like peak M from Coble (1996, 2007). The OpenFluor comparison connected C1 to humic-like matter but was inconclusive whether its source was biological/microbial activity (Chen et al., 2018; Yan et al., 2020) or terrestrial input (Cawley et al., 2012; Osburn and Stedmon, 2011). Component C2 (Ex 264/368 nm, Em 469 nm) had two excitation peaks which are assignable to Coble's humic-like peaks A and C. They both correspond to allochthonous terrestrial DOM (Chen et al., 2018; Kim et al., 2022; Shutova et al., 2014). Baker et al. (2007) bring peak C into connection with fulvic acid while peak A can be more connected with humic acid. C3 (Ex < 240/292 nm, Em 341 nm) and C4 (Ex < 240/276 nm, Em 306 nm) are both protein-like components (peak T and peak B, respectively, Coble, 1996, 2007) corresponding to microbial activity. C3 has been described as tryptophan-like (Calderó-Pascual et al., 2022; Eder et al., 2022; Retelletti Brogi et al., 2018), and C4 as tyrosine-like (Catalá et al., 2015; Gonçalves-Araujo et al., 2015; Marcé et al., 2021).
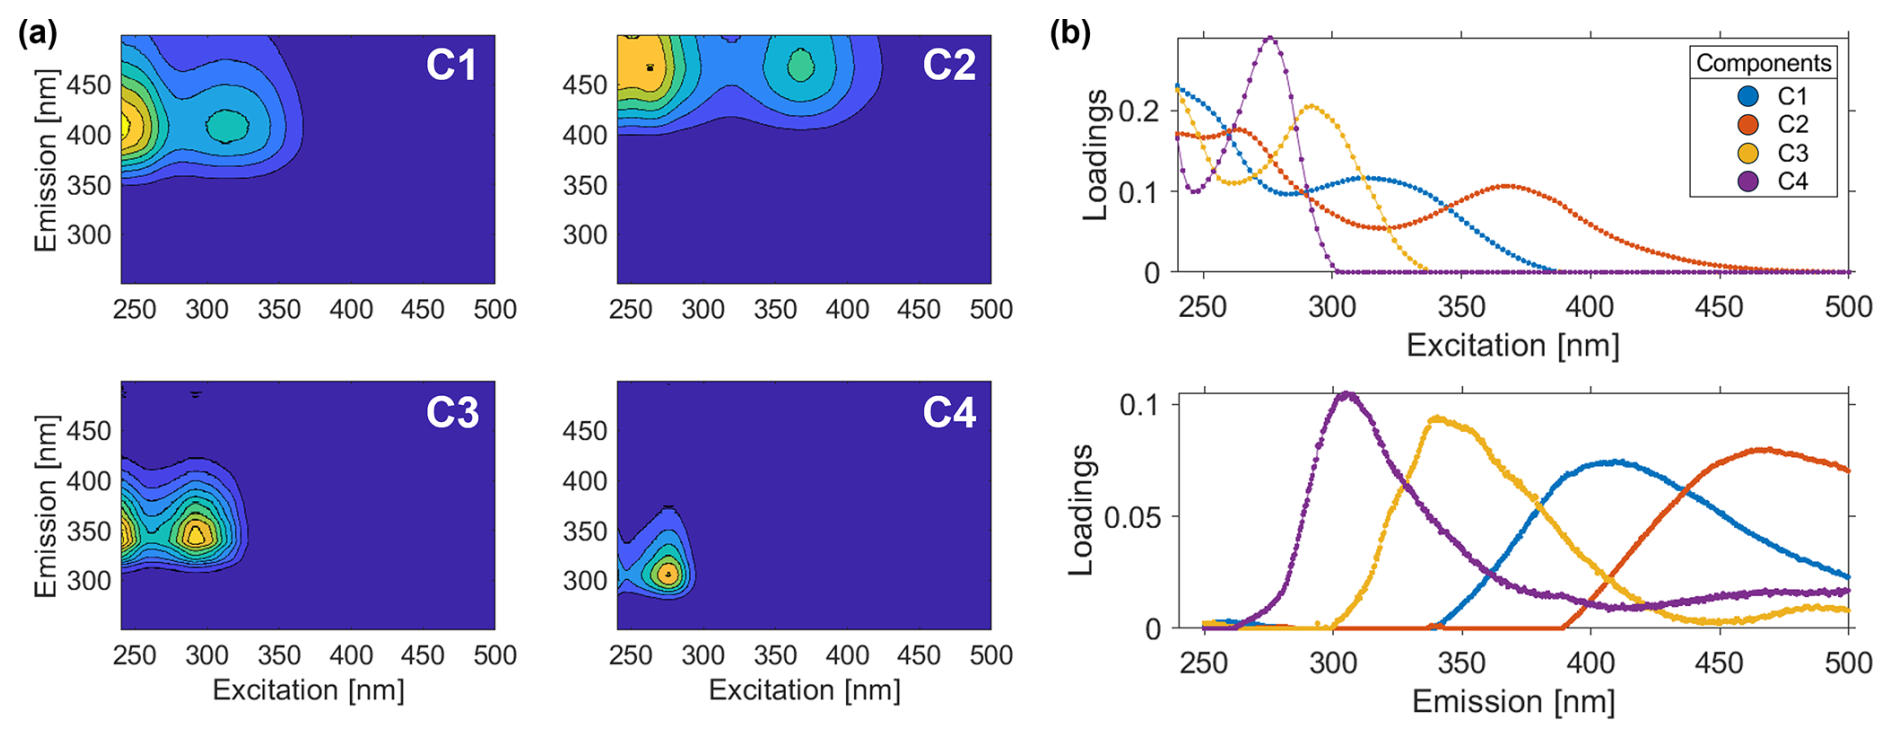
Figure 4(a) Excitation-emission-matrices (EEMs) for the fingerprints of the four validated PARAFAC components (C1–C4). (b) Spectral loadings of PARAFAC components, C1 (blue), C2 (red), C3 (yellow) and C4 (purple). Find further details about the PARAFAC components in Table 2.
3.3 Multivariate analysis of FDOM component composition
To statistically analyze the influence of different environmental variables on the FDOM component composition a PERMANOVA and a follow-up nMDS analysis were performed on the compositional data and its distance matrix. The PERMANOVA results were obtained from two separate runs (Layer × Phase run and Environmental variables run). For the Layer × Phase run, it was tested which influence the layer (SML or ULW) and the bloom phase (onset, peak, decay) had on the FDOM component composition (Table 3). In the Environmental variables run a set of environmental variables was tested for their influence on the composition (Table 4).
The results of the Layer × Phase run stated a moderate, but highly significant influence of the bloom phase (R2 = 0.46, p<0.001) on the FDOM component composition (Table 3). The layer had a statistically significant but small influence (R2 = 0.10, p<0.001) on the composition. The interaction of these two factors, phase and layer, did not have a significant influence (p=0.8192). 43 % of the variation remained unexplained with these two factors (Table 3).
The nMDS plot of the bloom phase and layer for the PARAFAC components showed a separation of the bloom phases with a small stress value of 0.104 (Fig. 5). The layers were not clearly separated in the nMDS plot for the onset and peak phase, yet the SML values appeared to be mostly higher in the y-axis. The decay phase showed some separation and clustering of the layer variable.
When the PERMANOVA model was refined by using defined environmental variables it was first tested whether the available environmental variables were correlated with each other and therefore redundant in the PERMANOVA. Based on a correlation matrix and coefficients of determination (R2) values > 0.80 (data not shown), temperature, salinity, phase, layer and sampling time (AM or PM) were excluded. The PERMANOVA Environmental variables run contained the date, UVA-light, surfactants, chlorophyll-a and NAP (Table 4). It was tested whether to include the bacterial abundance into the PERMANOVA, but because of the low number of samples, many days had to be excluded from the analysis not reflecting the study completely.
In the Environmental variables run, the progressing time (Date) explained 49 % of the variation (p<0.001, Table 4). Influences of NAP and the surfactants (correlating strongly with the layer) were highly significant and significant but with small R2 (R2=0.04, p = 0.0008; R2 = 0.03, p = 0.0021, respectively, Table 4). The influence of both chlorophyll-a and the UVA-light on the FDOM component composition was not significant (p = 0.1386 and p = 0.1072, respectively). From the variable interactions the most notable is the interaction between the surfactants, chlorophyll-a and the NAP which had a high significance (p = 0.0009) but a small R2 of 0.038 (Table 4).
Table 2Validated PARAFAC components (C1–C4) with their excitation and emission wavelength maxima (Exmax, Emmax), their assignment to fluorophores classified in literature, the nomenclature created by Coble in 1996 and 2007, their sources and OpenFluor references based on the PARAFAC output.
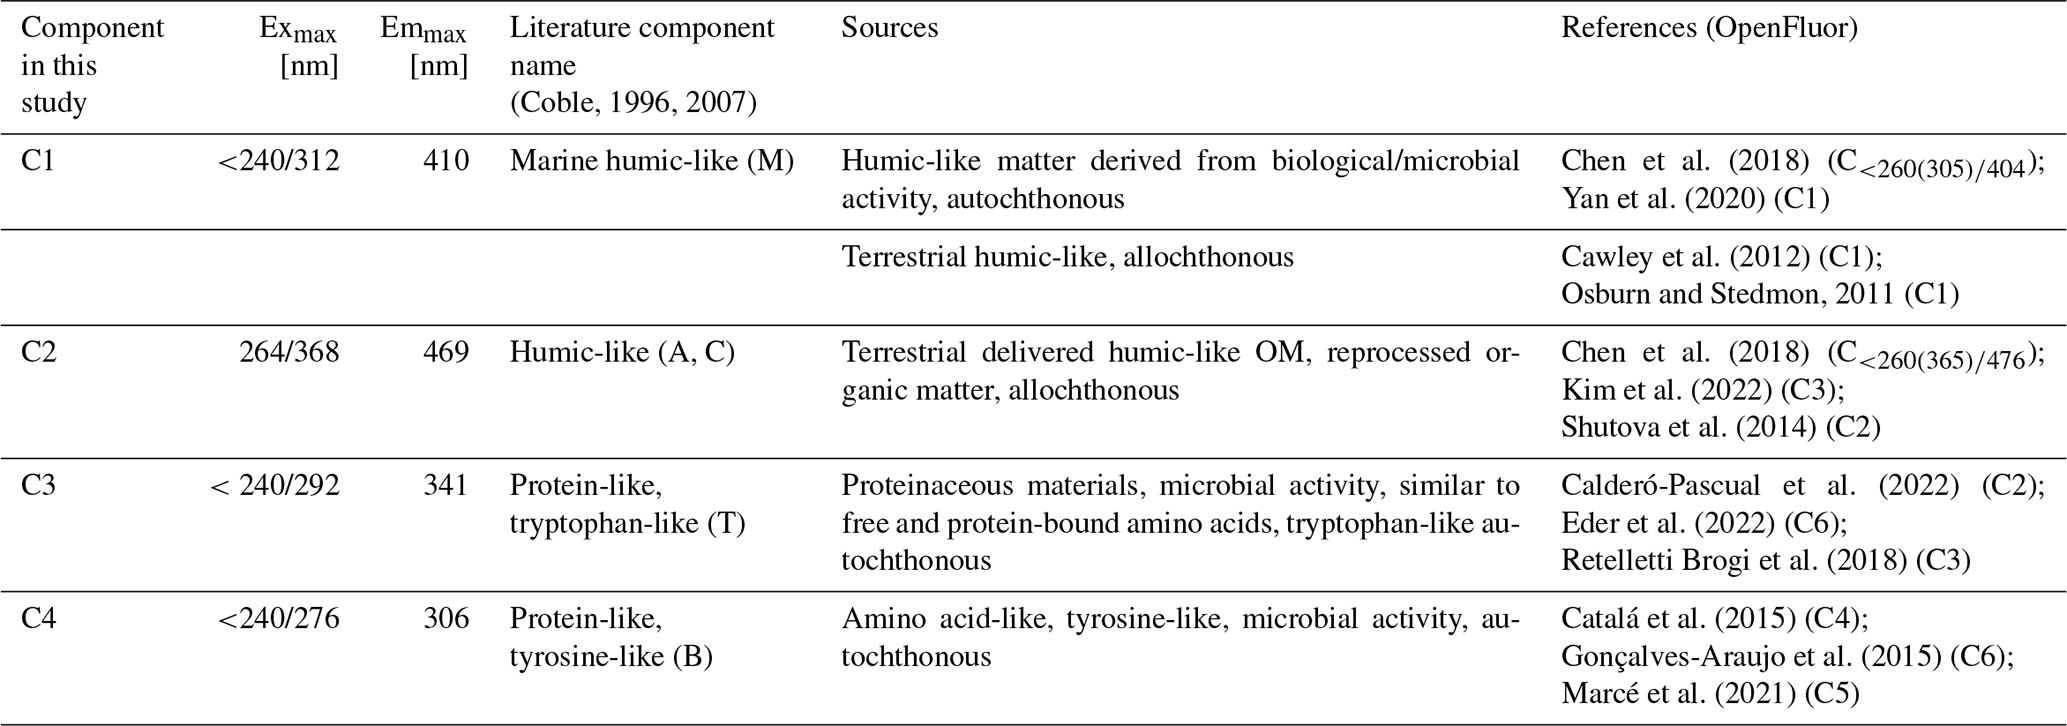
Table 3PERMANOVA results of the Layer × Phase run: coefficient of determination (R2), pseudo-F statistic (F), and p-value. Large F-values mean that the variation between groups is large relative to the variation within groups. Significance codes: highly significant/p<0.001: “***”, significant/p<0.01: “**”, moderately significant/p<0.05: “*”, slightly significant/p<0.1: “.”, not significant/p<1: “ns”.
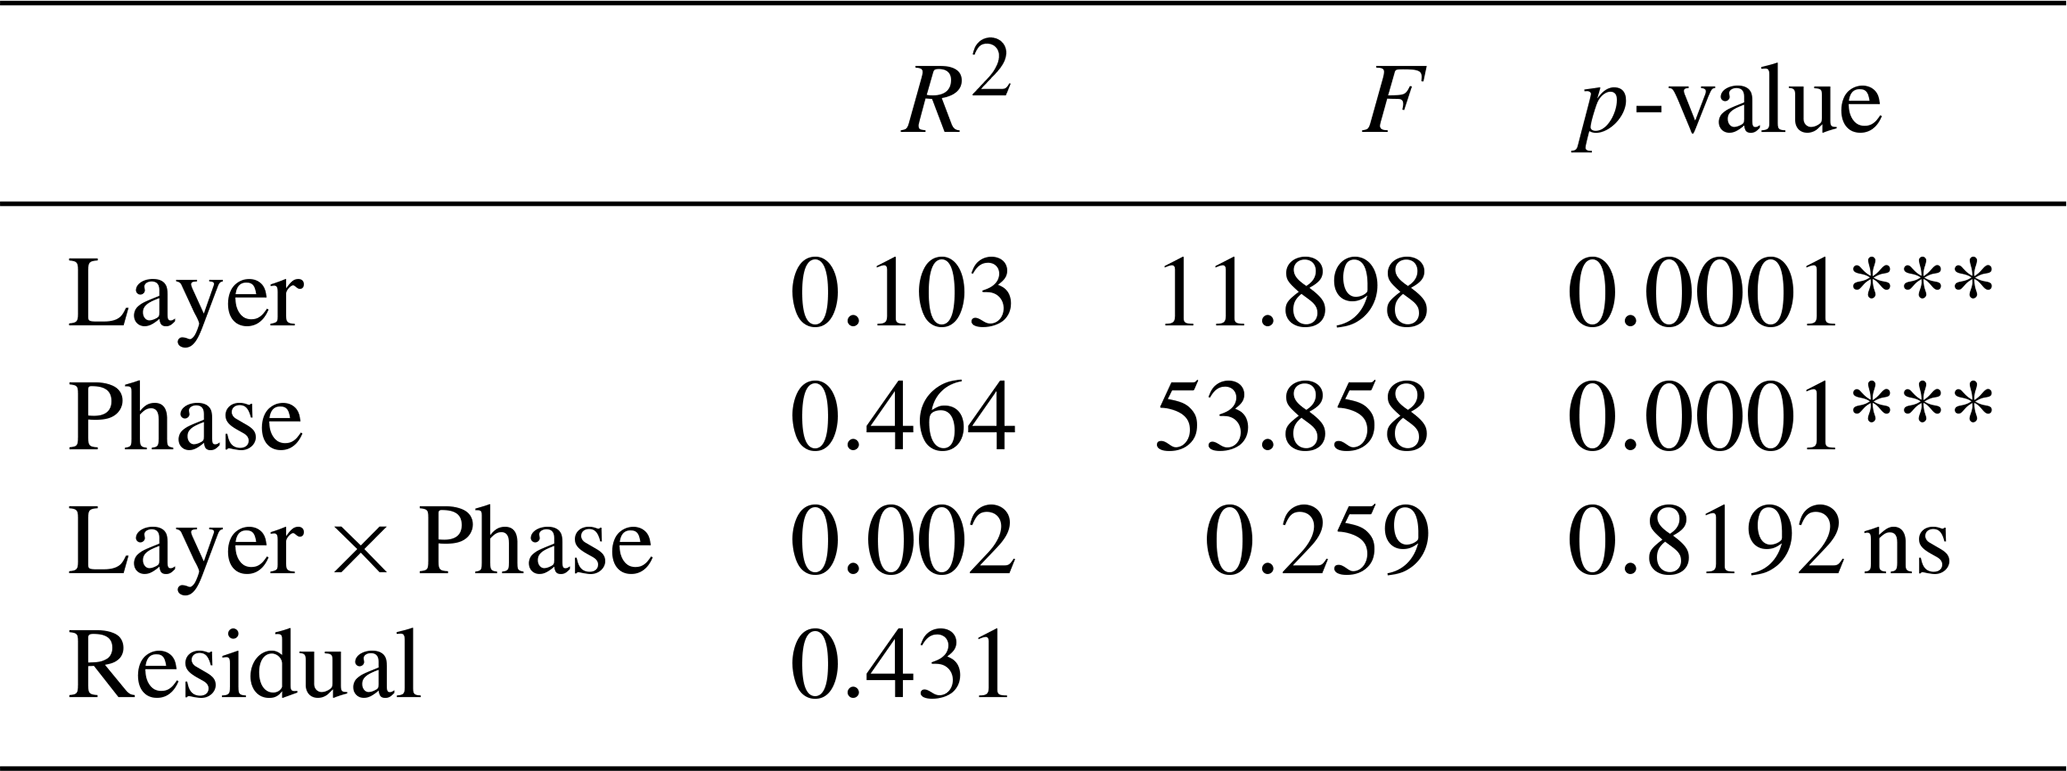
Table 4PERMANOVA results of the Environmental variables run (Date, UVA-light (UVA), surfactants, chlorophyll-a (Chla), non-algal particles (NAP)): coefficient of determination (R2), pseudo-F statistic (F), and p-value. Large F-values mean that the variation between groups is large relative to the variation within groups. Significance codes: highly significant/p<0.001: “***”, significant/p<0.01: “**”, moderately significant/p<0.05: “*”, slightly significant/p<0.1: “.”, not significant/p<1: “ns”. Only the results for the environmental variables themselves and the significant interactions are shown.
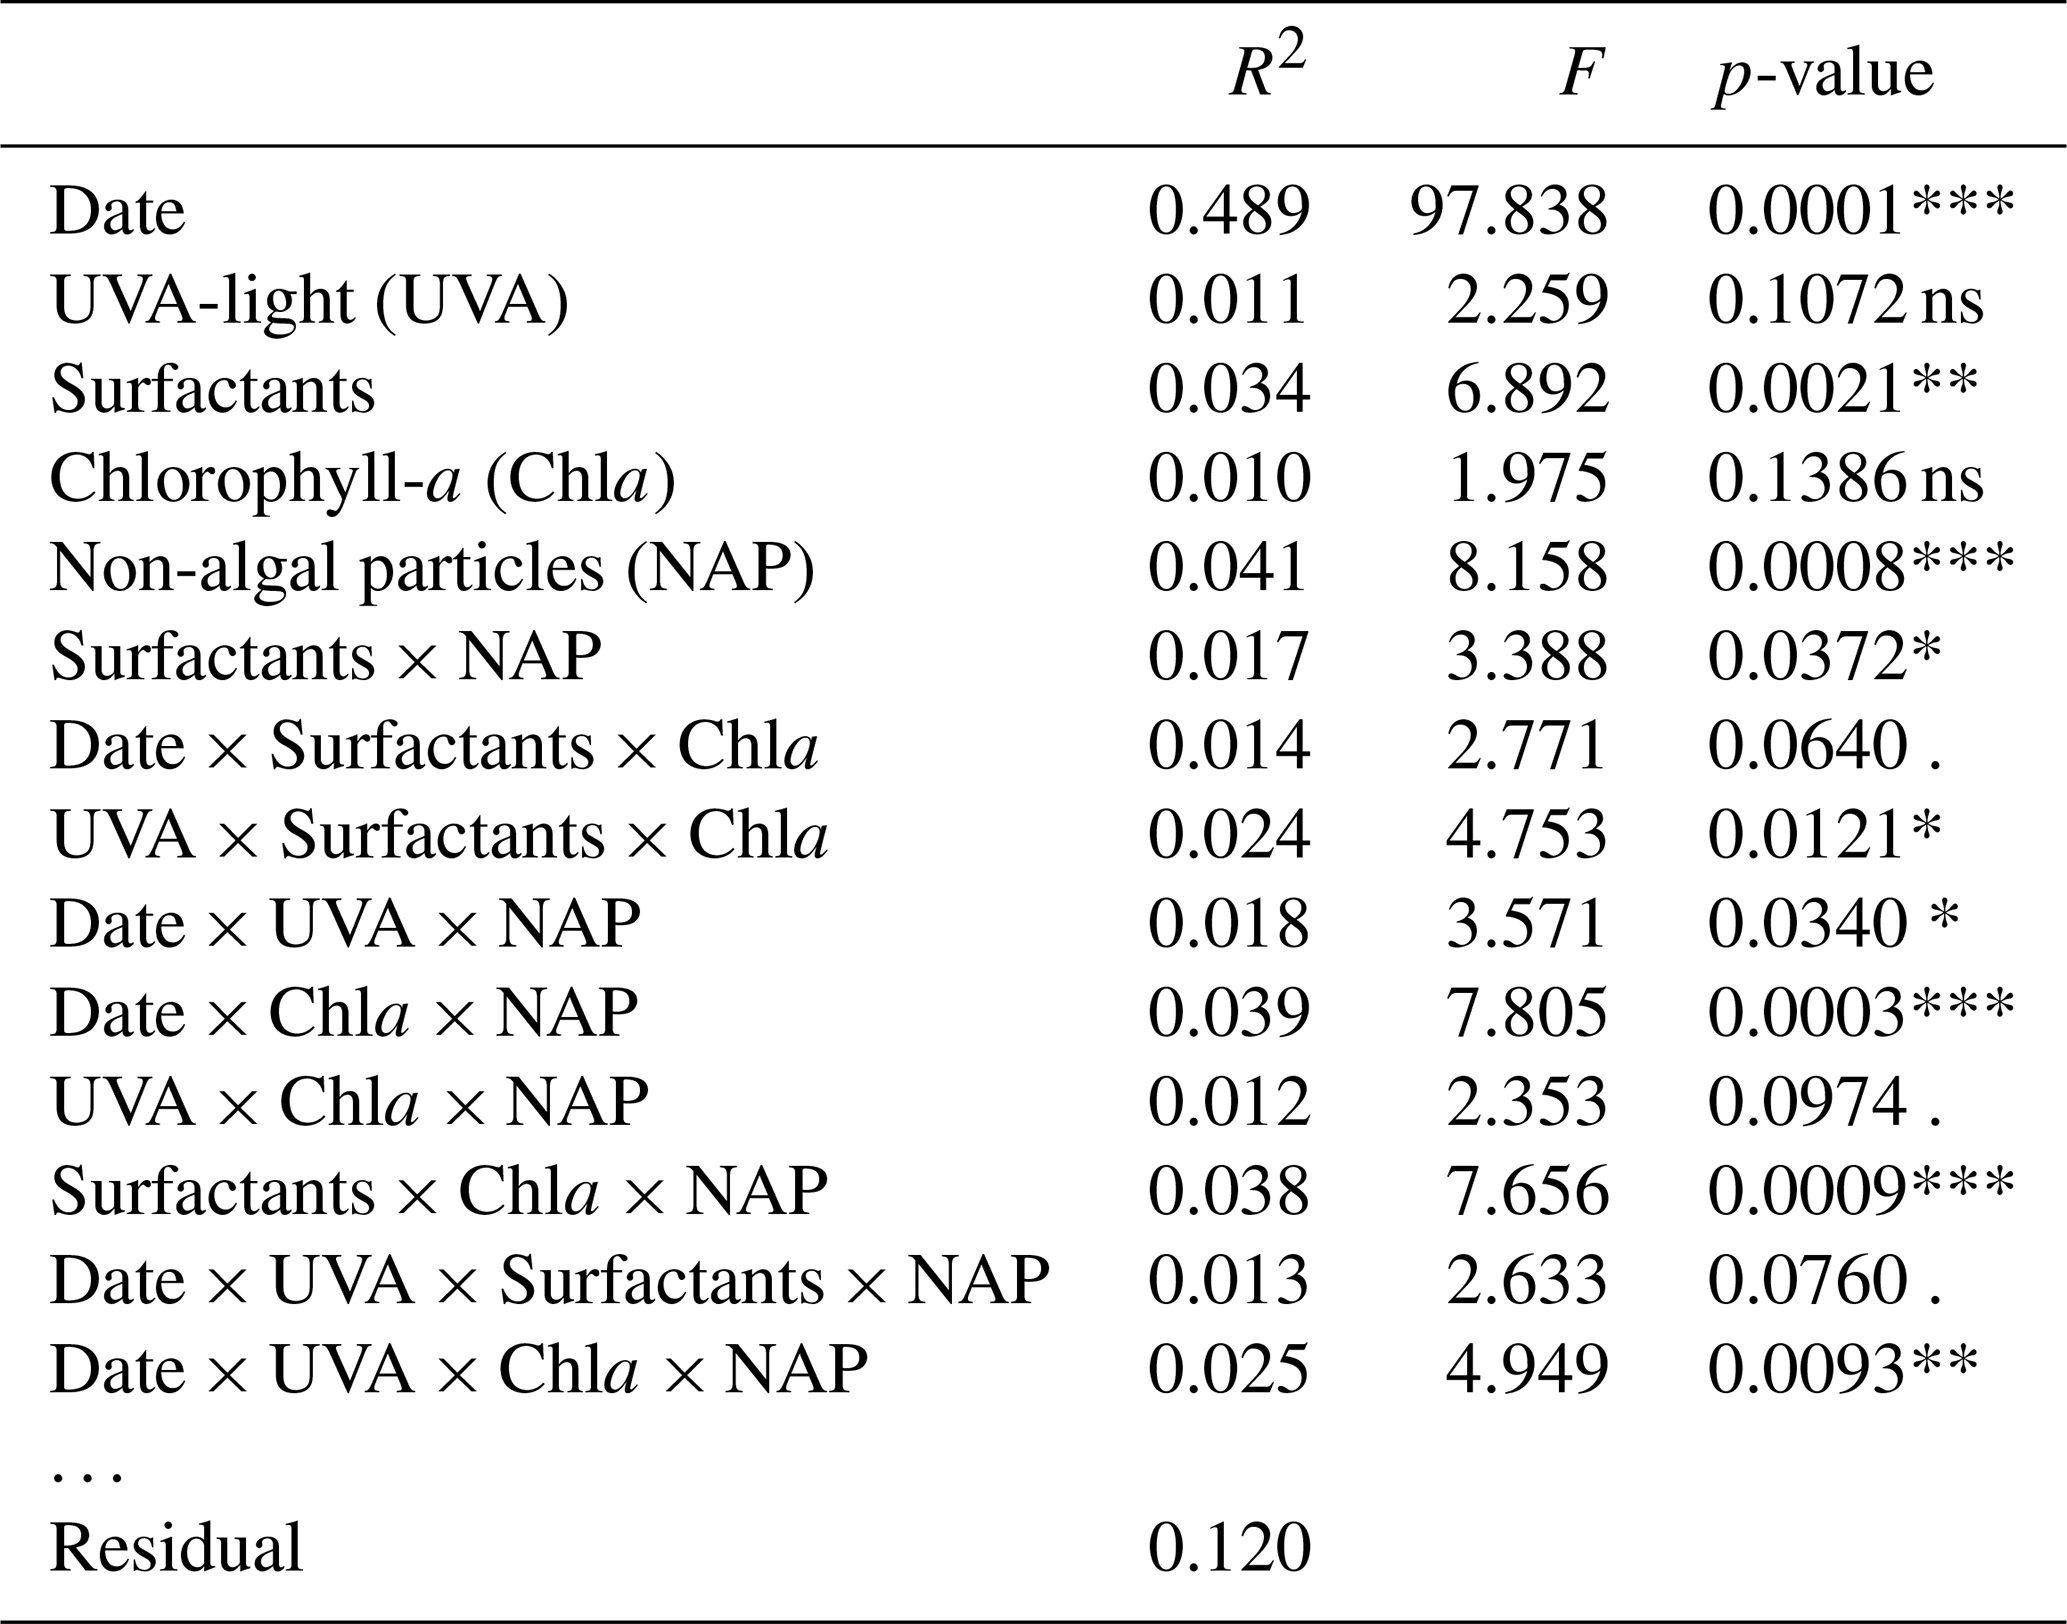
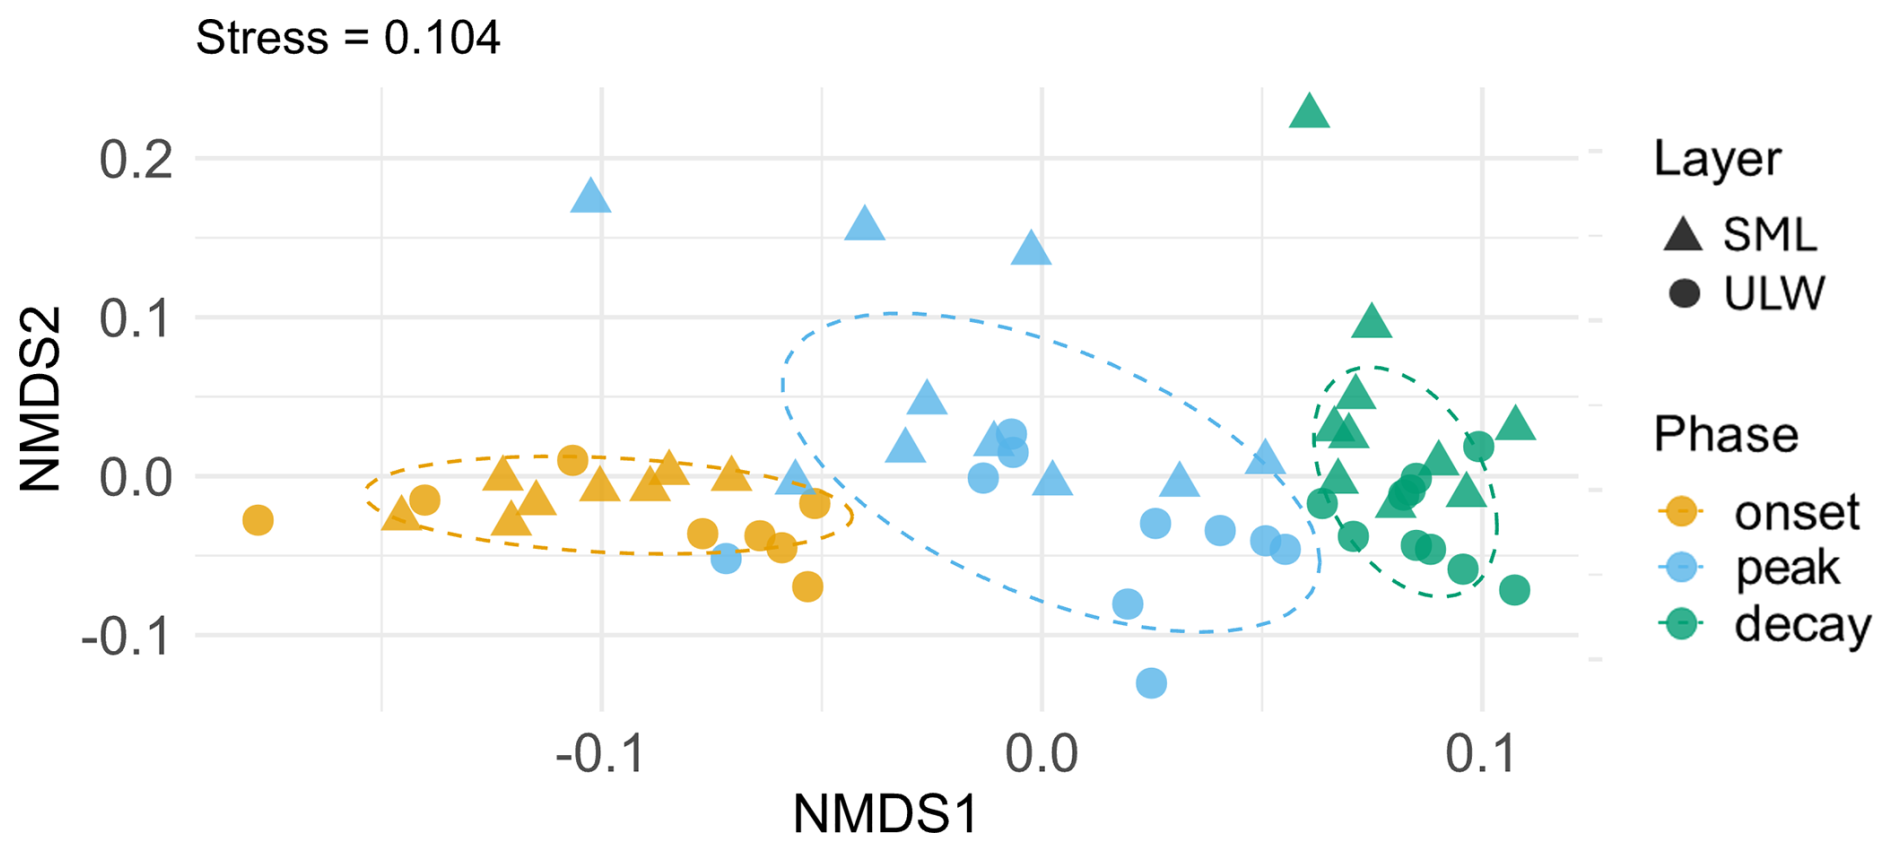
Figure 5nMDS plot of the FDOM component composition depending on the layer (sea-surface microlayer (SML) and underlying water (ULW)) and bloom phase (onset, peak, decay). The SML is marked with triangles and the ULW is marked with circles. The phase of the phytoplankton bloom is indicated by different colors (orange: onset, light blue: peak, green: decay). The elliptic dotted line circle 75 % of points of each phase based on a multivariate normal distribution. The stress value (0.104) is displayed in the header and points to a good representation of the sample distance in the reduced ordination.
3.4 CDOM and FDOM time series results
While the PERMANOVA analyses focused on examining differences between the three bloom phases, this section analyses temporal changes in CDOM and FDOM and the additional information from CDOM/FDOM derived metrics. The general trend of all CDOM/FDOM derived metrics either increased or decreased linearly during the study with some variations along the first bloom peak and with dependence on the sampling time (Fig. 6, Table 5). SML and ULW slopes and R2 were derived from linear correlations over the whole timeseries. Ø EF indicates the mean enrichment factor of the SML relative to the ULW over the whole study duration. “Layer Diff”, “Slope Diff”, and “Variance Diff” in Table 5 refer to the significance of differences between the respective means of the two layers, temporal trends (slopes), and variability, respectively, with significance indicated by asterisks (*: p<0.05; **: p<0.01; ***: p<0.001).
Around the time of the first chlorophyll-a peak on 28 May a rise in the total fluorophores can be observed, driven by the rise of component C3 in these samples. The humic-like components (C1 and C2) declined, while the protein-like components (C3 and C4) increased (Fig. 6). Fluorescence intensity was generally higher in the SML than in the ULW for all components except C4. The difference between the layers was significantly different for all components (Table 5). Around the first chlorophyll-a peak from 28–30 May, elevated values were observed for C1 and C3. All components apparently responded to the alternating morning and afternoon sampling, showing a “zig-zag” pattern in their temporal dynamics. However, the “zig-zag” pattern did not always follow the same direction. On some days, like 19–23 May, the humic-like components had a higher intensity in the morning samples than in the previous afternoon samples in both the SML and ULW samples. On other days this pattern was reversed and differs between SML and ULW. C4 was the component with the largest relative differences in the general development during the mesocosm and in the daily changes (Fig. 6).
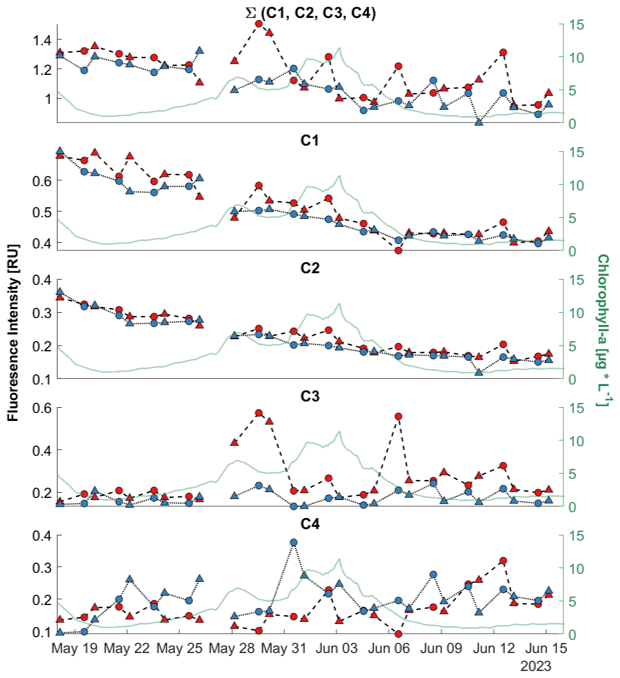
Figure 6Time series of fluorescent dissolved organic matter components (C1–C4) in Raman Units (RU) derived by PARAFAC analysis. The first panel shows the sum of all four components (∑(C1, C2, C3, C4) = C1 + C2 + C3 + C4). Sea-surface microlayer (SML) samples are marked red, with a dashed line and the underlying water (ULW) samples are marked blue with a dotted line. Morning samples (AM) are marked as triangles. Afternoon samples (PM) are marked with circles. On the right y-axis the chlorophyll-a values in µg L−1 are drawn to help for an orientation within the development of the bloom during the mesocosm study.
The first derivative indicates the slope of the change from one timestep to the next one. If the value is above 0 it indicates a rise of the metric towards that point in time, if it is lower than 0 it indicates a decrease. This emphasizes the differences between morning and afternoon sampling. The chlorophyll-a derivative is close to zero for the onset and decay phase with small fluctuations and exhibits high variability during the bloom phase. During most nights in the onset phase the chlorophyll-a values stagnate while after 11 June in the decay phase a rise in chlorophyll-a can be observed during the night.
The CDOM/FDOM derived metrics deliver information of the humification state (HIX, ), aromaticity (a254, SUVA254), photodegradation (HIX, SR, a254, ) and fresh production (REPIX, BIX, ). The time series of the FDOM derived HIX showed a negative trend throughout the study. With the alternation of morning and afternoon sampling an irregular “zig-zag” pattern was observed (Fig. 7b, c). The HIX values for SML and ULW samples of the morning and afternoon displayed different patterns throughout the study. In the onset phase, in the SML, the morning sample consistently had a higher HIX than the previous afternoon sample, while this pattern was reversed for the ULW in this period. During the bloom phase, no specific pattern was observed. In the decay phase the pattern was the opposite to the onset phase specifically in the ULW, while it changes a few times for the SML. The average EF for HIX is slightly lower than 1, indicating a higher humification in the ULW (Table 5). The HIX only had no significant differences between SML and ULW variability, slope or the layer mean values during the study.
The time series of the SR in SML and ULW increased during the study with almost constantly significantly higher values in the SML (Ø EF = 1.03, Fig. 7d, e, Table 5). Throughout the study the SR decreased only towards the morning samples in both layers but more often in the SML (Fig. 7). A significant difference in SML and ULW can be observed in the layer mean values of the absorption coefficient a254 and the linear fit of the decline during the study (Table 5). A higher but not significant variability in a254 is visible for the SML (R2 = 0.01) than for the ULW (R2=0.76). Only the a254 slope towards the SML morning samples is ever very low (<−1) indicating an overnight decrease in aromaticity in the SML (Fig. 7g). Higher values at the beginning of the study in the ratio (Fig. A1b) suggested that the marine humic-like substances are more humified or less photodegraded. For , the differences in the slope of the linear fit and the variability in the layers were significant (both: p<0.05, Table 5), the ratio declined in both layers but faster in the SML. BIX (Fig. A1a) and the ratio (Fig. A1c) were both significantly enriched in the SML throughout the study and had a similar time series development like the REPIX (Fig. A1e, Table 5). REPIX increased in both the SML and the ULW and was almost consistently enriched in the SML (Ø EF = 1.26). Particularly elevated REPIX values occurred around the first bloom peak (28–30 May) and, more briefly, for one day following the second bloom peak (6 June) in the SML. Variability in REPIX was significantly higher in the SML, and mean values differed significantly between layers. DOC increased steadily throughout the study and was enriched and more variable in the SML. Differences in DOC slope, layer and variance were all significant (Fig. A1d, Table 1, Table 5). SUVA254 was significantly higher in the ULW but had no significant slope or variance difference between layers (Fig. A1f, Table 5).
Table 5Sea-surface microlayer (SML) and underlying water (ULW) linear trends (slope, R2) and mean enrichment factor (Ø EF) for dissolved organic matter metrics described in Tables 1 and 2. Significance of differences between both layers as layer means, slopes, and variance are indicated in Layer Diff, Slope Diff, and Variance Diff (highly significant/p<0.001: “***”, significant/p<0.01: “**”, moderately significant/p<0.05: “*”, slightly significant/p<0.1: “.”, not significant/p<1: “ns”).
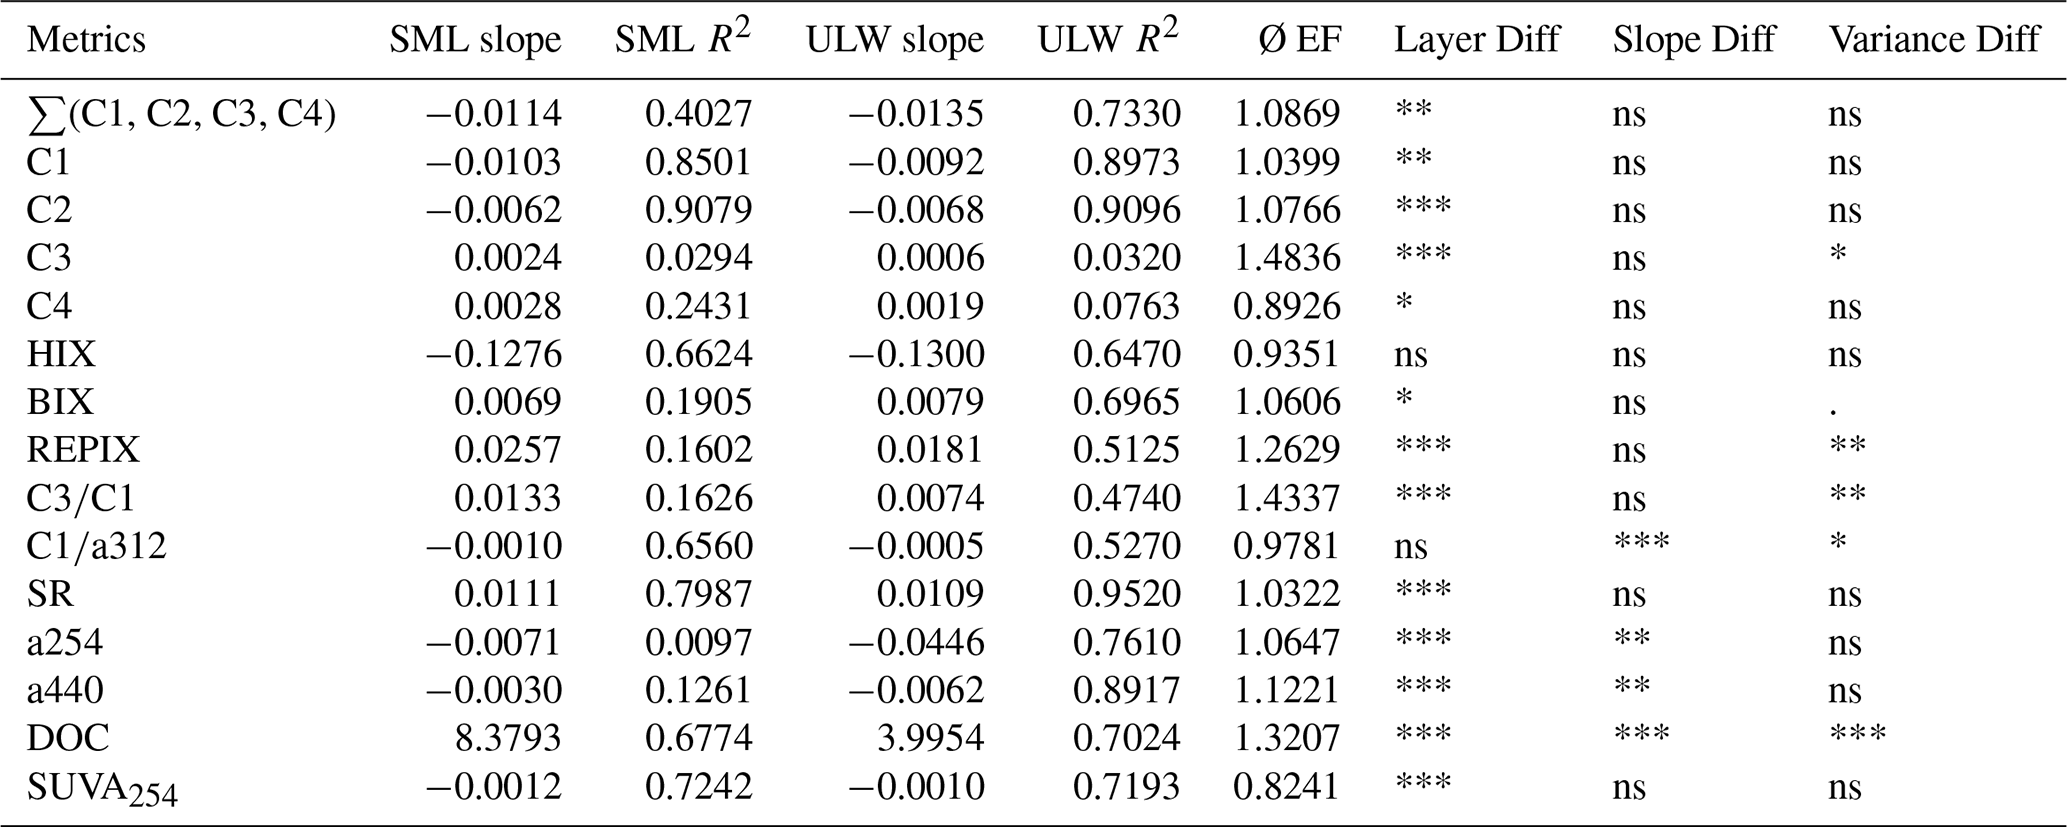
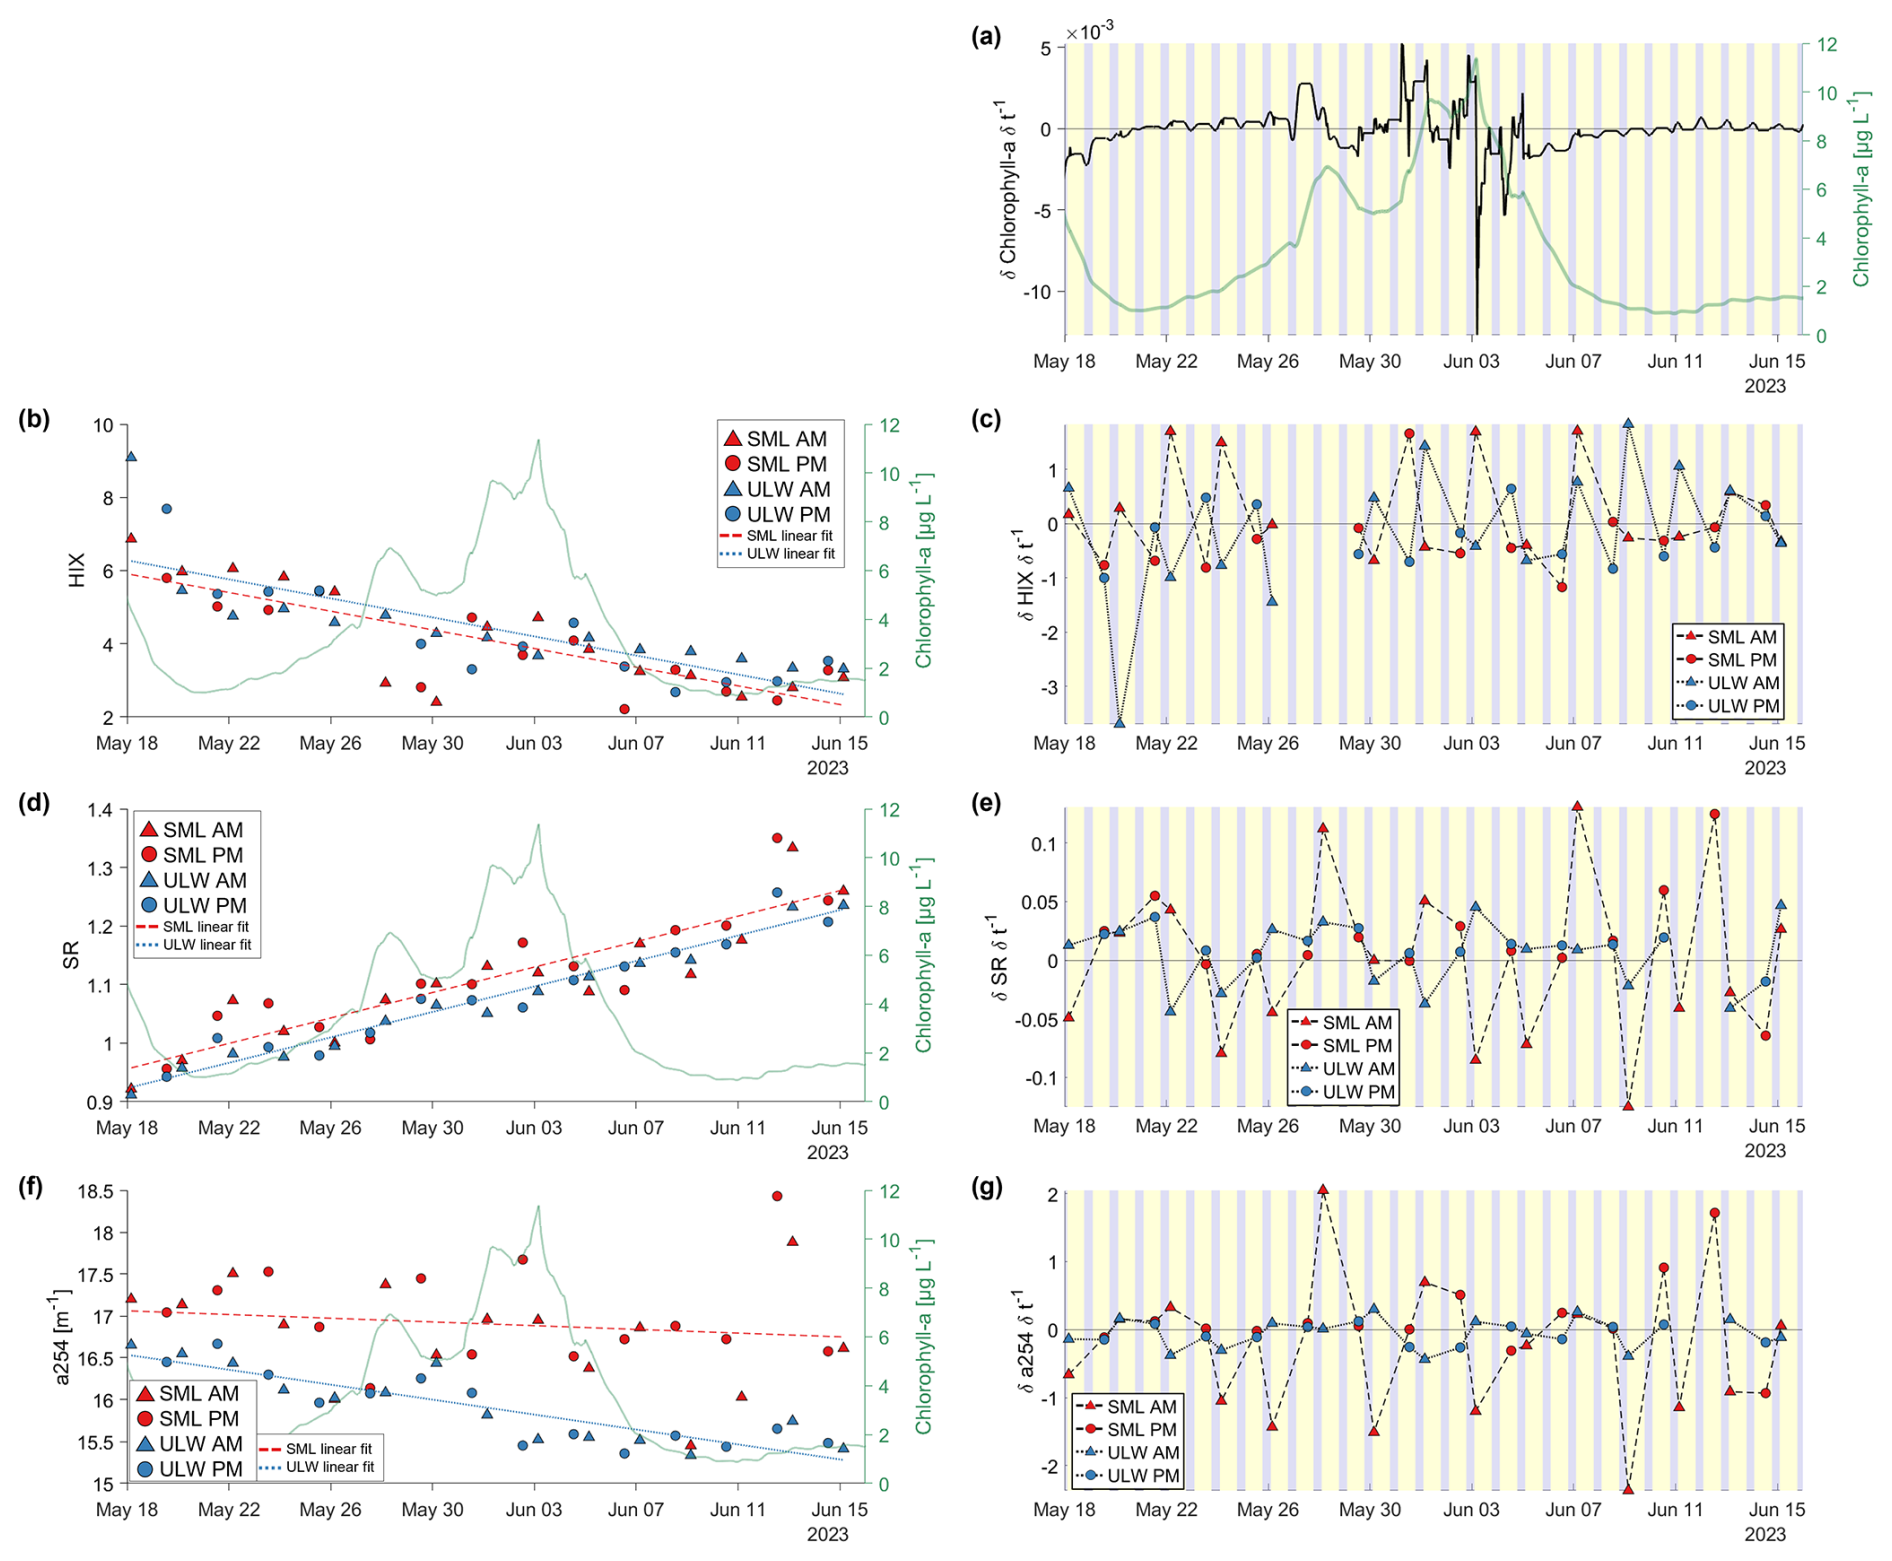
Figure 7Left side: Time series results of the humification index (HIX, Zsolnay et al., 1999, b), the slope ratio (SR, Helms et al., 2008, d), and the absorption coefficient at 254 nm in m−1 (a254, Summers et al., 1987; Weishaar et al., 2003, f). The sea-surface microlayer (SML) samples are marked in red, with a dashed red linear fit line, and the underlying water (ULW) samples are marked in blue with a dotted blue linear fit line. Morning (AM) samples are marked with triangles, afternoon (PM) samples are marked with squares. Right axes show the chlorophyll-a values in µg L−1. Right side: The first derivative of chlorophyll-a (a) HIX (c), SR (e), and a254 (g). The background colors indicate the day (yellow) and night (grey) cycle. The metrics not shown here exhibit similar trends to those displayed and are provided in the Appendix (Fig. A1).
3.5 Correlations between SML and ULW, CDOM/FDOM derived metrics and environmental variables
The results of this section are displayed in the Appendix. The overall pattern of a Spearman correlation matrix (Fig. A2) suggests that correlations are stronger in the SML compared to the ULW. Several CDOM/FDOM metrics and PARAFAC components were significantly related to chlorophyll-a and environmental variables in the SML, whereas correlations in the ULW were fewer and more selective.
The relationship between the HIX index and the UVA irradiance was not significantly correlated. But the afternoon sample data (Fig. A3b, d) showed more pronounced negative relationships between the integrated UVA irradiance and the HIX than the morning samples (Fig. A3a, c).
While the previous analyses considered the SML and ULW separately, comparing their metrics dynamics, Fig. A4 explores correlations between the layers to reveal their coupling or decoupling processes. The fluorophore intensities behaved differently in the SML and the ULW for single components (Fig. A4, upper panel). The intensities for the marine humic-like C1 and humic-like component C2 were significantly linearly correlated between ULW and SML with high ρs=0.95 (p<0.001). Between the protein-like components, the tryptophan-like component C3 was significantly correlated with a smaller ρs (ρs = 0.58, p = 0.001) while the component C4 was not correlated (ρs=0.09, p = 0.649) between ULW and SML. While a254 was not correlated (ρs = 0.38, p = 0.05), a440 was significantly correlated between ULW and SML (ρs = 0.69, p<0.001). The SR was higher in the SML and strongly correlated between ULW and SML (ρs = 0.91, p<0.001). SUVA254 was also significantly correlated between ULW and SML and higher in the ULW (ρs = 0.75, p<0.001, Fig. A4).
4.1 Mesocosm limitations and implications for DOM dynamics
While mesocosm studies help to provide controlled conditions and reduce complexity, several limitations inherent to the mesocosm design should be considered when interpreting the results. While the controlled setting minimized environmental variability, it also excluded processes relevant to natural SML dynamics, such as precipitation inputs, physical forcing, waves, and wind-driven turbulence. The relatively short study duration of approximately one month limits the ability to resolve longer-term feedback in CDOM and FDOM variability, particularly any gradual divergence in DOM composition between the SML and ULW that might develop over extended bloom and post-bloom cycles. Overall, these constraints mean that it remains uncertain to what degree the observed biogeochemical responses in the SML are representative of natural systems. The findings are therefore best interpreted as process-level insights into DOM dynamics under controlled bloom conditions, with their broader applicability to open-water environments requiring further validation under more variable, natural forcing.
4.2 Hypothesis 1: CDOM/FDOM signatures in SML and ULW shaped by a phytoplankton bloom
Two overlapping phytoplankton blooms developed during the mesocosm study following nutrient additions on 26 May, 30 May, and 1 June. The first, peaking on 28 May, was dominated by G. huxleyi, and the second, on 3 June, by C. closterium (Bibi et al., 2025a). Chlorophyll-a concentrations in the SML were distinctly higher (Ø EF = 47.95, Table A1) and more delayed than in the ULW (Fig. 2a), consistent with EF of 10–100, reported for very productive and slicky conditions in the ocean (Antonowicz, 2018; Carlson, 1982; Hardy and Apts, 1984). Although independent chlorophyll-a production by phytoneuston has been reported (Hardy, 2009; Hardy and Apts, 1984; Obernosterer et al., 2005; Reinthaler et al., 2008; Wurl et al., 2016), the strong enrichment observed here likely reflects passive accumulation rather than active growth of phytoneuston. The SML appeared dominated by brown detritus, and QFT-ICAM absorption spectra confirmed that elevated chlorophyll-a concentrations coincided with strong NAP absorption in the near-infrared (Fig. 2a, b). DOC enrichment in the SML (Ø EF = 1.32, Table 5, Fig. A1d) is also consistent with the passive accumulation of OM at the surface. This pattern suggested that detritus, OM and phytoplankton cells accumulated in the SML through physical processes such as bubble transport (Hardy, 1982) or vertical mixing. Cooling of the SML at night, increased its density and may have further enhanced this exchange through buoyancy fluxes (Rauch et al., 2026).
Phytoplankton exudation is typically associated with protein-like and marine humic-like FDOM (Chari et al., 2013; Romera-Castillo et al., 2010; Stedmon and Markager, 2005), suggesting a potential link between bloom progression and components C1, C3, and C4. However, neither individual FDOM components nor the CDOM/FDOM derived metrics followed the chlorophyll-a trend in the ULW (Fig. 2a, Fig. 6, Fig. A2). In contrast, several FDOM metrics (C1, C2, and most CDOM/FDOM derived metrics except a254) correlated significantly with chlorophyll-a in the SML, though this relationship may in part reflect the concurrent progression of time (Fig. A2).
PERMANOVA and nMDS analyses further support strong temporal control on FDOM composition, with clear clustering by bloom phase but not by layer (Table 3, Table 4, Fig. 5). The absence of a significant phase-layer interaction (p=0.8192, Table 3) indicated that bloom development and the layer affected FDOM independently, suggesting that temporal drivers such as photodegradation and microbial processing, rather than chlorophyll-a dynamics alone, governed the observed FDOM composition in the mesocosm.
The time series of FDOM components revealed distinct differences between SML and ULW, mainly in their mean layer values (Table 5). Throughout the study, humic-like matter steadily decreased (Fig. 6). C2 decreased linearly, while C1 showed elevated SML values, peaking shortly after the G. huxleyi bloom for three days (28–30 May). C1 fluorescence is associated to phytoplankton production (Chari et al., 2013; Coble et al., 1998) and microbial processing of algal DOM (Stedmon and Markager, 2005). The same three days also showed elevated C3, associated with tryptophan-like fluorescence from phytoplankton or microbes (Harris et al., 2024; Obernosterer et al., 2005; Rochelle-Newall et al., 2004; Romera-Castillo et al., 2010). Bacterial abundance data from Bibi et al. (2025a) confirm higher SML values on 28 May, the first day of increased C1 and C3 (Fig. 2d), suggesting a microbial contribution to FDOM. Passive accumulation of OM in the SML suggested that detritus and its microbial degradation represented key CDOM/FDOM sources, consistent with Zöbelein et al. (2026), who observed carbohydrate-rich DOM accumulation in the SML after the bloom, attributed to phytoplankton exudation, particle degradation, and microbial processing.
Retelletti Brogi et al. (2020) associated G. huxleyi exudates with fluorescence in the C3 and C1 regions, with tryptophan-like components (C3) dominating, while Romera-Castillo et al. (2010) showed that species, nutrients, and light affect FDOM quality as reflected in the ratio. Elevated ratios (Fig. A1c), BIX (Fig. A1a), and REPIX (Fig. A1e) in the SML during the bloom peak further support these findings. Although previous studies have reported significant enrichment of protein-like fluorescence in the SML (Blough, 1997; Galgani and Engel, 2016; Yang et al., 2022), the mesocosm results showed enhanced C1 and C3 enrichment only during the G. huxleyi bloom peak. Nevertheless, enrichment factors for all components except C4 exceeded one (Table 5).
Galgani and Engel (2016) attributed protein-like enrichment to microbial sources within the SML or immediate subsurface, while humic-like matter likely originated from the ULW and was transported upward by physical processes, an interpretation that may also apply in our study. Yang et al. (2022) reported vertical coupling and DOM exchange between the layers indicated by strong CDOM and FDOM correlations, alongside a photochemical conversion of humic-like to tyrosine-like matter. In our study, C4 stood out by showing no significant correlation between SML and ULW (Fig. A4), in contrast to most other metrics. During the G. huxleyi bloom, C3 was enriched in the SML, whereas C4 remained similar or higher in the ULW. The lack of coupling suggests that tyrosine-like FDOM production in the mesocosm was controlled by layer-specific transformation processes rather than vertical exchange. During the subsequent C. closterium bloom (31 May–4 June), only a slight increase of C4 was detected in the ULW (Fig. 6). Although Chari et al. (2013) demonstrated that C. closterium releases protein-like, humic-like, and marine humic-like FDOM even in bacteria-free cultures, no clear link between this diatom bloom and the observed fluorophores emerged in our study.
The irregular fluctuations of CDOM/FDOM derived metrics between sampling events suggested dynamic transformation, production and exchange processes between the SML and the ULW rather than a steady photodegradation trend, see Sect. 4.2. Had photochemical loss of humic-like matter been dominant, afternoon samples would have shown a relative increase in protein-like fluorescence; instead, DOM intensities exhibited a “zig-zag” pattern (Figs. 6, 7). Phytoplankton exudation likely contributed to this variability. During daylight, exudation of labile, low-molecular-weight compounds associated with protein-like FDOM (tryptophan- and tyrosine-like fluorescence) was enhanced, whereas nighttime processes favor the release of polymeric carbohydrates and the accumulation of humic-like FDOM (Kieber et al., 1989; Smith and Underwood, 2000; Stedmon and Markager, 2005; Thornton, 2014). Consequently, daytime conditions favored the accumulation of freshly produced, protein-like DOM, whereas nighttime processes promote its transformation into more humified, refractory compounds. BIX values rose from ∼ 0.8 to ∼ 1 during the study (Fig. A1a), further indicating increasing fresh DOM and bacterial influence consistent with rising bacterial abundance (Bibi et al., 2025a).
While the bloom phases influenced the general DOM composition, most observed changes appeared to result from passive accumulation, microbial transformation, and photochemical processes rather than direct phytoplankton exudation. Yet clear differences in the mean layer values for most CDOM/FDOM derived metrics and subtle responses of the , BIX and REPIX to the G. huxleyi bloom indicate connections of the phytoplankton bloom to the bio-optical proxies (Table 5, Fig. A1). Therefore, these results partly support the hypothesis that the CDOM/FDOM signatures in the SML and ULW provide information on the transformation processes of DOM and differ considerably between the two layers.
4.3 Hypothesis 2: Photodegradation of CDOM and FDOM in the SML vs. in the ULW
The SML's strong exposure to UV degradation is considered a key factor shaping its distinct chemical properties (Blough, 1997; Cunliffe et al., 2013; Drozdowska et al., 2017; Galgani and Engel, 2016). After 28 May the integrated irradiance is similar for the afternoon samples, indicating mostly sunny weather providing equal photodegradation potential (Fig. 3). It was hypothesized that photodegradation would affect the DOM in the SML stronger than in the ULW, especially regarding the production of OM during the phytoplankton blooms. Previous field studies have reported varying photochemical impacts on the SML relative to the ULW. While Drozdowska et al. (2017) observed higher and more rapid degradation rates in the SML based on CDOM slope and HIX values, Galgani and Engel (2016) found a significantly lower SR in the SML, and attribute the elevated CDOM to a local microbial release as a response to high solar radiation. Yang et al. (2022) showed stronger photodegradation in the SML during incubation experiments based on lower percentages of humic-like DOM and lower SUVA254 in the SML. Photodegradation breaks down conjugated aromatic structures, producing smaller, less conjugated molecules that absorb predominantly in the UV region, thus increasing the CDOM spectral slope and SR (Helms et al., 2008; Moran and Zepp, 1997; Stedmon and Markager, 2005). While photodegradation increases the SR, microbial activity decreases the SR over timescales of days to weeks (Galgani and Engel, 2016; Helms et al., 2008). CDOM/FDOM derived metrics delivering information of the humification (HIX, ) and aromaticity (a254, SUVA254), are expected to decrease by photodegradation. In the mesocosm study, the SR in both layers increased almost linearly, with no significant difference, while mean SR values were slightly higher in the SML, indicating a marginally stronger effect near the surface and pointing towards photodegradation outweighing microbial activity as a sink (Fig. 7d, Table 5). This is supported by the significantly faster decreasing ratio in the SML compared to the ULW (Fig. A1, Table 5). However, a254 declined significantly slower in the SML, suggesting greater aromatic content, and less photodegradation (Fig. 7f, Table 5). SUVA254 steadily decreased and was significantly higher in the ULW, despite lower DOC concentrations (Ø EF = 0.82, Table 5, Fig. A1f), indicating that aromatic DOM was lost faster per unit of carbon in the SML than the ULW, consistent with stronger photodegradation. This is supported by Yang et al. (2022), who similarly observed higher SUVA254 values in the ULW attributed this to preferential photodegradation of aromatic DOM in the more light-exposed SML. Together, SUVA254, and SR provide evidence for stronger photodegradation in the SML, whereas the results for a254, and the enrichment of humic-like FDOM (C1, C2) contradict it. These inconsistencies point to co-occurring processes, such as photodegradation and passive accumulation of aromatic, humic-like matter, influencing DOM composition in both layers.
As discussed in Sect. 4.2, CDOM/FDOM dynamics in the SML and ULW showed irregular, “zig-zag” patterns rather than a steady degradation trend, reflecting simultaneous photochemical, microbial, and phytoplankton-driven processes. Declining HIX values supported the progressive degradation of aromatic matter and corresponded with the observed decrease in humic-like components (C1, C2) and increase in protein-like components (C3, C4) over time (Fig. 6, Table 5). No significant correlation was found between HIX and daily irradiance (Fig. A3), yet afternoon samples tended to show a lower HIX under stronger light exposure, consistent with photodegradation effects on aromatic matter. Similar trends have been reported by Miranda et al. (2018), Yang et al. (2022), and Drozdowska et al. (2017), who observed reduced humic-like fluorescence and higher SR values in the SML due to the photochemical breakdown of aromatic DOM.
The initially high C1 and C2 intensities likely reflected the influence of riverine and sediment derived DOM in Jade Bay source water (Van Beusekom et al., 2012; Liebezeit et al., 1994). The concurrent decline of humic-like and increase of protein-like fluorescence supported a gradual shift from terrestrial and refractory DOM toward fresher, biologically and photochemically altered matter during the mesocosm study.
At the molecular level, Zöbelein et al. (2026) found a decline in aromatic molecules towards the end of the same mesocosm study. They found no major compositional differences between SML and ULW, suggesting that strong vertical coupling and high light penetration, possibly aided by the bright color of the concrete walls, promoted uniform photodegradation across layers. Jibaja Valderrama et al. (2026) detected enhanced photochemical activity in the SML, with elevated production of low-molecular-weight carbonyl compounds under high biological productivity, indicating that the SML acts as a hotspot for reactive photoproducts. However, the total light-induced formation of oxidants and the overall photooxidation capacity was comparable in both layers.
Overall, photodegradation acted as a clear sink for aromatic DOM, photodegradation metrics could not conclusively confirm a stronger photodegradation in the SML. This was likely due to the multiple overlying transformation and enrichment processes, the shallow basin, strong vertical mixing, and uniform light penetration preventing pronounced gradients. The initial hypothesis that photodegradation would more strongly affect the SML than the ULW was therefore partly supported under the given conditions, though it may apply stronger in more stratified natural systems where vertical gradients in light and DOM composition are more pronounced.
In this mesocosm study, the influence of an induced phytoplankton bloom and photodegradation on CDOM/FDOM dynamics in the SML and the ULW were investigated. It was hypothesized that the CDOM/FDOM signatures in the SML and ULW provide information on the transformation processes of DOM and differ considerably between the two layers and that photodegradation during the mesocosm study affects the DOM in the SML more than in the ULW, especially regarding the production of OM during the phytoplankton blooms.
The mesocosm study showed that phytoplankton bloom dynamics only partially shaped CDOM/FDOM signatures in the SML and ULW. While different bloom phases influenced the general DOM composition, most observed changes appeared to result from passive accumulation, microbial transformation, and photochemical processes rather than direct phytoplankton exudation. Photodegradation emerged as a major sink for aromatic DOM, showing stronger effects in the SML for some CDOM/FDOM derived metrics, while co-occurring processes, such as passive accumulation and enrichment of aromatic matter, might hinder more conclusive results. Strong vertical mixing, the shallow water depth, and high light penetration, might have further prevented the formation of stronger surface-specific photochemical gradients.
Our findings highlight that SML specific processes may be subtle and that even higher temporal and vertical resolution sampling, combined with interdisciplinary collaboration, will be essential to better distinguish between possible sinks and sources of DOM in future studies. At the same time, the controlled mesocosm setting means that these results are best interpreted as process-level insights under bloom conditions, and their transferability to more dynamic natural systems should be evaluated in future field studies.
Table A1Sea-surface microlayer (SML) and underlying water (ULW) linear trends (slope, R2) and mean enrichment factor (Ø EF) for environmental variables displayed in Fig. 2. Significance of differences between both layers as layer means, slopes, and variance are indicated in Layer Diff, Slope Diff, and Variance Diff (highly significant/p<0.001: “***”, significant/p<0.01: “**”, moderately significant/p<0.05: “*”, slightly significant/p<0.1: “.”, not significant/p<1: “ns”).
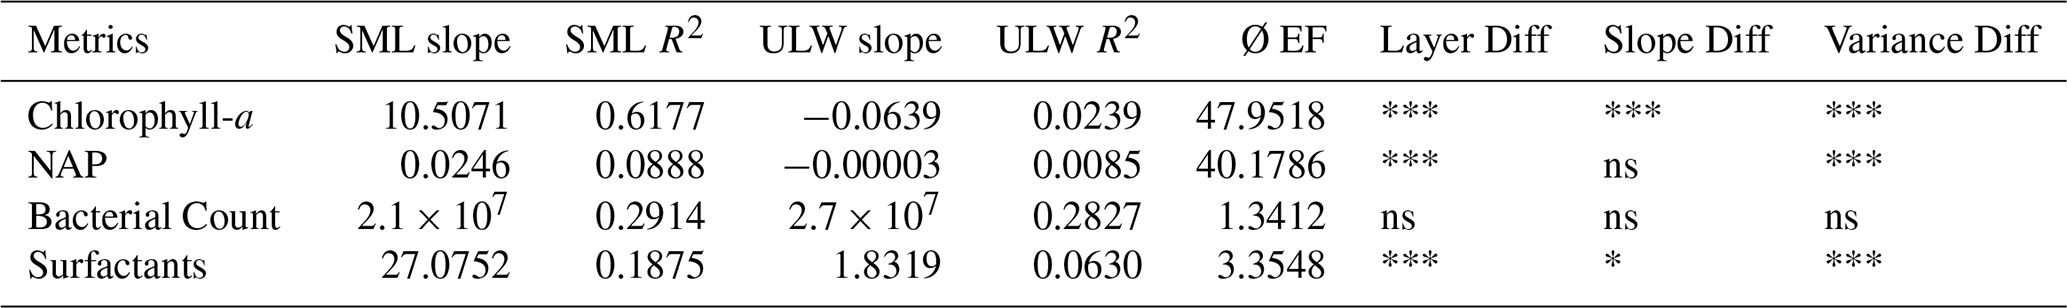
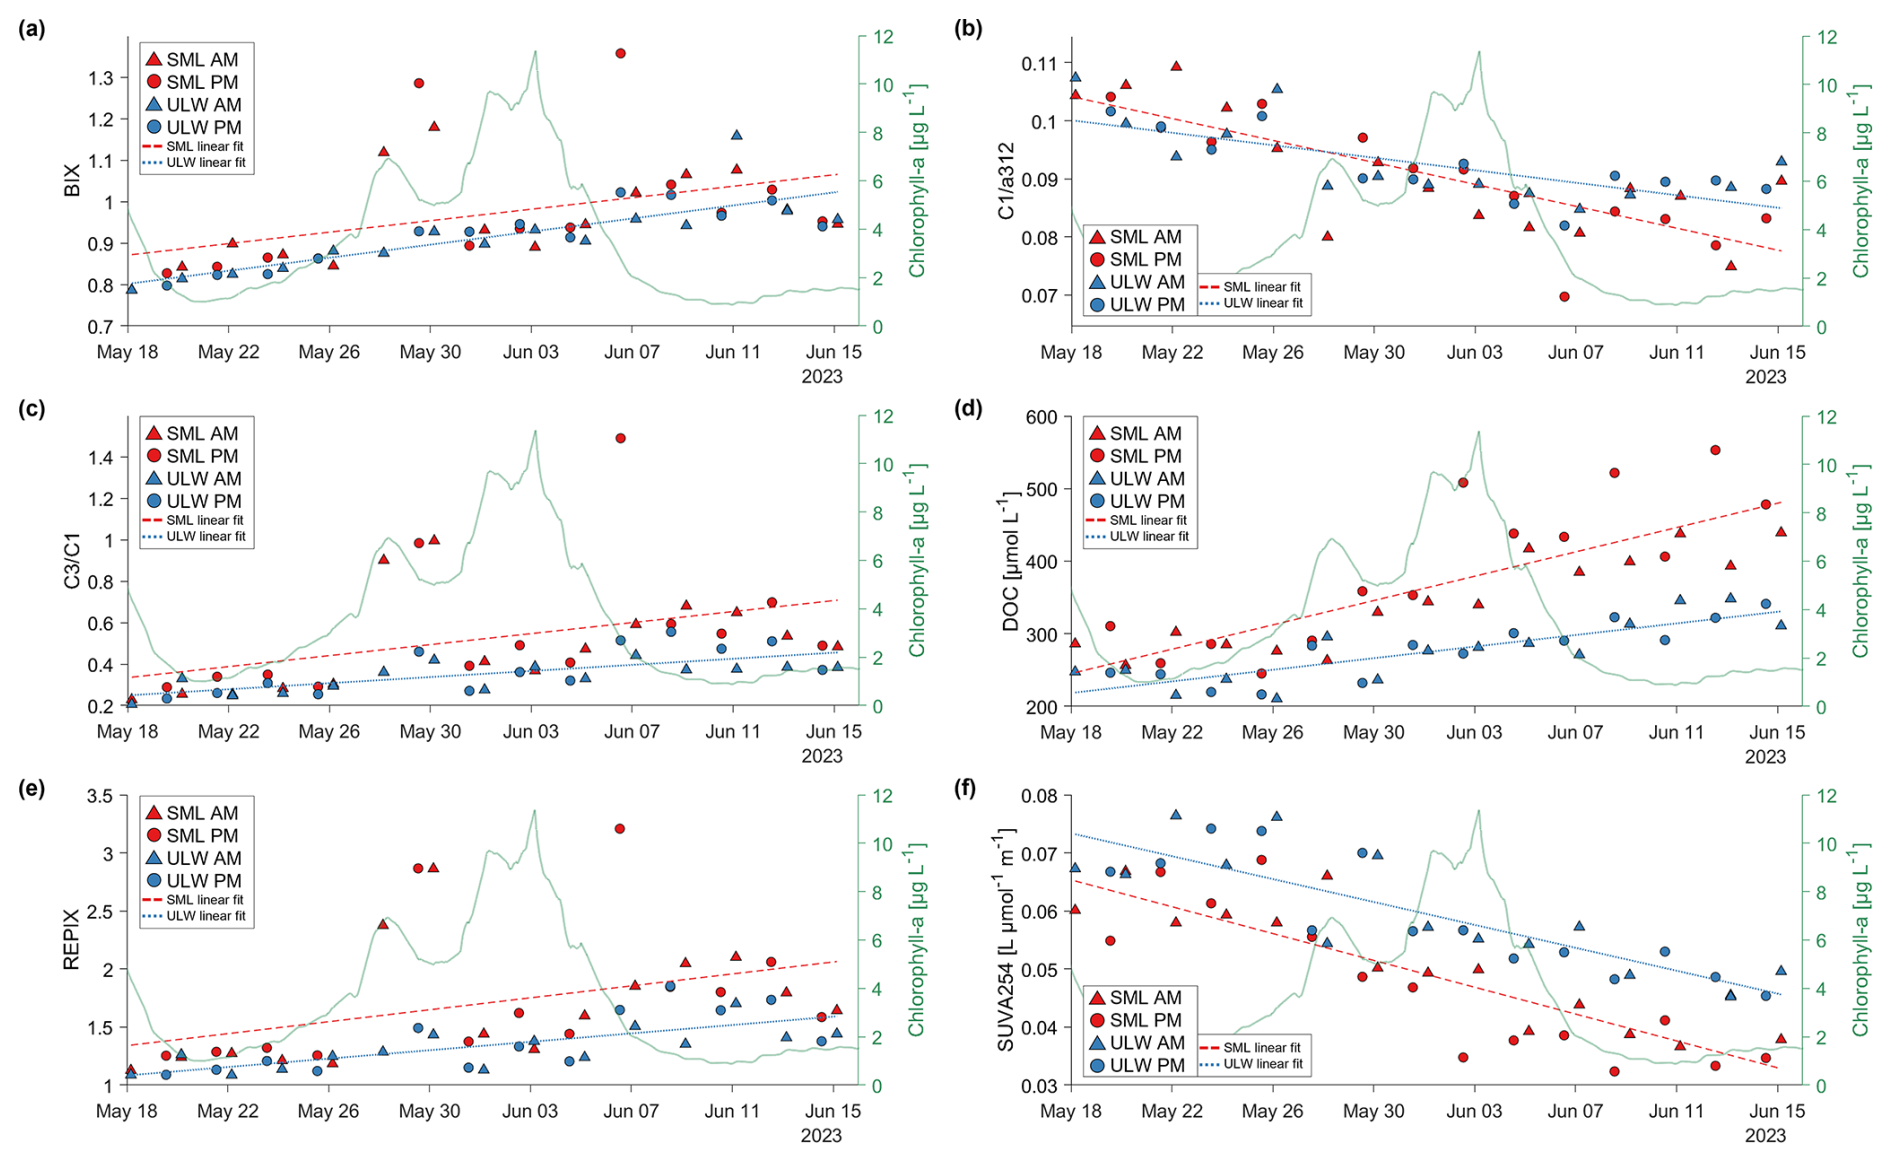
Figure A1Time-series results of the (a) biological index (BIX, Huguet et al., 2009), (b) the ratio of PARAFAC component C1 and the absorption at 312 nm (DeHaan, 1993; Lønborg et al., 2010), (c) the ratio of PARAFAC component C3 and C1 (Romera-Castillo et al., 2010), (d) dissolved organic carbon (DOC), (e) the recently produced index (REPIX, Drozdowska et al., 2017) and (f) the specific UV absorbance (SUVA254, Weishaar et al., 2003). The sea-surface microlayer (SML) samples are marked in red, with a dashed red linear fit line, and the underlying water (ULW) samples are marked in blue with a dotted blue linear fit line. Morning (AM) samples are marked with triangles, afternoon (PM) samples are marked with squares. Right axes show the chlorophyll-a values in µg L−1.
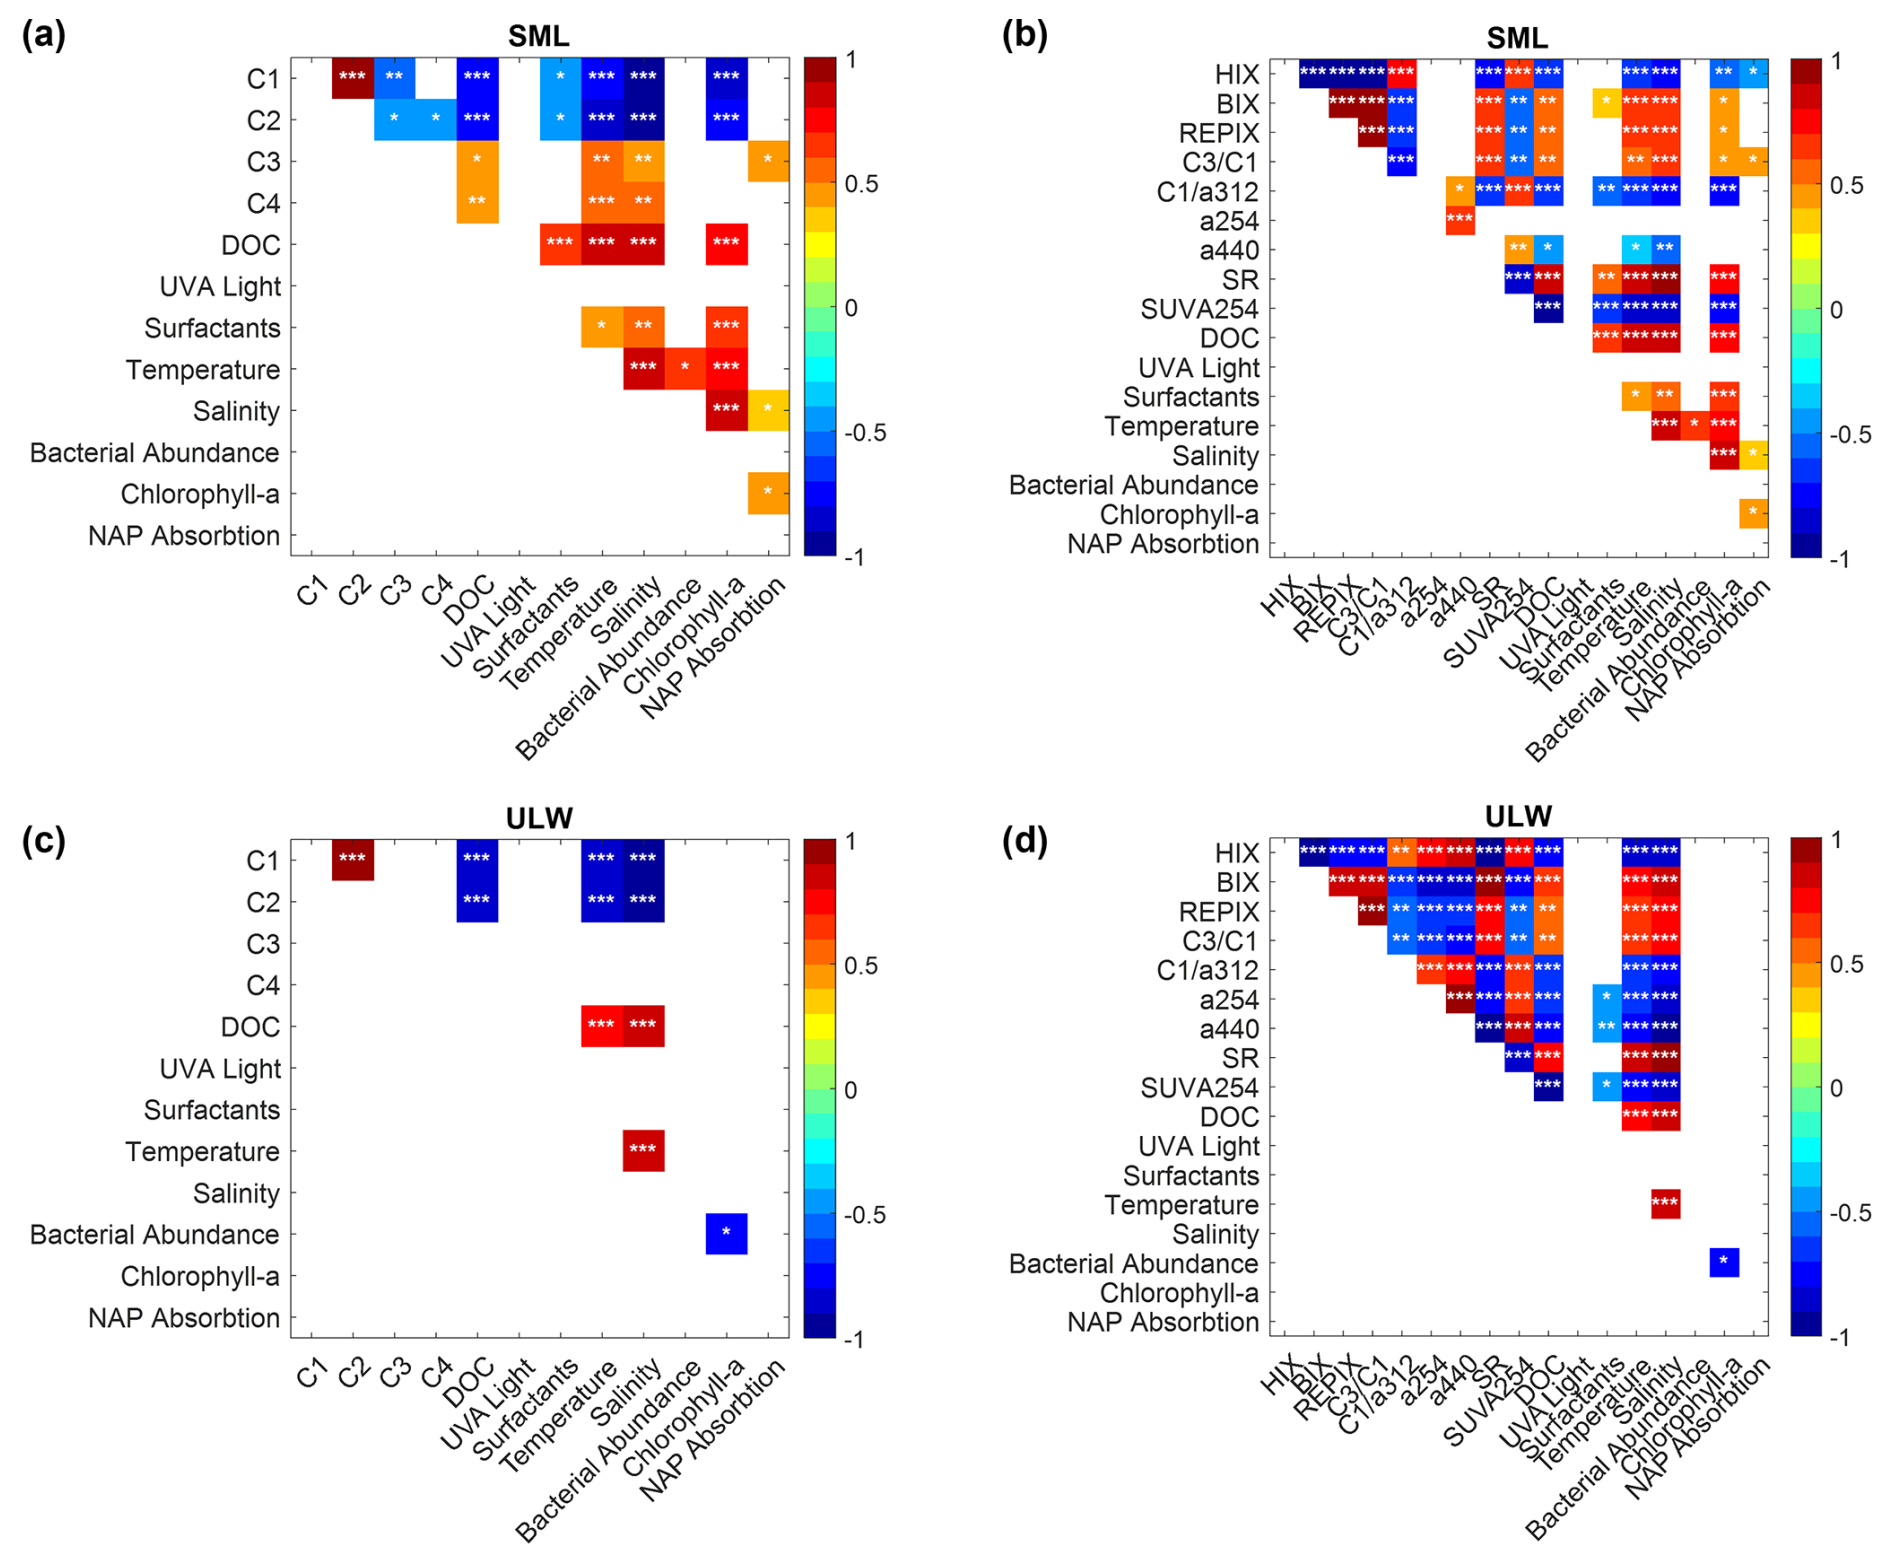
Figure A2Spearman correlations matrix of FDOM components and environmental variables (Sea-surface microlayer (SML, a), Underlying water (ULW, b) and CDOM/FDOM derived metrics and environmental variables (SML, c; ULW, d). Only the significant correlations are shown (p<0.5). The asterisks in the cells indicate the level of significance (* p<0.05; ** p<0.01; *** p<0.001). The color indicates the level of Spearman's ρs where red means positively correlated and blue means negatively correlated. The abbreviations used in the figure are explained in Table 1.
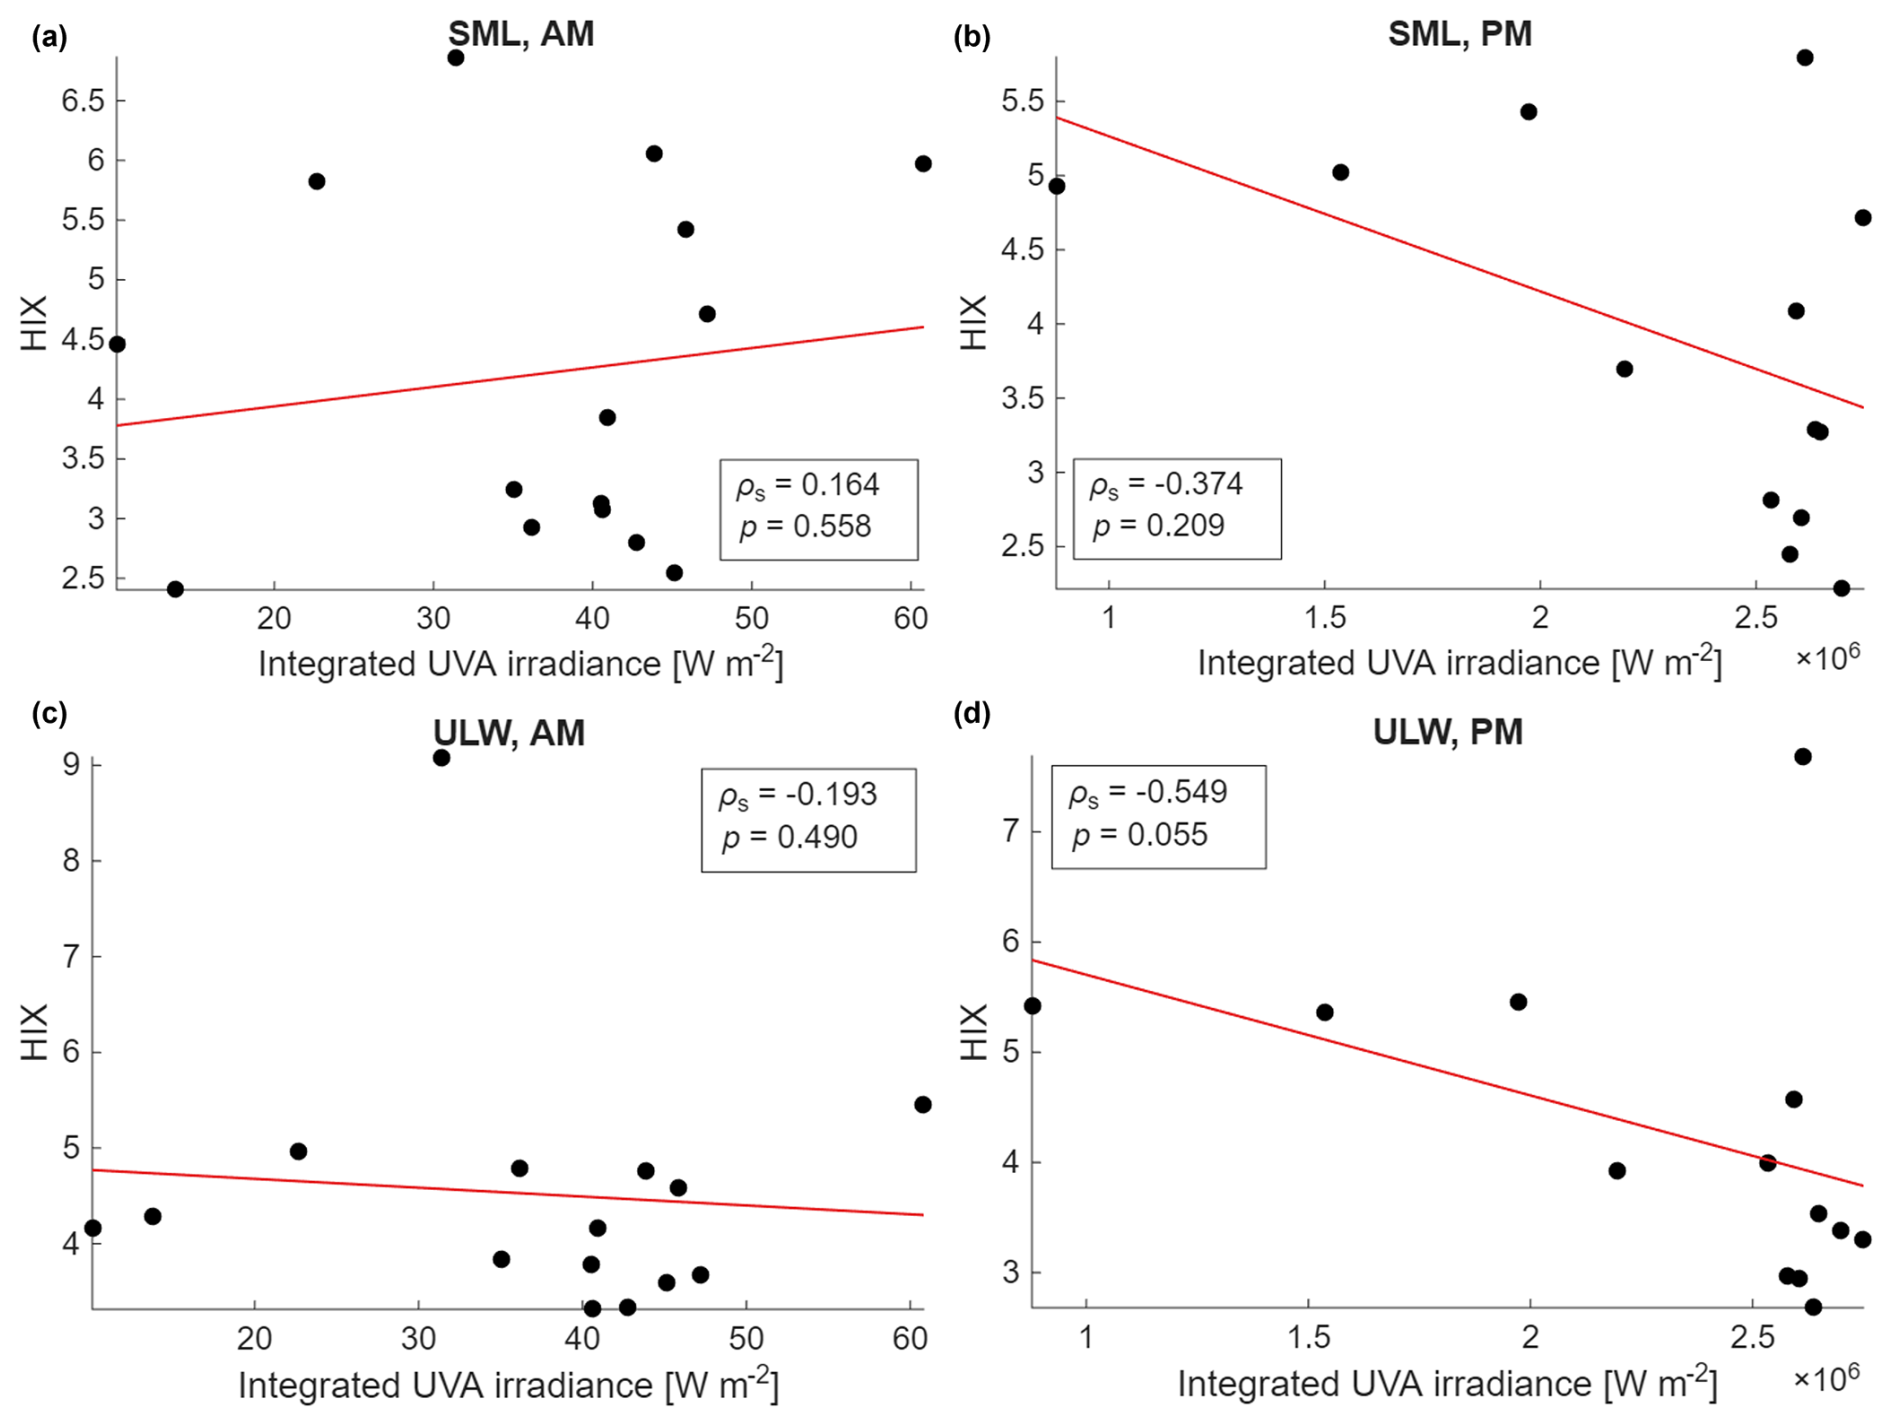
Figure A3Integrated UVA irradiance vs. the humification index (HIX, Zsolnay et al., 1999) for the sea-surface microlayer (SML) morning (AM) (a) and afternoon (PM) (b) samples and the underlying water (ULW) AM (c) and PM (d) samples. Within each plot Spearman's ρs and the linear correlation significance p are shown.
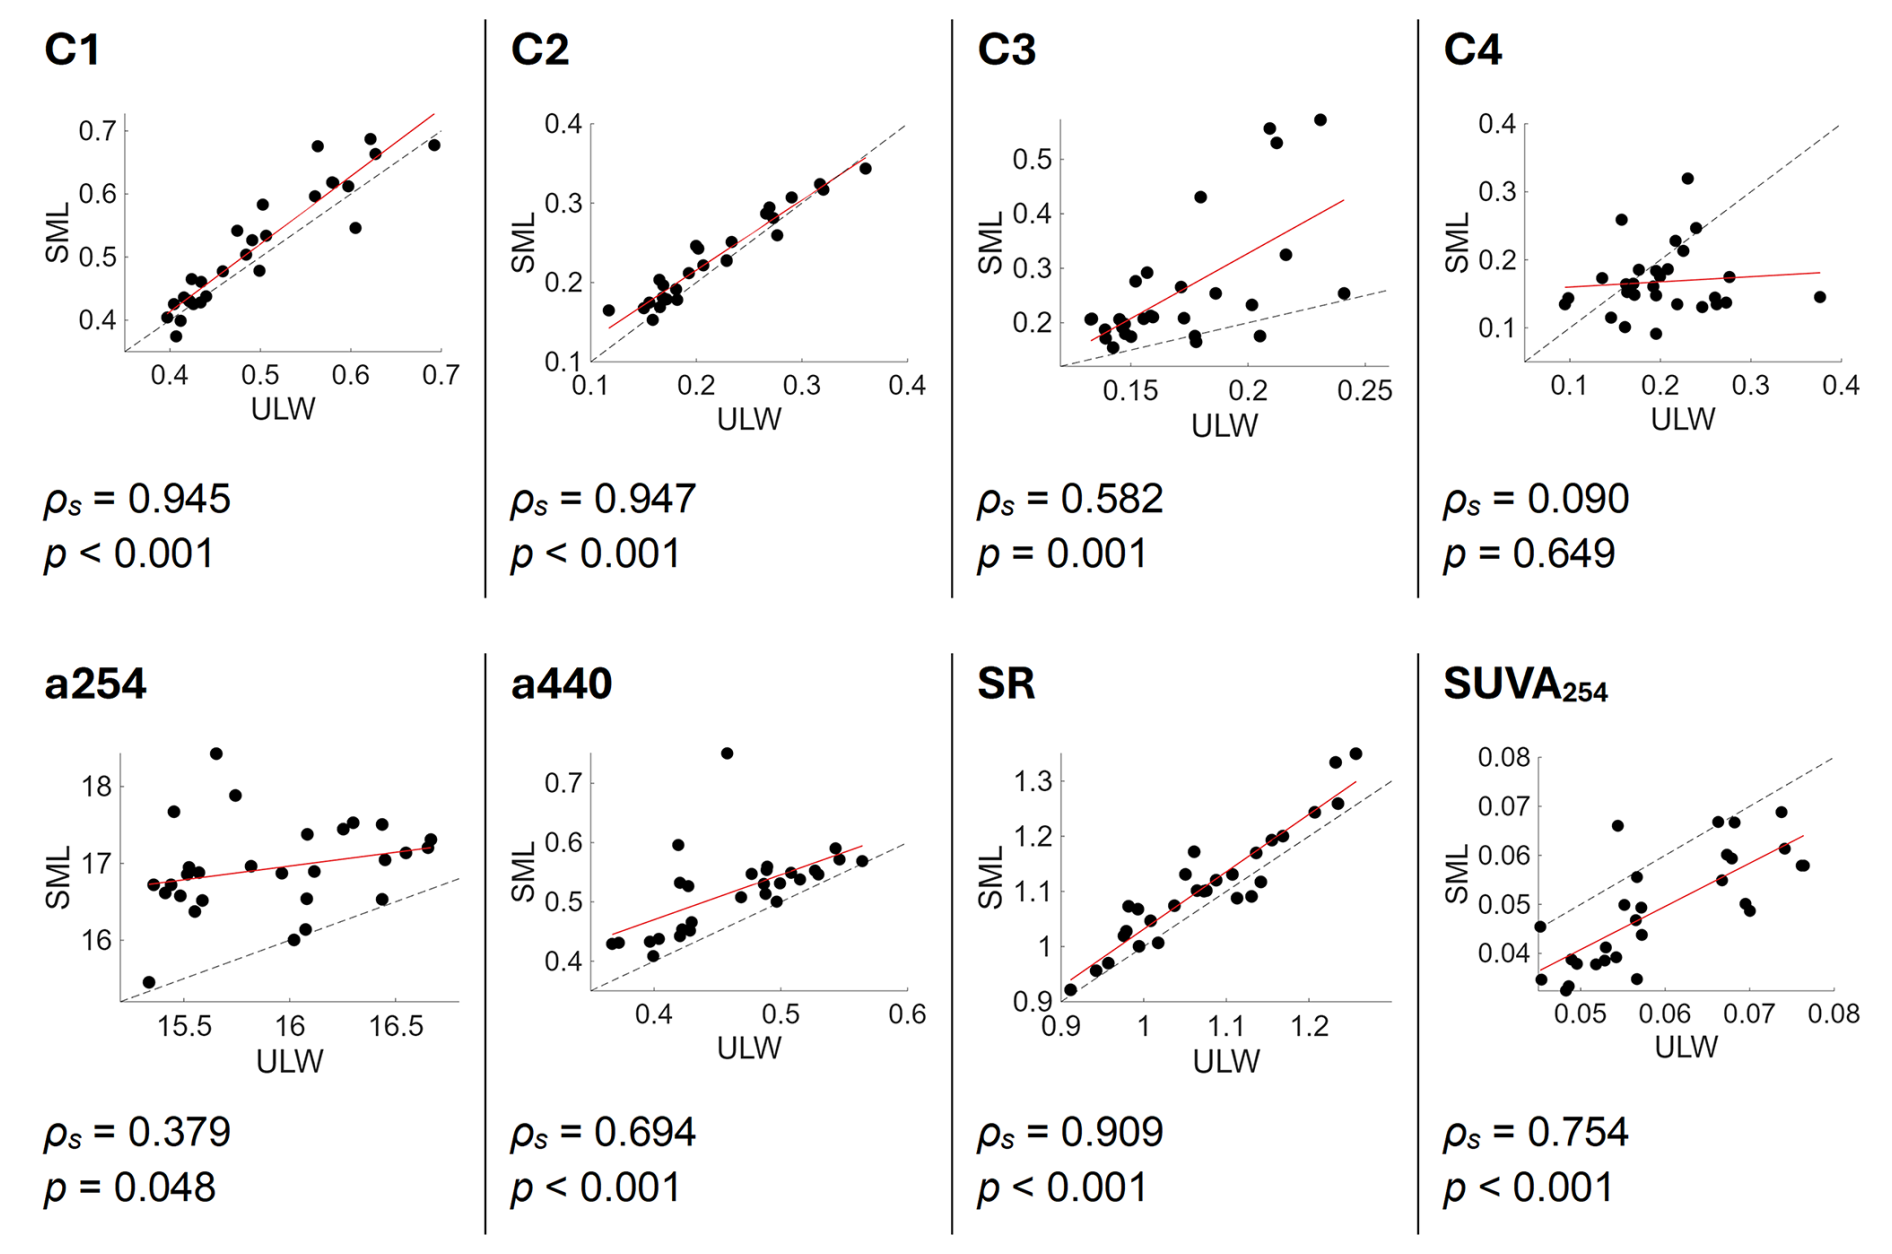
Figure A4Linear correlation between the underlying water (ULW) and the sea-surface microlayer (SML) for FDOM fluorophore intensities C1–C4 in Raman units (RU), two absorption coefficients (a254, a440), the slope ratio (SR) and the specific UV absorbance (SUVA254). The dotted line indicates the 1:1 line and the red line is the linear fit. Spearman's ρs and its significance are noted underneath each plot.
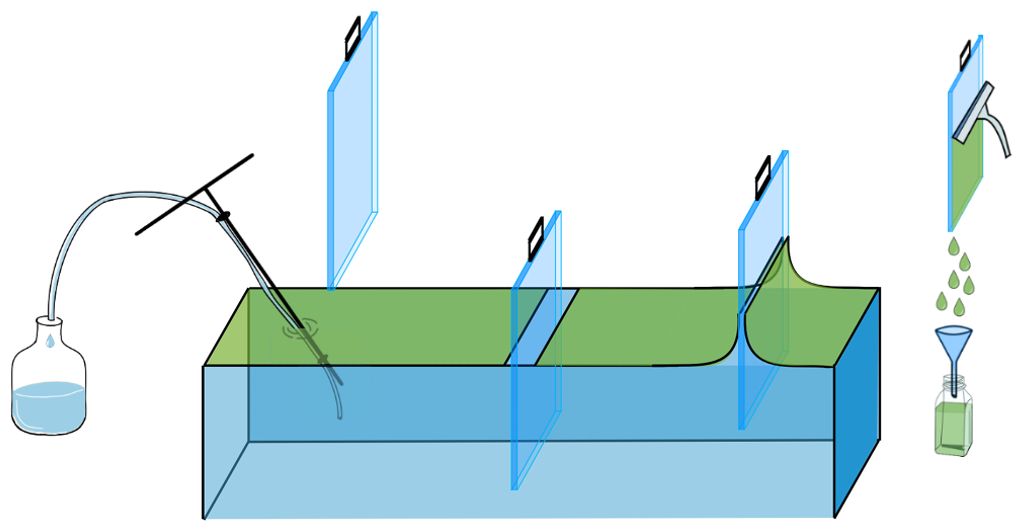
Figure A5Scheme of sampling methods used during the mesocosm study. Glass plate sampling of the sea-surface microlayer at the middle and right side of the figure and the tube and suction system used for sampling of the underlying water on the left side. Fig. adapted from Zöbelein et al. (2025, 2026).
CDOM and FDOM data are avaible in Thölen et al. (2026a, b) (https://doi.org/10.1594/PANGAEA.987974, https://doi.org/10.1594/PANGAEA.988058). The PARAFAC model will be available in OpenFluor under the name “BASS_Mesocosm_JadeBay”. Data from discrete samples during the mesocosm study (e.g. chlorophyll-a, surfactants, and overall bacterial abun dance) are available in Bibi et al. (2025b) (https://doi.org/10.1594/PANGAEA.984101). All data are available on request from the corresponding author.
CT: Data Curation, Formal Analysis, Methodology, Visualization, Writing – Original Draft, Writing – Review & Editing, JW: Conceptualization, Data Curation, Formal Analysis, Supervision, Writing – Review & Editing, MGN: Data Curation, Formal Analysis, Writing – Review & Editing, RR: Funding Acquisition, Conceptualization, Data Curation, Formal Analysis, Supervision, Writing – Review & Editing, OZ: Funding Acquisition, Conceptualization, Supervision, Writing – Review & Editing.
The contact author has declared that none of the authors has any competing interests.
Publisher's note: Copernicus Publications remains neutral with regard to jurisdictional claims made in the text, published maps, institutional affiliations, or any other geographical representation in this paper. The authors bear the ultimate responsibility for providing appropriate place names. Views expressed in the text are those of the authors and do not necessarily reflect the views of the publisher.
This article is part of the special issue “Biogeochemical processes and Air–sea exchange in the Sea-Surface microlayer (BG/OS inter-journal SI)”. It is not associated with a conference.
The authors would like to thank all members of the BASS research group and the ICBM workshop for the successful teamwork and their help conducting the SURF mesocosm study in 2023. We acknowledge Oliver Wurl and Riaz Bibi for their coordination and organization of the BASS mesocosm study. We are grateful to our colleagues Kai Schwalfenberg for helping with PARAFAC, Oliver Ferdinand for providing his bottle preparation protocol for the fluorometric analysis and Kerstin Heymann for conducting the HPLC analysis. We thank Isha Athale, Dmytro Spriahailo, Thorsten Brinkhoff, Thomas Reinthaler from BASS SP1.2 for providing the bacterial abundance data. We thank Carsten Rauch and Oliver Wurl from BASS SP2.3 for providing additional CTD data. We also thank Jasper Zöbelein and Hannelore Waska from SP 1.5 and Theresa Barthelmeß, Josefine Karnatz and Anja Engel from SP 1.1 for providing the DOC data. ChatGPT (OpenAI, 2025) was used for text refinement and language polishing.
This research was supported by the research unit “Biogeochemical processes and Air–sea exchange in the Sea-Surface microlayer (BASS)”, which was funded by the German Research Foundation (DFG) under grant no. 451574234.
This paper was edited by Peter S. Liss and reviewed by Bita Sabbaghzadeh and one anonymous referee.
Álvarez-Salgado, X. A., Nieto-Cid, M., and Rossel, P. E.: Dissolved Organic Matter, in: Marine Analytical Chemistry, edited by: Blasco, J. and Tovar-Sánchez, A., Springer Nature, Switzerland, https://doi.org/10.1007/978-3-031-14486-8_2, 2023.
Anderson, M. J.: A new method for non-parametric multivariate analysis of variance, Austral Ecol., 26, 32–46, https://doi.org/10.1111/j.1442-9993.2001.01070.pp.x, 2001.
Antonowicz, J. P.: Air-Water Interface in an Estuarine Lake: Chlorophyll and Nutrient Enrichment, Pol. J. Ecol., 66, 205, https://doi.org/10.3161/15052249PJE2018.66.3.001, 2018.
Baker, A., Bolton, L., Newson, M., and Spencer, R. G. M.: Spectrophotometric properties of surface water dissolved organic matter in an afforested upland peat catchment, Hydrol. Process., 22, 2325–2336, https://doi.org/10.1002/hyp.6827, 2007.
Balch, W. M.: The Ecology, Biogeochemistry, and Optical Properties of Coccolithophores, Annu. Rev. Mar. Sci., 10, 71–98, https://doi.org/10.1146/annurev-marine-121916-063319, 2018.
Barthelmeß, T. and Engel, A.: How biogenic polymers control surfactant dynamics in the surface microlayer: insights from a coastal Baltic Sea study, Biogeosciences, 19, 4965–4992, https://doi.org/10.5194/bg-19-4965-2022, 2022.
Bibi, R., Ribas-Ribas, M., Jaeger, L., Lehners, C., Gassen, L., Cortés-Espinoza, E. F., Wollschläger, J., Thölen, C., Waska, H., Zöbelein, J., Brinkhoff, T., Athale, I., Röttgers, R., Novak, M., Engel, A., Barthelmeß, T., Karnatz, J., Reinthaler, T., Spriahailo, D., Friedrichs, G., Schäfer, F. A., and Wurl, O.: Biogeochemical dynamics of the sea-surface microlayer in a multidisciplinary mesocosm study, Biogeosciences, 22, 7563–7589, https://doi.org/10.5194/bg-22-7563-2025, 2025a.
Bibi, R., Ribas-Ribas, M., Jaeger, L., Lehners, C., Gassen, L., Cortés, E., Wollschläger, J., Thölen, C., Waska, H., Zöbelein, J., Brinkhoff, T., Athale, I., Röttgers, R., Novak, M., Engel, A., Barthelmeß, T., Karnatz, J., Reinthaler, T., Spriahailo, D., Friedrichs, G., Schäfer, F., and Wurl, O.: Physical, chemical, and biogeochemical parameters from a mesocosm experiment at the Sea Surface Facility (SURF), Wilhelmshaven, Germany, spring 2023, PANGAEA [data set], https://doi.org/10.1594/PANGAEA.984101, 2025b.
Blough, N. V.: Photochemistry in the sea-surface microlayer, in: The Sea Surface and Global Change, edited by: Liss, P. S. and Duce, R. A., Cambridge University Press, 383–424, https://doi.org/10.1017/CBO9780511525025.014, 1997.
Bray, J. R. and Curtis, J. T.: An Ordination of the Upland Forest Communities of Southern Wisconsin, Ecol. Monogr., 27, 325–349, https://doi.org/10.2307/1942268, 1957.
Bricaud, A., Morel, A., and Prieur, L.: Absorption by dissolved organic matter of the sea (yellow substance) in the UV and visible domains, Limnol. Oceanogr., 26, 43–53, https://doi.org/10.4319/lo.1981.26.1.0043, 1981.
Brown, M. B. and Forsythe, A. B.: Robust Tests for the Equality of Variances, J. Am. Stat. Assoc., 69, 364–367, 1974.
Calderó-Pascual, M., Yýldýz, D., Yalçýn, G., Metin, M., Yetim, S., Fiorentin, C., Andersen, M. R., Jennings, E., Jeppesen, E., Ger, K. A., Beklioðlu, M., and McCarthy, V.: The importance of allochthonous organic matter quality when investigating pulse disturbance events in freshwater lakes: a mesocosm experiment, Hydrobiologia, 849, 3905–3929, https://doi.org/10.1007/s10750-021-04757-w, 2022.
Carlson, D. J.: Phytoplankton in marine surface microlayers, Can. J. Microbiol., 28, 1226–1234, https://doi.org/10.1139/m82-183, 1982.
Carlucci, A. F., Craven, D. B., and Henrichs, S. M.: Surface-film microheterotrophs: amino acid metabolism and solar radiation effects on their activities, Mar. Biol., 85, 13–22, 1985.
Catalá, T. S., Reche, I., Fuentes-Lema, A., Romera-Castillo, C., Nieto-Cid, M., Ortega-Retuerta, E., Calvo, E., Álvarez, M., Marrasé, C., Stedmon, C. A., and Álvarez-Salgado, X. A.: Turnover time of fluorescent dissolved organic matter in the dark global ocean, Nat. Commun., 6, 5986, https://doi.org/10.1038/ncomms6986, 2015.
Cawley, K. M., Ding, Y., Fourqurean, J., and Jaffé, R.: Characterising the sources and fate of dissolved organic matter in Shark Bay, Australia: a preliminary study using optical properties and stable carbon isotopes, Mar. Freshwater Res., 63, 1098–1107, https://doi.org/10.1071/MF12028, 2012.
Chari, N. V. H. K., Keerthi, S., Sarma, N. S., Pandi, S. R., Chiranjeevulu, G., Kiran, R., and Koduru, U.: Fluorescence and absorption characteristics of dissolved organic matter excreted by phytoplankton species of western Bay of Bengal under axenic laboratory condition, J. Exp. Mar. Biol. Ecol., 445, 148–155, https://doi.org/10.1016/j.jembe.2013.03.015, 2013.
Chen, M., Jung, J., Lee, Y. K., and Hur, J.: Surface accumulation of low molecular weight dissolved organic matter in surface waters and horizontal off-shelf spreading of nutrients and humic-like fluorescence in the Chukchi Sea of the Arctic Ocean, Sci. Total Environ., 639, 624–632, https://doi.org/10.1016/j.scitotenv.2018.05.205, 2018.
Clarke, K. R.: Non-parametric multivariate analyses of changes in community structure, Aust. J. Ecol., 18, 117–143, https://doi.org/10.1111/j.1442-9993.1993.tb00438.x, 1993.
Clayton, S., Neeley, A., Poulton, N., Brownlee, E., Corrales, M., Dugenne, M., Henrichs, D., Kavanaugh, M., Kenitz, K., Koester, J., Kramer, S., Lubelczyk, L., McFarland, M., Rühl, S., Sosik, H., Stresser, S., White, A., Wollschläger, J., and Wright-Fairbanks, L.: Operational Phytoplankton Observations Best Practices: A guide for using imaging technologies for routine monitoring of phytoplankton communities, OCB Operational Phytoplankton Observations Working Group, https://doi.org/10.25607/OBP-2059, 2026.
Coble, P. G.: Characterization of marine and terrestrial DOM in seawater using excitation-emission matrix spectroscopy, Mar. Chem., 51, 325–346, https://doi.org/10.1016/0304-4203(95)00062-3, 1996.
Coble, P. G.: Marine Optical Biogeochemistry: The Chemistry of Ocean Color, American Chemical Society, 38, 402–418, https://doi.org/10.1002/chin.200720265, 2007.
Coble, P. G.: Colored dissolved organic matter in seawater, in: Subsea Optics and Imaging, edited by: Watson, J. and Zielinski, O., Woodhead Publishing, Cambridge, 98–118, https://doi.org/10.1533/9780857093523.2.98, 2013.
Coble, P. G., Del Castillo, C. E., and Avril, B.: Distribution and optical properties of CDOM in the Arabian Sea during the 1995 Southwest Monsoon, Deep-Sea Res. Pt. II, 45, 2195–2223, https://doi.org/10.1016/S0967-0645(98)00068-X, 1998.
Ćosović, B. and Vojvodic, V.: Direct determination of surface active substances in natural waters, Mar. Chem., 22, 363–373, https://doi.org/10.1016/0304-4203(87)90020-X, 1987.
Cunliffe, M. and Wurl, O. (Eds.): Guide to best practices to study the ocean's surface, International Council for Science, Scientific Committee on Oceanic Research (SCOR), 118 pp., https://repository.oceanbestpractices.org/items/687356f1-381f-40ef-adc5-b4253c4769ba (last access: 26 May 2026), 2014.
Cunliffe, M., Engel, A., Frka, S., Gašparoviæ, B., Guitart, C., Murrell, J. C., Salter, M., Stolle, C., Upstill-Goddard, R. C., and Wurl, O.: Sea surface microlayers: A unified physicochemical and biological perspective of the air–ocean interface, Prog. Oceanogr., 109, 104–116, https://doi.org/10.1016/j.pocean.2012.08.004, 2013.
DeHaan, H.: Solar UV-light penetration and photodegradation of humic substances in peaty lake water, Limnol. Oceanogr., 38, 1072–1076, 1993.
Dittmar, T. and Stubbins, A.: Dissolved Organic Matter in Aquatic Systems, in: Treatise on Geochemistry, edited by: Holland, H. D. and Turekian, K. K., Elsevier, 125–156, https://doi.org/10.1016/B978-0-08-095975-7.01010-X, 2014.
Dragcevic, D. and Pravdic, V.: Properties of the seawater-air interface. 2. Rates of surface film formation under steady state conditions1, Limnol. Oceanogr., 26, 492–499, https://doi.org/10.4319/lo.1981.26.3.0492, 1981.
Drozdowska, V., Freda, W., Baszanowska, E., RudŸ, K., Darecki, M., Heldt, J. R., and Toczek, H.: Spectral properties of natural and oil polluted Baltic seawater – results of measurements and modelling, Eur. Phys. J. Spec. Top., 222, 2157–2170, https://doi.org/10.1140/epjst/e2013-01992-x, 2013.
Drozdowska, V., Wrobel, I., Markuszewski, P., Makuch, P., Raczkowska, A., and Kowalczuk, P.: Study on organic matter fractions in the surface microlayer in the Baltic Sea by spectrophotometric and spectrofluorometric methods, Ocean Sci., 13, 633–647, https://doi.org/10.5194/os-13-633-2017, 2017.
Eder, A., Weigelhofer, G., Pucher, M., Tiefenbacher, A., Strauss, P., Brandl, M., and Blöschl, G.: Pathways and composition of dissolved organic carbon in a small agricultural catchment during base flow conditions, Ecohydrology & Hydrobiology, 22, 96–112, https://doi.org/10.1016/j.ecohyd.2021.07.012, 2022.
Efron, B.: Bootstrap Methods: Another Look at the Jackknife, in: Breakthroughs in Statistics, edited by: Kotz, S., Springer-Verlag New York, https://doi.org/10.1214/aos/1176344552, 1979.
Engel, A., Bange, H. W., Cunliffe, M., Burrows, S. M., Friedrichs, G., Galgani, L., Herrmann, H., Hertkorn, N., Johnson, M., Liss, P. S., Quinn, P. K., Schartau, M., Soloviev, A., Stolle, C., Upstill-Goddard, R. C., van Pinxteren, M., and Zäncker, B.: The Ocean's Vital Skin: Toward an Integrated Understanding of the Sea Surface Microlayer, Front. Mar. Sci., 4, https://doi.org/10.3389/fmars.2017.00165, 2017.
Frew, N. M., Nelson, R. K., Mcgillis, W. R., Edson, J. B., Bock, E. J., and Hara, T.: Spatial Variations in Surface Microlayer Surfactants and their Role in Modulating Air-Sea Exchange, Gas Transfer at Water Surfaces, 127, 153–159, https://doi.org/10.1029/GM127p0153, 2002.
Gade, M., Byfield, V., Ermakov, S., Lavrova, O., and Mitnik, L.: Slicks as Indicators for Marine Processes, Oceanog., 26, https://doi.org/10.5670/oceanog.2013.39, 2013.
Galgani, L. and Engel, A.: Changes in optical characteristics of surface microlayers hint to photochemically and microbially mediated DOM turnover in the upwelling region off the coast of Peru, Biogeosciences, 13, 2453–2473, https://doi.org/10.5194/bg-13-2453-2016, 2016.
Gonçalves-Araujo, R., Stedmon, C. A., Heim, B., Dubinenkov, I., Kraberg, A., Moiseev, D., and Bracher, A.: From Fresh to Marine Waters: Characterization and Fate of Dissolved Organic Matter in the Lena River Delta Region, Siberia, Front. Mar. Sci., 2, https://doi.org/10.3389/fmars.2015.00108, 2015.
Hansen, A. M., Kraus, T. E. C., Pellerin, B. A., Fleck, J. A., Downing, B. D., and Bergamaschi, B. A.: Optical properties of dissolved organic matter (DOM): Effects of biological and photolytic degradation, Limnol. Oceanogr., 61, 1015–1032, https://doi.org/10.1002/lno.10270, 2016.
Hardy, J. T.: The Sea Surface Microlayer: Biology, Chemistry and Anthropogenic Enrichment, Prog. Oceanogr., 11, 307–328, 1982.
Hardy, J. T.: Biological effects of chemicals in the sea-surface microlayer, in: The Sea Surface and Global Change, edited by: Liss, P. S. and Duce, R. A., Cambridge University Press, 339–370, https://doi.org/10.1017/CBO9780511525025.012, 2009.
Hardy, J. T. and Apts, C. W.: The sea-surface microlayer: phytoneuston productivity and effects of atmospheric particulate matter, Mar. Biol., 82, 293–300, https://doi.org/10.1007/BF00392409, 1984.
Harris, N. A., Sorensen, J. P. R., Marchant, B., Old, G. H., Naden, P. S., Bowes, M. J., Scarlett, P. M., Nicholls, D. J. E., Armstrong, L. K., Wickham, H. D., Read, D. S., Lapworth, D., Bond, T., and Pond, K.: Temporal drivers of tryptophan-like fluorescent dissolved organic matter along a river continuum, Sci. Total Environ., 928, https://doi.org/10.1016/j.scitotenv.2024.172285, 2024.
Helms, J. R., Stubbins, A., Ritchie, J. D., Minor, E. C., Kieber, D. J., and Mopper, K.: Absorption spectral slopes and slope ratios as indicators of molecular weight, source, and photobleaching of chromophoric dissolved organic matter, Limnol. Oceanogr., 53, 955–969, https://doi.org/10.4319/lo.2008.53.3.0955, 2008.
Huguet, A., Vacher, L., Relexans, S., Saubusse, S., Froidefond, J. M., and Parlanti, E.: Properties of fluorescent dissolved organic matter in the Gironde Estuary, Org. Geochem., 40, 706–719, https://doi.org/10.1016/j.orggeochem.2009.03.002, 2009.
Hunter, K. A.: Chemistry of the sea-surface microlayer, in: The Sea Surface and Global Change, edited by: Liss, P. S. and Duce, R. A., Cambridge University Press, 287–320, https://doi.org/10.1017/CBO9780511525025.010, 2009.
Jaeger, L., Gassen, L., Ayim, S. M., Bibi, R., and Wurl, O.: Thermal Recovery Dynamics of the Ocean's Cool-Skin Layer After Complete Mixing, Tellus A, 77, https://doi.org/10.16993/tellusa.4103, 2025.
Jibaja Valderrama, O., Scheres Firak, D., Schaefer, T., van Pinxteren, M., Fomba, K. W., and Herrmann, H.: Photochemistry of the sea-surface microlayer (SML) influenced by a phytoplankton bloom: a mesocosm study, Biogeosciences, 23, 1965–1985, https://doi.org/10.5194/bg-23-1965-2026, 2026.
Kieber, D. J., McDaniel, J., and Mopper, K.: Photochemical source of biological substrates in sea water: implications for carbon cycling, Nature, 341, 637–639, https://doi.org/10.1038/341637a0, 1989.
Kim, J., Kim, Y., Park, S. E., Kim, T.-H., Kim, B.-G., Kang, D.-J., and Rho, T.: Impact of aquaculture on distribution of dissolved organic matter in coastal Jeju Island, Korea, based on absorption and fluorescence spectroscopy, Environ. Sci. Pollut. Res., 29, 553–563, https://doi.org/10.1007/s11356-021-15553-3, 2022.
Kirk, J. T. O.: Light and Photosyntesis in aquatic Ecosystems, 3rd ed., Cambridge University Press, The Edinburgh Building, Cambridge CB2 8RU, UK, 665 pp., ISBN 978-0-521-15175-7, 1983.
Kothawala, D. N., Murphy, K. R., Stedmon, C. A., Weyhenmeyer, G. A., and Tranvik, L. J.: Inner filter correction of dissolved organic matter fluorescence, Limnology & Ocean Methods, 11, 616–630, https://doi.org/10.4319/lom.2013.11.616, 2013.
Kowalczuk, P., Tilstone, G. H., Zabłocka, M., Röttgers, R., and Thomas, R.: Composition of dissolved organic matter along an Atlantic Meridional Transect from fluorescence spectroscopy and Parallel Factor Analysis, Mar. Chem., 157, 170–184, https://doi.org/10.1016/j.marchem.2013.10.004, 2013.
Lawaetz, A. J. and Stedmon, C. A.: Fluorescence intensity calibration using the Raman scatter peak of water, Appl. Spectrosc., 63, 936–40, https://doi.org/10.1366/000370209788964548, 2009.
Liebezeit, G., Thomas, K., and Beate, E.: Bulk chemical characterization of particulate material from the Jade Bay, Lower Saxonian Wadden Sea, Netherlands Journal of Aquatic Ecology, 28, 365–370, https://doi.org/10.1007/BF02334206, 1994.
Lilliefors, H. W.: On the Kolmogorov-Smirnov Test for Normality with Mean and Variance Unknown, J. Am. Stat. Assoc., 62, 399–402, 1967.
Liss, P. S. and Duce, R. A. (Eds.): The Sea Surface and Global Change, Cambridge University Press, https://doi.org/10.1017/CBO9780511525025, 2009.
Lønborg, C., Álvarez-Salgado, X. A., Davidson, K., Martínez-García, S., and Teira, E.: Assessing the microbial bioavailability and degradation rate constants of dissolved organic matter by fluorescence spectroscopy in the coastal upwelling system of the Ría de Vigo, Mar. Chem., 119, 121–129, https://doi.org/10.1016/j.marchem.2010.02.001, 2010.
Marcé, R., Verdura, L., and Leung, N.: Dissolved organic matter spectroscopy reveals a hot spot of organic matter changes at the river–reservoir boundary, Aquat. Sci., 83, 67, https://doi.org/10.1007/s00027-021-00823-6, 2021.
Mason, J. D., Cone, M. T., and Fry, E. S.: Ultraviolet (250–550 nm) absorption spectrum of pure water, Appl. Opt., 55, 7163, https://doi.org/10.1364/AO.55.007163, 2016.
McCarthy, M. D., Hedges, J. I., and Benner, R.: The chemical composition of dissolved organic matter in seawater, Chem. Geol., 107, 503–507, https://doi.org/10.1016/0009-2541(93)90240-J, 1993.
Miranda, M. L., Mustaffa, N. I. H., Robinson, T. B., Stolle, C., Ribas-Ribas, M., Wurl, O., and Zielinski, O.: Influence of solar radiation on biogeochemical parameters and fluorescent dissolved organic matter (FDOM) in the sea surface microlayer of the southern coastal North Sea, Elem. Sci. Anth., 6, 15, https://online.ucpress.edu/elementa/article/doi/10.1525/elementa.278/112808/Influence-of-solar-radiation-on-biogeochemical?searchresult=1 (last access: 26 May 2026), 2018.
Moran, M. A. and Zepp, R. G.: Role of photoreactions in the formation of biologically labile compounds from dissolved organic matter, Limnol. Oceanogr., 42, 1307–1316, https://doi.org/10.4319/lo.1997.42.6.1307, 1997.
Murphy, K. R., Stedmon, C. A., Graeber, D., and Bro, R.: Fluorescence spectroscopy and multi-way techniques. PARAFAC, Anal. Methods, 5, 6557, https://doi.org/10.1039/c3ay41160e, 2013.
Murphy, K. R., Stedmon, C. A., Wenig, P., and Bro, R.: OpenFluor- an online spectral library of auto-fluorescence by organic compounds in the environment, Anal. Methods, 6, 658–661, https://doi.org/10.1039/C3AY41935E, 2014.
Mustaffa, N. I. H., Kallajoki, L., Hillebrand, H., Wurl, O., and Striebel, M.: Sea surface phytoplankton community response to nutrient and light changes, Mar. Biol., 167, https://doi.org/10.1007/s00227-020-03738-2, 2020.
Nelson, N. B. and Siegel, D. A.: The Global Distribution and Dynamics of Chromophoric Dissolved Organic Matter, Annu. Rev. Mar. Sci., 5, 447–76, https://doi.org/10.1146/annurev-marine-120710-100751, 2013.
Nieto-Cid, M., Álvarez-Salgado, X. A., and Pérez, F. F.: Microbial and photochemical reactivity of fluorescent dissolved organic matter in a coastal upwelling system, Limnol. Oceanogr., 51, 1391–1400, 2006.
Obernosterer, I., Catala, P., Reinthaler, T., Herndl, G. J., and Lebaron, P.: Enhanced heterotrophic activity in the surface microlayer of the Mediterranean Sea, Aquat. Microb. Ecol., 39, 293–302, https://doi.org/10.3354/ame039293, 2005.
OpenAI: ChatGPT (GPT-5) [Large language model], https://chatgpt.com/ (last access: 3 May 2026), 2025.
Osburn, C. L. and Stedmon, C. A.: Linking the chemical and optical properties of dissolved organic matter in the Baltic–North Sea transition zone to differentiate three allochthonous inputs, Mar. Chem., 126, 281–294, https://doi.org/10.1016/j.marchem.2011.06.007, 2011.
Parker, C. A. and Rees, W. T.: Fluorescence Spectrometry: A Review, Analyst, 87, 83–111, https://doi.org/10.1039/AN9628700083, 1962.
Pereira, R., Ashton, I., Sabbaghzadeh, B., Shutler, J. D., and Upstill-Goddard, R. C.: Reduced air–sea CO2 exchange in the Atlantic Ocean due to biological surfactants, Nat. Geosci., 11, 492–496, https://doi.org/10.1038/s41561-018-0136-2, 2018.
Peuravuori, J. and Pihlaja, K.: Molecular size distribution and spectroscopic properties of aquatic humic substances, Anal. Chim. Acta, 337, 133–149, https://doi.org/10.1016/S0003-2670(96)00412-6, 1997.
Pinheiro, J. C. and Bates, D. M.: Fitting Nonlinear Mixed-Effect Models, in: Mixed-Effects Models in Sand S-PLUS. Statistics and Computing, Springer, New York, NY, https://doi.org/10.1007/0-387-22747-4_8, 2000.
Rauch, C., Deyle, L., Jaeger, L., Cortés-Espinoza, E. F., Ribas-Ribas, M., Karnatz, J., Engel, A., and Wurl, O.: Phytoplankton blooms affect microscale differences of oxygen and temperature across the sea surface microlayer, Ocean Sci., 22, 403–426, https://doi.org/10.5194/os-22-403-2026, 2026.
Reinthaler, T., Sintes, E., and Herndl, G. J.: Dissolved organic matter and bacterial production and respiration in the sea-surface microlayer of the open Atlantic and the western Mediterranean Sea, Limnol. Oceanogr., 53, 122–136, https://doi.org/10.4319/lo.2008.53.1.0122, 2008.
Repetea, D. and Aluwihare, L.: Chemical characterization and cycling of dissolved organic matter, in: Biogeochemistry of Marine Dissolved Organic Matter, edited by: Hansell, D. A. and Carlson, C. A., Elsevier, https://doi.org/10.1016/B978-0-443-13858-4.00011-3, 2024.
Retelletti Brogi, S., Ha, S.-Y., Kim, K., Derrien, M., Lee, Y. K., and Hur, J.: Optical and molecular characterization of dissolved organic matter (DOM) in the Arctic ice core and the underlying seawater (Cambridge Bay, Canada): Implication for increased autochthonous DOM during ice melting, Sci. Total Environ., 627, 802–811, https://doi.org/10.1016/j.scitotenv.2018.01.251, 2018.
Retelletti Brogi, S., Charrière, B., Gonnelli, M., Vaultier, F., Sempéré, R., Vestri, S., and Santinelli, C.: Effect of UV and Visible Radiation on Optical Properties of Chromophoric Dissolved Organic Matter Released by Emiliania huxleyi, JMSE, 8, 888, https://doi.org/10.3390/jmse8110888, 2020.
Rickard, P. C., Uher, G., and Upstill-Goddard, R. C.: Photo-Reactivity of Surfactants in the Sea-Surface Microlayer and Subsurface Water of the Tyne Estuary, UK, Geophys. Res. Lett., 49, https://doi.org/10.1029/2021GL095469, 2022.
Rochelle-Newall, E., Delille, B., Frankignoulle, M., Gattuso, J. P., Jacquet, S., Riebesell, U., Terbruggen, A., and Zondervan, I.: Chromophoric dissolved organic matter in experimental mesocosms maintained under different pCO2 levels, Mar. Ecol. Prog. Ser., 272, 25–31, https://doi.org/10.3354/meps272025, 2004.
Roesler, C. S. and Barnard, A. H.: Optical proxy for phytoplankton biomass in the absence of photophysiology: Rethinking the absorption line height, Methods in Oceanography, 7, 79–94, https://doi.org/10.1016/j.mio.2013.12.003, 2013.
Romera-Castillo, C., Sarmento, H., Álvarez-Salgado, X. A., Gasol, J. M., and Marrasé, C.: Production of chromophoric dissolved organic matter by marine phytoplankton, Limnol. Oceanogr., 55, 1466–1466, https://doi.org/10.4319/lo.2010.55.3.1466, 2010.
Röttgers, R., Doxaran, D., and Dupouy, C.: Quantitative filter technique measurements of spectral light absorption by aquatic particles using a portable integrating cavity absorption meter (QFT-ICAM), Opt. Express, 24, 1–20, https://doi.org/10.1364/OE.24.0000A1, 2016.
Röttgers, R., Novak, M. G., and Belz, M.: Measurement of light absorption by chromophoric dissolved organic matter using a type-II liquid capillary waveguide: assessment of an achievable accuracy, Appl. Opt., 63, 3811–3824, https://doi.org/10.1364/AO.516580, 2024.
Sabbaghzadeh, B., Upstill-Goddard, R. C., Beale, R., Pereira, R., and Nightingale, P. D.: The Atlantic Ocean surface microlayer from 50° N to 50° S is ubiquitously enriched in surfactants at wind speeds up to 13 m s−1, Geophys. Res. Lett., 44, 2852–2858, https://doi.org/10.1002/2017GL072988, 2017.
Shutova, Y., Baker, A., Bridgeman, J., and Henderson, R. K.: Spectroscopic characterisation of dissolved organic matter changes in drinking water treatment: From PARAFAC analysis to online monitoring wavelengths, Water Res., 54, 159–169, https://doi.org/10.1016/j.watres.2014.01.053, 2014.
Smith, D. J. and Underwood, G. J. C.: The production of extracellular carbohydrates by estuarine benthic diatoms: the effects of growth phase and light and dark treatment, J. Phycol., 36, 321–333, https://doi.org/10.1046/j.1529-8817.2000.99148.x, 2000.
Stedmon, C. A. and Bro, R.: Characterizing dissolved organic matter fluorescence with parallel factor analysis: a tutorial, Limnology & Ocean Methods, 6, 572–579, https://doi.org/10.4319/lom.2008.6.572, 2008.
Stedmon, C. A. and Markager, S.: Tracing the production and degradation of autochthonous fractions of dissolved organic matter by fluorescence analysis, Limnol. Oceanogr., 50, 1415–1426, https://doi.org/10.4319/lo.2005.50.5.1415, 2005.
Stramski, D., Reynolds, R. A., Gernez, P., Röttgers, R., and Wurl, O.: Inherent optical properties and particle characteristics of the sea-surface microlayer, Prog. Oceanogr., 176, 102117, https://doi.org/10.1016/j.pocean.2019.05.009, 2019.
Summers, R. S., Cornel, P. K., and Roberts, P. V.: Molecular size distribution and spectroscopic characterization of humic substances, Sci. Total Environ., 62, 27–37, https://doi.org/10.1016/0048-9697(87)90478-5, 1987.
Thölen, C., Wollschläger, J., Novak, M., Röttgers, R., and Zielinski, O.: Colored dissolved organic matter (CDOM) absorption coefficients in the sea-surface microlayer and the underlying water during a mesocosm phytoplankton bloom in 2023, PANGAEA [data set], https://doi.org/10.1594/PANGAEA.987974, 2026a.
Thölen, C., Wollschläger, J., Novak, M., Röttgers, R., and Zielinski, O.: PARAFAC components and fluorescent dissolved organic matter (FDOM) indices on organic matter transformation processes in the sea-surface microlayer and the underlying water during a mesocosm phytoplankton bloom in 2023, PANGAEA [data set], https://doi.org/10.1594/PANGAEA.988058, 2026b.
Thornton, D. C. O.: Dissolved organic matter (DOM) release by phytoplankton in the contemporary and future ocean, Eur. J. Phycol., 49, 20–46, https://doi.org/10.1080/09670262.2013.875596, 2014.
Tilstone, G. H., Airs, R. L., Martinez-Vicente, V., Widdicombe, C., and Llewellyn, C.: High concentrations of mycosporine-like amino acids and colored dissolved organic matter in the sea surface microlayer off the Iberian Peninsula. Limnol. Oceanogr., 55, 2010, 1835–1850, https://doi.org/10.4319/lo.2010.55.5.1835, 2010.
Van Beusekom, J. E. E., Buschbaum, C., and Reise, K.: Wadden Sea tidal basins and the mediating role of the North Sea in ecological processes: scaling up of management?, Ocean Coast. Manage., 68, 69–78, https://doi.org/10.1016/j.ocecoaman.2012.05.002, 2012.
van Pinxteren, M., Barthel, S., Fomba, K. W., Müller, K., Von Tümpling, W., and Herrmann, H.: The influence of environmental drivers on the enrichment of organic carbon in the sea surface microlayer and in submicron aerosol particles – measurements from the Atlantic Ocean, Elementa: Science of the Anthropocene, 5, 35, https://doi.org/10.1525/elementa.225, 2017.
Weishaar, J. L., Aiken, G. R., Bergamaschi, B. A., Fram, M. S., Fujii, R., and Mopper, K.: Evaluation of specific ultraviolet absorbance as an indicator of the chemical composition and reactivity of dissolved organic carbon, Environ. Sci. Technol., 37, 4702–8, https://doi.org/10.1021/es030360x, 2003.
Wilson, T. W., Ladino, L. A., Alpert, P. A., Breckels, M. N., Brooks, I. M., Browse, J., Burrows, S. M., Carslaw, K. S., Huffman, J. A., Judd, C., Kilthau, W. P., Mason, R. H., McFiggans, G., Miller, L. A., Nájera, J. J., Polishchuk, E., Rae, S., Schiller, C. L., Si, M., Temprado, J. V., Whale, T. F., Wong, J. P. S., Wurl, O., Yakobi-Hancock, J. D., Abbatt, J. P. D., Aller, J. Y., Bertram, A. K., Knopf, D. A., and Murray, B. J.: A marine biogenic source of atmospheric ice-nucleating particles, Nature, 525, 234–238, https://doi.org/10.1038/nature14986, 2015.
Wollschläger, J., Röttgers, R., Petersen, W., and Wiltshire, K. H.: Performance of absorption coefficient measurements for the in situ determination of chlorophyll-a and total suspended matter, J. Exp. Mar. Biol. Ecol., 453, 138–147, https://doi.org/10.1016/j.jembe.2014.01.011, 2014.
Wurl, O., Miller, L., Röttgers, R., and Vagle, S.: The distribution and fate of surface-active substances in the sea-surface microlayer and water column, Mar. Chem., 115, 1–9, https://doi.org/10.1016/j.marchem.2009.04.007, 2009.
Wurl, O., Miller, L., and Vagle, S.: Production and fate of transparent exopolymer particles in the ocean, J. Geophys. Res., 116, https://doi.org/10.1029/2011JC007342, 2011.
Wurl, O., Stolle, C., van Thuoc, C., The Thu, P., and Mari, X.: Biofilm-like properties of the sea surface and predicted effects on air–sea CO2 exchange, Prog. Oceanogr., 144, 15–24, https://doi.org/10.1016/j.pocean.2016.03.002, 2016.
Wurl, O., Ekau, W., Landing, W. M., and Zappa, C. J.: Sea surface microlayer in a changing ocean – A perspective, Elementa: Science of the Anthropocene, 5, https://doi.org/10.1525/elementa.228, 2017.
Wurl, O., Bird, K., Cunliffe, M., Landing, W. M., Miller, U., Mustaffa, N. I. H., Ribas-Ribas, M., Witte, C., and Zappa, C. J.: Warming and Inhibition of Salinization at the Ocean's Surface by Cyanobacteria, Geophys. Res. Lett., 45, 4230–4237, https://doi.org/10.1029/2018GL077946, 2018.
Yan, C., Sheng, Y., Ju, M., Ding, C., Li, Q., Luo, Z., Ding, M., and Nie, M.: Relationship between the characterization of natural colloids and metal elements in surface waters, Environ. Sci. Pollut. Res., 27, 31872–31883, https://doi.org/10.1007/s11356-020-09500-x, 2020.
Yang, L., Zhang, J., Engel, A., and Yang, G.-P.: Spatio-temporal distribution, photoreactivity and environmental control of dissolved organic matter in the sea-surface microlayer of the eastern marginal seas of China, Biogeosciences, 19, 5251–5268, https://doi.org/10.5194/bg-19-5251-2022, 2022.
Zäncker, B., Bracher, A., Röttgers, R., and Engel, A.: Variations of the Organic Matter Composition in the Sea Surface Microlayer: A Comparison between Open Ocean, Coastal, and Upwelling Sites Off the Peruvian Coast, Front. Microbiol., 8, 2369, https://doi.org/10.3389/fmicb.2017.02369, 2017.
Zepp, R. G., Callaghan, T. V., and Erickson, D. J.: Effects of enhanced solar ultraviolet radiation on biogeochemical cycles, J. Photoch. Photobio. B, 46, 69–82, https://doi.org/10.1016/S1011-1344(98)00186-9, 1998.
Zöbelein, J., Dittmar, T., and Waska, H.: Spatial and temporal dynamics of dissolved organic matter in the sea surface microlayer during a bloom of coccolithophores, EGU General Assembly 2025, Vienna, Austria, 27 Apr–2 May 2025, EGU25-19728, https://doi.org/10.5194/egusphere-egu25-19728, 2025.
Zöbelein, J., Sawle, S., Friedrichs, G., Ribas-Ribas, M., Lehners, C., Paetz, K., Pflaum, M., and Waska, H.: Buoyancy and polarity driven accumulation of dissolved organic matter in the sea surface microlayer during a phytoplankton bloom, EGUsphere [preprint], https://doi.org/10.5194/egusphere-2025-6563, 2026.
Zsolnay, A., Baigar, E., Jimenez, M., Steinweg, B., and Saccomandi, F.: Differentiating with fluorescence spectroscopy the sources of dissolved organic matter in soils subjected to drying, Chemosphere, 38, 45–50, 1999.