
the Creative Commons Attribution 4.0 License.
the Creative Commons Attribution 4.0 License.
 | 02 Oct 2026
Quantifying aggregation bias in marsh carbon flux estimates caused by rhizosphere oxygen heterogeneity
Youssef Saadaoui

Christian Beer
Peter Mueller
Friederike Neiske
Joscha N. Becker
Annette Eschenbach
Philipp Porada
Oxygen (O2) in marsh rhizospheres varies strongly at millimetre scales due to radial oxygen loss (ROL), re-oxidation of reduced compounds, hydrology, and sediment structure. Yet many models estimate heterotrophic (microbial) respiration at a single mean O2, which can bias CO2 fluxes because the O2 response of respiration is curved (nonlinear). We calibrated an enzyme kinetic respiration function to marsh-soil incubations, then compared (I) respiration evaluated at a single mean O2 value with (II) the mean of different respiration fluxes over a prescribed rhizosphere O2 distribution. To isolate oxygen effects, temperature and the relation between substrate and soil moisture were held fixed; incubations were used only to calibrate carbon kinetics. For a gas-phase, air-equivalent O2 proxy, the single mean approach overestimates respiration by ∼ 12 % on average. This bias increases with increasing variation of O2 and with the ratio of mean O2 to the O2 half-saturation constant . In the dissolved phase, mean O2 ≪ and variation in O2 is small, so the bias is negligible due to linear behaviour of the relation in these conditions; when physiology is unit-matched to a similar relative saturation, however, the dissolved case shows a negative bias comparable to the gas-phase one. Our findings suggest reporting the mean and variation of O2 together with a calibrated allows modellers to anticipate or correct the bias associated with replacing heterogeneous rhizosphere conditions with a single mean.
- Article
(1567 KB) - Full-text XML
- BibTeX
- EndNote


Marsh soils are major coastal carbon reservoirs where high primary production and efficient sediment trapping coincide with comparatively slow decomposition (Barbier et al., 2011; Duarte et al., 2013; Granse et al., 2024; Kirwan et al., 2016). Whether these systems store or release carbon depends not only on mean environmental conditions but also on the availability of oxygen (O2) to microbes in the rhizosphere, which regulates aerobic heterotrophic respiration.
Rhizosphere O2 is inherently patchy at millimetre scales. Radial oxygen loss (ROL) from roots varies across species and genotypes and with plant status (growth stage, stress), while aerenchyma formation and barriers to ROL modulate internal gas pathways. Hydrologic dynamics, such as tidal flooding and drainage, platform elevation, and episodic drying interact with sediment texture to shape air-filled porosity and diffusion pathways. O2 that enters the root zone is, in addition, consumed by the re-oxidation of reduced compounds such as dissolved sulfide, iron sulfides and ammonium, which competes with aerobic respiration for O2 and confines oxic zones to the immediate vicinity of root surfaces (Howes and Teal, 1994; Koop-Jakobsen et al., 2017). In situ microelectrode and optical measurements consistently show steep radial O2 gradients around roots and strong small scale variability within and across root neighbourhoods (Kühl et al., 2021; Mueller et al., 2016; Van der Nat and Middelburg, 1998; Visser et al., 2000). Thus, microbes experience a mosaic of microhabitats ranging from well oxygenated to effectively anoxic over centimetres or less. In such a setting, the curved, nonlinear shape of the O2 response of respiration may lead to differing estimates depending on the level of aggregation of O2 conditions.
Despite this heterogeneity, many ecosystem and land-surface models represent belowground redox drivers with a single bulk state, for example a mean O2 level or a uniform moisture or redox scalar within a grid cell or plant functional type (Alizad et al., 2016; Kirwan et al., 2016; Morris et al., 2002; Rietl et al., 2021; Swanson et al., 2014; Zhang et al., 2002). Under a concave O2-limitation function (saturating, Michaelis–Menten-type), evaluating respiration at the mean O2 generally differs from averaging respiration across a heterogeneous O2 field, a classic aggregation (upscaling) bias arising from response curvature (Jensen's inequality) (Rastetter et al., 1992). For marsh soils, strong O2 heterogeneity is well documented and concave limitation is physiologically expected, yet the magnitude, direction, and conditions of the resulting bias remain poorly quantified (Bernal et al., 2017; Bhattacharyya and Furtak, 2022; Mueller et al., 2020; Spivak et al., 2019).
Here we quantify the aggregation bias associated with spatially heterogeneous rhizosphere O2, focusing explicitly on aerobic heterotrophic (microbial) respiration in the root zone. While soil respiration includes both autotrophic (root) and heterotrophic (microbial) components, we focus on the heterotrophic component since the aggregation bias arises from the nonlinear O2 limitation of microbial respiration. The drivers of autotrophic respiration, including climatic conditions and plant physiology, are outside our scope. Moreover, we do not model explicitly plant internal gas transport, or pore scale advection-diffusion. Instead, we treat ROL and hydrology as drivers that shape local O2 distributions and ask how that heterogeneity propagates through a standard enzyme kinetic respiration formulation with an explicit O2-limitation term (cf. Davidson et al., 2012 for the general structure). To isolate oxygen effects, we calibrate carbon kinetic parameters to marsh soil incubations and hold temperature and the substrate–moisture linkage fixed.
We represent rhizosphere O2 using two complementary proxies: (I) a gas-phase, air-equivalent proxy that captures aeration via air-filled porosity; and (II) a dissolved-phase proxy derived from Henry's law. For like-for-like comparisons, we also analyse a diagnostic in which the microbial O2 half-saturation constant is unit-matched so that the relative saturation r = mean(O2) equals that of the gas case. We define the uniform baseline in O2 space as f(mean(O2)) (rather than mapping mean moisture to O2), then quantify bias as the difference between this uniform evaluation and the mean of respiration over the full O2 distribution.
We address three questions. (Q1) How large, and in which direction, is the bias when O2 heterogeneity is replaced by a single mean? (Q2) How does the bias scale with relative saturation and with the variance of O2 at fixed mean? (Q3) Under what conditions is the bias negligible, providing a simple rule for when single mean treatments are acceptable? Answering these provides a practical diagnostic for modellers: reporting the mean and variance of O2 together with a prescribed is sufficient to anticipate, and if needed correct, aggregation error in marsh carbon balance models.
2.1 Model overview: DAMM with explicit O2 limitation
We use the DAMM framework (Davidson et al., 2012) in which volumetric aerobic CO2 production Rsx (mg C cm−3 h−1) depends on temperature, soluble-carbon substrate, and oxygen:
Here Corg is bulk organic C (g C cm−3); Sx is the soluble substrate concentration (g C cm−3); O2 is an air-equivalent oxygen proxy expressed as cm3 O2 cm−3; T is absolute temperature (K); α (mg C cm−3 h−1) and Ea (J mol−1) are the pre-exponential factor and the activation energy; KM,S (g C cm−3) and (cm3 O2 cm−3) are half-saturation constants; and Rgas is the universal gas constant. Symbols, units, and baseline values are listed in Table 1.
To isolate O2 effects in the aggregation experiment, soluble carbon is linked to bulk carbon via a fixed moisture proxy:
where p (–) converts bulk to soluble carbon, Dliq (–) scales aqueous availability, and θref is the volumetric water content, used only inside the substrate term (to isolate oxygen effects). The oxygen-limitation term O2 is concave for O2 > 0; this curvature is the source of aggregation bias examined below.
2.2 Incubation medians and calibration
We calibrated α and KM,S against median aerobic respiration rates derived from long-term marsh-soil incubations summarized with a two-pool introductory carbon balance model (ICBM; Andrén and Kätterer, 1997; Beer et al., 2022; Knoblauch et al., 2013). Incubation rates were converted from µmol CO2 g−1 d−1 to mg C cm−3 h−1 using soil bulk density and molar-mass factors. Parameters were estimated by bounded constrained optimization (SQP; MATLAB fmincon) in log 10 space with box constraints, minimizing the RMSE between model predictions and the binned medians, at a fixed reference oxygen O2,ref and a fixed water content θref. The reference oxygen was computed from the gas-phase proxy defined in Sect. 2.3 evaluated at θref. Uncertainty was quantified by non-parametric bootstrap resampling of the (Corg, R) pairs (B = 500). We report 95 % pointwise bands for the calibration curve, confidence intervals for α and KM,S, and the Spearman correlation ρ between log 10α and log 10KM,S.
2.2.1 Incubation experiments
Marsh soils from the Elbe estuary (Germany) were gently sieved to 2 mm. For each incubation, 20 g dry-mass equivalent soil was weighed (wet masses corrected to dry-mass equivalence). The samples were then adjusted to 60 % water-holding capacity and placed in 1000 mL glass flasks. Incubations were conducted in the dark at 20 °C for up to 465 d. At regular intervals, 1 mL headspace samples were withdrawn and analyzed for CO2 by gas chromatography (JAS 6890N, Germany). To maintain aerobic conditions, we kept a slight overpressure and added synthetic air whenever headspace CO2 exceeded 2.5 %, preventing O2 depletion. In the context of our study, these incubations provide aerobic respiration rates across a broad Corg range for Elbe estuary marsh soils; they do not impose or resolve O2 heterogeneity. We use the rates only to calibrate carbon-kinetic parameters; O2 effects are controlled separately in the aggregation analyses (Sect. 2.3 to 2.6).
2.2.2 From CO2 time series to characteristic rates (ICBM fits)
CO2 time series were fit with the two-pool ICBM (fast and slow pools, first-order kinetics, humification from fast to slow) using gradient-descent optimization to estimate pool decay and humification parameters against the gas chromatography data. For each of seven Corg bins, we computed the median CO2 rate (µmol CO2 g−1 d−1), then converted it to mg C cm−3 h−1 as above. These bin medians are the only empirical constraints used to fit α and KM,S at fixed O2,ref and θref, thereby isolating oxygen effects in subsequent experiments.
2.3 Prescribed rhizosphere O2 distributions
We prescribe two rhizosphere O2 drivers and summarize each by its mean and variance.
For the gas-phase proxy (primary analysis), air-filled porosity a is approximated as
where θ is volumetric water content and BD and PD are bulk and particle densities (g cm−3), respectively. Air-equivalent oxygen is then
where Dgas (–) represents effective gas-phase diffusivity and 0.209 the atmospheric O2 mole fraction, which for an ideal gas is numerically equal to its volume fraction. Because Eq. (4) multiplies this fraction by the air-filled porosity, O is an amount of O2 per unit volume of soil (cm3 O2 cm−3), the same unit as . This proxy captures aeration in the rhizosphere and is used for all main analyses.
For the aqueous-phase proxy, dissolved O2 is derived from Henry's law:
where is the diffusivity of O2 in water, written here as a dimensionless scaling factor, consistently with Dgas in Eq. (4), and = Hcp is the Henry's-law equilibrium concentration (mol m−3) at atmospheric partial pressure. This concentration is converted using the molar volume Vm, so that O has units of volume fraction (cm3 O2 cm−3), the same as O. We do not rescale dissolved O2; we retain its native magnitude relative to .
In a diagnostic used for Sect. 3.4 and Appendix A, we keep the dissolved proxy unaltered and instead unit-match the microbial half-saturation so that relative saturation is identical across phases:
This aligns between gas and dissolved cases without artificially rescaling O2.
We map a uniform grid of θ values to O2 using Eqs. (3) to (5) to obtain discrete O2 samples. In the main text we use θ ∈ ; as a high-θ benchmark, we also consider a narrow saturated θ ∈ [0.65,0.68] (both mapped through the same proxy). Each driver is summarized by its first two moments,
which are used later in the Jensen diagnostic.
2.4 Uniform versus heterogeneous experiment (aggregation error)
To isolate the oxygen effect, the substrate Sx is held fixed by evaluating it at a single θref in all runs. For each Corg on a prescribed grid we compute two configurations of the same calibrated DAMM model. Uniform configuration: Runi(Corg) = , where = E[O2] is the arithmetic mean of the imposed O2 distribution. Heterogeneous configuration: Rhet(Corg) = E[f(Corg,O2)], that is, the arithmetic mean of the respiration response over the same O2 distribution, with Corg and θref held fixed.
Aggregation bias (percent) is calculated as
with ϵ = 10−12 mg C cm−3 h−1 used only to avoid division by zero (in practice Runi ≫ ϵ). In the implementation, the expectation E[⋅] is a discrete average over the vector of O2 values obtained by mapping the θ grid through the chosen proxy.
Crucially, the uniform baseline is defined in O2 space as , to avoid baseline reversal when the θ to O2 mapping is nonlinear. Unless stated otherwise, main text analyses use the gas-phase driver; dissolved-phase analyses appear as sensitivity/diagnostics, and where indicated also with unit-matched to equalize relative saturation .
2.5 Dependence on O2 affinity and transport distributions
Since sets the relative O2-saturation regime, we performed a structured variation (multipliers × 0.25, × 0.5, × 1, × 2, × 4) for the gas proxy and for the aqueous proxy with unit-matched . We further summarize bias behaviour on a response surface as a function of mean and the coefficient of variation (CV) using a symmetric two-point distribution at fixed mean (reported in Appendix A).
2.6 Jensen diagnostic (mechanistic check)
To link bias magnitude to heterogeneity directly, we fixed the mean oxygen at μ and constructed symmetric two-point mixtures with values μ − d and μ + d (equal probability; range constrained to positive values) to vary Var[O2] while holding the mean constant. For each variance level we computed Δ from Eq. (8) and compared it to the quadratic approximation implied by the curvature of the O2-limitation term:
where f′′(μ) is the second derivative of f with respect to O2 at fixed Corg and T.
2.7 Implementation details
All analyses were performed with consistent grid resolution for Corg (300 points across 0.001–0.30 g C cm−3). Calibration used bounded least squares; bootstrap size was 500; a fixed random seed was used for reproducibility.
3.1 Model calibration and parameter uncertainty
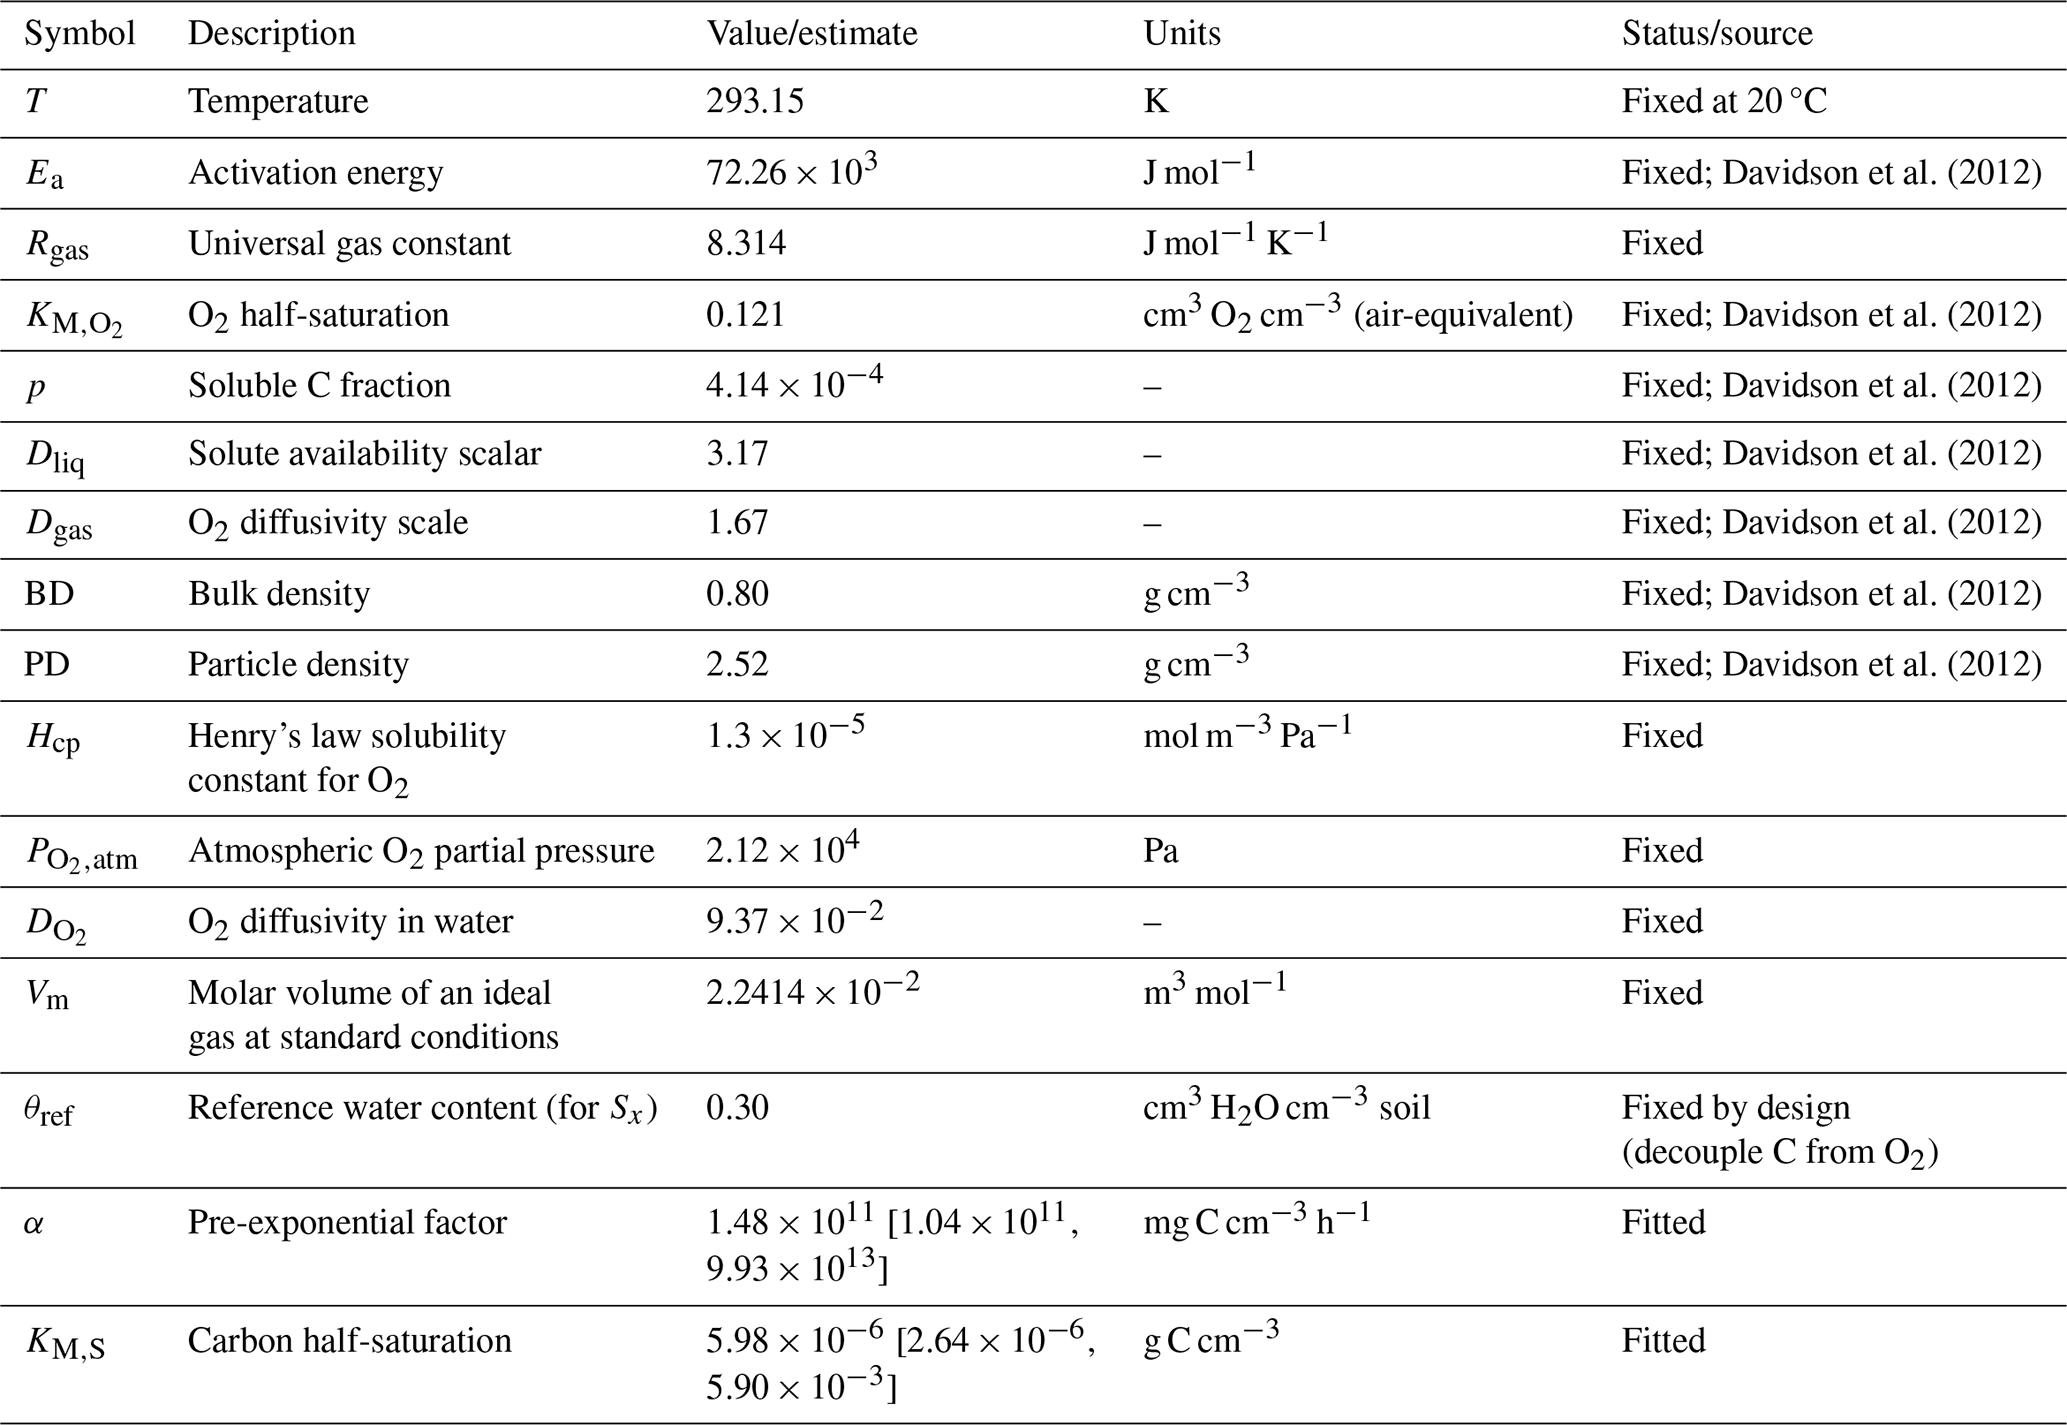
The respiration formulation calibrated well against incubation medians across the observed range of Corg (Fig. 1). Best-fit parameters are α = 1.48 × 10¹¹ mg C cm−3 h−1 (95 % CI: 1.04 × 10¹¹–9.93 × 10¹³) and KM,S = 5.98 × 10⁻⁶ g C cm−3 (RMSE = 6.04 × 10⁻⁴ mg C cm−3 h−1), bootstrap band (B = 500) around the calibration curve widens at high Corg where constraints are sparse. A few medians fall outside the ribbon because it reflects uncertainty in the fitted curve, not confidence intervals on binned medians. Incubations were aerobic at 20 °C and span the observed Corg range; these medians calibrate the carbon-kinetic terms only. In all aggregation experiments, temperature and the substrate–moisture linkage are held fixed to isolate oxygen effects; only the treatment of O2 variability differs.
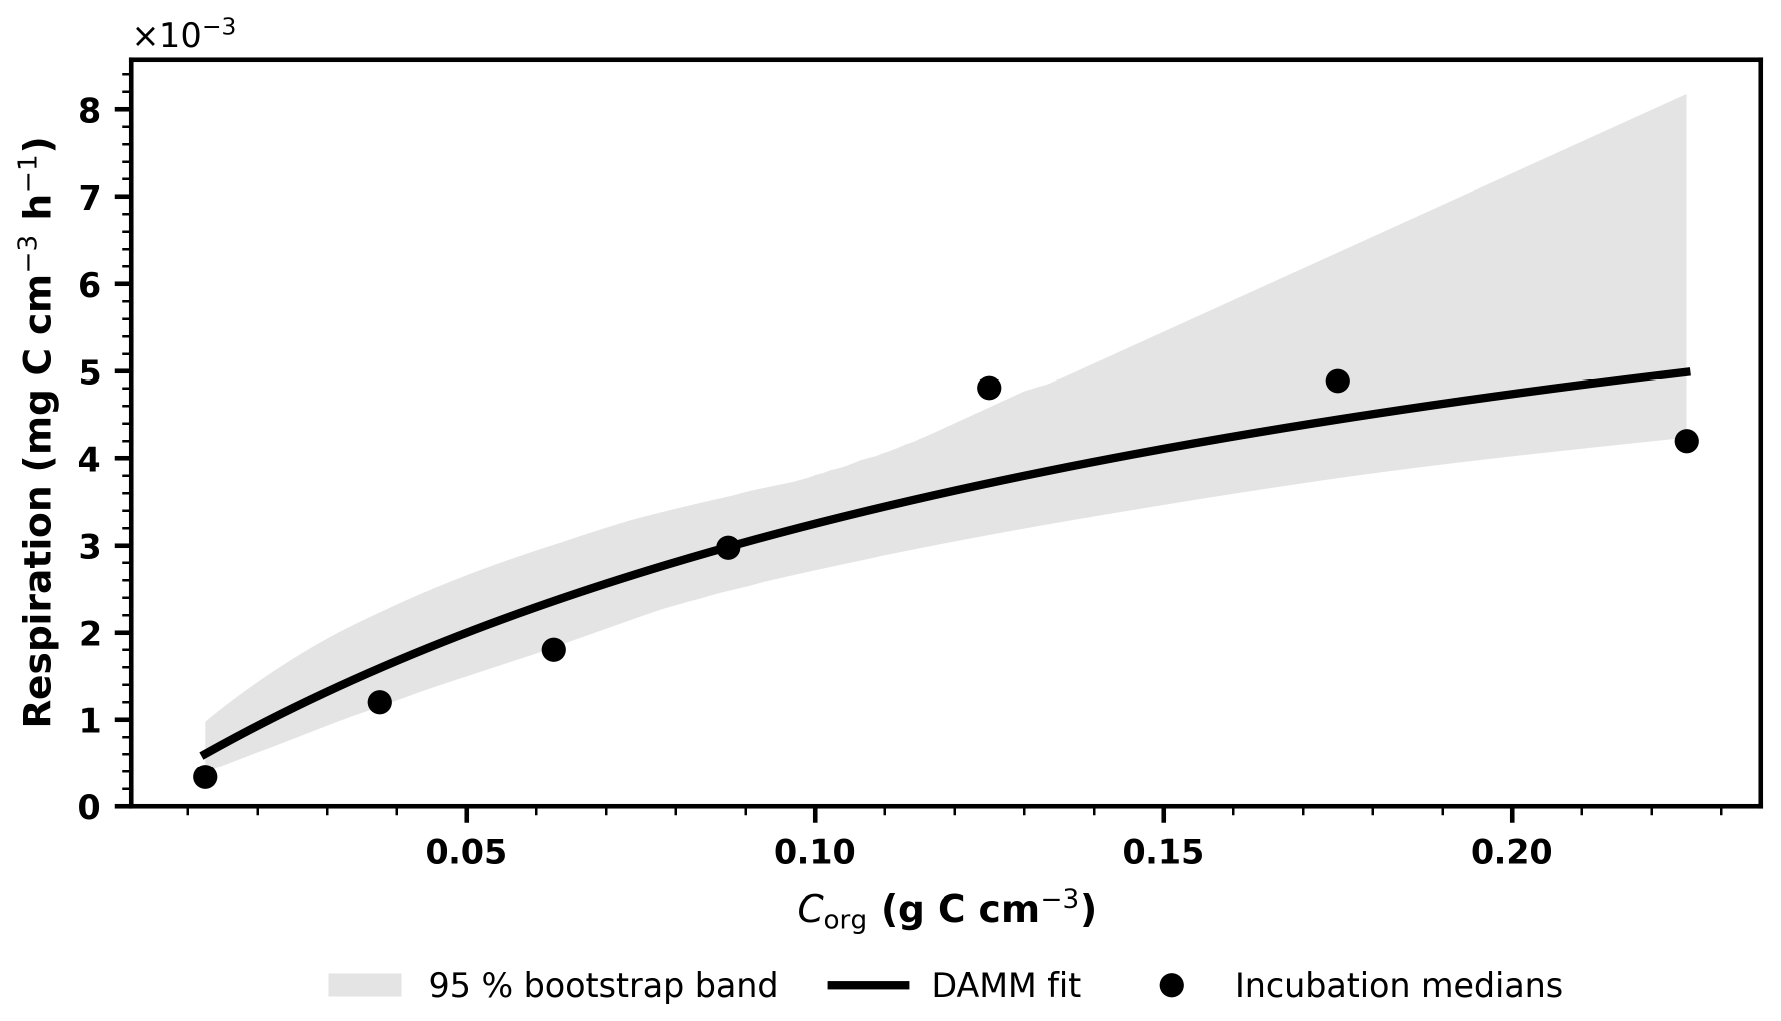
Figure 1Calibration of the DAMM respiration model to incubation-derived respiration medians under aerobic conditions. Points show median rates for seven bins of bulk organic carbon (Corg) obtained from a two-pool ICBM fitted to Elbe estuary incubations (units converted to mg C cm−3 h−1). The solid line is the best DAMM fit evaluated at the air-equivalent O2 corresponding to θref = 0.30; the shaded envelope is the 95 % bootstrap band (B = 500). Best-fit parameters: α = 1.48 × 10¹¹ mg C cm−3 h−1, KM,S = 5.98 × 10⁻⁶ g C cm−3; RMSE = 6.04 × 10⁻⁴ mg C cm−3 h−1. Parameter confidence intervals and provenance are summarized in Table 1.
Table 1Parameters used in the DAMM analyses (fixed and fitted). All constants are baseline values unless noted; fitted parameters carry 95 % bootstrap confidence intervals.
3.2 Rhizosphere O2 distributions
Both prescribed O2 drivers are right-tailed on a log scale (Fig. 2). Because the dissolved proxy is about 450 times smaller in magnitude than the gas proxy, we show them in separate panels to preserve visibility. For the gas-phase proxy [air-equivalent units], the mean and variance are μgas = 0.0891 cm3 O2 cm−3 and Vargas = 3.53 × 10⁻³ (cm3 O2 cm−3)2. For the dissolved proxy [volume fraction], μaq = 1.97 × 10⁻⁴ cm3 O2 cm−3 and Varaq = 1.16 × 10⁻⁸ (cm3 O2 cm−3)2 (Fig. A1). We retain each proxy in its native magnitude (no cross-rescaling) so its position relative to is preserved; these moments are used in the Jensen diagnostic (Sect. 3.5). A high-θ benchmark narrows the gas-phase distribution by mapping θ ∈ [0.65,0.68] through the same proxy.
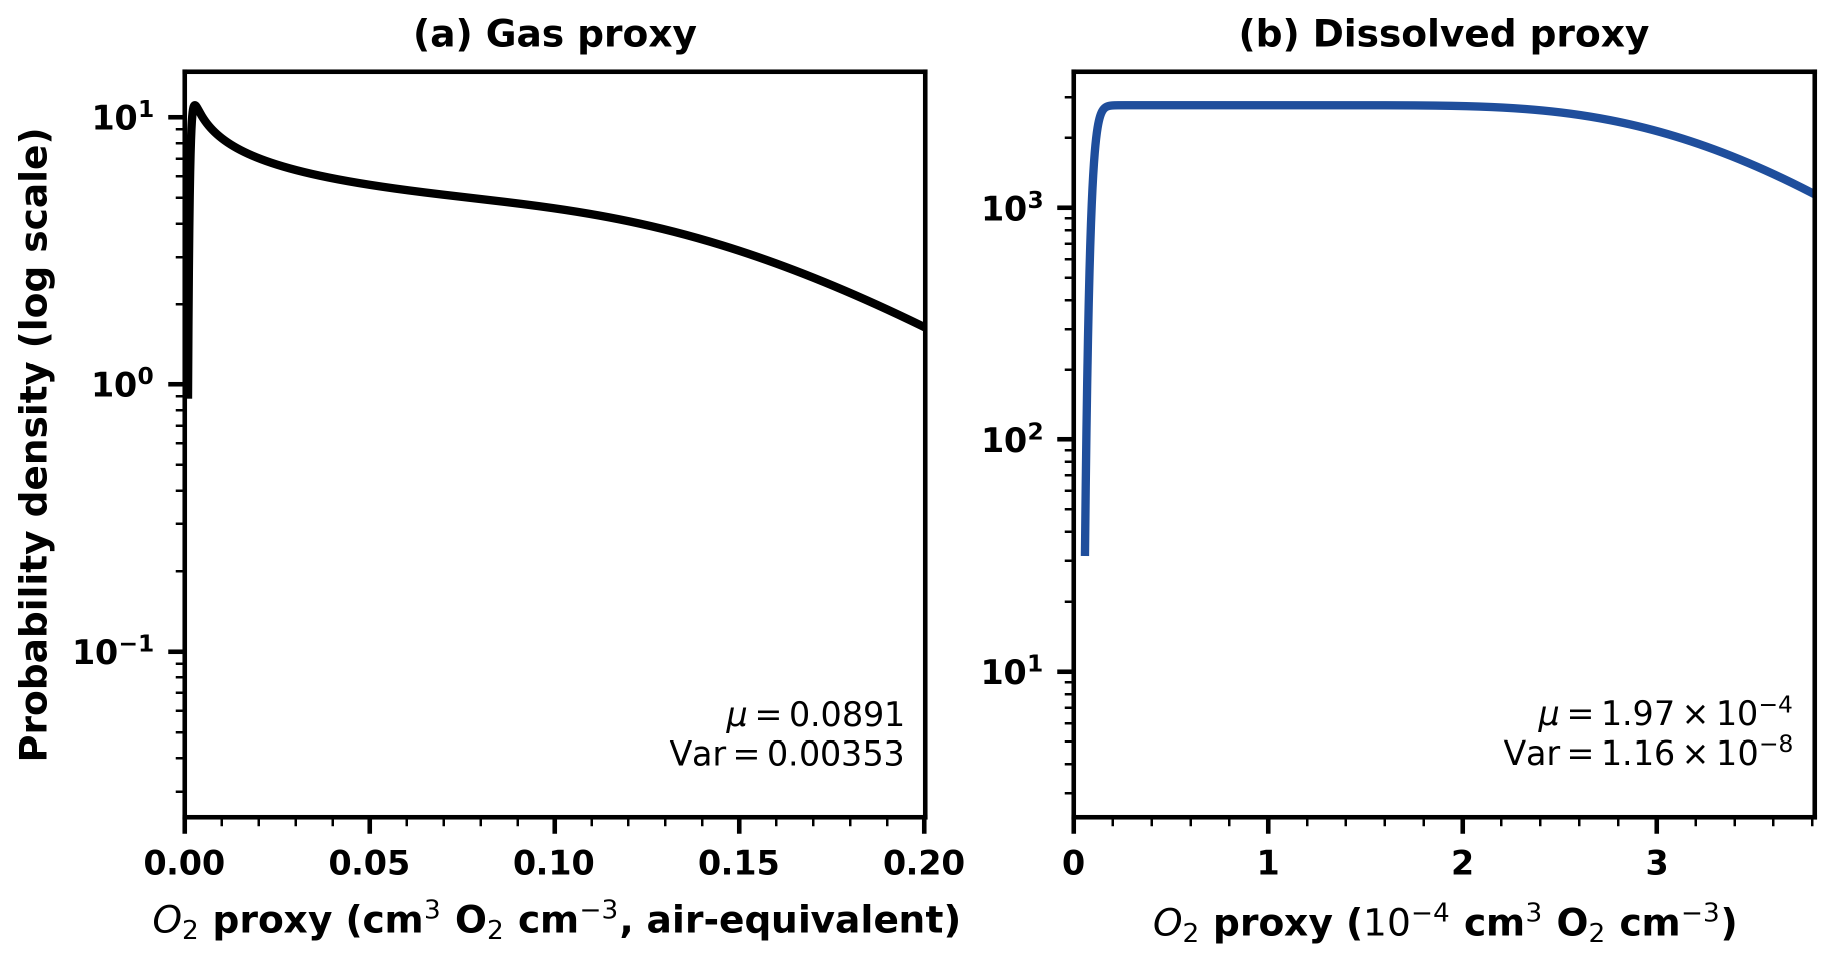
Figure 2Prescribed rhizosphere O2 distributions used to drive the DAMM model. (a) Gas-phase proxy in air-equivalent units (cm3 O2 cm−3), obtained from air-filled porosity and an effective gas diffusivity. (b) Dissolved-phase proxy based on Henry's law, expressed as a volume fraction (cm3 O2 cm−3). Both panels show probability density functions on a logarithmic y axis; in-panel annotations report the mean (μ) and variance (Var) of each distribution, which are later used in the Jensen diagnostic.
3.3 Aggregation bias: uniform versus heterogeneous O2
Across the full Corg range, evaluating respiration at a single mean O2 (uniform) yields higher fluxes than averaging the model over the full O2 distribution (heterogeneous) for the gas-phase driver (Fig. 3). The mean aggregation bias is −12 %, i.e., using a single mean O2 overestimates aerobic heterotrophic respiration by about one tenth on average under observed gas-phase heterogeneity. For the unscaled dissolved proxy, μaq ≪ and Varaq is small, so the response is near-linear and the mean bias is negligible (−0.05 %; Fig. A2). Tightening the gas-phase distribution in the high-θ benchmark reduces variance and yields a small bias (−0.5 % at Corg = 0.15 g C cm−3; Fig. A5).
The ∼ 12 % overestimate is model-structural (Jensen concavity) rather than statistical: the comparison uses the same calibrated model in both configurations and differs only by how O2 heterogeneity is treated. Hence, the bias is operationally meaningful for budgeting and benchmarking aerobic CO2 fluxes.
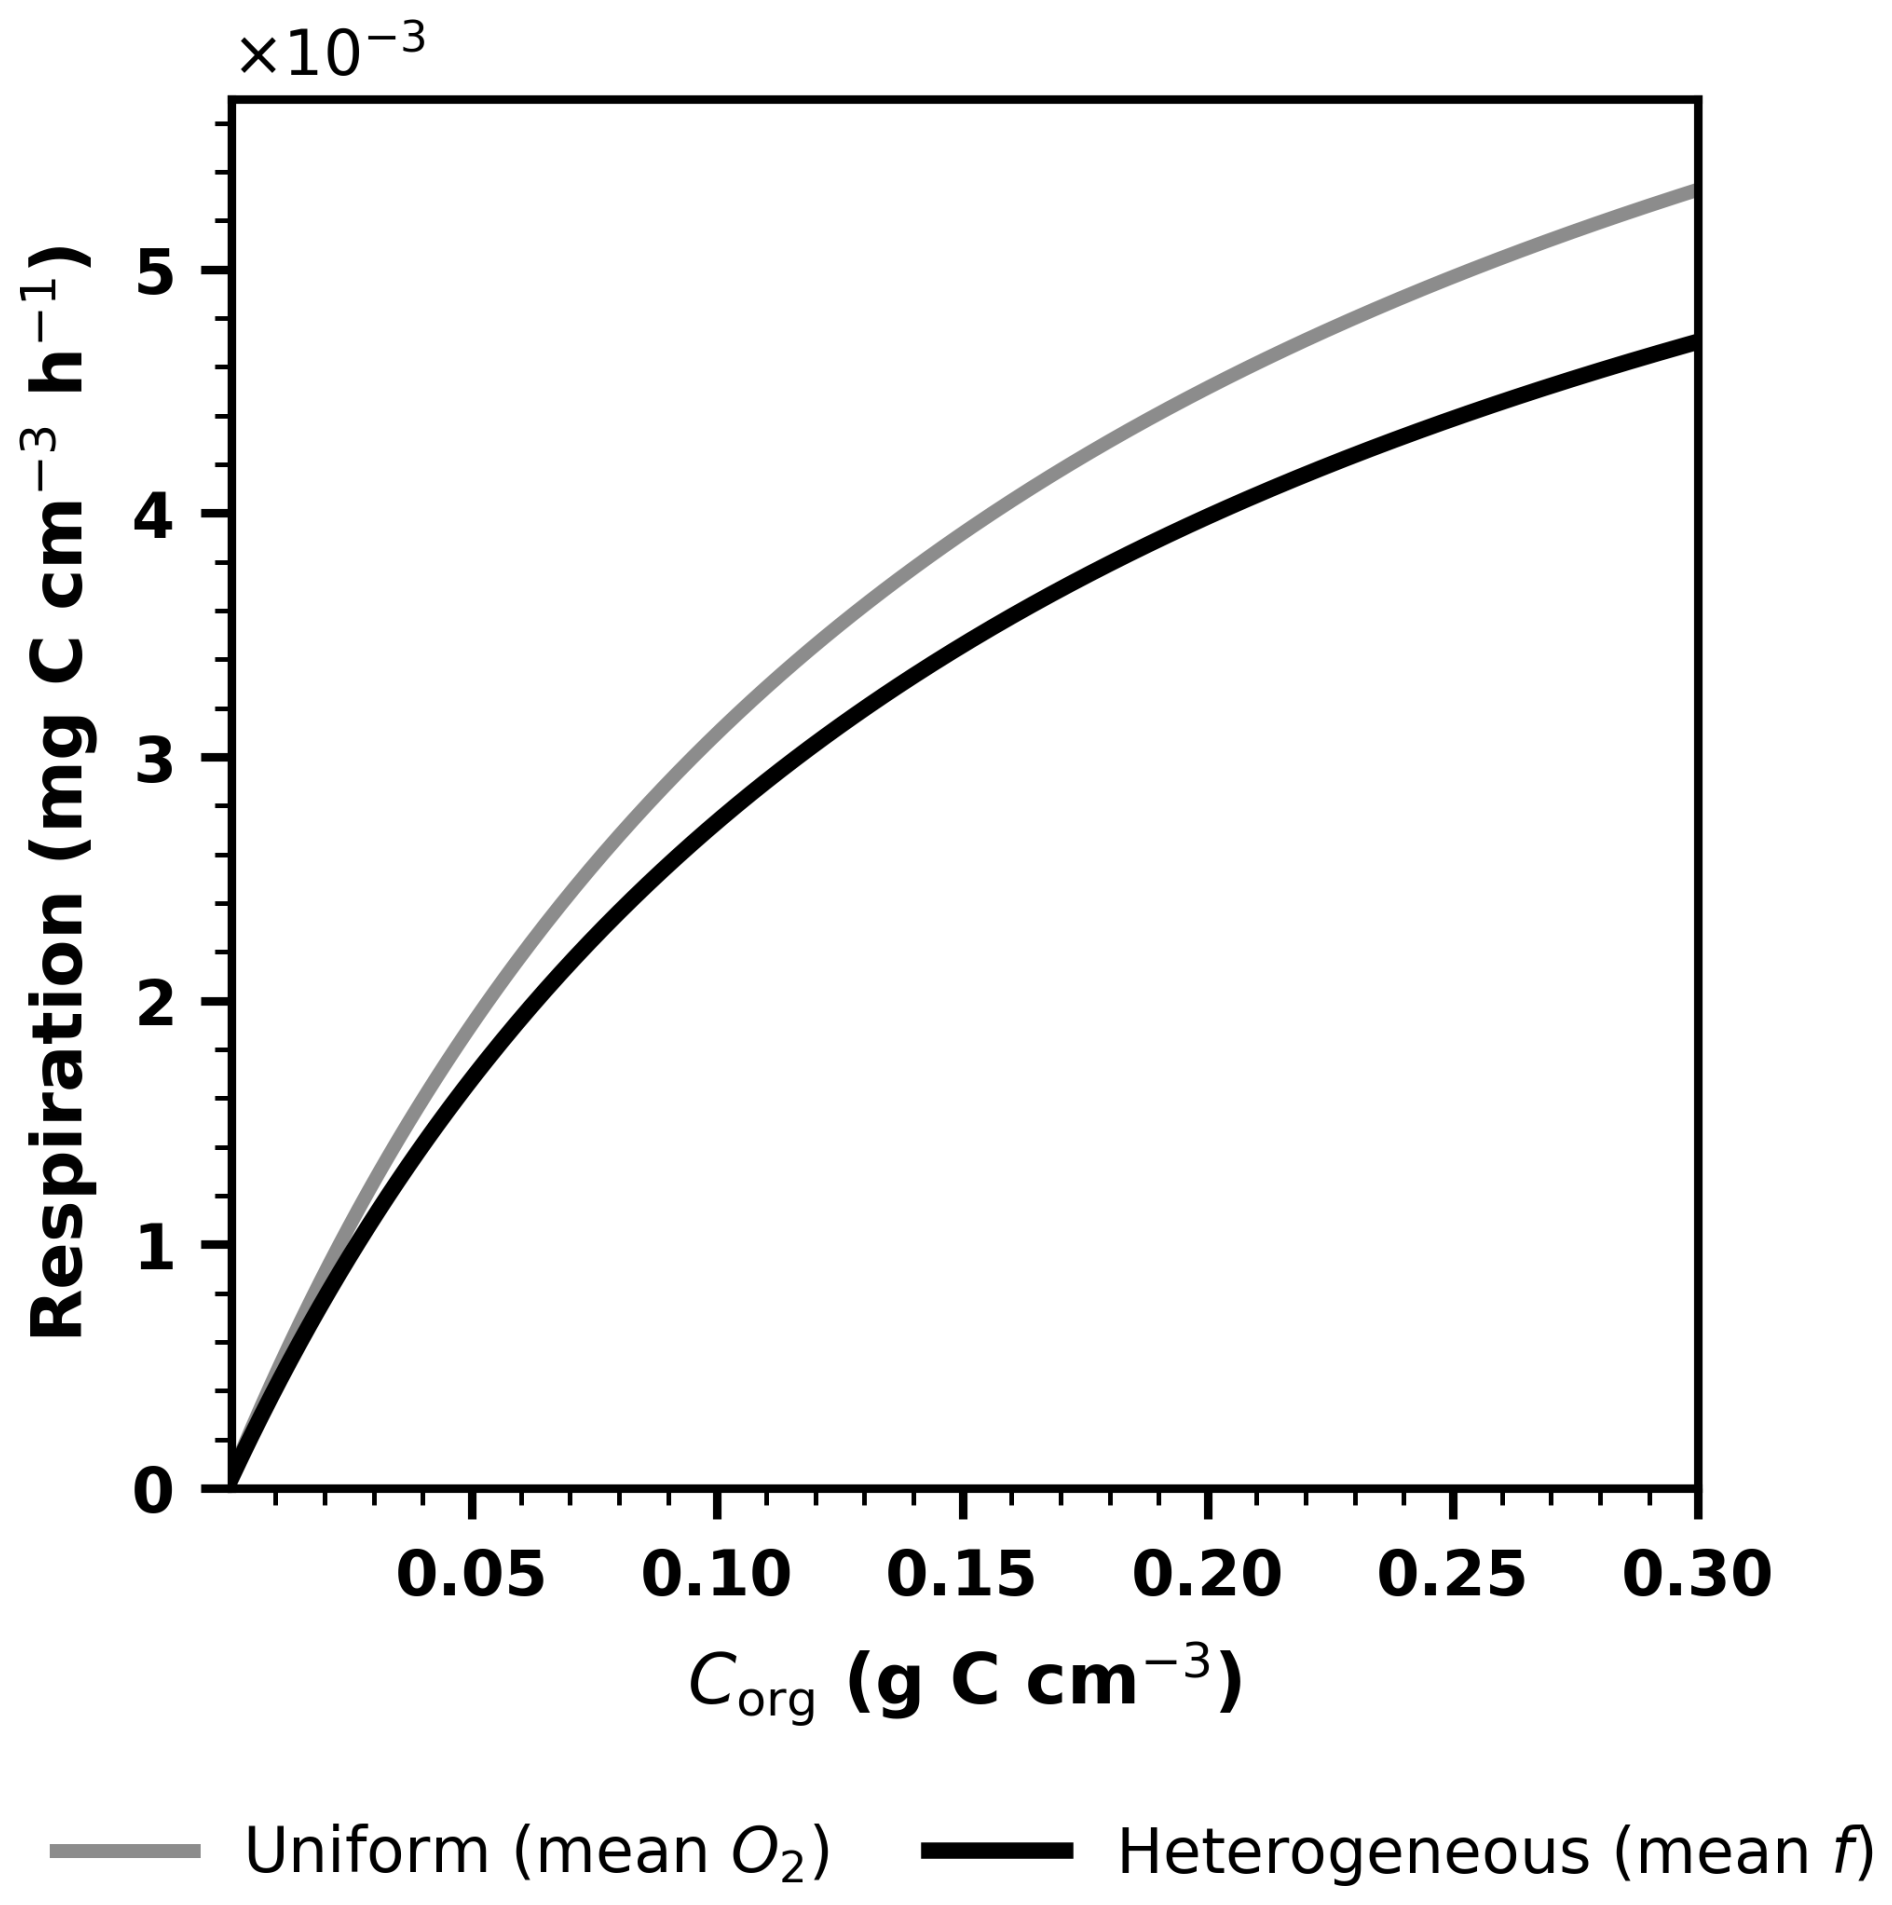
Figure 3Aerobic respiration as a function of Corg when evaluated at a single mean O2 (“Uniform”) versus averaged over the full gas-phase O2 distribution (“Heterogeneous”). Both curves use the calibrated DAMM parameters and the gas-phase O2 proxy. The reported mean aggregation bias (about 12 %) quantifies the relative difference between the heterogeneous and uniform cases over the Corg range considered.
3.4 Dependence on O2 affinity and relative saturation
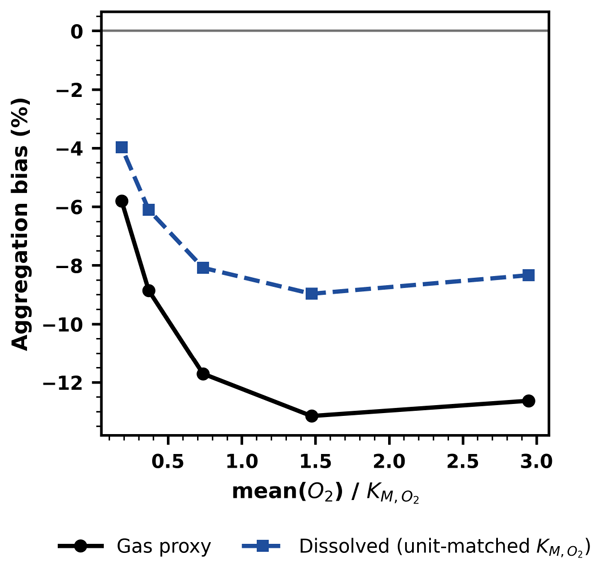
To separate transport from microbial physiology, we varied while holding the O2 distributions fixed and plotted the aggregation bias against the relative saturation ratio mean, which collapses cases onto an interpretable axis (Fig. 4). For the gas proxy, varying by factors of × 0.25, × 0.5, × 1, × 2, × 4 yields a bias range from −13 % to −6 %. For the dissolved proxy with unit-matched (that is, chosen so that its mean O2 concentration corresponds to the same relative saturation as the gas case), the range is −9 % to −4 %. The baseline points occur at mean ≈ 0.74 for both proxies; biases differ in magnitude because the underlying O2 PDFs differ in spread.
In short, the magnitude of bias increases as the system approaches the nonlinear mid-saturation regime and as O2 variability increases, and it does not decrease again over the range of relative saturation examined here.
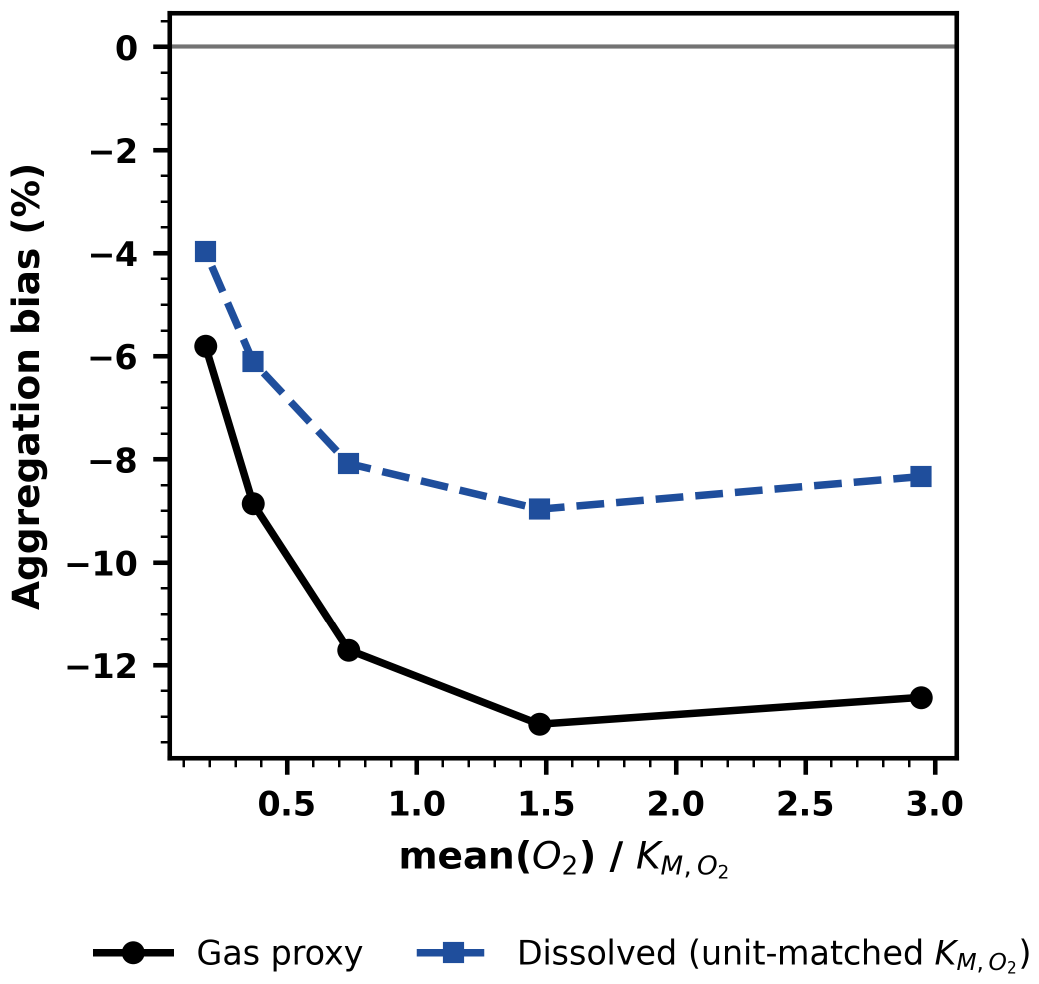
Figure 4Aggregation bias (%) as a function of mean(O2) for the gas-phase O2 proxy (circles) and the dissolved-phase proxy with unit-matched (squares). For each proxy, is varied via multiplicative factors around the calibrated gas-phase value. Bias is computed as the percent difference between heterogeneous (averaged over the O2 distribution) and uniform (evaluated at the mean O2) respiration at fixed Corg. The bias is most pronounced at intermediate relative saturation (mean(O2) ≈ 1). Over the range shown it becomes smaller towards low relative saturation, whereas at high relative saturation it remains almost constant, because the prescribed O2 distributions retain appreciable density close to zero.
3.5 Jensen diagnostic
Holding the mean O2 fixed and increasing Var(O2) with symmetric two-point mixtures produces a near-linear growth in bias (Fig. A3). A second order (quadratic) approximation based on the local curvature of the Michaelis–Menten O2 term closely tracks the simulations, confirming that the bias is a structural consequence of concavity: averaging a heterogeneous O2 field yields E[f(O2)] < f(E[O2]). A response-surface view in Appendix A (Fig. A6) shows that bias remains non-positive across the explored domain and peaks when mean(O2) is comparable to and the coefficient of variation is large.
4.1 Principal findings
Our analysis shows that spatial heterogeneity in rhizosphere oxygen can systematically bias modelled aerobic heterotrophic respiration when the process is evaluated at a single mean oxygen concentration. Using a Dual Arrhenius–Michaelis–Menten (DAMM) scheme calibrated to marsh-soil incubations, we compared a “uniform” configuration, in which respiration is evaluated at the spatial mean oxygen, with a “heterogeneous” configuration, where respiration is averaged over a prescribed distribution of oxygen in the root zone. For gas-phase (air-equivalent) oxygen distributions representative of tidally influenced marsh soils, the uniform configuration overestimates aerobic CO2 production by roughly 10 %–15 % across a wide range of organic carbon concentrations. This aggregation bias arises because the oxygen-limitation term in the DAMM model is a saturating Michaelis–Menten function of oxygen, which is concave over the range where respiration is partially oxygen-limited.
The magnitude of the bias depends on two simple descriptors of the oxygen field: the ratio of the mean oxygen concentration to the microbial half-saturation constant for oxygen, and the variance of oxygen in the rhizosphere. When mean oxygen is far below the half-saturation constant, microbial respiration responds nearly linearly to oxygen and the bias is negligible. When mean oxygen is far above the half-saturation constant, the oxygen term is close to saturation and again becomes insensitive to spatial variation. The largest aggregation errors occur at intermediate mean oxygen, where respiration is strongly limited but not saturated, and where the variance in oxygen is substantial. Our two point and lognormal variance experiments, which hold the mean oxygen fixed while increasing its variance, confirm that the magnitude of the negative bias increases monotonically with oxygen variance and that the sign of the bias does not change within the Michaelis–Menten framework (Figs. A3, A4).
The comparison between gas-phase and dissolved-phase oxygen drivers illustrates the same mechanism from a complementary angle. When the dissolved-phase proxy is used without rescaling, its mean and variance are both much smaller than the half-saturation constant, so respiration is effectively in the linear regime of the oxygen response, and the aggregation bias is close to zero (Fig. A2). When we adjust the microbial half-saturation constant so that the dissolved-phase proxy has a similar degree of oxygen limitation to the gas-phase proxy (that is, a similar ratio of mean oxygen to half-saturation), the dissolved-phase simulations exhibit biases comparable in sign and magnitude to the gas-phase case (Fig. 4). The difference between the gas and aqueous results therefore reflects how each proxy is positioned relative to microbial oxygen affinity, rather than a change in model structure.
Overall, the marsh-soil case study provides a concrete example of a general mechanism: when a saturating oxygen-limitation term is applied to a spatially heterogeneous rhizosphere, evaluating respiration at a single bulk oxygen level tends to overestimate aerobic heterotrophic CO2 production. The size of that overestimate can be understood and, in principle, approximated from simple statistics of the oxygen distribution and plausible ranges of the half-saturation constant.
4.2 Relation to process understanding and prior work
Tidal marsh soils are characterized by strong small-scale redox heterogeneity. Hydrologic forcing through tidal inundation, drainage, and groundwater flow drives rapid switches between oxic and anoxic conditions, while plant traits such as radial oxygen loss from aerenchymatous roots create localized oxic zones around roots embedded in largely reduced sediment. Microelectrode and planar optode studies in flooded and marsh soils consistently show millimetre-centimetre oxygen mosaics, with steep gradients around roots and patches where oxygen fluctuates over diel and tidal cycles (Koop-Jakobsen et al., 2018). Our imposed gas-phase oxygen distributions are designed to be consistent with this process understanding: they arise from variation in water content and air-filled porosity, both of which are strongly affected by tidal inundation and drainage, and they are intended to bracket realistic degrees of rhizosphere oxygen heterogeneity in tidally influenced marshes.
Previous work has emphasized that tidal marshes can be strong carbon sinks because high primary production and efficient sediment trapping are combined with slow anaerobic decomposition. At the same time, a growing literature highlights how root-mediated oxygen supply can locally accelerate aerobic decomposition and alter greenhouse gas production, especially in systems with high root biomass and pronounced aerenchyma development. However, most marsh carbon models represent belowground redox conditions using a single bulk variable (such as average water content, a redox class, or an empirical soil-moisture scalar), and they typically apply this scalar uniformly within a grid cell or plant functional type. In doing so, they effectively assume that respiration responds to a uniform oxygen environment, even though observations show that roots and microbes experience a patchwork of oxic and anoxic microhabitats (Pezeshki and DeLaune, 2012).
The broader ecological modelling literature has long recognized that using mean environmental conditions in nonlinear response functions can lead to systematic upscaling biases. Rastetter et al. (1992), for example, showed that aggregating nonlinear responses to water and nutrients can misrepresent ecosystem responses to climate change. Yet, to our knowledge, the specific consequences of small-scale rhizosphere oxygen heterogeneity for marsh carbon flux estimates have not been quantified using a physiologically based respiration scheme calibrated to marsh soils. Our results therefore connect a well established mathematical principle (Jensen's inequality) to a specific, process rich context in which oxygen heterogeneity is both expected and extensively documented. They complement previous work on micro-scale redox and organic-matter dynamics in soils and sediments by translating that heterogeneity into explicit consequences for ecosystem-scale flux calculations (Wilson and Gerber, 2021), and recent three dimensional reactive transport simulations that resolve plant mediated oxygen inputs and fine scale porewater biogeochemistry in coastal wetlands (Zhou et al., 2024) by translating those insights into an explicit correction for marsh carbon flux calculations.
Finally, by framing the bias in terms of the mean and variance of oxygen and the microbial half-saturation constant, our results fit naturally alongside DAMM-type applications in terrestrial and wetland systems. DAMM has been used to represent soil heterotrophic respiration in land surface and ecosystem models, where it replaces simple Q10 moisture scalars with a mechanistic treatment of temperature, substrate, and diffusion constraints. Our analysis extends this line of work by showing that, once oxygen limitation is represented explicitly, the spatial distribution of oxygen within a model grid cell becomes a first-order control on predicted respiration, rather than a secondary detail (Moyano et al., 2018).
4.3 Implications for modelling and observation
The most direct implication for marsh process models is that replacing heterogeneous rhizosphere oxygen with a single mean value will, under realistic conditions, tend to overestimate aerobic heterotrophic CO2 production. In our marsh case study, gas-phase oxygen heterogeneity produces a mean aggregation bias of −12 %, that is, a uniform-oxygen configuration overestimates respiration by roughly one tenth. Because net carbon sequestration reflects the balance between inputs and heterotrophic losses, this implies a systematic underestimation of the marsh carbon sink. If a bias of this magnitude were broadly representative of tidal marshes, then, given published global salt-marsh carbon burial estimates of about 10–21 Tg C yr−1 (Alongi, 2020; Ouyang and Lee, 2014), correcting for aggregation bias would increase inferred global marsh sequestration by on the order of 1–2.5 Tg C yr−1, corresponding to roughly 0.1–0.25 Gt C over a century. Given the wide uncertainty in global salt-marsh carbon burial, with estimates based on carbon accumulation rates spanning roughly 0.9–31.4 Tg C yr−1 (Chastain et al., 2022), these numbers should be interpreted as order of magnitude extrapolations rather than precise forecasts. Nevertheless, they indicate that aggregation bias is non negligible for coastal carbon budgets and for greenhouse gas inventories that include blue carbon ecosystems, even though the corrected flux remains small compared with anthropogenic fossil fuel emissions (IPCC, 2023).
At the land surface and Earth system model scale, most soil biogeochemical schemes still employ relatively simple representations of heterotrophic respiration, often combining a temperature response with an empirical soil moisture scalar. More mechanistic schemes, including DAMM and related enzyme kinetic formulations, are now being incorporated into regional and global models to capture interactions among temperature, moisture, and substrate supply more explicitly. Recent work using a reduced complexity carbon–climate model shows that replacing a first order respiration formulation with a Michaelis–Menten formulation can substantially increase the strength of the terrestrial carbon–climate feedback and raise the remaining carbon budget to meet a given temperature target (Beer, 2025). This underlines that large scale projections are structurally sensitive to the mathematical form chosen for respiration. Our results add that, when such schemes include an explicit oxygen limitation term but still operate at coarse spatial resolution, they also inherit an additional structural error that depends on how oxygen is aggregated within each grid cell. Regions with shallow water tables, strong hydrologic variability, and high root biomass, such as tidal marshes, riparian wetlands, peatlands and some rice systems, are likely to be particularly sensitive.
In practical terms, the modelling framework developed here can be used to diagnose where aggregation bias is likely to matter and to design simple mitigation strategies. First, modellers can characterize or bracket the relative saturation of oxygen, that is, the ratio between the mean oxygen in the rhizosphere and a plausible microbial half-saturation constant, together with a measure of subgrid variability. A convenient measure of variability is the coefficient of variation, defined as the standard deviation of oxygen divided by its mean. When relative saturation is very low or very high, or when variability is small, our results suggest that aggregation error will be negligible. When relative saturation is intermediate and variability in oxygen is substantial, a negative aggregation bias should be expected if a single bulk oxygen value is used.
Second, if subgrid oxygen distributions cannot be resolved explicitly, our Jensen-type diagnostics offer a way to correct for at least part of the bias or to represent it as an uncertainty range. For small to moderate variability, a Taylor series approximation using the local curvature of the oxygen-limitation term can be used to derive a multiplicative correction factor for the uniform-oxygen flux, which we demonstrate for the gas-phase proxy (Fig. A7). When variability is large or poorly constrained, it may be more appropriate to propagate a plausible range of oxygen variance into a range of predicted fluxes, thereby making the aggregation error explicit in model uncertainty budgets.
Finally, we note that a conceptually similar issue arises when oxygen limitation is parameterized as a function of another state variable, such as water content or water-table depth. If oxygen is first expressed as a nonlinear function of water content, and then the model uses mean water content within a grid cell, the resulting mean-water baseline can differ from the baseline defined by mean oxygen. In extreme cases, this can even alter the apparent sign of the aggregation effect. Our analysis suggests that it is preferable to define the uniform reference case directly in oxygen space (that is, to evaluate respiration at the mean oxygen concentration) rather than in terms of the mean of a proxy variable such as water content.
4.4 Uncertainties and limits
Several limitations of our approach should be kept in mind when interpreting the results. First, the gas-phase and dissolved-phase oxygen distributions we impose are proxies that reflect hydrologic and structural controls (through water content, porosity, and effective diffusivity) but do not resolve root architecture, advective transport, or biogeochemical feedback between reactions and oxygen supply. They are designed to constrain plausible degrees of rhizosphere heterogeneity rather than to reproduce site specific oxygen probability density functions. Fully coupled transport–reaction models that explicitly resolve root geometry, gas-phase diffusion, and solute flows would be needed to predict detailed oxygen distributions for particular marshes or plant communities.
A related simplification is that aerobic heterotrophic respiration is treated as the only sink for O2 in the root zone. In marsh soils, the re-oxidation of reduced compounds, including dissolved sulfide, iron sulfides and ammonium, also consumes O2 and competes with respiration for it (Howes and Teal, 1994; Koop-Jakobsen et al., 2017; Pezeshki and DeLaune, 2012). Because the O2 distributions are prescribed here rather than obtained from a coupled transport–reaction model, this competition is not resolved, and it affects how representative the imposed distributions are of a given marsh rather than the comparison between the uniform and the heterogeneous configuration.
Second, we treat microbial oxygen affinity through a single half-saturation constant and explore its influence via sensitivity sweeps, rather than by refitting oxygen kinetics for each hydrologic or redox regime. In reality, microbial communities and enzyme systems can acclimate or adapt to chronic hypoxia or frequent redox oscillations, shifting effective half-saturation constants and potentially altering the degree of concavity in the oxygen response. Our sensitivity analysis indicates that the sign of the aggregation bias is robust as long as the oxygen-limitation term retains its saturating form, but the exact magnitude of the bias in any specific marsh will depend on the local microbial community and redox history.
Third, our calibration focuses on aerobic heterotrophic respiration derived from long term soil incubations under controlled temperature and water content. Autotrophic root respiration and anaerobic pathways (for example fermentation, sulfate reduction, and methanogenesis) are outside the scope of the present study. In the field, these processes coexist and interact; root respiration can covary with oxygen and hydrology, while anaerobic pathways contribute substantially to CO2 and CH4 production under persistent anoxia. Our results should therefore be interpreted as applying to the aerobic heterotrophic component of belowground CO2 production, not to total soil respiration or full greenhouse gas budgets.
Lastly, we use a single marsh system and a fixed temperature as our calibration context. While the DAMM formulation is designed to be portable across sites and temperature regimes, additional calibration and validation against independent datasets from other marsh types, climates, and plant communities would be needed to confirm the quantitative magnitude of aggregation bias across the global diversity of coastal wetlands.
4.5 Observational priorities and data needs
Our diagnostics highlight a specific set of observational needs that would allow the aggregation mechanism to be better constrained in marshes and other wetland ecosystems. First, direct measurements of oxygen distributions in marsh rhizospheres are still rare relative to the spatial and temporal variability expected from hydrology and plant traits. Fine scale microelectrode and planar optode measurements (Koop-Jakobsen and Wenzhöfer, 2015) have proven capable of resolving steep oxygen gradients and dynamic oxic–anoxic interfaces in sediments and wetland soils. Extending these techniques across tidal elevations, plant functional types, and seasons would provide the empirical oxygen means, variances, and coefficients of variation needed to apply our bias diagnostics more directly.
Second, joint observations of oxygen, water content, and CO2 fluxes in the root zone would permit explicit tests of the DAMM based aggregation framework. For example, combining high resolution oxygen imaging with controlled manipulations of water level and plant species could reveal how hydrologic state and radial oxygen loss map into the statistical properties of rhizosphere oxygen distributions, and how those properties in turn control aerobic respiration.
Third, improved constraints on microbial oxygen kinetics in marsh soils through laboratory respiration assays across oxygen gradients, in combination with molecular or enzymatic measurements, would narrow the plausible range of half saturation constants and inform when and where the concavity driven aggregation bias is likely to be large. Together, such observational efforts would reduce structural uncertainty in marsh carbon models, enable more targeted use of correction factors in DAMM type schemes, and provide a foundation for representing rhizosphere oxygen heterogeneity in land surface and Earth system models.
We examined how small-scale heterogeneity in rhizosphere oxygen affects modelled aerobic heterotrophic respiration in tidal marsh soils. Using a Dual Arrhenius–Michaelis–Menten formulation calibrated to long term marsh soil incubations, we compared respiration evaluated at a single mean oxygen concentration with respiration averaged over heterogeneous oxygen distributions generated by hydrologic and structural variation in the root zone. For gas-phase oxygen fields representative of tidally influenced marsh soils, evaluating respiration at the mean oxygen led to an overestimate of aerobic CO2 production on the order of 10 %–15 %.
The magnitude of the bias is controlled by the ratio between mean oxygen and the microbial half-saturation constant for oxygen, together with the variance of oxygen in the rhizosphere. Biases are negligible when oxygen is either extremely scarce or effectively saturating, or when spatial variability is small, and they are largest at intermediate oxygen levels and substantial variability.
These findings have direct implications for marsh carbon budgets and for the representation of wetland soils in biogeochemical and Earth system models. In models that employ mechanistic, oxygen-limited respiration schemes but represent oxygen as a single bulk variable per grid cell, the concavity driven aggregation bias identified here can introduce a structural overestimate of aerobic heterotrophic CO2 production in systems with strongly heterogeneous rhizospheres. Our diagnostic framework provides a simple way to anticipate when this bias is likely to be important, namely where mean oxygen in the root zone is comparable to microbial half-saturation constants and where variability in oxygen is nontrivial, and to design correction factors or uncertainty ranges accordingly.
Finally, the work points to clear observational and modelling priorities. High resolution measurements of rhizosphere oxygen distributions, coupled with constraints on microbial oxygen kinetics, would allow aggregation effects to be quantified and corrected for specific marsh types. Extending the present framework to include autotrophic root respiration, anaerobic pathways, and fully coupled transport reaction models would further clarify how plant traits, hydrology, and microbial communities jointly shape carbon fluxes in coastal wetlands. By explicitly linking rhizosphere oxygen heterogeneity to aggregation bias in a widely used respiration scheme, this study provides a template for incorporating small scale redox dynamics into ecosystem and Earth system scale assessments of marsh carbon cycling.
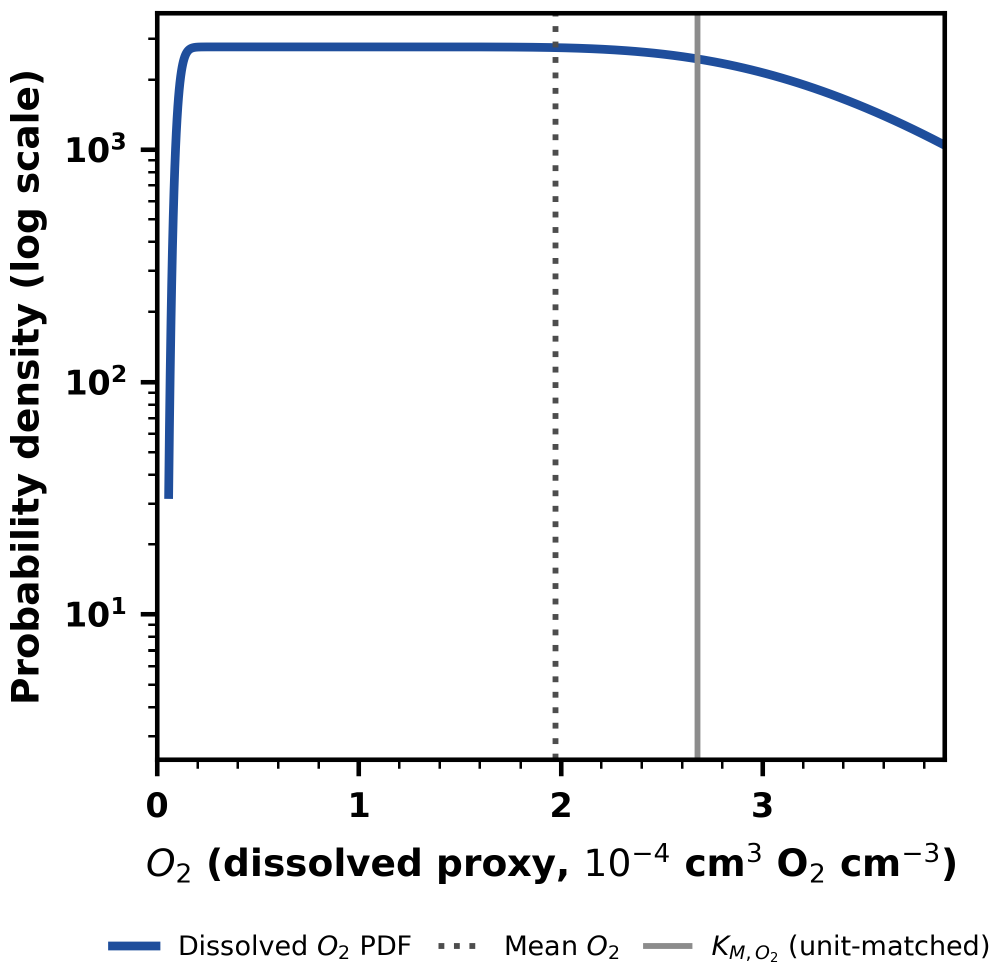
Figure A1Dissolved-phase O2 proxy distribution with the same units and proxy definition as in Fig. 2b, shown on a logarithmic y axis. The vertical lines indicate the distribution mean (μ) and the unit-matched value used in the dissolved sensitivity sweep in Fig. 4, placing the gas and dissolved cases on a comparable relative O2 saturation scale.
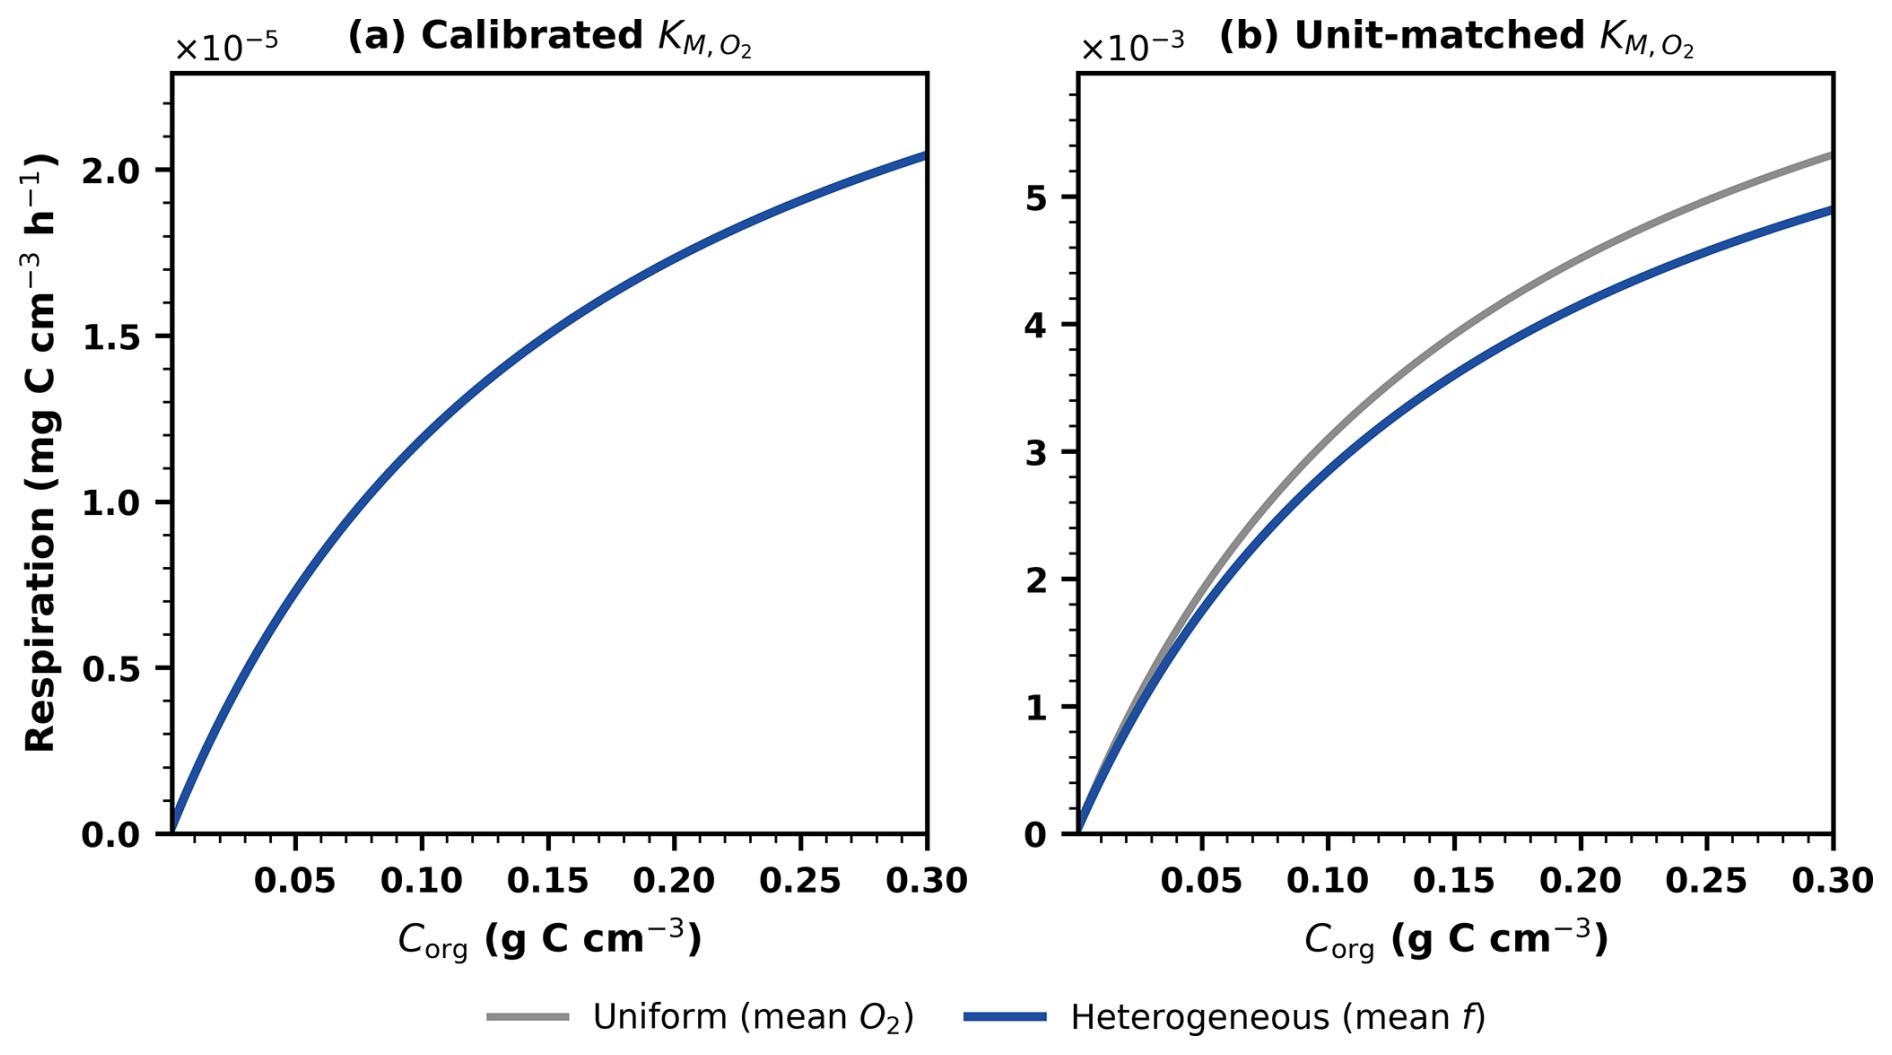
Figure A2Sensitivity of aggregation bias to the choice of dissolved-phase O2 driver. (a) Uniform (mean O2) versus heterogeneous (full distribution) DAMM respiration curves driven by the unscaled dissolved O2 proxy. Because dissolved O2 is orders of magnitude below the calibrated , the O2 limitation is effectively linear and the bias is negligible. (b) Same analysis but with rescaled to match the mean relative saturation of the gas-phase case. Under this unit-matched , the dissolved proxy exhibits a negative aggregation bias similar in magnitude to the gas-phase proxy.
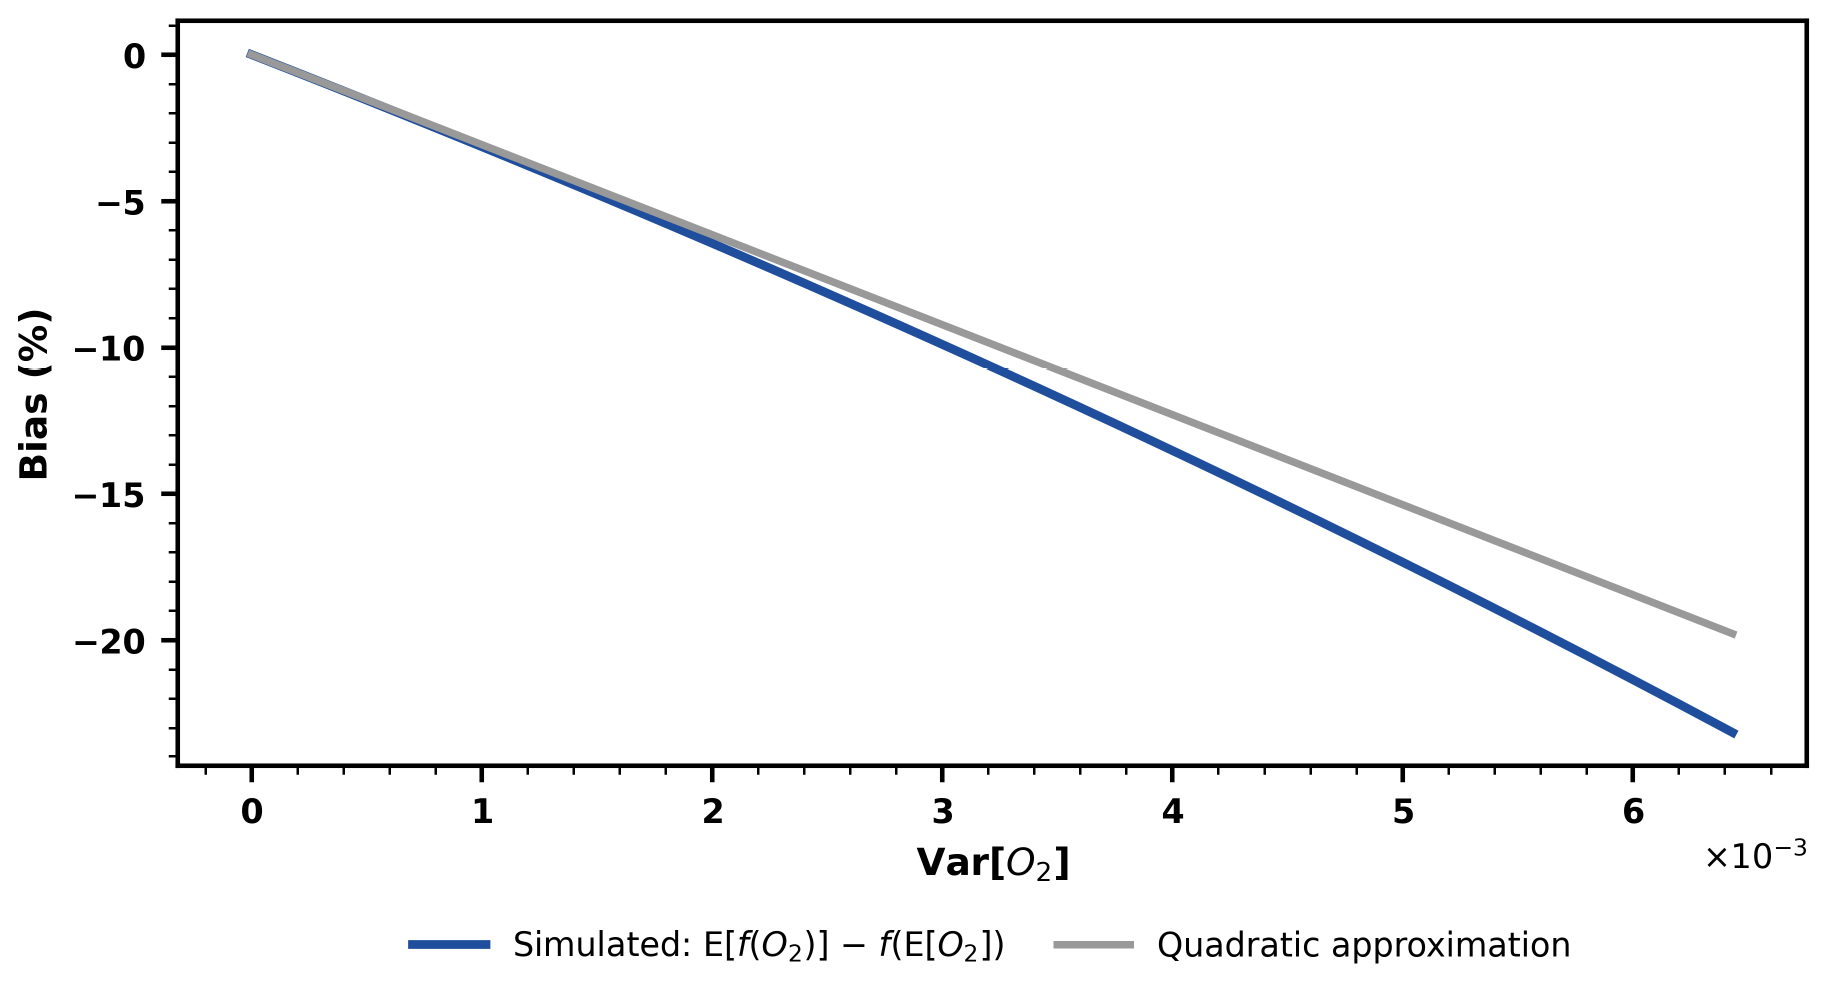
Figure A3Jensen diagnostic for a symmetric two-point O2 family. Bias in respiration E[f(O2)] − f(E[O2]) versus Var[O2] at fixed mean O2 and Corg, computed from explicit DAMM evaluations (primary curve) and from the second-order Taylor approximation based on the curvature of O2 limitation (secondary curve). The close agreement over a broad variance range supports the use of a curvature-based Jensen correction.
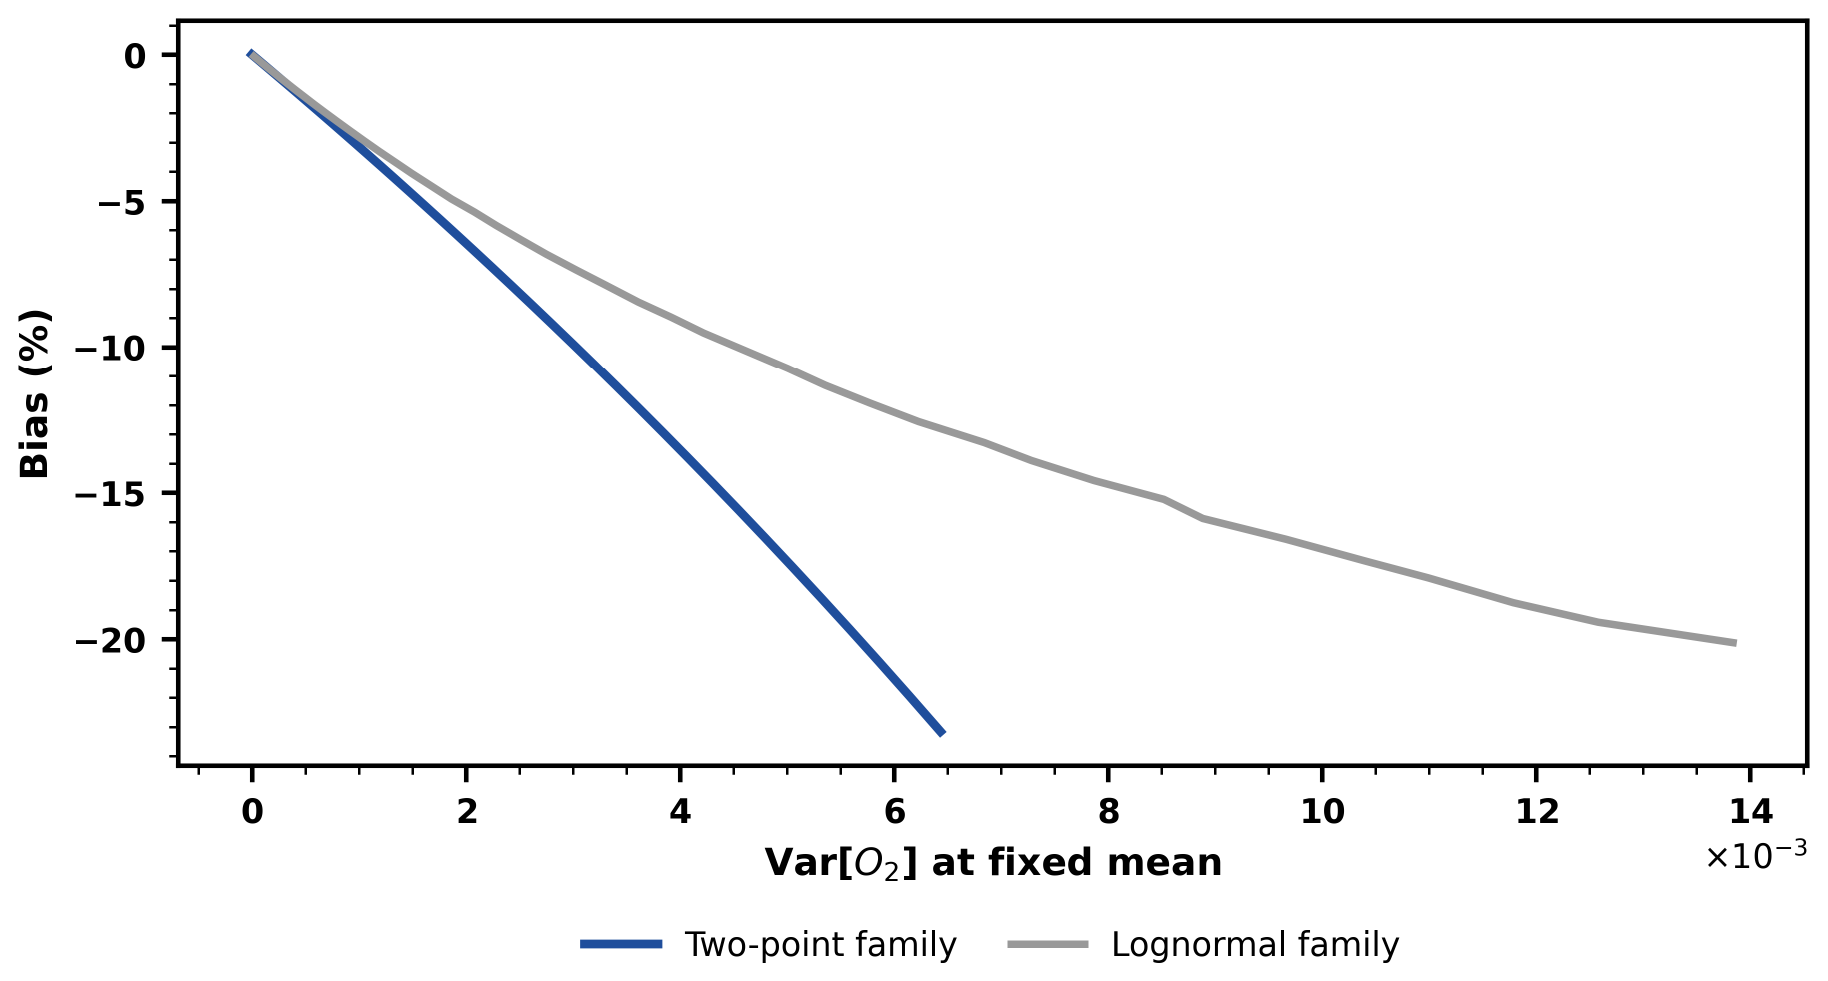
Figure A4Aggregation bias versus Var[O2] at fixed mean O2 for two families of O2 distributions: symmetric two-point mixtures and lognormal distributions. For each family, the mean O2 is held constant and the variance is varied. In both cases, the bias remains negative and its magnitude increases monotonically with Var[O2], indicating that the concavity mechanism is robust to the choice of O2 distribution shape.
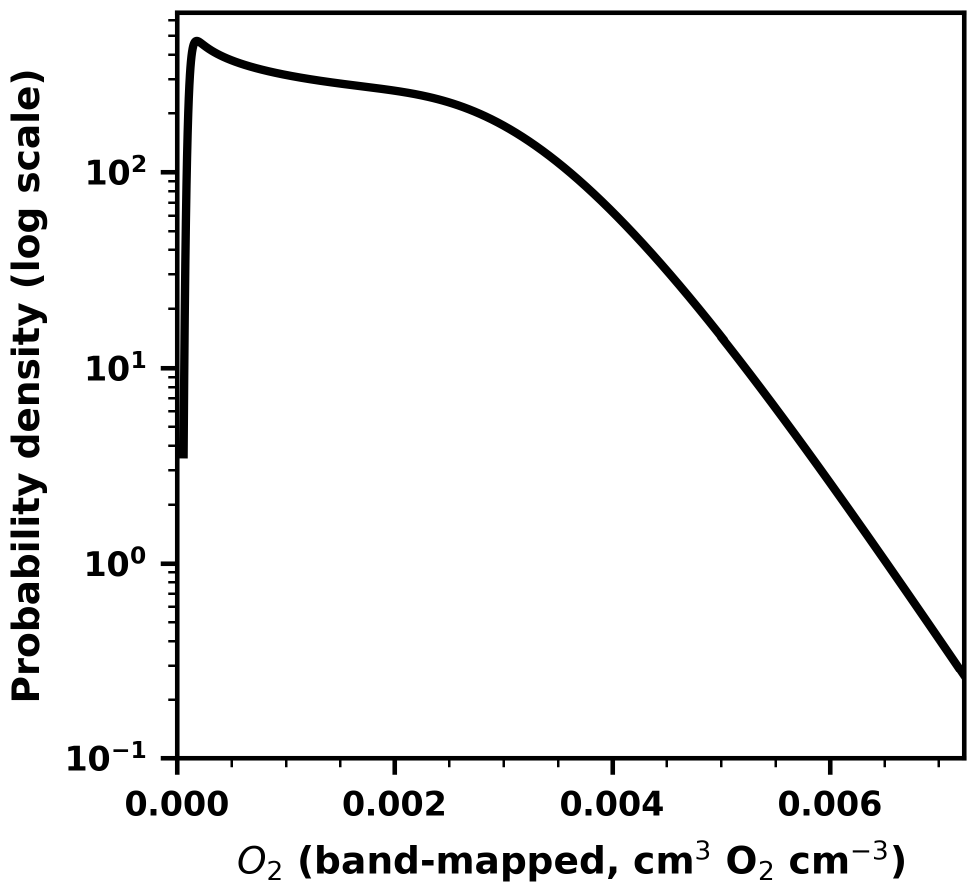
Figure A5Probability density of O2 obtained by mapping a narrow water-content band, θ ∈ [0.65,0.68], to gas-phase O2 using the same proxy as in the main analysis; the density is shown on a log scale. This high-θ band has much lower variance than the full rhizosphere distribution. Evaluated at Corg = 0.15 g C cm−3, the respiration predicted at the mean O2 (uniform configuration) is slightly larger than the heterogeneous average E[f(O2)], giving an aggregation bias of −0.5 % (uniform overpredicts). Numerically, Runiform = 1.2657 × 10⁻⁴ mg C cm−3 h−1 and Rheterogeneous = 1.2592 × 10⁻⁴ mg C cm−3 h−1 (calibrated DAMM parameters; substrate term evaluated at θref = 0.30).
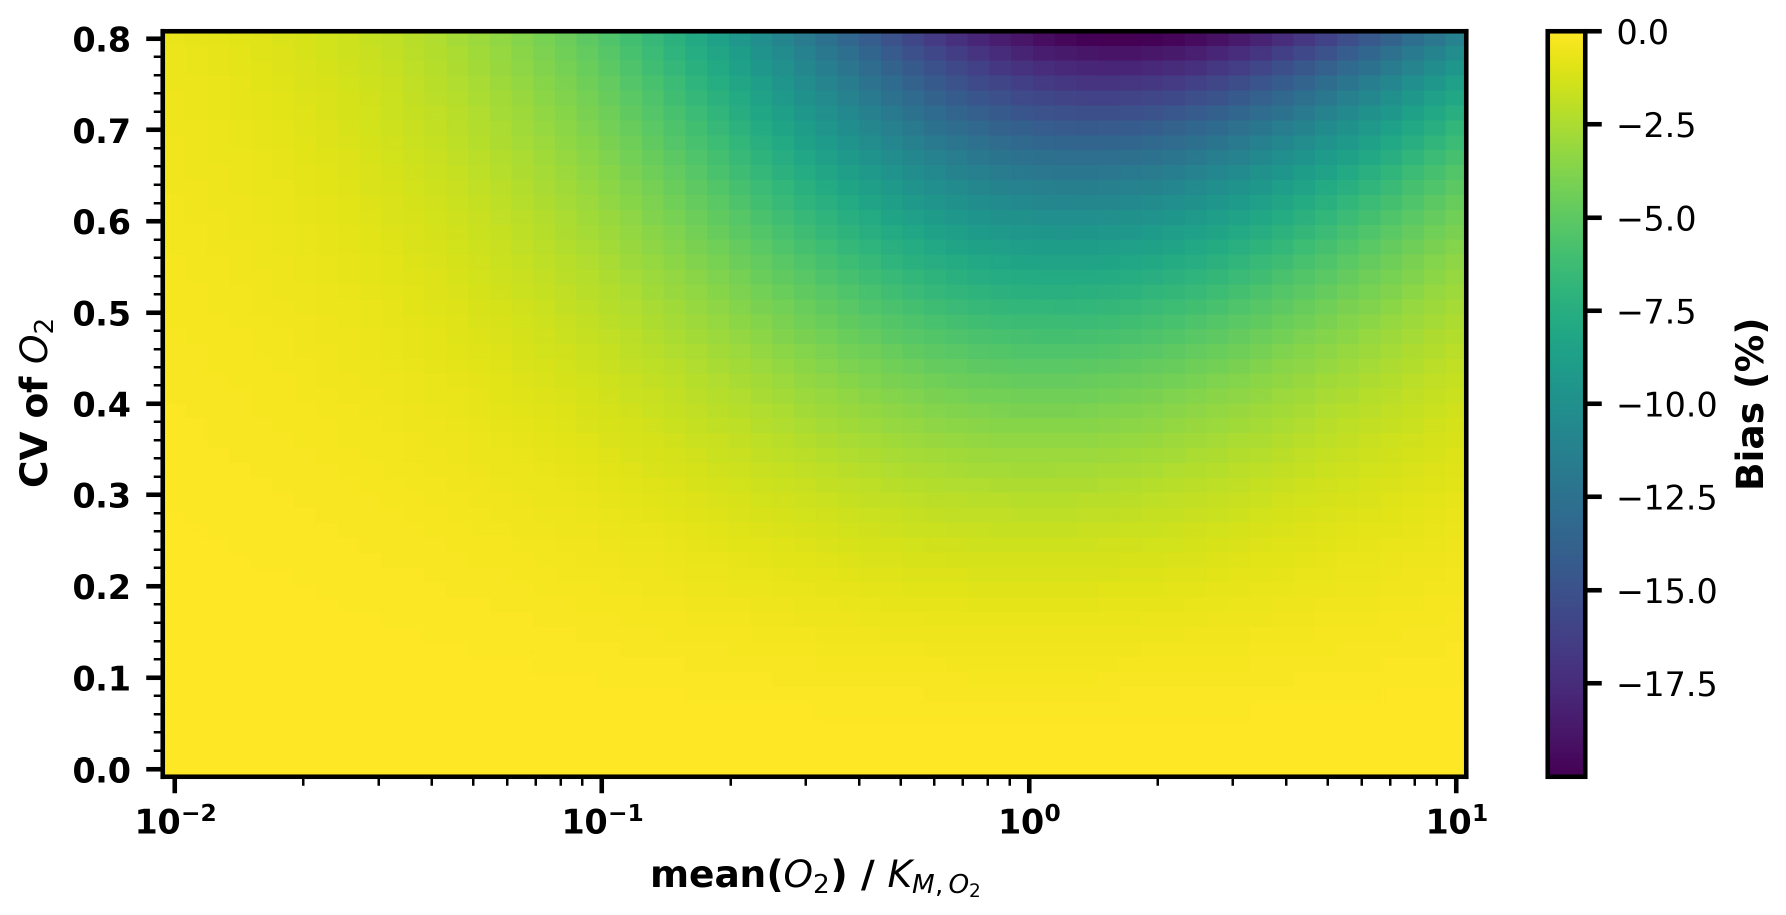
Figure A6Response surface of aggregation bias as a function of mean(O2) and the coefficient of variation (CV) of O2, for a symmetric two-point O2 family at fixed mean O2. Colour shading indicates bias (%) with negative values only, consistent with concave O2 limitation. Bias magnitude increases with CV and peaks at intermediate relative saturation, summarising how physiology () and O2 heterogeneity jointly control aggregation error.
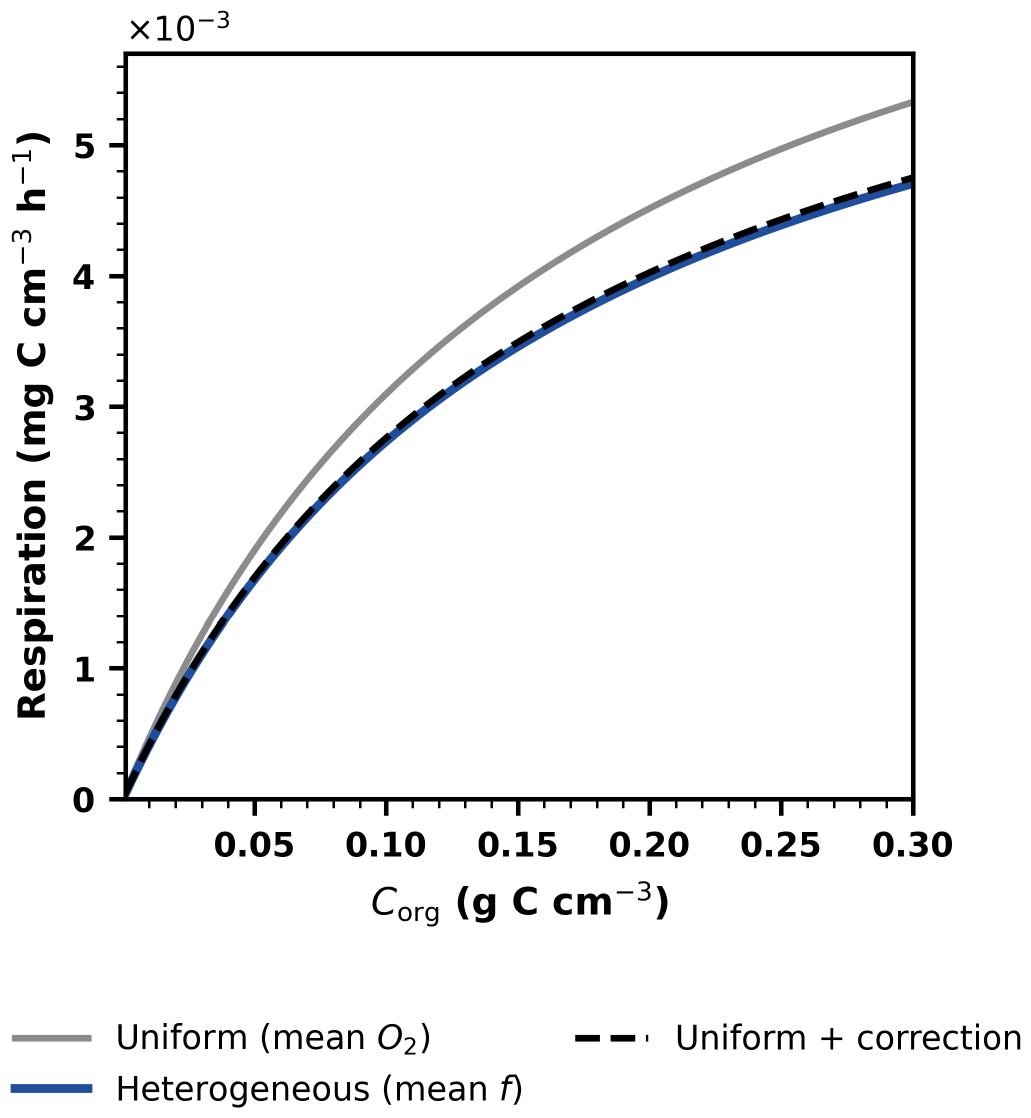
Figure A7Example of a small variance Jensen correction applied to the gas-phase O2 proxy. The uniform curve shows respiration evaluated at the mean O2, the heterogeneous curve shows the explicit average over the prescribed O2 distribution, and the corrected curve applies a second-order curvature-based factor using the local O2 variance and curvature. For the modest O2 variability considered, the correction removes most of the negative aggregation bias, illustrating a lightweight approach for models that cannot explicitly resolve subgrid O2.
The MATLAB code corresponding to this publication, including all scripts used for the analyses and figures, is archived in the institutional research data repository of Universität Hamburg and is available at https://doi.org/10.25592/uhhfdm.17912 (Saadaoui et al., 2024).
Summary datasets used in this study, including incubation medians and ICBM outputs for model calibration, are archived in the institutional research data repository of Universität Hamburg (https://doi.org/10.25592/uhhfdm.14367, Beer, 2024). Additional raw measurements are available from the corresponding author upon reasonable request.
YS, PP, CB and PM designed the study, and YS, PP and CB carried out the modelling. FN, JNB and AE designed the incubation experiment, FN investigated and provided the incubation data. YS wrote the manuscript with input from all co-authors.
The contact author has declared that none of the authors has any competing interests.
Publisher's note: Copernicus Publications remains neutral with regard to jurisdictional claims made in the text, published maps, institutional affiliations, or any other geographical representation in this paper. The authors bear the ultimate responsibility for providing appropriate place names. Views expressed in the text are those of the authors and do not necessarily reflect the views of the publisher.
The authors gratefully acknowledge the financial support of the Deutsche Forschungsgemeinschaft (DFG, German Research Foundation) as a part of the research training group (RTG2530) “Biota-mediated effects on Carbon Cycling in Estuaries”. P.M. acknowledges the financial support of the Deutsche Forschungsgemeinschaft (DFG) in the framework of the Emmy Noether program. C.B. acknowledges financial support by the Heisenberg professorship.
We thank Daniel Schwarze for supporting the laboratory work.
This research has been supported by the Deutsche Forschungsgemeinschaft (DFG) (grant nos. 407270017, 502681570, and DFG-BE 6485/4-1).
This paper was edited by Jack Middelburg and reviewed by three anonymous referees.
Alizad, K., Hagen, S. C., Morris, J. T., Bacopoulos, P., Bilskie, M. V., Weishampel, J. F., and Medeiros, S. C.: A coupled, two-dimensional hydrodynamic-marsh model with biological feedback, Ecol. Model., 327, 29–43, https://doi.org/10.1016/j.ecolmodel.2016.01.013, 2016.
Alongi, D. M.: Carbon balance in salt marsh and mangrove ecosystems: a global synthesis, J. Mar. Sci. Eng., 8, 767, https://doi.org/10.3390/jmse8100767, 2020.
Andrén, O. and Kätterer, T.: ICBM: the introductory carbon balance model for exploration of soil carbon balances, Ecol. Appl., 7, 1226, https://doi.org/10.2307/2641210, 1997.
Barbier, E. B., Hacker, S. D., Kennedy, C., Koch, E. W., Stier, A. C., and Silliman, B. R.: The value of estuarine and coastal ecosystem services, Ecol. Monogr., 81, 169–193, https://doi.org/10.1890/10-1510.1, 2011.
Beer, C.: Simulation of heterotrophic respiration of incubated soil samples based on the Introductory Carbon Balance Model (ICBM), Version 1, Universität Hamburg [data set], https://doi.org/10.25592/uhhfdm.14367, 2024.
Beer, C.: Carbon–climate feedback higher when assuming Michaelis–Menten kinetics of respiration, Earth Syst. Dynam., 16, 1527–1537, https://doi.org/10.5194/esd-16-1527-2025, 2025.
Beer, C., Knoblauch, C., Hoyt, A. M., Hugelius, G., Palmtag, J., Mueller, C. W., and Trumbore, S.: Vertical pattern of organic matter decomposability in cryoturbated permafrost-affected soils, Environ. Res. Lett., 17, 104023, https://doi.org/10.1088/1748-9326/ac9198, 2022.
Bernal, B., Megonigal, J. P., and Mozdzer, T. J.: An invasive wetland grass primes deep soil carbon pools, Glob. Change Biol., 23, 2104–2116, https://doi.org/10.1111/gcb.13539, 2017.
Bhattacharyya, S. S. and Furtak, K.: Soil–plant–microbe interactions determine soil biological fertility by altering rhizospheric nutrient cycling and biocrust formation, Sustainability, 15, 625, https://doi.org/10.3390/su15010625, 2022.
Chastain, S. G., Kohfeld, K. E., Pellatt, M. G., Olid, C., and Gailis, M.: Quantification of blue carbon in salt marshes of the Pacific coast of Canada, Biogeosciences, 19, 5751–5777, https://doi.org/10.5194/bg-19-5751-2022, 2022.
Davidson, E. A., Samanta, S., Caramori, S. S., and Savage, K.: The Dual Arrhenius and Michaelis–Menten kinetics model for decomposition of soil organic matter at hourly to seasonal time scales, Glob. Change Biol., 18, 371–384, https://doi.org/10.1111/j.1365-2486.2011.02546.x, 2012.
Duarte, C. M., Losada, I. J., Hendriks, I. E., Mazarrasa, I., and Marbà, N.: The role of coastal plant communities for climate change mitigation and adaptation, Nat. Clim. Change, 3, 961–968, https://doi.org/10.1038/nclimate1970, 2013.
Granse, D., Wanner, A., Stock, M., Jensen, K., and Mueller, P.: Plant–sediment interactions decouple inorganic from organic carbon stock development in salt marsh soils, Limnol. Oceanogr. Lett., 9, 469–477, https://doi.org/10.1002/lol2.10382, 2024.
Howes, B. L. and Teal, J. M.: Oxygen loss from Spartina alterniflora and its relationship to salt marsh oxygen balance, Oecologia, 97, 431–438, https://doi.org/10.1007/BF00325879, 1994.
IPCC: Global carbon and other biogeochemical cycles and feedbacks, in: Climate Change 2021: The Physical Science Basis, Cambridge University Press, Cambridge, UK and New York, NY, USA, 673–816, https://doi.org/10.1017/9781009157896.007, 2023.
Kirwan, M. L., Walters, D. C., Reay, W. G., and Carr, J. A.: Sea level driven marsh expansion in a coupled model of marsh erosion and migration, Geophys. Res. Lett., 43, 4366–4373, https://doi.org/10.1002/2016GL068507, 2016.
Knoblauch, C., Beer, C., Sosnin, A., Wagner, D., and Pfeiffer, E. M.: Predicting long-term carbon mineralization and trace gas production from thawing permafrost of Northeast Siberia, Glob. Change Biol., 19, 1160–1172, https://doi.org/10.1111/gcb.12116, 2013.
Koop-Jakobsen, K. and Wenzhöfer, F.: The dynamics of plant-mediated sediment oxygenation in Spartina anglica rhizospheres: a planar optode study, Estuar. Coast., 38, 951–963, https://doi.org/10.1007/s12237-014-9861-y, 2015.
Koop-Jakobsen, K., Fischer, J., and Wenzhöfer, F.: Survey of sediment oxygenation in rhizospheres of the saltmarsh grass Spartina anglica, Sci. Total Environ., 589, 191–199, https://doi.org/10.1016/j.scitotenv.2017.02.147, 2017.
Koop-Jakobsen, K., Mueller, P., Meier, R. J., Liebsch, G., and Jensen, K.: Plant–sediment interactions in salt marshes: an optode imaging study of O2, pH, and CO2 gradients in the rhizosphere, Front. Plant Sci., 9, 541, https://doi.org/10.3389/fpls.2018.00541, 2018.
Kühl, M., Scholz, V., Sorrell, B. K., Koop-Jakobsen, K., Meier, R. J., and Mueller, P.: Plant-mediated rhizosphere oxygenation in the native invasive salt marsh grass Elymus athericus, Front. Plant Sci., 12, 669751, https://doi.org/10.3389/fpls.2021.669751, 2021.
Morris, J. T., Sundareshwar, P. V., Nietch, C. T., Kjerfve, B., and Cahoon, D. R.: Responses of coastal wetlands to rising sea level, Ecology, 83, 2869–2877, https://doi.org/10.1890/0012-9658(2002)083[2869:ROCWTR]2.0.CO;2, 2002.
Moyano, F. E., Vasilyeva, N., and Menichetti, L.: Diffusion limitations and Michaelis–Menten kinetics as drivers of combined temperature and moisture effects on carbon fluxes of mineral soils, Biogeosciences, 15, 5031–5045, https://doi.org/10.5194/bg-15-5031-2018, 2018.
Mueller, P., Jensen, K., and Megonigal, J. P.: Plants mediate soil organic matter decomposition in response to sea level rise, Glob. Change Biol., 22, 404–414, https://doi.org/10.1111/gcb.13082, 2016.
Mueller, P., Mozdzer, T. J., Langley, J. A., Aoki, L. R., Noyce, G. L., and Megonigal, J. P.: Plant species determine tidal wetland methane response to sea level rise, Nat. Commun., 11, 1–9, https://doi.org/10.1038/s41467-020-18763-4, 2020.
Ouyang, X. and Lee, S. Y.: Updated estimates of carbon accumulation rates in coastal marsh sediments, Biogeosciences, 11, 5057–5071, https://doi.org/10.5194/bg-11-5057-2014, 2014.
Pezeshki, S. R. and DeLaune, R. D.: Soil oxidation-reduction in wetlands and its impact on plant functioning, Biology, 1, 196–221, https://doi.org/10.3390/biology1020196, 2012.
Rastetter, E. B., King, A. W., Cosby, B. J., Hornberger, G. M., O'Neill, R. V., and Hobbie, J. E.: Aggregating fine-scale ecological knowledge to model coarser-scale attributes of ecosystems, Ecol. Appl., 2, 55–70, https://doi.org/10.2307/1941889, 1992.
Rietl, A. J., Megonigal, J. P., Herbert, E. R., and Kirwan, M. L.: Vegetation type and decomposition priming mediate brackish marsh carbon accumulation under interacting facets of global change, Geophys. Res. Lett., 48, e2020GL092051, https://doi.org/10.1029/2020GL092051, 2021.
Saadaoui, Y., Porada, P., and Beer, C.: Scripts for modeling and simulating soil heterotrophic respiration, Version 2, Universität Hamburg [code], https://doi.org/10.25592/uhhfdm.17912, 10 June 2024.
Spivak, A. C., Sanderman, J., Bowen, J. L., Canuel, E. A., and Hopkinson, C. S.: Global-change controls on soil-carbon accumulation and loss in coastal vegetated ecosystems, Nat. Geosci., 12, 685–692, https://doi.org/10.1038/s41561-019-0435-2, 2019.
Swanson, K. M., Drexler, J. Z., Schoellhamer, D. H., Thorne, K. M., Casazza, M. L., Overton, C. T., Callaway, J. C., and Takekawa, J. Y.: Wetland accretion rate model of ecosystem resilience (WARMER) and its application to habitat sustainability for endangered species in the San Francisco Estuary, Estuar. Coast., 37, 476–492, https://doi.org/10.1007/s12237-013-9694-0, 2014.
Van der Nat, F.-J. W. A. and Middelburg, J. J.: Effects of two common macrophytes on methane dynamics in freshwater sediments, Biogeochemistry, 43, 79–104, https://doi.org/10.1023/A:1006076527187, 1998.
Visser, E. J. W., Colmer, T. D., Blom, C. W. P. M., and Voesenek, L. A. C. J.: Changes in growth, porosity, and radial oxygen loss from adventitious roots of selected mono- and dicotyledonous wetland species with contrasting types of aerenchyma, Plant Cell Environ., 23, 1237–1245, https://doi.org/10.1046/j.1365-3040.2000.00628.x, 2000.
Wilson, C. H. and Gerber, S.: Theoretical insights from upscaling Michaelis–Menten microbial dynamics in biogeochemical models: a dimensionless approach, Biogeosciences, 18, 5669–5679, https://doi.org/10.5194/bg-18-5669-2021, 2021.
Zhang, Y., Li, C., Trettin, C. C., Li, H., and Sun, G.: An integrated model of soil, hydrology, and vegetation for carbon dynamics in wetland ecosystems, Global Biogeochem. Cy., 16, 9-1–9-17, https://doi.org/10.1029/2001GB001838, 2002.
Zhou, Y., O'Meara, T., Cardon, Z. G., Wang, J., Sulman, B. N., Giblin, A. E., and Forbrich, I.: Simulated plant-mediated oxygen input has strong impacts on fine-scale porewater biogeochemistry and weak impacts on integrated methane fluxes in coastal wetlands, Biogeochemistry, 167, 945–963, https://doi.org/10.1007/s10533-024-01145-z, 2024.