the Creative Commons Attribution 4.0 License.
the Creative Commons Attribution 4.0 License.
 | 10 Apr 2018
Biogeochemical characteristics of suspended particulate matter in deep chlorophyll maximum layers in the southern East China Sea
Qianqian Liu
Baozhi Lin
Huawei Wang
Chen-Tung Arthur Chen
Continental shelves and marginal seas are key sites of particulate organic matter (POM) production, remineralization and sequestration, playing an important role in the global carbon cycle. Elemental and stable isotopic compositions of organic carbon and nitrogen are thus frequently used to characterize and distinguish POM and its sources in suspended particles and surface sediments in the marginal seas. Here we investigated suspended particulate matter (SPM) collected around deep chlorophyll maximum (DCM) layers in the southern East China Sea for particulate organic carbon and nitrogen (POC and PN) contents and their isotopic compositions (δ13CPOC and δ15NPN) to understand provenance and dynamics of POM. Hydrographic parameters (temperature, salinity and turbidity) indicated that the study area was weakly influenced by freshwater derived from the Yangtze River during summer 2013. Elemental and isotopic results showed a large variation in δ13CPOC (−25.8 to −18.2 ‰) and δ15NPN (3.8 to 8.0 ‰), but a narrow molar C ∕ N ratio (4.1–6.3) and low POC ∕ Chl a ratio (< 200 g g−1) in POM, and indicated that the POM in DCM layers was newly produced by phytoplankton. In addition to temperature effects, the range and distribution of δ13CPOC were controlled by variations in primary productivity and phytoplankton species composition; the former explained ∼ 70 % of the variability in δ13CPOC. However, the variation in δ15NPN was controlled by the nutrient status and δ15N in seawater, as indicated by similar spatial distribution between δ15NPN and the current pattern and water masses in the East China Sea; although interpretations of δ15NPN data should be verified with the nutrient data in future studies. Furthermore, the POM investigated was weakly influenced by the terrestrial OM supplied by the Yangtze River during summer 2013 due to the reduced sediment supply by the Yangtze River and north-eastward transport of riverine particles to the northern East China Sea. We demonstrated that the composition of POM around DCM layers in the southern East China Sea is highly dynamic and largely driven by phytoplankton abundance. Nonetheless, additional radiocarbon and biomarker data are needed to re-evaluate whether or not the POM around the DCM water depths is influenced by terrestrial OM in the river-dominated East China Sea.
- Article
(7728 KB) - Full-text XML
-
Supplement
(682 KB) - BibTeX
- EndNote


Stable isotopes of organic carbon and nitrogen (δ13C, δ15N) and molar carbon to nitrogen (C ∕ N) ratios are natural tracers frequently used to identify the source and fate of terrestrial organic matter (OM) in the estuarine and marine environments (Meyers, 1994; Hedges et al., 1997; Goñi et al., 2014; Selvaraj et al., 2015). This approach is based on the significant difference in δ13C, δ15N and C ∕ N ratios between different end-members (e.g. terrestrial and marine), and the assumption that only a physical mixing of OM from compositionally distinct end-members occurs in these marginal settings (Thornton and McManus, 1994; Hedges et al., 1986). Quantifying the relative contributions of end-members using mass balance models thus requires known and constant elemental and isotopic values of end-members and major sources of OM in the study region (e.g. Goñi et al., 2003). Therefore, application of mixing models for the discrimination of OM sources requires clearly identified representative values for local OM sources. However, in most cases, end-member values of δ13C, δ15N and molar C ∕ N ratios are represented by “typical” numbers, such as ca. −20 and −27 ‰ for δ13C of marine phytoplankton and terrestrial plants (Kandasamy and Nagender Nath, 2016, and references therein), respectively, but without measuring discrete end-member values in real, local or regional OM source materials. For example, a number of earlier studies failed to measure isotopic values of marine phytoplankton despite using end-member mixing models to distinguish marine versus terrestrial OM in surface sediments (e.g. Kao et al., 2003; Wu et al., 2013), or these numbers were simply represented by values of particulate organic matter (POM) in surface waters in the studied system (e.g. Zhang et al., 2007) or elsewhere from other ocean basins (e.g. Hale et al., 2012). It is known that stable isotopes (δ13C, δ15N) and molar C ∕ N ratios of POM in estuarine and marine areas are representative of primary production-derived OM when POM are mostly derived from phytoplankton biomass (Gearing et al., 1984). Since phytoplankton are the main primary producer of marine OM, the elemental and isotopic compositions of phytoplankton should therefore be considered while studying the dynamics of POM in the marine water column.
Chlorophyll a (Chl a) concentration in seawater is often used as an index of phytoplankton biomass (Cullen et al., 1982). The deep chlorophyll maximum (DCM) layer, which contributes significantly to the total biomass and primary production in the whole water column (Weston et al., 2005; Sullivan et al., 2010), is approximately equal to the subsurface biomass maximum layer (e.g. Sharples et al., 2001; Ryabov et al., 2010). The formation of maximum chlorophyll concentration at the DCM layer has been explained by several mechanisms: the differential zooplankton grazing with depths (Riley et al., 1949; Lorenzen, 1967; Pilati and Wurtsbaugh, 2003), adaption of phytoplankton to light intensities or to increased concentration of nutrients (Nielsen and Hansen, 1959; Gieskes et al., 1978; Hickman et al., 2012), chlorophyll accumulation by sinking detritus of phytoplankton (Gieskes et al., 1978; Karlson et al., 1996), decomposition of chlorophyll by light (Nielsen and Hansen, 1959), and wind-driven nitrate supply and nitrate uptake in seasonally stratified shelf seas (Hickman et al., 2012; Williams et al., 2013). The DCM layer is common in both coastal and open oceans, occurring at relatively shallow depths (1–50 m) in coastal seas, but at greater depths (80–130 m) in the open ocean (Cullen et al., 1982; Gong et al., 2015), and often variable in time and space (Karlson et al., 1996). For example, the DCM layers were reported at depths of 30–50 m across the shelf in the southern East China Sea (ECS) during summer from 1991 to 1995 (Gong et al., 2010). Hence, δ13C, δ15N and molar C ∕ N ratios of POM in the DCM layers of the continental shelf waters should reflect the δ13C, δ15N and molar C ∕ N ratios of phytoplankton (Savoye et al., 2003, 2012; Gao et al., 2014).
The East China Sea is one of the largest marginal seas in the world, receiving huge quantities of freshwater (905.1 km3 yr−1; Dai et al., 2010) and organic C (2.93 Tg C yr−1, Tg = 1012 g; Qi et al., 2014) from the Yangtze River (Changjiang). Nutrient-rich freshwater inputs in turn stimulate the water column productivity in coastal waters compared to the open ocean. Annual primary production over the entire shelf of the East China Sea is high relative to other marginal seas and was estimated to be 85 Tg C yr−1 in 2008 (Tan et al., 2011). Several studies have been carried out on the physical, chemical and biological aspects of the East China Sea, including distributions of seasonal currents (e.g. Gong et al., 2010), chemical hydrography and nutrient distribution (Chen, 1996, 2008), and phytoplankton species composition in the water column (e.g. Zheng et al., 2015; Jiang et al., 2015). Likewise, δ13C, δ15N and molar C ∕ N ratios of POM have been determined for a limited number of transects across the East China Sea (e.g. Wu et al., 2003, 2007a) as well as in a wide area of the western North Pacific marginal seas (Chen et al., 1996). Nonetheless, studies on elemental ratios and stable isotopic compositions of POM in DCM layers in the continental shelf of the East China Sea, especially along the indirect transport pathway of the Yangtze-derived terrestrial material to the Okinawa Trough (Chen et al., 2017), are poorly studied. A recent study in the northern East China Sea investigated elemental and isotopic compositions of POM in the surface, DCM and bottom layers on both seasonal and inter-annual timescales (Gao et al., 2014); however, there was minimal attention given to biogeochemical processes associated with the DCM. Here, we investigate δ13C, δ15N and molar C ∕ N ratios of suspended POM around the DCM layer in the continental margin of the East China Sea, in particular the area south of the Yangtze estuary, aiming (1) to comprehend the sources of POM in DCM layers and (2) to understand the factors controlling δ13C and δ15N dynamics in DCM layers of the southern East China Sea.
The East China Sea (Fig. 1) is the largest river-dominated marginal sea in the north-western Pacific region (Chen et al., 2017). The ECS shelf is wide (> 500 km), but relatively shallow (< 130 m) with an average water depth of 60 m (Gong et al., 2003; Liu et al., 2006). The Yangtze River (Fig. 1), with a catchment area of more than 1.94 × 10⁶ km2 (Liu et al., 2007), is the main source of freshwater and sediment to the continental shelf. It is the fifth largest river in terms of water discharge (900 km3 yr−1) and the fourth largest river in terms of sediment discharge (470 Mt yr−1) in the world (Milliman and Farnsworth, 2011).
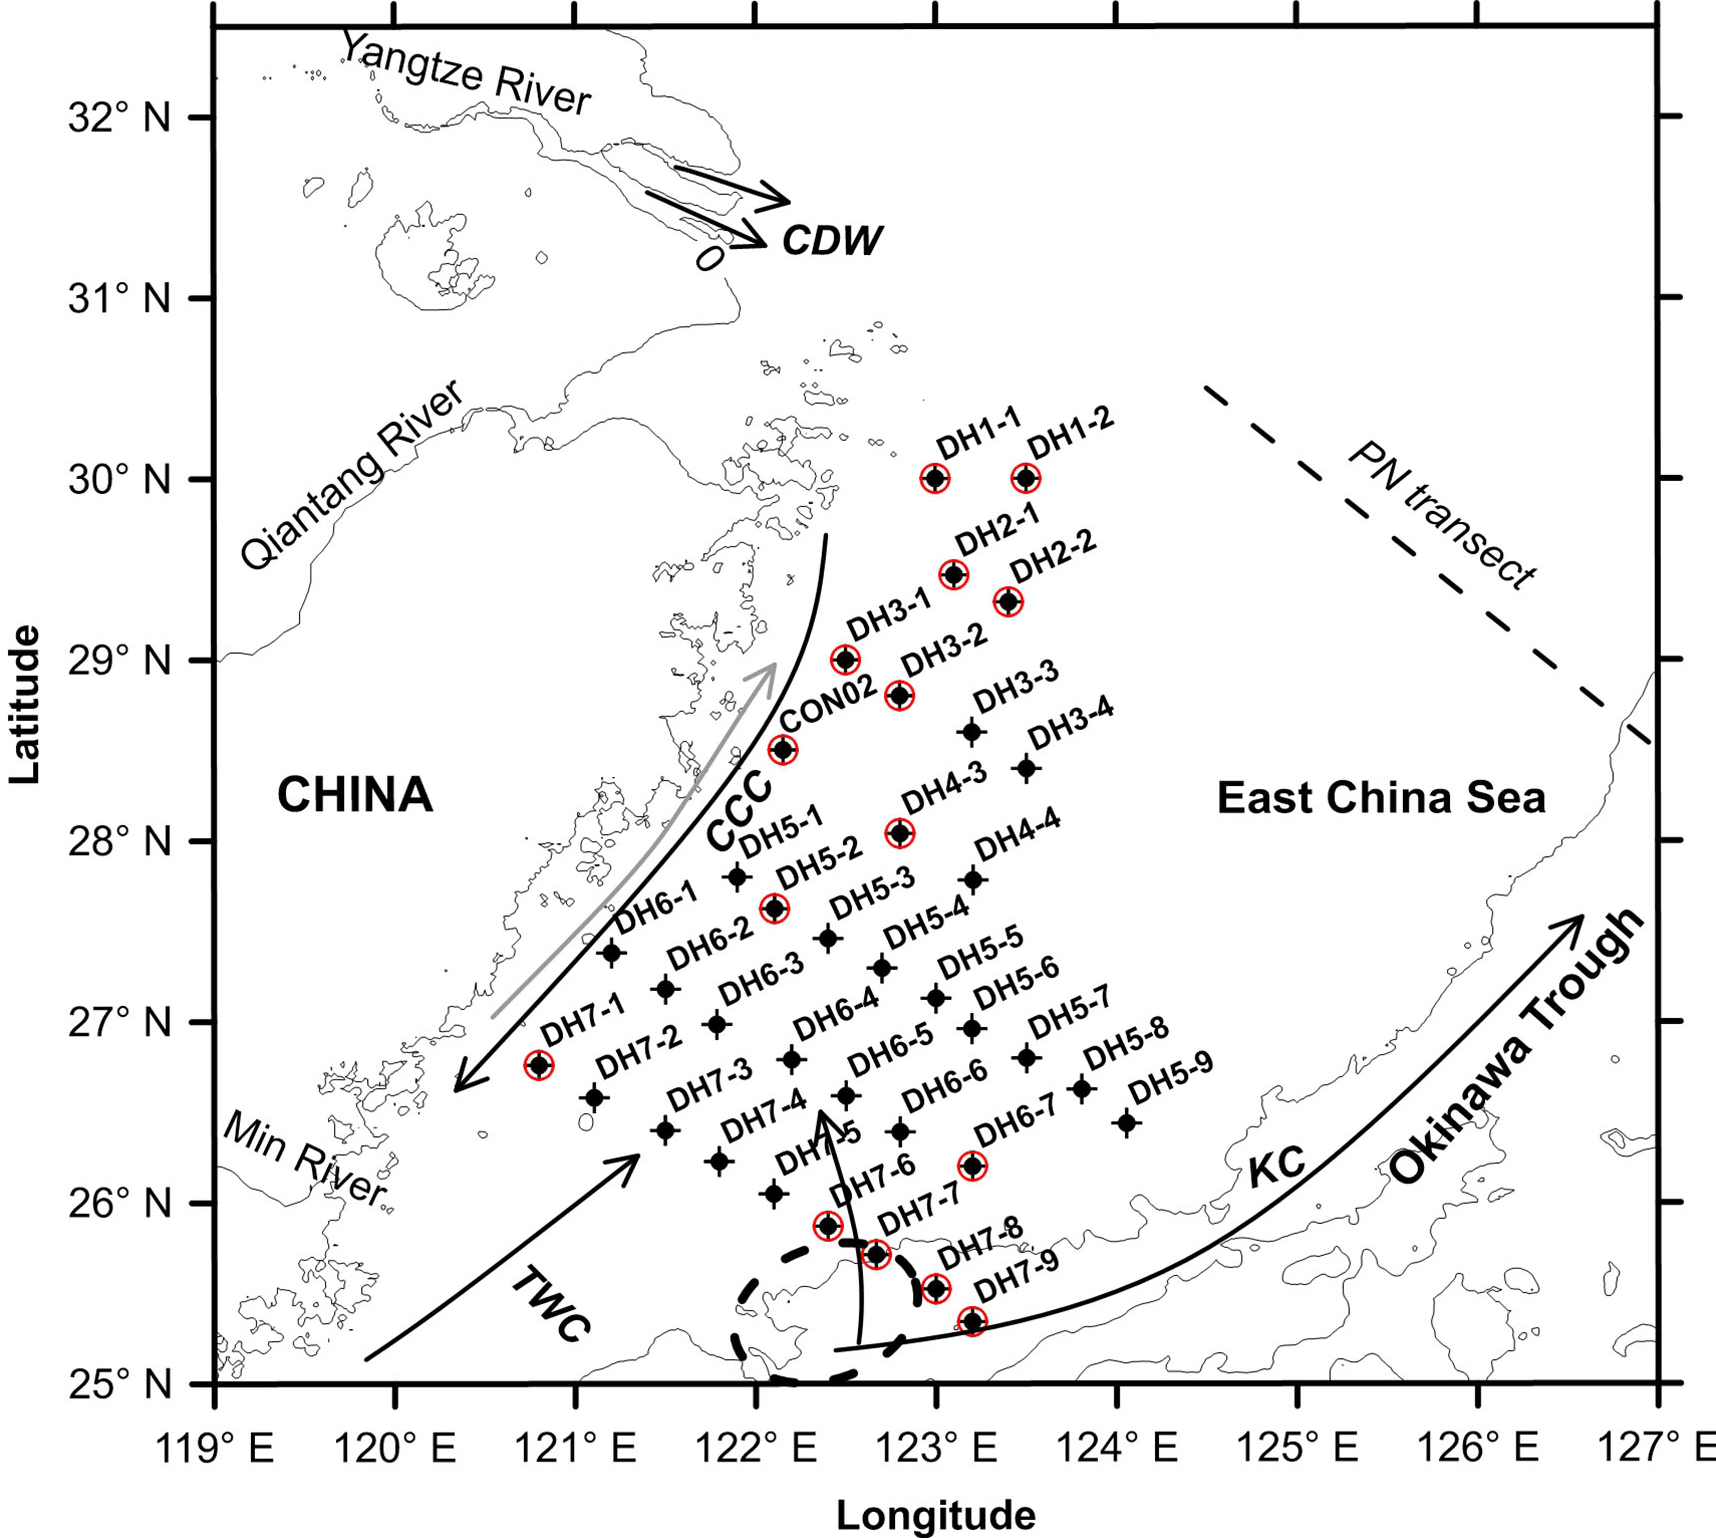
Figure 1Map showing the locations of suspended particulate matter (SPM) collected around the deep chlorophyll maximum (DCM) layer from the East China Sea during summer (22 June–21 July) 2013 for the present investigation. Also shown is the modern current pattern in the East China Sea. Red circles mark the SPM samples that were collected from the water depths either below or above but mostly contiguous to the DCM layer. CDW – Changjiang Diluted Water, CCC – China Coast Current, TWC – Taiwan Warm Current and KC – Kuroshio Current. The dashed ellipse represents the center of Kuroshio upwelling, occurring due to an abrupt change in the bottom topography, in the north-east of Taiwan Island (Wong et al., 2000). Also shown is the PN transect, a cross-shelf transect in the East China Sea in which particulate organic matter dynamics is relatively well studied.
In addition to the huge inputs of nutrients (dissolved inorganic nitrogen, DIN: 61.0 ± 13.5 × 10⁹ mol yr−1 for the interval of 1981–2006; Chai et al., 2009) and sediments from the Yangtze River, the ECS is characterized by a complex circulation pattern that is largely driven by the seasonally reversing East Asian monsoon winds (He et al., 2014; Chen et al., 2017). The surface circulation in the shelf is characterized by the south–north China Coastal Current (CCC) in the west, northward-moving Taiwan Warm Current (TWC) in the central part and the north-eastward-flowing Kuroshio Current (KC) in the east (Fig. 1) (Liu et al., 2006). The Changjiang Diluted Water (CDW) is a mixture of Yangtze River freshwater and the East China Sea shelf water and is characterized by a low salinity (< 30, Umezawa et al., 2014). Owing to a huge amount of freshwater discharge from the Yangtze into the ECS, it is thought that the CDW is the main component of CCC (Fig. 1). Because of the East Asian monsoon, where there is a strong north-east monsoon in winter and a weaker south-west monsoon in summer, the CDW flows southward along the coastline of mainland China as a narrow jet in winter (Chen, 2008; Han et al., 2013), whereas the same spreads mainly to the north-east in summer (Isobe et al., 2004). The TWC is a mixture of the warm water from the Taiwan Strait and intruding saline Kuroshio water; the latter is thought to be the most dominant source of heat and salt to the ECS (Su and Pan, 1987; Zhou et al., 2015). In addition, Kuroshio Subsurface Water (KSSW) is upwelled in the north-east off Taiwan Island due to an abrupt change in seafloor topography at the ECS outer shelf (dashed ellipse in Fig. 1) (Su et al., 1990; Sheu et al., 1999). The upwelled, oxygen-undersaturated KSSW is characterized by low temperature, high salinity and high nutrients (Liu et al., 1988; Wong et al., 1991). The water exchange rate between the ECS water and Kuroshio water was estimated to be about 22 000 ± 9000 km−3 yr−1, which is approximately 25 times the amount of Yangtze run-off into the ECS (Li, 1994; Sheu et al., 1999). Furthermore, Kuroshio water accounts for up to 90 % of the shelf water in the ECS (Chen, 1996; Sheu et al., 1999).
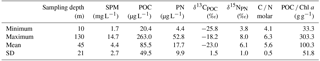
Table 1Summary statistics of elemental and isotopic compositions, as well as C ∕ N and POC ∕ Chl a ratios, of suspended particulate matter (SPM) around DCM layers in the southern East China Sea (n=36). Chl a is the converted value using the linear relationship between measured Chl a and chlorophyll fluorescence. SD = standard deviation.
The primary productivity in the ECS is limited by nitrogen in summer, but light in winter (Chen et al., 2001; Chen and Chen, 2003). With the highest primary production during summer, annual primary production showed distinct spatial and temporal variations of 155, 144 and 145 g C m−2 yr−1 in the north-western ECS, south-eastern ECS and the entire ECS, respectively, in 1998 (Gong et al., 2003). The primary productivity has, however, decreased by 86 % between 1998 and 2003 due to a large number of impoundments in the drainage basin of Yangtze River (Gong et al., 2006).
3.1 Sample collection
To investigate the biogeochemical characteristics of POM in the DCM layer of the southern East China Sea, suspended particles around the DCM water depths (10–130 m; Table 1) were collected from 36 stations along 7 transects across the continental shelf by the Science 3 cruise during summer (22 June–21 July) 2013 (Fig. 1). At each site, the physical properties of the water column were recorded by a conductivity–temperature–depth (CTD) rosette (Seabird, SBE911+) fitted with a Seapoint chlorophyll fluorometer to detect the fluorescence maximum (see Table S1 in the Supplement for the whole dataset). Seawater was collected using the rosette of Niskin water bottles attached to the CTD frame, and then stored in 5 L PVC bottles. All PVC bottles had been soaked in 0.1 M HCl and then cleaned by distilled water. The volume of each water sample was measured by graduated cylinder before filtration. Suspended particles were obtained by filtering 4.1–19.1 L of seawater collected around the fluorescence maximum layer through 0.7 µm/47 mm Whatman glass fiber filters (GF/F), which were wrapped in aluminium foil. The filtration was under an ultimate pressure of 0.08 MPa to avoid the rupturing of phytoplankton cells (Steinman et al., 2017). All filters had been pre-combusted at 450 ∘C for 4 h in a muffle furnace to remove the background carbon and pre-weighed to determine the concentration of suspended particulate matter (SPM). After filtration, filters were folded without rinsing, wrapped again in aluminium foil and then immediately stored at −20 ∘C in a freezer on-board before they were brought back to the laboratory for further analysis.
3.2 Determination of SPM concentration and analyses of Chl a, POC, PN, δ13C and δ15N
In the laboratory, filters with suspended particles were freeze-dried and then dried in an oven at 50 ∘C for 48 h. The weight difference between the dried filter and the same filter before the filtration was used to calculate the weight of SPM. Five SPM samples (DH1-2, DH2-1, DH3-1, DH7-1 and DH7-7; Fig. S1) from water depths ranging between 20 and 50 m were randomly selected for the measurement of chlorophyll a (Chl a) concentration. Chlorophyll a was extracted using 90 % acetone and then determined spectrophotometrically according to Lorenzen (1967) and Aminot and Rey (2000). Briefly, the absorbance of sample extraction was measured at 665 and 750 nm against a 90 % acetone blank before (E665o, E750o) and after (E665a, E750a) acidification with 1 % HCl by the UV-Vis spectrophotometer (UV 1800, Shimadzu). Chl a concentration (µg L−1) was calculated as follows: Chl a=11.4 × 2.43 × ((E665o − E750o) − (E665a − E750a)) × Ve∕L ×Vf, where Ve and Vf were the volumes of sample extraction and filtered seawater (mL), respectively, and L was the cuvette light path (cm) (Aminot and Rey, 2000).
Prior to the measurement of POC and PN contents and their stable isotope values (δ13CPOC and δ15NPN) in SPM samples, a half of each filter was placed in a culture dish and 3 mL of 1 N HCl was then added into the dish by a dropper. These were allowed to react for 16 h to remove inorganic carbon (mainly carbonate). The de-carbonated sample was dried at 50 ∘C for 48 h in an oven for HCl evaporation. Then a half of the de-carbonated filter (i.e. a quarter of the original filter, ∼ 11 mm) was then punched and placed in tin capsules for further analysis. The POC and PN contents and their δ13CPOC and δ15NPN compositions were measured at the Stable Isotope Facility of University of California Davis in the USA, by using an elemental analyser (EA) (Elementar Analysensysteme GmbH, Hanau, Germany) interfaced to a continuous flow isotope ratio mass spectrometer (IRMS; PDZ Europa 20–20, Sercon Ltd., Cheshire, UK). During the isotope (δ13CPOC and δ15NPN) analyses, different working standards (bovine liver, glutamic acid, enriched alanine and nylon 6) that were compositionally similar to the samples were used and were calibrated against NIST Standard Reference Materials (IAEA–N1, IAEA–N2, IAEA–N3, USGS–40 and USGS–41). The standard deviation was 0.2 ‰ for δ13C and 0.3 ‰ for δ15N. Isotopic values were presented in standard δ-notation as per mille deviations relative to the conventional standards, i.e. VPDB (Vienna Pee Dee Belemnite) for carbon and atmospheric N2 for nitrogen, that is δX (‰) = [(, where X=13C or 15N, R=13C/12C or 15N/14N, Rsample and Rstandard are the heavy (13C or 15N) to light (12C or 14N) isotope ratios of sample and standard, respectively (e.g. Selvaraj et al., 2015).

Figure 2Vertical distributions of temperature and salinity along seven transects across the southern East China Sea during summer 2013. Note that there is an obvious thermally stratified water column during the collection of suspended particles in the study area.
Lorrain et al. (2003) cautioned that the measurement of PN and δ15N after freezing increases the uncertainty of δ15N and, in combination with the concentrated HCl treatment, leads to a loss of PN and alteration of the δ15N signature. Therefore, PN content and δ15N values in the current study may have some bias due to de-carbonation. Nonetheless, a similar methodological approach has been adopted by Wu et al. (2003) while investigating suspended particles along the PN transect in the East China Sea (Fig. 1) and by Hung et al. (2007) while studying the suspended particles in the entire East China Sea. For instance, the range of δ15N values (∼ 3.8–8.4 ‰) obtained in the present study is comparable to the range of δ15N values (ca. 0.7–9.4 ‰) obtained by Wu et al. (2003) for the entire water column. In addition, precision for δ13C and δ15N decreases for samples containing less than 100 µgC and 20 µgN, respectively. Among 36 filters analysed for the present study, only 5 (3) filters contain less than 100 µgC (20 µgN).
4.1 Hydrographic characteristics and chlorophyll a
4.1.1 Temperature and salinity
Figure 2 illustrates the vertical distributions of temperature and salinity along seven transects across the ECS. Water temperature in the upper 300 m varied from 15 to 30 ∘C, with distinct thermal stratification of the water column across the entire study area (Fig. 2). The temperature decreases when depth increases and the highest temperature (∼ 30 ∘C) seen mostly in the surface water and the lowest temperature (5 ∘C) was observed in stations DH7–8 and DH7–9 at water depths of 850 and 800 m, respectively (Fig. 2 and Table S1). Temperature at sampling depths of SPM ranged from 19.1 to 28.2 ∘C, showing a general decreasing trend from the inner to outer shelf in each transect (Fig. 2).
Salinity in general shows an increasing trend with water depths (Fig. 2), varying from 26.9 to 34.8 with an average value of 34.6 for the entire water column. An increasing trend in salinity from the west to east is evident in all seven transects (Fig. 2). The low salinity (< 30) was constrained in the upper 10 m in four coastal stations (DH1–1, DH2–1, DH3–1, CON02; Fig. 2), wherein temperature is < 24 ∘C, indicating the limited influence of CDW plume in the study area. The middle salinity (30 < S < 34.1) was observed at a depth interval between 10 m and 30 m in stations (DH1–1, DH1–2, DH2–1, DH2–2, DH3–1; Fig. 2), but it spreads to a depth interval between the surface and 30 m in the remaining stations. High salinity was mostly prevalent at bottom depths in all stations investigated. The salinity distribution at depths of SPM sampling shows an increasing trend from the inner to outer shelf (Fig. 2) and varied from 32.7 to 34.7 with an average salinity of 34.0, indicating low influence of CDW at DCM depths in the study area.
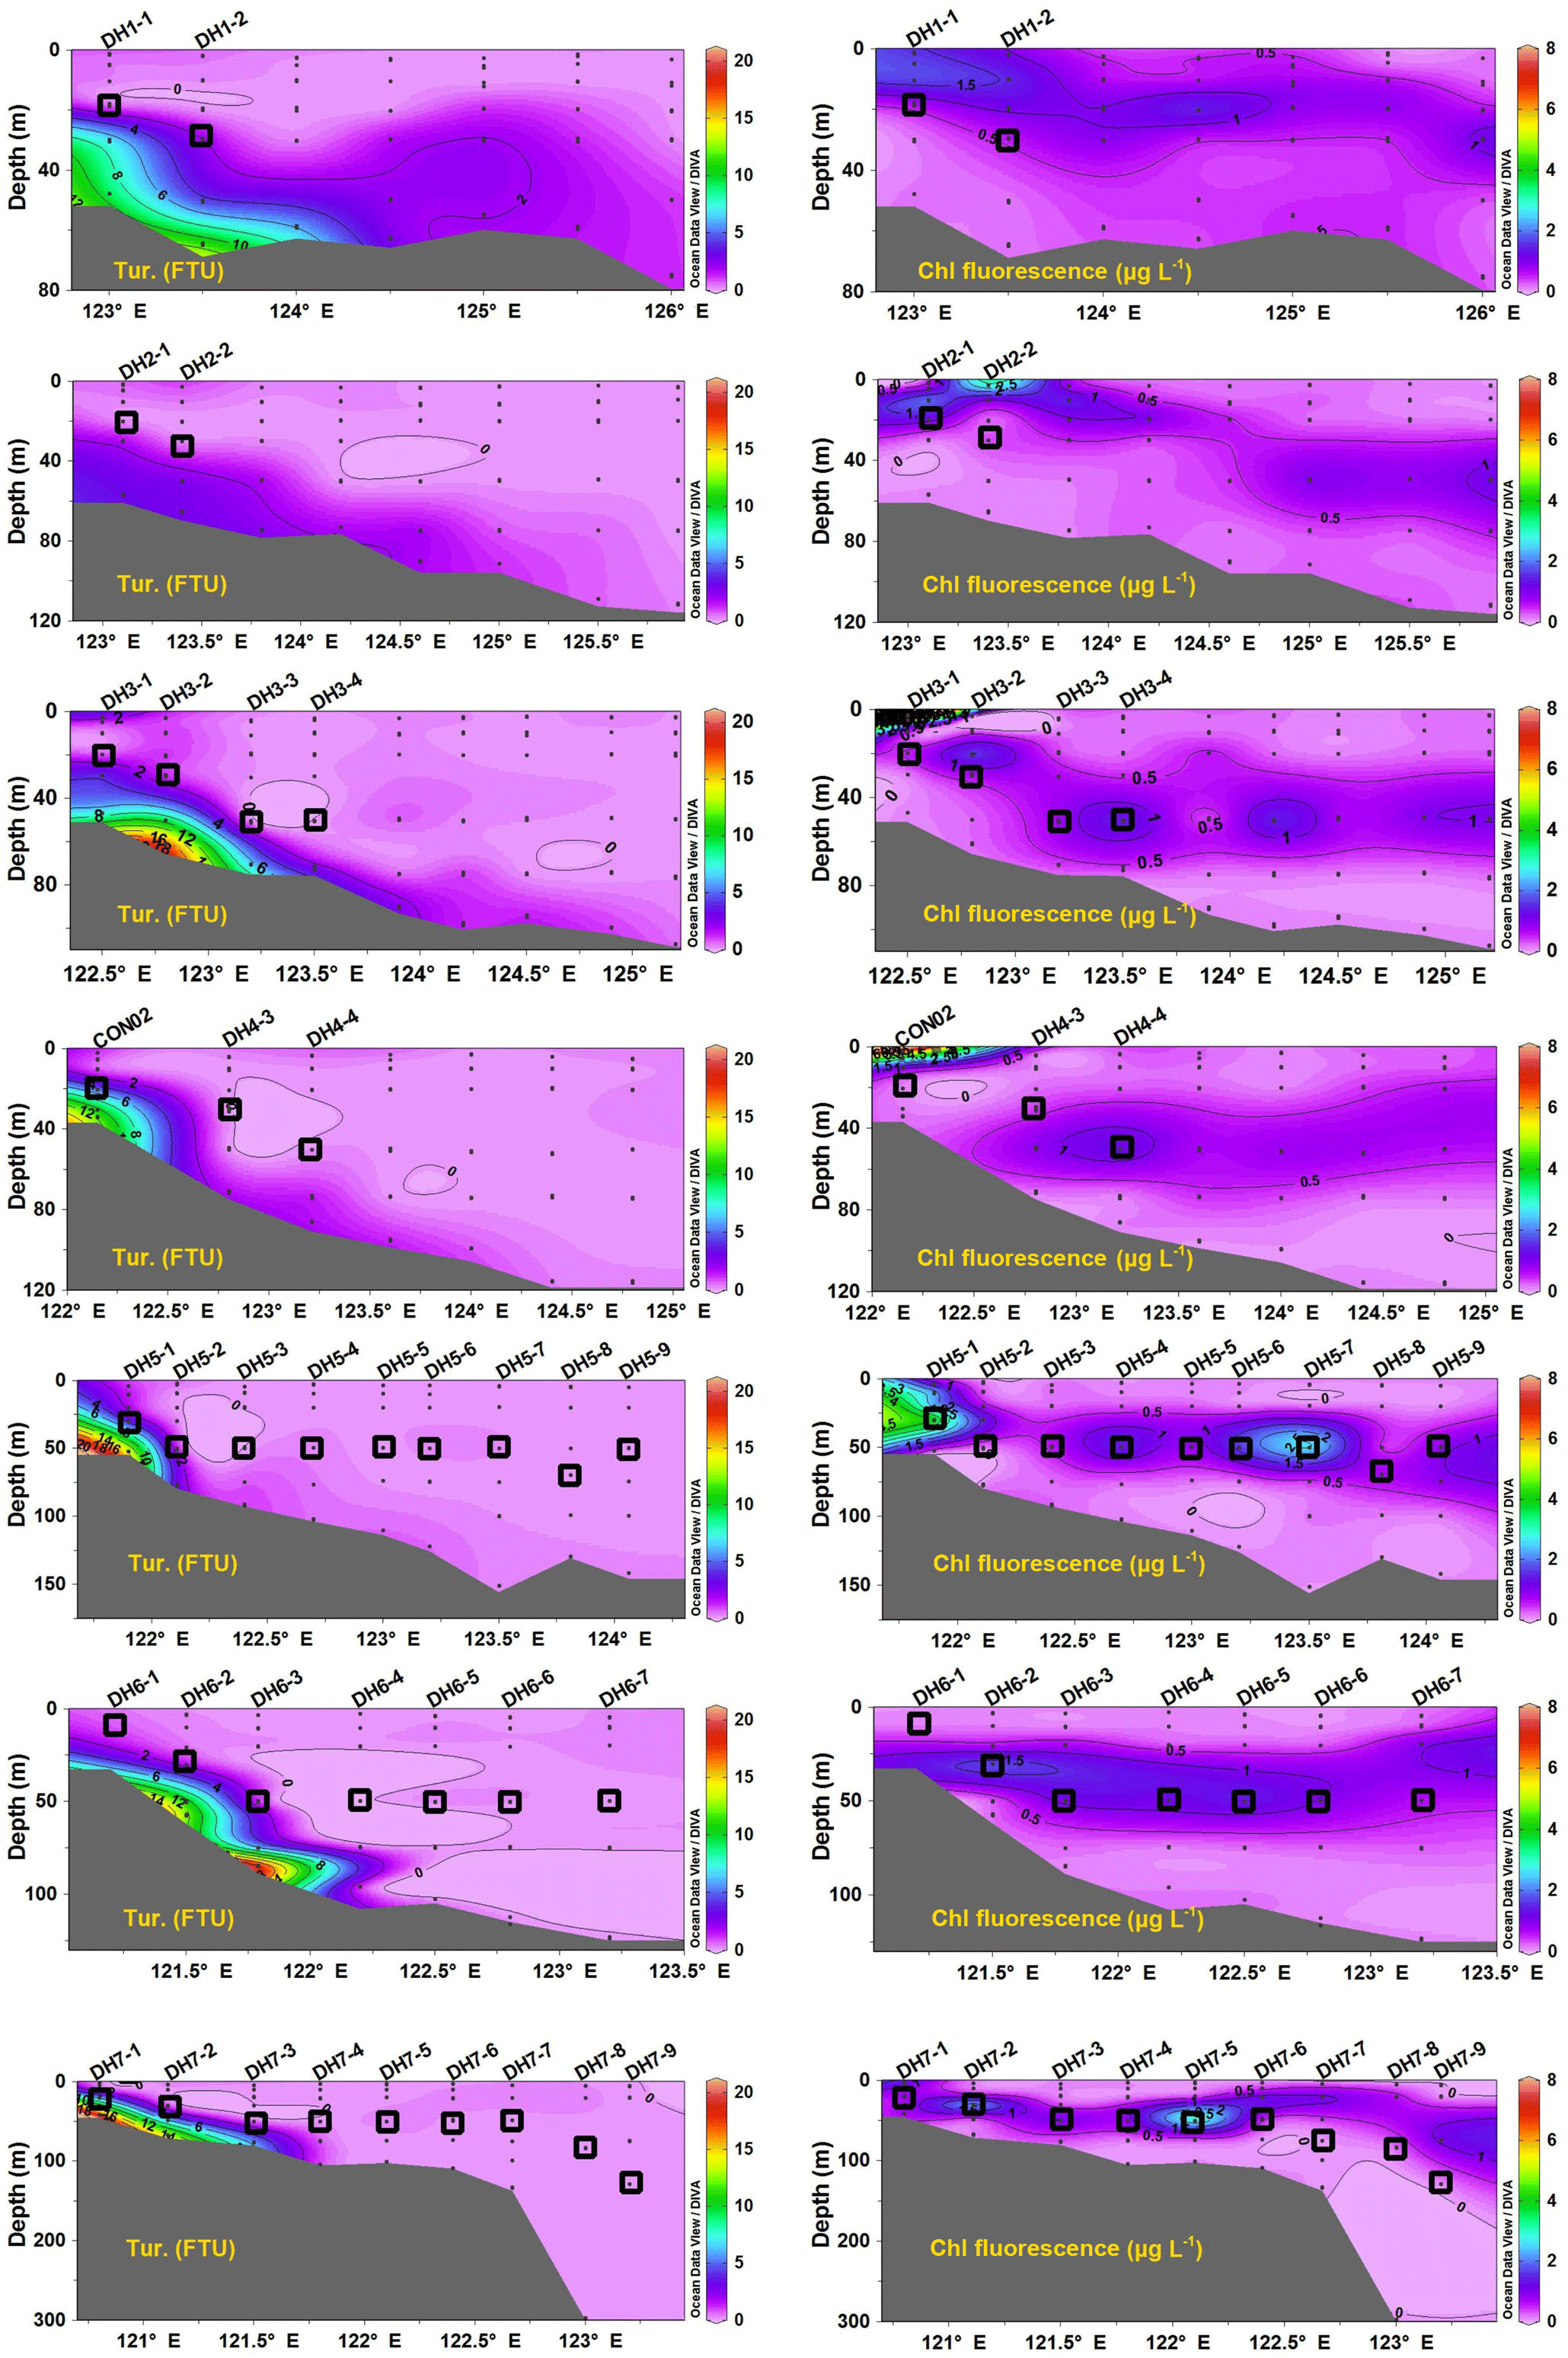
Figure 3Vertical distributions of turbidity (Tur.) and chlorophyll fluorescence (Chl fluorescence) concentration along seven cross-shelf transects in the southern East China Sea during summer 2013.
4.1.2 Turbidity
The turbidity in the water column of the ECS varied from 0.0 to 20.9 Formazin Turbidity Unit (FTU) (Fig. 3). In the inner shelf region, the vertical distribution of turbidity shows an obvious downward increasing trend and these high turbidity stations were limited along the coast (Fig. 3). This indicates sediment resuspension from the sea floor that was probably induced by hydrodynamic forces such as tides, waves and currents in the shallow coastal region. In the outer shelf stations, the turbidity was uniformly low from the surface to the bottom. Overall, most water depths where the SPM was sampled have low turbidity (< 2.0 FTU), except for stations CON02 (4.75), DH5–1 (3.44) and DH7–1 (5.52) (Fig. 3).
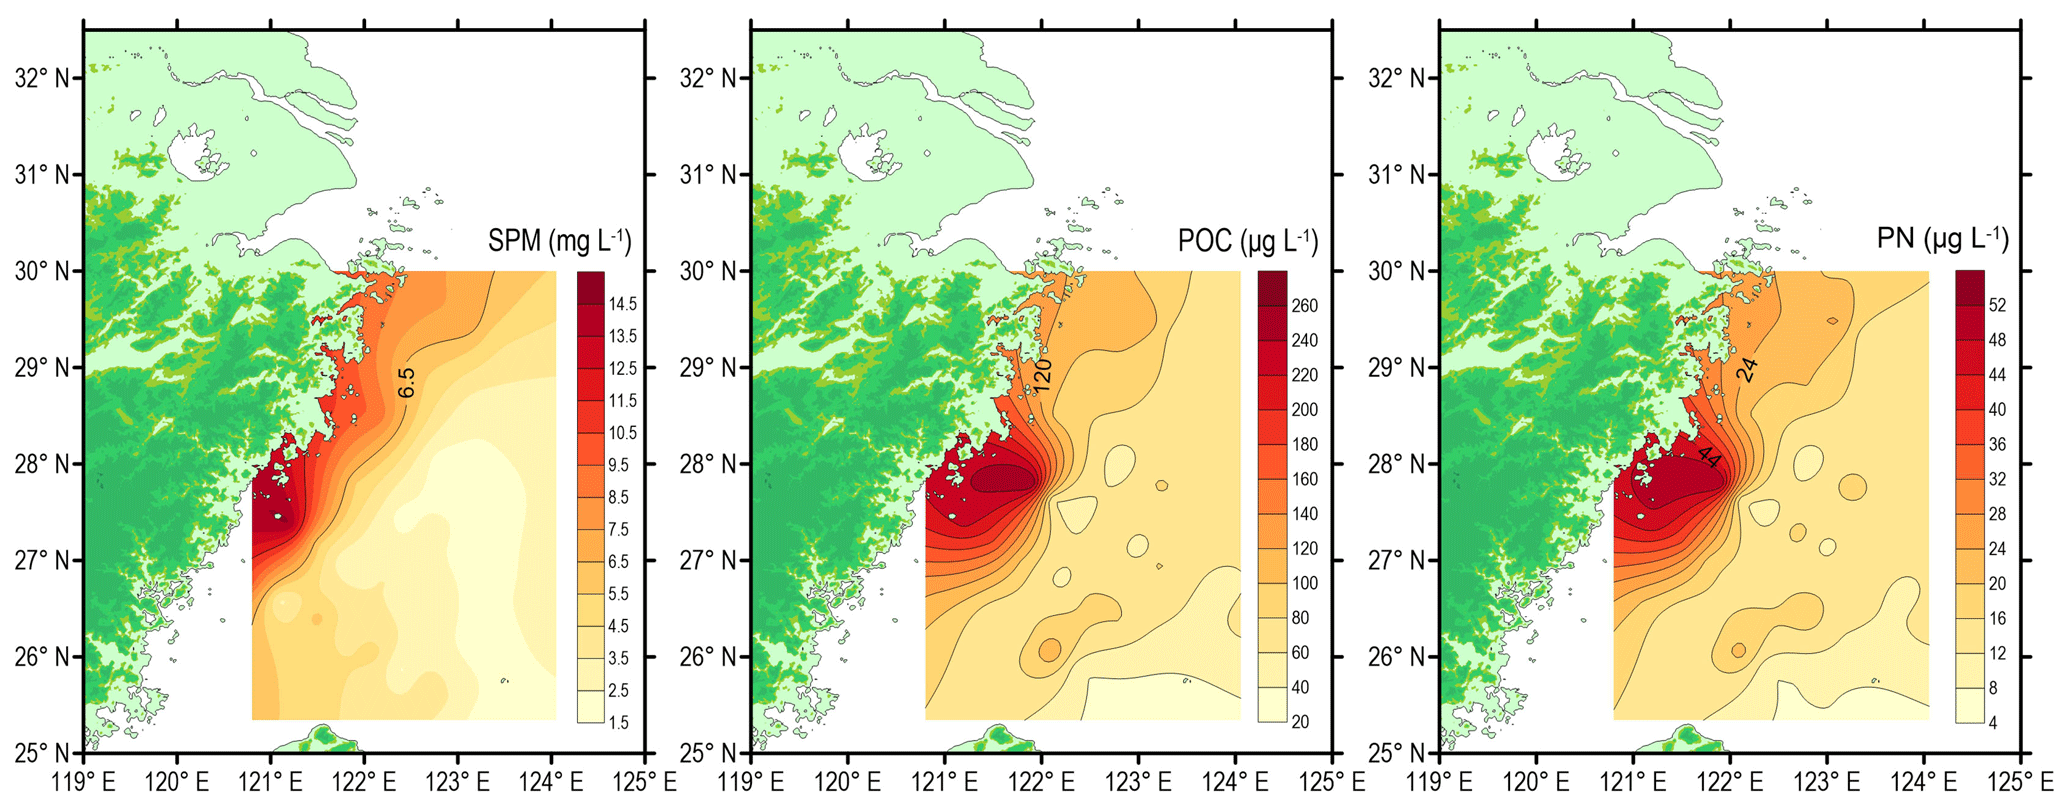
Figure 4Spatial distributions of suspended particulate matter (SPM, mg L−1), particulate organic carbon (POC, µg L−1) and particulate nitrogen (PN, µg L−1) around the deep chlorophyll maximum layer in the southern East China Sea during summer 2013.
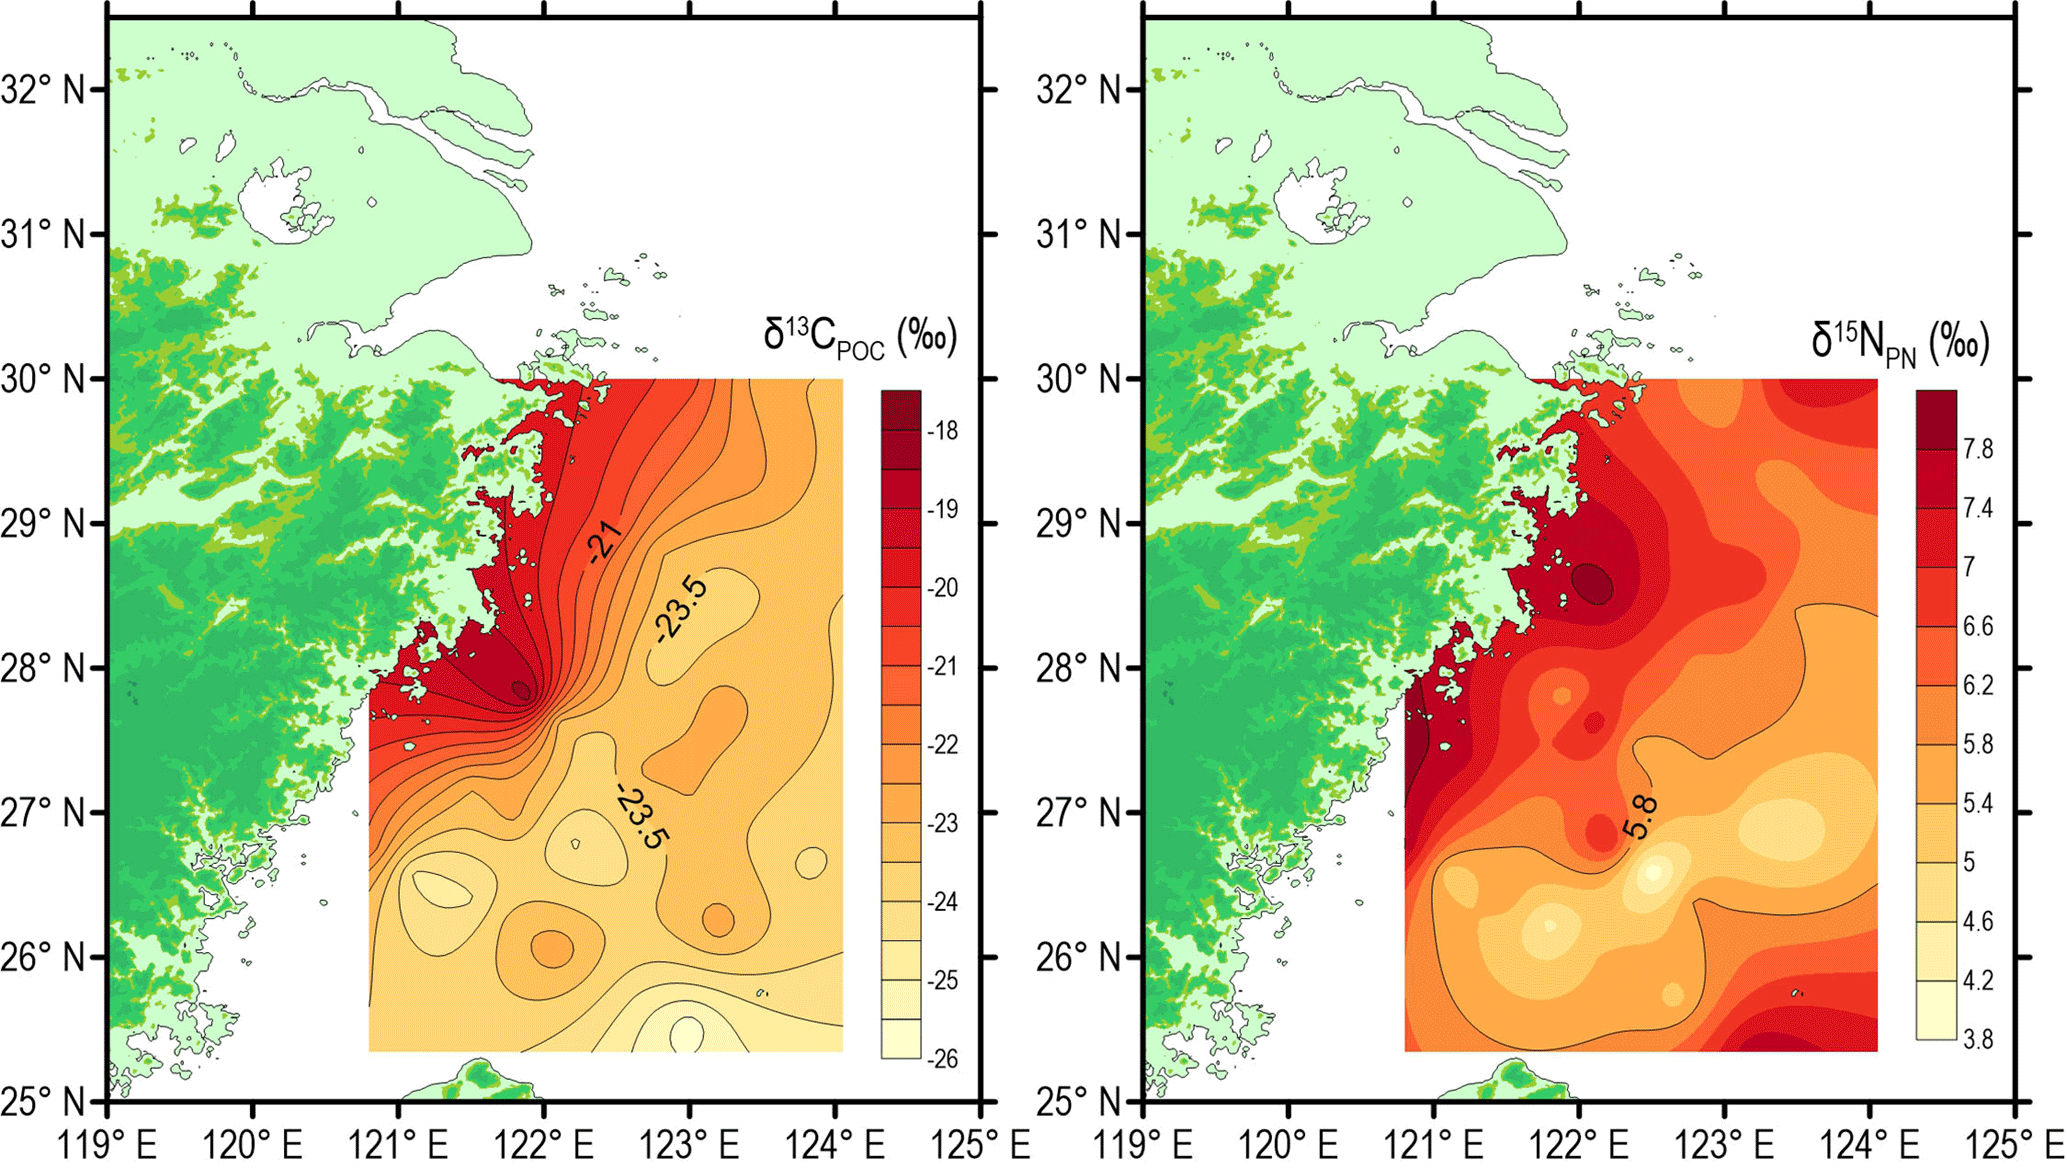
Figure 5Spatial distributions of stable isotopic values of particulate organic carbon and nitrogen (δ13CPOC and δ15NPN) around the deep chlorophyll maximum layer in the southern East China Sea during summer 2013.
4.1.3 Chlorophyll fluorescence and chlorophyll a (Chl a)
The highest chlorophyll fluorescence concentration (18.0 µg L−1) was observed in surface waters at station DH3–1 and all other values were less than 8.0 µg L−1 (Fig. 3). The vertical profiles of chlorophyll fluorescence usually showed a clear maximum in the subsurface layer at around 20 m in near-coastal stations and 50 m in outer shelf stations (Fig. 3). The chlorophyll fluorescence in the sampling depth ranged from 0.1 to 4.1 µg L−1. Around 70 % of SPM sampled in this study falls in the DCM and/or contiguous to the DCM layer (open squares in Fig. 3), ideally representing the biogeochemical behaviours of POM across the DCM layer. Based on the photosynthetically active radiation (PAR), we defined the euphotic depth as a depth at which the PAR is 1 % of its value at the sea surface and photosynthesis can take place (Kirk, 1994; Ravichandran et al., 2012; Guo et al., 2014a). The euphotic depth increased from the inner shelf (20 m) to the outer shelf (100 m) region. This is consistent with average euphotic depth of 33 m calculated based on the empirical relation: (PAR) (Kirk, 1994), where Kd(PAR) = 1.22Kd(490) (Tang et al., 2007; Ravichandran et al., 2012) and a mean value of 0.115 for Kd(490) for the East China Sea in summer was taken from Chen and Liu (2015). The presence of DCM layers near the euphotic depths suggests a close relationship between the light availability and deep chlorophyll maximum, and the OM in the SPM samples was likely to be dominated by the phytoplankton.
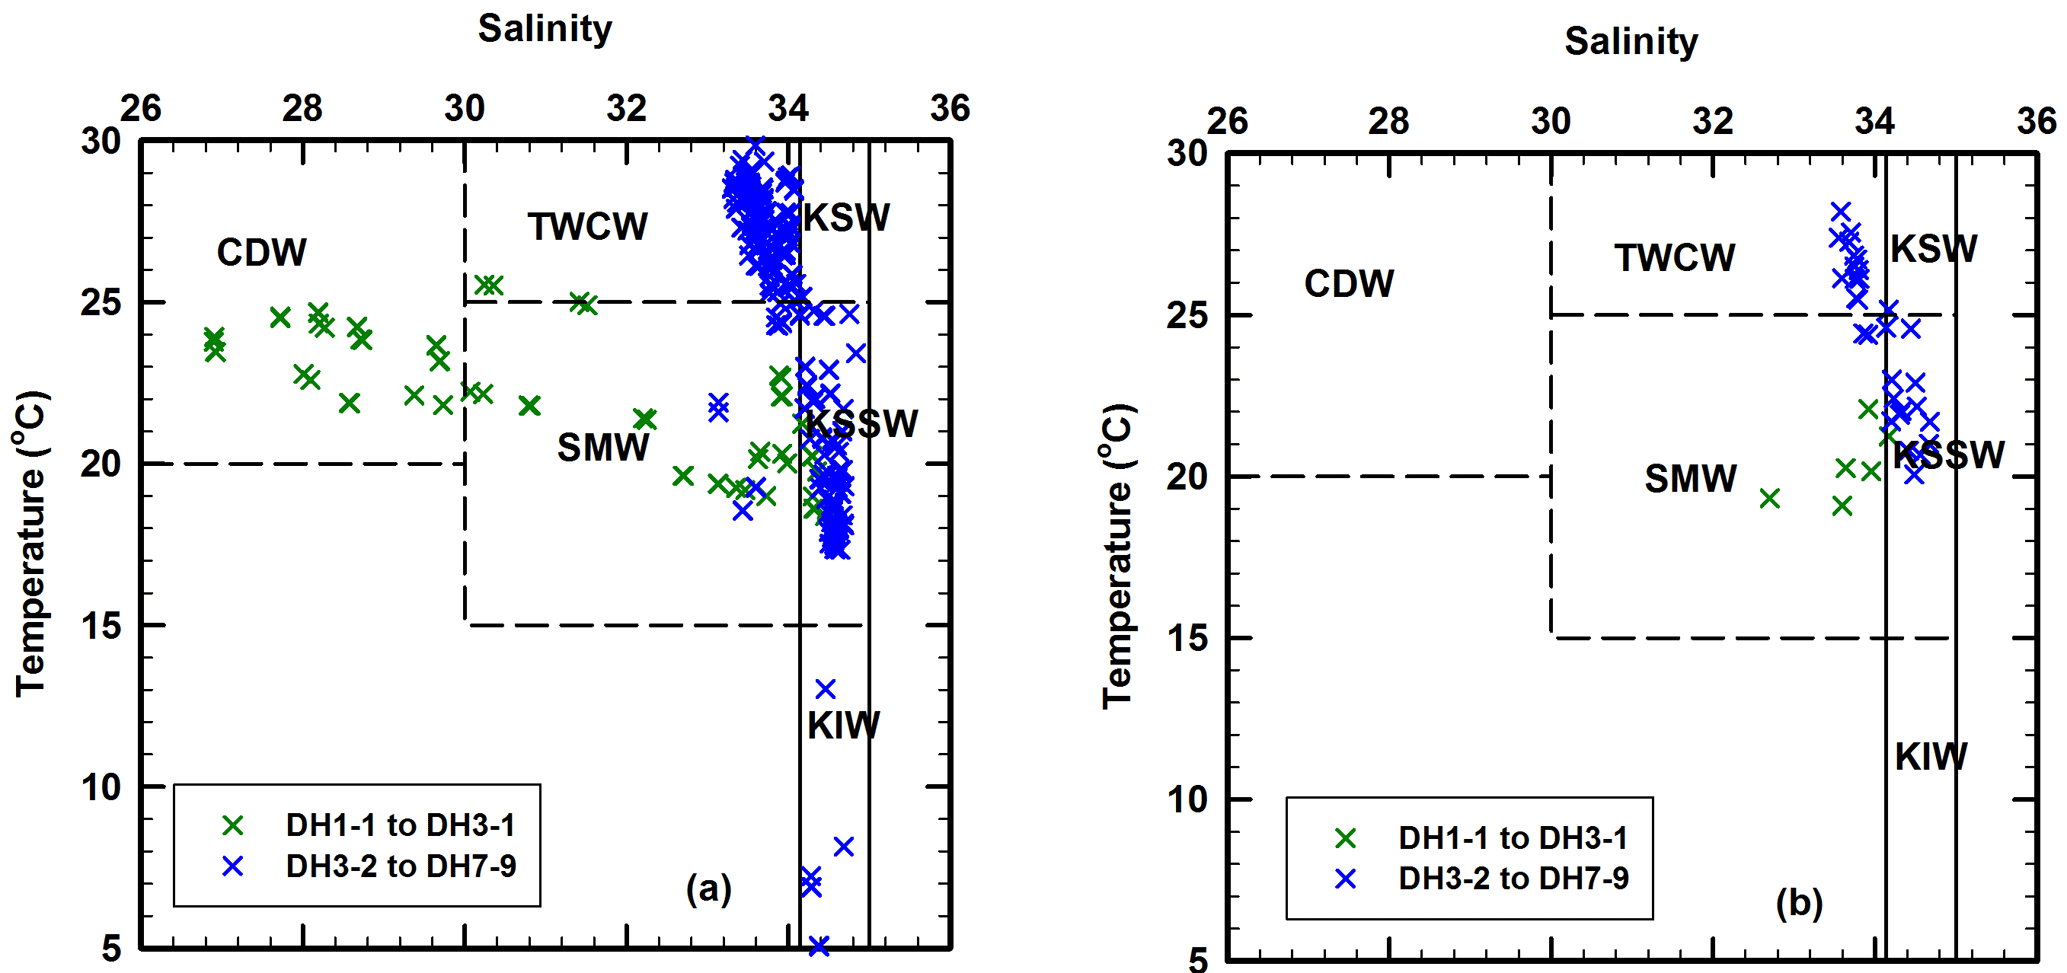
Figure 6Temperature–salinity (T–S) diagrams for (a) the entire water column in the East China Sea and (b) the deep chlorophyll maximum layer where the suspended particulate matter were collected for the present investigation. T–S ranges of six water masses are taken from Umezawa et al. (2014). CDW – Changjiang Diluted Water; TWCW – Taiwan Warm Current Water; SMW – Shelf Mixed Water; KSW – Kuroshio Surface Water; KSSW – Kuroshio Subsurface Water; KIW – Kuroshio Intermediate Water.
The linear correlation between the measured Chl a values and the fluorescence values obtained directly from the calibrated sensor attached with the CTD rosette is high, with R2=0.93 (see Fig. S1 in the Supplement). This relationship was used to convert the fluorescence values into Chl a concentration of all the remaining SPM using the following equation: , where y is Chl a concentration and x is in situ fluorescence value. The Chl a concentration varied from 0.28 to 3.08 µg L−1. The highest value is observed in near-coastal station DH5-1, whereas the lowest value is noted in station DH7-9 located off north-east Taiwan. The converted Chl a values were used to calculate the POC ∕ Chl a ratio (Table S1), which is discussed in Sect. 5.2.2.
4.2 POC and PN
The concentration of SPM ranged from 1.7 to 14.7 mg L−1 with a mean value of 4.4 mg L−1 (Table 1). The spatial distribution of SPM showed higher values in the inner shelf region and lower values in the outer shelf region (Fig. 4), consistent with the water column turbidity (Fig. 3). The POC concentrations in the DCM layer varied between 20.4 and 263.0 µg L−1, with a mean value of 85.5 µg L−1 (n=36) (Fig. 4). The PN ranged from 4.4 to 52.8 µg L−1, with a mean value of 17.7 µg L−1 (n=36). The spatial distributions of POC and PN resemble each other (Fig. 4). The highest concentrations of POC (263 µg L−1) and PN (52.8 µg L−1) were associated with station DH5-1 (Fig. 4 and Table S1). POC and PN concentrations were higher near the coast on the inner shelf (> 90 and > 21 µg L−1, respectively) and decreased gradually with distance offshore (Fig. 4). Lower concentrations of POC and PN are observed in the easternmost stations, near north-eastern Taiwan Island (Fig. 4). Although the concentrations of both POC and PN varied by more than an order of magnitude (Fig. 4), the molar C ∕ N ratios are fairly uniform at DCM layers throughout sampling, ranging from 4.1 to 6.3 with a mean ratio of 5.6 ± 0.5 (n=36) (Table 1).
4.3 δ13CPOC and δ15NPN
Spatial distributions of δ13CPOC and δ15NPN around DCM layers are presented in Fig. 5. The δ13CPOC decreased from the inner shelf to offshore region, varying widely from −25.8 to −18.2 ‰ (Table 1). Consistent with the POC concentration, the highest δ13CPOC value (−18.2 ‰) is also associated with the coastal station DH5-1. The range of δ15NPN is 4.2 ‰, varying between 3.8 and 8.0 ‰ (Table 1). The lowest δ13CPOC values (−25.8 and −25.2 ‰) were observed north-east of Taiwan Island in the Okinawa Trough, whereas δ15NPN values (6.73 and 7.78 ‰) in this region were higher than those of the surrounding area (Fig. 5). The spatial distribution of δ13CPOC was quite similar to the spatial distribution of POC (Fig. 4), and the correlation coefficient (R2) between δ13CPOC and POC was 0.55 (p < 0.0001; Fig. 10).
5.1 Influence of different water masses in the southern ECS
In order to identify the different water sources in the study area, temperature–salinity (T–S) diagrams were drawn for the entire water column (Fig. 6a) as well as for the SPM sampling depth around DCM layers (Fig. 6b). The T–S diagram for all the water depths shows a convergence at around 17 ∘C, 34.6 (Fig. 6a), representing the upwelling of KSSW (Umezawa et al., 2014). There are two trends in the T–S diagram, indicating a mixing of three water masses: one is less saline and much colder water, mainly CDW, another is more saline and warmer, mainly Taiwan Warm Current Water (TWCW), and the third one is KSSW (Fig. 6a). The low salinity observed at five coastal sites (DH1-1, DH2-1, DH2-2, DH3-1 and CON02; Fig. 2) indicates the influence of CDW mostly in surface water, but also some of the DCM depths where water was sampled for SPM. This is also evident from Fig. 6b where five stations fall within the area of shelf mixed water (SMW), which is a water body composed of a mixing between CDW and KSSW. However, apart from at these five coastal stations, most DCM depths where water was sampled for SPM seem to be weakly influenced by the CDW (Fig. 6b). Based on the T–S range of different water masses (Fig. 6), we further delineated the area and water depths influenced by three important water masses: CDW, TWCW and KSSW (Fig. 7). Interestingly, the influence of CDW was constrained to the upper 10 m in five coastal stations, whereas TWCW influenced the upper 30 m and covered three quarters of the study region, with KSSW largely influencing the bottom water across the entire study region (Figs. 2, 6a and 7).

Figure 7A diagram delineating the regions influenced by three main water masses based on the T–S relationship (Figs. 2 and 6) in the study area. Area with grey polygon represents the influence of CDW, which is limited only in the upper 10 m. The sky-blue area represents the dominance of TWCW, which is limited to ∼ 30 m below the surface. The polygon coloured by deep blue represents the area influenced by the KSSW, indicating that the bottom water of the entire study area was dominated by KSSW.
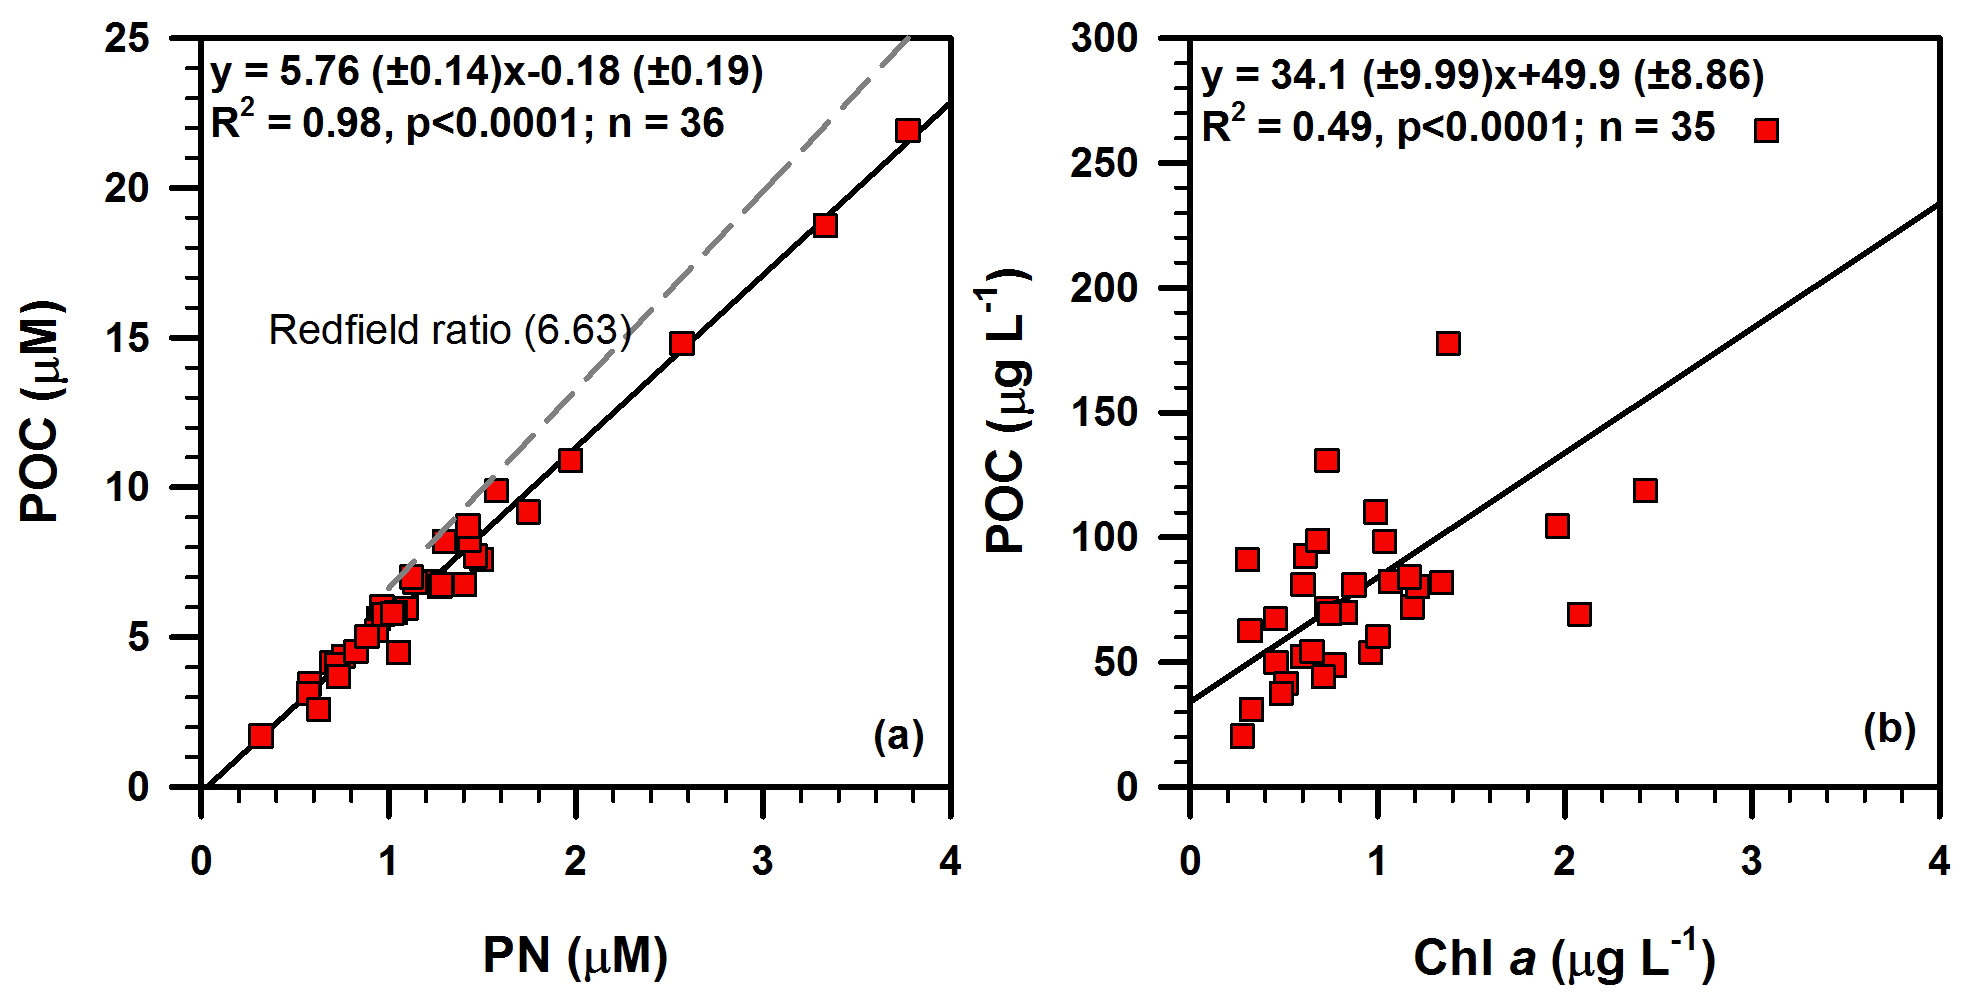
Figure 8Bi-plots showing the relationships of (a) POC vs. PN and (b) POC vs. Chl a in suspended particulate matter investigated in this study. Redfield ratio (dashed line in panel a) is taken from Redfield (1958).
In summary, although the river run-off was huge, the influence of CDW plume in the southern part of the ECS was weak during summer 2013 mainly because most of the CDW plume was transported north-eastward of the Yangtze estuary to the Korean coast (Isobe et al., 2004; Bai et al., 2014; Gao et al., 2014). This contrasts with summer 2003 when the plume front moved southward (Bai et al., 2014). Meanwhile, the intrusion of TWCW and KSSW was strong in the continental shelf of the East China Sea during summer 2013.
5.2 Characterization of POM in DCM layers
5.2.1 Molar C ∕ N ratio
A necessary first step in the source analysis of POM using bulk carbon and nitrogen isotopes as well as the molar carbon to nitrogen ratio is to identify the form of total nitrogen in the measured SPM, so that inorganic nitrogen is not mis-assigned as nitrogenous organic end-member (Hedges et al., 1986). The linear relationship between POC and PN (R2=0.98, p < 0.0001; Fig. 8a) suggests that nitrogen is strongly associated with organic carbon. The slope of linear regression of POC against PN corresponds to a molar C ∕ N ratio of 5.76 (Fig. 8a). The positive intercept on the PN axis when POC is zero represents the amount of inorganic nitrogen (∼ 0.03 µM), indicating that essentially all nitrogen is in organic form. The molar C ∕ N ratios of all SPM samples (4.1–6.3) from the DCM layers are lower than the canonical Redfield ratio (6.63) (Fig. 8a), but are similar to the average molar C ∕ N ratios of 5.6 for marine POM (Copin-Montegut and Copin-Montegut, 1983) and 6 for POM in cold, nutrient-rich waters at high latitudes (Martiny et al., 2013). The range also falls within the range of 3.8 to 17 reported for marine POM (Geider and La Roche, 2002), but it is higher than an unprecedented low C ∕ N ratio (2.65 ± 0.19) of POM in the Canada Basin that was attributed to a dominant contribution of smaller-sized (< 8 µm) phytoplankton to POC (Crawford et al., 2015). Wu et al. (2003) investigated the C ∕ N ratio of POM (4.3–29.2) at all depths along the PN transect, a standard cross-shelf section extending from the Yangtze estuary south-east to the Ryukyu Islands, cross-cutting the Okinawa Trough and perpendicular to the principle axis of Kuroshio Current in the ECS (Fig. 1). Liu et al. (1998) measured the C ∕ N ratio of POM in the surface water of the ECS and found a wider C ∕ N ratio from 4.0 to 26.9 with a mean ratio of 7.6 in spring and from 4.7 to 34.3 with a mean ratio of 15.2 in autumn 1994. The authors attributed the lower C ∕ N in spring to more intense biological activity than in autumn, and the spatial distribution of C ∕ N was thought to be related to that of phytoplankton abundance.
Characteristically, a narrow range of low C ∕ N ratios in our SPM samples and less influence of CDW in the study region (Fig. 7) confirm the lack of terrestrial signals transported mainly by the Yangtze River. We therefore suggest that the POM in the DCM layers of the southern East China Sea is dominated by marine-sourced OM with an unrecognized contribution of terrestrial OM. Low C ∕ N ratios further restrict the assumption of degradation of nitrogen-rich OM, a process that normally increases the C ∕ N ratio to more than that of the Redfield ratio. Therefore, the molar C ∕ N ratio can be better explained as a source signal of OM rather than OM degradation in the SPM investigated in this study.
5.2.2 POC ∕ Chl a ratio
The linear correlation between POC and Chl a (R2=0.49, p<0.0001; Fig. 8b) further indicates that the phytoplankton productivity is largely responsible for the POC production in the SPM samples. Moreover, the POC ∕ Chl a ratio of 34.1 g g−1 derived from the slope of a regression line () (Fig. 8b) is consistent with the reported POC ∕ Chl a ratios in the ECS (36.1 g g−1; Chang et al., 2003) and the north-western Pacific (48 g g−1; Furuya, 1990). However, the POC ∕ Chl a ratio obtained in this study is lower than that estimated (64 g g−1) for the sinking particles in the ECS and the Kuroshio region, off north-eastern Taiwan Island (Hung et al., 2013). The range is well within the range (13–93 g g−1) reported for POM in the ECS by Chang et al. (2003) and is also consistent with the range (18–94 g g−1) estimated from phytoplankton cell volumes by the same authors. Although the Chl a concentration in our study was converted based on the linear relationship between measured Chl a and in situ fluorescence values (see Sect. 3.2 and Fig. S1 in the Supplement for more details), it is more or less similar to Chl a concentrations obtained in the above-mentioned studies, which were mostly extracted from filtered particles (Chang et al., 2003; Hung et al., 2013).
The POC ∕ Chl a ratio has been used for the discrimination of POM sources in coastal ocean waters (Cifuentes et al., 1988). The POC ∕ Chl a ratio in living phytoplankton varies with temperature, growth rate, day length, phytoplankton species and irradiance (Savoye et al., 2003 and references therein). The POC ∕ Chl a ratio of living phytoplankton was reported to be between 40 and 140 g g−1 (Geider, 1987; Thompson et al., 1992; Montagnes et al., 1994; Head et al., 1996). Furthermore, a POC ∕ Chl a ratio of less than 200 g g−1 is an indication of a predominance of newly produced phytoplankton (or autotrophic-dominated) in POM, and that a value higher than 200 g g−1 is an indication of detrital or degraded organic matter (or heterotrophic/mixture-dominated) (Cifuentes et al., 1988; Savoye et al., 2003; Liénart et al., 2016). The POC ∕ Chl a ratio in the DCM layer of the ECS is almost < 200 g g−1 (33–200 g g−1), with one exception (CON02: 303 g g−1; Fig. 9), indicating that POM in the DCM layers of ECS was dominated by phytoplankton, as also indicated by the low C ∕ N ratios (4.1–6.3). The relatively high POC ∕ Chl a ratio in only one station, CON02 (Fig. 9), suggests that the POM in this sample was likely sourced from degraded phytoplankton OM, terrestrial OM or heterotrophic-dominated OM. However, the molar C ∕ N ratio of CON02 (5.3) is lower than the canonical Redfield ratio (6.63), eliminating the probability of degraded and terrestrial OM sources. In addition, the insignificant linear correlation between the C ∕ N ratio and POC ∕ Chl a ratio (Fig. 9) supports the non-degraded POM, a process resulting in a simultaneous increase in C ∕ N and POC ∕ Chl a ratios, mainly because of the preferential decomposition of N-rich OM, as well as a fast degradation of Chl a than the bulk POC pool (e.g. Savoye et al., 2003). Thus, the POM in CON02 seems to be dominated by heterotrophic biota, though the exact reason for the dominance of heterotrophic biota at only one location in our study area is unknown and needs further investigation.
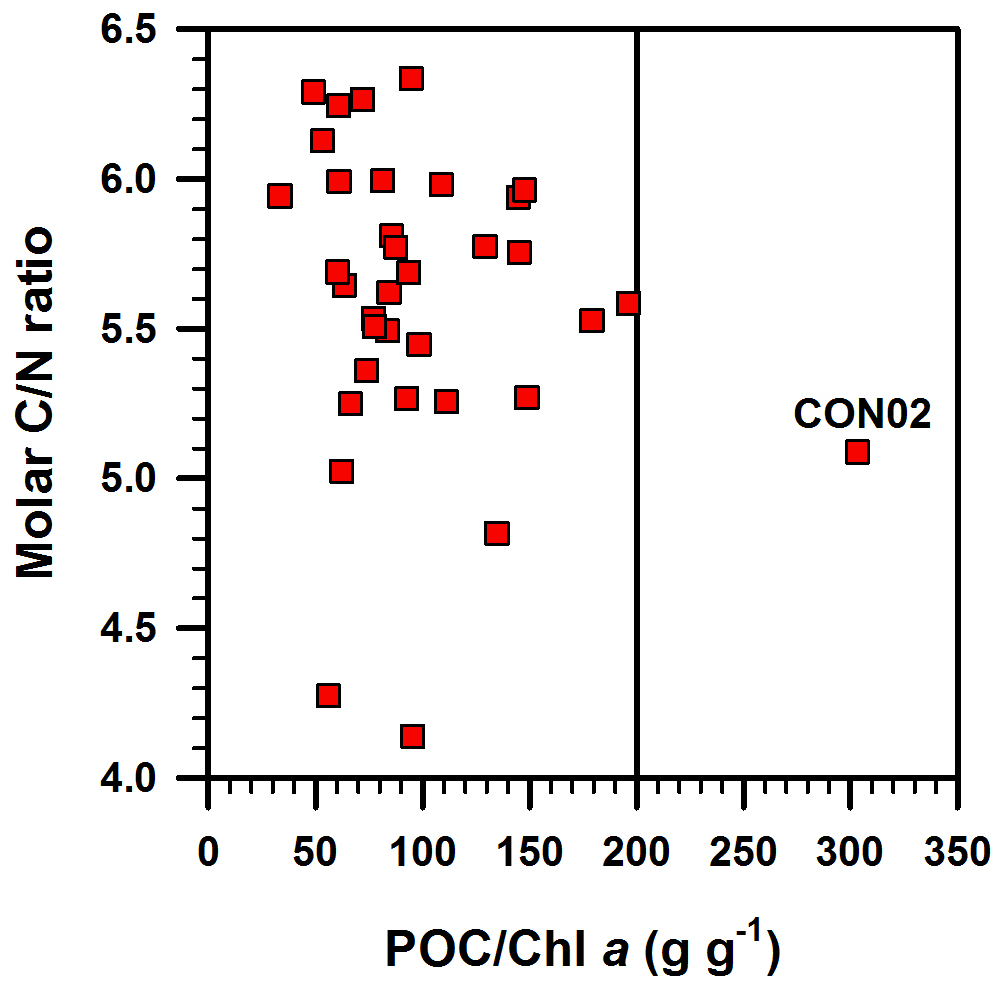
Figure 9Molar C ∕ N ratio vs. POC ∕ Chl a ratio in suspended particulates investigated in this study. The vertical line represents POC ∕ Chl a ratio of 200 g g−1, the upper limit for phytoplankton-dominated particulate organic matter (Savoye et al., 2003). See text for more details. CON02 is the station where red tide was observed during the sampling time and the colour of the surface water was brown and dissolved oxygen in the bottom water was 1.6 mg L−1.
Briefly, several clues indicate the predominance of newly produced, phytoplankton-synthesized OM around DCM layers of the southern East China Sea: (1) low influence of fresh water, (2) low molar C ∕ N ratios, (3) a linear correlation between POC and chlorophyll a, and (4) low POC ∕ Chl a ratios, mostly < 200 g g−1.
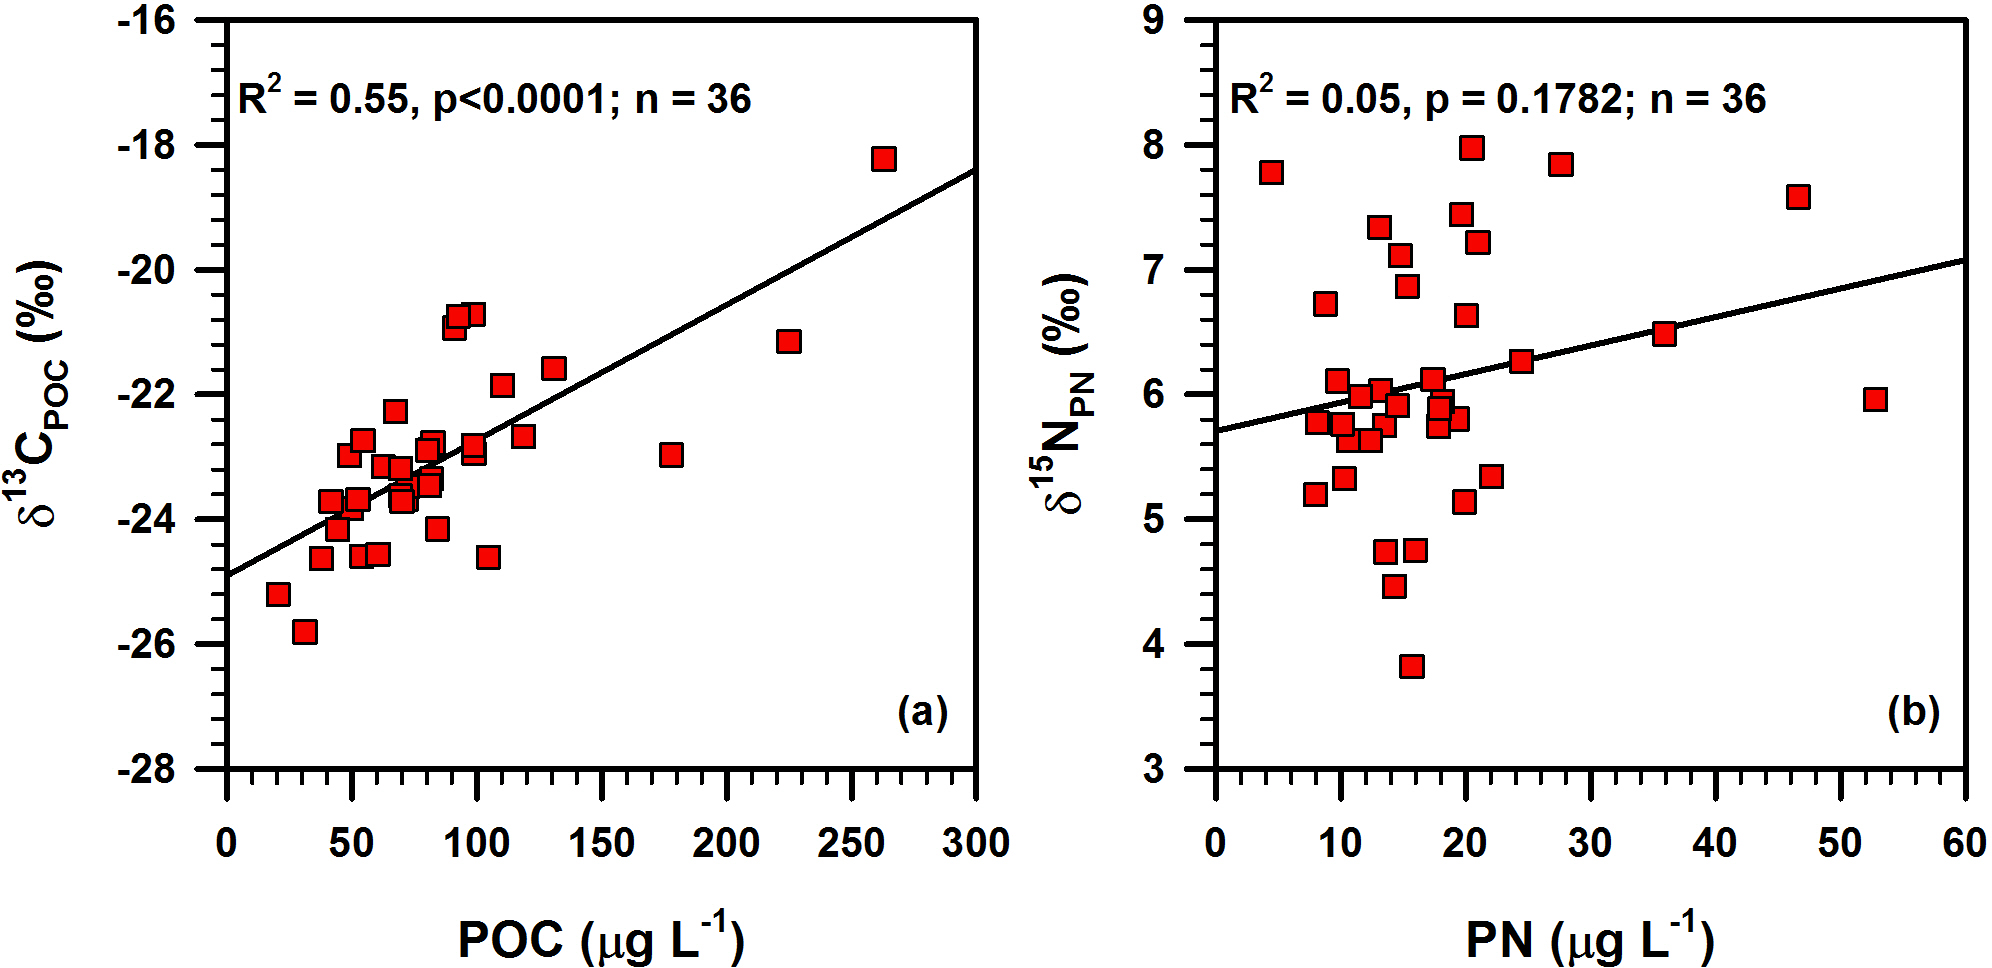
Figure 10Bi-plots showing the relationships of (a) δ13CPOC vs. POC and (b) δ15NPN vs. PN in suspended particulate matter around the deep chlorophyll maximum layer in the southern East China Sea.
5.3 Dynamics of δ13CPOC in POM in DCM
Although a narrow range of molar C ∕ N ratio in the SPM indicated an aquatic origin for the POM at DCM layers, the wide variability of δ13CPOC (−25.8 to −18.2 ‰) suggests that the POM around DCM layers would be a mixture of terrestrial C3 plants with a typical δ13C value of ca. −27 ‰ (e.g. Peters et al., 1978; Wada et al., 1987) and marine phytoplankton with a typical δ13C range of −18 to −20 ‰ (e.g. Goericke and Fry, 1994). However, Fig. 5 illustrates a distinct decreasing trend in δ13CPOC towards the outer shelf; a pattern opposite to an increasing trend in δ13C evident in suspended particles and surface sediments, i.e. seaward decrease in terrestrial OC in surface sediments of many river-dominated margins (Emerson and Hedges, 1988; Meyers, 1994; Hedges et al., 1997; Kao et al., 2003; Wu et al., 2003). Such a spatial distribution with less negative δ13CPOC values in the coastal region, but more negative δ13CPOC values in the middle-outer shelf is inconsistent with the idea of terrestrial OC influence. The elevated δ13CPOC values (average of −20.7 ‰) in the coastal region, concomitant with high POC concentrations (Fig. 4), are consistent with the higher marine primary productivity (11 g C m−2 yr−1) reported in the western than that in the eastern parts of the East China Sea (Gong et al., 2003). The lower δ13CPOC occurred in the middle–outer shelf region where oligotrophic Taiwan Warm Current Water and Kuroshio Water spread (Fig. 5). The lowest δ13CPOC (−25.8 ‰) was observed at a water depth of 85 m, off north-eastern Taiwan, likely due to the intrusion of Kuroshio Subsurface Water with low δ13C from −31 to −27 ‰ Wu et al., 2003), is also in agreement with the hydrographic parameters of this location (Figs. 2 and 7).
A positive linear correlation between δ13CPOC and POC (R2=0.55, p<0.0001; Fig. 10a), a characteristic feature of productive oceanic regions (Savoye et al., 2003), suggesting the effect of growing primary productivity (and or increasing cell growth rate) on a decrease in carbon fractionation during photosynthesis (Miller et al., 2013). This is likely because of a limitation of dissolved CO2, which cannot be compensated for in time by the surrounding water in a relatively closed system because of stratification (Kopczyńska et al., 1995). Further, high productivity makes 13C-enriched OM in phytoplankton (Fry and Wainwright, 1991; Nakatsuka et al., 1992; Miller et al., 2013). Lowe et al. (2014) observed increased δ13C and fatty acid concentration in the POM while increasing phytoplankton abundance in the nearshore waters of San Juan Archipelago, WA. Although primary productivity has a significant correlation with δ13CPOC, only 55 % of δ13CPOC variation can be explained by primary productivity (Fig. 10a), implying that other factors, such as species and sizes of phytoplankton, must have influenced δ13C values of phytoplankton living in the DCM layers (Falkowski, 1991; Hinga et al., 1994).
The distribution of the phytoplankton community in the East China Sea is affected by physico-chemical properties (temperature, salinity and nutrients) of different water masses and surface currents (Umezawa et al., 2014; Jiang et al., 2015, 2017). Diatoms and dinoflagellates are the main phytoplankton communities in summer, with 136 taxa of diatoms from 55 genera and 67 taxa of dinoflagellates from 11 genera having been reported, along with minor communities of chrysophyta, chlorophyta and cyanophyta (Guo et al., 2014b). There is a clear decreasing trend in phytoplankton abundances in the East China Sea from the surface to the bottom, as well as from the coastal to offshore region that is widely believed to be due to nutrient availability (Zheng et al., 2015). The phytoplankton species have distinct spatial characteristics, but no significant differences in species between surface waters and the DCM layers (Zheng et al., 2015). Diatoms with large cell sizes were the dominant species in the coastal region, while phytoplankton with small sizes was dominant in the oligotrophic offshore shelf and Kuroshio waters (Furuya et al., 2003; Zhou et al., 2012). According to Jiang et al. (2015), the contribution of micro- (> 20 µm), nano- (3–20 µm) and pico-phytoplankton (< 3 µm) to Chl a was 40, 46 and 14 %, respectively, in nutrient-rich inshore waters, and 14, 34 and 52 % in offshore regions in summer 2009. The outer shelf region was composed of small-sized phytoplankton, mainly cyanobacteria and cryptophytes transported by Taiwan Warm Current and Kuroshio Current. It has been reported that diatoms have higher δ13C values (−19 to −15 ‰) than dinoflagellates (−22 to −20 ‰; Fry and Wainwright, 1991; Lowe et al., 2014). Likewise, large phytoplankton have higher δ13C values than small phytoplankton and heterotrophic dinoflagellates have higher δ13C values than autotrophic dinoflagellates (Kopczyńska et al., 1995). Similarly, wide variations of δ13CPOC (−22.05 to −27.62 ‰) at DCM layers in the northern East China Sea were documented by Gao et al. (2014). Significant variations of δ13C in suspended OM that was dominated by phytoplankton were reported from the Delaware estuary (−25 to −20 ‰; Cifuentes et al., 1988), the Bay of Seine (−24.3 to −19.7 ‰; Savoye et al., 2003), the Santa Barbara Channel (Miller et al., 2013) and the nearshore waters of San Juan Archipelago, WA (−24.1 to −18.9 ‰; Lowe et al., 2014). These variations were influenced largely by the isotopic fractionation during phytoplankton photosynthesis and degradation than by changes in the relative contributions of terrestrial and aquatic OM (Fogel and Cifuentes, 1993; Savoye et al., 2003).

Figure 11Bi-plots showing the relationships of (a) δ13CPOC vs. temperature for samples separated into two groups based on temperature: < 24 ∘C and > 24 ∘C, (b) temperature-normalized δ13C (δ13C vs. POC concentration, (c) δ13C vs. POC ∕ Chl a ratio, and (d) δ13C vs. molar C ∕ N ratio in suspended particulate matter around deep chlorophyll maximum layers in the southern East China Sea.
5.4 Temperature effect on the δ13CPOC around the DCM layer
Apart from primary production and the growth rate and species composition, temperature and biomass degradation may influence the carbon isotopic composition of phytoplankton (Savoye et al., 2003). Temperature has an indirect effect on isotopic fractionation between phytoplankton carbon and dissolved CO2, and therefore on phytoplankton δ13C (e.g. Rau et al., 1992; Savoye et al., 2003). The C ∕ N ratio, POC ∕ Chl a ratio and δ13CPOC all indicated that the POM around the DCM layer is dominated by newly produced phytoplankton OM (see Sect. 5.1–5.3). Therefore, to understand the temperature effect on δ13C of phytoplankton, we plotted our δ13CPOC data against temperature after separating samples into two groups based on temperature: < 24 ∘C and > 24 ∘C (Fig. 11a). Data points of both groups show a decreasing δ13C of phytoplankton biomass with increasing temperature around the water depths of DCM in the southern ECS (Fig. 11a). Such a relationship is in contrast to the positive relationship between these two variables observed for the surface ocean POM around the world (Sackett et al., 1965; Fontugne, 1983; Fontugne and Duplessy, 1981).
The negative relationship between δ13CPOC and temperature is likely related to biological activity and carbonate dissolution equilibrium; both may control the concentration of dissolved inorganic carbon in the DCM layers, which are closer to euphotic depths (see Sect. 4.1). The weak correlation between δ13CPOC and temperature supports a weak influence of temperature on δ13CPOC around DCM layers in the study area (Fig. 11a). A decrease in fractionation of approximately −0.56 ‰ ∘C−1 is estimated for POM collected at < 24 ∘C, whereas a decrease in fractionation of roughly −0.51 ‰ ∘C−1 is estimated for POM collected at > 24 ∘C (Fig. 11a). In order to distinguish the influence of biological parameters from temperature on δ13CPOC, the δ13CPOC data were corrected for the “temperature effect” by normalizing the data using the following equation: δ13CPOC=f(T).
In the present study, since most δ13CPOC values come from the DCM layer and the δ13CPOC is negatively correlated with temperature (Fig. 11a), we applied our own temperature coefficients (−0.56 and −0.51 ‰ ∘C−1) and δ13CPOC was normalized at 24 ∘C (i.e. the mean temperature at sampled water depths) using the following formula (Savoye et al., 2003): δ13CC, where δ13C is the temperature-normalized δ13CPOC, T is the seawater temperature in ∘C from water depths where SPM sampled, and s is the slope of the linear regression δ13CPOC=f(T) in ‰ ∘C−1 obtained from Fig. 11a. There are significant correlations between δ13C of biomass and POC concentration (circles: R2=0.71, p<0.0001, n=18; triangles: R2=0.66, p<0.0001, n=18; Fig. 11b), indicating that primary production drives ∼ 70 % of the variation of phytoplankton δ13C around DCM layers in the southern ECS. A similar positive relationship between temperature-normalized δ13C and POC concentration was observed by Savoye et al. (2003) during spring phytoplankton blooms in the Bay of Seine, France. However, δ13C correlated insignificantly with the POC ∕ Chl a ratio and C ∕ N ratio (Fig. 11c and d), implying that degradation has a minor effect on the carbon isotopic composition of POM in this study.
5.5 Dynamics of δ15NPN in POM in DCM layers
In contrast to the POC and δ13CPOC relationship (Fig. 10a), there is no significant relationship between PN and the isotopic composition (δ15NPN) of the POM investigated in the present study (Fig. 10b), implying that primary productivity has no significant control on the variability of δ15NPN. As the POM around the water depths of DCM was dominantly from the newly produced, phytoplankton-synthesized source, δ15NPN should be similar to δ15N in phytoplankton. Considering the prevalence of low N ∕ P ratios in the DCM layer of the East China Sea (Lee et al., 2017), the degree of nitrate utilization by phytoplankton should be high and that would result in the composition of δ15NPN being similar to δ15N of nitrate (δ15N) (Altabet and Francois, 1994; Minagawa et al., 2001). Therefore, the spatial distribution of δ15N is probably crucial to decipher the distribution of δ15NPN in DCM layers. Importantly, the spatial distribution of δ15NPN (Fig. 5) resembles the surface current pattern (Fig. 1), as well as the distribution of different water masses (Fig. 7), suggesting that nitrate and the δ15N of CDW, TWCW and Kuroshio Water are largely governing the distribution of δ15NPN in the study area.
According to Li et al. (2010), the range of δ15N in the Yangtze River was 7.3–12.9 ‰, with a mean value of 8.3 ‰. In the north-east of Taiwan Island, δ15N was 5.5–6.1 ‰ at depths of 500 to 780 m (Liu et al., 1996). However, TWCW is nutrient-depleted, enabling incorporation of N-fixer-derived nitrogen in the suspended POM. This general spatial pattern of δ15N (i.e. higher δ15N (> 6 ‰) in the north-east coastal region and off north-east Taiwan, but lower δ15NPN in between these two regions) exactly resembles the distribution of δ15NPN in the DCM layers of this study (Fig. 5). Therefore, the δ15NPN variation in the DCM layer of the East China Sea was primarily governed by the nutrient status and δ15N, though we do not have nutrient data generated during the same cruise to validate our interpretations.
There is another possibility that high δ15NPN (DH7-8: 6.7 ‰, DH7-9: 7.8 ‰) in the DCM layer, off north-east Taiwan (Fig. 5), may not result from the high degree of nitrate utilization, but instead from the incorporation of inorganic nitrogen (mainly NH in the POM. According to Chen et al. (1996) and Liu et al. (1996), NO and NH concentrations in KSSW were high due to the decomposition of OM in sinking particles. However, the concentrations of chlorophyll fluorescence as well as POC and PN are low (Figs. 3 and 4). The low chlorophyll fluorescence might be limited by the low temperature in this high-nutrient–low-chlorophyll region (Umezawa et al., 2014). Because of the low temperature, the prevailing high CO2 pressure is expected to decrease δ13C in DIC and may drive a great carbon isotopic fractionation during carbon assimilation by phytoplankton (Rau et al., 1992), the potential reason why δ13CPOC values in these two stations were low (−25.8 and −25.2 ‰) compared to values of other locations in the study area. Consistently, the low concentration of POC restricts the idea that the high δ15NPN could not be from the denitrification effect. The high δ15NPN (6.7, 7.8 ‰) values are probably due to the incorporation of inorganic nitrogen (mainly NH; the process normally drives the δ15NPN as high as that of inorganic nitrogen δ15N (Coffin and Cifuentes, 1999). Although δ15N of NH in Kuroshio Water is not available for comparison, it seems that δ15N of remineralized NH was relatively greater than δ15N of NO (York et al., 2010). This possibility is also supported by the high concentrations of NO and NH in Kuroshio Subsurface Water (Liu et al., 1996) as well as the low contents of POC (< 1; 0.96, 0.98 %) and low molar C ∕ N ratios (4.1, 5.4) of these two SPM samples (DH7-8 and DH7-9).
5.6 Impact of Yangtze River on POM in DCM of ECS
The range of POC ∕ Chl a obtained in this study (33–200 g g−1) is within the range (< 200 g g−1) reported for the phytoplankton-dominated POM in the coastal and shelf waters (e.g. Chang et al., 2003; Savoye et al., 2003; Hung et al., 2013; Liénart et al., 2016). We also obtained a narrow range of C ∕ N ratios (4.1–6.3), but a wide range of δ13CPOC (−25.8 to −18.2 ‰) compared to previous studies in the ECS (4.0–34.3, Liu et al., 1998; −24.0 to −19.8 ‰, Wu et al., 2003). Our results indicate that POM at the DCM was largely produced in situ and derived from phytoplankton biomass, with little terrestrial influence. The lack of terrestrial OM signals seems to be related to reservoir- and dam-building along the river in recent years that has shifted the location of the Yangtze-derived POC deposition from the inner shelf of the ECS to terrestrial reservoirs (Li et al., 2015). The sediment delivered from the river to the estuary has been reduced by 40 % since 2003 when the Three Gorges Dam was completed (Yang et al., 2011, and references therein). Recently, Dai et al. (2014) reported that the particulate load discharged by the Yangtze has declined to 150 Mt yr−1, less than ∼ 70 % of its sediment delivery to the ECS during the 1950s. Although 87 % of the mean annual sediment of Yangtze River is discharged during the flood season from June to September (Wang et al., 2007; Zhu et al., 2011), approximately 60 out of 87 % of the fine-grained sediments are temporarily deposited near the estuary and then later resuspended and transported southward along the inner shelf, off mainland China (Chen et al., 2017, and references therein). The Yangtze-transported POM moves up toward the north-east across the shelf along the so-called Changjiang transport pathway in summer season (e.g. Gao et al., 2014), which is largely affected by the combined effects of high river discharge, south-west summer monsoon and the intensified TWC (Beardsley et al., 1985; Ichikawa and Beardsley, 2002; Lee and Chao, 2003). The T–S diagrams (Figs. 6 and 7) of this study also illustrate this view.
Accompanying the decreasing sediment input, dam-building in the Yangtze River basin since 2003 has buried around 4.9 ± 1.9 Mt yr−1 biospheric POC, approximately 10 % of the world riverine POC burial flux to the oceans (Li et al., 2015). The POC flux from the Yangtze to the ECS (range: 1.27–8.5 × 10¹² g C yr−1; Wang et al., 1989; Qi et al., 2014) was significantly less than the estimated primary productivity (72.5 × 10¹² g C yr−1; Gong et al., 2003), implying the predominance of marine-sourced organic matter in the ECS. Moreover, the substantial quantity of organic substances that transported by the Yangtze River may be completely modified before being ultimately deposited on the inner shelf of the ECS and being transported further offshore (Katoh et al., 2000; Lie et al., 2003; Chen et al., 2008; Isobe and Matsuno, 2008). Wu et al. (2007b), for instance, observed an advanced stage of POM degradation in the entire Yangtze River with an average degradation index of −1.1. Based on the investigation of lipid biomarkers in a sediment core collected from the ECS, Wang et al. (2016) suggested the dominant preservation of marine autochthonous organic matter (∼ 90 %) in the ECS.
In this study, we comprehensively characterized the particulate organic matter collected from the deep chlorophyll maximum layer in the southern East China Sea using hydrographic data (temperature, salinity and turbidity) and fluorescence (chlorophyll a) as well as elemental (POC, PN) concentrations and isotopic (δ13CPOC and δ15NPN) compositions. All these parameters indicated that the POM around DCM layers was dominantly composed of newly produced OM by phytoplankton with a weak contribution from terrestrial input despite the study area being the best example of a river-dominated continental margin in the world. We also discussed the main factors controlling the δ13C and δ15N variations in phytoplankton in the study area. As for the δ13CPOC, the variations in primary productivity, as indicated by the positive correlation between δ13CPOC and POC, and phytoplankton species were the main factors; the former explained ∼ 70 % of the variability in δ13CPOC, after accounting for temperature effects. However, δ15NPN variation seems to be related to uptake of nitrate or locally regenerated ammonia, which needs to be substantiated by the nutrient data in future studies. Our results show that phytoplankton dynamics drive marine POM composition around DCM layers in the southern East China Sea.
Moreover, phytoplankton in the southern East China Sea contain relatively lower δ13CPOC values than that of typical marine phytoplankton (−18 to −20 ‰). This emphasizes the need for sufficient investigation of end-member variability, which is crucial for the estimation of relative contributions of terrestrial and marine OM by an end-member mixing model. Therefore, our results of highly variable δ13CPOC and δ15NPN values in the autotrophic-dominated DCM layers can provide unique ranges for these two isotopes in the East China Sea, especially the region south of 29∘ N, and form a basis for the long-term evaluation of organic carbon burial along the inner shelf mud belt, which is largely accumulated in the East China Sea during the Holocene.
All data are available within this paper (Table 1) and the Supplement (Table S1).
The supplement related to this article is available online at: https://doi.org/10.5194/bg-15-2091-2018-supplement.
The authors declare that they have no conflict of interest.
We thank the captain, chief scientist and crew of the Science 3
CRUISE (organized by the Institute of Oceanography, Chinese Academy of
Sciences) for their support and assistance during the sampling in summer
2013. We also appreciate Wenbin Zou and Xinlei Jiang for their help with
on-board sampling. Selvaraj Kandasamy is grateful to the National Natural
Foundation of China (41273083), Shanhai Fund of Xiamen University (2013SH012)
and Open Funds of First Institute of Oceanography (MASEG201502, MASEG201601)
for the financial support. We gratefully acknowledge Carol Robinson, Phil Meyers and
three anonymous reviewers for their helpful comments and suggestions on the
original manuscript.
Edited by: Carol
Robinson
Reviewed by: Philip Meyers and three anonymous
referees
Altabet, M. A. and Francois, R.: The use of nitrogen isotopic ratio for reconstruction of past changes in surface ocean nutrient utilization, in: Carbon cycling in the glacial ocean: constraints on the ocean's role in global change, Springer Berlin Heidelberg, 281–306, 1994.
Aminot, A. and Rey, F.: Standard procedure for the determination of chlorophyll a by spectroscopic methods, ICES Techniques in Marine Environmental Sciences, Copenhagen, Denmark, 8–11, 2000.
Bai, Y., He, X. Q., Chen, C. T. A., Kang, Y., Chen, X., and Caj, W. J.: Summertime Changjiang River plume variation during 1998–2010, J. Geophys. Res., 119, 6238–6257, 2014.
Beardsley, R. C., Limeburner, R., Yu, H., and Cannon, G. A.: Discharge of the Changjiang (Yangtze River) into the East China Sea, Cont. Shelf Res., 4, 57–76, 1985.
Chai, C., Yu, Z., Shen, Z., Song, X. X., Gao, X. H., and Gao, Y.: Nutrient characteristics in the Yangtze River Estuary and the adjacent East China Sea before and after impoundment of the Three Gorges Dam, Sci. Total Environ., 407, 4687–4695, 2009.
Chang, J., Shiah, F. K., Gong, G. C., and Chiang, K. P.: Cross–shelf variation in carbon-to-chlorophyll a ratios in the East China Sea, summer 1998, Deep-Sea Res. Pt. II, 50, 1237–1247, 2003.
Chen, C. T. A.: The Kuroshio intermediate water is the major source of nutrients on the East China Sea continental shelf, Oceanol. Acta, 19, 523–527, 1996.
Chen, C. T. A.: Distributions of nutrients in the East China Sea and the South China Sea connection, J. Oceanogr., 64, 737–751, 2008.
Chen, C. T. A., Lin, C. M., Huang, B. T., and Chang, L. F.: The stoichiometry of carbon, hydrogen, nitrogen, sulfur and oxygen in particular matter of the Western North Pacific marginal seas, Mar. Chem., 54, 179–190, 1996.
Chen, C. T. A., Kandasamy, S., Chang, Y. P., Bai, Y., He, X. Q., Lu, J. T., and Gao, X. L.: Geochemical evidence of the indirect pathway of terrestrial particulate material transport to the Okinawa Trough, Quaternary Int., 441, 51–61, 2017.
Chen, J. and Liu, J.: The spatial and temporal changes of chlorophyll-a and suspended matter in the eastern coastal zones of China during 1997–2013, Cont. Shelf Res., 95, 89–98, 2015.
Chen, Y. L. L. and Chen, H. Y.: Nitrate-based new production and its relationship to primary production and chemical hydrography in spring and fall in the East China Sea, Deep-Sea Res. Pt. II, 50, 1249–1264, 2003.
Chen, Y. L., Chen, H. Y., Lee, W. H., Hung, C. C., Wong, G. T. F., and Kanda, J.: New production in the East China Sea, comparison between well mixed winter and stratified summer conditions, Cont. Shelf Res., 21, 751–764, 2001.
Cifuentes, L. A., Sharp, J. H., and Fogel, M. L.: Stable carbon and nitrogen isotope biogeochemistry in the Delaware estuary, Limnol. Oceanogr., 33, 1102–1115, 1988.
Coffin, R. B. and Cifuentes, L. A.: Stable isotope analysis of carbon cycling in the Perdido Estuary, Florida, Estuaries, 22, 917–926, 1999.
Copin-Montegut, C. and Copin-Montegut, G.: Stoichiometry of carbon, nitrogen, and phosphorus in marine particulate matter, Deep-Sea Res. Pt. A, 30, 31–46, 1983.
Crawford, D. W., Wyatt, S. N., Wrohan, I. A., Cefarelli, A. O., Giesbrecht, K. E., Kelly, B., and Varela, D. E.: Low particulate carbon to nitrogen ratios in marine surface waters of the Arctic, Global Biogeochem. Cy., 29, 2021–2033, 2015.
Cullen, J. J., Reid, F. M. H., and Stewart, E.: Phytoplankton in the surface and chlorophyll maximum off southern California in August, 1978, J. Plank. Res., 4, 665–694, 1982.
Dai, Z., Du, J., Zhang, X., Su, N., and Li, J.: Variation of Riverine Material Loads and Environmental Consequences on the Changjiang (Yangtze) Estuary in Recent Decades (1955–2008), Environ. Sci. Technol, 45, 223–227, 2010.
Dai, Z., Liu, J. T., Wei, W., and Chen, J.: Detection of the Three Gorges Dam influence on the Changjiang (Yangtze River) submerged delta, Sci. Rep., 4, 6600, https://doi.org/10.1038/srep06600, 2014.
Emerson, S. and Hedges, J. I.: Processes controlling the organic carbon content of open ocean sediments, Paleoceanography, 3, 621–634, 1988.
Falkowski, P. G.: Species variability in the fractionation of 13C and 12C by marine phytoplankton, J. Plank. Res., 13, 21–28, 1991.
Fogel, M. L. and Cifuentes, L. A.: Isotope fractionation during primary production, in Organic Geochemistry, edited by: Macko, S. A. and Engel, M. H., 73–98, Springer, New York, 1993.
Fontugne, M. R.: Les isotopes stables du carbone organique dans l'océan: application à la paléoclimatologie, PhD thesis, Université de Paris XI, 1983.
Fontugne, M. R. and Duplessy, J.-C.: Organic carbon isotopic fractionation by marine plankton in the temperature range −1 to 31 ∘C, Oceanol. Acta, 4, 85–90, 1981.
Fry, B. and Wainright, S. C.: Diatom sources of 13C-rich carbon in marine food webs, Mar. Ecol.-Prog. Ser., 76, 149–157, 1991.
Furuya, K.: Subsurface chlorophyll maximum in the tropical and subtropical western Pacific Ocean: Vertical profiles of phytoplankton biomass and its relationship with chlorophyll a and particulate organic carbon, Mar. Biol., 107, 529–539, 1990.
Furuya, K., Hayashi, M., Yabushita, Y., and Ishikawa, A.: Phytoplankton dynamics in the East China Sea in spring and summer as revealed by HPLC-derived pigment signature, Deep-Sea Res. Pt. II, 50, 367–387, 2003.
Gao, L., Li, D., and Ishizaka, J.: Stable isotope ratios of carbon and nitrogen in suspended organic matter: Seasonal and spatial dynamics along the Changjiang (Yangtze River) transport pathway, J. Geophys. Res., 119, 1717–1737, 2014.
Gearing, J. N., Gearing, P. J., Rudnick, D. T., Requejo, A. G., and Hutchins, M. J.: Isotopic variability of organic carbon in a phytoplankton-based, temperate estuary, Geochim. Cosmochim. Ac., 48, 1089–1098, 1984.
Geider, R. and La Roche, J.: Redfield revisited: variability of C : N : P in marine microalgae and its biochemical basis, Eur. J. Phycol., 37, 1–17, 2002.
Geider, R. J.: Light and temperature dependence of the carbon to chlorophyll a ratio in microalgae and cyanobacteria: implications for physiology and growth of phytoplankton, New Phytol., 106, 1–34, 1987.
Gieskes, W. W. C., Kraay, G. W., and Tijssen, S. B.: Chlorophylls and their degradation products in the deep pigment maximum layer of the tropical North Atlantic, Netherlands, J. Sea Res., 12, 195–204, 1978.
Goericke, R. and Fry, B.: Variations of marine plankton δ13C with latitude, temperature, and dissolved CO2 in the world ocean, Global Biogeochem. Cy., 8, 85–90, 1994.
Gong, G. C., Wen, Y. H., Wang, B. W., and Liu, G. J.: Seasonal variation of chlorophyll a concentration, primary production and environmental conditions in the subtropical East China Sea, Deep-Sea Res. Pt. II, 50, 1219–1236, 2003.
Gong, G. C., Chang, J., Chiang, K. P., Hsiung, T. M., Hung, C. C., Duan, S. W., and Codispoti, L. A.: Reduction of primary production and changing of nutrient ratio in the East China Sea: Effect of the Three Gorges Dam?, Geophys. Res. Lett., 33, L07610, https://doi.org/10.1029/2006GL025800, 2006.
Gong, G. C., Shiah, F. K., Liu, K. K., Wen, Y. H., and Liang, M. H.: Spatial and temporal variation of chlorophyll a, primary productivity and chemical hydrography in the southern East China Sea, Cont. Shelf Res., 20, 411–436, 2010.
Gong, X., Shi, J., Gao, H. W., and Yao, X. H.: Steady-state solutions for subsurface chlorophyll maximum in stratified water columns with a bell-shaped vertical profile of chlorophyll, Biogeosciences, 12, 905–919, https://doi.org/10.5194/bg-12-905-2015, 2015.
Goñi, M. A., Teixeira, M. J., and Perkey, D. W.: Sources and distribution of organic matter in a river-dominated estuary (Winyah Bay, SC, USA), Estuar. Coast. Shelf Sci., 57, 1023–1048, 2003.
Goñi, M. A., Moore, E., Kurtz, A., Portier, E., Alleau, Y., and Merrell, D.: Organic matter compositions and loadings in soils and sediments along the Fly River, Papua New Guinea, Geochim. Cosmochim. Ac., 140, 275–296, 2014.
Guo, S. J., Feng, Y. Y., Wang L, Dai, M. H. Liu, Z. L., Bai, Y., and Sun, J.: Seasonal variation in the phytoplankton community of a continental-shelf sea: the East China Sea, Mar. Ecol.-Prog. Ser., 516, 103–126, 2014a.
Guo, C., Liu, H., Zheng, L., Song, S., Chen, B., and Huang, B.: Seasonal and spatial patterns of picophytoplankton growth, grazing and distribution in the East China Sea, Biogeosciences, 11, 1847–1862, 2014b.
Hale, R. P., Nittrouer, C. A., Liu, J. T., Keil, R. G., and Ogston, A. S.: Effects of a major typhoon on sediment accumulation in Fangliao Submarine Canyon, SW Taiwan, Mar. Geol., 326, 116–130, 2012.
Han, A. Q., Dai, M. H., Gan, J. P., Kao, S.-J., Zhao, X. Z., Jan, S., Li, Q., Lin, H., Chen, C.-T. A., Wang, L., Hu, J. Y., Wang, L. F., and Gong, F.: Inter-shelf nutrient transport from the East China Sea as a major nutrient source supporting winter primary production on the northeast South China Sea shelf, Biogeosciences, 10, 8159–8170, https://doi.org/10.5194/bg-10-8159-2013, 2013.
He, X. Q., Bai, Y., Chen, C. T. A., Hsin, Y. C., Wu, C. R., Zhai, W. D., Liu, Z. L., and Gong, F.: Satellite views of the episodic terrestrial material transport to the southern Okinawa Trough driven by typhoon, J. Geophys. Res., 119, 4490–4504, 2014.
Head, E. J. H., Harrison, W. G., Irwin, B. I., Horne, E. P. W., and Li, W. K. W.: Plankton dynamics and carbon flux in an area of upwelling off the coast of Morocco, Deep-Sea Res. Pt. I, 43, 1713–1738, 1996.
Hedges, J. I., Clark, W. A., Quay, P. D., Richey, J. E., Devol, A. H., and Santos, U. D. M.: Compositions and fluxes of particulate organic material in the Amazon River, Limnol. Oceanogr., 31, 717–738, 1986.
Hedges, J. I., Keil, R. G., and Benner, R.: What happens to terrestrial organic matter in the ocean?, Org. Geochem., 27, 195–212, 1997.
Hickman, A. E., Moore, C. M., Sharples, J., Lucas, M. I., Tilstone, G. H., Krivtsov, V., and Holligan, P. M.: Primary production and nitrate uptake within the seasonal thermocline of a stratified shelf sea, Mar. Ecol.-Prog. Ser., 463, 39–57, 2012.
Hinga, K. R., Arthur, M. A., Pilson, M. E. Q., and Whitaker, D.: Carbon isotope fractionation by marine phytoplankton in culture: The effects of CO2 concentration, pH, temperature, and species, Global Biogeochem. Cy., 8, 91–102, 1994.
Hung, C.-C., Tseng, C.-W., Gong, G.-C., Chen, K.-S., Chen, M.-H., and Hsu, S.-C.: Fluxes of particulate organic carbon in the East China Sea in summer, Biogeosciences, 10, 6469–6484, https://doi.org/10.5194/bg-10-6469-2013, 2013.
Hung, J. J., Chan, C. L., and Gong, G. C.: Summer distribution and geochemical composition of suspended-particulate matter in the East China Sea, J. Oceanogr., 63, 189–202, 2007.
Ichikawa, H. and Beardsley, R. C.: The current system in the Yellow and East China Seas, J. Oceanogr., 58, 77–92, 2002.
Isobe, A. and Matsuno, T.: Long-distance nutrient-transport process in the Changjiang river plume on the East China Sea shelf in summer, J. Geophys. Res., 113, C04006, https://doi.org/10.1029/2007JC004248, 2008.
Isobe, A., Fujiwara, Y., Chang, P. H., Sugimatsu, K., Shimizu, M., Matsuno, T., and Manda, A.: Intrusion of less saline shelf water into the Kuroshio subsurface layer in the East China Sea, J. Oceanogr., 60, 853–863, 2004.
Jiang, Z., Chen, J., Zhou, F., Shou, L., Chen, Q., Tao, B., Yan, X., and Wang, K.: Controlling factors of summer phytoplankton community in the Changjiang (Yangtze River) Estuary and adjacent East China Sea shelf, Cont. Shelf Res., 101, 71–84, 2015.
Jiang, Z., Chen, J., Zhou, F., Zhai, H., Zhang, D., and Yan, X.: Summer distribution patterns of Trichodesmium spp. in the Changjiang (Yangtze River) Estuary and adjacent East China Sea shelf, Oceanologia, 59, 248–261, 2017.
Kandasamy, S. and Nagender Nath, B.: Perspectives on the terrestrial organic matter transport and burial along the land-deep sea continuum: Caveats in our understanding of biogeochemical processes and future needs, Front. Mar. Sci., 3, 259, https://doi.org/10.3389/fmars.2016.00259, 2016.
Kao, S. J., Lin, F. J., and Liu, K. K.: Organic carbon and nitrogen contents and their isotopic compositions in surficial sediments from the East China Sea shelf and the southern Okinawa Trough, Deep-Sea Res. Pt. II, 50, 1203–1217, 2003.
Karlson, B., Edler, L., Granéli, W., Sahlsten, E., and Kuylenstierna, M.: Subsurface chlorophyll maxima in the Skagerrak-processes and plankton community structure, J. Sea Res., 35, 139–158, 1996.
Katoh, O., Morinaga, K., and Nakagawa, N.: Current distributions in the southern East China Sea in summer, J. Geophys. Res., 105, 8565–8573, 2000.
Kirk, J. T.: Light and photosynthesis in aquatic ecosystems, Cambridge university press, 1994.
Kopczyńska, E. E., Goeyens, L., Semeneh, M., and Dehairs, F.: Phytoplankton composition and cell carbon distribution in Prydz Bay, Antarctica: relation to organic particulate matter and its δ13C values, J. Plankton Res., 17, 685–707, 1995.
Lee, H. J. and Chao, S. Y. A climatological description of circulation in and around the East China Sea, Deep-Sea Res. Pt. II, 50, 1065–1084, 2003.
Lee, K. J., Matsuno, T., Endoh, T., Endoh, T., Ishizaka, J., Zhu, Y. L., Takeda, S., and Sukigara, C.: A role of vertical mixing on nutrient supply into the subsurface chlorophyll maximum in the shelf region of the East China Sea, Cont. Shelf Res., 143, 139–150, 2017.
Li, G., Wang, X. T., Yang, Z., Mao, C., West, A. J., and Ji, J.: Dam-triggered organic carbon sequestration makes the Changjiang (Yangtze) river basin (China) a significant carbon sink, J. Geophys. Res, 120, 39–53, 2015.
Li, S. L., Liu, C. Q., Li, J., Liu, X., Chetelat, B., Wang, B., and Wang, F.: Assessment of the sources of nitrate in the Changjiang River, China using a nitrogen and oxygen isotopic approach, Environ. Sci. Technol., 44, 1573–1578, 2010.
Li, Y. H.: Material exchange between the East China Sea and the Kuroshio current, Terr. Atmos. Ocean. Sci., 5, 625–631, 1994.
Lie, H. J., Cho, C. H., Lee, J. H., and Lee, S.: Structure and eastward extension of the Changjiang River plume in the East China Sea, J. Geophys. Res., 108, 3077, https://doi.org/10.1029/2001JC001194, 2003.
Liénart, C., Susperregui, N., Rouaud, V., Cavalheiro, J., David, V., Del Amo, Y., Duran, R., Lauga, B., Monperrus, M., Pigot, T., Bichon, S., Charlier, K., and Savoye, N.: Dynamics of particulate organic matter in a coastal system characterized by the occurrence of marine mucilage-A stable isotope study, J. Sea Res., 116, 12–22, 2016.
Liu, J. P., Li, A. C., Xu, K. H., Velozzi, D. M., Yang, Z. S., Milliman, J. D., and DeMaster, D. J.: Sedimentary features of the Yangtze River-derived along-shelf clinoform deposit in the East China Sea, Cont. Shelf Res., 26, 2141–2156, 2006.
Liu, J. P., Xu, K. H., Li, A. C., Milliman, J. D., Velozzi, D. M., Xiao, S. B., and Yang, Z. S.: Flux and fate of Yangtze River sediment delivered to the East China Sea, Geomorphology, 85, 208–224, 2007.
Liu, K. K., Pai, S. C., and Liu, C. T.: Temperature-nutrient relationships in the Kuroshio and adjacent waters near Taiwan, Acta Oceanogr. Taiwan, 21, 1–17, 1988.
Liu, K. K., Su, M. J., Hsueh, C. R., and Gong, G. C.: The nitrogen isotopic composition of nitrate in the Kuroshio Water northeast of Taiwan: Evidence for nitrogen fixation as a source of isotopically light nitrate, Mar. Chem., 54, 273–292, 1996.
Liu, W. C., Wang, R., and Li, C. L.: C ∕ N ratios of particulate organic matter in the East China Sea, Oceanologia et Limnologia Sinica, 29, 467–470, 1998 (Chinese).
Lorenzen, C. J.: Vertical distribution of chlorophyll and phaeo-pigments: Baja California, In Deep Sea Research and Oceanographic Abstracts, Elsevier, 14, 735–745, 1967.
Lorrain, A., Savoye, N., Chauvaud, L., Paulet, Y.-M., and Naulet, N.: Decarbonation and preservation method for the analysis of organic C and N contents and stable isotope ratios of low-carbonated suspended particulate material, Anal. Chim. Acta, 491, 125–133, 2003.
Lowe, A. T., Galloway, A. W. E., Yeung, J. S., Dethier, M. N., and Duggins, D. O.: Broad sampling and diverse biomarkers allow characterization of nearshore particulate organic matter, Oikos, 123, 1341–1354, 2014.
Martiny, A. C., Pham, C. T., Primeau, F. W., Vrugt, J. A., Moore, J. K., Levin, S. A., and Lomas, M. W.: Strong latitudinal patterns in the elemental ratios of marine plankton and organic matter, Nat. Geosci., 6, 279–283, https://doi.org/10.1038/ngeo1757, 2013.
Meyers, P. A.: Preservation of elemental and isotopic source identification of sedimentary organic matter, Chem. Geol., 114, 289–302, 1994.
Miller, R. J., Page, H. M., and Brzezinski, M. A.: δ13C and δ15N of particulate organic matter in the Santa Barbara Channel: drivers and implications for trophic inference, Mar. Ecol.-Prog. Ser., 474, 53–66, 2013.
Milliman, J. D. and Farnsworth. K. L.: River Discharge to the Coastal Ocean: A Global Synthesis, Cambridge Univ. Press, 2011.
Minagawa, M., Ohashi, M., Kuramoto, T., and Noda, N.: δ15N of PON and nitrate as a clue to the origin and transformation of nitrogen in the subarctic North Pacific and its marginal sea, J. Oceanogr., 57, 285–300, 2001.
Montagnes, D. J., Berges, J. A., Harrison, P. J., and Taylor, F.: Estimating carbon, nitrogen, protein, and chlorophyll a from volume in marine phytoplankton, Limnol. Oceanogr., 39, 1044–1060, 1994.
Nakatsuka, T., Handa, N., Wada, E., and Wong, C. S.: The dynamic changes of stable isotopic ratios of carbon and nitrogen in suspended and sedimented particulate organic matter during a phytoplankton bloom, J. Mar. Res., 50, 267–296, 1992.
Nielsen, E. S. and Hansen, V. K.: Light adaptation in marine phytoplankton populations and its interrelation with temperature, Physiol. Plantarum, 12, 353–370, 1959.
Peters, K. E., Sweeney, R. E., and Kaplan, I. R.: Correlation of carbon and nitrogen stable isotope ratios in sedimentary organic matter, Limnol. Oceanogr., 23, 598–604, 1978.
Pilati, A. and Wurtsbaugh, W. A.: Importance of zooplankton for the persistence of a deep chlorophyll layer: a limnocorral experiment, Limnol. Oceanogr., 48, 249–260, 2003.
Qi, W., Müller, B., Pernet-Coudrier, B., Singer, H., Liu, H., Qu, J., and Berg, M.: Organic micropollutants in the Yangtze River: seasonal occurrence and annual loads, Sci. Total Environ., 472, 789–799, 2014.
Rau, G. H., Takahashi, T., Des Marais, D. J., Repeta, D. J., and Martin, J. H.: The relationship between δ13C of organic matter and [CO2 (aq)] in ocean surface water: data from a JGOFS site in the northeast Atlantic Ocean and a model, Geochim. Cosmochim. Ac., 56, 1413–1419, 1992.
Ravichandran, M., Girishkumar, M. S., and Riser, S.: Observed variability of chlorophyll-a using Argo profiling floats in the southeastern Arabian Sea, Deep-Sea Res. Pt. I, 65, 15–25, 2012.
Redfield, A. C.: The biological control of chemical factors in the environment, Am. Sci., 46, 205–221, 1958.
Riley, G. A., Stommel, H. M., and Bumpus, D. F.: Quantitative ecology of the plankton of the western North Atlantic, Bull. Bingham Oceanogr. Coll., 12, 1–169, 1949.
Ryabov, A. B., Rudolf, L., and Blasius, B.: Vertical distribution and composition of phytoplankton under the influence of an upper mixed layer, J. Theor. Biol., 263, 120–133, 2010.
Sackett, W. M., Eckelmann, W. R., Bender, M. L., and Bé, A. W. H.: Temperature dependence of carbon isotope composition in marine plankton and sediments, Science, 148, 235–237, 1965.
Savoye, N., Aminot, A., Treguer, P., Fontugne, M., Naulet, N., and Kerouel, R.: Dynamics of particulate organic matter δ15N and δ13C during spring phytoplankton blooms in a macrotidal ecosystem (Bay of Seine, France), Mar. Ecol.-Prog. Ser., 255, 27–41, 2003.
Savoye, N., David, V., Morisseau, F., Etcheber, H., Abril, G., Billy, I., Charlier, K., Oggian, G., Derriennic, H., and Sautour, B.: Origin and composition of particulate organicmatter in a macrotidal turbid estuary: The Gironde estuary France, Estuar. Coast. Shelf S., 108, 16–28, 2012.
Selvaraj, K., Lee, T. Y., Yang, J. Y. T., Canuel, E. A., Huang, J. C., Dai, M., Liu, J. T., and Kao, S. J.: Stable isotopic and biomarker evidence of terrigenous organic matter export to the deep sea during tropical storms, Mar. Geol., 364, 32–42, 2015.
Sharples, J., Moore, C. M., Rippeth, T. P., Holligan, P. M., Hydes, D. J., Fisher, N. R., and Simpson, J. H.: Phytoplankton distribution and survival in the thermocline, Limnol. Oceanogr., 46, 486–496, 2001.
Sheu, D. D., Jou, W. C., Chung, Y. C., Tang, T. Y., and Hung, J. J.: Geochemical and carbon isotopic characterization of particles collected in sediment traps from the East China Sea continental slope and the Okinawa Trough northeast of Taiwan, Cont. Shelf Res., 19, 183–203, 1999.
Steinman, A. D., Lamberti, G. A., Leavitt, P. R., and Uzarski, D. G.: Biomass and Pigments of Benthic Algae Methods in Stream Ecology (3rd Edition), 1, 223–241, 2017.
Su, J. L. and Pan, Y. Q.: On the shelf circulation north of Taiwan, Acta Oceanol. Sin., 6, 1–20, 1987.
Su, J. L., Guan, B. X., and Jiang, J. Z.: The Kuroshio. Part I. Physical Features, Oceanogr. Mar. Biol., 28, 11–71, 1990.
Sullivan, J. M., Donaghay, P. L., and Rines, J. E.: Coastal thin layer dynamics: consequences to biology and optics, Cont. Shelf Res., 30, 50–65, 2010.
Tan, S. C., Shi, G. Y., Shi, J. H., Gao, H. W., and Yao, X.: Correlation of Asian dust with chlorophyll and primary productivity in the coastal seas of China during the period from 1998 to 2008, J. Geophys. Res., 116, https://doi.org/10.1029/2010JG001456, 2011.
Tang, S., Chen, C., Zhan, H., and Xu, D.: Remotely-sensed estimation of the euphotic depth in the northern South China Sea, Geoscience and Remote Sensing Symposium, 2007, IGARSS 2007, IEEE International, 23–28 July 2007, Barcelona, https://doi.org/10.1109/IGARSS.2007.4422947, 2007.
Thompson, P. A., Guo, M. X., and Harrison, P. J.: Effects of variation in temperature. I. On the biochemical composition of eight species of marine phytoplankton, J. Phycol., 28, 481–488, 1992.
Thornton, S. F. and McManus, J.: Application of organic carbon and nitrogen stable isotope and C ∕ N ratios as source indicators of organic matter provenance in estuarine systems: evidence from the Tay Estuary, Scotland, Estuar. Coast. Shelf S., 38, 219–233, 1994.
Umezawa, Y., Yamaguchi, A., Ishizaka, J., Hasegawa, T., Yoshimizu, C., Tayasu, I., Yoshimura, H., Morii, Y., Aoshima, T., and Yamawaki, N.: Seasonal shifts in the contributions of the Changjiang River and the Kuroshio Current to nitrate dynamics in the continental shelf of the northern East China Sea based on a nitrate dual isotopic composition approach, Biogeosciences, 11, 1297–1317, https://doi.org/10.5194/bg-11-1297-2014, 2014.
Wada, E., Minagawa, M., Mizutani, H., Tsuji, T., Imaizumi, R., and Karasawa, K.: Biogeochemical studies on the transport of organic matter along the Otsuchi River watershed, Japan, Estuar. Coast. Shelf S., 25, 321–336, 1987.
Wang, M. Y., Zhao, G. J., and Zhang, S.: The transport of carbon, nitrogen, phosphorus and sulfur in the Changjiang, The Background Study of Chemical Elements in the Water Environments, Mapping Publisher, Beijing, 122–131, 1989.
Wang, R., Wang, J., Li, F., Yang, S., and Tan, L.: Vertical distribution and indications of lipids biomarkers in the sediment core from East China Sea, Cont. Shelf Res., 122, 43–50, 2016.
Wang, Z. H., Li, L. Q., Chen, D. C., Xu, K. Q., Wei, T. Y., Gao, J. H., Zhao, Y. W., Chen, Z. Y., and Masabate, W.: Plume front and suspended sediment dispersal off the Yangtze (Changjiang) River mouth, China during non-flood season, Estuar. Coast. Shelf S., 71, 60–67, 2007.
Weston, K., Fernand, L., Mills, D. K., Delahunty, R., and Brown, J.: Primary production in the deep chlorophyll maximum of the central North Sea, J. Plankton Res., 27, 909–922, 2005.
Williams, C., Sharples, J., Mahaffey, C., and Rippeth, T.: Wind-driven nutrient pulses to the subsurface chlorophyll maximum in seasonally stratified shelf seas, Geophys. Res. Lett., 40, 5467–5472, 2013.
Wong, G. T. F., Pai, S. C., Liu K. K., Liu, C. T., and Chen, C. T. A.: Variability of the chemical hydrography at the frontal region between the East China Sea and the Kuroshio north-east of Taiwan, Estuar. Coast. Shelf S., 33, 105–120, 1991.
Wong, G. T. F., Chao, S. Y., Li, Y. H., and Shiah, F. K.: The Kuroshio edge exchange processes (KEEP) study-an introduction to hypotheses and highlights, Cont. Shelf Res., 20, 335–347, 2000.
Wu, Y., Zhang, J., Li, D. J., Wei, H., and Lu, R. X.: Isotope variability of particulate organic matter at the PN section in the East China Sea, Biogeochemistry, 65, 31–49, 2003.
Wu, Y., Dittmar, T., Ludwichowski, K. U., Kattner, G., Zhang, J., Zhu, Z. Y., and Koch, B. P.: Tracing suspended organic nitrogen from the Yangtze River catchment into the East China Sea, Mar. Chem., 107, 367–377, 2007a.
Wu, Y., Zhang, J., Liu, S. M., Zhang, Z. F., Yao, Q. Z., Hong, G. H., and Cooper, L.: Sources and distribution of carbon within the Yangtze River system, Estuar. Coast. Shelf S., 71, 13–25, 2007b.
Wu, Y., Eglinton, T., Yang, L., Deng, B., Montluçon, D., and Zhang, J.: Spatial variability in the abundance, composition, and age of organic matter in surficial sediments of the East China Sea, J. Geophys. Res., 118, 1495–1507, 2013.
Yang, S. L., Milliman, J. D., Li, P., and Xu, K.: 50,000 dams later: erosion of the Yangtze River and its delta, Global Planet. Change, 75, 14–20, 2011.
York, J. K., Tomasky, G., Valiela, I., and Giblin, A. E.: Isotopic approach to determining the fate of ammonium regenerated from sediments in a eutrophic sub-estuary of Waquoit Bay, MA., Estuar. Coast., 33, 1069–1079, 2010.
Zhang, J., Wu, Y., Jennerjahn, T. C., Ittekkot, V., and He, Q.: Distribution of organic matter in the Changjiang (Yangtze River) Estuary and their stable carbon and nitrogen isotopic ratios: Implications for source discrimination and sedimentary dynamics, Mar. Chem., 106, 111–126, 2007.
Zheng, L., Chen, B., Liu, X., Huang, B., Liu, H., and Song, S.: Seasonal variations in the effect of microzooplankton grazing on phytoplankton in the East China Sea, Cont. Shelf Res., 111, 304–315, 2015.
Zhou, F., Xue, H., Huang, D., Xuan, J., Ni, X., Xiu, P., and Hao, Q.: Cross-shelf exchange in the shelf of the East China Sea, J. Geophys. Res., 120, 1545–1572, 2015.
Zhou, W. H., Yin, K. D., Long, A. M., Huang, H., Huang, L. M., and Zhu, D. D.: Spatial-temporal variability of total and size-fractionated phytoplankton biomass in the Yangtze River Estuary and adjacent East China Sea coastal waters, China, Aquat. Ecosyst. Health Manage., 15, 200–209, 2012.
Zhu, C., Wang, Z. H., Xue, B., Yu, P. S., Pan, J. M., Wagner, T., and Pancost, R. D.: Characterizing the depositional settings for sedimentary organic matter distributions in the Lower Yangtze River-East China Sea Shelf System, Estuar. Coast. Shelf S., 93, 182–191, 2011.