the Creative Commons Attribution 4.0 License.
the Creative Commons Attribution 4.0 License.
 | 07 May 2018
Massive carbon addition to an organic-rich Andosol increased the subsoil but not the topsoil carbon stock
Antonia Zieger
Klaus Kaiser
Pedro Ríos Guayasamín
Martin Kaupenjohann
Andosols are among the most carbon-rich soils, with an average of 254 Mg ha−1 organic carbon (OC) in the upper 100 cm. A current theory proposes an upper limit for OC stocks independent of increasing carbon input, because of finite binding capacities of the soil mineral phase. We tested the possible limits in OC stocks for Andosols with already large OC concentrations and stocks (212 g kg−1 in the first horizon, 301 Mg ha−1 in the upper 100 cm). The soils received large inputs of 1800 Mg OC ha−1 as sawdust within a time period of 20 years. Adjacent soils without sawdust application served as controls. We determined total OC stocks as well as the storage forms of organic matter (OM) of five horizons down to 100 cm depth. Storage forms considered were pyrogenic carbon, OM of < 1.6 g cm−3 density and with little to no interaction with the mineral phase, and strongly mineral-bonded OM forming particles of densities between 1.6 and 2.0 g cm−3 or > 2.0 g cm−3. The two fractions > 1.6 g cm−3 were also analysed for aluminium-organic matter complexes (Al–OM complexes) and imogolite-type phases using ammonium-oxalate–oxalic-acid extraction and X-ray diffraction (XRD).
Pyrogenic organic carbon represented only up to 5 wt % of OC, and thus contributed little to soil OM. In the two topsoil horizons, the fraction between 1.6 and 2.0 g cm−3 had 65–86 wt % of bulk soil OC and was dominated by Al–OM complexes. In deeper horizons, the fraction > 2.0 g cm−3 contained 80–97 wt % of the bulk soil's total OC and was characterized by a mixture of Al–OM complexes and imogolite-type phases, with proportions of imogolite-type phases increasing with depth. In response to the sawdust application, only the OC stock at 25–50 cm depth increased significantly (α=0.05, ). The increase was entirely due to increased OC in the two fractions > 1.6 g cm−3. However, there was no significant increase in the total OC stocks within the upper 100 cm.
The results suggest that long-term large OC inputs cannot be taken up by the obviously OC-saturated topsoil but induce downward migration and gradually increasing storage of OC in subsurface soil layers. The small additional OC accumulation despite the extremely large OC input over 20 years, however, shows that long time periods of high input are needed to promote the downward movement and deep soil storage of OC.
- Article
(4070 KB) - Full-text XML
-
Supplement
(400 KB) - BibTeX
- EndNote


Soil holds more organic carbon (OC) than there is carbon in the global vegetation and atmosphere combined (Lehmann and Kleber, 2015). Soil organic matter (OM) improves plant growth and protects water quality by retaining nutrients as well as pollutants in the soil (Lal, 2004). Thus, understanding the soil OC dynamics is crucial for developing strategies to mitigate the increase in atmospheric CO2 concentrations and to increase soil fertility (Stewart et al., 2007). The dynamic nature of the soil carbon reservoir is the result of the dynamic equilibrium between organic and inorganic material entering and leaving the soil (Schrumpf et al., 2011).
There are contradicting views of soil carbon storage capacities. According to Lal (2004), the OC stock to 1 m depth ranges from 30 Mg ha−1 in arid climates to 800 Mg ha−1 in organic soils in cold regions; the predominant range is 50 to 150 Mg ha−1. Paustian et al. (1997) consider the carbon input rate as the main factor for influencing carbon stocks. The authors state that OC stocks increase linearly with increasing organic input without having an upper limit. Most current OC models using this linear relationship perform reasonably well across a diversity of soils and land use changes (Campbell and Paustian, 2015). On the contrary, Campbell et al. (1991) published data where soils rich in OC show little or no increase in soil OC despite a 2- to 3-fold increase in carbon input. This motivated Six et al. (2002) and Stewart et al. (2007) to propose that the OC accumulation potentials of soils are limited independent of increasing carbon input. They attributed this to the limited binding capacities of minerals. This concept is reflected by the model of Schmidt et al. (2011) in which the OC input is stepwise mineralized, surpassing the form of large biopolymeres, small biopolymers with less than 600 Da, and monomers. At each step the possibility of interaction with mineral phases increases, leading to different OC storage forms with differing turnover times and degree of interaction with the mineral phase. The predominant proportion of OM in soils is associated with the mineral phase (e.g. Schrumpf et al., 2013). Minerals have finite reactive surface areas, and consequently finite OM binding capacities. The size of the surface area depends on the type of mineral, and so the differences in OC stocks among soils are due to different types and amounts of the contained minerals. Thus, the OC input rate is only crucial as long as the mineral OC storage capacities are not exhausted. However, the concept of limited storage capacity has hardly been experimentally tested so far.
Allophane and imogolite-type phases are, besides Al and Fe oxides, the most effective minerals to bind OM (Kögel-Knabner et al., 2008; Huang et al., 2011a). They dominate the mineral assemblage of Andosols, making them the most carbon-rich mineral soil type (Huang et al., 2011a; IUSS Working Group WRB, 2015; Basile-Doelsch et al., 2007). Andosols are subdivided into silandic and aluandic subgroups. Silandic Andosols have 80–120 g OC kg−1 soil, whereas aluandic Andosols can contain up to 300 g OC kg−1 soil (Huang et al., 2011a). Differences in OC concentrations among both subgroups are explained by differing carbon storage mechanisms. Organic matter in silandic Andosols is mainly bound to allophanes, imogolites, and protoimogolites (grouped as imogolite-type phases Levard et al., 2012). The OM in aluandic Andosols is mainly stored within aluminium-organic complexes (Al–OM complexes). The Al in these complexes can be either monomeric Al3+ ions or hydroxilated Al species (Huang et al., 2011a; Colombo et al., 2004; Masion et al., 1994). Andosols with extremely high OC concentrations likely present OM-saturated mineral phases, at least in the topsoil, and should respond with no change in OC concentrations to increasing carbon input.
In order to test the concept of limited OC storage capacity in soils we took the opportunity of a unique setting in the Ecuadorian rainforest, where a carbon-rich Andosol (301 Mg OC ha−1 within the first 100 cm) received an extra 1800 Mg OC ha−1 input as sawdust during a period of 20 years. Adjacent soils without sawdust application served as controls.
We tested the following hypotheses: (i) the additional OC input did not result in increased OC in the topsoil, but in the subsoil, because the mineral binding capacities for OM in the topsoil are exhausted and mobile OM is transported into the subsoil and retained there; (ii) the increase in OC in the subsoil is due to OM binding to the mineral phase; and (iii) the total OC stock of the soil increased significantly.
We determined total OC stocks as well as the storage forms of OM and the mineral composition down to 100 cm depth. For determining different OM storage forms we used the sequential density fractionation method yielding OM fractions of different degrees of mineral interaction. We also determined pyrogenic organic carbon (PyC) because of its significant contribution to OC stocks in some regions of the Amazon basin (e.g. Glaser et al., 2000). We used ammonium-oxalate–oxalic-acid extraction and X-ray diffraction for characterizing the prevalent mineral species in density fractions containing organic–mineral associations.
2.1 Soil sample source and handling
The study site is located in Ecuador, within the Centro de Rescarte de la Flora Amazónica (CERFA) 3 km south of Puyo (1∘30′50 S, 77∘58′50 E, 950 m a.s.l.). Puyo, located in the transition zone between the Andes and the western Amazon basin, lies in the centre of a largely homogeneous alluvial fan composed of re-deposited Pleistocene volcanic debris of the Mera formation (Sauer, 1971; Mortimer et al., 1980). The deposited material belongs to the andesite-plagidacite series or the andesite andesitedacite-rhyolite series (Hörmann and Pichler, 1982).
The climate is diurnal tropical with mean annual temperatures of 20.8 ∘C and annual precipitation of 4403 mm (Schwarz, 2015). The vegetation cover is tropical rainforest and pasture (Tello, 2014).
Before 1980 the sampling area was first used for traditional shifting cultivation, and then pasture dairy farming. Since 1980 5 ha of pasture were reforested by Nelson Omar Tello Benalcázar. On 3 ha, within this area, he applied 1800 t OC ha−1 additional litter in the form of sawdust until the year 2000 (sawdust site). About 10 m3 of sawdust were applied approximately evenly over the site by hand every day on 5 days a week for 20 years. The sawdust was collected on a daily basis from a local sawmill. The 5 ha reforested area is now covered by a 37-years-old secondary rainforest (Tello, 2014).
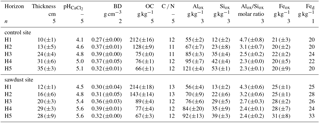
Table 1Selected bulk properties of the studied Andosol. Soil horizon thicknesses, pH values, bulk densities (BD), bulk organic carbon (OC) concentrations and carbon nitrogen ratios (C ∕ N) are given as means with the standard error where appropriate. The Alox, Siox, and Feox represent ammonium-oxalate–oxalic-acid-extractable aluminium, silicon, and iron and are given as the mean concentrations and standard error. Fed is dithionite-extractable iron analysed with samples from only one profile per site. The concentrations of Al, Si, and Fe are normalized to the mineral part (or inorganic part) of the dry soil assuming that the mass of OM is 2 times the mass of OC (Sollins et al., 2006). The row marked with n represents the number of profiles analysed per site.
As the site was not originally designed for experimental purposes, our research plots are not arranged in a randomized plot design. Nevertheless, we think that it can be scientifically useful because the plot areas are fairly large (2–3 ha at each site) and essential conditions like exposition, inclination, climate, and geology are the same for the treated and untreated areas. No information about changes in tree species over time and possible differences in species due to the sawdust input are available. Therefore, no precise information on differences in carbon input due to litterfall are available. Using the litterfall biomass of 0.9–6.0 Mg ha−1 yr−1 carbon reported by Clark et al. (2001) for tropical forests across the world, we estimated the litter input since 1980 at the study site to be 33–222 Mg ha−1. This means that the maximum carbon input with litter represents 2–12 % of the total sawdust carbon input and is therefore insignificant. In order to estimate the belowground biomass as a possible soil OC source, we measured the gravimetric root intensity. We found no significant difference between the sites (for data see Table A1).
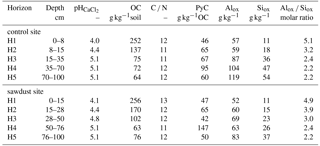
Table 2Selected properties of bulk samples used in the sequential density fractionation. The soil profiles were selected on the basis of having five horizons within the upper 1 m, largest OC concentration in horizon one, similar amount of acid–oxalate-extractable elements, and having different bulk OC concentrations in the third horizon. Presented are bulk organic carbon (OC) concentrations, carbon-to-nitrogen ratios (C ∕ N), and pyrogenic carbon (PyC) contents normalized to bulk soil OC. Alox, Siox, and Feox are the concentrations of ammonium-oxalate-oxalic-acid-extractable aluminium, silicon, and iron. The concentrations of Al, Si, and Fe are normalized to the mineral part (or inorganic part) of the dry soil assuming that the mass of OM is 2 times the mass of OC (Sollins et al., 2006).
We classified the soil as an alusilandic Andosol, based on the IUSS Working Group WRB (2015) (for selected properties see Table 1, for a profile example see Fig. A1). Few prominent X-ray diffraction reflections indicate simple mineral composition. The crystalline primary minerals are amphibole, chlorite, quartz, and plagioclase. Kaolinite and other secondary clay minerals are not present. Contents of crystalline Fe oxides and gibbsite are little. Oxalate extractions indicate large amounts of short-range-ordered and nano- or micro-crystalline mineral phases.
The soil samples for this study were taken in 2014 from the upper 100 cm at five profiles at both the secondary rainforest with sawdust application site (sawdust site) and the adjacent forest site where no sawdust was applied (control site). The positions of the 10 profiles were randomly selected and each profile had a width of 1 m. We define horizons one and two as the topsoil and horizons three to five as the subsoil. Samples were oven dried at 40 ∘C in Ecuador at the Universidad Estatal Amazónica, before transport to the laboratory in Germany and sieving to < 2 mm. All analyses, except for X-ray diffraction which was carried out with no replicate, were carried out in duplicates. Results are presented as means of replicates. Sequential density fractionation, subsequent mineralogical analyses, and PyC analyses were carried out for one representative profile per site (for selected soil data see Table 2). The soil profiles for these analyses were selected on the basis of having five horizons within the upper 1 m, the largest bulk OC concentration in horizon one, a similar amount of acid–oxalate-extractable elements, and having different bulk OC concentrations in the third horizon. All calculations and graphs were processed with R version 3.4.3 (The R Foundation for Statistical Computing, 2017).
2.2 Bulk organic carbon concentration and stock
OC stocks were calculated based on soil volume to the fixed soil depth of 1 m. The equivalent soil mass approach propagated by Schrumpf et al. (2011) and Wendt and Hauser (2013) was not applied, because (i) bulk density did not vary much between sites for the same horizons, (ii) the studied site was not cropland, and (iii) the approach increases uncertainties in OC stocks of undisturbed soils (Schrumpf et al., 2011).
We distinguished up to five soil horizons per profile and determined bulk density, horizon thickness, and OC concentrations. Horizon thickness and OC concentrations were recorded at all five profiles per site. Aliquots of all bulk samples were grounded and oven dried at 105 ∘C for 24 h prior to OC and nitrogen (N) determination with an Elementar Vario EL III CNS analyzer. The bulk densities were determined at two profiles per site (all horizons). At each horizon, five replicates were sampled with 100 cm3 corers, oven-dried at 105 ∘C for 24 h, and weighed. For calculating the OC stock of horizons in all five profiles per site (horizoni), the mean of bulk densities (meanBD) was used (Eq. 1). The OC stock of each profile is the sum of the respective horizons' OC stocks. The OC stocks are presented as the means with their 95 % confidence interval. As the soils contained no material > 2 mm in diameter, the soil particles < 2 mm represent the total soil mass.
For comparing OC stocks at different depths, we also cumulated the OC stocks of each horizon proportionally. We choose the depths 0–25, 25–50, 50–75, and 75–100 cm in order to represent the topsoil, horizon three (25–50 cm), and the subsoil below horizon three. We performed two sample t tests of mean values for comparing bulk OC stocks and OC concentrations between sites. The two sample t tests were performed unpaired, one sided, at the significance level α=0.05 and the power of . The OC concentration and OC stocks at the sawdust site were considered significantly larger, if the t test's confidence interval did not contain zero and the sampling number was sufficient. We calculated the minimum sample number (nmin) and power (powerth) for the difference we wish to detect (Δth) between the sites to evaluate the power of our data. The Δth is either the mean difference or assumed to be 10 % of the mean at the control site.
2.3 Pyrogenic carbon analyses
Analysis of PyC was carried out in the department of soil science at Rheinische Friedrich-Wilhelms-Universität Bonn. It followed the revised protocol of Brodowski et al. (2005). For quantifying the benzene polycarboxylic acids (BPCA), 10 mg of dried and ground soil material was treated with 10 mL 4 M CF3CO2H (99%, Sigma-Aldrich, Taufkirchen, Germany) to remove polyvalent cations. The PyC was then oxidized with HNO3 (8 h, 170 ∘C) and converted to BPCAs. After removal of metal ions with a cation exchange column (Dowex 50 W X 8, 200–400 mesh, Fluka, Steinheim, Germany), the BPCAs were silylated and determined using gas chromatography with a flame ionization detection (GC-FID; Agilent 6890 gas chromatograph; Optima-5 column; 30 m × 0.25 mm i.d., 0.25 µm film thickness; Supelco, Steinheim, Germany). Two internal standards citric acid and biphenyl dicarboxylic acid were used. Carefully monitoring the pH avoided decomposition of citric acid during sample processing as criticized by Schneider et al. (2010). The recovery of internal standard 1 (citric acid) ranged between 78 and 98 %. Carbon content of BPCA (BPCA-C) was converted to PyC using the conversion factor of 2.3 (Brodowski et al., 2005). The analyses showed good repeatability, with differences between two measurement parallels being < 4.2 g PyC kg−1OC, except for the second horizon at the control site where the parallels differed by 12.5 g PyC kg−1OC.
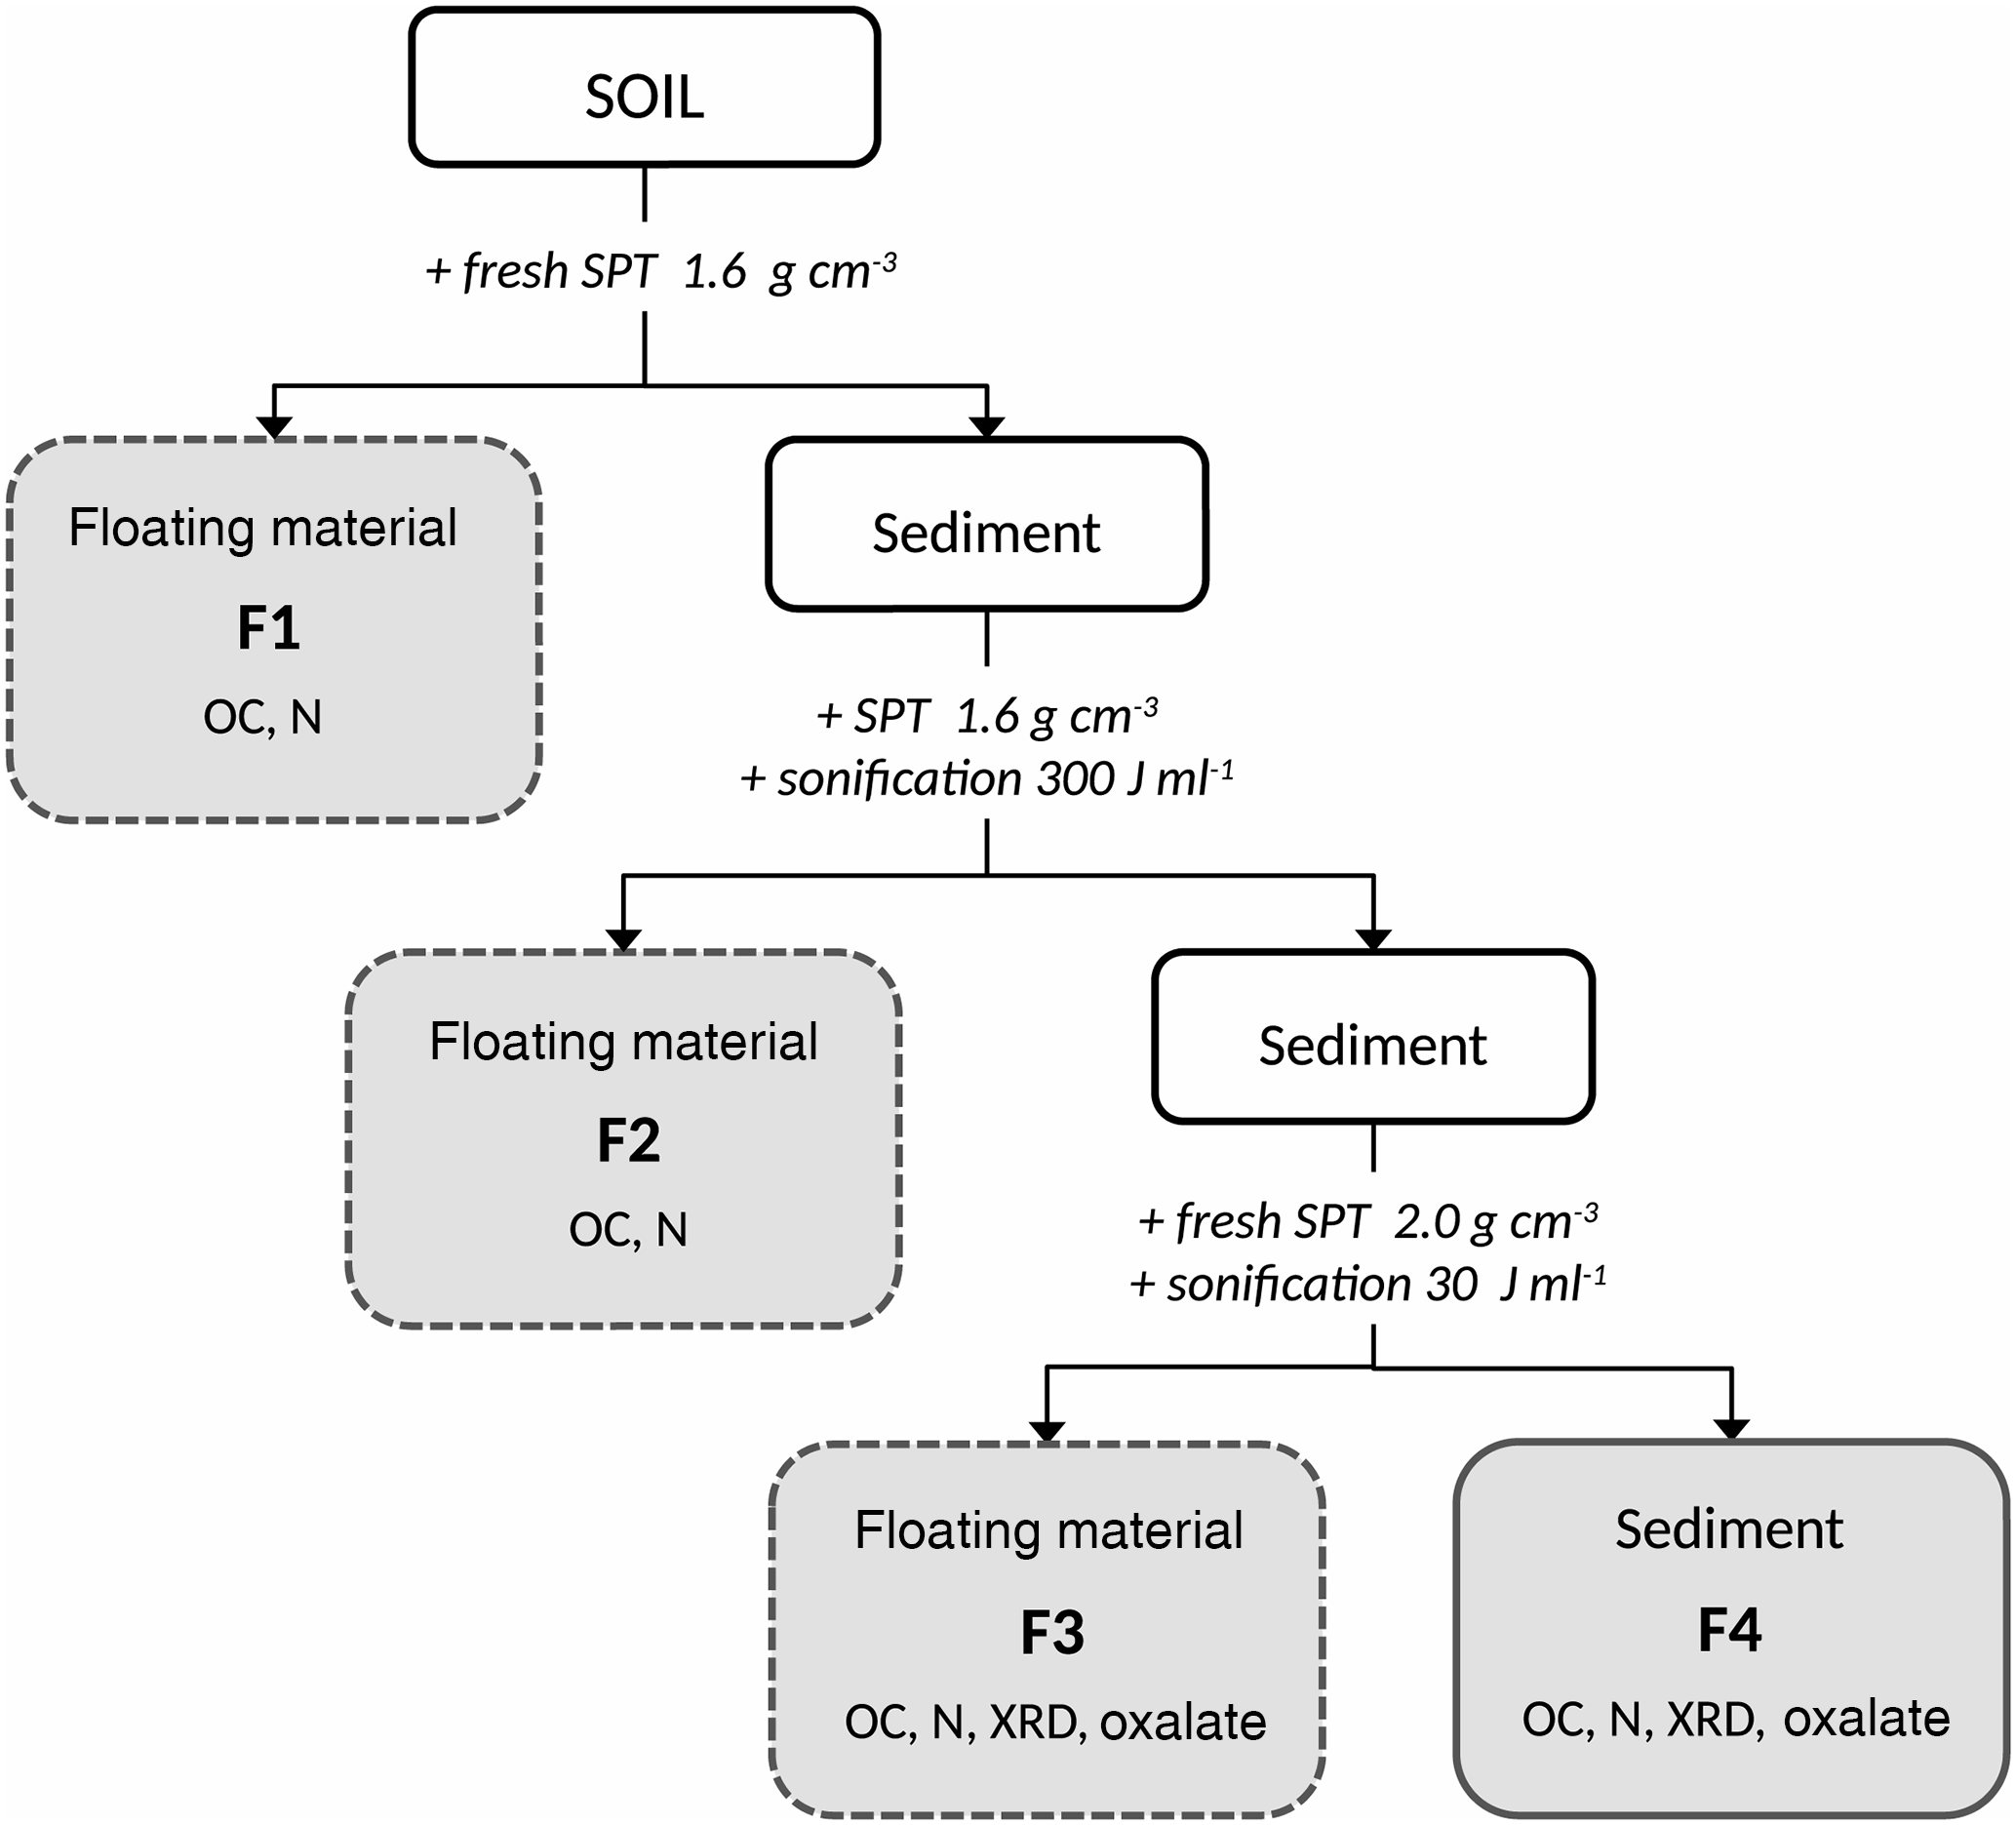
Figure 1Sequential density fractionation scheme. SPT: sodium-polytungstate solution, F1: fraction predominately organic matter of densities < 1.6 g cm−3 with basically no interaction with the mineral phase, F2: fraction predominately organic matter of densities < 1.6 g cm−3 and weakly associated with the mineral phase, F3: soil materials of densities between 1.6 and 2.0 g cm−3 and holding organic matter strongly bound to mineral phases, F4: soil materials of densities > 2.0 g cm−3 and holding organic matter strongly bound to mineral phases. Below the fraction labeling, subsequent analyses are listed. OC: total organic carbon concentration, N: nitrogen concentration, XRD: X-ray diffraction, Oxalate: ammonium-oxalate–oxalic-acid extraction
2.4 Sequential density fractionation of OM
We modified the sequential density fractionation procedure (Fig. 1) described by Cerli et al. (2012) in order to separate four different fractions. The first light fraction (F1) contains OM that is basically not interacting with the mineral phase, often labelled free particulate OM. The second light fraction (F2) contains mainly particulate OM being incorporated into aggregates, thus having little interaction with the mineral phase. The third and forth fractions (F3, F4) are heavy fractions mainly containing OM strongly bound to the mineral phase.
Fifteen grams of dried (40 ∘C) and sieved (< 2 mm) soil were mixed with 75 mL of sodium polytungstate solution (SPT, TC-Tungsten Compounds) with a density of 1.6 g cm−3 in 200 mL PE (polyethylene) bottles. To obtain F1, the bottles were gently shaken a few times, and then the suspensions were allowed to settle for 1 h and subsequently centrifuged at 4500 g for 30 min (Sorvall RC-5B). The supernatant was siphoned with a water jet pump and the F1 fraction was collected on a pre-rinsed 1.2 µm cellulose-nitrate membrane filter. After rinsing with deionized water until the conductivity of the filtrate was < 50 µS cm−1, F1 was transferred into a 50 mL PE bottle and subsequently freeze-dried (Martin Christ Gefriertrocknungsanlagen GmbH, models Alpha 2–4 and 1–4 LCS).
The residue was re-suspended with re-collected SPT solution and refilled with fresh SPT solution (1.6 g cm−3) until the original sample bottle mass was maintained. In order to release F2, the samples were dispersed by sonication (13 mm pole head sonotrode, submersed to 15 mm depth, oscillation frequency 20 Hz, sonication power 48.98 J s−1; Branson Sonifier 250). The energy input was 300 J mL−1, calibrated according to Schmidt et al. (1999). The appropriate energy input was determined in a preliminary experiment as that energy which released the largest amount of largely pure OM (Cerli et al., 2012). Temperature was kept < 40 ∘C using an ice bath to avoid thermal sample alteration. Thereafter, the sample was centrifuged at 4500 g for 30 min and the floating material was separated, washed, and dried as described above for F1.
In order to further separate the residual > 1.6 g cm−3 fraction into Al–OM complexes and imogolite-type phases, we introduced an additional density cut off. This is sensible because the overall density of organic–mineral associations depends on OM density, mineral density, and OM load (Kaiser and Guggenberger, 2007; Chenu and Plante, 2006). The densities of pure imogolite-type mineral phases and Al–OM complexes are similar (Huang et al., 2011c), but Boudot (1992) and Kaiser and Guggenberger (2007) showed that Al–OM complexes have a higher OM load than imogolite-type phases. The second density cut off at 2.0 g cm−3 was selected based on OC concentrations, XRD spectra, and oxalate-extractable Al, Si, and Fe concentrations determined in a preliminary experiment. The fraction with a density between 1.6. and 2.0 g cm−3 was found to be enriched in Al–OM complexes (F3), while the fraction > 2.0 g cm−3 (F4) was rich in imogolite-type phases.
For obtaining F3, the residue of the previous separation step was re-suspended in 75 mL fresh SPT solution (density of 2.0 g cm−3), dispersed at 30 J mL−1 to ensure dispersion, centrifuged, separated, washed, and dried as described above for F1. The final residue of > 2.0 g cm−3 density (F4) was rinsed with deionized water until the conductivity of the supernatant was < 50 µS cm−1 and subsequently freeze-dried.
Aliquots of all fraction samples were oven dried at 105 ∘C for 24 h prior to OC and N determination with an Elementar Vario EL III CNS analyzer.
To test if the separation of particles with F3 and F4 is caused by either variations in mineral density or OM loading, we calculated the overall soil particle densities ρsoil particle in F3 using Eq. (2) (Chenu and Plante, 2006). We assume the minerals to have densities (ρM) of about 2.7 g cm−3 (Huang et al., 2011c) and OM (xOM as 2×OC) to have an average density (ρOM) of 1.4 g cm−3 (Mayer et al., 2004).
2.5 Acid–oxalate extraction of F3 and F4
Aluminium (Al) and silicon (Si) of short-range-ordered phases were extracted using the ammonium-oxalate–oxalic-acid reagent proposed by Schwertmann (1964). Either 0.1 or 0.5 g of oven dried (105 ∘C) and grounded F3 and F4 material were suspended in 0.2 M ammonium oxalate–oxalic acid at pH 3 at a soil-to-solution ratio of 1 g : 100 mL and shaken for 2 h in the dark. The suspension was decanted over Munktell 131 paper filters, with the first turbid effluent being discarded. Clear solutions were stored in the dark and at room temperature for no more than 1 day. Al and Si concentrations were determined by ICP-OES (Thermo Scientific, iCAP 6000 series). The iron (Fe) concentrations were measured but results are not presented here since they were very low compared to those of Al and Si (< 30 g kg−1, Table 1). The recovery rates are calculated as the sum of the elements' amount quantified in F3 and F4 normalized to oxalate extractable amounts of the element in bulk samples. Since the high and strongly varying with depth concentrations of organic matter masks the actual contribution of oxalate extractable minerals to total mineral constituents, we normalized the oxalate-extractable metals to the mineral soil component (or inorganic part) instead of to the dry soil. We calculated the mineral proportion of the samples assuming the mass of OM being 2 times the mass of OC (Sollins et al., 2006).
2.6 X-ray diffraction of F3 and F4
X-ray diffraction (XRD) spectra were obtained on each one F3 and F4 sample per horizon of the samples from the sawdust site. Samples were grounded with a ball mill and oven dried at 105 ∘C for 24 h. The random oriented powders were analysed using a PANalytical Empyrean X-ray diffractometer with theta/theta geometry, 1 D-PIXcell detector, Cu-Kα radiation at 40 kV and 40 mA, at an angle range of 5–65 ∘2θ with 378 s counting time per 0.013 ∘ 2θ step and automatically acting diaphragm. Evaluation was performed using the X'Pert HighScore Plus V 3.0 (PANalytical) software.
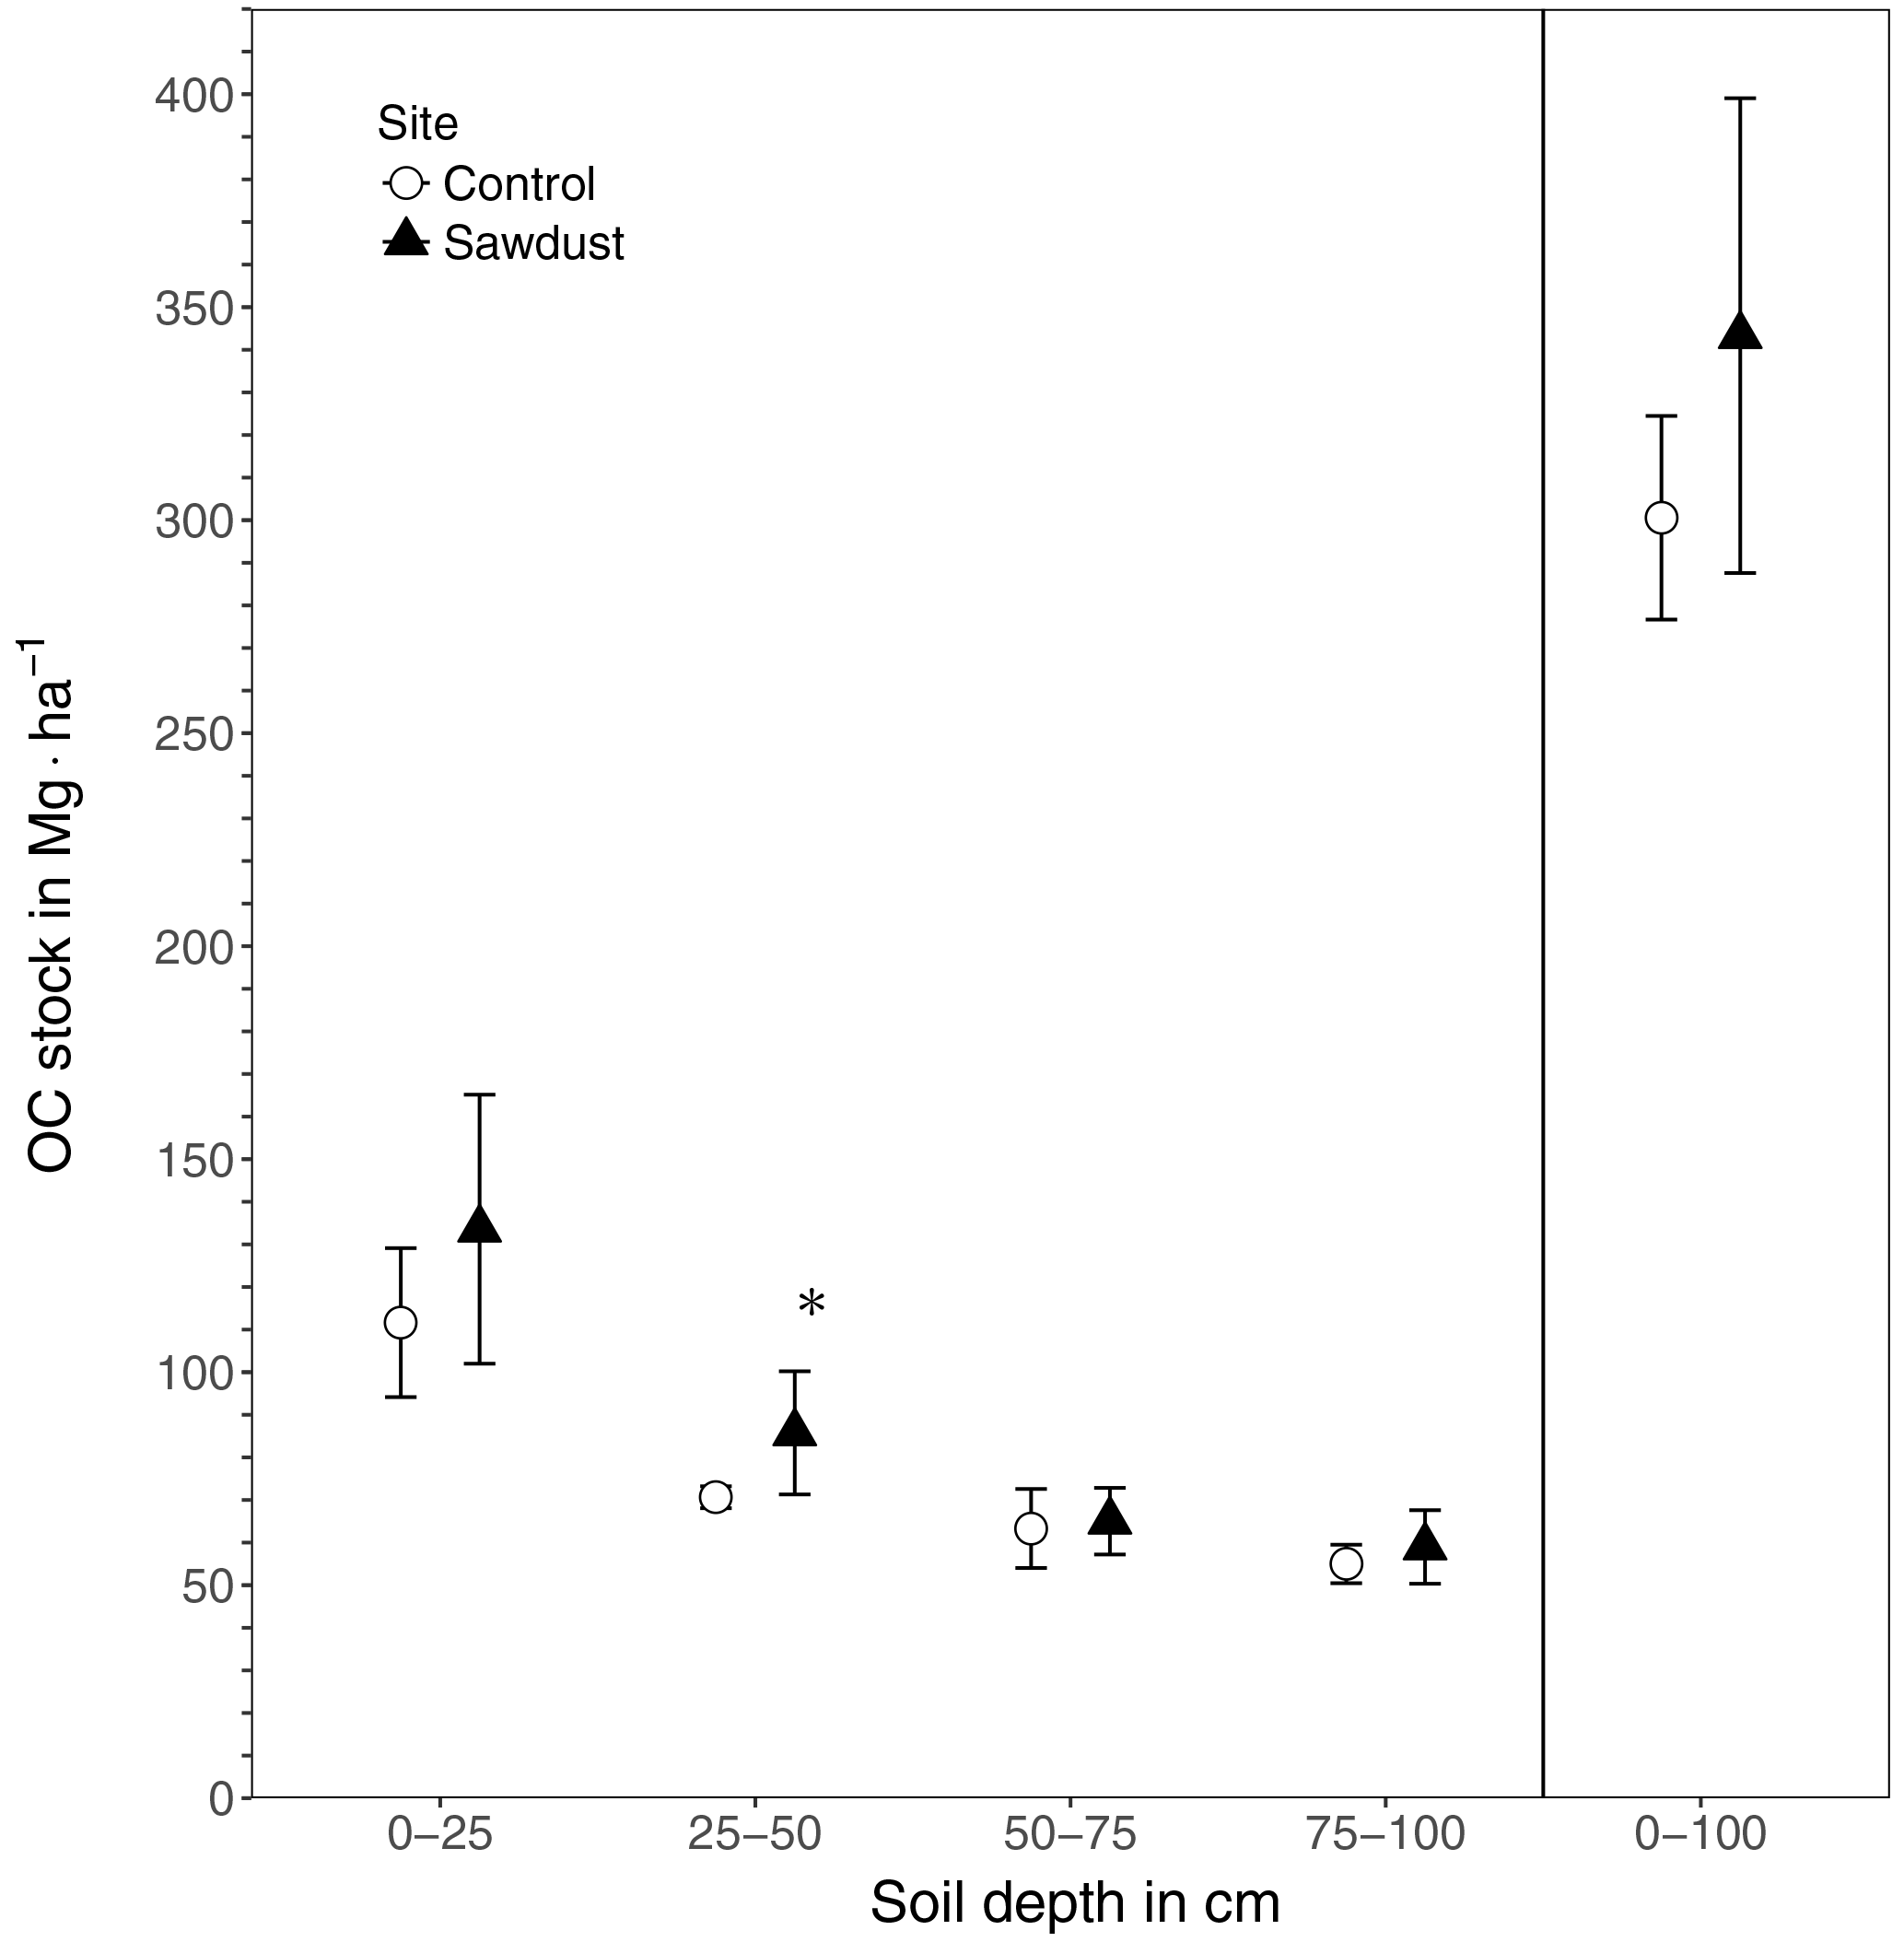
Figure 2The organic carbon (OC) stocks of the sawdust and the control sites. Presented are the entire profile (0–100) and the four selected depth increments 0–25, 25–50, 50–75, and 75–100 cm as the mean and the 95 % confidence interval. ∗ The OC stock at the sawdust site is significantly (α=0.05, ) larger compared to the control site.
3.1 Bulk organic carbon
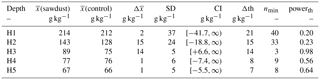
The bulk OC concentrations are largest in the first horizon with around 212 g kg−1, declining continuously with depth to around 66 g kg−1 (Tables 1 and A3). The first two horizons show large variances, being slightly larger at the sawdust site. The subsoil horizons have low variances and also have, except for horizon three with a difference of 14 g kg−1, very low differences in their means between sites. The PyC proportion on bulk OC range between 42 and 147 g PyC kg−1 OC (Table 2) and vary with depth in a non-regular pattern.
The total OC stock at the sawdust site has a mean of 343 Mg ha−1 with a 95 % confidence interval of [288, 399]. At the control site the confidence interval is [277, 324] with a mean of 301 Mg ha−1 (Fig. 2). The 0–25 cm segment contributes most to the total OC stock and their confidence intervals also have the largest range. Both the mean and the ranges of the confidence intervals decrease with depth at both sites.
The total OC stock does not significantly differ between the two sites, although the t test confidence interval was close to being positive (Appendix Table A2). Additionally, a sample number larger than 9 would have been necessary to reach the test power of 0.8. Out of the selected depth increments the 25–50 cm segment, which comprises mostly the third horizon, showed significantly larger OC stocks at the sawdust site and the collected sample number was sufficient (Table A2). The bulk OC concentrations of horizon three at the sawdust site was significantly higher (Table A3). The OC concentrations at all other horizons did not show significant differences between sites.
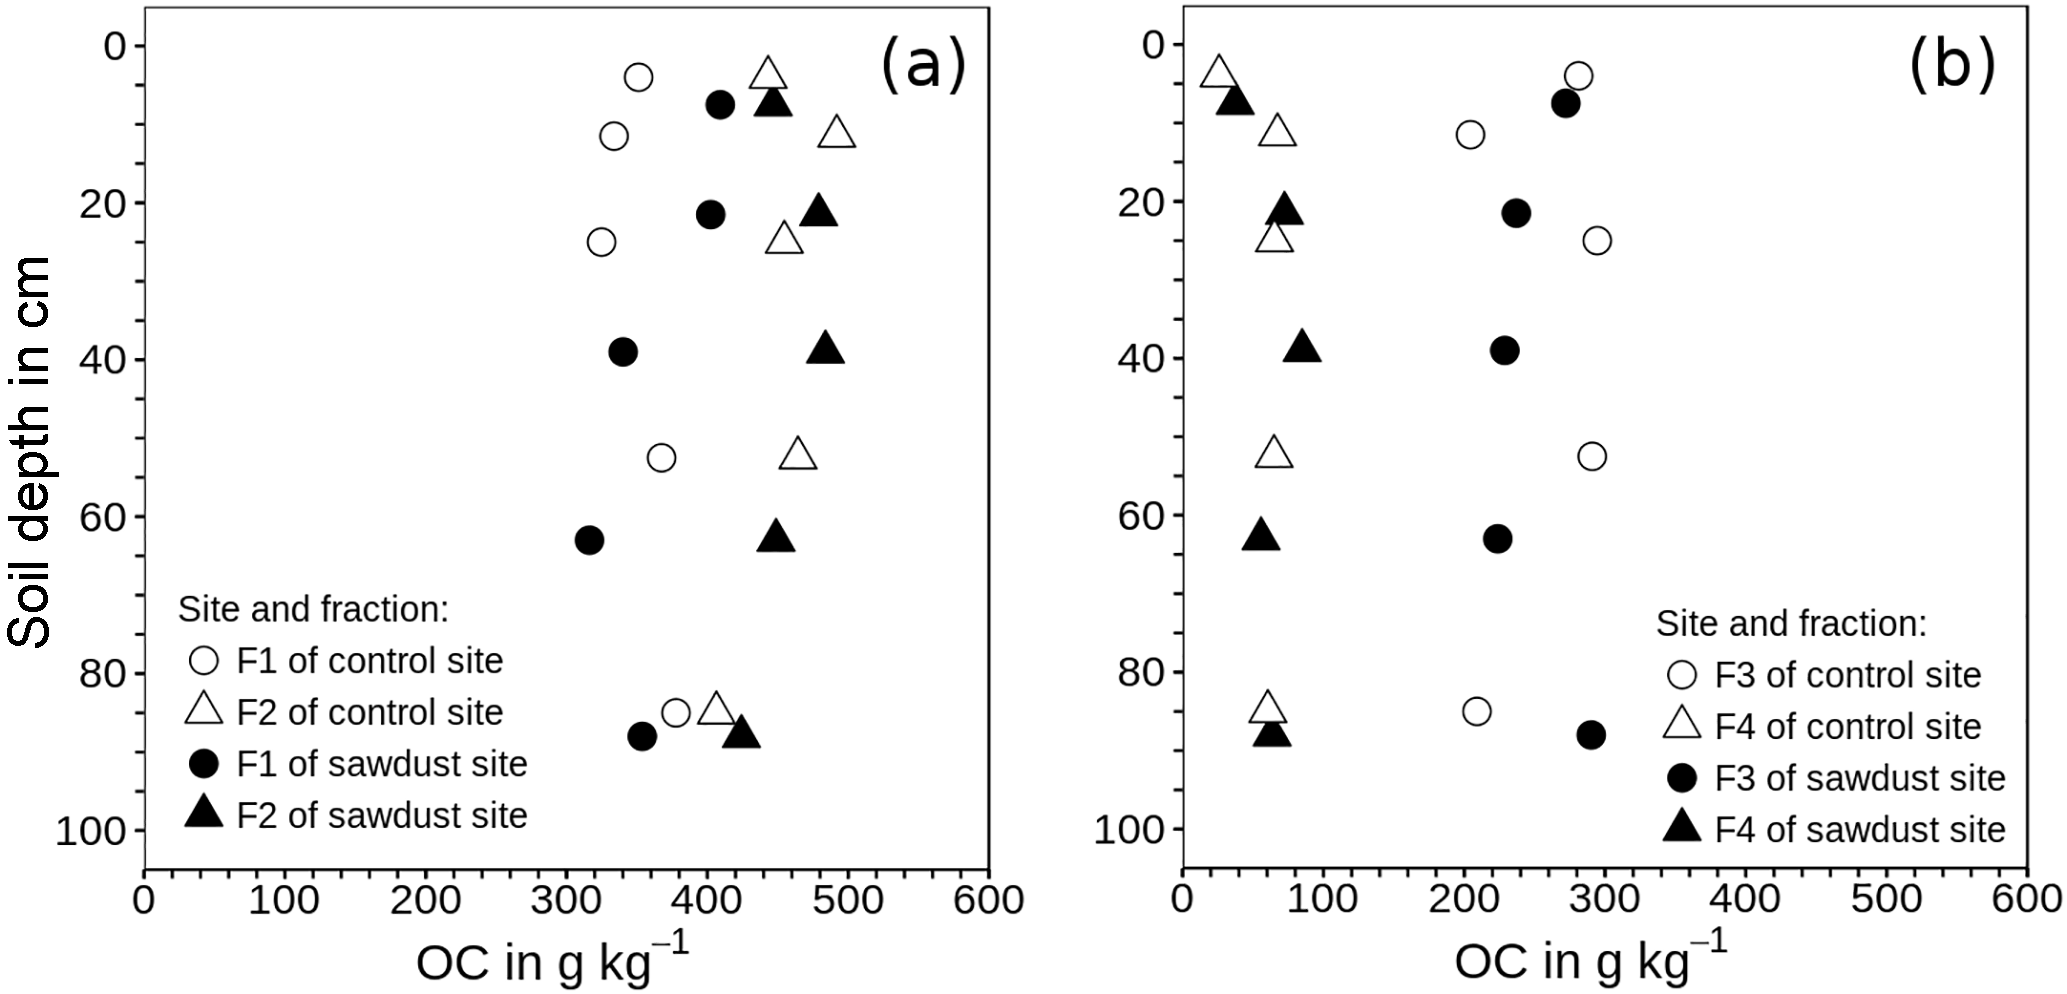
Figure 3Mean of organic carbon (OC) concentrations in density fractions one to four related to the mass of the respective fraction instead of the bulk soil mass. (a) Fraction 1 (F1) contains material released directly; fraction 2 (F2) represents material released after applying 300 J mL−1 sonication energy. (b) Fractions 3 and 4 comprise organic matter strongly bound to mineral phases in soil particles of densities between 1.6 and 2.0 g cm−3 (F3) and > 2.0 g cm−3 (F4).
3.2 Sequential density fractionation
3.2.1 Organic matter
The performance of the density fractionation was evaluated using the recovery of mass and OC and the OC concentration patterns within the fractions (Fig. 3). The recoveries of the soil mass range between 98 and 102 wt %. The OC recoveries are on average 95 wt % and always larger than 89 wt %. Thus despite the numerous fractionation steps and extensive rinsing, the overall high recoveries suggest very little losses of material due to dissolution and dispersion during the fractionation. Values exceeding 100 wt % are probably caused by random errors of measurements and some SPT not entirely removed by sample washing.
The OC concentrations increase in the order F4 < F3 < F1 < F2 at all depths and all sites. The OC concentrations are related to the respective fraction mass. The two light fractions (F1, F2) are rich in OC with 285–422 and 371–501 g kg−1 for F1 and F2, respectively. Fraction three also has large OC concentrations, which vary between 204 and 294 g kg−1 with depth, showing no regular depth patterns. In F4 the OC concentrations are much lower. They are the lowest in the first 10 cm (30 g kg−1) and remain at a similar but slightly higher level of (65 g kg−1) deeper down the profile.
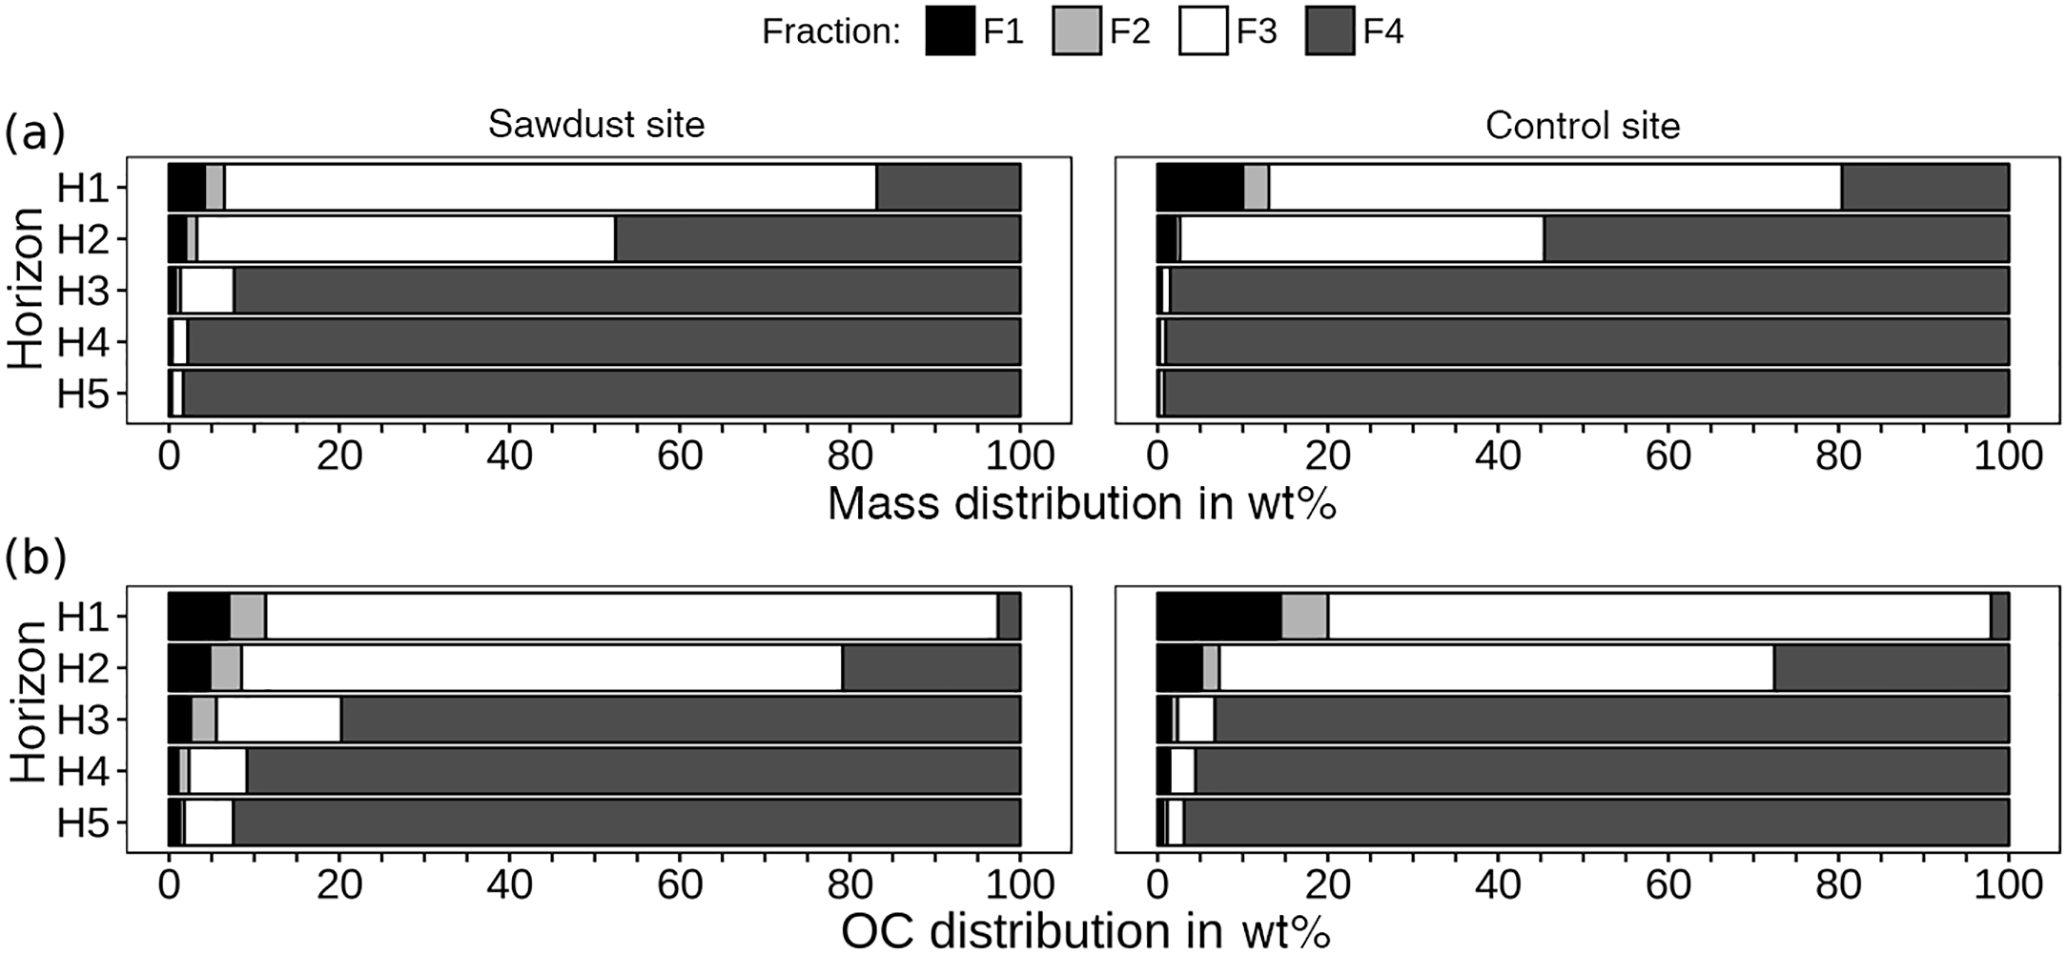
Figure 4Mass (a) and organic carbon (OC, b) distribution over density fractions, given as percentages of cumulated fractions. Fractions 1 and 2 contain material either directly released (F1) or after applying 300 J mL−1 sonication energy (F2). Fractions 3 and 4 comprise organic matter strongly bound to mineral phases in soil particles of densities between 1.6 and 2.0 G cm−3 (F3) or > 2.0 g cm−3 (F4).
To evaluate the OC storage forms, we evaluated the contribution of individual fractions to bulk sample OC (Fig. 4). Fractions one and two account for less than 11 wt % of bulk sample OC at the sawdust site and 20 wt % at the control site (Fig. 4b). Their proportions decrease rapidly with depth to 2 and 1 wt % in horizon five. The OC with F3 decreases drastically from > 65 wt % in the topsoils to < 7 wt % in the subsoils at both sites. The OC with F4 increases strongly from < 27 wt % in the topsoils to > 91 wt % in the subsoils at both sites.
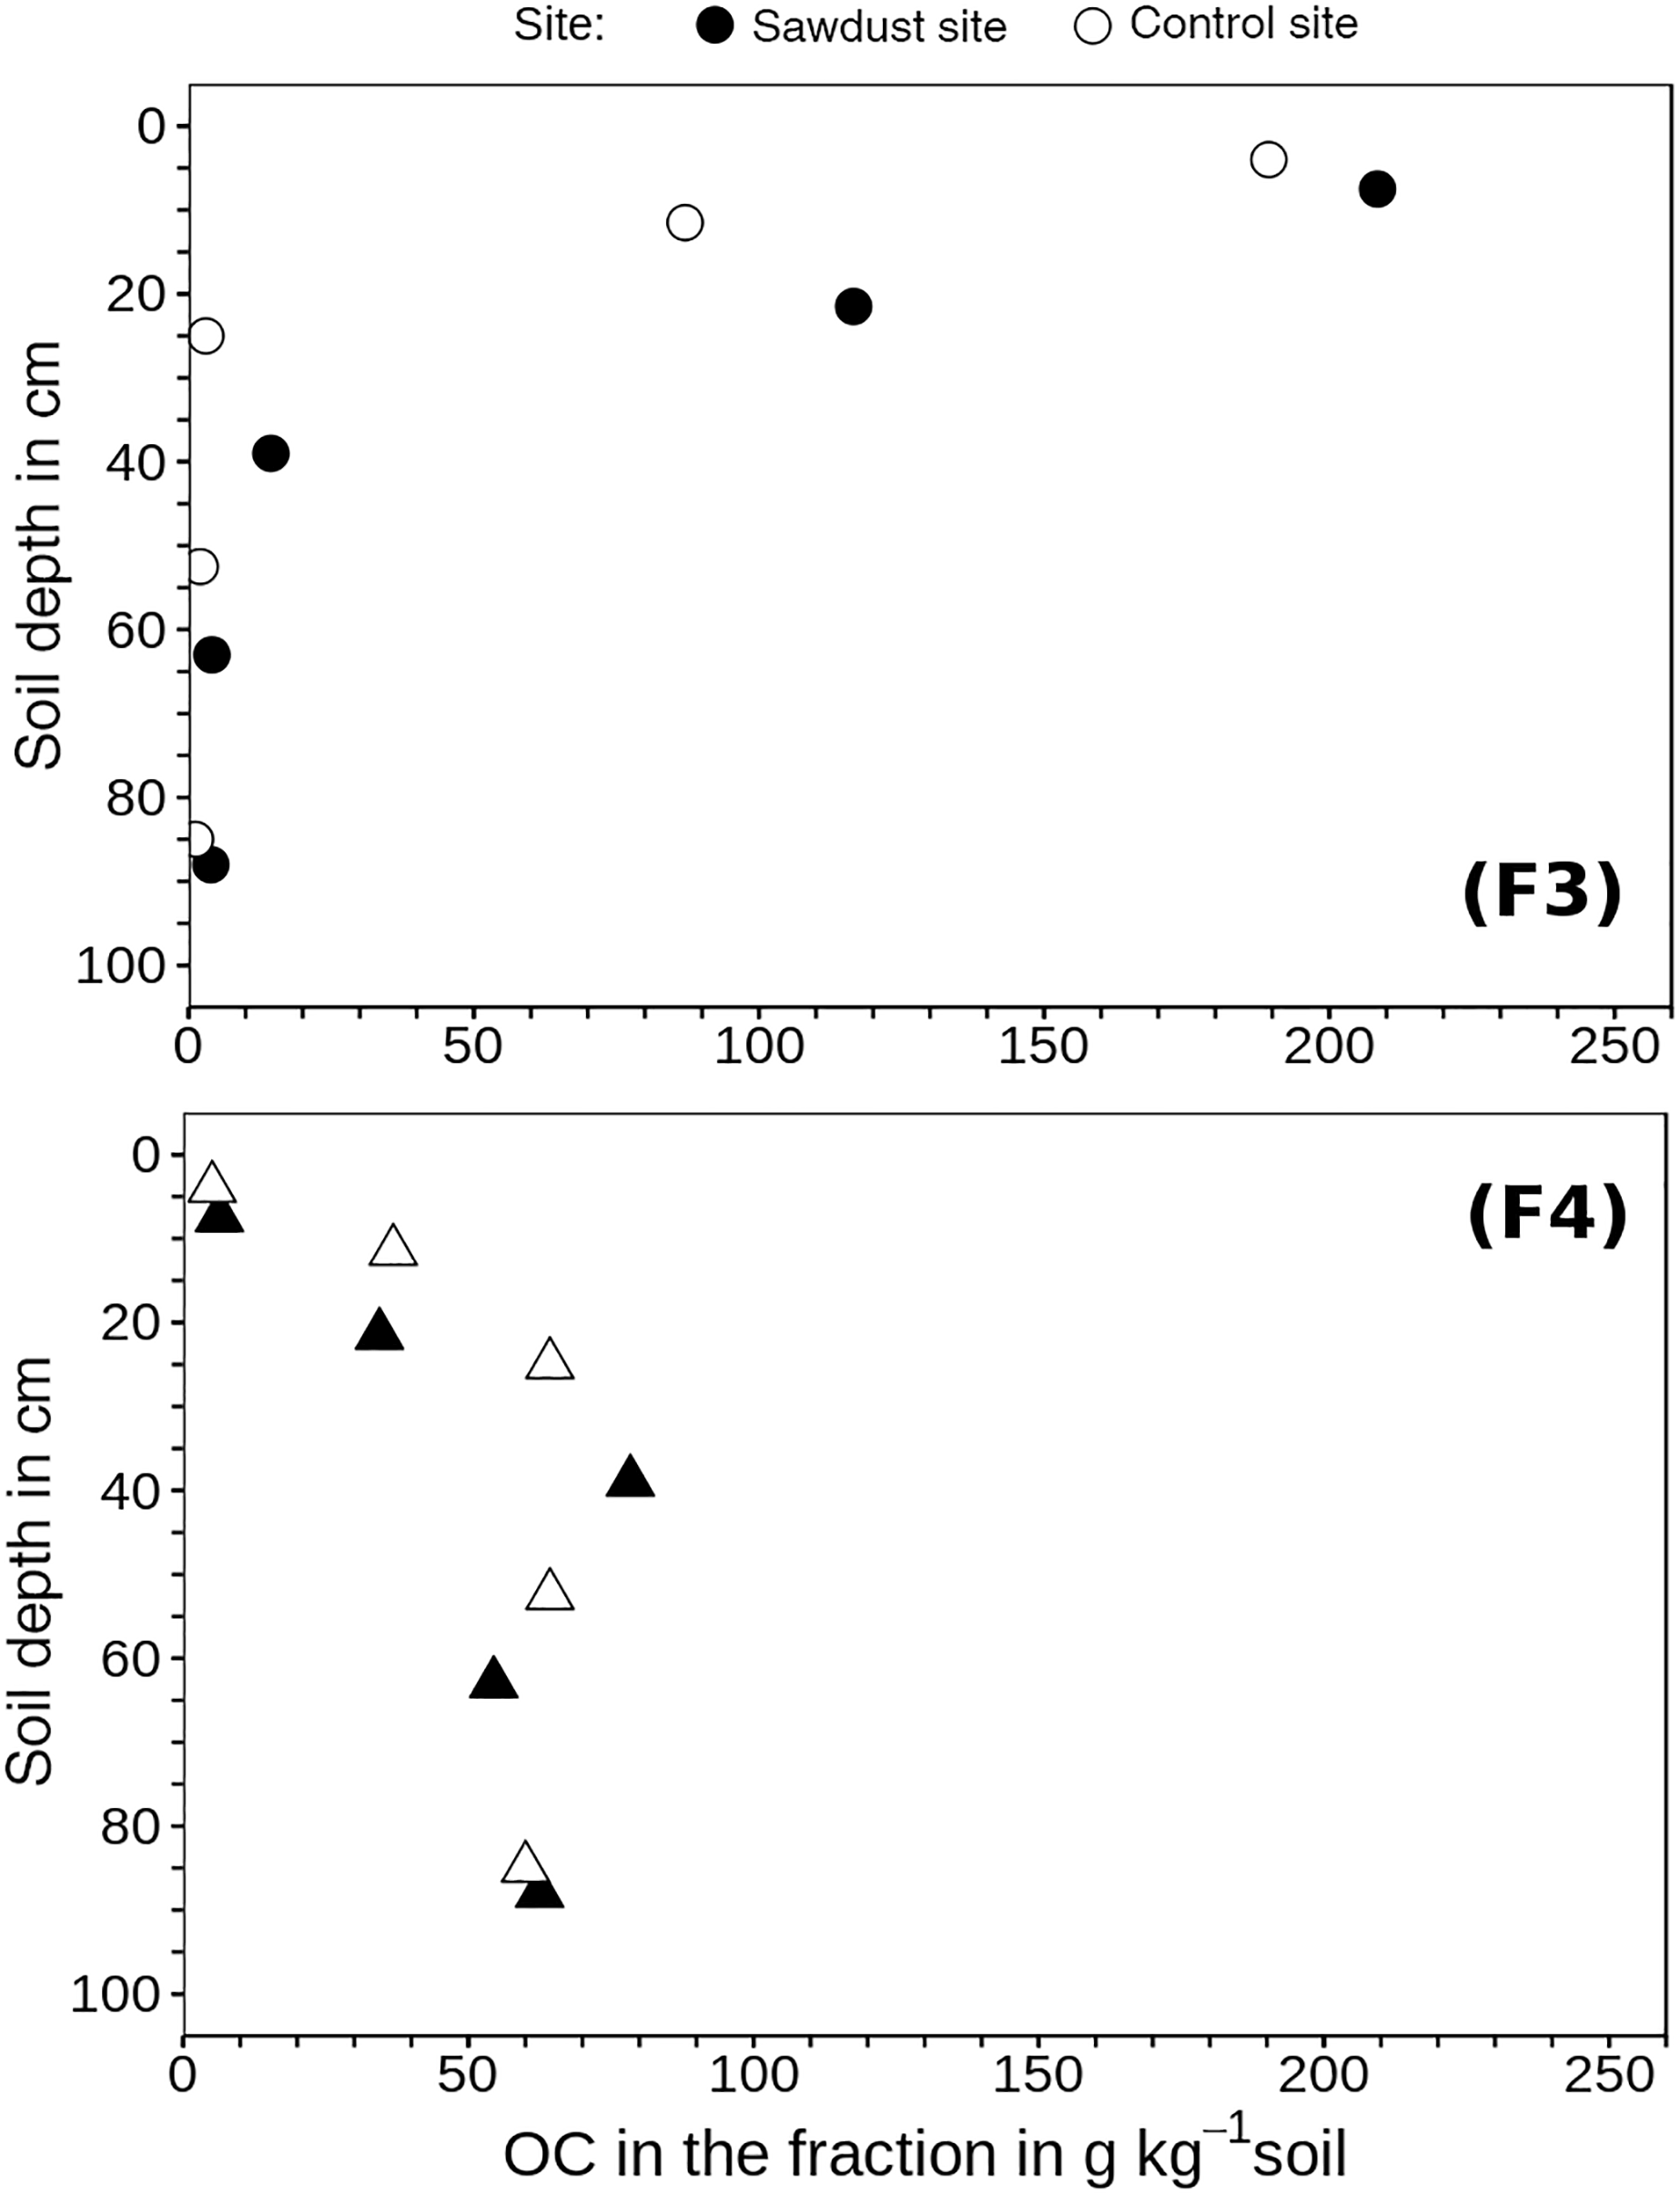
Figure 5Organic carbon (OC) concentrations of fraction three (F3) and four (F4) related to the bulk soil mass. These fractions comprise organic matter strongly bound to mineral phases in soil particles of densities between 1.6 and 2.0 g cm−3 (F3) or > 2.0 g cm−3 (F4).
The analysis of OC concentrations of F3 and F4 normalized to the bulk soil mass (Fig. 5) may give explanations for differences in OC concentrations between sites. The F3 of the second horizon at the sawdust site contains 29 g kg−1soil, more OC than F3 at the control site. This represents 91 wt % of the differences in bulk OC concentration in the second horizon. In the third horizon, F3 and F4 at the sawdust site respectively contain 11 and 14 g kg−1 more OC than the respective fractions at the control site; combined they represent 93 wt % of the differences in bulk OC concentrations of the third horizon. In the fourth and fifth horizons, the differences in OC concentrations of the fractions between the two sites are < 3 g OC kg−1soil, and thus not significant.
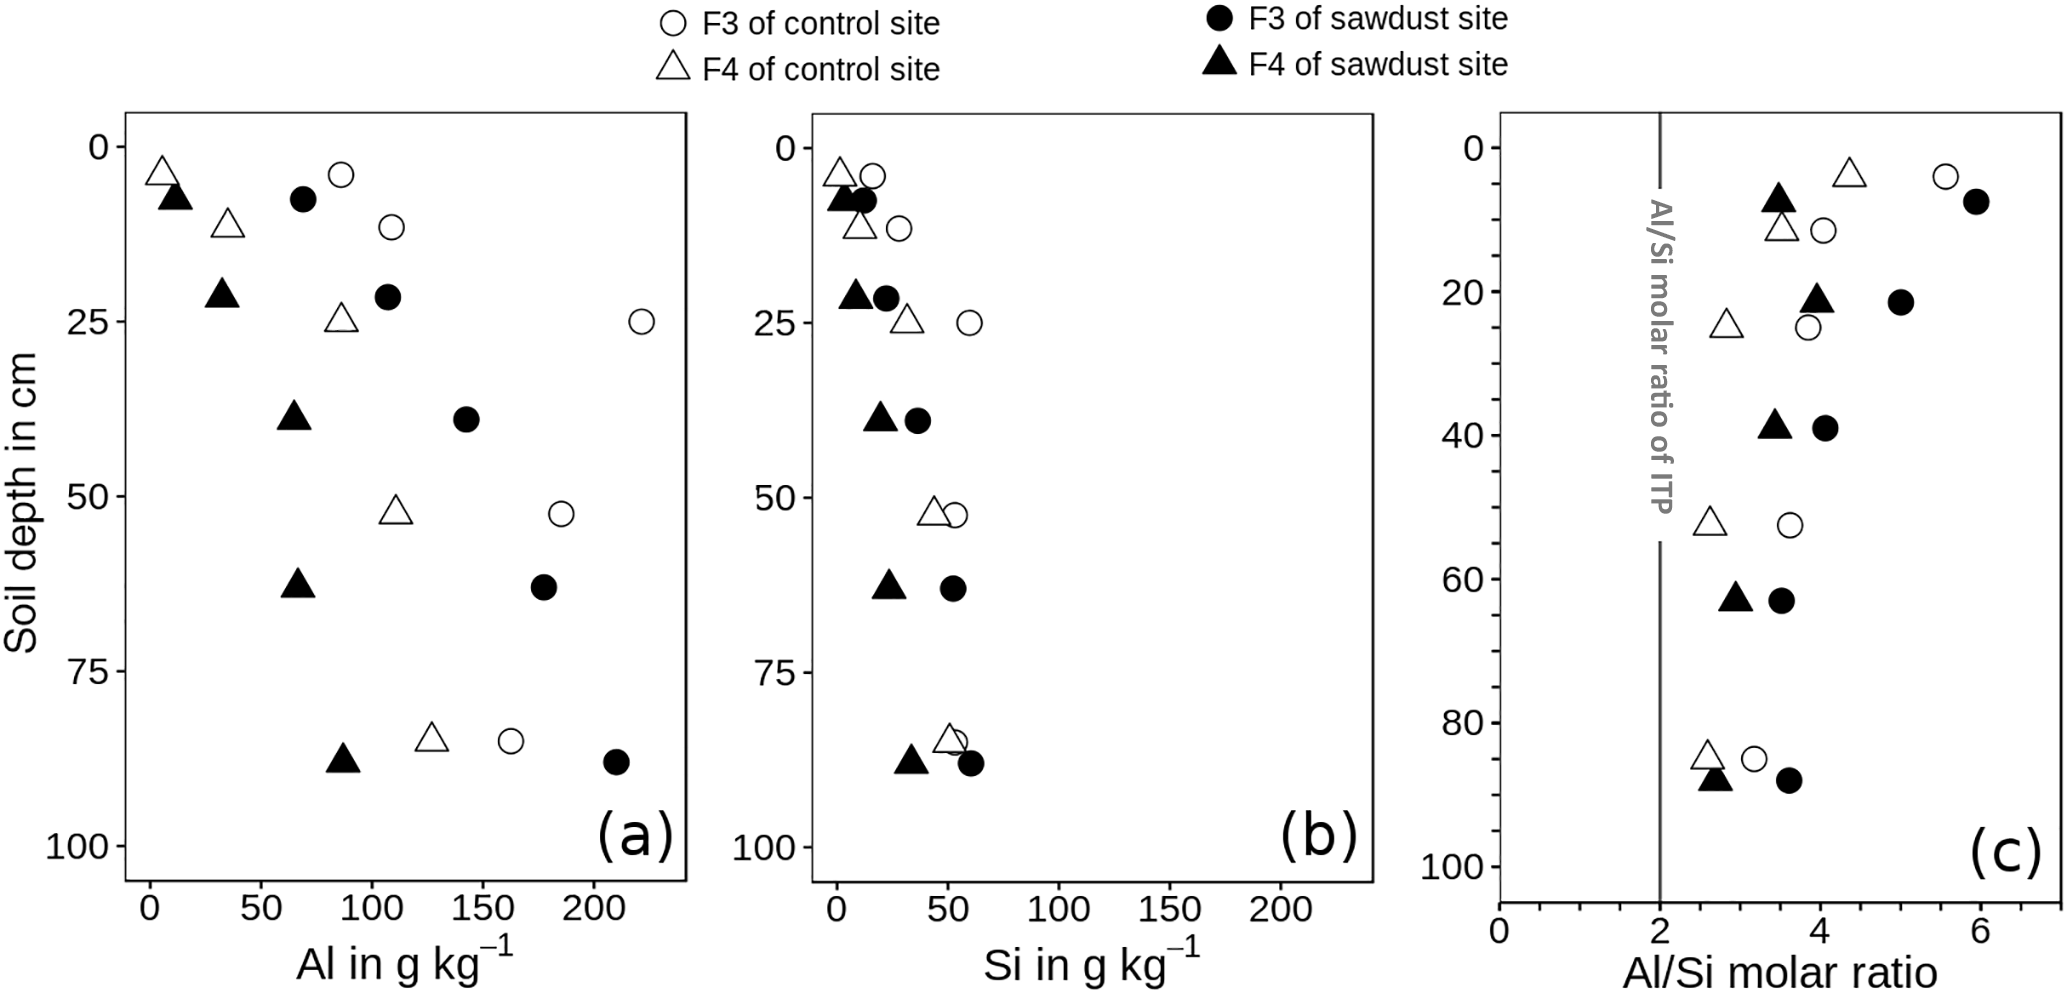
Figure 6Concentration of acid–oxalate-extractable aluminium (Al, a) and silica (Si, b) and Al ∕ Si molar ratios (Al ∕ Si, c) of fractions of densities between 1.6 and 2.0 g cm−3 (F3) and > 2.0 g cm−3 (F4). The metal concentrations are normalized to the mineral portion of the fraction, assuming that the mass of OM is 2 times the mass of OC (Sollins et al., 2006). ITP represents imogolite-type phases.
3.2.2 Acid–oxalate extraction of F3 and F4
The recoveries of Al are on average 101 wt % and systematically lower for Si, ranging between 87 and 96 wt %. The concentrations of oxalate-extractable Al are normalized to the mineral soil components (see Sect. 2.5). The concentrations of Al in F3 range between 63 and 227 g kg−1 and are 2.1-6.7 times larger than those of F4, which range between 5 and 128 g kg−1 (Fig. 6). For both sites, the Al concentrations increase with increasing soil depth.
The Si concentrations show in general the same depth trend as the respective Al concentrations for all fractions and sites. They range between 11–61 g kg−1 for F3 and 1–51 g kg−1 for F4.
The Al ∕ Si molar ratios are always larger than 2 and are distributed in a concave function with depth, similar to bulk soil ratios (Table 2). Only the Al ∕ Si molar ratio in F4 of the uppermost horizon at the sawdust site is very low. At all sites, the Al ∕ Si molar ratios in F3 are larger than the Al ∕ Si molar ratios in F4 throughout the profiles.
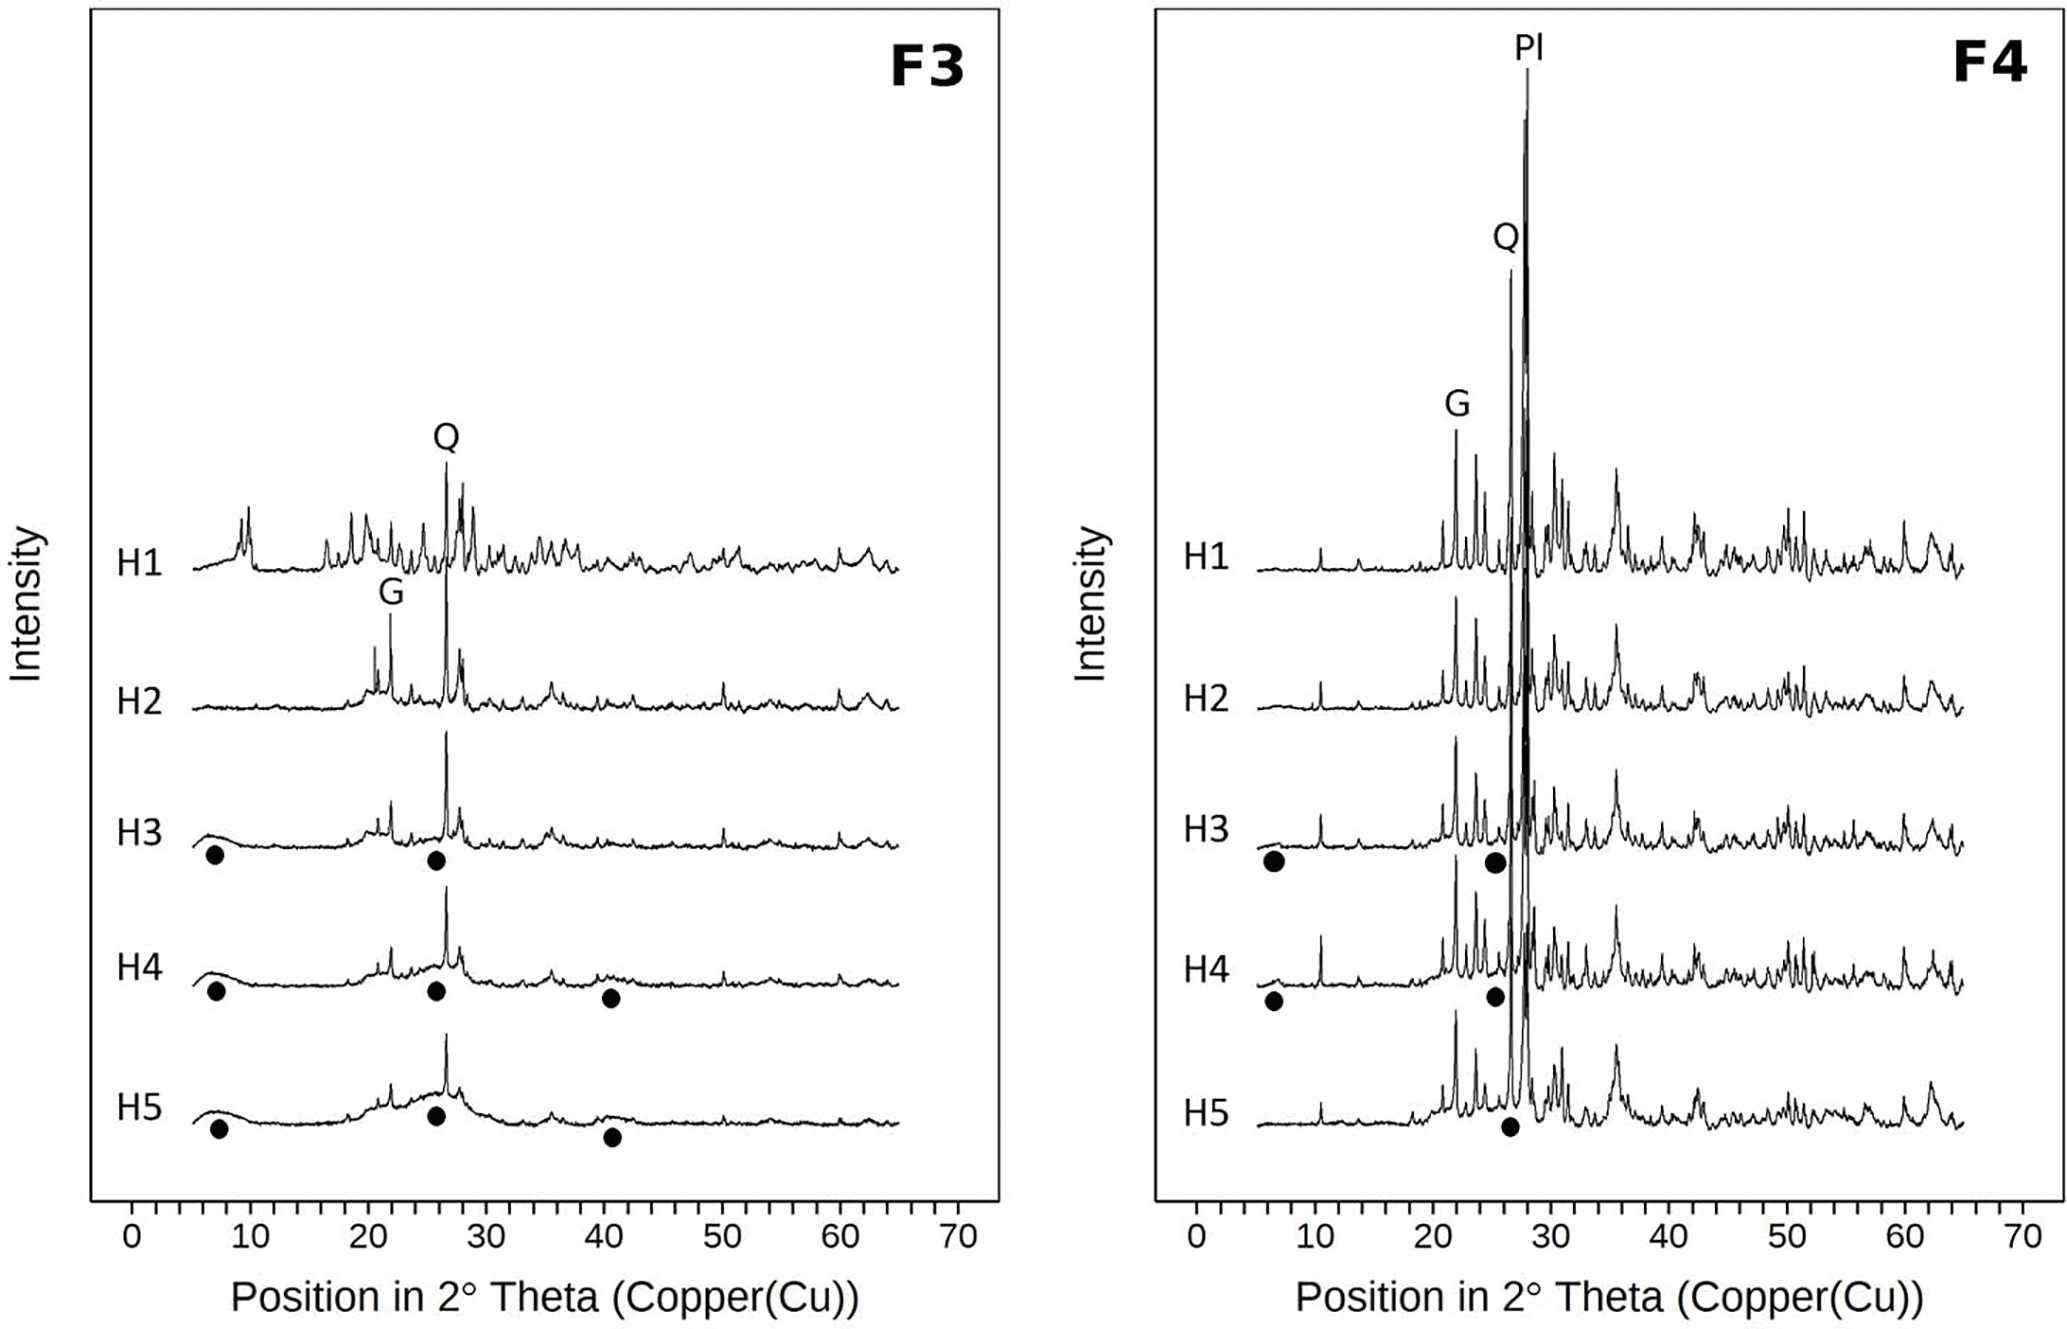
Figure 7X-ray diffractograms (Cu-Kα radiation) of the heavy fractions for all horizons of samples from the sawdust site. Fractions 3 and 4 comprise particles of densities between 1.6 and 2.0 g cm−3 (F3) and > 2.0 g cm−3 (F4). All diffractograms are normalized to the same vertical scale. Circles indicate poorly crystalline material. Q marks the main quartz reflection, Pl marks the main plagioclase reflection, and G marks the main gibbsite reflection.
3.2.3 X-ray diffractograms of F3 and F4
Differential X-ray spectra of F3 and F4 show similar main reflections as the spectra of the bulk samples. The overall signal intensities in F4 are higher than for F3 spectra (Fig. 7). Moreover the F4 spectra show hardly any broad reflections, while the F3 spectra have broad reflections at 6–8, 20–30, and 40∘ 2θ. These features reflect low-crystallinity material and are thus imogolite-type phases (Yoshinaga and Aomine, 1962; Basile-Doelsch et al., 2007). In contrast, the F4 spectra indicate larger amounts of crystalline minerals. Spectra of both fractions show increases in broad reflections at 6–8 and 20–30∘ 2θ with increasing soil depth.
4.1 Sequential density fractionation and oxalate extraction performance
The OC concentrations in F2 (Fig. 3a) are within the range of 400–500 g kg−1, which suggests pure organic matter. Thus, the applied sonication energy of 300 J mL−1 did not cause redistribution of mineral phases over light fractions (Cerli et al., 2012). However, there is also no evidence for complete dispersion of aggregates, which Chenu and Plante (2006) state as impossible. The OC concentrations of F2 are larger than those of F1. This may be caused by sonication, which basically strips off all adhering mineral materials (Cerli et al., 2012). This “cleaning effect” leads to purer OM fractions in F2 than in F1. As a consequence, the OC concentrations in F1 range between 300 and 400 g kg−1.
The calculated (Eq. 2) particle densities of F3 are between 1.7 and 2.0 g cm−3, which is in line with the nominal density range of F3. This also indicates that the overall soil particle density of the studied Andosol is largely due to OM loadings and not caused by variations in mineral density. This contrasts the results of Basile-Doelsch et al. (2007).
The recoveries of acid–oxalate-extractable Al and Si were large. The lower recovery of Si could be due to Si being present as silicic acid or Si sorbed to ferrihydrite and other poorly crystalline phases (Childs, 1992), and may become released during the sequential density fractionation.
4.2 Mineral composition of F3 and F4
Peak intensities of XRD spectra in F4 are up to 2.5 times larger than in F3. This indicates enrichment in crystalline minerals in F4 as compared to F3 and vice versa enrichment in short-range-ordered phases in F3. This enrichment in short-range-ordered phases is supported by the 2–7 times larger amount of oxalate-extractable Al in F3 than in F4. The broad signals in the XRD spectra of F3 and F4 in deeper horizons suggest the presence of imogolite-type phases. These broad signals are less prominent in F4, because they are overlain by signals of crystalline minerals. Despite the largely similar XRD patterns the Al ∕ Si molar ratios of F3 are larger than those of F4 in all horizons. Also, the C ∕ Al molar ratios of F3 are larger than those of F4 throughout the profile, meaning that the organic–mineral associations in F3 have more OC. We conclude that F3 is more enriched in Al–OM complexes than F4. Additionally, F4 of the topsoil has Al ∕ Si molar ratios of 4, which means Al–OM complexes have to be present in addition to imogolite-type phases. Thus, complete separation of Al–OM complexes and OM-loaded imogolite-type phases was not achieved by our density fractionation method. We think that Al–OM complexes and imogolite-type phases either form into continuous phases or that the density ranges of the two phases may overlap. Moreover, we think that quartz and other minerals could also be present in those fractions because the XRD spectra of the topsoil F3 show reflections for primary minerals. This is also supported by the extremely low Al and Si concentrations in F3 of the topsoil samples.
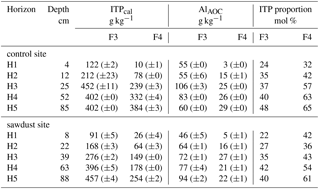
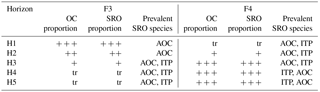
Table 3Concentrations of imogolite-type phases (ITPcal), Al in Al–OM complexes (AlAOC), and molar proportions of imogolite-type phases on short-range-ordered phases (ITP proportion) in F3 and F4, as calculated with Eqs. (3) to (5). Data are presented as means, and ranges in parenthesis.
The Al ∕ Si molar ratios decrease with depth, which indicates changes in the assemblage of short-range-ordered phases. This allows for identifying those phases predominating the two fractions > 1.6 g cm−3 in the different horizons. Many authors such as Yagasaki et al. (2006) use (Al–Alpy)/Si molar ratios, with Si and Al being oxalate-extractable Al and Si, respectively, and Alpy being pyrophosphate-extractable Al. Pyrophosphate is supposed to extract Al from Al–OM complexes (Parfitt and Childs, 1988). We did not follow this approach, because the reliability of pyrophosphate-extraction has been questioned (Kaiser and Zech, 1996; Thompson et al., 2011). Kaiser and Zech (1996) attribute this to high pH of the extractant, which can result in dissolution of Al-containing mineral phases.
Table 4Mass contribution of OC and short-range-ordered phases (SRO) to fractions three (F3) and four (F4). The grouping ranges from “” (very abundant, > 75 wt %), “” (abundant, 75–30 wt %), “+” (low, 30–3 wt %), to “tr” (traces, < 3 wt %). The prevalent short-range-ordered species are defined according to the molar proportion of imogolite-type phases on the short-range-ordered phases (ITP proportion of Table 3). For mean molar proportions of < 33 wt % Al–OM complexes (AOC) prevail. For molar proportions between 33 and 67 wt %, AOC and imogolite-type phases (ITP) are largely balanced, with the species listed first being slightly more abundant. For molar proportions > 67 wt % ITP prevail.
According to Amonette et al. (1994), oxalate-extractable Si originates almost exclusively from imogolite-type phases. The results of the oxalate-extraction indicate the studied Andosol to be poor in Si, and therefore only imogolite-type phases with the minimum silicon content should be present. Instead of relying on the pyrophosphate-extraction, we developed a formula to determine the prevailing short-range-ordered species in the density fractions. We estimated imogolite-type phases, Al in Al–OM complexes, and their molar contribution to short-range-ordered phases using Eqs. (3) to (5) (Table 3). These equations are based on the formula proposed by Parfitt et al. (1985), Mizota and Reeuwijk (1989), and the assumptions listed below. The proportion of imogolite-type phases on short-range-ordered phases are given in mol %, because the exact composition of Al–OM complexes are unknown.
-
oxalate-extractable Al (Al) is only incorporated in Al–OM complexes (AlAOC) and imogolite-type phases (AlITP)
-
Al–OM complexes comprise compounds which contain mainly Al–O–C bonds and scarcely any Al–O–Al bonds, because OM concentrations are high. Therefore we assume that Al–OM complexes contain on average 1.1 mol Al per 1 mol Al–OM complexes.
-
oxalate-extractable Si is only incorporated into imogolite-type phases (= SiITP)
-
AlITP ∕ SiITP molar ratio is 2
-
ITPcal calculated concentration of imogolite-type phases
We used the imogolite-type phases (ITP) proportion data from Table 3 to evaluate the prevailing short-range-ordered species in each horizon. The results are compiled in Table 4 along with the abundance of short-range-ordered phases with F3 and F4 on total mineral masses. The results show that in the topsoil short-range-ordered phases are mostly present in F3 and in the subsoils they are mostly present in F4. The prevailing short-range-ordered species in topsoils are Al–OM complexes, since dominating F3. In the subsoil, the presence of imogolite-type phases and Al–OM complexes is more balanced in F4, with increasing portions of imogolite-type phases with depth.
The characteristic broad signals indicating imogolite-type phases in the X-ray diffractograms appear in the subsoil, but not in the topsoil (Fig. 7). Imogolite-type phases dissolve at pH values below 4.8 (Huang et al., 2011b). The pH values in the subsoil are equal or above 4.8, whereas pH values in the topsoil are below 4.8 (Table 1). Thus, the X-ray diffractograms and pH values are well in line with the estimated distribution of short-range-ordered species, suggesting the presence of imogolite-type phases in the subsoil and their absence in the topsoil. We conclude that the studied Andosol shows aluandic properties in the topsoil and silandic properties in the subsoil.
4.3 Organic carbon stock and storage forms
The OC stocks within the first 100 cm of the studied soil are above the mean OC stocks for Andosols (254 Mg ha−1, Huang et al., 2011a) and similar to the 375 ± 83 Mg ha−1 found in an aluandic Andosol under tropical rainforest on Hawaii (Marin-Spiotta et al., 2011). The observed low bulk densities, resulting from large OC accumulation, are a common feature of aluandic Andosols (Marin-Spiotta et al., 2011; Basile-Doelsch et al., 2005).
The studied Andosol has medium to high PyC concentrations compared to Amazonian Oxisols (1–3 g PyC kg−1 soil, 140 g PyC kg−1 OC; Glaser et al., 2000) and Terra Preta soils (4–20 g PyC kg−1 soil, 350 g PyC kg−1 OC; Glaser et al., 2000). The PyC, however, contributes only up to 5 wt % to the total OC concentration, thus plays only a marginal role for the accumulation of total OM.
Only up to 20 wt % of OM in the topsoil and 2 wt % in the subsoil is not bound to mineral phases. The low proportions of OC in the light fractions are in line with data published by Paul et al. (2008) for topsoils of Andosols under tropical rainforest (20 wt % of material with densities < 1.6 g cm−3). Thus, the mineral phase plays the dominant role in stabilizing OM in this Andosol, which is in agreement with numerous previous studies (e.g. Basile-Doelsch et al., 2007; Huang et al., 2011a).
We used the data from Fig. 4 to estimate the abundances of OC with F3 and F4 on total OC and correlate it with the abundance and prevalent species of the short-range-ordered phases (Table 4). The OC abundances clearly correlates with the respective abundance of mineral phases in the two fractions. In the topsoil, OC is mainly associated with Al–OM complexes, whereas the OC in the subsoil is mainly bonded to imogolite-type phases. As explained in Sect. 4.2 we suggest that Al–OM complexes are in close contact to imogolite-type phases i.e. they precipitate on their surfaces.
4.4 Organic carbon response to sawdust input
No sawdust was optically visible neither in the soil profile nor in the light density fractions prior to grounding. Seemingly, the period since the last sawdust application was long enough to allow for complete decay. Chambers et al. (2000) report that wood density and bole diameter were significantly and inversely correlated with the decomposition rate for dead trees in tropical forests of the central Amazon. For the smallest bole diameter (10 cm) the authors calculated 0.26 yr−1 as the lowest rate. A dead tree with such a diameter would then be decomposed to 99 % after 17 years. Additionally Powers et al. (2009) showed that in tropical soils, the decomposition rate increases linearly with precipitation. With sawdust being much finer in texture than a dead tree trunk and the precipitation at the CERFA site being twice as high as at the site of Chambers et al. (2000), we expect a much faster decomposition. Moreover, the phosphorus concentrations, determined in an aqua regia solution for samples taken from the first 20 cm (data not shown), are significantly larger at the sawdust site than at the control site. The additional phosphorus at the sawdust site matches the phosphorus input via sawdust. Additionally, the C ∕ N ratios of all fractions in the upper two horizons are below 20, showing no difference between the two sites. From all this, we conclude that the added sawdust, which has a C ∕ N mass ratio of around 110, was completely decomposed on site.
In the first horizon, the differences between both sites in bulk OC concentrations are, with around 2 g kg−1 OC, extremely small. Additionally, the observed variances in these forest topsoils are large. This makes it impossible to find a significant increase in the bulk OC concentration, even with larger sample numbers. We conclude that the OC concentration of the first horizon did not change upon sawdust input. In the second horizon the difference between OC concentrations are larger than in the first horizon, but are not significant due to a large variance. For the second horizon, a larger sample number may have revealed a significant OC increase at the sawdust site. The results of the sequential density fractionation show no indications for additional inclusion of OM into macro-aggregates. This holds true despite the fact that the sample of the second horizon used for the sequential density fractionation at the sawdust site has a higher OC concentration than the sample at the control site. Those results need to be interpreted with some caution in terms of site comparison, because we conducted the fractionation only with one profile per site. The sequential density fractionation also revealed that over 80–89 wt % of OC is strongly associated with minerals. We therefore conclude that the mineral phase of the topsoil, especially the first horizon, is completely saturated with OC and so despite the massive carbon input not even the faintest additional storage occurred.
Kaiser and Kalbitz (2012) state that in soils where percolating water controls transport processes, a steady input of surface-reactive compounds from overlying soil layers forces less strongly binding compounds to move further down. With OM storage capacities in the top layers being exhausted, increasing amounts of OM become displaced and start migrating downwards. When reaching soil horizons with free storage capacity, these OM compounds are retained and the respective horizon's OC concentration increases. This process would explain the significantly larger OC concentration in the third horizon at the sawdust site. As long as the third horizon has free storage capacities, the OC concentration in horizon four and five will not increase, which is in line with our results.
Over 90 wt % of the additional OM in the third horizon are recovered in F3 and F4 together. Thus, the increase in bulk OC concentration in the third horizon is due to OM strongly interacting with the mineral phase and likely becoming long-term stabilized.
The increase in OC concentration in the third horizon, however, is probably not only due to undersaturated mineral phases. The increased OC concentration in the bulk sample of the third horizon of the sawdust site used in the fractionation experiment correlates with a larger proportion of F3 and slightly lower pH values than those of the third horizon at the control site. The lower pH in the third horizon at the sawdust site was unlikely due to mineralization of the 18 Mg ha−1 nitrogen added with the sawdust, since it is not affecting the overlying horizons. More likely, the acidification was caused by the downward movement of organic acids formed during the decomposition of sawdust. These acids may promote the weathering of imogolite-type phases and subsequent formation of Al–OM complexes.
The OC stock increased significantly at the sawdust site for the 25–50 cm segment, which belongs to the subsoil and comprises mostly the third horizon. This difference was basically due to the increase in OC concentration. Despite this increased OC stock in parts of the subsoil, we found no evidence for increased total soil OC stocks. We think that this is not due to the small number of bulk density measurements because the standard error was very low with ⩽ 0.05 g cm−3 (see Table 1). Moreover, Schrumpf et al. (2011) found that the contribution of bulk density to the OC stock variability was lower than the contribution of OC concentration and horizon thickness and decreased with soil depth. We rather think that the large variability in OC concentrations in the topsoil overlay the effect of the larger OC concentration in the subsoil at the sawdust site. Therefore, for topsoils we recommend an increased number of samples in order to detect significant differences.
To evaluate the OC accumulation in response to the sawdust application, we referred to the increase in OC stock within the 25–50 cm segment (Table A2). The resulting additional OC stock is 15 Mg ha−1, which represents only 0.8 wt % of the originally added 1800 Mg OC ha−1. Thus, the OC accumulation rate is extremely low. That is in line with Six et al. (2002) who postulate in their saturation concept that soils which are close to their maximum OC storage capacity have low accumulation rates.
The massive OC input did not increase the OC concentrations in the topsoil but in the subsoil, which also resulted in significantly larger OC stocks for the subsoil. The OC-rich Andosol topsoils are not capable of storing additional carbon, likely because of limited binding capacities of their mineral phases. Seemingly, some of the additional OC migrates downwards with the percolating water until reaching horizons where free binding sites are available. Hence, the studied soils are saturated with OC when only considering the topsoils but still have some capacity to host more OC in their deeper horizons. Leaving the time and input aspect aside and imagining that the Andosols upper horizon will one day stretch down to 100 cm, the OC stock would have increased by 260 Mg ha−1 compared to the control site.
The OC increase in the subsoil was exclusively due to binding to mineral phases. Since binding to mineral phases promotes retarded mineralization, i.e. longer turnover times, stabilization, and thus long-term storage of the additional OC can be expected.
The additional OC was likely stored within Al–OM complexes and by binding to imogolite-type phases. There are indications that the input of additional OC into the subsoils induced dissolution of the imogolite-type mineral phases and subsequent formation of Al–OM complexes. This transition from a predominately silandic to a more aluandic mineral assemblage would increase the subsoils storage capacity for OC. We suggest that silandic Andosols can gradually become aluandic.
Despite the increase in subsoil OC, there was no significant change in total OC stock in response to the massive OC inputs over a period of 20 years. This was basically because of spatial variations that demand larger sample numbers or larger changes than the observed ones to become significantly different.
The results clearly show that the accumulation efficiency of the added OC was very low. Increasing the OC stock in soils already rich in OC requires comparably large inputs over long time periods to induce OC transport into the deeper soil horizons. This contrasts the situation in young soils where OC stocks build up rapidly in near-surface horizons.
The underlying research data of all Figures can be found in the Supplement comprised to a .zip file. Also included in the .zip file is a READme.txt describing the content of each .csv file. The Supplement is also under the CC-BY license.
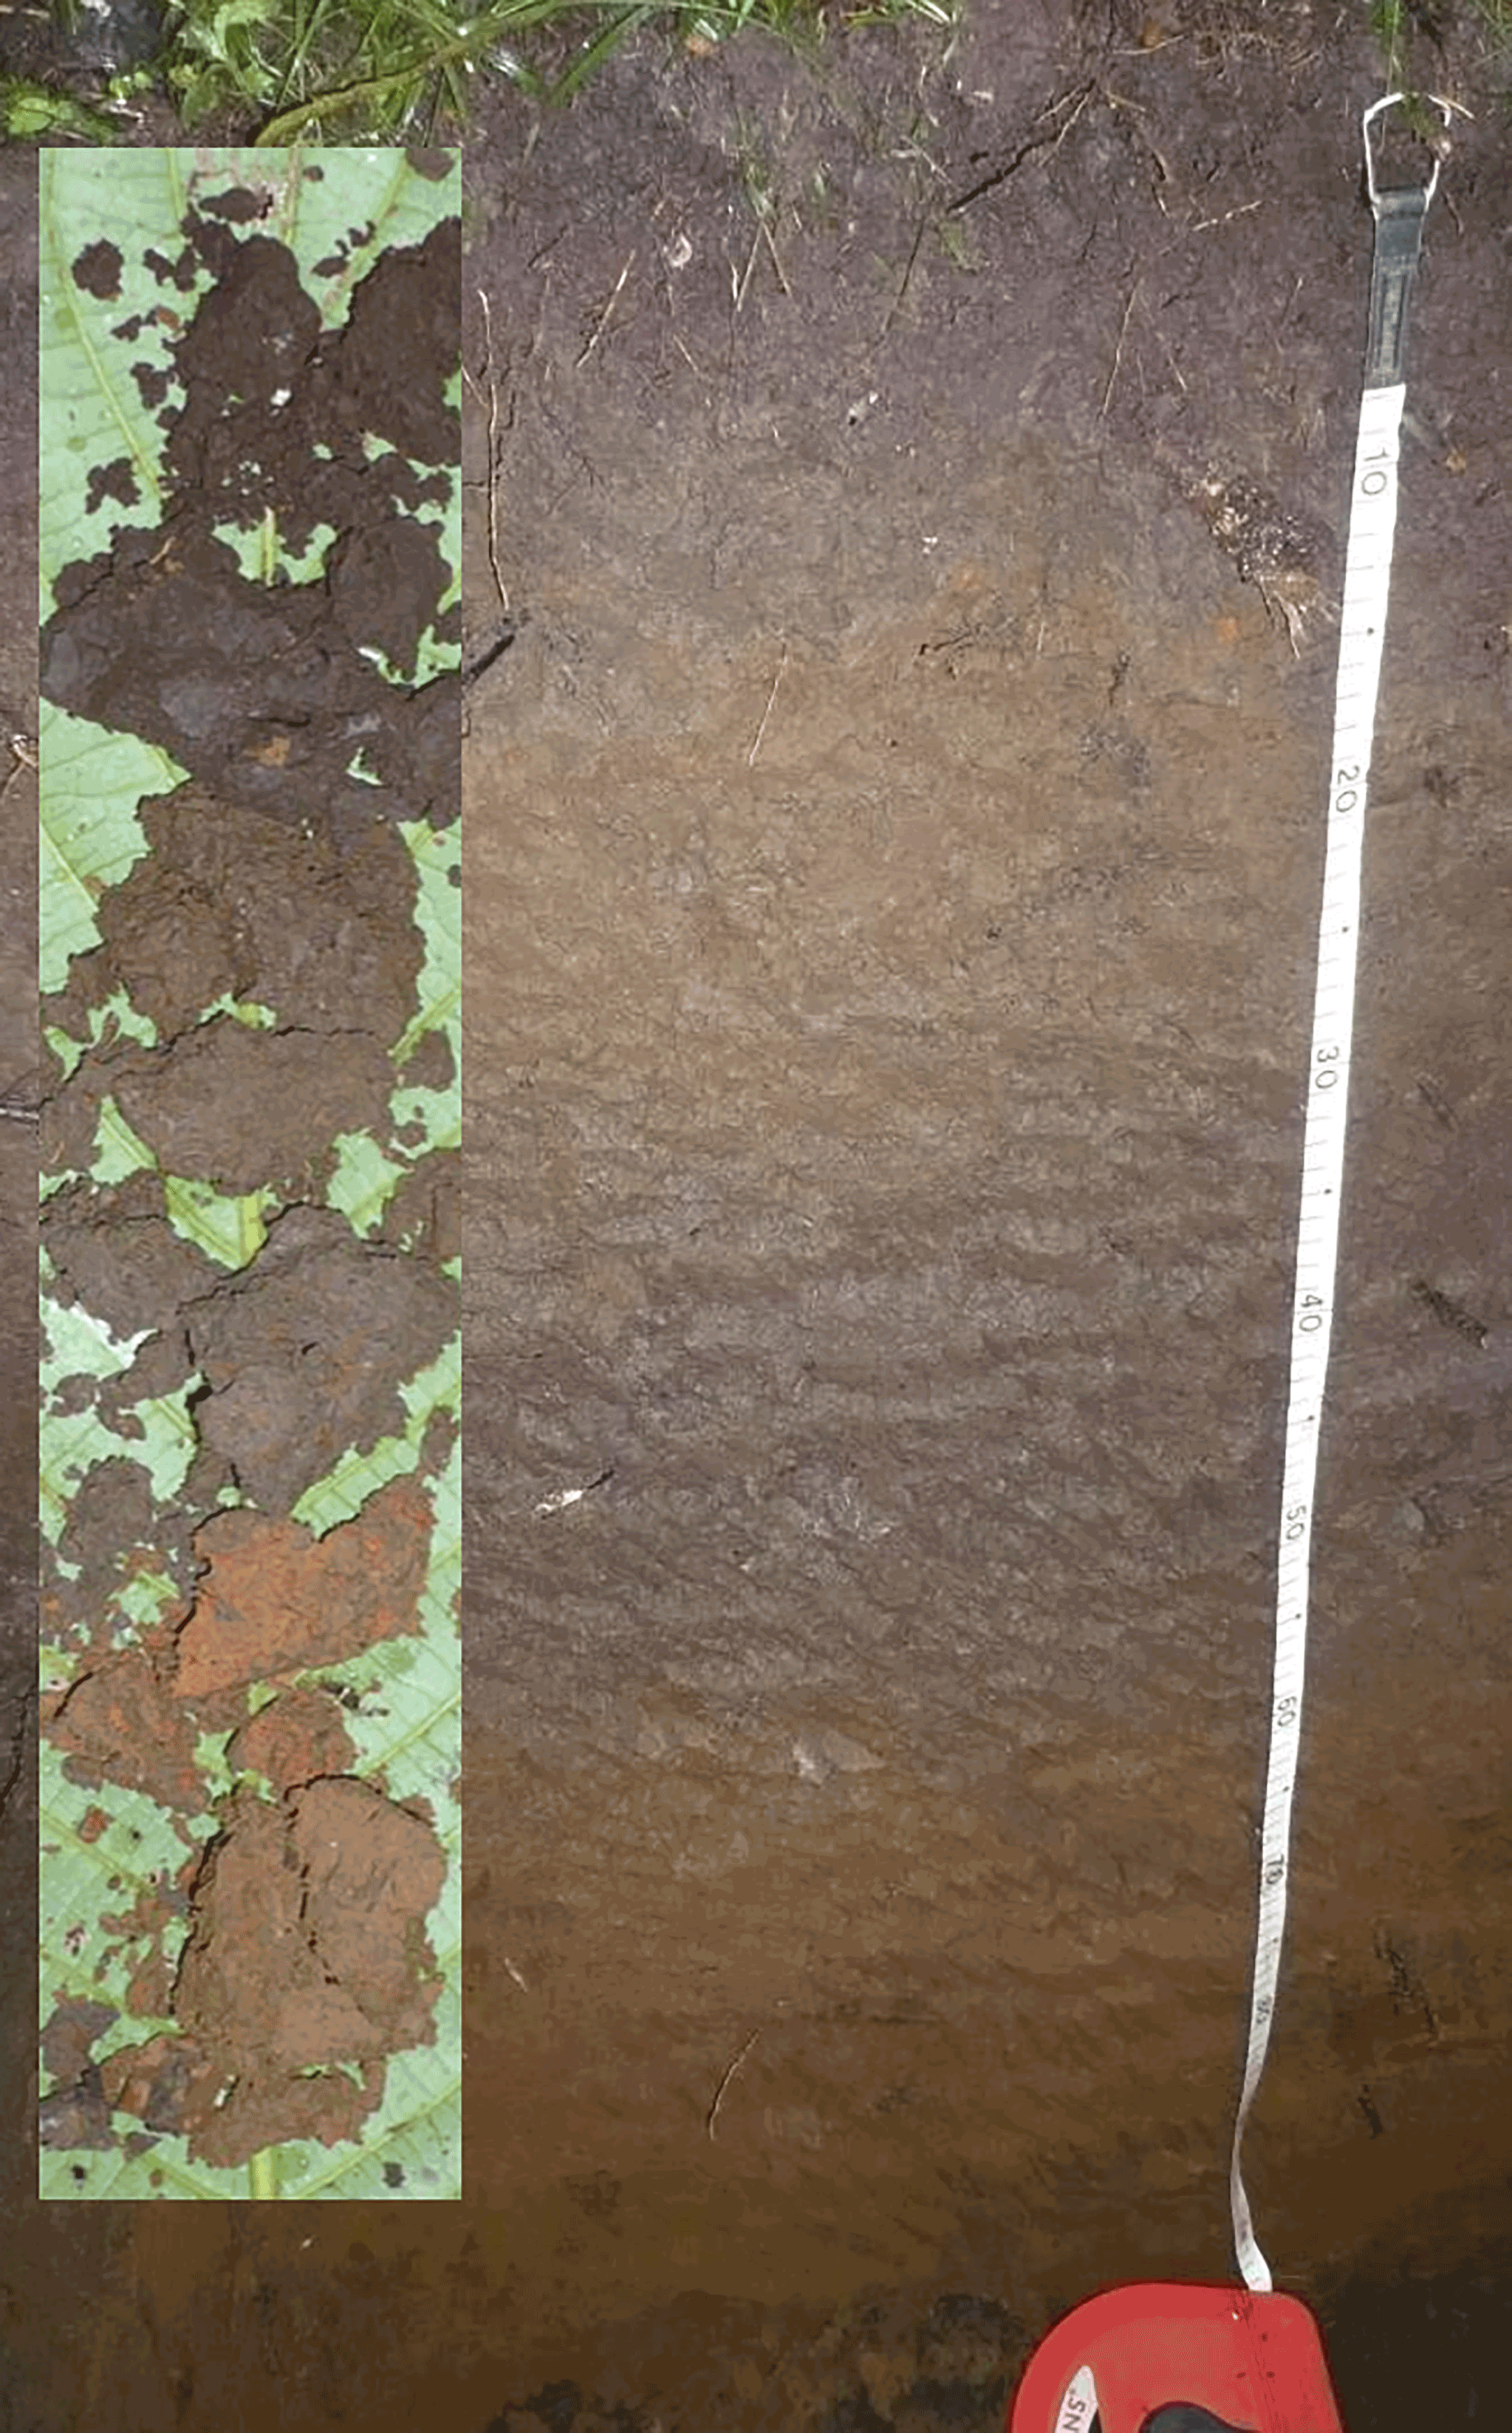
Table A1Gravimetric-determined rooting intensity, measured with five 2.7 dm3 corers at each site.
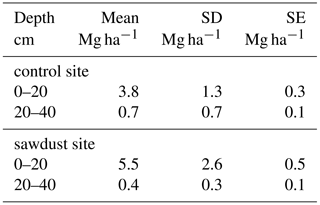
Table A2The means of the OC stocks ((sawdust), (control)), their differences (), and their pooled standard deviation (SD) are presented. The confidence interval (CI) is calculated from a t test (one sided, significance level α=0.05, power , sample size 5, unpaired) to answer the alternative hypothesis that x(sawdust)−x(control) is larger than zero. The difference is significantly larger if the CI is > 0. We also calculated the minimum sample size (nmin) and power (powerth) for a theoretical difference (Δth) between the sites to evaluate the power of our data. The Δth is either taken from or assumed to be 10 % of .
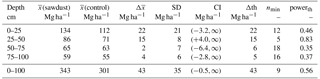
Table A3The means of the OC concentrations (, ), their differences (), and their pooled standard deviation (SD) are presented. The confidence interval (CI) is calculated from a t test (one sided, significance level α=0.05, power , sample size 5, unpaired) to answer the alternative hypothesis that x(sawdust)−x(control) is larger than zero. The difference is significantly larger if the CI is > 0. We also calculated the minimum sample size (nmin) and power (powerth) for a theoretical difference (Δth) between the sites to evaluate the power of our data. The Δth is either taken from or assumed to be 10 % of .
The supplement related to this article is available online at: https://doi.org/10.5194/bg-15-2743-2018-supplement.
The authors declare that they have no conflict of interest.
The authors acknowledge the financial support of the Technische Universität
Berlin for experimental costs, as well as the University's publication fund
for covering the article processing charges. The pyrogenic carbon analysis
was conducted by Arne Kappenberg at the department of soil science at the
Rheinische Friedrich-Wilhelms-Universität Bonn, for which we are grateful.
We also acknowledge Nelson Omar Tello Benalcázar and Josue Tenorio for
providing the study sites and assisting during the field work.
We are grateful for the work of Saskia Machel in the initial part of the
project.
Edited by: Yakov Kuzyakov
Reviewed by: four anonymous referees
Amonette, J. E., Zelazny, L. W., and Dahlgren, R. A.: Quantification of Allophane and Imogolite, in: Quantitative Methods in Soil Mineralogy, ACSESS publications, Soil Sci. Soc. Am., 430–451, 1994. a
Basile-Doelsch, I., Amundson, R., Stone, W., Masiello, C. A., Bottero, J. Y., Colin, F., Masin, F., Borschneck, D., and Meunier, J. D.: Mineralogical control of organic carbon dynamics in a volcanic ash soil on La Réunion, Eur. J. Soil Sci., 56, 689–703, https://doi.org/10.1111/j.1365-2389.2005.00703.x, 2005. a
Basile-Doelsch, I., Amundson, R., Stone, W., Borschneck, D., Bottero, J. Y., Moustier, S., Masin, F., and Colin, F.: Mineral control of carbon pools in a volcanic soil horizon, Geoderma, 137, 477–489, https://doi.org/10.1016/j.geoderma.2006.10.006, 2007. a, b, c, d
Boudot, J.-P.: Relative efficiency of complexed aluminum noncrystalline Al hydroxide, allophane and imogolite in retarding the biodegradation of citric acid, Geoderma, 52, 29–39, https://doi.org/10.1016/0016-7061(92)90073-G, 1992. a
Brodowski, S., Rodionov, A., Haumaier, L., Glaser, B., and Amelung, W.: Revised black carbon assessment using benzene polycarboxylic acids, Org. Geochem., 36, 1299–1310, https://doi.org/10.1016/j.orggeochem.2005.03.011, 2005. a, b
Campbell, C. A., Zentner, R. P., Bowren, K. E., Townley-Smith, L., and Schnitzer, M.: Effect of crop rotations and fertilization on soil organic matter and some biochemical properties of a thick Black Chernozem, Can. J. Soil Sci., 71, 377–387, https://doi.org/10.4141/cjss91-036, 1991. a
Campbell, E. E. and Paustian, K.: Current developments in soil organic matter modeling and the expansion of model applications: a review, Environ. Res. Lett., 10, 123004, https://doi.org/10.1088/1748-9326/10/12/123004, 2015. a
Cerli, C., Celi, L., Kalbitz, K., Guggenberger, G., and Kaiser, K.: Separation of light and heavy organic matter fractions in soil – Testing for proper density cut-off and dispersion level, Geoderma, 170, 403–416, https://doi.org/10.1016/j.geoderma.2011.10.009, 2012. a, b, c, d
Chambers, J. Q., Higuchi, N., Schimel, J. P., Ferreira, L. V., and Melack, J. M.: Decomposition and carbon cycling of dead trees in tropical forests of the central Amazon, Oecologia, 122, 380–388, https://doi.org/10.1007/s004420050044, 2000. a, b
Chenu, C. and Plante, A. F.: Clay-sized organo-mineral complexes in a cultivation chronosequence: revisiting the concept of the “primary organo-mineral complex”, Eur. J. Soil Sci., 57, 596–607, https://doi.org/10.1111/j.1365-2389.2006.00834.x, 2006. a, b, c
Childs, C. W.: Ferrihydrite: A review of structure, properties and occurrence in relation to soils, Z. Pflanz. Bodenkunde, 155, 441–448, https://doi.org/10.1002/jpln.19921550515, 1992. a
Clark, D. A., Brown, S., Kicklighter, D. W., Chambers, J. Q., Thomlinson, J. R., Ni, J., and Holland, E. A.: Net Primary Production in Tropical Forests: An Evaluation and Synthesis of Existing Field Data, Ecol. Appl., 11, 371–384, https://doi.org/10.1890/1051-0761(2001)011[0371:NPPITF]2.0.CO;2, 2001. a
Colombo, C., Ricciardella, M., Cerce, A. D., Maiuro, L., and Violante, A.: Effect of Tannate, pH, sample preparation, ageing and temperature on the formation and nature of Al oxyhydroxides, Clay. Clay Miner., 52, 721–733, https://doi.org/10.1346/CCMN.2004.0520607, 2004. a
Glaser, B., Balashov, E., Haumaier, L., Guggenberger, G., and Zech, W.: Black carbon in density fractions of anthropogenic soils of the Brazilian Amazon region, Org. Geochem., 31, 669–678, https://doi.org/10.1016/S0146-6380(00)00044-9, 2000. a, b, c
Huang, P. M., Li, M., and Sumner, M. (Eds.): Handbook of Soil Sciences: Resource Management and Environmental Impacts Volume II: chapter 7 Mineralogical,Physicochemical, and Microbiological Controls on Soil Organic Matter Stabilization and Turnover, CRC Press Inc, [s.l.], 2nd Edn., 2011a. a, b, c, d, e, f
Huang, P. M., Li, Y., and Sumner, M. E. (Eds.): Handbook of Soil Sciences: Properties and Processes, 2nd Edn., Chapter 20 Alteration, Formation, Occurence of Minerals in Soils, Taylor & Francis, https://books.google.de/books?id=9BJlVxJLNO8C (last access: 25 August 2017), 2011b. a
Huang, P. M., Li, Y., and Sumner, M. E. (Eds.): Handbook of Soil Sciences: Properties and Processes, 2nd Edn., Chapter 33.3 Andisols, Taylor & Francis, https://books.google.de/books?id=9BJlVxJLNO8C (last access: 25 August 2017), 2011c. a, b
Hörmann, P. K. and Pichler, H.: Geochemistry, petrology and origin of the Cenozoic volcanic rocks of the Northern Andes in Ecuador, J. Volcanol. Geoth. Res., 12, 259–282, https://doi.org/10.1016/0377-0273(82)90029-4, 1982. a
IUSS Working Group WRB: World Reference Base for Soil Resources 2014, update 2015, International soil classification system for naming soils and creating legends for soil maps, no. 106 in World Soil Resources Reports, Food and Agriculture Organization of the United Nations, 2015. a, b
Kaiser, K. and Guggenberger, G.: Distribution of hydrous aluminium and iron over density fractions depends on organic matter load and ultrasonic dispersion, Geoderma, 140, 140–146, https://doi.org/10.1016/j.geoderma.2007.03.018, 2007. a, b
Kaiser, K. and Kalbitz, K.: Cycling downwards – dissolved organic matter in soils, Soil Biol. Biochem., 52, 29–32, https://doi.org/10.1016/j.soilbio.2012.04.002, 2012. a
Kaiser, K. and Zech, W.: Deffects in estimation of alluminium in humus complexes of podzolic soils by pyrophosphate extraction, Soil Sci., 161, 452–458, https://doi.org/10.1097/00010694-199607000-00005, 1996. a, b
Kögel-Knabner, I., Guggenberger, G., Kleber, M., Kandeler, E., Kalbitz, K., Scheu, S., Eusterhues, K., and Leinweber, P.: Organo-mineral associations in temperate soils: Integrating biology, mineralogy, and organic matter chemistry, J. Plant Nutr. Soil Sc., 171, 61–82, https://doi.org/10.1002/jpln.200700048, 2008. a
Lal, R.: Soil Carbon Sequestration Impacts on Global Climate Change and Food Security, Science, 304, 1623–1627, https://doi.org/10.1126/science.1097396, 2004. a, b
Lehmann, J. and Kleber, M.: The contentious nature of soil organic matter, Nature, 528, 60–68, https://doi.org/10.1038/nature16069, 2015. a
Levard, C., Doelsch, E., Basile-Doelsch, I., Abidin, Z., Miche, H., Masion, A., Rose, J., Borschneck, D., and Bottero, J. Y.: Structure and distribution of allophanes, imogolite and proto-imogolite in volcanic soils, Geoderma, 183/184, 100–108, https://doi.org/10.1016/j.geoderma.2012.03.015, 2012. a
Marin-Spiotta, E., Chadwick, O. A., Kramer, M., and Carbone, M. S.: Carbon delivery to deep mineral horizons in Hawaiian rain forest soils, J. Geophys. Res.-Biogeo., 116, G03011, https://doi.org/10.1029/2010JG001587, 2011. a, b
Masion, A., Thomas, F., Bottero, J.-Y., Tchoubar, D., and Tekely, P.: Formation of amorphous precipitates from aluminum-organic ligands solutions: macroscopic and molecular study, J. Non-Cryst. Solids, 171, 191–200, https://doi.org/10.1016/0022-3093(94)90355-7, 1994. a
Mayer, L. M., Schick, L. L., Hardy, K. R., Wagai, R., and McCarthy, J.: Organic matter in small mesopores in sediments and soils, Geochim. Cosmochim. Ac., 68, 3863–3872, https://doi.org/10.1016/j.gca.2004.03.019, 2004. a
Mizota, C. and van Reeuwijk, L. P.: Clay mineralogy and chemistry of soils formed in volcanic material in diverse climatic regions, vol. 2, Soil monograph, International Soil Reference and Information Centre, Wageningen, the Netherlands, 1989. a
Mortimer, C., Huacho, J., and Almeida, C.: Mapa Geologico del Ecuador – El Puyo, https://www.geoinvestigacion.gob.ec/mapas/100K_r/HOJAS_GEOLOGICAS_100k/EL_PUYO_PSAD56_Z17S.compressed.pdf (last access: 8 March 2018), 1980. a
Parfitt, R. L. and Childs, C. W.: Estimation of forms of Fe and Al – a review, and analysis of contrasting soils by dissolution and Mossbauer methods, Soil Res., 26, 121–144, https://doi.org/10.1071/sr9880121, 1988. a
Parfitt, R. L., Wilson, A. D., and Hutt, L.: Estimation of allophane and halloysie in three sequences of volcanic soils new zealand, Volcanic Soils Catena, Suplement, 7, 1–8, 1985. a
Paul, S., Veldkamp, E., and Flessa, H.: Soil organic carbon in density fractions of tropical soils under forest – pasture – secondary forest land use changes, Eur. J. Soil Sci., 59, 359–371, https://doi.org/10.1111/j.1365-2389.2007.01010.x, 2008. a
Paustian, K., Andrén, O., Janzen, H. H., Lal, R., Smith, P., Tian, G., Tiessen, H., Van Noordwijk, M., and Woomer, P. L.: Agricultural soils as a sink to mitigate CO2 emissions, Soil Use Manage., 13, 230–244, https://doi.org/10.1111/j.1475-2743.1997.tb00594.x,1997. a
Powers, J. S., Montgomery, R. A., Adair, E. C., Brearley, F. Q., DeWalt, S. J., Castanho, C. T., Chave, J., Deinert, E., Ganzhorn, J. U., Gilbert, M. E., González-Iturbe, J. A., Bunyavejchewin, S., Grau, H. R., Harms, K. E., Hiremath, A., Iriarte-Vivar, S., Manzane, E., De Oliveira, A. A., Poorter, L., Ramanamanjato, J.-B., Salk, C., Varela, A., Weiblen, G. D., and Lerdau, M. T.: Decomposition in tropical forests: a pan-tropical study of the effects of litter type, litter placement and mesofaunal exclusion across a precipitation gradient, J. Ecol., 97, 801–811, https://doi.org/10.1111/j.1365-2745.2009.01515.x, 2009. a
Sauer, W.: Geologie von Ecuador, vol. 11, Gebruder Borntraeger, Berlin, Stuttgart, 1971. a
Schmidt, M. W. I., Rumpel, C., and Kögel-Knabner, I.: Evaluation of an ultrasonic dispersion procedure to isolate primary organomineral complexes from soils, Eur. J. Soil Sci., 50, 87–94, https://doi.org/10.1046/j.1365-2389.1999.00211.x, 1999. a
Schmidt, M. W. I., Torn, M. S., Abiven, S., Dittmar, T., Guggenberger, G., Janssens, I. A., Kleber, M., Kögel-Knabner, I., Lehmann, J., Manning, D. A. C., Nannipieri, P., Rasse, D. P., Weiner, S., and Trumbore, S. E.: Persistence of soil organic matter as an ecosystem property, Nature, 478, 49–56, https://doi.org/10.1038/nature10386, 2011. a
Schneider, M. P., Hilf, M., Vogt, U. F., and Schmidt, M. W.: The benzene polycarboxylic acid (BPCA) pattern of wood pyrolyzed between 200 ∘C and 1000 ∘C, Org. Geochem., 41, 1082–1088, https://doi.org/10.1016/j.orggeochem.2010.07.001, 2010. a
Schrumpf, M., Schulze, E. D., Kaiser, K., and Schumacher, J.: How accurately can soil organic carbon stocks and stock changes be quantified by soil inventories?, Biogeosciences, 8, 1193–1212, https://doi.org/10.5194/bg-8-1193-2011, 2011. a, b, c, d
Schrumpf, M., Kaiser, K., Guggenberger, G., Persson, T., Kögel-Knabner, I., and Schulze, E.-D.: Storage and stability of organic carbon in soils as related to depth, occlusion within aggregates, and attachment to minerals, Biogeosciences, 10, 1675–1691, https://doi.org/10.5194/bg-10-1675-2013,2013. a
Schwarz, T.: Klima: Puyo, http://de.climate-data.org/location/2971/ (last access: 17 June 2016), 2015. a
Schwertmann, U.: Differenzierung der Eisenoxide des Bodens durch Extraktion mit Ammoniumoxalat-Lösung, Z. Pflanz. Bodenkunde, 105, 194–202, https://doi.org/10.1002/jpln.3591050303, 1964. a
Six, J., Conant, R. T., Paul, E. A., and Paustian, K.: Stabilization mechanisms of soil organic matter: Implications for C-saturation of soils, Plant Soil, 241, 155–176, https://doi.org/10.1023/A:1016125726789, 2002. a, b
Sollins, P., Swanston, C., Kleber, M., Filley, T., Kramer, M., Crow, S., Caldwell, B. A., Lajtha, K., and Bowden, R.: Organic C and N stabilization in a forest soil: Evidence from sequential density fractionation, Soil Biol. Biochem., 38, 3313–3324, https://doi.org/10.1016/j.soilbio.2006.04.014, 2006. a, b, c, d
Stewart, C. E., Paustian, K., Conant, R. T., Plante, A. F., and Six, J.: Soil carbon saturation: concept, evidence and evaluation, Biogeochemistry, 86, 19–31, https://doi.org/10.1007/s10533-007-9140-0, 2007. a, b
Tello, O.: History of the region around CEFRA: verbal, 2014. a, b
Thompson, A., Rancourt, D. G., Chadwick, O. A., and Chorover, J.: Iron solid-phase differentiation along a redox gradient in basaltic soils, Geochim. Cosmochim. Ac., 75, 119–133, https://doi.org/10.1016/j.gca.2010.10.005, 2011. a
Wendt, J. W. and Hauser, S.: An equivalent soil mass procedure for monitoring soil organic carbon in multiple soil layers, Eur. J. Soil Sci., 64, 58–65, https://doi.org/10.1111/ejss.12002, 2013. a
Yagasaki, Y., Mulder, J., and Okazaki, M.: The role of soil organic matter and short-range ordered aluminosilicates in controlling the activity of aluminum in soil solutions of volcanic ash soils, Geoderma, 137, 40–57, https://doi.org/10.1016/j.geoderma.2006.07.001, 2006. a
Yoshinaga, N. and Aomine, S.: Allophane in Some Ando Soils, Soil Sci. Plant Nutr., 8, 6–13, https://doi.org/10.1080/00380768.1962.10430983, 1962. a