the Creative Commons Attribution 4.0 License.
the Creative Commons Attribution 4.0 License.
 | 04 Jun 2018
Methane-oxidizing seawater microbial communities from an Arctic shelf
John B. Kirkpatrick
Steven D'Hondt
Brice Loose
Marine microbial communities can consume dissolved methane before it can escape to the atmosphere and contribute to global warming. Seawater over the shallow Arctic shelf is characterized by excess methane compared to atmospheric equilibrium. This methane originates in sediment, permafrost, and hydrate. Particularly high concentrations are found beneath sea ice. We studied the structure and methane oxidation potential of the microbial communities from seawater collected close to Utqiagvik, Alaska, in April 2016. The in situ methane concentrations were 16.3 ± 7.2 nmol L−1, approximately 4.8 times oversaturated relative to atmospheric equilibrium. The group of methane-oxidizing bacteria (MOB) in the natural seawater and incubated seawater was > 97 % dominated by Methylococcales (γ-Proteobacteria). Incubations of seawater under a range of methane concentrations led to loss of diversity in the bacterial community. The abundance of MOB was low with maximal fractions of 2.5 % at 200 times elevated methane concentration, while sequence reads of non-MOB methylotrophs were 4 times more abundant than MOB in most incubations. The abundances of MOB as well as non-MOB methylotroph sequences correlated tightly with the rate constant (kox) for methane oxidation, indicating that non-MOB methylotrophs might be coupled to MOB and involved in community methane oxidation. In sea ice, where methane concentrations of 82 ± 35.8 nmol kg−1 were found, Methylobacterium (α-Proteobacteria) was the dominant MOB with a relative abundance of 80 %. Total MOB abundances were very low in sea ice, with maximal fractions found at the ice–snow interface (0.1 %), while non-MOB methylotrophs were present in abundances similar to natural seawater communities. The dissimilarities in MOB taxa, methane concentrations, and stable isotope ratios between the sea ice and water column point toward different methane dynamics in the two environments.
- Article
(703 KB) - Full-text XML
-
Supplement
(1342 KB) - BibTeX
- EndNote


Methane (CH4) is the third most abundant greenhouse gas contributing to climate change (IPCC, 2014) – exceeded only by water vapor and carbon dioxide. Despite much lower concentrations than carbon dioxide, it has a 32 times higher accumulative radiative forcing potential (Etminan et al., 2016) over a time span of 100 years. In the ocean, the two major sources of methane are ongoing biogenic production by microbes in anoxic sediment (Formolo, 2010; Reeburgh, 2007; Whiticar, 1999) and release of fossil methane from geological storage (summarized by Kvenvolden and Rogers, 2005; Saunois et al., 2016). Other sources include release from permafrost, river runoff, submarine groundwater discharge (Lecher et al., 2016; Overduin et al., 2012), and production from methylated substrates under aerobic conditions (Damm et al., 2010; Karl et al., 2008; Repeta et al., 2016). More than 90 % of the methane sourced in the seabed is oxidized within the sediment by anaerobic and aerobic oxidation (Barnes and Goldberg, 1976; Boetius and Wenzhöfer, 2013; Knittel and Boetius, 2009; Reeburgh, 1976). The remaining methane either diffuses into the water at the sediment surface or is released as bubbles, which completely or partially dissolve while rising through the water column (Leifer and Patro, 2002). Dissolved methane is diluted by the surrounding water column (e.g., Damm and Budéus, 2003; Gentz et al., 2014), in which it is used as a substrate and oxidized by aerobic methanotrophic bacteria (methane-oxidizing bacteria, MOB; Hanson and Hanson, 1996; Murrell, 2010). As a result, oceanic methane concentrations are frequently at low nanomolar levels, leaving only a small fraction of sediment-sourced methane to eventually exchange with the atmosphere (Karl et al., 2008; Reeburgh, 2007).
By contrast, in the subarctic and Arctic shelf areas, shallow water depths and seasonal sea-ice cover complicate the picture. High concentrations of methane have been reported from the entire water column up to the surface around Svalbard (Damm et al., 2005; Mau et al., 2013; Myhre et al., 2016), the Siberian Shelf (Shakhova et al., 2010), and the Beaufort Sea (Lorenson et al., 2016). In addition, during periods of near 100 % sea-ice cover, gas exchange from the water column to the atmosphere is restricted (Loose et al., 2011). Under ice-free conditions, methane concentrations are frequently found in the range of 15 to 30 nmol L−1 or up to 7 times supersaturated with regard to atmospheric equilibrium, while winter concentrations are often 10 to 100 times higher. Maximal concentrations of 5000 nmol L−1, or oversaturation of 1600 times, have been reported from the Siberian Shelf (Lorenson et al., 2016; Shakhova et al., 2010; Zhou et al., 2014).
Along with factors like oxygen and trace-metal availability (Crespo-Medina et al., 2014; Sansone et al., 2001; Semrau et al., 2010), as well as local oceanographic and geologic conditions (Schmale et al., 2015; Steinle et al., 2015), dissolved methane concentration can be a control on the community of MOB and thus methane oxidation rates (Crespo-Medina et al., 2014; Kessler et al., 2011; Mau et al., 2013). Methane hotspots, promoted by limited gas exchange under sea ice, might thus be candidate locations for accumulation of methane oxidizers. In addition, sea ice, particularly the ice–water interface, is a hotspot for microbial activity. The ice surface, penetration of light, and constant exchange with the underlying water column favor the development of communities composed of small eukaryotic organisms, microalgae, prokaryotes, and viruses; the biomass often being several orders of magnitude denser than in the underlying water column (Thomas and Dieckmann, 2002).
MOB use methane as their sole carbon and energy source (Hanson and Hanson, 1996). In the first step, methane is oxidized to methanol catalyzed by the enzyme methane monooxygenase. Since methane monooxygenase is characteristic of nearly all aerobic MOB (Knief, 2015), pmoA, the gene encoding for a subunit of the membrane-bound particulate methane monooxygenase, has been used as a specific molecular marker for detection and characterization of aerobic MOB (Knief, 2015; Lüke and Frenzel, 2011; reviewed by McDonald et al., 2008; Tavormina et al., 2008). Methanol is further metabolized to formaldehyde, from which it is either mineralized to carbon dioxide (CO2) or assimilated into organic compounds and finally biomass (reviewed by Hanson and Hanson, 1996; reviewed by Strong et al., 2015). Different types of MOB are distinguished by their phylogeny and assimilation pathways for formaldehyde. While γ-Proteobacteria or Type I MOB assimilate formaldehyde via the ribulose monophosphate pathway, α-Proteobacteria or Type II MOB use the serine pathway (Hanson and Hanson, 1996). Besides these two proteobacterial groups, MOB also occur in the phylum Verrucomicrobia (e.g., Dunfield et al., 2007; Pol et al., 2007).
Methane-derived carbon is also assimilated in non-methane-utilizing methylotrophs (non-MOB methylotrophs) or other bacteria in freshwater and temperate marine environments. These non-methane oxidizers are suggested to cross-feed on metabolites produced by the MOB (Hutchens et al., 2003; Jensen et al., 2008; Saidi-Mehrabad et al., 2013).
Knowledge of the microbial communities responsible for methane oxidation in the Arctic and subarctic is still sparse. During the last few years, the first studies have determined methane oxidation rates from seawater in these regions to cover a range from 10−4 up to 3.2 nmol L−1 d−1 (Gentz et al., 2014; Lorenson et al., 2016; Mau et al., 2013, 2017; Steinle et al., 2015). In only two of these studies, both performed off Svalbard, oxidation rate measurements were combined with analysis of the microbial community. Steinle et al. (2015) quantified MOB by fluorescence in situ hybridization and microscopy. Low but relatively constant cell-specific oxidation rates were determined from the oxidation rates and MOB abundance, indicating that MOB community size is an important control on the total methane oxidation rate in the system. Mau et al. (2013) analyzed the bacterial community with denaturing gradient gel electrophoresis (DGGE) of the 16S gene and compared patterns of PCR products for pmoA. Different MOB communities were observed in the meltwater layer and deep water in this stratified system, also reflecting the observed differences in methane oxidation rates. Only 1 of the 11 analyzed DGGE bands was identified as methanotroph (from the genus Methylosphaera) from the deep water in this study, while 0 were detected in the meltwater, possibly due to the limitations of the method. To our knowledge, no high-throughput sequencing studies of MOB in the Arctic have been published in peer-reviewed literature to date.
We studied methane-oxidizing communities from seawater sampled on the Beaufort Sea shelf close to Utqiagvik, Alaska. Incubation experiments were performed under different methane concentrations to directly compare the bacterial community structure with methane oxidation rates. Seawater incubations, freshly sampled seawater, and sea ice were analyzed for their entire community diversity (16S rDNA) and the presence of MOB (16S rDNA and pmoA) using high-throughput Illumina MiSeq sequencing. The aim of this study was to (1) investigate the response of the entire microbial community to an increase in methane abundance, (2) identify types of MOB involved in the oxidation of methane, (3) test for the presence of MOB in natural seawater and sea ice communities, and (4) relate these community features to methane oxidation rates.
2.1 Study site
Samples were collected at two sites between 7 and 15 April 2016 in the Beaufort Sea (Table 1). Site Elson Lagoon (EL) is located north of Utqiagvik, Alaska, (7 April 2016; 71.334∘ N, −156.363∘ W). At the time of sampling, EL was covered with 1.5 m thick sea ice; at approx. 1.5 m water depth, this left only a narrow layer of water between the sea ice and the sediment. Site “ice mass balance buoy” (IMB) is located 1 km offshore of Utqiagvik, close to the ice mass balance buoy of the sea ice physics group of the University of Alaska, Fairbanks (7 April 2016; 71.373∘ N, −156.548∘ W and 9 April 2016; 71.372∘ N, −156.540∘ W). This site was characterized by 1 m thick fast ice cover and a water depth of approximately 7 m.
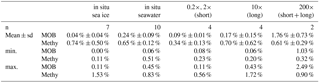
Table 1Station and sample list.
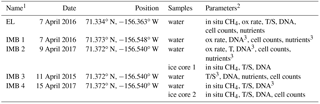
1Station abbreviations are Elson Lagoon (EL) and ice mass balance buoy (IMB). 2Parameters: in situ concentration and δ13CH4(in situ CH4), net oxidation/production rate (ox rate), temperature and salinity (T/S), collection of biomass for DNA extraction (DNA), cell counts, nutrients. 3No complete depth profile available.
2.2 Sampling and instrument deployment
Seawater temperature and salinity were recorded with a YSI Professional Plus probe (YSI, Ohio, USA) and a YSI 600 OMS V2 sonde (YSI, Ohio, USA). Water was collected using either a peristaltic pump (Masterflex Environmental Sampler, Cole-Parmer, Illinois, USA) or submersible pump (Cyclone, Proactive Environmental Products, Florida, USA) from different water depths. For determination of methane concentration and isotope ratios, water samples were collected as described in Uhlig and Loose (2017a). Briefly, in the field, 0.7 to 0.9 L of seawater was transferred bubble-free directly into foil sample bags (no. 22950, Restek, Pennsylvania, USA). On return to the laboratory, a 0.1 L headspace of ultra-high purity nitrogen (Air Liquide, Anchorage, AK) was introduced into the bags through the septa, and the samples were equilibrated at 30 ∘C for at least 6 h to measure in situ methane concentration and carbon isotope ratios.
For DNA extractions, between 1 and 2 L of seawater were filtered onto Sterivex® filter cartridges (Millipore) with 0.2 µM PES filter membranes directly in the field, or were filled into foldable polypropylene containers and filtered upon return to the laboratory. For nutrient analysis, an aliquot of the flow-through of the Sterivex® filters was collected in 15 mL polypropylene tubes (Falcon Brand, Corning, New York, USA) and frozen at −80 ∘C. Seawater was fixed with 2 % final concentration formaldehyde (Mallinckrodt Chemicals, Surrey, UK) and stored at 5 ∘C for later determination of the cell abundance.
Additionally, at site IMB, seawater temperature, salinity, and velocities were recorded with an Aquadopp Profiler (Nortek AS, Norway) and a salinity temperature recorder (SBE37SMP, Sea-Bird Scientific, Washington, USA). These were deployed at about 7 m depth on the seafloor between 9 and 15 April.
Sea ice was collected at site IMB only, using a Kovacs Mark II ice corer (Kovacs, Roseburg, Oregon, USA). The ice cores were sectioned into 15 cm and split lengthwise. The outside was cleaned with a sterilized knife to remove microbes possibly transferred from the sampling equipment. The core sections were sealed into custom-made gas-tight tubes (Loose et al., 2011) for determination of methane concentration and isotope ratios. In the laboratory, the gas-tight tubes were flushed with ultrapure nitrogen for several gas volumes (Lorenson and Kvenvolden, 1995). Ice core 1 (IC1) was melted at 5 ∘C within a week due to technical limitations, while ice core 2 (IC2) was melted with frequent mixing at room temperature within a day. Samples for molecular biology and cell counts were collected from the melted sea ice similar to the procedure described for seawater. In addition, the bottom 2 cm of one ice core was sampled into a sterile sample bag (Whirlpak, Nasco, Fort Atkinson, WI, USA) for molecular biology processing only. Sea-ice brine volume fractions were calculated according to Cox and Weeks (1983).
2.3 Net methane oxidation/production and determination of isotope fractionation factors
Rates for net methane oxidation/production were determined from the methane mass balance according to Uhlig and Loose (2017a). In short, seawater was sampled into multi-layer foil bags. In addition to a headspace of hydrocarbon-free air (Air Liquide, Anchorage, AK), some sampling bags were supplied with a spike of methane. Final dissolved methane concentrations ranged between 3.0 and 4000 nmol L−1, representing approximately 0.2 times (no methane addition, resulting in degassing of in situ methane to the headspace, 0.2×), 2 times (2×), 10 times (10×), and 200 times (200×) of the in situ methane concentration. Samples were incubated at 0 to 1 ∘C for 5 to 46 days. Some variation in the incubation period was introduced by logistical constraints. To account for potential diffusive loss of methane, a killed control was prepared for the 200× treatment by adding 0.1 M NaOH.
Assuming first order kinetics for oxidation of methane (Reeburgh et al., 1991; Valentine et al., 2001), net oxidation/production rate constants (kox) were determined from the methane mass balance in the incubations (Uhlig and Loose, 2017a) as
with being the total molar mass of methane in the bag at time ti.
The net oxidation/production rate (rox) was calculated from the first order constant and the in situ concentration of methane in the water:
Isotopic fractionation factors of methane oxidation ( were determined as described in Preuss et al. (2013), using the isotope fractionation approach (Coleman et al., 1981).
where the isotope ratios are described in δ-notation , and R is the isotope ratio of 13CH4 ∕ 12CH4 in the sample or standard (VPDB, Vienna Peedee Belemnite; McKinney et al., 1950).
Alpha can be determined as from the slope (m) of the linear regression between and .
2.4 Analytical procedures
2.4.1 Methane concentration and stable isotope ratios
Methane concentrations and stable isotope ratios were determined with a Picarro G2201-i cavity ring-down spectrometer (Picarro, Santa Clara, California, USA) coupled to the Picarro A0314 small sample isotope module (SSIM) as described by Uhlig and Loose (2017a). After equilibration, the headspace above the seawater or melted ice was subsampled with a gas tight syringe and 1 to 15 mL was injected into the SSIM. Measurements were performed in fast measurement mode. Dissolved methane concentrations were calculated as described in Magen et al. (2014), with the equilibrium constant according to Yamamoto et al. (1976).
2.4.2 Nutrient analysis and flow cytometry
Phosphate, nitrate, and nitrite concentrations were determined using a QuickChem QC8500 automated ion analyzer (Lachat, Loveland, Colorado, USA). The total number of prokaryotic cells was counted on a BD InfluxTM flow cytometer with BD FACSTM software. Formol-fixed samples were stained with a final concentration of 1 × SYBR Green I (Invitrogen, Molecular Probes, Eugene, Oregon, USA) for 20 to 45 min at room temperature in the dark before analysis.
2.5 Nucleic acid extraction and sequencing
DNA was extracted with the PowerWater® DNA extraction kit (MoBio, Carlsbad, California, USA). To remove the filter membrane, the Sterivex® cartridge was opened with a pair of sterilized pliers. The filter membrane was cut out along the edge with a scalpel, transferred into the bead tube, and DNA subsequently extracted according to the manufacturer's protocol. A minor modification was made: the tube was vortexed once for 3 min, rotated 180∘, and then vortexed for another 3 min. The DNA was eluted in 80 µL buffer PW6, after incubating the buffer for 1 min on the membrane. Quantification was conducted with a Qubit®2.0 fluorometer (Invitrogen, Carlsbad, California, USA).
The V4-V5 region of the 16S rRNA gene was amplified with forward primer 518F (5′-xx-CCAGCAGCYGCGGTAAN-3′), and an mix of the reverse primers 926R1 (5′-yy-CCGTCAATTCNTTTRAGT-3′), R2 (5′-yy-CCGTCAATTTCTTTGAGT-3′), and R3 (5′-yy-CCGTCTATTCCTTTGANT-3′) (Nelson et al., 2014). Primers included 33 base pair (bp) adapters (xx, yy) at the 5′ end. The final volume of 20 µL PCR reaction contained 0.2 µL PfuUltra II fusion HS DNA polymerase (Agilent Technologies, Santa Clara, California, USA), 50 µM each forward and reverse primer, 25 µM each dNTPs (Thermo Scientific, Waltham, Massachusetts, USA), 10 µg mL−1 BSA (Thermo Scientific, Waltham, Massachusetts, USA) and 1 ng template DNA. After initial denaturation for 2 min at 95 ∘C, DNA was amplified in 30 cycles of 30 s 95 ∘C denaturation, 30 s 55 ∘C annealing, and 30 s at 72 ∘C for extension, with a final extension of 2 min at 72 ∘C. The pmoA subunit of the particulate monooxygenase (pMMO) was amplified with primer pair 189f (5′-xx-GGNGACTGGGACTTCTGG-3′) and mb661r (5′-yy-CCGGMGCAACGTCYTTACC-3′) (Holmes et al., 1999; Lyew and Guiot, 2003). The PCR conditions were the same as described for the V4-V5 amplicon. All amplicons were purified with Agencourt® AMPure® XP magnetic beads (Beckman Coulter, Indianapolis, Indiana, USA) at a ratio of 0.7 × bead solution per PCR reaction volume and washed with 80 % ethanol.
The primer sequences specified above included adapter sequences (xx, yy) to attach Nextera indices and adapters in a second PCR reaction of 6 cycles with 50 ng template DNA (http://web.uri.edu/gsc/next-generation-sequencing/, last access: 27 May 2018). Amplicons were sequenced with Illumina MiSeq at 2 × 250 bp read length.
2.6 Sequence analysis
2.6.1 V4-V5 region of 16S rRNA gene
Demultiplexing and adapter removal was performed with Illumina software. V4-V5 sequence quality control and clustering was performed in mothur (Schloss et al., 2009) as follows. Contigs were prepared from forward and reverse reads and culled if they contained ambiguous bases or homopolymers longer than 6 bases. Contaminating sequences observed in kit and filter blanks accounted for 1.4 % of all sequences and were removed from all samples. After alignment to the Silva small subunit reference database (v123; Quast et al., 2013), the 408 bp long sequences were preclustered (1 % variability allowed) and filtered for chimeras (de novo algorithm) with the UCHIME (Edgar et al., 2011) wrapper in mothur. Sequences identified as chloroplast, mitochondria, Archaea, Eukaryota, or unknown were removed and operational taxonomical units (OTUs were built at a 3 % distance level with the opticlust algorithm. OTUs with fewer than 2 reads were removed from further analysis.
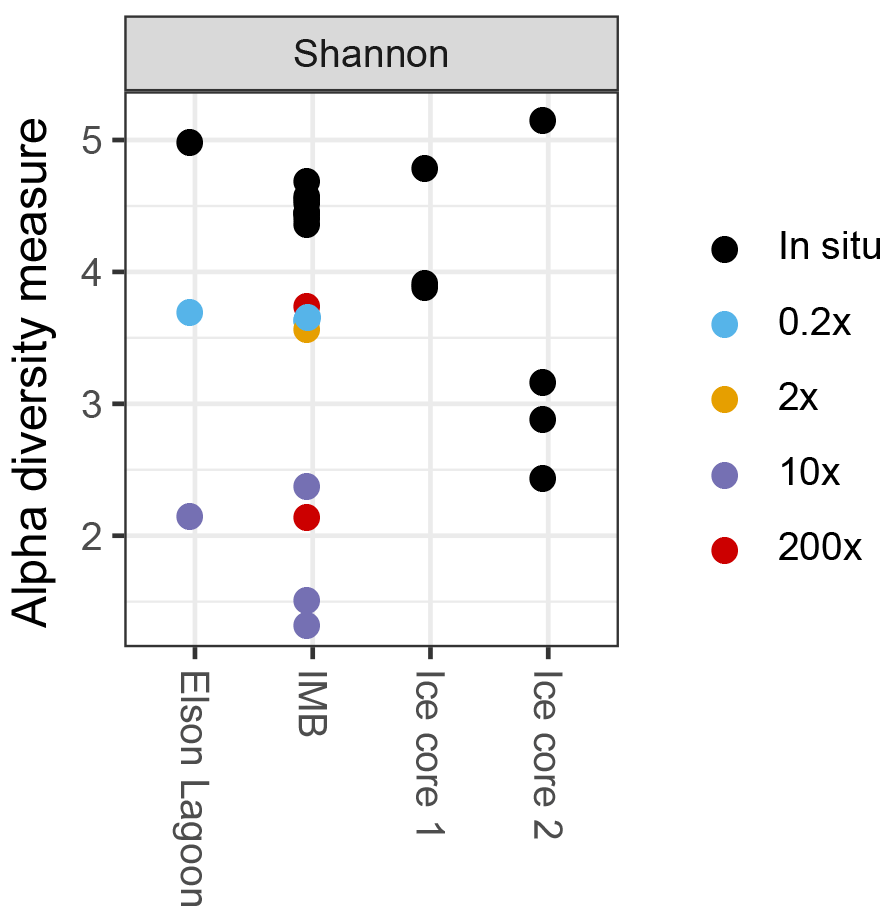
Visualization and further analysis of sequencing data were performed in R version 3.2.3 (R CoreTeam, 2015) in RStudio Version 0.99.903. Species diversity was analyzed using the phyloseq package (McMurdie and Holmes, 2013) to determine richness (Shannon and Simpson indices) and differences in community structures (Bray–Curtis dissimilarities). Differences in community structure associated with different methane spike concentrations were determined via analysis of similarity (ANOSIM) in the package vegan (Oksanen et al., 2017) on three predefined groups: in situ (n = 9), 0.2× (n = 2), and 10× (n = 3). Groups 1×, 200× short, and 200× long with n = 1 (Table 2) were excluded from the analysis.
Table 2Samples sequenced for V4-V5 and pmoA.
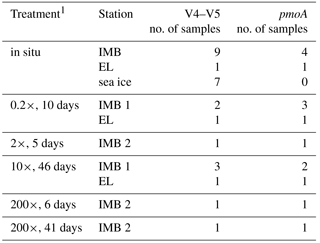
1The different incubation times resulted from logistical constraints.
2.6.2 Identifying potential methane-oxidizing bacteria
To select groups representing methylotrophs and methanotrophs, 16S OTUs were filtered according to their phylogenetic annotation assigned by mothur for containing the string “meth” on family, order, and genus level. This filter is expected to find 97 % of taxonomically annotated methanotrophs, according to a current review on the diversity of methanotrophs (Knief, 2015).
Further, phylogenetic groups potentially involved in methane dynamics were identified as differentially more abundant 16S OTUs between incubations (0.2×, 10×, 200×) and in situ samples using DESeq2 (Love et al., 2014). Only OTUs with an adjusted p value in DESeq2 < 0.05 were kept for further analysis. OTUs identified from spike concentration 0.2× were considered to represent groups favored due to the incubations (the “bottle effect”) rather than addition of methane, and removed from further analysis. Treatments EL 0.2×, EL 10×, and IMB 2× (Table 2) were not included in this analysis, since no replicate samples were available. The abundance of all candidate 16S OTUs, identified as described above, was determined within every in situ or incubated sample.
Absolute numbers of methanotrophs and methylotrophs were calculated by multiplying the relative 16S sequence abundance with flow cytometric cell counts. The absolute numbers were further corrected for the mean of the 16S gene copy number for the lowest taxonomic rank (class to genus) available in the rrnDB database (Stoddard et al., 2015).
2.6.3 Particulate methane monooxygenase: pmoA
In addition to 16S genes, the alpha subunit of the particulate methane monooxygenase (pmoA) was used as a molecular marker for MOB. Only pmoA forward reads were analyzed. High-quality pmoA reads were retrieved according to the following protocol. Using mothur (Schloss et al., 2009), all reads were trimmed to a length of 225 bp to remove sequence fractions with a mean quality score below 30 (fastqc; Andrews, 2010). In addition, reads were clipped whenever the average quality score over a 50 bp window dropped below 30. Sequences with ambiguous bases and homopolymers larger than 6 bp were culled. Only sequences that translated into uninterrupted protein reading frames (Emboss 6.60 / transseq; Rice et al., 2000) were kept for further analysis. Nucleic acid sequences were aligned to a reference dataset of pmoA sequences (fungene; Fish et al., 2013) and sequences of a length of at least 220 bp were preclustered (1 % variability allowed). De novo chimera filtration was run with the UCHIME (Edgar et al., 2011) wrapper in mothur. A similarity of 93 % between pmoA sequences was defined to match the 97 % cutoff as species definition for the 16S gene (Lüke and Frenzel, 2011). PmoA OTUs were built at a maximal distance of 7 % between the furthest neighbors to maximize resolution between OTUs due to the short read length and limited number of unique sequences (Table S1 in the Supplement). To determine the phylogenetic relationship of pmoA sequences, nucleotide sequences were aligned against selected reference sequences in Mafft 7.017 (Katoh and Standley, 2013) and a neighbor joining tree calculated in Clustal 2.1 (Larkin et al., 2007) with 1000 replications.
3.1 Water column properties
On 7 April 2016, the narrow layer of water between the sediment and ice in EL (n = 1) had a salinity of 21 and a temperature of −1.5 ∘C. Phosphate and nitrate concentrations were 0.74 µM and 4.87 µM, respectively. Methane concentration for EL (n = 1) was 53.2 nmol L−1 with a stable isotope ratio of −73.8 ‰ (Fig. 1) and cell density 7.7 × 10⁴ cells mL−1. For most days during the sampling period, the water column at station IMB was characterized by temperatures around −1.8 ∘C and salinities of 33.9 to 36.4 (Fig. 1, Figs. S1 and S2 in the Supplement). Between 11 and 13 April warmer water (max. temperature observed −0.9 ∘C) was advected, coinciding with a change in current direction. A lower salinity of 27.5 at the ice–water interface indicates melting of the sea ice. Phosphate concentrations at station IMB were 0.99 ± 0.33 µM (n = 9) and nitrate 6.59 ± 4.04 µM (n = 9), with neither showing any trends in the depth profiles (data not shown). Nitrite concentrations were below detection (0.3 µM based on technical replicates). Water column methane concentrations at station IMB ranged between 9.2 and 25.3 nmol L−1 (16.3 ± 7.2 nmol L−1, n = 5; Fig. 1), with stable isotope signatures between −55.4 ‰ and −70.5 ‰ (−60.6 ‰ ± 6.3 ‰, n = 5). Total prokaryotic cell densities, determined as SYBR Green stained cells with flow cytometry, were 6.9 × 10⁴ ± 5.7 × 10³ cells mL−1 (n = 16).
3.2 Ice cores
Temperature and salinity profiles of the two sea-ice cores sampled on 9 and 15 April are shown in Fig. 2. Brine volume fractions above 5 % indicate that the ice was permeable to water and gases (Golden et al., 1998) in the bottom 50–100 cm, while the upper part of the ice was impermeable. Methane concentrations in the ice were higher than in the water (83.9 ± 35.0 nmol kg−1, n = 9), while the isotope signatures were close to seawater (−60.4 ‰ ± 3.5 ‰, n = 9). Ice core 1 (IC1), sampled on 7 April, had generally higher methane concentrations and more positive isotope signatures (72.3–144.3 nmol kg−1, −54.4 ‰ to 62.0 ‰ ) than ice core 2 (IC2), sampled on 15 April (53.3–77.6 nmol kg−1, −59.0 ‰ to −61.6 ‰ ). Microbial activity during storage of IC1 at 5 ∘C for 1 week before analysis might have led to the differences in methane concentrations and isotope ratios. For ice samples, cell counts were performed on IC2 only; they show an increase from 1.0 × 10⁴ cells mL−1 in the top layers to 8.2 × 10⁵ cells mL−1 in the bottom two centimeters of the ice core.
3.3 Net methane oxidation/production and isotope fractionation
The methane oxidation potential of microbial seawater communities at stations EL and IMB was determined from the methane mass balance in incubation experiments (Table 3; Uhlig and Loose, 2017a). Final dissolved methane concentrations ranged between 3.0 and 4000 nmol L−1, representing approximately 0.2 times (0.2×) to 200 times (200×) the in situ concentration. Oxygen concentrations at the end of the long incubations ranged between 116 and 126 % saturation, while oxygen concentrations at the end of the short incubations were not determined.
Table 3Methane oxidation parameters during long-term incubation experiments. n: number of replicates, c(CH4)initial: approximate initial methane concentration, kox: net oxidation/production rate constant, rox: net oxidation/production rate at in situ concentration, αox: isotopic fractionation factor during oxidation. Oxidation rates and rate constants are replicated from Uhlig and Loose (2017a).
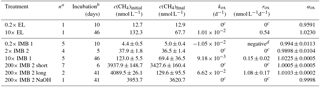
aReplicates are from different water depth. bThe different incubation times resulted from logistical constraints. cOxidation rate constants were not significantly different from 0 at a 95 % confidence level. dNegative net oxidation rate constant indicating methane production.
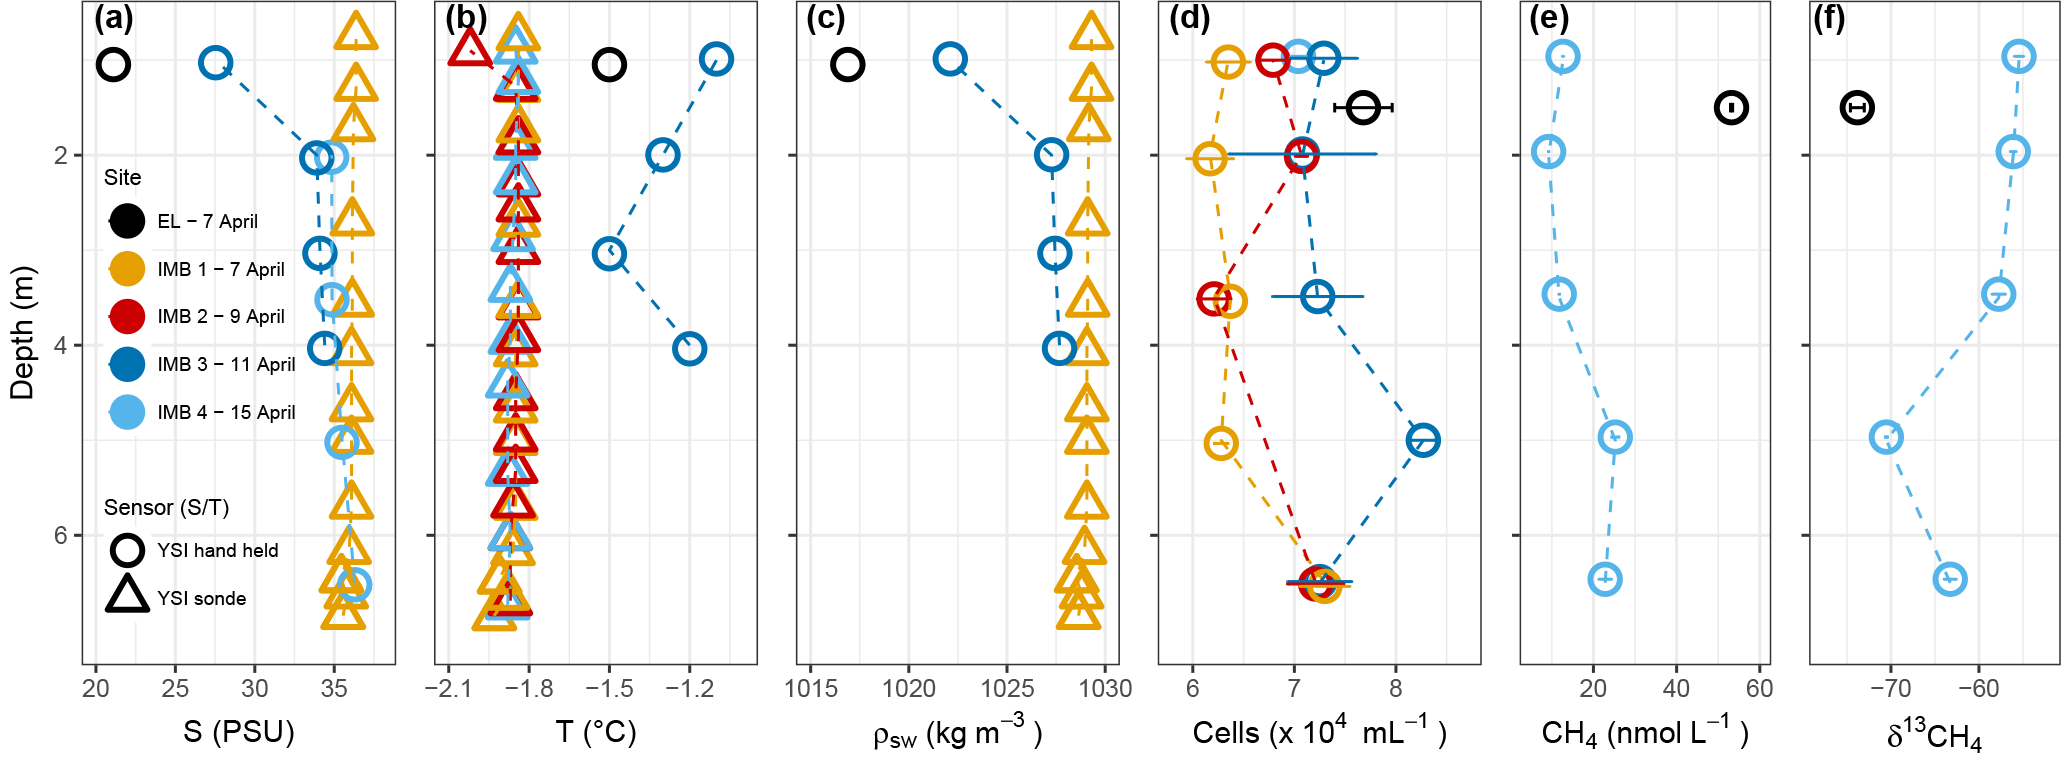
Figure 1Water column properties during the time series near Utqiagvik. Salinity (a), temperature (b), density (c), cell abundance (d), methane concentration (e) and stable isotope ratios (f). Error bars on cell numbers (d) represent the standard deviation on two technical replicates. Salinity and temperature (a and b) were determined with a YSI hand held (circle) and YSI sonde (triangle). Salinity for the YSI hand held on 15 April was determined in the laboratory, thus in situ temperature is missing. Salinity for the YSI sonde on 9 and 15 April is missing due to freezing of the sensor. Methane data is only available for EL on 7 April and for IMB 4 on 15 April.
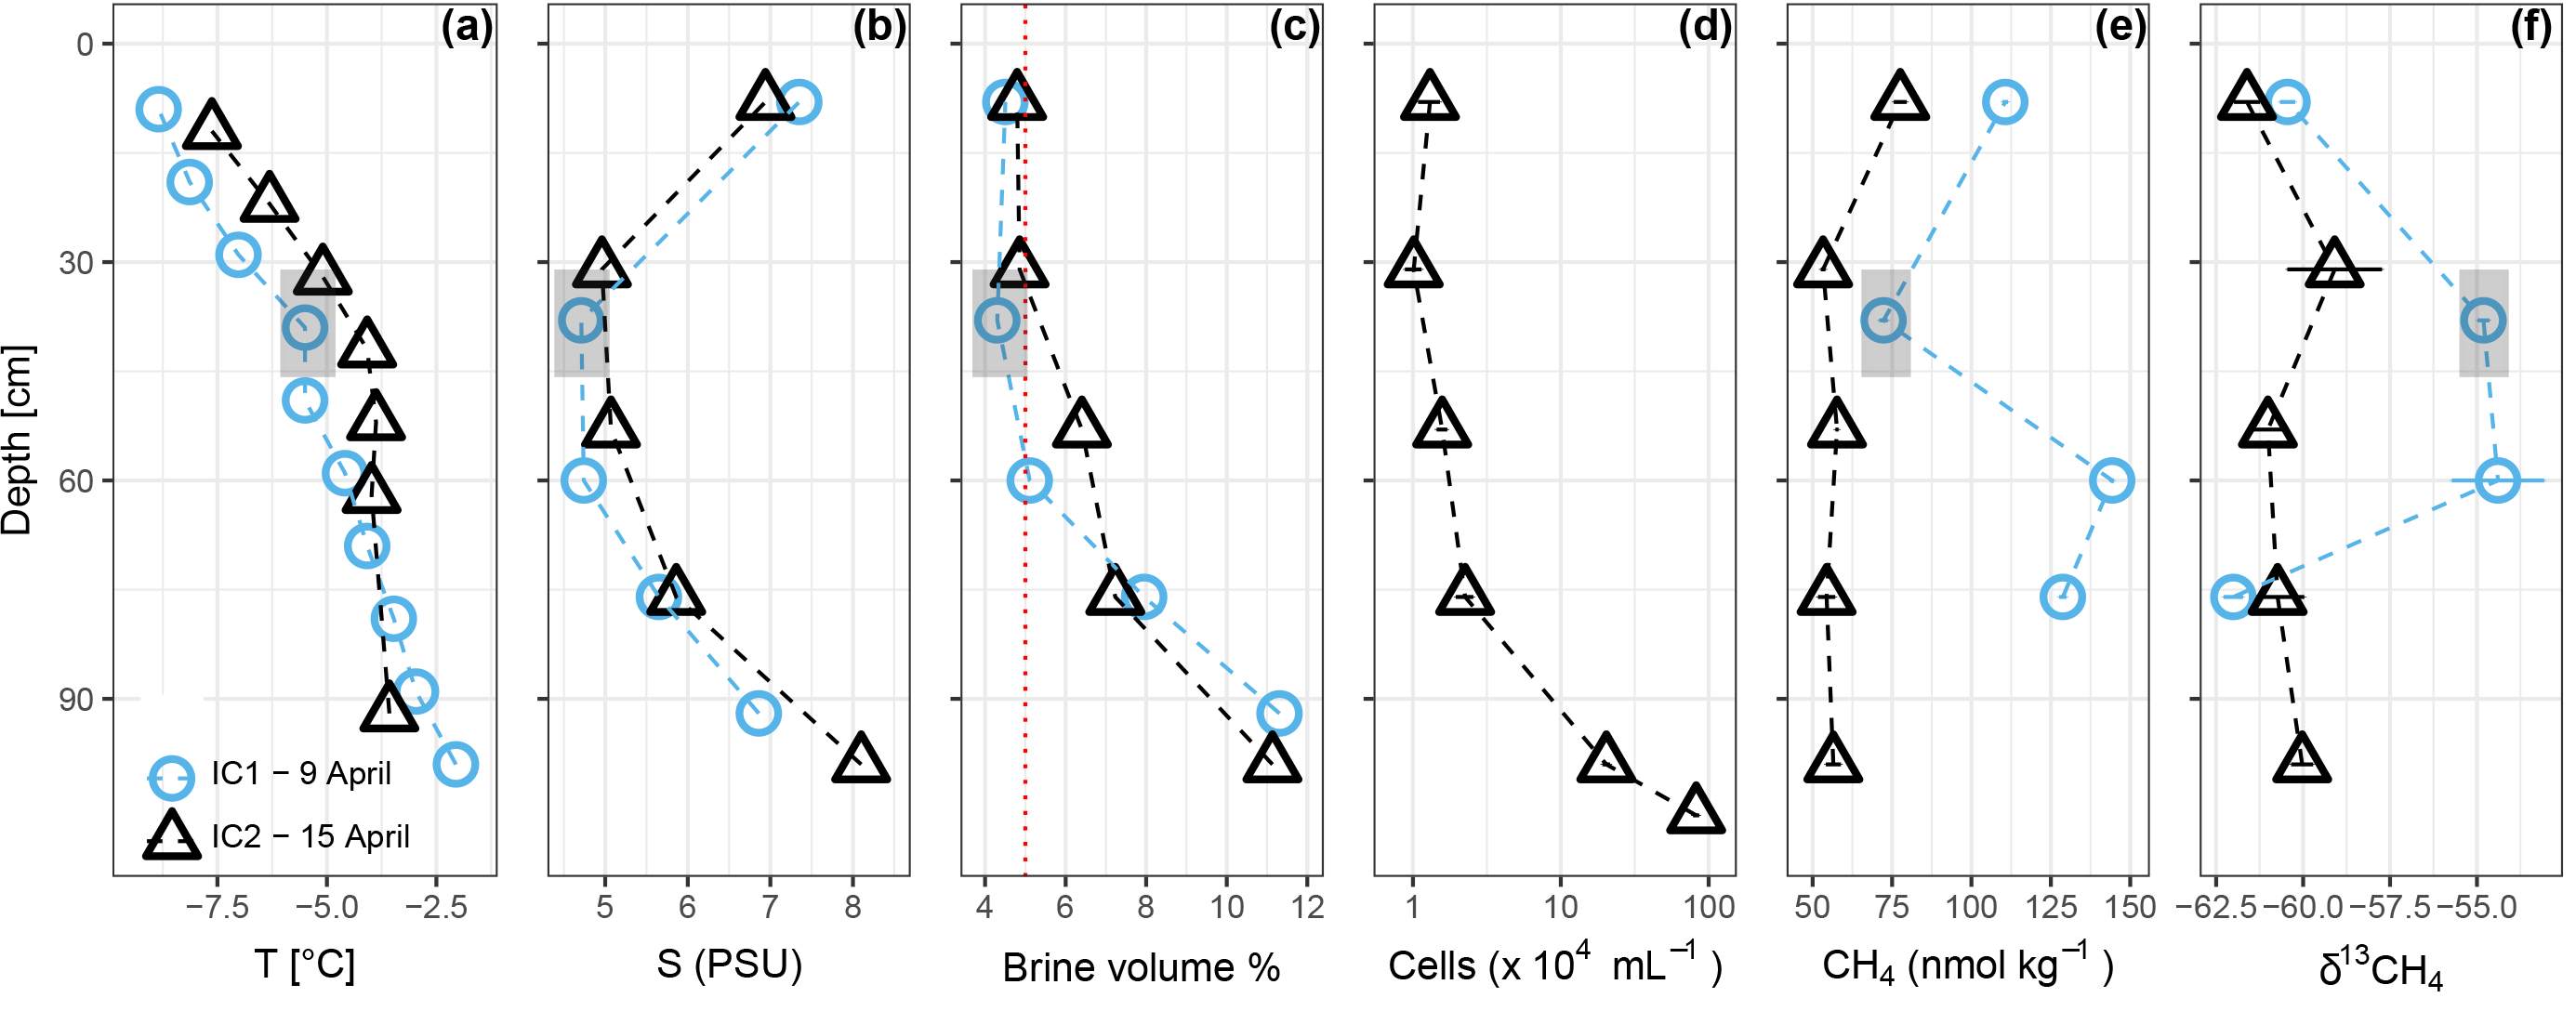
Figure 2Sea ice temperature (a), bulk salinity (b), brine volume fraction (c), prokaryotic cells mL−1 sea ice (for IC2 only) (d), methane concentration (e), and stable isotope ratios (f). The vertical red dotted line in (c) shows a brine volume fraction of 5 %, the threshold for permeability (Golden et al., 1998). IC1 had sediment included into the ice matrix at depths 30–46 cm, indicated by the gray box.
Net oxidation rates discussed here were published in Uhlig and Loose (2017a) and are summarized for comparison with the microbial community structure. Short incubations (≤ 10 days) did not show significant oxidation, while long-term incubations (41–46 days) did. Surprisingly, four out of five replicates of treatment 0.2× IMB showed a statistically significant increase in methane of about 0.62 ± 0.21 nmol L−1 (n = 5) within 10 days (Fig. S3). In long-incubation samples with significant methane oxidation (10× and 200× spikes), the isotopic signature of the residual methane increased toward heavier (more positive) signatures with fractionation factors α of 1.0230 (10× EL), 1.0225 (10× IMB), and 1.0103 (200× IMB).
3.4 Bacterial community structure
The V4-V5 region of the 16S rRNA gene was sequenced from a total of 10 seawater samples and 7 ice samples (Table 2). Non-metric multidimensional scaling analysis of the Bray–Curtis diversity revealed high similarity across the in situ water samples analyzed for 16S diversity (Fig. 4). Samples from site IMB clustered together repeatedly, and we did not observe any differences in community structure coinciding with water depth or temperature (Fig. 4). For the IMB samples, IMB 2 was the only sample slightly different from the other in situ samples, though IMB 1, IMB 2, and IMB 4 are all characterized by a colder water mass. Only IMB 3 showed some influence of an incoming warm water mass in the YSI profile (Fig. 1), though not yet reaching the bottom (Fig. S1), but this shift is not seen in the community structure. In contrast to the in situ water samples, the community structure of incubated samples is driven by incubation time. While communities in the short-incubation treatments (5–10 days; 0.2×, 2×, 200× short) were similar to the in situ samples, the long incubations (41–46 days; 10×, 200× long) clearly deviated from the in situ samples. In both the long and short incubated clusters samples originating from IMB 1 (0.2×, 10×) and IMB 2 (2×, 200×) are present (Fig. 4, Table 2). Microbial communities in ice cores were clearly distinct from those in the water samples and were more distant to each other than were the communities in water samples.
In the in situ seawater communities, Proteobacteria were dominant with relative sequence abundances of 59.5 and 65.5 % ± 2.5 % for EL (n = 1) and IMB (n = 9), respectively (Fig. S4). Within the phylum of Proteobacteria, α- and γ-Proteobacteria made up the majority. The second most abundant phylum was Bacteroidetes with 23 and 19.6 % ± 1.4 % for EL and IMB, respectively.
Similar to the seawater, sea ice (n = 7) showed a dominance in Proteobacteria (58.9 % ± 9.8 %), but Bacteroidetes sequences (29.1 % ± 11.7 %) were slightly more abundant in the ice than in the water. γ-Proteobacteria dominated in all but one sample (IC2 30–46 cm). This one sample, which had clearly visible sediment included into the sea ice structure, was dominated by α-Proteobacteria.
In all incubated samples that were sequenced (n = 10), species richness decreased (Fig. 3) and the communities shifted toward higher fractions of γ-Proteobacteria over time. In short incubations (5–10 days; n = 5) γ-Proteobacteria dominated with 61.8 % ± 2.9 % of sequences, while reaching 81.0 % ± 11.1 % in long-incubation samples (41–46 days; n = 4). In particular, one operational taxonomical unit (OTU), from the genus Oleispira, was very abundant in the long-incubation samples, with 50.1 to 76.3 %, compared to abundances < 0.04 % in the in situ samples. The same OTU was only slightly more abundant in the short-incubation treatments (0.5 to 1.6 %) compared to in situ abundances. In addition to the shift in community structure, total cell densities increased to 1.9 × 10⁵ and 3.3 × 10⁶ cells mL−1 for short and long incubations, respectively, based on flow cytometric cell counts.
3.5 Methanotrophs, methylotrophs, and differentially abundant OTUs
Using their 16S taxonomic annotation, we identified six groups of aerobic methanotrophs (MOB; Fig. 5). With a maximum of 1.76 % ± 0.73 %, the relative abundance of MOB was low in all samples (Table 4). Four MOB grouped in the Methylococcales (γ-Proteobacteria), specifically Marine Methylotrophic Group 1 and 2 (MMG1, MMG2), unclassified Methylococcales and the Milano-WF1B-03 family. The three remaining MOB OTUs belonged to the genera Methylobacterium and Methyloceanibacter (α-Proteobacteria) and Candidatus “Methylacidiphilum” (Verrucomicrobia). MOB OTUs were more abundant in natural seawater samples than in sea ice (maximal 0.11 % in IC1 0–16 cm), but in contrast to the seawater, α-Proteobacteria MOB dominated in the sea ice.
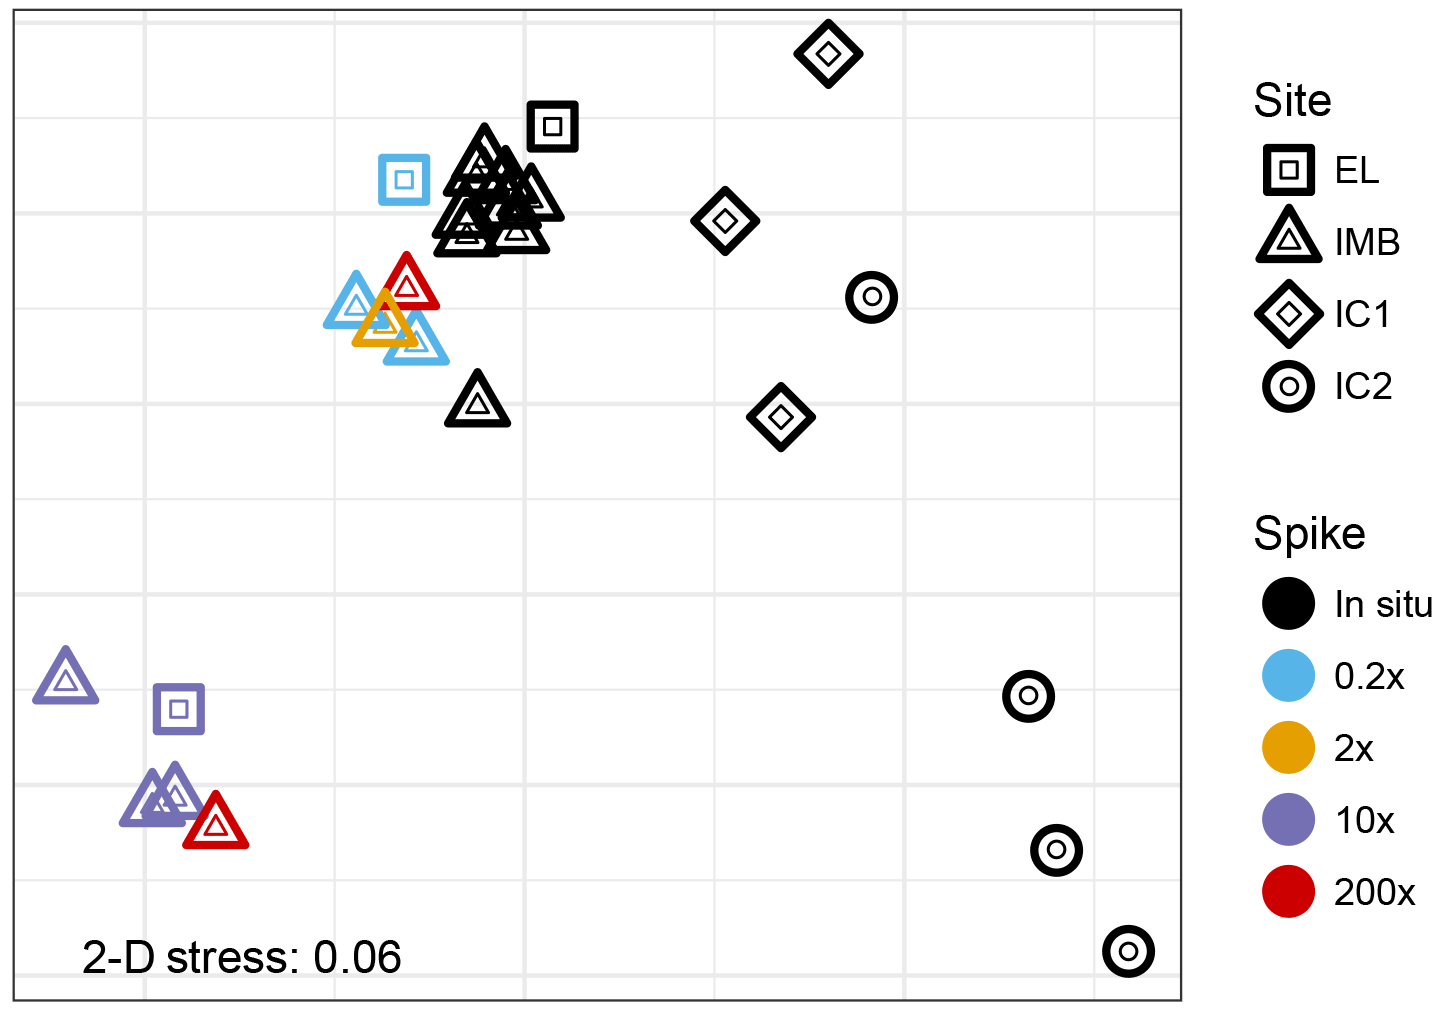
Figure 4Non-metric multidimensional scaling analysis (unitless) of Bray–Curtis dissimilarities of the 16S read data. The low 2-D stress of 0.06 indicates a good two-dimensional representation of the multidimensional dataset with very low prospect of misinterpretation.
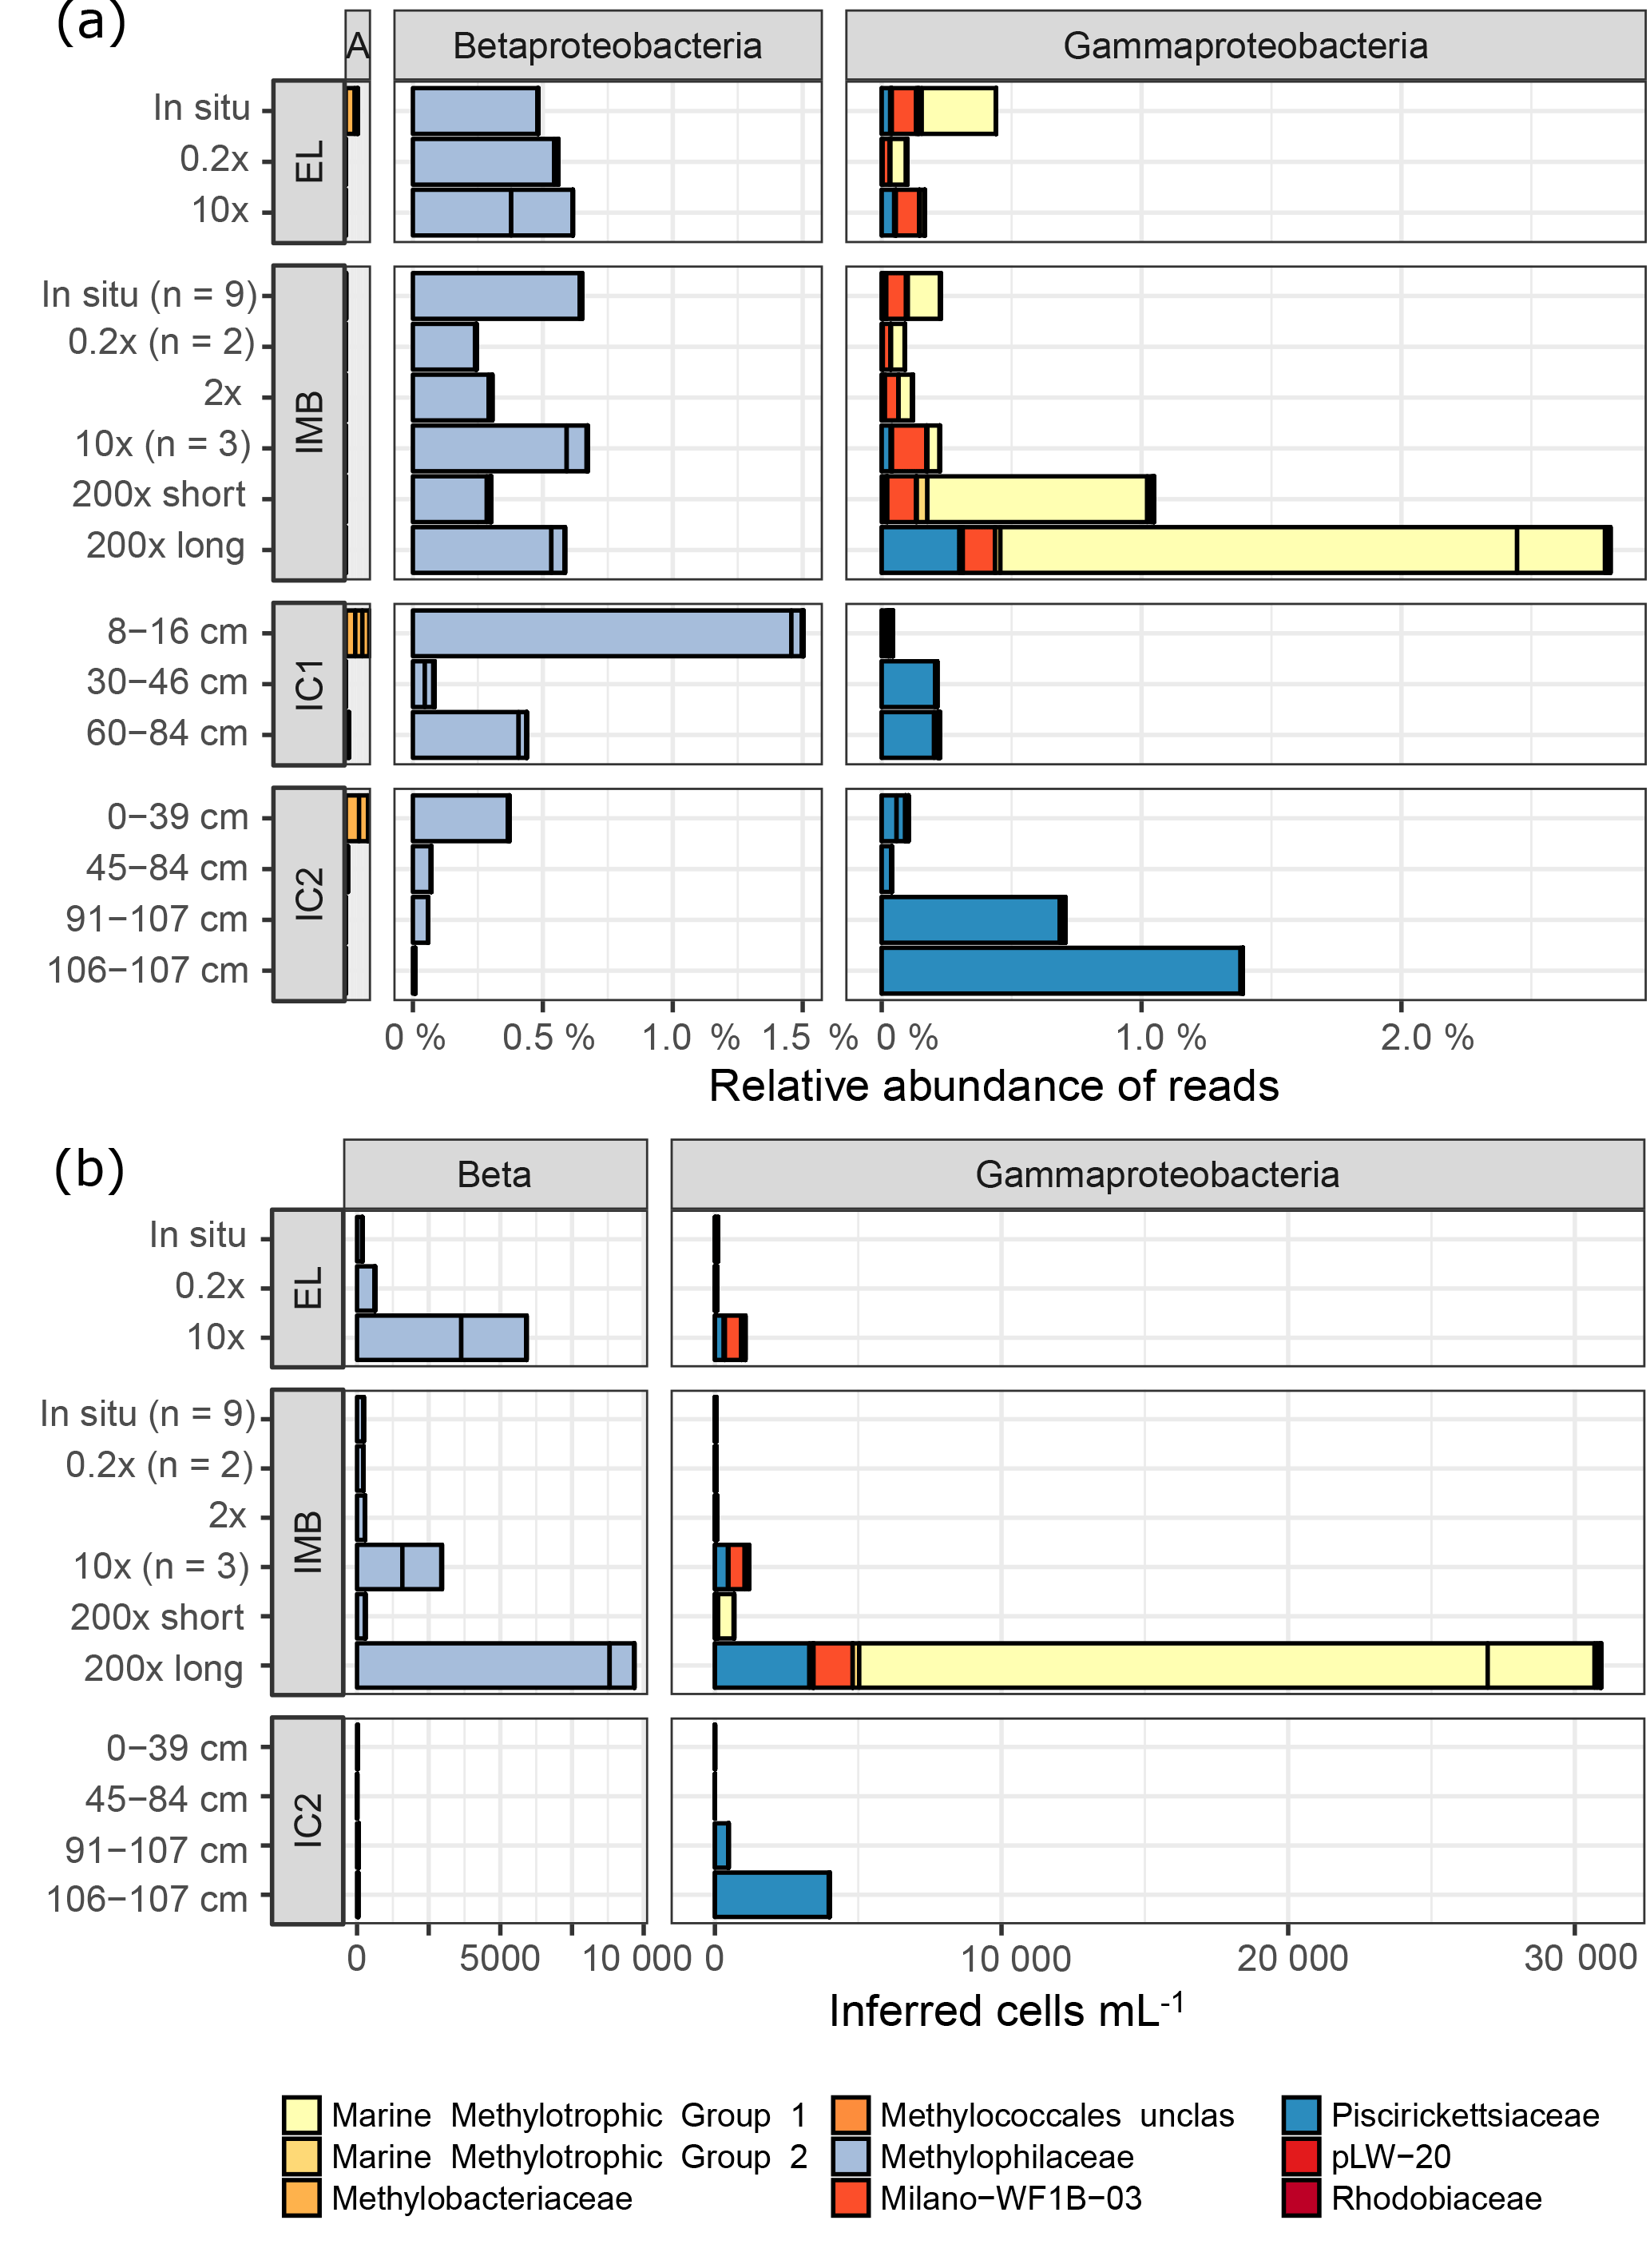
Figure 5Relative abundances (a) and inferred cell numbers (b) of methylotroph OTUs by family. Sampling sites for water samples are Elson Lagoon (EL) and ice mass balance buoy (IMB). Ice cores (IC1 and IC2) were collected at site IMB on 9 and 15 April, respectively. The sample name indicates the methane spike concentration compared to in situ methane concentration for IMB and EL, and the ice core section in centimeters from top (0 cm, ice–snow interface) to bottom (ice–water interface). IMB in situ, 0.2× and 10× are averages of the respective number (n) of samples, all other samples were n = 1. Red and yellow shades indicate MOB, while blue shades indicate non-MOB methylotrophs. (a) α-Proteobacteria (A), β-Proteobacteria (Beta), and γ-Proteobacteria are shown; Verrucomicrobia Incertae Sedis were < 0.003 % in (a). Scale for α-Proteobacteria is the same as for β- and γ-Proteobacteria. (b) Cell numbers were calculated from the relative abundances shown in (a) with the cell counts from flow cytometry and corrected for the 16S copy number per cell. Verrucomicrobia Incertae Sedis and α-Proteobacteria were <8 cells mL−1.
Table 4Relative abundance of methylotroph OTUs in situ, split into methanotrophs (MOB) and non-MOB methylotrophs (Methy)
Furthermore, four clades of non-methane-utilizing methylotrophs (non-MOB methylotrophs) were identified, grouping into γ-Proteobacteria Marine Methylotrophic Group 3 (MMG3) and Methylophaga, and to the β-Proteobacteria Methylophilaceae (Methylotenera, OM43 clade). Non-MOB methylotroph OTUs were more abundant than MOB OTUs with the exception of the 200× incubation treatments (Fig. 5, Table 4). Ice samples showed the largest difference in abundance between non-MOB methylotrophs and MOB, with a ratio of 21:1 between the two groups. Ice samples also had the highest overall relative abundance of methylotrophs (MOB and non-MOB) of all in situ samples (max: 1.63 %, IC1 0–16 cm). Only the 200× long incubations had a higher total number of methylotrophs (3.3 %), while this sample was in addition dominated by MOB (2.49 %). The second highest relative abundance of MOB was found for in situ EL and IMB with 0.24 % ± 0.09 % (n = 10).
Taking into account the total cell number, a strong increase in MOB groups MMG1 (2 to 700 times) and Milano-WF1B-03 (25 to 75 times) was observed for the 10× and 200× long-incubation samples compared to in situ conditions (Fig. 5b).
Taxonomic groups that became differentially more abundant in the incubated samples than in natural communities were the y-Proteobacteria Oleispira, Colwellia, and Glaciecola, as well as Rhodobacteracea (α-Proteobacteria). Except for Oleispira, which became dominant, the other taxa had relative sequence read abundances from 1.1 to 12.6 % after the oxidation experiments, compared to abundances < 0.25 % for in situ samples (Fig. S5).
3.6 Particulate methane monooxygenase (pmoA) sequences
A 225 bp section of the particulate methane monooxygenase gene (pmoA) was sequenced in a total of 15 samples (Table 2). The absolute abundance of pmoA fragments obtained in sequences ranged from 9331 (IMB in situ, 6.5 m depth) to 72781 (IMB 200× long) reads. In general, incubations with higher methane concentration had more pmoA reads than incubations with lower methane concentration or in situ samples. About three times more reads were filtered from the EL in situ sample (33 844 reads, n = 1) than the IMB in situ samples (11700 ± 1833, n = 4).
Two of the 59 pmoA OTUs made up 96.8 % of all sequences, while all other OTUs individually represented ≤ 1 % of the pmoA sequences. The most abundant OTU (71.0 % of all sequences) clustered with two uncultured isolates from methane seeps (NCBI accession: HQ738559, EU444875) in the deep sea-3/OPU3 subgroup of γ-Proteobacteria Type I MOB (Hansman et al., 2017; Knief, 2015; Lüke and Frenzel, 2011). The second most abundant (25.8 %) OTU was related to Methyloprofundus sedimentii, another Type I MOB. Most of the low-abundance OTUs also clustered within the Type I MOB, while only three OTUs (0.07 % of all pmoA sequences) clustered with Type II α-Proteobacteria MOB pmoA sequences (Methylocystis, Methylosinus).
4.1 Methane concentration and stable isotope ratios in seawater and ice
Seawater methane concentrations in April 2016 close to Utqiagvik, Alaska were supersaturated 2.5 times to 7 times compared to atmospheric equilibrium (3.6 nmol L−1). The concentration at site EL (52.90 nmol L−1, n = 1, 7 April 2016) was in the range of a study by Lecher et al. (2016) in EL under ice-free conditions (3.3–124.0 nmol L−1). At site IMB, concentrations were slightly lower (9.5–25.2 nmol L−1 : n = 5, 15 April 2018) than previously reported from the same area for ice-free (Lecher et al., 2016; mean: 40.6 nmol L−1), and ice-covered conditions (Zhou et al., 2014; March/April: 37.5 ± 6 nmol L−1). Shallower depths at IMB exhibit lower methane concentrations (Fig. 2), and the isotopic signature mirrors this pattern with more positive values toward the surface. This indicates that methane might be biologically oxidized on the way through the water column, after being released from the sediment.
The sea-ice bulk methane concentrations observed in this study (53–144 nmol kg−1) are significantly higher than in a study from the same area (Zhou et al., 2014), but fall within values reported for the Beaufort Sea (5–1260 nM, Lorenson and Kvenvolden, 1995). Methane carbon isotopic signatures (−54.4 to −63.8 ‰) are comparable to the higher end of previous studies for bulk sea ice (−52.1 to −83.4 ‰ , Lorenson and Kvenvolden, 1995) and sea-ice brine (−75 ‰ , Damm et al., 2015).
Although both ice cores were sampled within 300 m distance from each other at site IMB, they differ in concentration and isotope signature. These differences could either be caused by spatial variability between the two ice cores or differences in the processing procedure described in Sect. 2.2. Spatial variability as driving difference between the two ice cores is corroborated by the sediment present at 30–46 cm depth in IC1, which was not observed in IC2, indicating that both ice cores have different freezing histories. The same event that led to inclusion of the sediment into IC1 possibly resulted in inclusion of higher methane concentrations into IC1 compared to IC2 during freeze-up. In addition, microbial processes like oxidation of methane or methanogenesis could have taken place in situ or during sample processing and storage. Microbial oxidation of methane, particularly in the two middle sections (30–46 and 52–86 cm depth), might have led to the observed shift toward more positive carbon isotope ratios (Fig. 2). The different bacterial community introduced through the sediment (Fig. S4) might have favored oxidation in those two sections compared to the top and bottom sections. MOB identified by our approach were, however, neither more abundant nor phylogenetically distinct in the sediment-loaded section compared to the other sections (Fig. 4a). Another microbial process that may have led to the discrepancies between IC1 and IC2 could be methane production from ice algae-derived organic carbon in IC1. With typical carbon isotopic signatures of −20 to −30 ‰ for ice-derived carbon (e.g., Wang et al., 2014), methane produced from this substrate would be enriched in 13C (more positive) compared to the initial pool of methane (about −60 ‰, Figs. 2 and 6). Yet sequences of bacterial taxa that might indicate anoxic conditions (Eronen-Rasimus et al., 2017), which would favor anaerobic methane production, were not significantly more abundant in IC1 than in IC2 (Table S2).
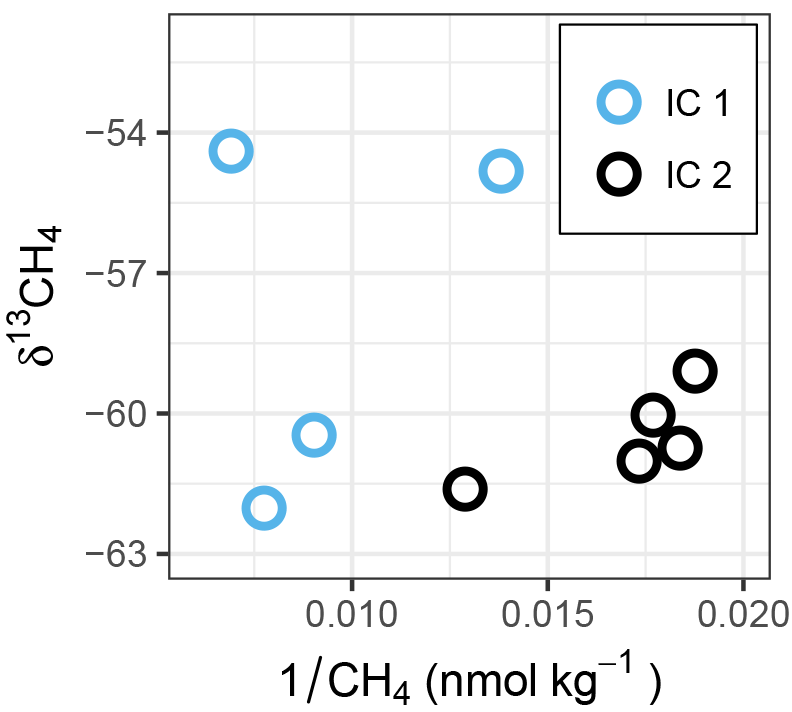
Figure 6δ13CH4 vs. reciprocal of CH4 concentration (Keeling-type plot) of ice cores. Within each ice core, a shift to more positive δ13CH4 values in combination with a decrease in CH4 concentration indicates microbial oxidation. Comparing IC2 to IC1, the shift toward higher concentrations and more positive δ13CH4 (see also Fig. 2) in IC1 might indicate CH4 production from a substrate with heavier isotope signature, compared to the values in IC2.
Compared to the underlying water column, methane concentrations in the sea ice were 2 to 5 times higher. Further, the isotope signatures indicate less oxidized methane (−60.4 to −63.8 ‰) in most of the ice sections compared to the upper water column (−55 ‰). Lorenson and Kvenvolden (1995) report higher methane concentrations in sea ice than in the water column for the Beaufort Sea. They attributed the high methane concentrations in the fast ice to inclusion of sediment-sourced methane during the initial freeze-up over the shallow shelf at < 10 m water depth (Lorenson et al., 2016). Methane concentrations in IC2, which are close to water column concentrations reported in previous studies for our study region (Lecher et al., 2016; Zhou et al., 2014), suggest the same process for our ice cores. Further, in our study, the lower methane concentrations together with more positive (heavier) isotopic signature in seawater compared to ice, might indicate that the microbial community in the water column is oxidizing more methane during the ice-covered period than in the freeze-up period. Higher oxidation rates during ice-covered periods compared to ice-free conditions were previously reported for the Beaufort Sea. Due to reduced sea–air gas exchange, higher methane concentrations can build up under sea-ice cover, which might lead to higher oxidation rates (Lorenson and Kvenvolden, 1995).
4.2 Methane dynamics at different methane concentrations
Net methane oxidation/production rates were determined from water sampled at stations IMB 1 and IMB 2 on 7 and 9 April 2016. Both days were characterized by the cold water temperatures ( ∘C; Fig. 1). Different water masses have previously been reported to influence the methane oxidation potential of water column microbial communities off Svalbard (Steinle et al., 2015). In this study, we observed a change in current direction and water temperature consistent with advection of a different water mass into the study area (Fig. S1). However, this change occurred on 12 April subsequent to sampling IMB 3, and thus this event would not have influenced the net oxidation potential determined in this study.
Net oxidation rates of the long-incubation treatments at 10× (46 days) and 200× (41 days) methane concentration fall into the mid-range of rates published for Arctic and subarctic environments (Damm et al., 2015; Gentz et al., 2014; Lorenson et al., 2016; Mau et al., 2013, 2017; Steinle et al., 2015) or marine sites with high oxidation rates at oil spills or gas flares (Leonte et al., 2017; Redmond et al., 2010; Valentine et al., 2010), as discussed in Uhlig and Loose (2017a). The fractionation factors (αox) that we observed are higher than previously reported from cold marine environments with a range of αox from 1.002 to 1.017 (Cowen et al., 2002; Damm et al., 2008; Grant and Whiticar, 2002; Heeschen et al., 2004; Keir et al., 2009; Tsunogai et al., 2000). However, some of these fractionation factors, which were calculated from in situ data, might be underestimates due to mixing effects in the water column (Grant and Whiticar, 2002). The fractionation factors in our study seem to be inversely dependent on the methane spike concentration, with higher fractionation in the 50× (1.023, n = 6) treatments than in the 200× (1.010, n= 2) treatments. The relative and absolute abundances of MOB, as well as the dominant MOB types, differed between both treatments, possibly providing explanations for the differences in fractionation rates. Logistical constraints forced us to stop several incubations already after 5 to 6 days. These short-incubation 2× and 200× treatments did not resolve oxidation of methane. While the 2× treatments did not meet the sensitivity threshold for the method (Uhlig and Loose, 2017a), the 200× short treatments were likely just about to leave the lag phase when the experiments were stopped. A lag phase of 6 days was observed for the long-incubation 200× samples, in which the microbial community possibly shifted toward an abundance of MOB that was large enough to cause detectable methane oxidation. To facilitate comparisons between treatments, incubation duration should be kept constant in future studies.
The increase in methane concentration in treatment IMB 0.2× (10 days incubation) is surprising since experiments were performed under aerobic conditions. Since the seawater was not pre-filtered through a larger pore-size filter, which would exclude larger particles but allow bacterial cells to pass, production of methane in microanoxic zones (de Angelis and Lee, 1994; Oremland, 1979) should be considered. Furthermore, several studies suggested pathways for methane production in oxygenated marine systems from methylated compounds or dissolved organic matter (Damm et al., 2010; Florez-Leiva et al., 2010; Karl et al., 2008; Repeta et al., 2016). The methane production rate of 0.06 nmol L−1 d−1 observed in our study is 2 to 6 orders of magnitude lower than previously published methane production rates under aerobic conditions (Damm et al., 2010; Karl et al., 2008). In addition to biological processes, we cannot rule out an abiotic effect leading to the increased methane concentrations, since our experimental setup did not include a killed control at the same methane concentration.
4.3 Abundances of MOB and non-MOB methylotrophs control the methane oxidation potential
We found a strong linear correlation between the net oxidation rate constant (kox) and the relative abundance of 16S MOB sequences (Spearman rank order coefficient ρs= 0.79, p = 0.006; Fig. 7a, Table 5). This strong correlation is confirmed when correlating against the total abundance or DESeq2 normalized abundance of 16S MOB sequences (Table 5). The correlation to kox is even stronger for the absolute abundance of pmoA sequences retrieved from the respective datasets (ρs= 0.86, p = 0.006; Fig. 7b). This presentation of a direct and statistically significant linear relationship is the first to our knowledge. It agrees with other qualitative reports of positive correlations between methane oxidation rates and abundance of pmoA or MOB 16S rRNA genes determined using a variety of methods – quantitative PCR, FISH, or sequencing – for marine water column and lake sediments (Crespo-Medina et al., 2014; Deutzmann et al., 2011; Rahalkar et al., 2009; Steinle et al., 2015). Future application of marine-specific pmoA primers may further improve this correlation (Tavormina et al., 2008).
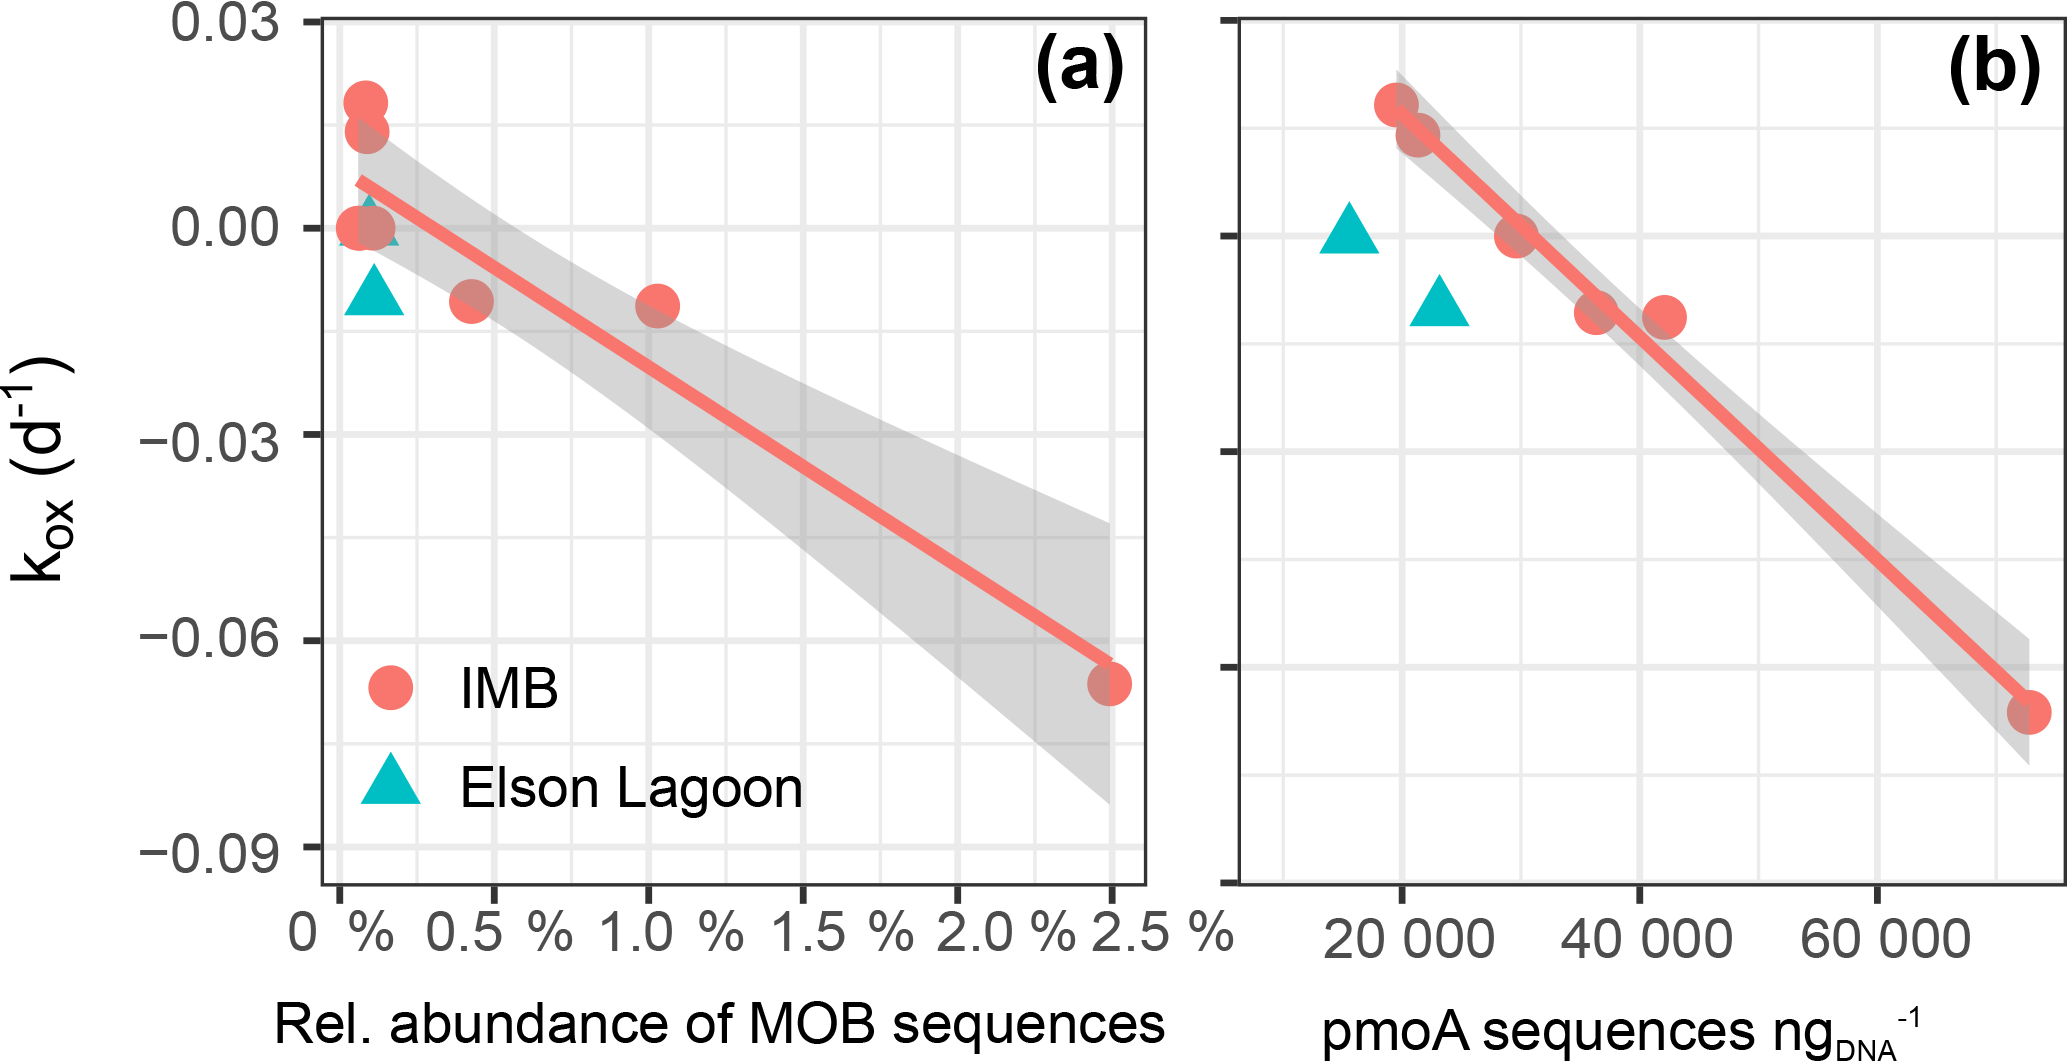
Figure 7Correlation between net oxidation rate constant (kox) and the relative abundance of sequences in 16S-MOB-OTUs, R 0.84 (a) and number of pmoA sequences with R 0.85 (b). For correlation to the number of total methylotroph OTUs (which includes MOB and non-MOB methylotrophs in total 16S) R 0.81. The gray shaded area shows the 95 % confidence interval of the correlation.
Table 5Spearman rank order correlations coefficients (ρS) of kox vs. the number of sequences of pmoA, MOB and non-MOB methylotrophs, and candidate OTUs. Candidate OTUs are OTUs that were differentially more abundant in 10× and 200× incubated samples.
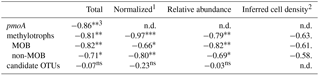
1Normalized to total abundance of reads using the DESeq2 package. 2Inferred cell density was calculated from relative abundance and flow cytometry cell counts, weighted for copy number of 16S for respective OTUs. 3Significance levels: 0 '' 0.001 '' 0.01 '*' 0.05 '.' 0.1 'ns' 1.
Cell-specific net oxidation rates in our study (3.2–7.5 fmol cell−1 h−1) were relatively constant between treatments. They are 2 orders of magnitude higher than reported for subarctic seawater (Steinle et al., 2016). Since the cell-specific rates only span a narrow range, the ultimate control on the methane oxidation potential is the number of MOB, as reported in previous studies (Crespo-Medina et al., 2014; Kessler et al., 2011; Steinle et al., 2015).
Despite the long incubation time in our experiments and the fact that methane was the only added source of carbon, the relative abundance of MOB determined from 16S reads was low (< 2.5 %, Table 4). Other studies of natural or man-made gas or oil spills, with dissolved methane concentrations comparably high to our 10× and 200× treatments, reported maximal values of 8 to 34 % of MOB (Crespo-Medina et al., 2014; Kessler et al., 2011; Steinle et al., 2015, 2016). Surprisingly, relative sequence abundances of MOB in the natural seawater communities were higher than in the incubations except for the 200× treatment (Table 4). Inferred absolute MOB numbers were higher in 10× and 200× incubations than in situ (Fig. 5b). In contrast, absolute MOB numbers in 0.2× and 2× incubations were very similar to in situ abundances, indicating that either the provided methane concentration was too low or the incubation time too short to stimulate MOB growth.
It is puzzling why the fraction of methane oxidizers in the bacterial community did not increase above the observed low percentages although the cell-specific oxidation rates were high and sufficient methane was available, particularly in the 10× and 200× treatments. Oxygen and methane can be ruled out as limiting factors, since both were abundant. Copper, which is essential for expression of particulate methane monooxygenase, can restrict MOB growth (Avdeeva and Gvozdev, 2017; Zhivotchenko et al., 1995). In the absence of copper, many MOB express a copper-independent soluble methane monooxygenase (Hakemian and Rosenzweig, 2007). Since we neither determined copper concentrations nor the expression of particulate and soluble methane monooxygenase, we cannot exclude that copper was limiting in our study. Further, the low relative abundance of MOB sequences could be due to competition with other bacterial taxa for other macro- or micronutrients. In the absence of other added C substrates, these other taxa could have utilized the initial pool of dissolved organic carbon (DOC). DOC concentration is about 68 µM carbon in the southern Chukchi Sea (Tanaka et al., 2016), which is in the same range as the amount of consumed methane carbon in the 200× treatments and 2 orders of magnitude higher than the consumed carbon in the 10× treatments.
As a result of the low MOB abundances, the potential of the microbial community to mitigate release of dissolved methane to the atmosphere by oxidation is small. For example, for methane concentrations in the Laptev Sea area, the rates observed in this study would result in 0.2 % consumption during the ice-covered period. This supports the results from a previous study for the Beaufort Sea, where 1 to 2 % of dissolved methane was calculated to be oxidized (Lorenson et al., 2016).
4.4 Structure of the methane degrading microbial community
This first study based on 16S MiSeq sequencing of methane-oxidizing seawater communities in the Arctic provides a broader view of the community structure than approaches with FISH and DGGE. The dominance of γ-Proteobacteria MOB in our natural and incubated seawater samples agrees with previous records of MOB diversity for polar and subpolar waters (Mau et al., 2013; Steinle et al., 2015; Verdugo et al., 2016). In addition, non-methane-utilizing methylotrophs were present in all of our samples. The relative read abundance of non-MOB methylotrophs were, similar to MOB, tightly correlated to kox, and the same correlation holds for the relative abundance of total methylotrophs (MOB plus non-MOB). In contrast, the correlation between OTUs that were differentially more abundant in the incubated samples and kox was weak (Table 5). This points toward a possible link between the MOB and non-MOB in this methane-oxidizing microbial community, in which non-MOB methylotrophs might play a role for community methane oxidation, whereas the OTUs that were differentially more abundant are not directly linked to methane oxidation.
Methylophilaceae, the most abundant non-MOB methylotroph in our experiments, have been found to be abundant in sediment methane-oxidizing communities in lakes and marine systems (Beck et al., 2013; Redmond et al., 2010). Possible cooperative behavior between methanotrophs (Methylococcaceae) and non-MOB methylotrophs (Methylophilaceae) was suggested (Beck et al., 2013), in which the latter cross-feeds on intermediate metabolic products of the MOB, i.e., methanol, and can even positively alter the metabolism of the MOB toward methane assimilation (Krause et al., 2017).
To test if the non-methane MOB could be supported by the intermediate substrates produced by MOB, we calculated a budget between the methane carbon assimilated by the growing microbial population (), and the cell carbon gained during growth (Ccell−growth) (Fig. 8). We assumed (i) a cellular carbon content of 150 fg for exponentially growing bacterial cells (Vrede et al., 2002) and (ii) that about one-third of consumed CH4 carbon is assimilated, with the remaining two-thirds respired to CO2 (Bastviken et al., 2003; Roslev et al., 1997). exceeds MOB-Ccell−growth by a factor of 9 to 17, indicating that some of the was available for secondary consumption by non-MOB. The entire methylotrophic community (MOB + non-MOB methylotroph) growth can also be explained solely by , supporting the possible link of non-MOB methylotrophs to methane consumption. In contrast, only about 0.1 % of the total community growth could be supported by in the 10× treatment and 15 % in the 200× treatment. The remaining cell growth, e.g., of the differentially more abundant OTUs, must have been supported by other carbon sources, such as initially available DOC.
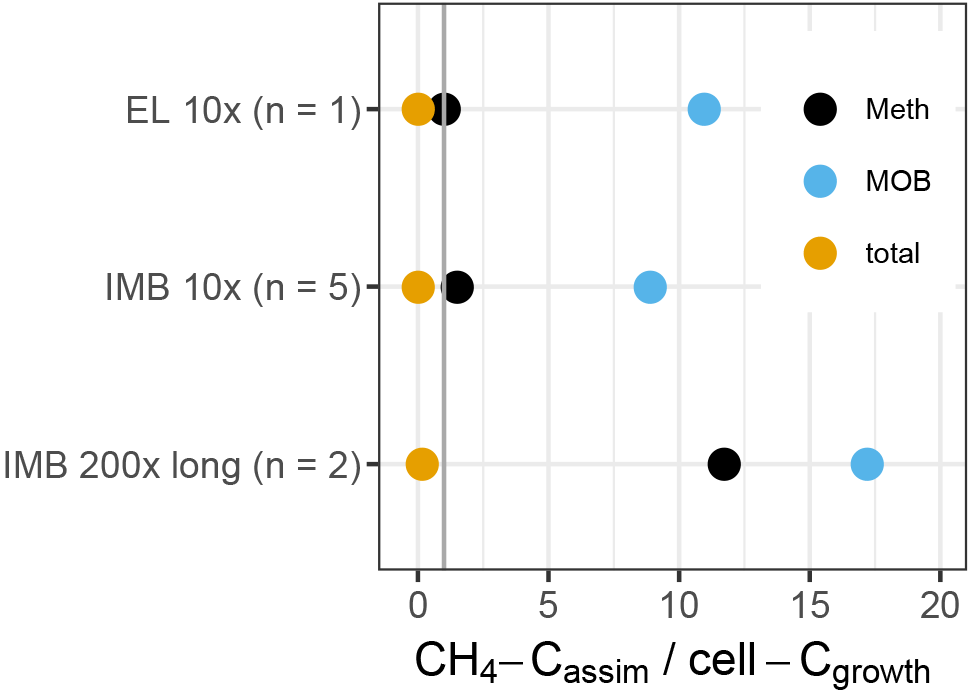
Figure 8Ratio of methane-carbon assimilated (CH4-Cassim) to cell-C gained during growth (cell-Cgrowth), based on flow cytometric cell counts (total) or inferred cell numbers (Meth, MOB). The standard deviation between replicates was 10 to 20 %. The vertical line indicates a ratio of 1. Above 1, the entire cell gain can be explained by the assimilated CH4.
4.5 MOB and methylotrophs in sea ice
The two sea-ice cores analyzed in this study give a first insight into the possible role of methane oxidizers in sea ice. In contrast to seawater samples, MOB found in sea ice samples were mostly α-Proteobacteria. The relative sequence read abundance of MOB in the ice was very low (maximal 0.1 %), pointing to an overall low contribution of methane oxidation inside sea ice. The highest relative abundances of MOB were found in the top-most ice sections in both ice cores (Fig. 5a). This coincided with the highest methane concentration in the case of IC2, whereas the top-most section of IC1 had the second smallest concentration of methane in this ice core (Fig. 2e). Relative abundances of MOB in the inner and bottom sections of the ice cores were even lower, with 0 to 0.02 % only.
The top-most section of IC1 and the biologically rich bottom section of IC2 had the highest relative abundances of β-Proteobacteria Methylophilaceae, a non-MOB methylotroph. Recently identified as DMS degraders (Eyice et al., 2015), Methylophilaceae might use DMS, a methylated compound abundant in sea ice, as substrate (Kirst et al., 1991).
We studied the structure and methane oxidation potential of microbial communities from Arctic seawater and sea ice. The natural seawater community had relative sequence abundances of MOB of 0.24 % ± 0.09 % and was dominated by γ-Proteobacteria MOB, while α-Proteobacteria MOB dominated in sea ice with maximal fractions of ≤ 0.1 % in the surface of the sea ice. In seawater incubations under different methane concentrations, the overall relative abundance of methane oxidizers (MOB) was low, with a maximum of 2.5 % and the dominant MOB types were γ-Proteobacteria. A tight correlation between the rate constant of methane oxidation and relative abundances of MOB and non-MOB methylotrophs (Fig. 7, Table 5) suggests that the abundance of MOB is a control on the magnitude of methane oxidation. It also suggests that non-MOB methylotrophs might play a role in methane oxidation. The reasons for low MOB abundance, despite ample methane availability, along with the role of methylotrophs in methane oxidation are both open questions.
Higher methane concentrations in the sea ice compared to the underlying water and an offset in stable isotope ratios suggest that either fractionation and solute concentration occurred during freeze-up or different microbial processes took place within the ice and water. Possible causes explaining this observation include (i) microbial production of methane, even within the ice (Damm et al., 2015), and (ii) microbial oxidation in the water column and at lower rates in sea ice. To address these hypotheses, future studies should directly compare both sea ice and water, particularly during ice freeze-up, and involve investigation of the microbial processes.
Raw sequence reads are available at NCBI under accession numbers SRP144338 (V4-V5) and SRP144333 (pmoA). Physicochemical parameters including methane concentration and isotope ratios were archived at PANGAEA and can be accessed via DOIs https://doi.pangaea.de/10.1594/PANGAEA.889726 (Uhlig and Loose, 2018) and https://doi.org/10.1594/PANGAEA.874893 (Uhlig and Loose, 2017b).
The supplement related to this article is available online at: https://doi.org/10.5194/bg-15-3311-2018-supplement.
The authors declare that they have no conflict of interest.
This work was supported by the American Chemical Society, Petroleum Research
Fund (PRF no. 54473-DNI2). Part of this research is based upon work
conducted using the NSF EPSCoR Marine Science Research Facility and the
Rhode Island NSF EPSCoR Genomics and Sequencing Center, which are supported
in part by the National Science Foundation under EPSCoR grants nos. 0554548
and EPS-1004057. We thank Clarisse Sullivan for support with preparations
for fieldwork and Rodrigue Spinette for help with flow cytometry as well as
the nutrient measurements. We thank David C. Smith and Lucie Maranda for
lending equipment and discussing concepts and experimental procedures. We
thank Hajo Eicken, Joshua Jones, and Andy Mahony from the University Alaska
Fairbanks for discussing the local oceanographic conditions.
Edited by: Helge Niemann
Reviewed by: two anonymous referees
Andrews, S.: FastQC: a quality control tool for high throughput sequence data, available at: http://www.bioinformatics.babraham.ac.uk/projects/fastqc (last access: 29 September 2017), 2010.
Avdeeva, L. and Gvozdev, R.: Effect of gopper goncentration on the growth of Methylococcus gapsulatus (Strain Ì), Chem. J. Mold., 12, 110–114, https://doi.org/10.19261/cjm.2017.404, 2017.
Barnes, R. O. and Goldberg, E. D.: Methane production and consumption in anoxic marine sediments, Geology, 4, 297, https://doi.org/10.1130/0091-7613(1976)4<297:MPACIA>2.0.CO;2, 1976.
Bastviken, D., Ejlertsson, J., Sundh, I., and Tranvik, L.: Methane as a Source of Carbon and Energy for Lake Pelagic Food Webs, Ecology, 84, 969–981, 2003.
Beck, D. A. C., Kalyuzhnaya, M. G., Malfatti, S., Tringe, S., Glavina del Rio, T., Ivanova, N., Lidstrom, M., and Chistoserdova, L.: A metagenomic insight into freshwater methane-utilizing communities and evidence for cooperation between the Methylococcaceae and the Methylophilaceae, PeerJ., 1, e23, https://doi.org/10.7717/peerj.23, 2013.
Boetius, A. and Wenzhöfer, F.: Seafloor oxygen consumption fuelled by methane from cold seeps, Nat. Geosci., 6, 725–734, https://doi.org/10.1038/ngeo1926, 2013.
Coleman, D. D., Risatti, J. B., and Schoell, M.: Fractionation of carbon and hydrogen isotopes by methane-oxidizing bacteria, Geochim. Cosmochim. Acta, 45, 1033–1037, https://doi.org/10.1016/0016-7037(81)90129-0, 1981.
Cowen, J. P., Wen, X., and Popp, B. N.: Methane in aging hydrothermal plumes, Geochim. Cosmochim. Acta, 66, 3563–3571, https://doi.org/10.1016/S0016-7037(02)00975-4, 2002.
Cox, G. F. N. and Weeks, W. F.: Equations for determining the gas and brine volumes in sea-ice samples, J. Glaciol., 29, 306–316, 1983.
Crespo-Medina, M., Meile, C. D., Hunter, K. S., Diercks, A.-R., Asper, V. L., Orphan, V. J., Tavormina, P. L., Nigro, L. M., Battles, J. J., Chanton, J. P., Shiller, A. M., Joung, D.-J., Amon, R. M. W., Bracco, A., Montoya, J. P., Villareal, T. A., Wood, A. M., and Joye, S. B.: The rise and fall of methanotrophy following a deepwater oil-well blowout, Nat. Geosci., 7, 423–427, https://doi.org/10.1038/ngeo2156, 2014.
Damm, E. and Budéus, G.: Fate of vent-derived methane in seawater above the Håkon Mosby mud volcano (Norwegian Sea), Mar. Chem., 82, 1–11, https://doi.org/10.1016/S0304-4203(03)00031-8, 2003.
Damm, E., Mackensen, A., Budéus, G., Faber, E., and Hanfland, C.: Pathways of methane in seawater: Plume spreading in an Arctic shelf environment (SW-Spitsbergen), Cont. Shelf Res., 25, 1453–1472, https://doi.org/10.1016/j.csr.2005.03.003, 2005.
Damm, E., Kiene, R. P., Schwarz, J., Falck, E., and Dieckmann, G.: Methane cycling in Arctic shelf water and its relationship with phytoplankton biomass and DMSP, Mar. Chem., 109, 45–59, https://doi.org/10.1016/j.marchem.2007.12.003, 2008.
Damm, E., Helmke, E., Thoms, S., Schauer, U., Nöthig, E., Bakker, K., and Kiene, R. P.: Methane production in aerobic oligotrophic surface water in the central Arctic Ocean, Biogeosciences, 7, 1099–1108, https://doi.org/10.5194/bg-7-1099-2010, 2010.
Damm, E., Rudels, B., Schauer, U., Mau, S., and Dieckmann, G.: Methane exess in Arctic surface water- triggered by sea ice formation and melting, Sci. Rep., 16, 16179, https://doi.org/10.1038/srep16179, 2015.
de Angelis, M. A. and Lee, C.: Methane production during zooplankton grazing on marine phytoplankton, Limnol. Oceanogr., 39, 1298–1308, https://doi.org/10.4319/lo.1994.39.6.1298, 1994.
Deutzmann, J. S., Worner, S., and Schink, B.: Activity and Diversity of Methanotrophic Bacteria at Methane Seeps in Eastern Lake Constance Sediments, Appl. Environ. Microbiol., 77, 2573–2581, https://doi.org/10.1128/AEM.02776-10, 2011.
Dunfield, P. F., Yuryev, A., Senin, P., Smirnova, A. V., Stott, M. B., Hou, S., Ly, B., Saw, J. H., Zhou, Z., Ren, Y., Wang, J., Mountain, B. W., Crowe, M. A., Weatherby, T. M., Bodelier, P. L. E., Liesack, W., Feng, L., Wang, L., and Alam, M.: Methane oxidation by an extremely acidophilic bacterium of the phylum Verrucomicrobia, Nature, 450, 879–882, https://doi.org/10.1038/nature06411, 2007.
Edgar, R. C., Haas, B. J., Clemente, J. C., Quince, C., and Knight, R.: UCHIME improves sensitivity and speed of chimera detection, Bioinformatics, 27, 2194–2200, https://doi.org/10.1093/bioinformatics/btr381, 2011.
Eronen-Rasimus, E., Luhtanen, A.-M., Rintala, J.-M., Delille, B., Dieckmann, G., Karkman, A., and Tison, J.-L.: An active bacterial community linked to high chl-a concentrations in Antarctic winter-pack ice and evidence for the development of an anaerobic sea-ice bacterial community, ISME J., 11, 2345–2355, https://doi.org/10.1038/ismej.2017.96, 2017.
Etminan, M., Myhre, G., Highwood, E. J., and Shine, K. P.: Radiative forcing of carbon dioxide, methane, and nitrous oxide: A significant revision of the methane radiative forcing: Greenhouse Gas Radiative Forcing, Geophys. Res. Lett., 43, 12,614–12,623, https://doi.org/10.1002/2016GL071930, 2016.
Eyice, Ö., Namura, M., Chen, Y., Mead, A., Samavedam, S., and Schäfer, H.: SIP metagenomics identifies uncultivated Methylophilaceae as dimethylsulphide degrading bacteria in soil and lake sediment, ISME J., 9, 2336–2348, https://doi.org/10.1038/ismej.2015.37, 2015.
Fish, J. A., Chai, B., Wang, Q., Sun, Y., Brown, C. T., Tiedje, J. M., and Cole, J. R.: FunGene: the functional gene pipeline and repository, Front. Microbiol., 4, 291, https://doi.org/10.3389/fmicb.2013.00291, 2013.
Florez-Leiva, L., Tarifeño, E., Cornejo, M., Kiene, R., and Farías, L.: High production of nitrous oxide (N2O), methane (CH4 and dimethylsulphoniopropionate (DMSP) in a massive marine phytoplankton culture, Biogeosciences Discuss., 7, 6705–6723, https://doi.org/10.5194/bgd-7-6705-2010, 2010.
Formolo, M.: The microbial production of methane and other volatile hydrocarbons, in: Handbook of Hydrocarbon and Lipid Microbiology, edited by: Timmis, K. N., Springer Berlin Heidelberg, Berlin, Heidelberg, 113–126, available at: http://link.springer.com/10.1007/978-3-540-77587-4_6 (last access: 5 January 2017), 2010.
Gentz, T., Damm, E., Schneider von Deimling, J., Mau, S., McGinnis, D. F., and Schlüter, M.: A water column study of methane around gas flares located at the West Spitsbergen continental margin, Cont. Shelf Res., 72, 107–118, https://doi.org/10.1016/j.csr.2013.07.013, 2014.
Golden, K. M., Ackley, S. F., and Lytle, V. I.: The Percolation Phase Transition in Sea Ice, Science, 282, 2238–2241, https://doi.org/10.1126/science.282.5397.2238, 1998.
Grant, N. J. and Whiticar, M. J.: Stable carbon isotopic evidence for methane oxidation in plumes above Hydrate Ridge, Cascadia Oregon Margin., Glob. Biogeochem. Cycles, 16, 71–1–71–13, https://doi.org/10.1029/2001GB001851, 2002.
Hakemian, A. S. and Rosenzweig, A. C.: The Biochemistry of Methane Oxidation, Annu. Rev. Biochem., 76, 223–241, https://doi.org/10.1146/annurev.biochem.76.061505.175355, 2007.
Hansman, R. L., Thurber, A. R., Levin, L. A., and Aluwihare, L. I.: Methane fates in the benthos and water column at cold seep sites along the continental margin of Central and North America, Deep Sea Res. Part Oceanogr. Res. Pap., 120, 122–131, https://doi.org/10.1016/j.dsr.2016.12.016, 2017.
Hanson, R. S. and Hanson, T. E.: Methanotrophic bacteria, Microbiol. Rev., 60, 439–471, 1996.
Heeschen, K. U., Keir, R. S., Rehder, G., Klatt, O., and Suess, E.: Methane dynamics in the Weddell Sea determined via stable isotope ratios and CFC-11, Glob. Biogeochem. Cycles, 18, GB2012, https://doi.org/10.1029/2003GB002151, 2004.
Holmes, A. J., Roslev, P., McDonald, I. R., Iversen, N., Henriksen, K., and Murrell, J. C.: Characterization of Methanotrophic Bacterial Populations in Soils Showing Atmospheric Methane Uptake, Appl. Environ. Microbiol., 65, 3312–3318, 1999.
Hutchens, E., Radajewski, S., Dumont, M. G., McDonald, I. R., and Murrell, J. C.: Analysis of methanotrophic bacteria in Movile Cave by stable isotope probing: Methanotrophs in Movile Cave, Environ. Microbiol., 6, 111–120, https://doi.org/10.1046/j.1462-2920.2003.00543.x, 2003.
IPCC: Climate Change 2014: Mitigation of Climate Change. Contribution of Working Group III to the Fifth Assessment Report of the Intergovernmental Panel on Climate Change, Edenhofer, O., Pichs-Madruga, R., Sokona, Y., Farahani, E., Kadner, S., Seyboth, K., Adler, A., Baum, I., Brunner, S., Eickemeier, P., Kriemann, B., Savolainen, J., Schlömer, S., von Stechow, C., Zwickel, T., Minx, J. C. (Eds.), Cambridge University Press, Cambridge, UK and New York, NY, USA., 2014.
Jensen, S., Neufeld, J. D., Birkeland, N.-K., Hovland, M., and Murrell, J. C.: Methane assimilation and trophic interactions with marine Methylomicrobium in deep-water coral reef sediment off the coast of Norway: Deep-water coral reef methanotrophy, FEMS Microbiol. Ecol., 66, 320–330, https://doi.org/10.1111/j.1574-6941.2008.00575.x, 2008.
Karl, D. M., Beversdorf, L., Björkman, K. M., Church, M. J., Martinez, A., and Delong, E. F.: Aerobic production of methane in the sea, Nat. Geosci., 1, 473–478, 2008.
Katoh, K. and Standley, D. M.: MAFFT Multiple Sequence Alignment Software Version 7: Improvements in Performance and Usability, Mol. Biol. Evol., 30, 772–780, https://doi.org/10.1093/molbev/mst010, 2013.
Keir, R. S., Schmale, O., Seifert, R., and Sültenfuß, J.: Isotope fractionation and mixing in methane plumes from the Logatchev hydrothermal field, Geochem. Geophys. Geosy., 10, Q05005, https://doi.org/10.1029/2009GC002403, 2009.
Kessler, J. D., Valentine, D. L., Redmond, M. C., Du, M., Chan, E. W., Mendes, S. D., Quiroz, E. W., Villanueva, C. J., Shusta, S. S., Werra, L. M., Yvon-Lewis, S. A., and Weber, T. C.: A Persistent Oxygen Anomaly Reveals the Fate of Spilled Methane in the Deep Gulf of Mexico, Science, 331, 312–315, https://doi.org/10.1126/science.1199697, 2011.
Kirst, G. O., Thiel, C., Wolff, H., Nothnagel, J., Wanzek, M., and Ulmke, R.: Dimethylsulfoniopropionate (DMSP) in ice-algae and its possible biological role, Mar. Chem., 35, 381–388, https://doi.org/10.1016/S0304-4203(09)90030-5, 1991.
Knief, C.: Diversity and Habitat Preferences of Cultivated and Uncultivated Aerobic Methanotrophic Bacteria Evaluated Based on pmoA as Molecular Marker, Front. Microbiol., 6, 1346, https://doi.org/10.3389/fmicb.2015.01346, 2015.
Knittel, K. and Boetius, A.: Anaerobic oxidation of methane: Progress with an unknown process, Annu. Rev. Microbiol., 63, 311–334, https://doi.org/10.1146/annurev.micro.61.080706.093130, 2009.
Krause, S. M. B., Johnson, T., Samadhi Karunaratne, Y., Fu, Y., Beck, D. A. C., Chistoserdova, L., and Lidstrom, M. E.: Lanthanide-dependent cross-feeding of methane-derived carbon is linked by microbial community interactions, Proc. Natl. Acad. Sci., 114, 358–363, https://doi.org/10.1073/pnas.1619871114, 2017.
Kvenvolden, K. A. and Rogers, B. W.: Gaia's breath – global methane exhalations, Mar. Pet. Geol., 22, 579–590, https://doi.org/10.1016/j.marpetgeo.2004.08.004, 2005.
Larkin, M. A., Blackshields, G., Brown, N. P., Chenna, R., McGettigan, P. A., McWilliam, H., Valentin, F., Wallace, I. M., Wilm, A., Lopez, R., Thompson, J. D., Gibson, T. J., and Higgins, D. G.: Clustal W and Clustal X version 2.0, Bioinformatics, 23, 2947–2948, https://doi.org/10.1093/bioinformatics/btm404, 2007.
Lecher, A. L., Kessler, J., Sparrow, K., Garcia-Tigreros Kodovska, F., Dimova, N., Murray, J., Tulaczyk, S., and Paytan, A.: Methane transport through submarine groundwater discharge to the North Pacific and Arctic Ocean at two Alaskan sites, Limnol. Oceanogr., 61, S344–S355, https://doi.org/10.1002/lno.10118, 2016.
Leifer, I. and Patro, R. K.: The bubble mechanism for methane transport from the shallow sea bed to the surface: A review and sensitivity study, Cont. Shelf Res., 22, 2409–2428, https://doi.org/10.1016/S0278-4343(02)00065-1, 2002.
Leonte, M., Kessler, J. D., Kellermann, M. Y., Arrington, E. C., Valentine, D. L., and Sylva, S. P.: Rapid rates of aerobic methane oxidation at the feather edge of gas hydrate stability in the waters of Hudson Canyon, US Atlantic Margin, Geochim. Cosmochim. Acta, 204, 375–387, https://doi.org/10.1016/j.gca.2017.01.009, 2017.
Loose, B., Schlosser, P., Perovich, D., Ringelberg, D., Ho, D. T., Takahashi, T., Richter-Menge, J., Reynolds, C. M., Mcgillis, W. R., and Tison, J.-L.: Gas diffusion through columnar laboratory sea ice: implications for mixed-layer ventilation of CO2 in the seasonal ice zone., Tellus B, 63, 23–39, https://doi.org/10.1111/j.1600-0889.2010.00506.x, 2011.
Lorenson, T. D. and Kvenvolden, K. A.: Methane in coastal seawater, sea ice and bottom sediments, Beaufort Sea, Alaska: U.S. Geological Survey Open-File Report 95–70, US Geological Survey, Menlo Park, CA, 1995.
Lorenson, T. D., Greinert, J., and Coffin, R. B.: Dissolved methane in the Beaufort Sea and the Arctic Ocean, 1992–2009; sources and atmospheric flux: Dissolved methane in the Beaufort Sea and the Arctic Ocean, Limnol. Oceanogr., 61, S300–S323, https://doi.org/10.1002/lno.10457, 2016.
Love, M. I., Huber, W., and Anders, S.: Moderated estimation of fold change and dispersion for RNA-seq data with DESeq2, Genome Biol., 15, 550, https://doi.org/10.1186/s13059-014-0550-8, 2014.
Lüke, C. and Frenzel, P.: Potential of pmoA Amplicon Pyrosequencing for Methanotroph Diversity Studies, Appl. Environ. Microbiol., 77, 6305–6309, https://doi.org/10.1128/AEM.05355-11, 2011.
Lyew, D. and Guiot, S.: Effects of aeration and organic loading rates on degradation of trichloroethylene in a methanogenic-methanotrophic coupled reactor, Appl. Microbiol. Biotechnol., 61, 206–213, https://doi.org/10.1007/s00253-003-1224-8, 2003.
Magen, C., Lapham, L. L., Pohlman, J. W., Marshall, K., Bosman, S., Casso, M., and Chanton, J. P.: A simple headspace equilibration method for measuring dissolved methane, Limnol. Oceanogr. Methods, 12, 637–650, https://doi.org/10.4319/lom.2014.12.637, 2014.
Mau, S., Blees, J., Helmke, E., Niemann, H., and Damm, E.: Vertical distribution of methane oxidation and methanotrophic response to elevated methane concentrations in stratified waters of the Arctic fjord Storfjorden (Svalbard, Norway), Biogeosciences, 10, 6267–6278, https://doi.org/10.5194/bg-10-6267-2013, 2013.
Mau, S., Römer, M., Torres, M. E., Bussmann, I., Pape, T., Damm, E., Geprägs, P., Wintersteller, P., Hsu, C.-W., Loher, M., and Bohrmann, G.: Widespread methane seepage along the continental margin off Svalbard – from Bjørnøya to Kongsfjorden, Sci. Rep., 7, 42997, https://doi.org/10.1038/srep42997, 2017.
McDonald, I. R., Bodrossy, L., Chen, Y., and Murrell, J. C.: Molecular Ecology Techniques for the Study of Aerobic Methanotrophs, Appl. Environ. Microbiol., 74, 1305–1315, https://doi.org/10.1128/AEM.02233-07, 2008.
McKinney, C. R., McCrea, J. M., Epstein, S., Allen, H. A., and Urey, H. C.: Improvements in mass spectrometers for the measurement of small differences in isotope abundance ratios, Rev. Sci. Instrum., 21, 724, https://doi.org/10.1063/1.1745698, 1950.
McMurdie, P. J. and Holmes, S.: phyloseq: An R Package for Reproducible Interactive Analysis and Graphics of Microbiome Census Data, PLoS ONE, 8, e61217, https://doi.org/10.1371/journal.pone.0061217, 2013.
Murrell, J. C.: The aerobic methane oxidizing bacteria (Methanotrophs), in: Handbook of Hydrocarbon and Lipid Microbiology, edited by: Timmis, K. N., Springer Berlin Heidelberg, Berlin, Heidelberg, 1953–1966, available at: http://link.springer.com/10.1007/978-3-540-77587-4_143 (last access: 5 January 2017), 2010.
Myhre, C. L., Ferré, B., Platt, S. M., Silyakova, A., Hermansen, O., Allen, G., Pisso, I., Schmidbauer, N., Stohl, A., Pitt, J., Jansson, P., Greinert, J., Percival, C., Fjaeraa, A. M., O'Shea, S. J., Gallagher, M., Le Breton, M., Bower, K. N., Bauguitte, S. J. B., Dalsøren, S., Vadakkepuliyambatta, S., Fisher, R. E., Nisbet, E. G., Lowry, D., Myhre, G., Pyle, J. A., Cain, M., and Mienert, J.: Extensive release of methane from Arctic seabed west of Svalbard during summer 2014 does not influence the atmosphere: CH4 From Arctic Ocean to the Atmosphere, Geophys. Res. Lett., 43, 4624–4631, https://doi.org/10.1002/2016GL068999, 2016.
Nelson, M. C., Morrison, H. G., Benjamino, J., Grim, S. L., and Graf, J.: Analysis, Optimization and Verification of Illumina-Generated 16S rRNA Gene Amplicon Surveys, PLoS ONE, 9, e94249, https://doi.org/10.1371/journal.pone.0094249, 2014.
Oksanen, J., Blanchet, F. G., Friendly, M., Kindt, R., Legendre, P., McGlinn, D., Minchin, P. R., O'Hara, R. B., Simpson, G. L., Solymos, P., Stevens, M. H. H., Szoecs, E., and Wagner, H.: vegan: Community Ecology Package, available at: https://CRAN.R-project.org/package=vegan (last access: 27 May 2018), 2017.
Oremland, R. S.: Methanogenic activity in plankton samples and fish intestines: A mechanism for in situ methanogenesis in oceanic surface waters, Limnol. Oceanogr., 24, 1136–1141, https://doi.org/10.4319/lo.1979.24.6.1136, 1979.
Overduin, P. P., Westermann, S., Yoshikawa, K., Haberlau, T., Romanovsky, V., and Wetterich, S.: Geoelectric observations of the degradation of nearshore submarine permafrost at Barrow (Alaskan Beaufort Sea), J. Geophys. Res. Earth Surf., 117, F02004, https://doi.org/10.1029/2011JF002088, 2012.
Pol, A., Heijmans, K., Harhangi, H. R., Tedesco, D., Jetten, M. S. M., and Op den Camp, H. J. M.: Methanotrophy below pH 1 by a new Verrucomicrobia species, Nature, 450, 874–878, https://doi.org/10.1038/nature06222, 2007.
Preuss, I., Knoblauch, C., Gebert, J., and Pfeiffer, E.-M.: Improved quantification of microbial CH4 oxidation efficiency in arctic wetland soils using carbon isotope fractionation, Biogeosciences, 10, 2539–2552, https://doi.org/10.5194/bg-10-2539-2013, 2013.
Quast, C., Pruesse, E., Yilmaz, P., Gerken, J., Schweer, T., Yarza, P., Peplies, J., and Glockner, F. O.: The SILVA ribosomal RNA gene database project: improved data processing and web-based tools, Nucleic Acids Res., 41, D590–D596, https://doi.org/10.1093/nar/gks1219, 2013.
R CoreTeam: R: A language and Environment for Statistical Computing, available at: http://www.r-project.org/ (last access: 27 May 2018), 2015.
Rahalkar, M., Deutzmann, J., Schink, B. and Bussmann, I.: Abundance and Activity of Methanotrophic Bacteria in Littoral and Profundal Sediments of Lake Constance (Germany), Appl. Environ. Microbiol., 75, 119–126, https://doi.org/10.1128/AEM.01350-08, 2009.
Redmond, M. C., Valentine, D. L., and Sessions, A. L.: Identification of Novel Methane-, Ethane-, and Propane-Oxidizing Bacteria at Marine Hydrocarbon Seeps by Stable Isotope Probing, Appl. Environ. Microbiol., 76, 6412–6422, https://doi.org/10.1128/AEM.00271-10, 2010.
Reeburgh, W. S.: Methane consumption in Cariaco Trench waters and sediments, Earth Planet. Sci. Lett., 28, 337–344, https://doi.org/10.1016/0012-821X(76)90195-3, 1976.
Reeburgh, W. S.: Oceanic methane biogeochemistry, Chem. Rev., 107, 486–513, 2007.
Reeburgh, W. S., Ward, B. B., Whalen, S. C., Sandbeck, K. A., Kilpatrickt, K. A., and Kerkhof, L. J.: Black Sea methane geochemistry, Deep Sea Res. Part Oceanogr. Res. Pap., 38, S1189–S1210, https://doi.org/10.1016/S0198-0149(10)80030-5, 1991.
Repeta, D. J., Ferron, S., Sosa, O. A., Johnson, C. G., Repeta, L. D., Acker, M., DeLong, E. F., and Karl, D. M.: Marine methane paradox explained by bacterial degradation of dissolved organic matter, Nat. Geosci, 9, 884–887, 2016.
Rice, P., Longden, I., and Bleasby, A.: EMBOSS: The European Molecular Biology Open Software Suite, Trends Genet., 16, 276–277, https://doi.org/10.1016/S0168-9525(00)02024-2, 2000.
Roslev, P., Iversen, N., and Henriksen, K.: Oxidation and assimilation of atmospheric methane by soil methane oxidizers., Appl. Environ. Microbiol., 63, 874–880, 1997.
Saidi-Mehrabad, A., He, Z., Tamas, I., Sharp, C. E., Brady, A. L., Rochman, F. F., Bodrossy, L., Abell, G. C., Penner, T., Dong, X., Sensen, C. W., and Dunfield, P. F.: Methanotrophic bacteria in oilsands tailings ponds of northern Alberta, ISME J., 7, 908–921, https://doi.org/10.1038/ismej.2012.163, 2013.
Sansone, F. J., Popp, B. N., Gasc, A., Graham, A. W., and Rust, T. M.: Highly elevated methane in the eastern tropical North Pacific and associated isotopically enriched fluxes to the atmosphere, Geophys. Res. Lett., 28, 4567–4570, https://doi.org/10.1029/2001GL013460, 2001.
Saunois, M., Bousquet, P., Poulter, B., Peregon, A., Ciais, P., Canadell, J. G., Dlugokencky, E. J., Etiope, G., Bastviken, D., Houweling, S., Janssens-Maenhout, G., Tubiello, F. N., Castaldi, S., Jackson, R. B., Alexe, M., Arora, V. K., Beerling, D. J., Bergamaschi, P., Blake, D. R., Brailsford, G., Brovkin, V., Bruhwiler, L., Crevoisier, C., Crill, P., Covey, K., Curry, C., Frankenberg, C., Gedney, N., Höglund-Isaksson, L., Ishizawa, M., Ito, A., Joos, F., Kim, H.-S., Kleinen, T., Krummel, P., Lamarque, J.-F., Langenfelds, R., Locatelli, R., Machida, T., Maksyutov, S., McDonald, K. C., Marshall, J., Melton, J. R., Morino, I., Naik, V., O'Doherty, S., Parmentier, F.-J. W., Patra, P. K., Peng, C., Peng, S., Peters, G. P., Pison, I., Prigent, C., Prinn, R., Ramonet, M., Riley, W. J., Saito, M., Santini, M., Schroeder, R., Simpson, I. J., Spahni, R., Steele, P., Takizawa, A., Thornton, B. F., Tian, H., Tohjima, Y., Viovy, N., Voulgarakis, A., van Weele, M., van der Werf, G. R., Weiss, R., Wiedinmyer, C., Wilton, D. J., Wiltshire, A., Worthy, D., Wunch, D., Xu, X., Yoshida, Y., Zhang, B., Zhang, Z., and Zhu, Q.: The global methane budget 2000–2012, Earth Syst. Sci. Data, 8, 697–751, https://doi.org/10.5194/essd-8-697-2016, 2016.
Schloss, P. D., Westcott, S. L., Ryabin, T., Hall, J. R., Hartmann, M., Hollister, E. B., Lesniewski, R. A., Oakley, B. B., Parks, D. H., Robinson, C. J., Sahl, J. W., Stres, B., Thallinger, G. G., Van Horn, D. J., and Weber, C. F.: Introducing mothur: Open-Source, Platform-Independent, Community-Supported Software for Describing and Comparing Microbial Communities, Appl. Environ. Microbiol., 75, 7537–7541, https://doi.org/10.1128/AEM.01541-09, 2009.
Schmale, O., Leifer, I., Deimling, J. S. v., Stolle, C., Krause, S., Kießlich, K., Frahm, A., and Treude, T.: Bubble Transport Mechanism: Indications for a gas bubble-mediated inoculation of benthic methanotrophs into the water column, Cont. Shelf Res., 103, 70–78, https://doi.org/10.1016/j.csr.2015.04.022, 2015.
Semrau, J. D., DiSpirito, A. A., and Yoon, S.: Methanotrophs and copper, FEMS Microbiol. Rev., 34, 496–531, https://doi.org/10.1111/j.1574-6976.2010.00212.x, 2010.
Shakhova, N., Semiletov, I., Salyuk, A., Yusupov, V., Kosmach, D., and Gustafsson, Ö.: Extensive methane venting to the atmosphere from sediments of the East Siberian Arctic shelf, Science, 327, 1246–1250, https://doi.org/10.1126/science.1182221, 2010.
Steinle, L., Graves, C. A., Treude, T., Ferré, B., Biastoch, A., Bussmann, I., Berndt, C., Krastel, S., James, R. H., Behrens, E., Böning, C. W., Greinert, J., Sapart, C.-J., Scheinert, M., Sommer, S., Lehmann, M. F., and Niemann, H.: Water column methanotrophy controlled by a rapid oceanographic switch, Nat. Geosci., 8, 378–382, https://doi.org/10.1038/ngeo2420, 2015.
Steinle, L., Schmidt, M., Bryant, L., Haeckel, M., Linke, P., Sommer, S., Zopfi, J., Lehmann, M. F., Treude, T., and Niemannn, H.: Linked sediment and water-column methanotrophy at a man-made gas blowout in the North Sea: Implications for methane budgeting in seasonally stratified shallow seas: Linked sediment and water methanotrophy, Limnol. Oceanogr., 61, S367–S386, https://doi.org/10.1002/lno.10388, 2016.
Stoddard, S. F., Smith, B. J., Hein, R., Roller, B. R. K., and Schmidt, T. M.: rrnDB: improved tools for interpreting rRNA gene abundance in bacteria and archaea and a new foundation for future development, Nucleic Acids Res., 43, D593–D598, https://doi.org/10.1093/nar/gku1201, 2015.
Strong, P. J., Xie, S., and Clarke, W. P.: Methane as a Resource: Can the Methanotrophs Add Value?, Environ. Sci. Technol., 49, 4001–4018, https://doi.org/10.1021/es504242n, 2015.
Tanaka, K., Takesue, N., Nishioka, J., Kondo, Y., Ooki, A., Kuma, K., Hirawake, T., and Yamashita, Y.: The conservative behavior of dissolved organic carbon in surface waters of the southern Chukchi Sea, Arctic Ocean, during early summer, Sci. Rep., 6, 34123, https://doi.org/10.1038/srep34123, 2016.
Tavormina, P. L., Ussler, W., and Orphan, V. J.: Planktonic and Sediment-Associated Aerobic Methanotrophs in Two Seep Systems along the North American Margin, Appl. Environ. Microbiol., 74, 3985–3995, https://doi.org/10.1128/AEM.00069-08, 2008.
Thomas, D. N. and Dieckmann, G. S.: Antarctic Sea Ice–a Habitat for Extremophiles, Science, 295, 641–644, https://doi.org/10.1126/science.1063391, 2002.
Tsunogai, U., Yoshida, N., Ishibashi, J., and Gamo, T.: Carbon isotopic distribution of methane in deep-sea hydrothermal plume, Myojin Knoll Caldera, Izu-Bonin arc: implications for microbial methane oxidation in the oceans and applications to heat flux estimation, Geochim. Cosmochim. Acta, 64, 2439–2452, https://doi.org/10.1016/S0016-7037(00)00374-4, 2000.
Uhlig, C. and Loose, B.: Using stable isotopes and gas concentrations for independent constraints on microbial methane oxidation at Arctic Ocean temperatures: Methane oxidation rates from stable isotopes, Limnol. Oceanogr. Methods, 15, 737–751, https://doi.org/10.1002/lom3.10199, 2017a.
Uhlig, C. and Loose, B.: Methane oxidation in Arctic seawater, Utqiagvik, Alaska. PANGAEA, https://doi.org/10.1594/PANGAEA.874893, 2017b.
Uhlig, C. and Loose, B.: Methane concentration and stable isotope ratios in seawater and sea ice, Utqiagvik shelf, Alaska, PANGAEA, available at: https://doi.pangaea.de/10.1594/PANGAEA.889726 (last access: 27 May 2018), 2018.
Valentine, D. L., Blanton, D. C., Reeburgh, W. S., and Kastner, M.: Water column methane oxidation adjacent to an area of active hydrate dissociation, Eel river Basin, Geochim. Cosmochim. Acta, 65, 2633–2640, https://doi.org/10.1016/S0016-7037(01)00625-1, 2001.
Valentine, D. L., Kessler, J. D., Redmond, M. C., Mendes, S. D., Heintz, M. B., Farwell, C., Hu, L., Kinnaman, F. S., Yvon-Lewis, S., Du, M., Chan, E. W., Tigreros, F. G., and Villanueva, C. J.: Propane respiration jump-starts microbial response to a deep oil spill, Science, 330, 208–211, https://doi.org/10.1126/science.1196830, 2010.
Verdugo, J., Damm, E., Snoeijs, P., Díez, B., and Farías, L.: Climate relevant trace gases (N2O and CH4) in the Eurasian Basin (Arctic Ocean), Deep Sea Res. Part Oceanogr. Res. Pap., 117, 84–94, https://doi.org/10.1016/j.dsr.2016.08.016, 2016.
Vrede, K., Heldal, M., Norland, S., and Bratbak, G.: Elemental Composition (C, N, P) and Cell Volume of Exponentially Growing and Nutrient-Limited Bacterioplankton, Appl. Environ. Microbiol., 68, 2965–2971, https://doi.org/10.1128/AEM.68.6.2965-2971.2002, 2002.
Wang, S. W., Budge, S. M., Gradinger, R. R., Iken, K., and Wooller, M. J.: Fatty acid and stable isotope characteristics of sea ice and pelagic particulate organic matter in the Bering Sea: tools for estimating sea ice algal contribution to Arctic food web production, Oecologia, 174, 699–712, https://doi.org/10.1007/s00442-013-2832-3, 2014.
Whiticar, M. J.: Carbon and hydrogen isotope systematics of bacterial formation and oxidation of methane, Chem. Geol., 161, 291–314, https://doi.org/10.1016/S0009-2541(99)00092-3, 1999.
Yamamoto, S., Alcauskas, J. B., and Crozier, T. E.: Solubility of methane in distilled water and seawater, J. Chem. Eng. Data, 21, 78–80, https://doi.org/10.1021/je60068a029, 1976.
Zhivotchenko, A. G., Nikonova, E. S., and Jørgensen, M. H.: Copper effect on the growth kinetics of Methylococcus capsulatus (bath), Biotechnol. Tech., 9, 163–168, https://doi.org/10.1007/BF00157072, 1995.
Zhou, J., Tison, J.-L., Carnat, G., Geilfus, N.-X., and Delille, B.: Physical controls on the storage of methane in landfast sea ice, The Cryosphere, 8, 1019–1029, https://doi.org/10.5194/tc-8-1019-2014, 2014.