the Creative Commons Attribution 4.0 License.
the Creative Commons Attribution 4.0 License.
 | 06 Jun 2018
Characteristics of wet dissolved carbon deposition in a semi-arid catchment at the Loess Plateau, China
Linhua Wang
Liding Chen
Xinhui E
Yafeng Wang
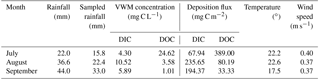
Wet dissolved carbon deposition is a critical node of the global carbon cycle, but little is known about dissolved organic and inorganic carbon (DOC and DIC) concentrations and fluxes in the semi-arid areas of the Loess Plateau Region (LPR). In this study, we measured variations in DOC and DIC concentrations in rainfalls at Yangjuangou Ecological Restoration and Soil and Water Observatory. Rainwater samples were collected in 16 rainfall events from July to September and the event-based, monthly concentrations and fluxes of DOC and DIC were quantified. The results showed that the event-based concentrations and fluxes of DOC and DIC were highly variable, ranging from 0.56 to 28.71 mg C L−1 and from 3.47 to 17.49 mg C L−1, respectively. The corresponding event-based fluxes ranged from 0.21–258.36 mg C m−2 and from 4.12 to 42.32 mg C m−2. The monthly concentrations of DOC and DIC were 24.62 and 4.30 (July), 3.58 and 10.52 (August), and 1.01 and 5.89 (September) mg C L−1, respectively. Thus, the monthly deposition fluxes of DOC and DIC were 541.64/94.60, 131.03/385.03, and 44.44/259.16 mg C m−2 for July, August, and September, respectively. In addition, the concentrations of DOC and DIC for the concentrated rainfall season (July–September) in the studied catchment were 7.06 and 7.00 mg C L−1, respectively. The estimated annual wet dissolved carbon depositions were 1.91 and 1.89 g C m−2 yr−1 for DOC and DIC, respectively. The results of this study suggest the variation in concentrations and fluxes of DOC and DIC and explore that these variation may be related to the dissolved carbon source and the rainfall characteristics during the concentrated rainfall season in the semi-arid catchment of the LPR. Furthermore, these results also suggest that dissolved carbon may be an important external input of carbon into terrestrial ecosystems.
- Article
(2366 KB) - Full-text XML
- BibTeX
- EndNote


Wet carbon deposition is recognized as the rainfall scavenging of aerosols and gas-phase organic compounds, which originated from biogenic and anthropogenic sources (Duarte et al., 2006; Houghton, 2003; May et al., 2013). Dissolved carbon is a ubiquitous component of rainwater in many regions around the world (Dachs et al., 2005). Global scale model simulations show that dissolved organic carbon (DOC) concentrations ranging from 1 to 10 mg C L−1 with a total of 188 Tg C yr−1 of wet dissolved organic deposition flux occurred during the terrestrial rainfall, which equals approximately 43 % of the total particulate organic carbon transported by rivers to oceans (Galy et al., 2015). A modeling study conducted by Safieddine and Heald (2017) estimated that the total global wet deposition of DOC was 273 Tg C yr−1. Similarly, Willey et al. (2000), respectively, found that the concentration of DOC in terrestrial precipitation was 1.93 mg C L−1, which was greater than nitric and sulfuric acid combined. Thus, the global flux of DOC and dissolved inorganic carbon (DIC) via precipitation can be estimated as 430 and 80 Tg C yr−1 (Willey et al., 2000). Furthermore, as a labile and bioavailable fraction of dissolved carbon, wet deposition of dissolved carbon may provide a substantial input of nutrient source for terrestrial and aquatic ecosystems. For example, Mladenov et al. (2012) used a long-term dataset of weekly DOC deposition and demonstrated that atmospheric wet deposition of dissolved carbon represented a significant source to an alpine catchment in the Rocky Mountains of Colorado, USA. Wang et al. (2017) reported that atmospheric wet deposition might be a large source of DOC in stream water, based on isotopic characteristics of carbon in a semi-arid catchment in the LPR. Consequently, the large magnitude of dissolved carbon flux via rainfall played an important role in ecological processes and acted as one of the key driving forces of the global carbon biogeochemical cycle. Thus, it is urgent to improve the associated knowledge and understanding of dissolved carbon deposition in rainfall.
With regard to relevant studies on nitrogen and phosphorus in atmospheric wet deposition, only a few quantitative studies are available on the atmospheric wet deposition of dissolved carbon. Iavorivska et al. (2016a) summarized that there were only 83 contemporary studies over the last three decades focused on the concentration and flux of dissolved organic carbon via rainfall at a worldwide scale. These available datasets were sparsely measured and only a handful of studies maintained long-term monitoring. Dissolved carbon deposition concentration and flux in rainfall are not general parameters in monitoring networks, such as the National Atmospheric Deposition Program (USA), European Monitoring Evaluation Programme (European Union) and Chinese Ecosystem Research Network (China) (Iavorivska et al., 2016a). In general, only few studies have assessed the dissolved carbon deposition via rainfall, such as the USA (1.1–2.9 mg C L−1; McDowell and Likens, 1998; Quideau and Bockheim, 1997; Willey et al., 2000), Brazil (3.3–4.1 mg C L−1; Coelho et al., 2008), New Zealand (0.1–4.8 mg C L−1; Kieber et al., 2002), Korea (0.2–9.4 mg C L−1; Yan and Kim, 2012), and Poland (4.7–5.1 mg C L−1; Siudek et al., 2015). Until recently, the only measurement data available were those related to wet dissolved carbon deposition in the northern and Tibetan region of China (Li et al., 2016; Pan et al., 2010). Pan et al. (2010) reported that significant seasonal differences in DOC concentrations and deposition fluxes are found in northern China. The corresponding annual average concentrations and deposition fluxes of DOC from the atmosphere ranged from 2.4 to 3.9 mg C L−1 and from 1.4 to 2.7 g C m−2 yr−1, respectively. Li et al. (2016) also reported that the DOC concentration of seasonal precipitation varied between monsoonal and non-monsoonal periods and the average deposition of DOC was 1.1 mg C L−1. The annual deposition flux of DOC was about 0.6 g C m−2 yr−1 in the Tibetan Plateau of China. These results indicated that wet dissolved carbon concentrations and deposition fluxes were commonly found in coastal, forested, and alpine regions and showed a spatial and temporal variation between different regions. The differences were attributed to rainfall, meteorological conditions, and carbonaceous source. In addition, due to the lack of quantitative measurement in dissolved carbon concentrations and associated fluxes, including corresponding sources, chemical composition, and variation patterns, the carbon exchange between the atmosphere and terrestrial ecosystem have not been incorporated into the current regional or global carbon cycle models (Jurado et al., 2008; Kieber et al., 2002). Thus, wet dissolved carbon deposition in rainfall remains unsolved and highlights the need to acquire more information.
Previous studies have provided insights on the magnitude and importance of wet dissolved carbon deposition in rainwater worldwide. However, studies that have explored atmospheric wet deposition of dissolved carbon are rarely found in the target research area, which is a semi-arid catchment in the LPR. The LPR (35–41∘ N, 102–114∘ E), which has an area of 6.4 × 10⁵ km2, is situated in the middle stream of the Yellow River. The plateau is covered by an average thickness of 100 m of loess. Loess is formed by the accumulation of wind-blown silt (Ding et al., 2002). Meanwhile, the fine-grained particles may serve as nuclei to form a rain droplet or cloud condensation. Consequently, it is worth noting that atmospheric dust scavenged by rainfall may be another source of dissolved carbon, which might differ from other regions. Thus, attention should be paid to the wet deposition processes of DOC and DIC, which were a potential external input of carbon to the semi-arid catchment in the LPR. Until this point, knowledge of wet dissolved carbon deposition and the associated flux has not been fully explored in the LPR. Thus, it is necessary to investigate the DOC and DIC deposition via rainfall, where little information is available.
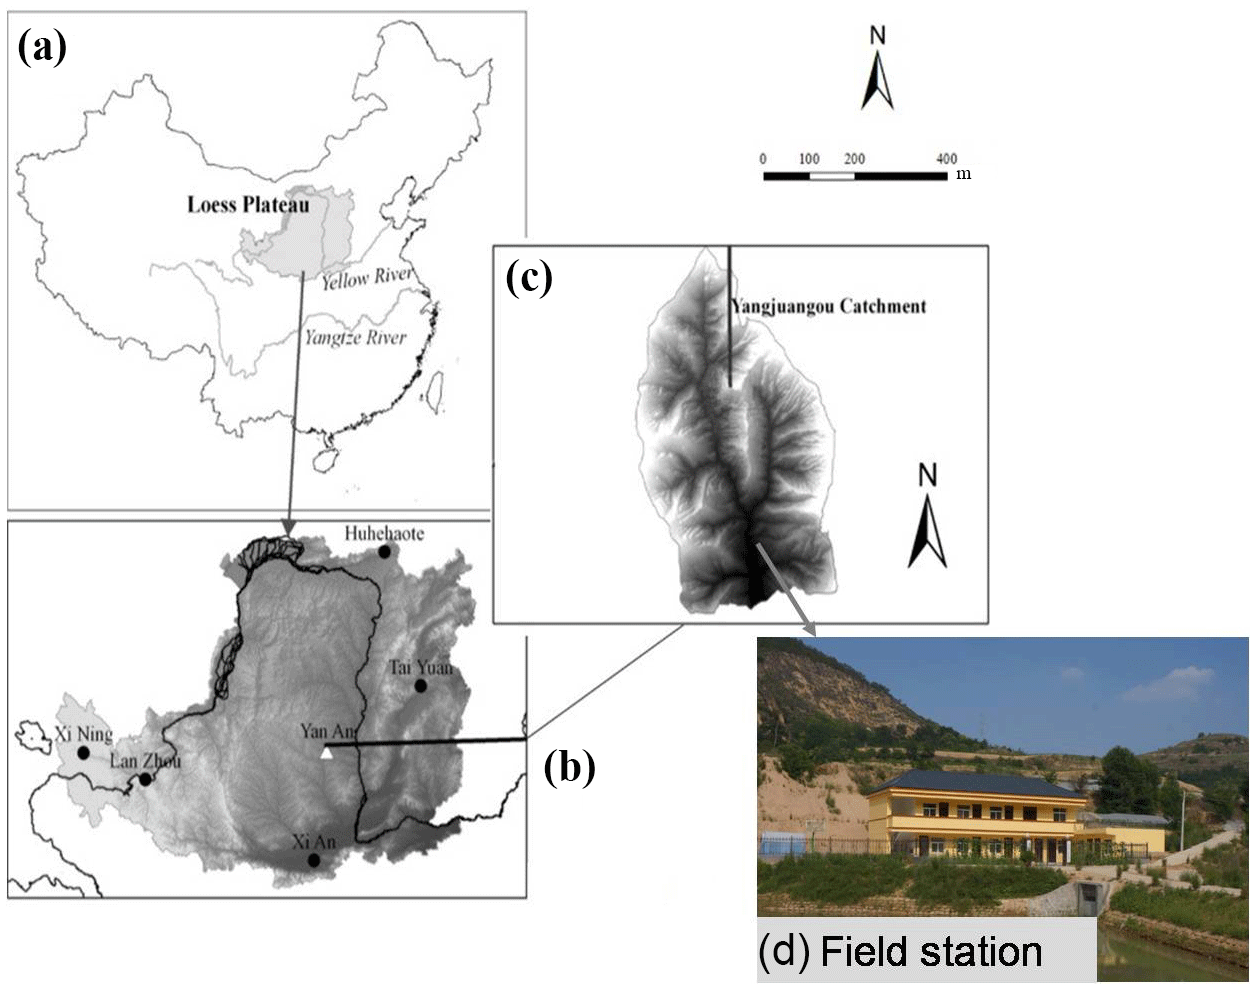
Figure 1Geographic location of the Yangjuangou catchment (c) in the LPR (b) of China (a) and the field station (d).
In this study, we measured DOC and DIC concentrations in samples collected during 16 rainfall events from July to September 2015 in the Yangjuangou catchment, which is a semi-arid catchment of the LPR. Therefore, the primary goal of this study is to investigate the variations in DOC and DIC fluxes from the atmosphere to understand the magnitude of dissolved carbon deposition during the concentrated rainfall season in the LPR. Specifically, the three objectives of this study were to examine the concentration of DOC and DIC and the associated variations in a rainfall event or monthly periods, to quantify the deposition fluxes of DOC and DIC, and to explore the relationships between dissolved carbon, rainfall properties, and rainwater chemical characteristics. These results will provide evidence of wet dissolved carbon deposition, which may be important for understanding the carbon cycle and ecosystem response in a semi-arid catchment in the LPR.
2.1 Description of the sampling site
As shown in Fig. 1, the field sampling was performed in the Yangjuangou catchment (36∘41′50.9 N, 109∘31′37.6 E), which is an Ecological Restoration and Soil and Water Conservation Monitoring Station on the Loess Plateau located in Yan'an, Shaanxi Province. This catchment covers an area of 2.02 km2 in area and is characterized by a typical loess hilly and gully topography with a gully density of 2.74 km km−2 (Wang et al., 2011). The main land use types in this catchment are forest, shrub, grassland, orchard, and farmland. The major forest species are Robinia pseudoacacia, Salix spp. and Populus spp. The Artemisa argyi, Stipa Bungeana trin., Bothriochloa ischaemum, Lespedezadavurica schindl., and Artemisia sacrorum are classified as grassland. The major orchards are Prunus armeniaca L., Malus pumila Mill., and Juglans rejia L. The major crops are Setaria italica, Zea may L. Glycinemax (L) Merr. Panicum miliaceum L. and Solanum tuberosum (Fu et al., 2014). The catchment has a semi-arid continental monsoonal climate and annual mean minimum and maximum temperatures of 6.5∘ (January) and 22.9∘ (July). The mean annual precipitation is 535 mm, whereas the concentrated precipitation occurs from June to September with large interannual fluctuations. A meteorological station is used to monitor the rainfall amounts, air temperature, moisture, wind velocity, etc. The soil in this area is classified as a typical loess with a fine silt texture and is weakly resistant to detachment by raindrops or runoff. The average erosion rate was 7715.5 t km−2 yr−1 between 2006 and 2009 (Fu et al., 2014).

Figure 2The backward trajectories of air mass calculated by the HYSPLIT model analysis at 100 m (red), 500 m (blue), and 1000 m (green) above ground level. Sample collected during (a) 9–15 July, (b) 16–22 July, (c) 1–8 August, (d) 16–22 August, (e) 1–8 September, (f) 9–15 September, (g) 16–22 September, and (h) 23–29 September are shown along with the corresponding backward trajectories.
2.2 Collection of rainfall samples
In the Yangjuangou catchment, experimenters resided in the field observatory station and treated the samples immediately after a rainfall event to ensure the dissolved carbon in the rainwater did no microbiologically biodegrade. Because the common sampling frequency is monthly or weekly at this field observatory station, this sampling method may result in dissolved carbon in rainwater that is degraded by microbial activities (Kieber et al., 2002; Willey et al., 2000). This is also the reason for the measurement scarcity of wet dissolved carbon deposition concentrations and fluxes in the existing ecosystem monitoring networks worldwide. In this study, rainfall samples were collected from July to September 2015. The use of an open-to-the-atmosphere collector is a common approach for collecting atmospheric wet deposition during an individual rainfall event. A rain gauge was installed on the roof of the building at the sampling site to determine the rainfall amount and can be used for collecting rainfall samples during a rainfall event. Two additional duplicate rainfall samples were collected using a steel bucket (diameter = 29 cm). During the field collection, the rainwater samples were poured into high-density polyethylene bottles at the end of a rainfall event. All rainfall containers were cleaned with deionized water after collection and returned to the sampling sites for the next rainfall sampling. Information on the rainfall events that occurred and were sampled during the study period is summarized in Table 1 and Fig. 2. There were 37 rainfall events in total and a total rainfall amount of 102.4 mm over the sampling period of July to September, of which the individual rainfall amount varied from 0.2 to 13.6 mm. The rainfall event collections in July, August, and September were 4, 7, and 5, respectively, whereas the corresponding total rainfall events were 6, 12, and 7 in each month. Therefore, we sampled 15.8, 22.4, and 32.9 mm of rainfall that occurred in each month, respectively. The sampled rainfall accounted for 69.4 % of the total amount of rainfall over the sampling period. Some events were not sampled due to the experimenter transporting the samples to the State Key Laboratory of Urban and Regional Ecology in Beijing for indoor analysis, and thus there are no experimenter was at the field station during those events.
Table 1Characterization of rainwater chemistry from the rainfall events that occurred during the sampling period of July to September.

2.3 In situ and laboratory measurements
In this study, there are three steps for conducting in situ and laboratory measurements. First, the TDS (total dissolved solids) and pH of unfiltered rainfall samples were immediately tested using a portable Ultrameter 6PFC (MYRON L. Company, USA) after each rainfall collection. Then, each sample was filtered by a 0.45 µm membrane filter (Whatman, GE, USA) and stored in high-density polyethylene bottles. Before use, the bottles were strictly cleaned with a 10 % hydrochloric acid solution, and then, these bottles were soaked in deionized water and air-dried. The bottles filled with 200 mL filtrates were stored in a refrigerator (4∘C). After completing the rainwater filtration, all filtered membranes were soaked in 80∘C deionized water and maintained at this temperature for 12 h to clean and air-dry for the next use. Third, the samples were transported to the laboratory for further analysis. Total dissolved carbon (TDC) and DIC concentrations were determined by a Vario (Elementar, Germany), which included a high-temperature combustion furnace, self-contained acidification module, and a highly sensitive CO2 detector. Prior to measurement, the instrument should dose 125 mL of 1 % H3PO4 solution (phosphoric acid) in the acidification module, and then validation is conducted by analyzing various concentrations of a TDC standard solution to achieve accurate results. TDC is automatically measured by the combustion of a sample, whereas DIC is measured after acidification of a sample. The distilled water blanks were also tested every 50 samples for ensuring the quality of results. TDC is recognized as the sum of the DIC and DOC components, and thus the DOC was the difference between TDC and DIC for each sample (DOC = TDC − DIC). Meanwhile, and were measured on the FUTURA segmented continuous flow analysis system (Alliance, France).
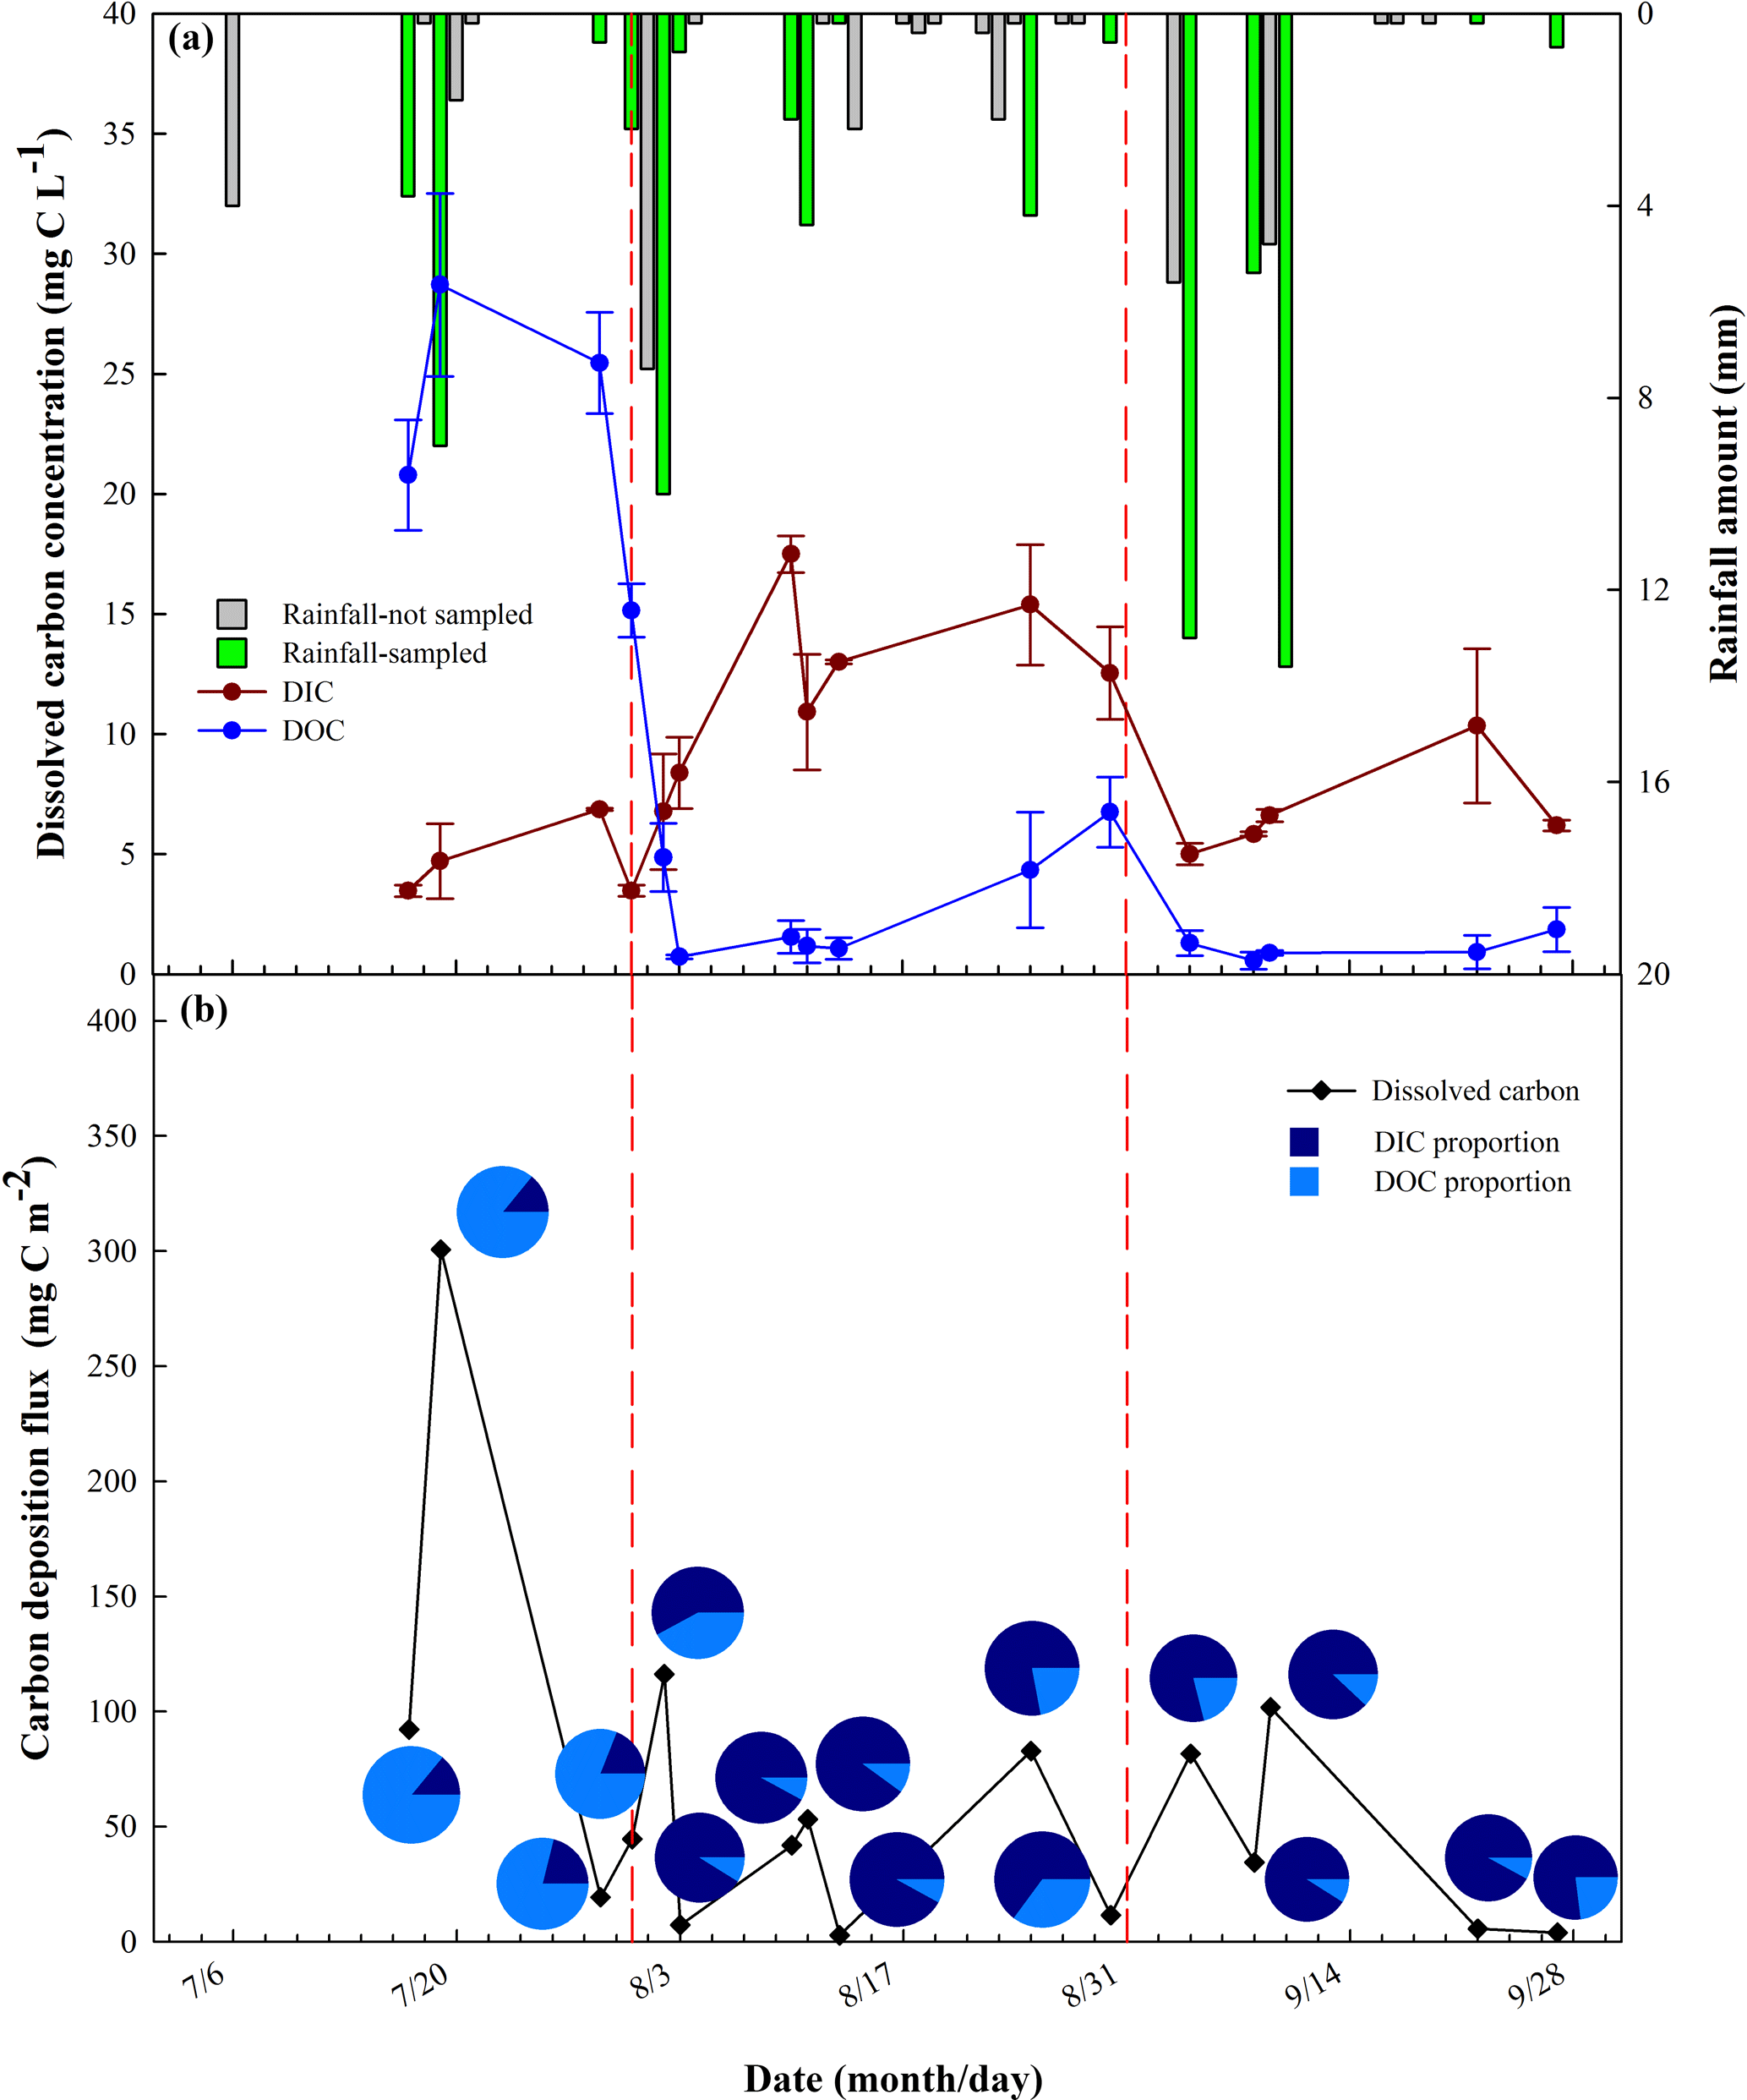
Figure 3The dissolved carbon concentrations (a), deposition fluxes and the proportions of DOC and DIC (b) in individual rainfall events during July to September.
2.4 Statistical analyses
In the present study, the DIC and DOC concentrations in the rainfall for an event-based, monthly period underwent volume-weighted mean (VWM) concentration calculations, which are commonly used in wet dissolved carbon deposition studies for minimizing the average effects of a small rainfall amount (Li et al., 2017; Pan et al., 2010; Santos et al., 2011, 2014). The calculation of the VWM concentration and wet deposition flux were defined in the following equations:
where Pi (mm) is the rainfall amount corresponding to each sample, Ci (mg C L−1) is the DOC and DIC concentrations in an individual rainfall sample, n and m are the number of samples and total rainfall events in a time period, F (mg C m−2) is the wet deposition flux of DOC and DIC during a month or rainy season in the study region, and S (m2) is the catchment area.
In order to describe the origin of air masses at the study site during the sampling period, back-trajectory analyses were performed using the Hybrid Single Particle Lagrangian Integrated Trajectory (HYSPLIT) model developed by the National Oceanic and Atmospheric Administration – Air Resources Laboratory (NOAA-ARL; Draxler and Rolph, 2003). The input meteorological data were from the Global Data Assimilation System (GDAS). The trajectories were generated for 168 h hindcast starting at 100/500/1000 m above ground level and vertical motion based on model vertical velocity (Siudek et al., 2015). The weekly air parcel backward trajectories with a 6 h interval were calculated for the Yangjuangou catchment (36∘41′50.9 N, 109∘31′37.6 E) during July to September 2015. Therefore, this approach from HYSPLIT simulations is shown in Fig. 2 and give an insight into the relationship between potential source and wet dissolved carbon concentration in rainwater.
To analyze potential relationships among DIC, DOC, -N, -N, TDS, and pH, Pearson's test (P < 0.05) was performed using SPSS (Statistics Package for Social Science; IBM, 2010). The corresponding figures were developed using SigmaPlot 10.0 (Systat, 2008).
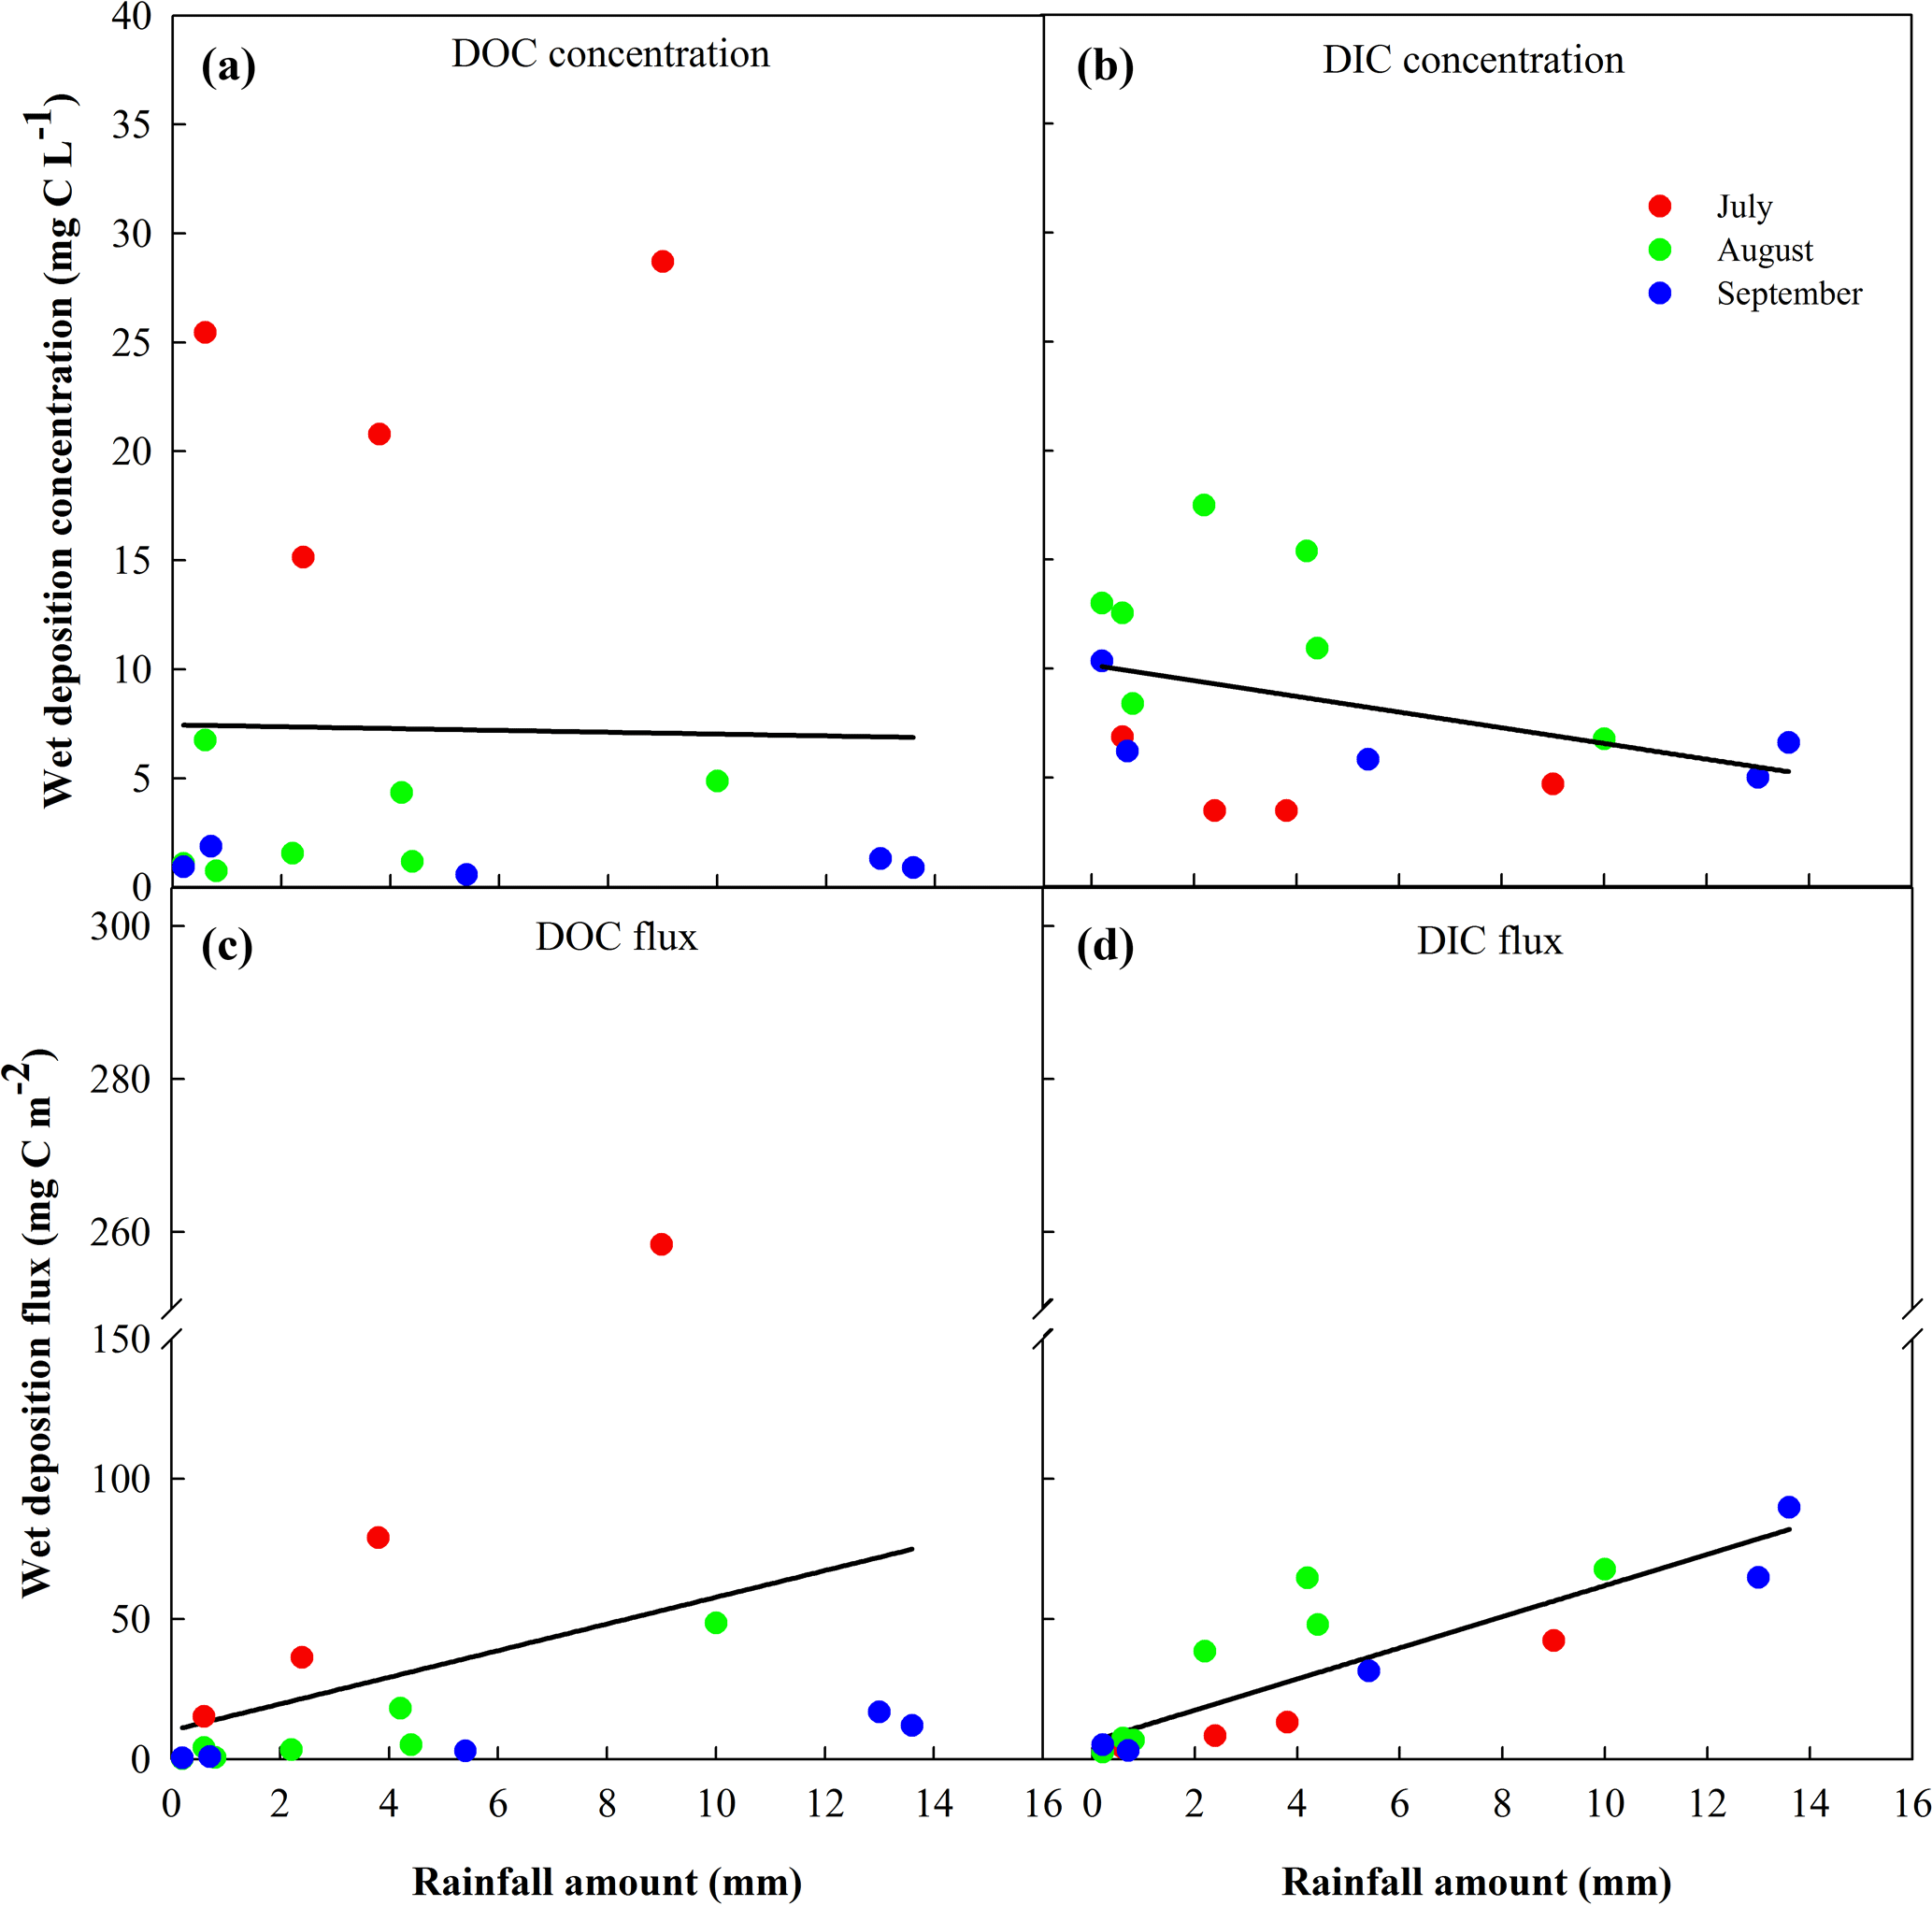
Figure 4Relationships between measured parameters and rainfall amounts in a single rainfall event during July to September: (a) DOC concentration, (b) DIC concentration, (c) DOC flux, and (d) DIC flux.
3.1 Concentrations and fluxes of DOC and DIC
As illustrated in Fig. 3a, we analyzed 48 rainfall samples from 16 rainfall events, which spanned a range of rainfall amounts during the concentrated rainfall season, and we quantified the variability in concentrations and fluxes of DOC and DIC for an event-based or monthly rainfall. The event-based concentration of DOC exhibited large variations and ranged from 0.56 to 28.71 mg C L−1, whereas the maximum and minimum concentrations were found in July and September. For each month during the sampling period, the ranges of DOC concentrations were 15.14–28.71, 0.73–6.75, and 0.56–1.86 mg C L−1, whereas the monthly concentrations of DOC were 24.62, 3.58, and 1.01 mg C L−1 for July, August, and September, respectively (Table 2). In addition, DIC concentrations generally varied from 0.5 to 13.6 mg C L−1 from July to September. DIC concentrations in each monthly rainfall were 3.47–6.86 (July), 6.77–17.49 (August), and 4.99–10.35 (September) mg C L−1, while monthly wet DIC deposition concentrations were 4.30, 10.52, and 5.89 mg C L−1, respectively (Table 2). Based on the DOC and DIC concentrations and rainfall amounts over the sampling period of July to September, concentrations of DOC and DIC during this concentrated rainfall season were 7.06 and 7.00 mg C L−1. The variation in the dissolved carbon concentration of the rainwater could be attributed to the differences in carbon sources, rainfall amount and frequency, and meteorological conditions (Iavorivska et al., 2016b, 2017a, b). Back-trajectory analyses demonstrated how the DOC from gas-phase organic compounds changed throughout the study period (Fig. 2). Results of dissolved carbon concentrations in rainwater reflected the influences of regional or distant carbon sources. Elevated DOC concentrations were observed in July, which could be highly influenced by gas-phase organic compounds emitted from local or regional anthropogenic activities, such as biogenic, industrial, and traffic emissions (Kieber et al., 2002; Mladenov et al., 2012). However, the decreased DOC concentrations in August and September may be attributed to a reduced gas-phase organic compound source (Witkowska and Lewandowska, 2016). As shown in Fig. 4a and b, the concentration of DOC and DIC in the rainwater generally decreased with a single rainfall amount. Similar relationships between the dissolved carbon concentration and rainfall amount have also been found at other sites (Heartsill-Scalley et al., 2007; Pantelaki et al., 2018; Santos et al., 2013). However, DOC concentrations can be more or less associated with a smaller rainfall amount during a single event (Fig. 4a, b). These findings suggested that the concentration of DOC was not followed a dilution behavior. In addition, the frequency of rainfall events is lower and shows a flush effect. For example, when the rainfall event occurred on 17 July, it had been 10 days since last rainfall, suggesting that DOC tends to be effectively flushed from the atmosphere with a large rainfall amount. Moreover, the frequency of rainfall events was increased, and the rainfall intervals ranged between 0 and 5 days, and thus this may lead to a reduction in the DOC concentration (Fig. 3a).
Table 2Summary of rainfall, temperature, wind speed, monthly concentrations, and fluxes of DOC and DIC in rainwater during July to September.
The wet dissolved carbon deposition flux in an individual rainfall event and the proportion of DOC and DIC were also observed during the sampled period (Fig. 3b). In general, DOC deposition flux for a single rainfall event ranged from 0.21 to 258.36 mg C m−2, while the monthly deposition fluxes of DOC were 541.64 (July), 131.03 (August), and 44.44 (September) mg C m−2, respectively (Table 2). In contrast to DOC, the DIC deposition flux ranged from 3.10 to 89.81 mg C m−2, with a lower DIC deposition flux found in July (4.12–42.32 mg C m−2) and then an increase in August (2.6–67.66 mg C m−2) and September (3.10–89.81 mg C m−2). Meanwhile, the DIC deposition fluxes for each month were 94.60, 385.03, and 259.16 mg C m−2, respectively (Table 2). In addition, the DOC was the primary contributor to the wet dissolved carbon flux, with a proportion that ranged from 79 to 86 %, with an average of 83 % in July. Then, the proportion of DOC contribution decreased in August and September, which ranged from 8 to 42 %, with an average of 17 %. There were differences in the deposition of a single rainfall event due to both the dissolved carbon concentration and rainfall amount. A higher DOC deposition flux was found in July with a significantly higher DOC concentration, especially the rainfall that occurred on 19 July. However, there is a reduced DOC deposition flux, even with higher DOC concentration associated with a lesser rainfall amount, such as the single rainfall events on 29 and 31 July. These results indicated the lesser rainfall amounts may overwhelm the effects of a high DOC concentration. Meanwhile, the DIC deposition flux appeared in accordance with variations in the associated rainfall amount for each month. Thus, the DOC concentrations in rainfall may have a major impact on the DOC deposition flux, which is supported by the results shown in Fig. 4c, d. These results show that the different variations in DOC and DIC occur during sequential rainfall events in the concentrated rainfall season in the LPR.
3.2 Correlation analysis
Correlations between DOC and DIC concentrations and -N, -N, TDS, and pH in rainwater samples are shown in Table 3. The concentrations of -N, -N, TDS and pH in terms of regression functions of DOC and DIC during rainfall are presented in Fig. 5. For DOC, a significant positive correlation between DOC concentration and -N and TDS were obtained with correlation coefficients of 0.76 and 0.57 (P < 0.01), whereas a negative correlation was found between the DOC concentration and -N with a correlation coefficient of −0.67 (P < 0.01). A positive correlation was found between the DOC concentration and -N, which was an indicator of fossil fuel burning, as also stated by Santos et al. (2014) and Willey et al. (2000). In addition, the observed TDS varied within an extensive range of 10.70–253.70 mg L−1, and the average value was 73.10 mg L−1 for all rainfall events that occurred during the study period (Table 2). The average TDS in July, August, and September were 131.22, 74.01, and 25.33 mg L−1, which coincided with variations in DOC concentrations each month. The TDS in the rainfall in the study region was much higher than other regions of China. As reported by Hao et al. (2017) in the Xiangxi River catchment in eastern China, TDS ranged from 40.63 to 70.71 mg L−1, with an average of 55.26 mg L−1 of rainfall. Meanwhile, DOC was also positively correlated with TDS and indicated that dissolved solids emitted from fossil fuel burning or dust particles probably contributed to the dissolved organic carbon in rainwater (Fig. 5b). Therefore, the presence of a higher TDS may explain the higher DOC concentrations in the rainwater. Furthermore, a negative correlation between DOC and -N concentrations indicated that a lower concentration of -N and pH with a higher DOC were found in July (Fig. 5c). This result disagreed with the conclusions made by Santos et al. (2014) and Santos et al. (2011), who obtained positive correlations between DOC and -N. Dissolved NH was likely related to dust particles that originated from agriculture and may have contributed to acid neutralization (Lohse et al., 2008). Santos et al. (2014) concluded that the acidity of deposition depends on the concentration of acid-forming ions and alkaline species. Therefore, higher DOC concentrations in rainfall may diminish the dissolved , and thus there are lower -N concentrations and pH in the rainfall. Nevertheless, the lower DOC concentration may lead to more -N, which may neutralize the acidity, and consequently the concentrations of -N and the pH will be higher. In addition, a significant positive correlation between DIC concentration and -N and pH were found, with correlation coefficients of 0.69 and 0.62 (P < 0.01), respectively (Fig. 5d, e). DIC existed as a form of disassociated carbonic acid in the rainfall (Iavorivska et al., 2016a). -N in the rainfall formed ammonia or ammonium nitrate, which may neutralize the carbonic acid. Thus, this may result in a higher DIC concentration with a higher -N concentration and pH. Therefore, these results of the rainwater chemical properties may provide further support for the variations in DOC and DIC during the sampling period.
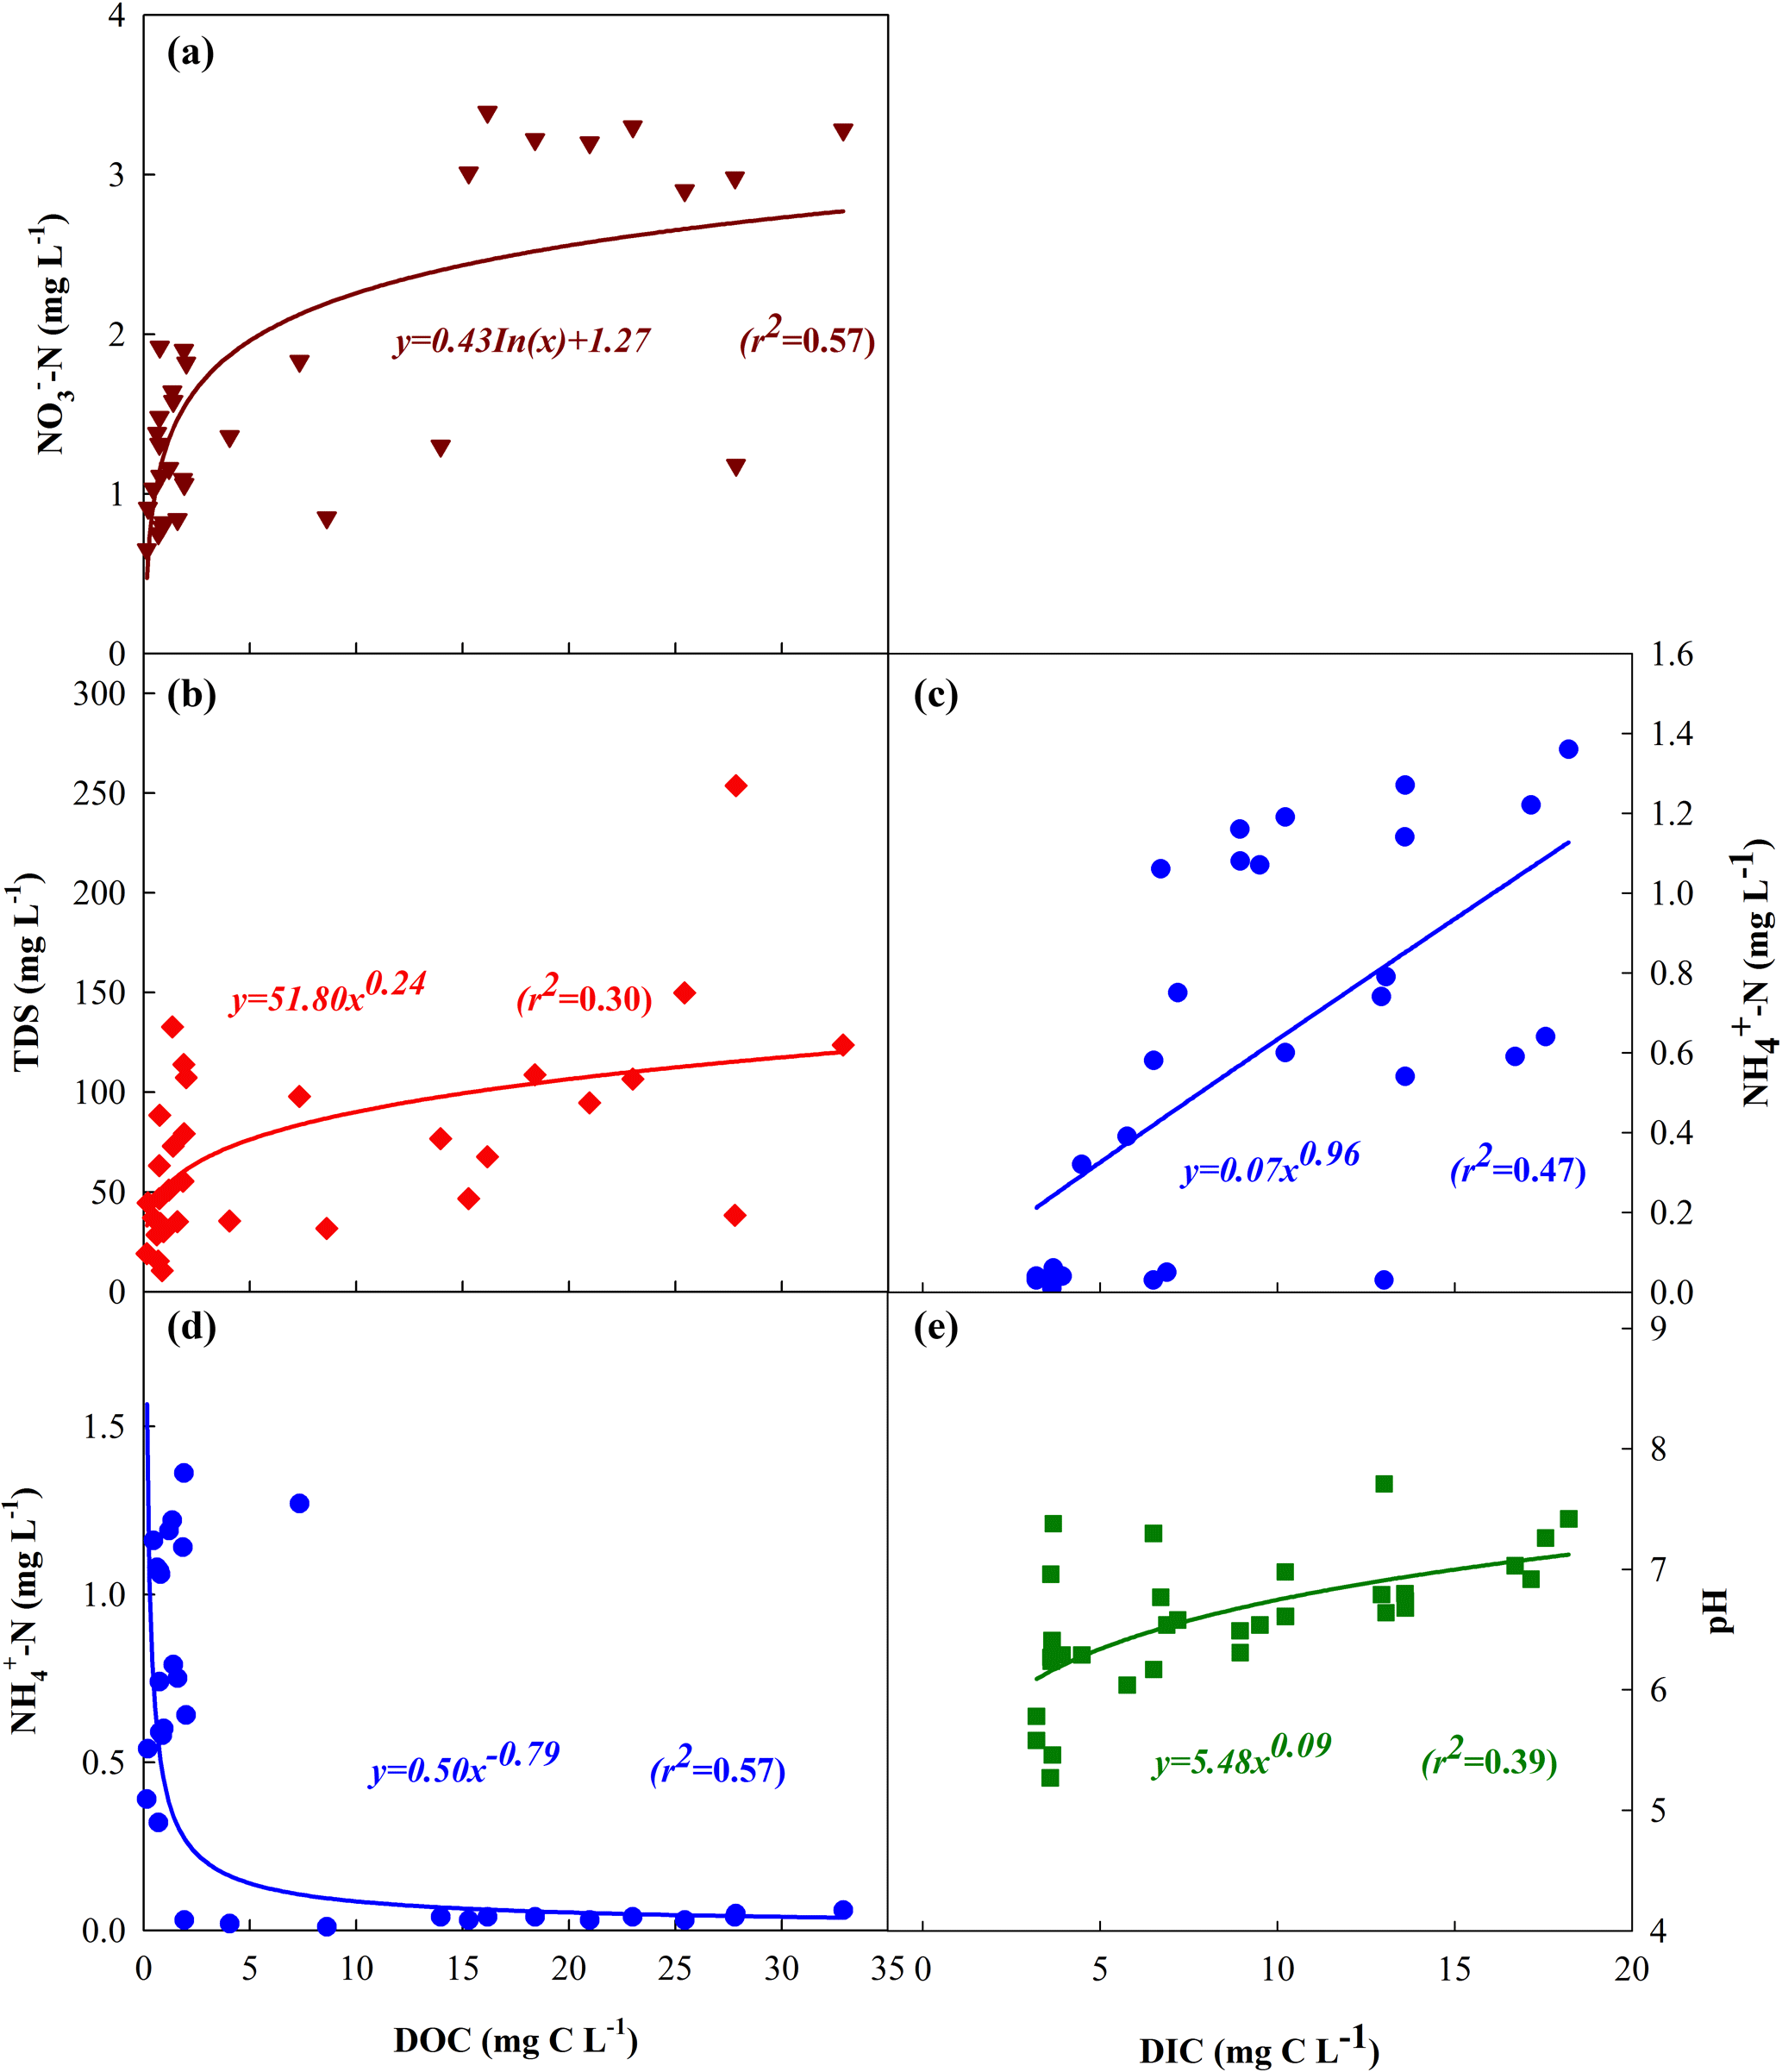
Figure 5Significant correlations between DOC concentrations and various rainwater variables: (a) NO-N, (b) TDS, and (c) -N in the rainfall event samples collected during July–September. In addition, correlations between DIC concentrations with the variables (d) -N and (e) pH are also demonstrated accordingly.
Table 3Correlation coefficients between DOC, DIC, -N, -N, TDS, and pH (n=48).
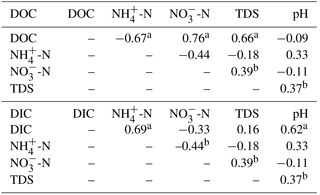
Note: a (P < 0.01), b (P < 0.05).
3.3 Comparisons of wet dissolved carbon deposition with other sites
Owing to various sources, meteorological conditions, seasons, and sampling times in different regions, the DOC and DIC of the rainfall exhibited spatial and temporal variations. Investigations on the DOC and DIC deposition via rainfall have not been previously conducted in the LPR. Moreover, to our knowledge, two similar observations were performed for other sites in northern and the Tibetan regions of China (Li et al., 2016; Pan et al., 2010). In this study, the DOC concentrations ranged from 1.01 to 24.62 mg C L−1 over the sampling period of July to September. Meanwhile, DOC concentrations in the rainy season (from July to September) were 7.06 mg C L−1, which suggested a higher wet deposition of dissolved organic carbon in the LPR. DOC concentrations measured in the rainfall in the LPR were much higher than those from Beijing (3.90 mg C L−1; Pan et al., 2010) and Lhasa (1.10 mg C L−1; Li et al., 2017). The carbonaceous aerosol particles and soluble organic gases in the atmosphere may have a major impact on the DOC concentrations of the rainfall. Indeed, the back-trajectories can provide evidence for explaining the temporal variations in dissolved carbon concentrations, as shown in Fig. 2. The DOC deposition fluxes were the predominant proportion and had higher concentrations in July (Fig. 3). This might be explained by a higher contribution of anthropological emissions. A higher relative proportion of DOC deposition fluxes with a positive correlation observed between DOC and -N concentrations may highlight a higher contribution of aerosols from anthropological activities, which was also reported by Santos et al. (2011). Furthermore, the -N dissolved in rainwater that formed acidic conditions may reduce the disassociated carbonic acid, which showed a lesser DIC concentration for the July rainfall events. Indeed, Santos et al. (2014) suggested that the acid neutralization was likely due to the presence of -N, which was beneficial for forming disassociated carbonic acid in the rainwater. This might be another aspect that is further supported by the positive relationship between DIC concentrations, pH and -N concentrations, which is shown in Fig. 5d and e. Overall, observational data from this case study showed temporal variations in dissolved carbon concentration in rainfall events in the LPR. The temporal variability may be attributed to the dissolved carbon source, rainfall characteristics, meteorological conditions, and the interactions between ions that impacted dissolution of gas-phase organic compounds.
Figure 3 shows the wet dissolved carbon concentration and deposition flux in July, August, and September. Therefore, it was estimated that the annual wet deposition of DOC and DIC were 1.91 and 1.89 g C m−2 yr−1, which were much higher than that of other reported regions in China. For instance, the annual wet deposition fluxes of DOC and DIC were 1.9 and 0.7 g C m−2 yr−1 in northern China (Pan et al., 2010), and the observed DOC flux was 0.63 g C m−2 yr−1 in the Tibetan Plateau (Li et al., 2016). With regard to worldwide sites, the estimated values in the present study were much lower than those reported in Brazil (Ribeirao Preto 4.8 g C m−2 yr−1, Araraquara 5.4 g C m−2 yr−1; Coelho et al., 2008) and the USA (North Carolina 2.9 g C m−2 yr−1; Willey et al., 2000). Moreover, the values were comparable to the annual wet deposition flux of DOC in Seoul, South Korea (1.90 g C m−2 yr−1), which mostly originated from emissions of fossil fuel combustion (Yan and Kim, 2012). In addition, the magnitude of contributions of DOC and DIC to wet dissolved carbon deposition were approximately equal. These results at this study site were within the range reported for other sites (Fahey et al., 2005; Liu et al., 2010) and was also comparable with values measured in Pennsylvania, USA, which reported that contributions of DOC and DIC were 53 and 47 %, respectively (Iavorivska et al., 2017a). Therefore, atmospheric wet dissolved carbon deposition in the semi-arid catchment of the LPR may have considerable differences among domestic or worldwide regions. Even though the annual wet deposition flux of dissolved carbon was estimated and may have uncertainty due to limited samples, the flux value reflected the dissolved carbon deposition in the rainfall during the concentrated rainfall season and highlighted that the wet dissolved carbon deposition may be a substantial external input of carbon to a semi-arid catchment in the LPR. Hence, further investigations should be a long-term undertaking to evaluate the concentration and flux of dissolved carbon deposition and its impact on terrestrial ecosystems in semi-arid regions.
In this study, we measured the concentration of DOC and DIC in rainwater collected for 16 rainfall events during the sampling period of July to September in the Yangjuangou catchment of the LPR. Thus, we also compared the event-based, monthly deposition fluxes of DOC and DIC, and estimated the annual deposition flux using a case study for a semi-arid catchment. The monthly concentrations of DOC in rainfalls of July, August, and September were 24.62, 3.58, and 1.01 mg C L−1, respectively. However, the concentrations of DIC were 4.30, 10.52, and 5.89 mg C L−1, respectively. Moreover, the monthly deposition fluxes of DOC and DIC were 541.64/94.60, 131.03/385.03, and 44.44/259.16 mg C m−2 for July, August, and September, respectively. In addition, concentrations of DOC and DIC for the concentrated rainfall season (July–September) in the studied catchment were 7.06 and 7.00 mg C L−1. The estimated annual wet dissolved carbon deposition was 1.91 and 1.89 g C m−2 yr−1 for DOC and DIC. The event-based, monthly concentrations and fluxes of DOC and DIC were highly variable, which was possibly because of the aerosol source, rainfall characteristics, and meteorological conditions reported by studies of other sites. Although this is the first study to provide information on the concentration and flux of dissolved carbon deposition during the concentrated rainfall season in a semi-arid catchment, further investigation should be conducted over long-term temporal and large spatial scales to reveal the dissolved carbon input to a watershed and its ecological impacts on terrestrial and aquatic systems. Nevertheless, our primary results provide evidence that wet dissolved carbon deposition represents a substantial carbon contribution to a catchment in the semi-arid area of the LPR.
The data are not publicly accessible according to the requirements for confidentiality of rainfall characteristics and dissolved carbon concentration in rainwater data in the studied catchment.
The authors declare that they have no conflict of interest.
This work was financially supported by the National Nature Science Foundation
of China (no. 41571130083), the National Key Research and Development Program
(no. 2016YFC0501602), and the Youth Innovation Promotion Association, CAS. We
also appreciate two anonymous referees for their pertinent and professional
comments and suggestions, which are very beneficial for improving the
quality of this paper.
Edited by: Anja
Rammig
Reviewed by: two anonymous referees
Coelho, C. H., Francisco, J. G., Nogueira, R. F. P., and Campos, M. L. A. M.: Dissolved organic carbon in rainwater from areas heavily impacted by sugar cane burning, Atmos. Environ., 42, 7115–7121, 2008.
Dachs, J., Calleja, M. L., Duarte, C. M., del Vento, S., Turpin, B., Polidori, A., Herndl, G. J., and Agustí, S.: High atmosphere-ocean exchange of organic carbon in the NE subtropical Atlantic, Geophys. Res. Lett., 32, L21807, https://doi.org/10.1029/2005GL023799, 2005.
Ding, Z. L., Ranov, V., Yang, S. L., Finaev, A., Han, J. M., and Wang, G. A.: The loess record in southern Tajikistan and correlation with Chinese loess, Earth Planet. Sc. Lett., 200, 387–400, 2002.
Draxler, R. R. and Rolph, G. D.: HYSPLIT (HYbrid Single Particle Lagrangian Integrated Trajectory) Model Access Via NOAA ARL READY Website, NOAA Air Resources Laboratory, Silver Spring, MD, available at: http://ready.arl.noaa.gov/HYSPLIT.php (last access: 12 May 2018), 2003.
Duarte, C. M., Dachs, J., Llabrés, M., Alonso-Laita, P., Gasol, J. M., Tovar-Sánchez, A., Sañudo-Wilhemy, S., and Agustí, S.: Aerosol inputs enhance new production in the subtropical northeast Atlantic, J. Geophys. Res.-Biogeo., 111, G04006, https://doi.org/10.1029/2005JG000140, 2006.
Fahey, T. J., Siccama, T. G., Driscoll, C. T., Likens, G. E., Campbell, J., Johnson, C. E., Battles, J. J., Aber, J. D., Cole, J. J., Fisk, M. C., Groffman, P. M., Hamburg, S. P., Holmes, R. T., Schwarz, P. A., and Yanai, R. D.: The Biogeochemistry of Carbon at Hubbard Brook. Biogeochemistry 75, 109–176, 2005.
Fu, B., Zhao, W., Zhao, Q., and Liu, Y.: Changes of landscape pattern and soil erosion in Loess Plateau, Science Press, Beijing, 186–199, 2014 (in Chinese with English abstract).
Galy, V., Peucker-Ehrenbrink, B., and Eglinton, T.: Global carbon export from the terrestrial biosphere controlled by erosion, Nature, 521, 204–207, 2015.
Hao, Z., Gao, Y., Yang, T., and Tian, J.: Atmospheric wet deposition of nitrogen in a subtropical watershed in China: characteristics of and impacts on surface water quality, Environ. Sci. Pollut. R., 24, 8489–8503, 2017.
Heartsill-Scalley, T., Scatena, F. N., Estrada, C., McDowell, W. H., and Lugo, A. E.: Disturbance and long-term patterns of rainfall and throughfall nutrient fluxes in a subtropical wet forest in Puerto Rico, J. Hydrol., 333, 472–485, 2007.
Houghton, R. A.: Why are estimates of the terrestrial carbon balance so different?, Glob. Change Biol., 9, 500–509, 2003.
Iavorivska, L., Boyer, E. W., and DeWalle, D. R.: Atmospheric deposition of organic carbon via precipitation, Atmos. Environ., 146, 153–163, 2016a.
Iavorivska, L., Boyer, E. W., Miller, M. P., Brown, M. G., Vasilopoulos, T., Fuentes, J. D., and Duffy, C. J.: Atmospheric inputs of organic matter to a forested watershed: Variations from storm to storm over the seasons, Atmos. Environ., 147, 284–295, 2016b.
Iavorivska, L., Boyer, E., and Grimn, J.: Wet atmospheric deposition of organic carbon: An underreported source of carbon to watersheds in the northeastern United States, J. Geophys. Res.-Atmos., 122, 3104–3115, 2017a.
Iavorivska, L., Boyer, E. W., Grimm, J. W., Miller, M. P., DeWalle, D. R., Davis, K. J., and Kaye, M. W.: Variability of dissolved organic carbon in precipitation during storms at the Shale Hills Critical Zone Observatory, Hydrol. Process., 31, 2935–2950, 2017b.
IBM: IBM SPSS Statistics for Windows, Version 19.0, IBM Corporation, Armonk, NY, 2010.
Jurado, E., Dachs, J., Duarte, C. M., and Simó, R.: Atmospheric deposition of organic and black carbon to the global oceans, Atmos. Environ., 42, 7931–7939, 2008.
Kieber, R., Peake, B., Willey, J., and Avery, B.: Dissolved organic carbon and organic acids in coastal New Zealand rainwater, Atmos. Environ., 36, 3557–3563, 2002.
Li, C., Yan, F., Kang, S., Chen, P., Qu, B., Hu, Z., and Sillanpaa, M.: Concentration, sources, and flux of dissolved organic carbon of precipitation at Lhasa city, the Tibetan Plateau, Environ. Sci. Pollut. R., 23, 12915–12921, 2016.
Li, C., Yan, F., Kang, S., Chen, P., Hu, Z., Han, X., Zhang, G., Gao, S., Qu, B., and Sillanpaa, M.: Deposition and light absorption characteristics of precipitation dissolved organic carbon (DOC) at three remote stations in the Himalayas and Tibetan Plateau, China, Sci. Total Environ., 605–606, 1039–1046, 2017.
Liu, Z., Dreybrodt, W., and Wang, H.: A new direction in effective accounting for the atmospheric CO2 budget: Considering the combined action of carbonate dissolution, the global water cycle and photosynthetic uptake of DIC by aquatic organisms, Earth-Sci. Rev., 99, 162–172, 2010.
Lohse, K. A., Hope, D., Sponseller, R., Allen, J. O., and Grimm, N. B.: Atmospheric deposition of carbon and nutrients across an arid metropolitan area, Sci. Total Environ., 402, 95–105, 2008.
May, B., Wagenbach, D., Hoffmann, H., Legrand, M., Prenunkert, S., and Steier, P.: Constraints on the major sources of dissolved organic carbon in Alpine ice cores from radiocarbon analysis over the bomb-peak period, J. Geophys. Res.-Atmos., 118, 3319–3327, 2013.
McDowell, W. and Likens, G.: Origin, composition, and flux of dissolved organic carbon in the hubbard brook valley, Ecol. Monogr., 58, 177–195, 1998.
Mladenov, N., Williams, M. W., Schmidt, S. K., and Cawley, K.: Atmospheric deposition as a source of carbon and nutrients to an alpine catchment of the Colorado Rocky Mountains, Biogeosciences, 9, 3337–3355, https://doi.org/10.5194/bg-9-3337-2012, 2012.
Pan, Y., Wang, Y., Xin, J., Tang, G., Song, T., Wang, Y., Li, X., and Wu, F.: Study on dissolved organic carbon in precipitation in Northern China, Atmos. Environ., 44, 2350–2357, 2010.
Pantelaki, I., Papatzelou, A., Balla, D., Papageorgiou, A., and Voutsa, D.: Characterization of dissolved organic carbon in rainwater of an urban/coastal site in Mediterranean area, Sci. Total Environ., 627, 1433–1441, 2018.
Quideau, S. A. and Bockheim, J. G.: Biogeochemical cycling following planting to red pine on a sandy prairie soil, J. Environ. Qual., 26, 1167–1175, 1997.
Safieddine, S. A. and Heald, C. L.: A global assessment of dissolved organic carbon in precipitation, Geophys. Res. Lett., 44, 11672–11681, 2017.
Santos, P. S., Otero, M., Santos, E. B., and Duarte, A. C.: Chemical composition of rainwater at a coastal town on the southwest of Europe: what changes in 20 years?, Sci. Total Environ., 409, 3548–3553, 2011.
Santos, P. S., Santos, E. B., and Duarte, A. C.: Seasonal and air mass trajectory effects on dissolved organic matter of bulk deposition at a coastal town in south-western Europe, Environ. Sci. Pollut. R., 20, 227–237, 2013.
Santos, P. S., Santos, E. B., and Duarte, A. C.: Dissolved organic and inorganic matter in bulk deposition of a coastal urban area: an integrated approach, J. Environ. Manage., 145, 71–78, 2014.
Siudek, P., Frankowski, M., and Siepak, J.: Seasonal variations of dissolved organic carbon in precipitation over urban and forest sites in central Poland, Environ. Sci. Pollut. R., 22, 11087–11096, 2015.
Systat: Sigma Plot, Version 10.0, Systat Software Inc., San Jose, CA, 2008.
Wang, Y., Fu, B., Lü, Y., and Chen, L.: Effects of vegetation restoration on soil organic carbon sequestration at multiple scales in semi-arid Loess Plateau, China, Catena, 85, 58–66, 2011.
Wang, Y., Chen, L., Gao, Y., Chen, S., Chen, W., Hao, Z., Jia, J., and Han, N.: Geochemical isotopic composition in the Loess Plateau and corresponding sources analyses: A case study of China's Yangjuangou catchment, Sci. Total Environ., 581–582, 794–800, 2017.
Willey, J., Kieber, R., Eyman, M., and Avery, G. B.: Rainwater dissolved organic carbon: concentrations and global flux, Global Biogeochem. Cy., 14, 139–148, 2000.
Witkowska, A. and Lewandowska, A. U.: Water soluble organic carbon in aerosols (PM1, PM2.5, PM10) and various precipitation forms (rain, snow, mixed) over the southern Baltic Sea station, Sci. Total Environ., 573, 337–346, 2016.
Yan, G. and Kim, G.: Dissolved organic carbon in the precipitation of Seoul, Korea: Implications for global wet depositional flux of fossil-fuel derived organic carbon, Atmos. Environ., 59, 117–124, 2012.