the Creative Commons Attribution 4.0 License.
the Creative Commons Attribution 4.0 License.
 | 14 Jun 2018
The potential of 230Th for detection of ocean acidification impacts on pelagic carbonate production
Tatiana Ilyina
Marion Gehlen
Concentrations of dissolved 230Th in the ocean water column increase with depth due to scavenging and downward particle flux. Due to the 230Th scavenging process, any change in the calcium carbonate (CaCO3) fraction of the marine particle flux due to changes in biological CaCO3 hard-shell production as a consequence of progressing ocean acidification would be reflected in the dissolved 230Th activity. Our prognostic simulations with a biogeochemical ocean general circulation model using different scenarios for the reduction of CaCO3 production under ocean acidification and different greenhouse gas emission scenarios – the Representative Concentration Pathways (RCPs) 8.5 to 2.6 – reveal the potential for deep 230Th measurements to detect reduced CaCO3 production at the sea surface. The time of emergence of an acidification-induced signal on dissolved 230Th is of the same order of magnitude as for alkalinity measurements. Interannual and decadal variability in factors other than a reduction in CaCO3 hard-shell production may mask the ocean-acidification-induced signal in dissolved 230Th and make detection of the pure CaCO3-induced signal more difficult so that only really strong changes in marine CaCO3 export would be unambiguously identifiable soon. Nevertheless, the impacts of changes in CaCO3 export production on marine 230Th are stronger than those for changes in POC (particulate organic carbon) or clay fluxes.
- Article
(12689 KB) - Full-text XML
-
Supplement
(838 KB) - BibTeX
- EndNote


Progressing ocean acidification is a fact. It can be directly seen from measurements at Eulerian time series stations (e.g. Bates, 2007; Dore et al., 2009; Santana-Casiano et al., 2007) and also at larger depth from high-quality deep hydrography data (Olafsson et al., 2009). Depending on the emission scenario for CO2, the decrease in ocean pH and the decrease in carbonate saturation will continue and become more pressing during this century (e.g. Orr et al., 2005; Steinacher et al., 2009; Bopp et al., 2013). Temporal and regional patterns of changes in pH and carbonate saturation are relatively straightforwardly to project by Earth system models including marine inorganic carbon chemistry formulations (e.g. Bopp et al., 2013). They also can be monitored through long-term high-quality measurements of the inorganic carbon system. However, monitoring impacts of ocean acidification on biological processes remains challenging. While for some organisms, especially corals (Kleypas et al., 1999), detrimental effects due to decreasing pH and carbonate saturation have been determined, the various physiological impacts of ocean acidification on specific organisms and ecosystem functioning are still under investigation (e.g. Iglesias-Rodriguez et al., 2008; Kroeker et al., 2013; Meyer and Riebesell, 2015; Riebesell et al., 2007). At present, a series of possible pH dependencies of governing marine carbon cycle parameters (such as elemental stoichiometric ratios and nutrient uptake kinetics under biological particle production) are discussed. So far, the potential decrease in calcification due to the lowering of carbonate saturation under high pCO2 is among the key changes which may be expected to occur, especially when it comes to organisms building aragonite shells (the metastable form of CaCO3, calcite, has a lower solubility than aragonite) (Raven et al., 2005). Two important questions emerge: (1) if changes in biological calcification would indeed occur in the ocean during the coming years, how can they be detected and monitored by observational frameworks (through which methodology and through which variable)? (2) In which oceanic region could one observe early signals of these changes unambiguously at the earliest possible stage?
Development of such early warning systems is vital in order to check the validity of parameterisations of pH-dependent processes in ocean models and to take appropriate mitigation/adaptation measures to diminish the consequences of potential considerable ecosystem changes due to ocean acidification. Such changes could affect the marine food chain. In a global modelling study, Ilyina et al. (2009) quantified the detection thresholds for changes in alkalinity due to changes in a series of possible formulations for the reduction of calcification (with the term “calcification” we mean here the production of hard CaCO3 parts by marine biota) with pH decrease. The logic behind the approach of Ilyina et al. (2009) is as follows: if ocean acidification leads to a decrease in calcification, more ions would be retained in the surface water and not become incorporated into CaCO3 shell material. Changes in ion concentration would induce a change in ocean total alkalinity, which could eventually be measured against an earlier baseline. According to that study, the tropical Pacific (with high CaCO3 production rates) would be the region for detecting such alkalinity changes first, as the anticipated change in CaCO3 production would be largest there in absolute terms. For intermediate dependencies of CaCO3 production on pH/carbonate saturation, a reduction in biological calcification could unequivocally only be diagnosed from approximately the year 2035 on. In the Arctic Ocean, where pH changes are expected to be most pronounced, large-scale changes in calcification would be detectable even later on the basis of alkalinity measurements due to the overall lower biological production rates. Likewise, detection may be additionally complicated due to signals from natural seasonal and interannual variations in surface total alkalinity (Carter et al., 2016). There is thus a need for the development of novel detection methods. Heinze et al. (2006) investigated the impact of varying rain ratios CaCO3 : Corg on the distribution of the radionuclides thorium (230Th) and protactinium (231Pa), as well as beryllium (10Be). As the rain ratio describes the average amount of carbon atoms incorporated into CaCO3 shell material relative to the amount of carbon atoms incorporated into organic matter by plankton, a reduction in calcification would lead to a rain ratio decrease. Indeed, especially for 230Th, due to its affinity for scavenging to CaCO3 particles, a considerable increase in the concentration of dissolved 230Th with depth and time was obtained in a sensitivity experiment with strong rain ratio reduction. In this paper, we explore the option of using radionuclides for diagnosing changes in calcification and respectively reduced downward marine particle flux in more detail.
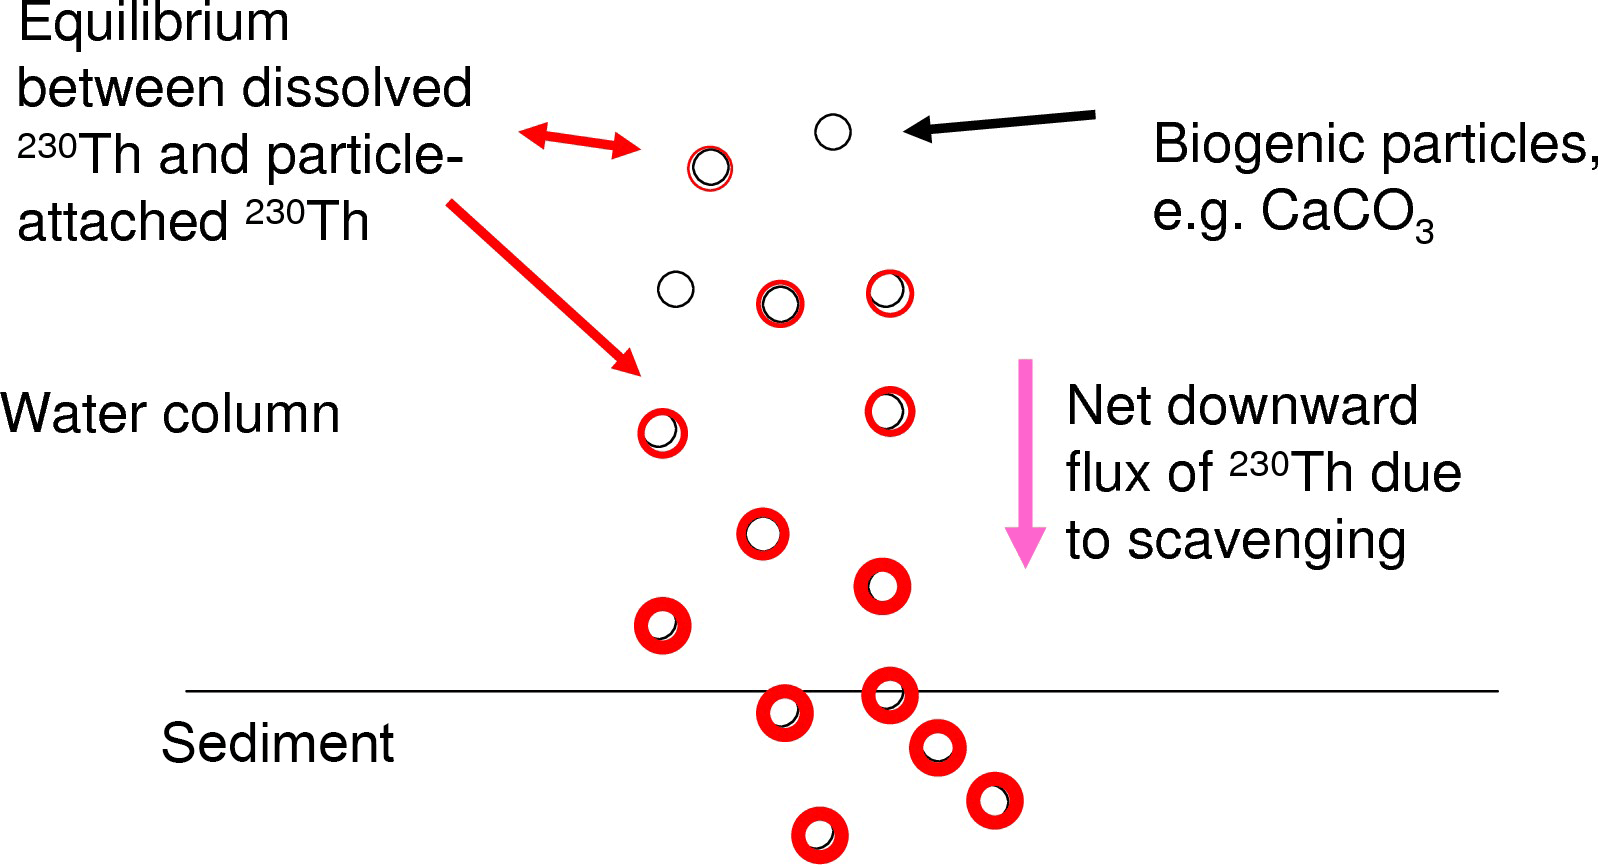
Figure 1Schematic illustration of the equilibration process between the dissolved and particle-attached phases of 230Th and the increasing concentrations downward in the water column.
We focus here on 230Th, a long-lived radionuclide (half-life 7.5 × 10⁴ yr) and a highly particle reactive metal. 230Th is produced in the uranium decay series. As uranium has a very long residence time in the ocean and quasi-homogenous concentrations in seawater, the present natural marine 230Th source is constant everywhere in the ocean water column and thus ideally suited for using 230Th as a tracer in modelling studies. 230Th is strongly particle reactive and is removed from the water column quickly through scavenging by the vertical particle flux in the ocean (for a summary, please see Henderson et al., 1999). The majority of 230Th is removed from the water column and will not re-enter the bottom waters, e.g. through sediment pore water diffusion (though resuspension may potentially cause some re-release). In spite of its strong particle reactivity, concentrations of dissolved 230Th show horizontal as well as vertical gradients in the water column which are induced by the oceanic current field and differential particle fluxes as well as particle concentrations (e.g. Henderson et al., 1999; Yu et al., 1996). The distribution of particle-bound 230Th follows the particle concentrations and particle fluxes. Both the dissolved 230Th and the particle-bound 230Th show nutrient-type vertical profiles with low values at the surface and increasing concentrations with depth. Dissolved 230Th increases with depth as particles continuously carry 230Th downwards and new equilibria between the dissolved phase and the particle-attached phase establish as illustrated in Fig. 1. The equilibrium between the concentration of the dissolved phase [230Thdiss] and the concentration of the particle-attached phase [230Thpart] can be described in an analog way to a chemical reaction equation:
The respective analog for the mass action law constant describing to which extent the reaction from left to right is carried out is then given through the kd value governing the equilibrium between the dissolved and particle-bound phases for the radionuclide:
Often, kd values are formulated to account for a shift of the equilibrium towards the particle-attached phase at low particle mass concentrations, assuming that low particulate concentrations occur in parallel to low particle sizes with correspondingly high reactive surface areas when compared to large particles (e.g. Honeyman et al., 1988). Respective formulations have been used successfully in 230Th modelling studies (Heinze et al., 2006; Henderson et al., 1999).
How would then the distribution of dissolved 230Th in the ocean reflect changes in marine calcification at the sea surface? There are indications that 230Th is attached first of all to CaCO3 and clay particles in the water column as preferential carrier phases (Chase et al., 2002, 2003; Luo and Ku, 1999; Hayes et al., 2015b). Indeed, Heinze et al. (2006) reproduced the large-scale 230Th distribution in the world ocean with a coarse-resolution biogeochemical ocean general circulation model based on a formulation allowing 230Th scavenging only by CaCO3 and clay particles. Other studies have indicated that preferential carrier phases may vary regionally in the ocean (Scholten et al., 2005). However, Heinze et al. (2006) could demonstrate that rain ratio changes (CaCO3 : Corg) in marine biological particle export production could also be recorded, if 230Th became in addition attached to particulate organic carbon (POC). A weakening of CaCO3 particle production would result in a less efficient 230Th scavenging as less particles (in terms of mass) would be available to carry 230Th to larger depths and finally the sediment. Changes in the strength of CaCO3 production and the respective downward particle flux are reflected increasingly better in the 230Th distribution with increasing depth (see Heinze et al., 2006) due to two reasons. First, CaCO3 particles get less well degraded as POC (which is remineralised mostly in the upper 1000 m of the water column) and thus reach larger depth; this is also corroborated from sediment trap measurements (e.g. Honjo, 1996). Second, due to the scavenging of 230Th by particles, the vertical downward particle flux, and the equilibration between dissolved and particle-bound phases, 230Th is continuously transferred from shallower layers to larger depths. Thus, temporal changes in 230Th scavenging in the upper ocean become enlarged in the deep 230Th distribution as in a kind of “magnifying glass” (see Fig. 1). We investigate here whether this feature can be exploited for an early detection method of large-scale reductions in calcification and correspondingly reduced rates in CaCO3 particle export and CaCO3 particle fluxes through the water column.
In this study, we use the Hamburg ocean carbon cycle circulation model, HAMOCC (Maier-Reimer, 1993), in its annually averaged version (time step of 1 year; Heinze and Maier-Reimer, 1999; Heinze et al., 2009, 2016) with a horizontal resolution of 3.5∘ × 3.5∘. This coarse-resolution model is computationally very efficient and useful when multiple integrations are needed, such as for the testing and adjusting of scavenging codes. An advantage of this fast model is that it includes a fully equilibrated early diagenesis module (10 layers) under each grid point and thus can account for alkalinity changes induced by dissolution of CaCO3 from the seafloor. The model version employed here corresponds to the version used in Heinze et al. (2009, 2016) with a slightly updated scavenging module of Heinze et al. (2006) with respect to the formulation of the equilibrium coefficient governing the distribution of 230Th between the dissolved and particle-attached phase (see below). For details, please see those publications. The model uses a fixed ocean velocity field (and thus provides no dynamical computation of the ocean currents; velocities, temperature, salinity, and ice cover are rather read from an input file). The model includes an atmospheric compartment (“slab atmosphere”) which allows for prognostic computation of the atmospheric CO2 concentration as well as meridional atmospheric CO2 transport. We describe here only briefly features of specific relevance for this study. The water column is structured into 11 layers (centred at 25, 75, 150, 250, 450, 700, 1000, 2000, 3000, 4000, and 5000 m). The bioturbated top sediment zone of the early diagenesis module is divided into 10 layers which are separated by interfaces at 0, 0.3, 0.6, 1.1, 1.6, 2.1, 3.1, 4.1, 5.1, 7.55, and 10 cm “downcore”. We make the simplifying assumption that no pore water reactions take place below 10 cm depth in the sediment (see, e.g. Smith and Rabouille, 2002; Boudreau, 1997). The biogeochemical model includes the processes of air–sea gas exchange, biogenic particle export production out of the ocean surface layer, particle flux through the water column and particle degradation by dissolution as well as remineralisation, transport of dissolved substances with the ocean currents, deposition of particulate constituents on the ocean floor, pore water chemistry and diffusion, advection of solid sediment weight fractions (organic carbon, organic phosphorus, CaCO3, opal, and clay), bioturbation, and sediment accumulation (export out of the sediment mixed layer). The model predicts the following tracer concentrations in the atmosphere, the ocean water column, and in the sediments. Atmospheric tracers include the concentrations of CO2 (carbon dioxide) and O2. In the water column, concentrations of DIC (dissolved inorganic carbon), POC (particulate organic carbon), POP (particulate organic phosphorus), DOC (dissolved organic carbon), CaCO3 (calcium carbonate or particulate inorganic carbon), dissolved oxygen O2, dissolved as the biolimiting nutrient, silicic acid Si(OH)4, and opal (biogenic particulate silica – BSi) are calculated. In the sediment pore waters, the same dissolved substances as in the water column, as well as solid sediment constituents such as clay, CaCO3, opal, and organic carbon, are simulated. The inorganic carbon chemistry is computed following Dickson et al. (2007). In the advection scheme and for the other chemical reactions, DIC and total alkalinity (TAlk) are used as “master tracers” form which derived quantities such as the concentration and the pH value are computed through a Newton–Raphson algorithm. In the annually averaged model as employed in this study, only export production of biogenic particles is modelled (and no explicit phytoplankton and zooplankton concentrations). Particle production takes place in the model surface layer representing the euphotic zone. Phosphate serves as the biolimiting nutrient. POC and opal export productions are simulated following Michaelis–Menten kinetics for nutrient uptake (e.g. Sarmiento and Gruber, 2006) (where the phytoplankton concentration is replaced by the phosphate concentration as ecosystem processes as such are not explicitly modelled):
and
where PPOC and Popal are the POC and opal export production rates (mol L−1 yr−1), Red(C : P) is the Redfield ratio C : P, and are the maximum uptake rate of phosphate and silicic acid from the water column (yr−1), and as well as are the respective half-saturation constants. , , , and are simulated as a function of sea surface temperature as described by Heinze et al. (2003). POP production follows POC production with a constant stoichiometry here. The export production of CaCO3 is coupled to the local production ratio Popal ∕ PPOC. It starts to increase gradually (parameter R; see below) if Popal ∕ PPOC sinks below a threshold value Sopal, i.e. when not enough silicic acid is available in the ocean surface layer to fuel full diatom growth:
Parameter R is the maximum possible rain ratio C(CaCO3) : C(POC), a is the CaCO3 saturation-dependent factor to account for an ocean acidification impact (see Fig. 2, following Ilyina et al., 2009), and Sopal is the threshold value of Popal ∕ PPOC for gradual onset of CaCO3 production. Particle fluxes and particle degradation are simulated through balance equations for sinking particulate matter as in Heinze et al. (2009, 2016), taking the saturation state for CaCO3 and biogenic silica into account.
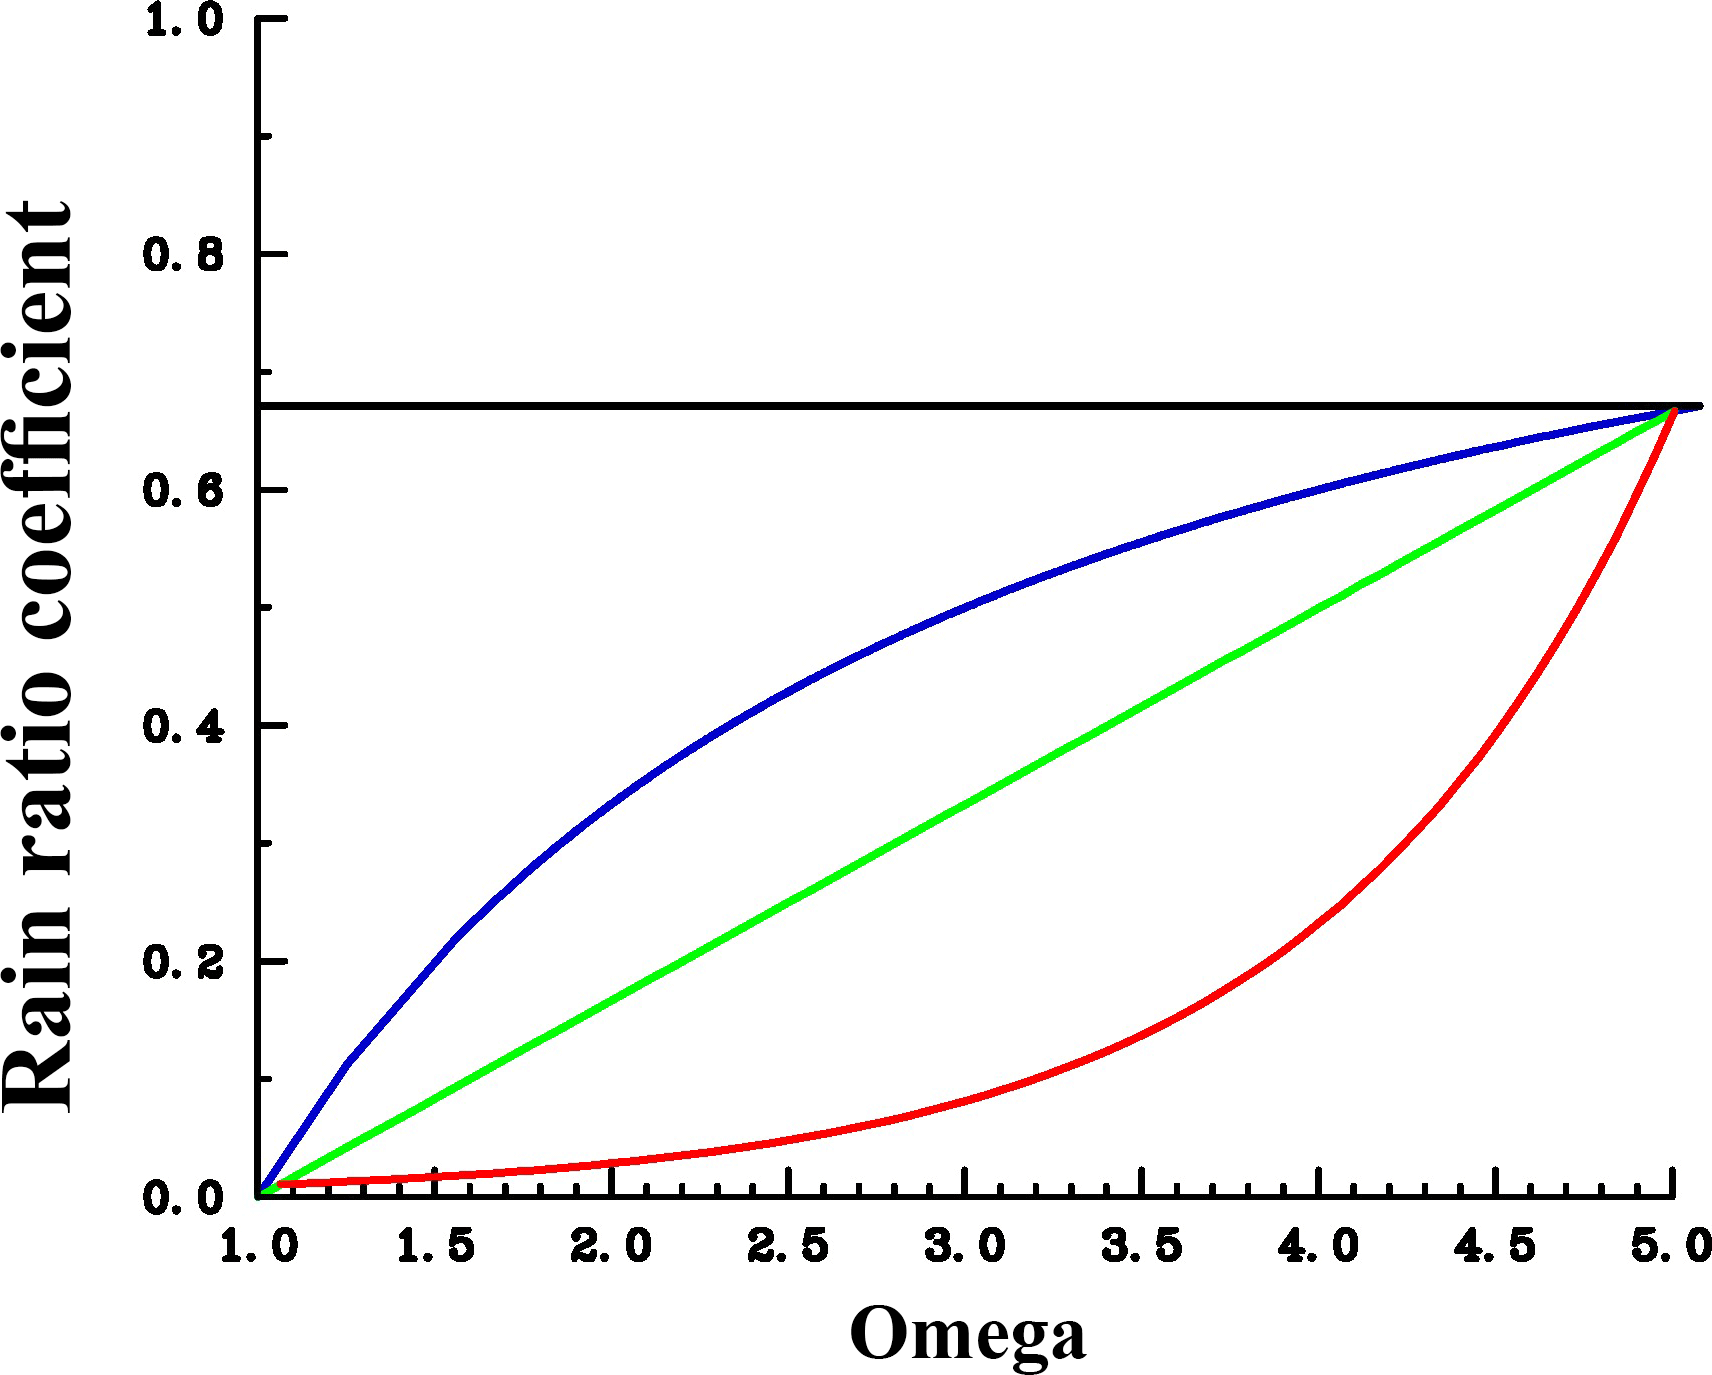
Figure 2Assumed sensitivities of CaCO3 export production in response to changes in calcite saturation (Ω). The rain ratio coefficient is used as factor “a” applied to the right-hand side of the equation for CaCO3 production (see Eq. 1). For the control run, a was fixed at each grid point according to the prevailing pre-industrial carbonate saturation (following the moderate sensitivity). Blue: moderate sensitivity. Green: linear sensitivity. Red: extreme sensitivity. The shape of the curves would look similar at each grid point; only the pre-industrial crossover point would be different.
Scavenging of 230Th is simulated according the reversible first-order scavenging reaction (Gehlen et al., 2003; Heinze et al., 2006):
cpart is the concentration of particle-bound 230Th, cdiss the concentration of dissolved 230Th, and the equilibrium concentration of particle-bound 230Th. The first-order rate constant K (in yr−1) is set here to 104 yr−1, thus assuming a quasi-instantaneous equilibration. Concentration of suspended particulate material is represented by M. For the partitioning coefficient kd between the dissolved and particle-attached phases of 230Th, we follow the formulation of Honeyman et al. (1988), which accounts implicitly for the changing reactive surfaces of particles with particle size
where M is the particle concentration (here taken in mg particles per litre) and A as well as B are tuneable parameters. In addition to 230Th, we carry also 231Pa as well as 10Be in our model (see Heinze et al., 2006) but focus here on 230Th only. For each of these radionuclides, the preferential carrier phase can be selected in a dedicated switchboard. For 230Th scavenging, we used here CaCO3, POC, and clay as carrier phases. With introducing a particle-specific scavenging following Hayes et al. (2015b), the final formulation for the scavenging equilibrium coefficient then becomes
where C and F are the weighting coefficients and fractions of total local particle mass. The A, B, and C values are included in Table 1. Atlantic and Pacific cross sections with the kd values for the control simulation without CO2 emissions are given in Fig. S1 (in the Supplement).
The clay flux is computed according to the modern dust deposition from Mahowald et al. (1999) assuming that respective clay particles are chemically quasi-inert in seawater. Particle-bound 230Th phases never get to zero, even if all biogenic particles are degraded, because at each grid point there is – at least a tiny – dust flux consisting of inert clay. Therefore, particle concentrations as such never go to zero (a minimum concentration could be prescribed, but this was not necessary in our case). Because the Atlantic dust deposition may be overestimated (Gehlen et al., 2003), we assumed for the 230Th scavenging only 25 % of the respective clay flux strength in order to avoid too strong scavenging in Atlantic surface waters (see also our sensitivity experiment assuming 100 % in comparison below). We allow biological production under sea ice scaled with the local sea ice thickness.
The model was spun up restarting from an earlier integration and computed into quasi-equilibrium including the sediment over 40 000 years. The equilibrium coefficient kd was determined through a visual fit to observations of dissolved 230Th taken from the literature (Bacon and Anderson, 1982; Bacon et al., 1989; Chase et al., 2002; Cochran et al., 1987, 1995; Colley et al., 1995; Guo et al., 1995; Huh and Beasley, 1987; Moore, 1981; Moran et al., 1995, 1997; Nozaki and Horibe, 1983; Nozaki and Yang, 1987; Nozaki et al., 1987; Roy-Barman et al., 1996; Scholten et al., 1995; Vanderloeff and Berger, 1993; Vogler et al., 1998) and combined with the data as given in the GEOTRACES intermediate data product version 3 (Mawji et al., 2015; Hayes et al., 2015a, b; Deng et al., 2014). Important global bulk numbers and the parameters for the partitioning coefficient kd are listed in Table 1.
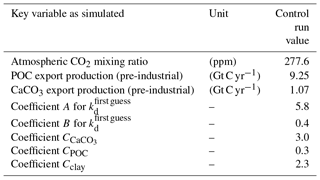
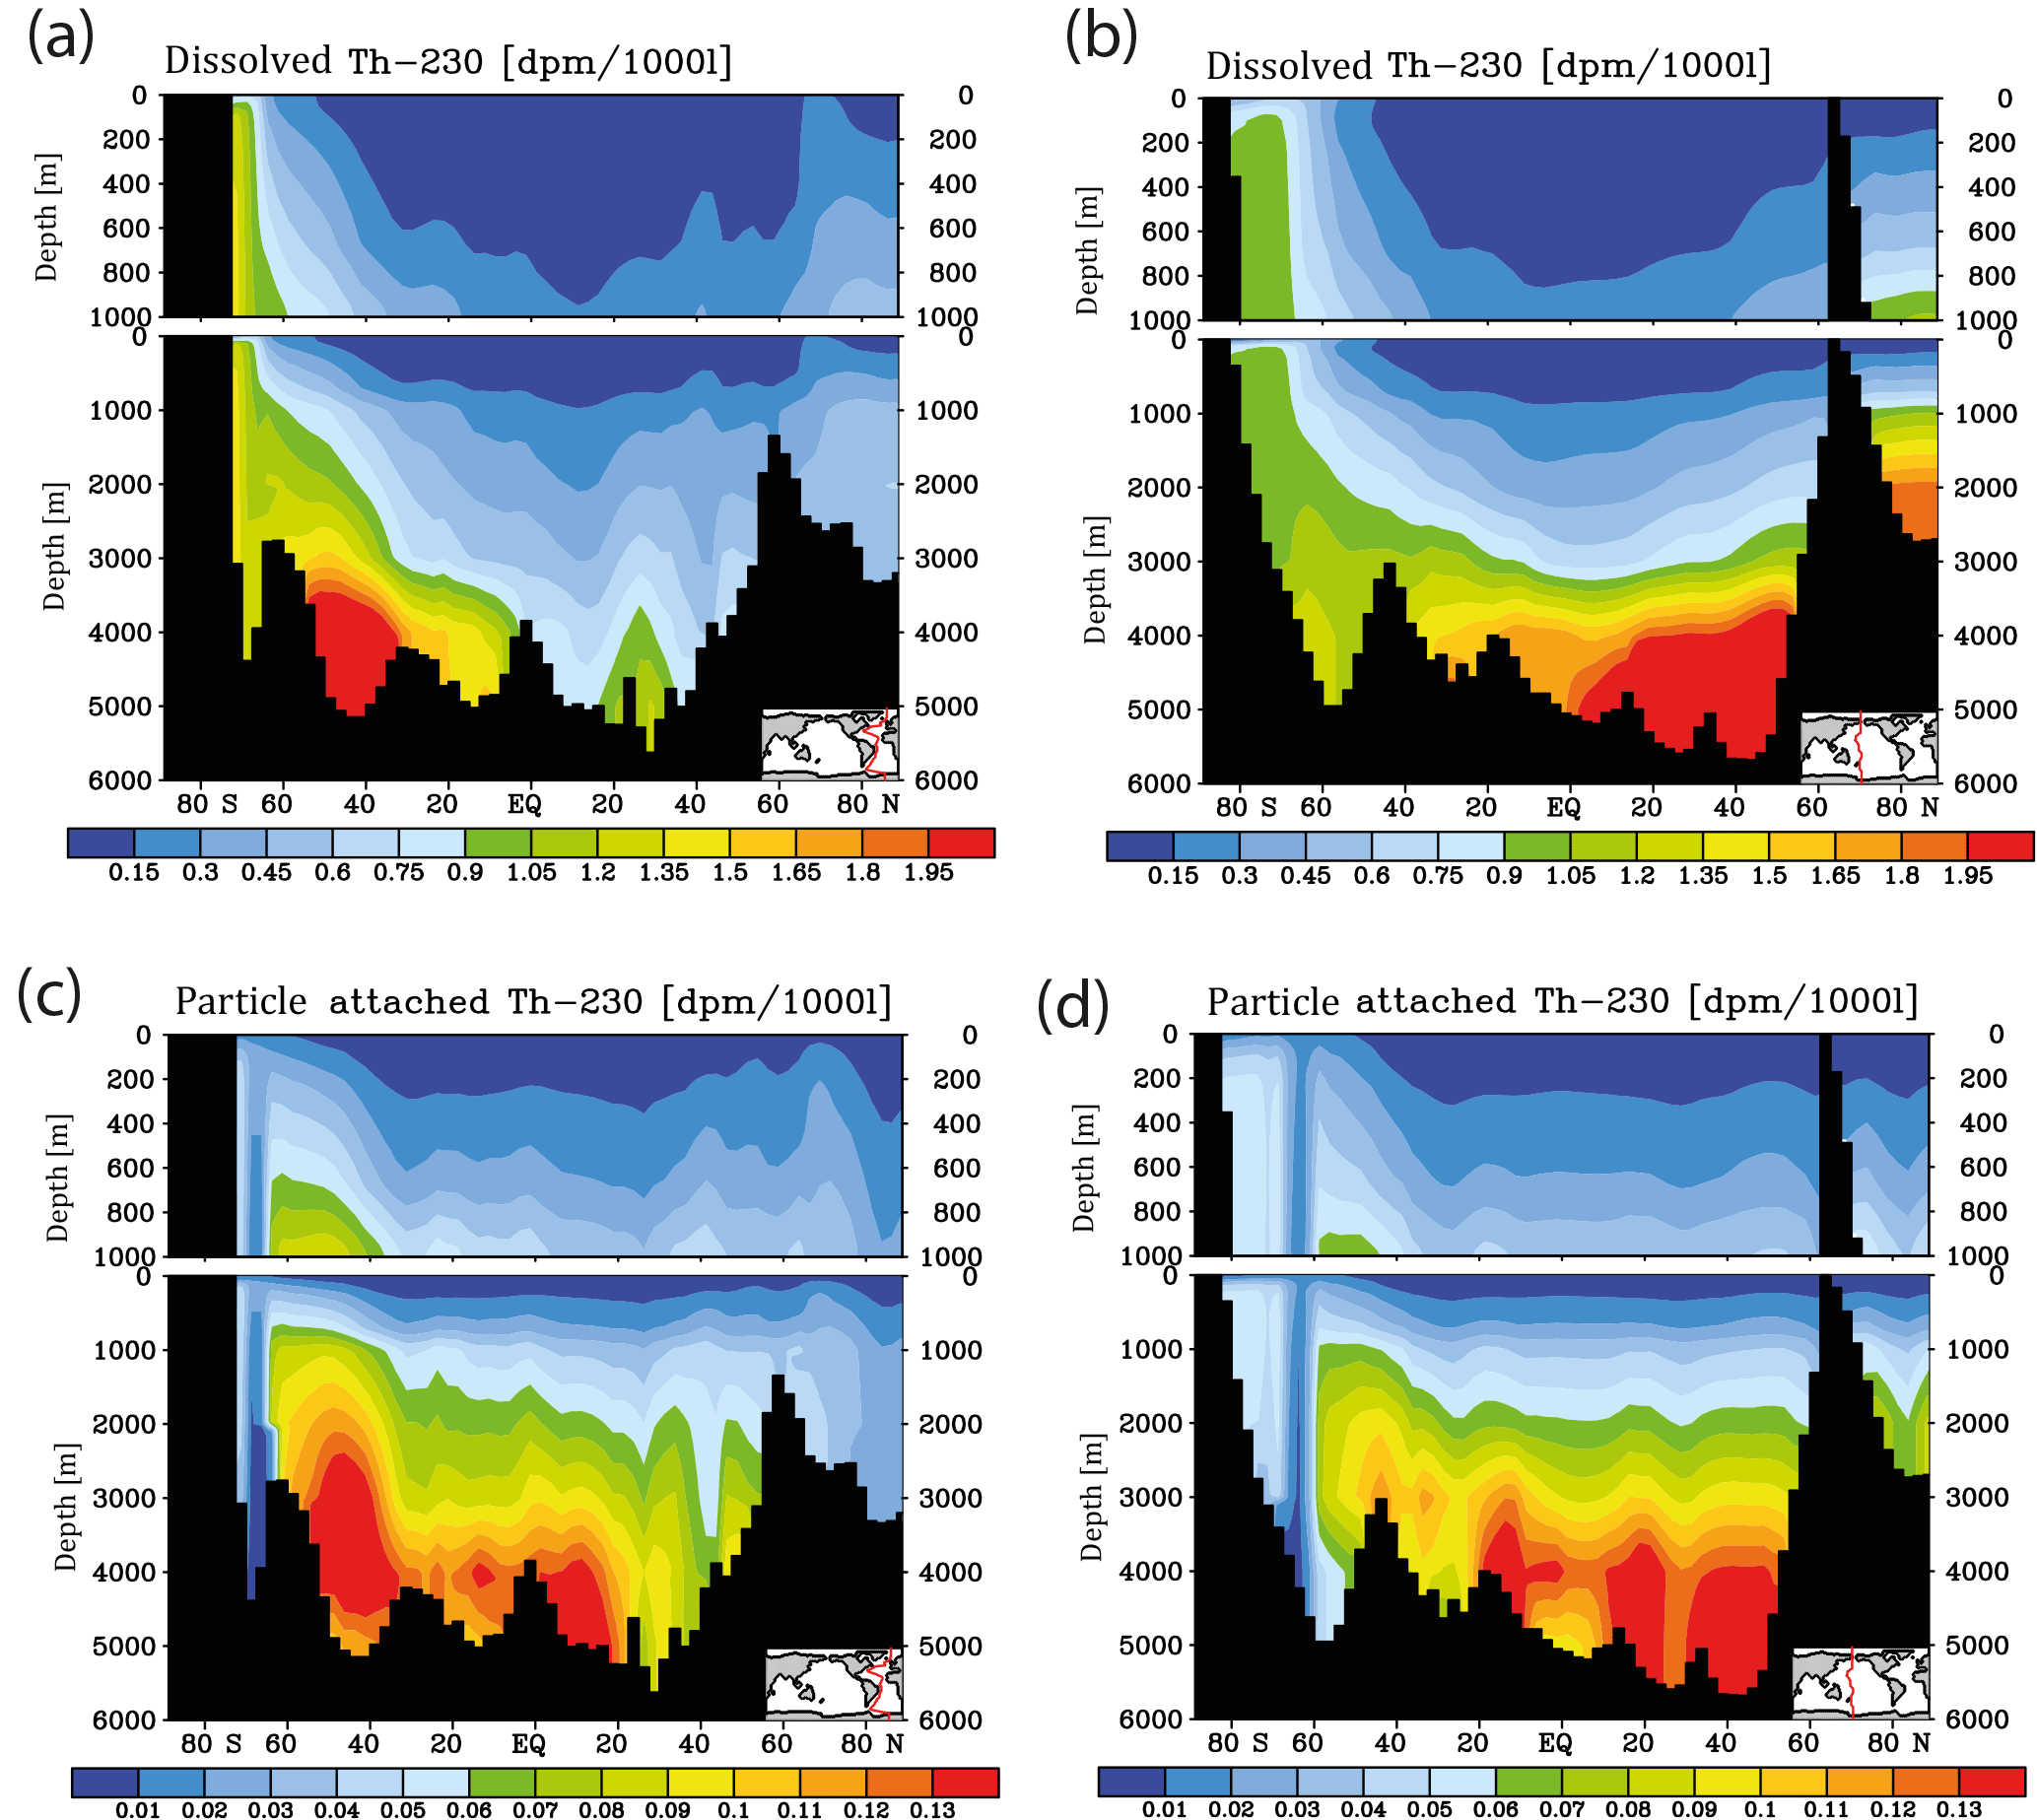
Figure 3Meridional 230Th cross sections in dpm/1000 L (dpm indicates disintegration per minute) for the model control run under pre-industrial atmospheric CO2. (a) Dissolved, Atlantic. (b) Dissolved, Pacific. (c) Particle attached, Atlantic. (d) Particle attached, Pacific.
Meridional sections of dissolved 230Th concentrations for the Atlantic and Pacific oceans are given in Fig. 3. The vertical distribution clearly shows the increase of concentrations with depth due to the downward transfer of 230Th with the marine particle flux. A comparison of simulated and observed dissolved 230Th values in the water column along a meridional Atlantic cross section (Fig. 4) indicates that the model dissolved 230Th is in fairly good agreement with observations, except for a strong overestimation in some bottom water locations. This could be due to deficiencies in the flow field and corresponding problems or due to the lack of explicit simulations of hydrothermal vents and sediment resuspension. We carried out a respective sensitivity experiment (see discussion further below). A scatter plot of modelled and observed 230Th values and the locations of stations with observed data are shown in Fig. 5. The standard-run export production rates for POC and CaCO3 are given as maps in Fig. 6.
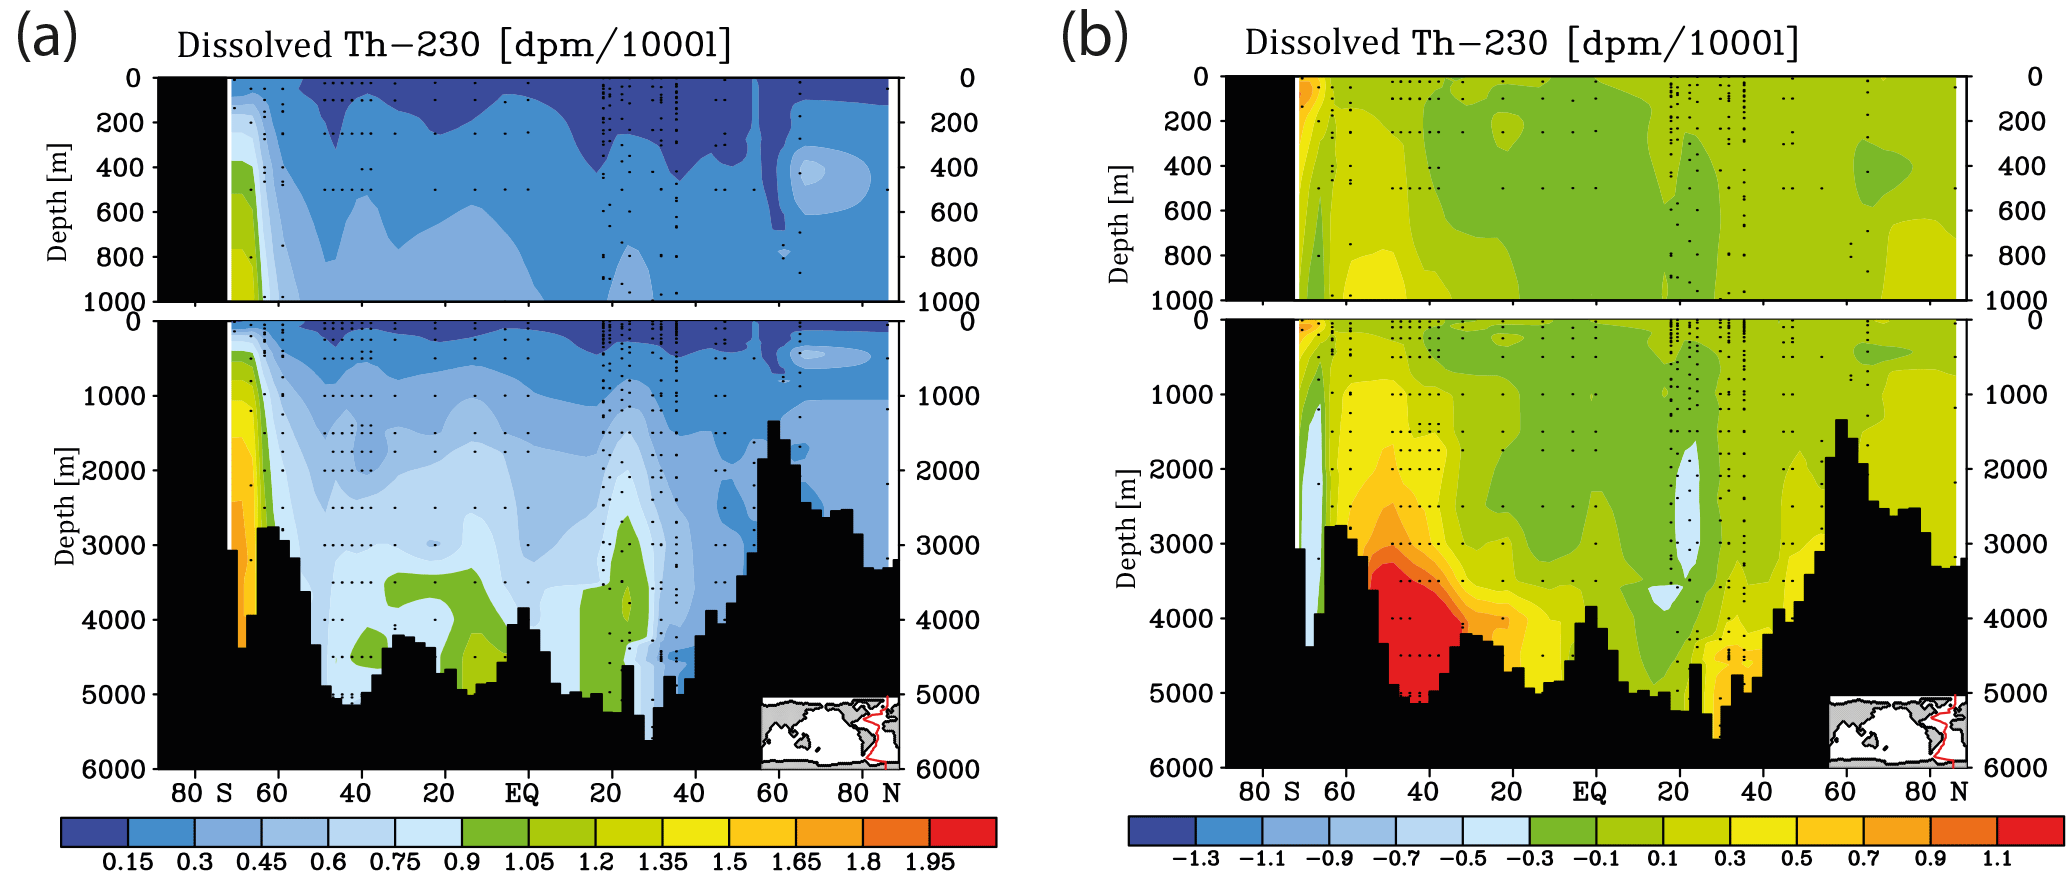
Figure 4Meridional dissolved 230Th Atlantic Ocean cross sections in dpm/1000 L (dpm indicates disintegration per minute): (a) interpolation from observations (data from the GEOTRACES intermediate data product; for references, please see the text). (b) Difference between the model values from the control run without CO2 emissions and the observations.
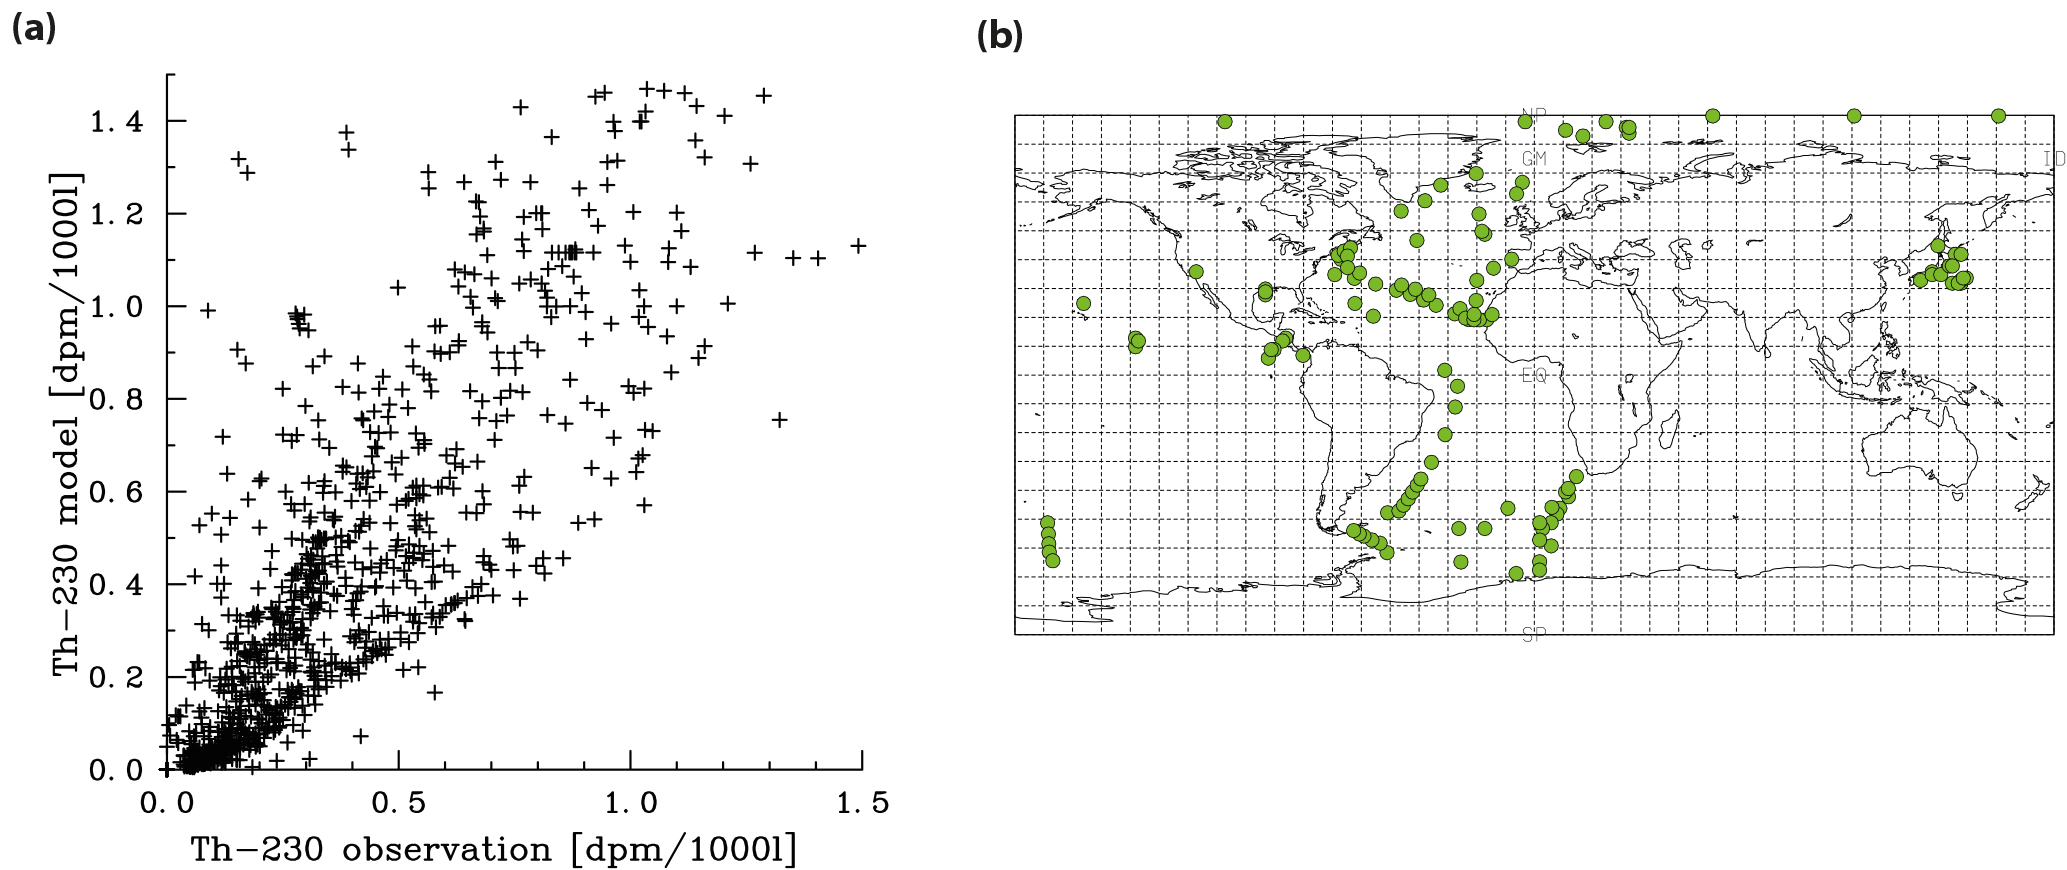
Figure 5Comparison of dissolved 230Th model results with observations (for references of observations, see the text). (a) Correlation between observations and modelled values. (b) Location of all vertical profiles used in this work.
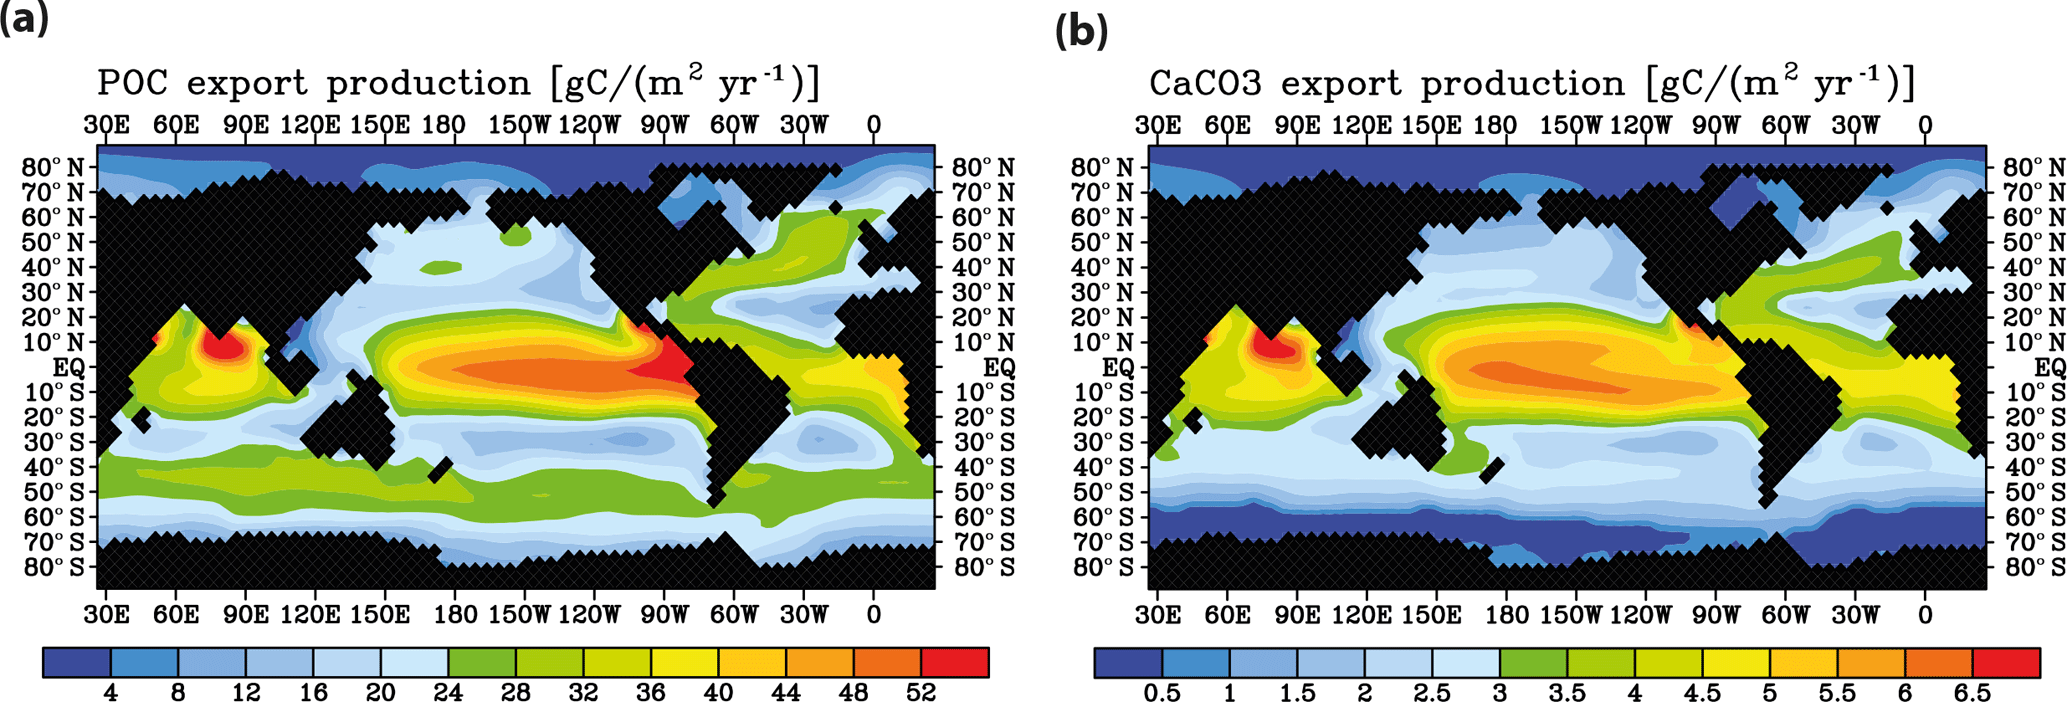
Figure 6Model control run results for (a) biological export production of particulate organic carbon and (b) CaCO3 export.
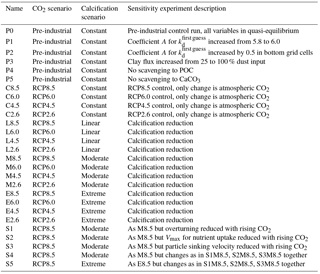
An overview concerning all model simulations is given in Table 2. We carried out model projections under four different scenarios for changes in calcification (including control runs with constant calcification but rising atmospheric CO2) and four different scenarios of the future development of the atmospheric CO2 concentration (C8.5–2.6, L8.5–2.6, M8.5–2.6, and E8.5–2.6; see Table 2). All scenarios were restarted from the same previously performed spin-up model run reflecting a pre-industrial biogeochemical state of the ocean. Throughout the experiments, the ocean circulation field was not changed. The model was integrated during the calendar years 1200–2300 spanning a period of 1100 years. In the model spin-up simulation, the atmospheric CO2 concentration was a prognostic variable. For the computations from 1700 onwards, we prescribed the atmospheric CO2 concentration according to the Representative Concentration Pathways (RCPs) including their extension to the year 2300 (van Vuuren et al., 2011) used in CMIP5 (Coupled Model Intercomparison Project phase 5). Our simulations follow scenarios RCP2.6, RCP4.5, RCP6.0, and RCP8.5 designed to span a range of radiative forcing between 2.6 and 8.5 W m−2 by the year 2100. The respective atmospheric CO2 concentrations are shown in Fig. S2. For the decrease in calcification with decreasing pH as well as carbonate saturation, functional relationships between CaCO3 export production and carbonate saturation were chosen which correspond to the respective experiments in Ilyina et al. (2009). For each RCP, we carried out a control simulation with constant calcification, a moderate decrease of CaCO3 production with decreasing saturation, a linear dependency simulation with respectively stronger decrease in CaCO3 production), and an extreme scenario (Fig. 2). To date, no clear bulk formulation for the dependency of CaCO3 export on CaCO3 saturation exists. Therefore, the scenarios carried out here are only sensitivity experiments and not overall exhaustive simulations in order to reproduce the entire range of possible changes in ocean biogeochemistry.
As an indication for the robustness of our results, a suite of sensitivity experiments was carried out. In a first set of sensitivity experiments (P1–P5, Table 2), we investigated how much the pre-industrial control simulation depends on selected parameter choices. In P1, parameter A for was slightly increased from 5.8 to 6.0 in order to test the dependency of the result from small changes in the still not very precisely known kd value for 230Th. Given the effect of release of material from hydrothermal vents and resuspension of material from the sediments, we carried out experiment P2 with a strong increase in scavenging in the lowermost wet model grid cells (directly over the ocean floor). To this end, parameter A for was increased by 0.5 units in these grid boxes. In our general reference run (P0), we applied scavenging to clay, as if the clay flux would only be 25 % of its prescribed value. Therefore, we also added the P3 run, where 100 % clay flux was assumed also for the 230Th scavenging. Finally, in experiments P4 and P5, we switched off the scavenging to POC and CaCO3, respectively, in order to see the importance of these two biogenic particle species on the 230Th distribution.
In a second set of sensitivity experiments, we tested how sensitive the future projection of dissolved 230Th is in view of factors other than changes in CaCO3 production (S1–S5; see Table 2). Because we use an annually averaged model without seasonal cycle and also employed fixed annual mean velocity field, we have to use approximations in order to see the effect of a change in the velocity field or other changes involving interannual/decadal variability. We use here the time series of the Atlantic meridional overturning from the fully fledged Earth system model NorESM for a historic ramp-up and subsequent RCP8.5 forcing (Tjiputra et al., 2016; see Fig. 2 therein). In experiment S1, we scaled the three-dimensional velocity field (and also the convective mixing representation) of our simplified model with this time series, leading to an overall reduction in circulation strength. The formulation for this scaling is
with Y being a scalar variable (such as the velocity components in the x, y, and, z directions, the convective adjustment, or other specific biogeochemical parameters), Yscaled the value as updated for the sensitivity experiments, Yreference the original value used in the reference run, and ΔOverturning the relative change in Atlantic meridional overturning between a specific year after the year 1850 and the year 1850 itself (ΔOverturning would be zero until 1850). Using this scaling, we also investigated separately from a circulation change the consequences of variations in the maximum nutrient uptake velocity Vmax in our simple trophic model (a reduction in Vmax could be seen as a deterioration of growth conditions for plankton under climate change) (run S2), and in the sinking velocity of particles (corresponding to, e.g. a loss in ballast material) (run S3). In experiments S4 and S5, finally, the simultaneous effects of changes in the circulation, Vmax, and the particle sinking velocity were explored for the moderate (S4) and the extreme (S5) calcification scenarios. The list of potential factors with an influence on 230Th is much longer; however, our choice of factors covers at least the physical forcing through the velocity field, surface biogeochemistry through Vmax, and three-dimensional biogeochemistry through the particle sinking speed.
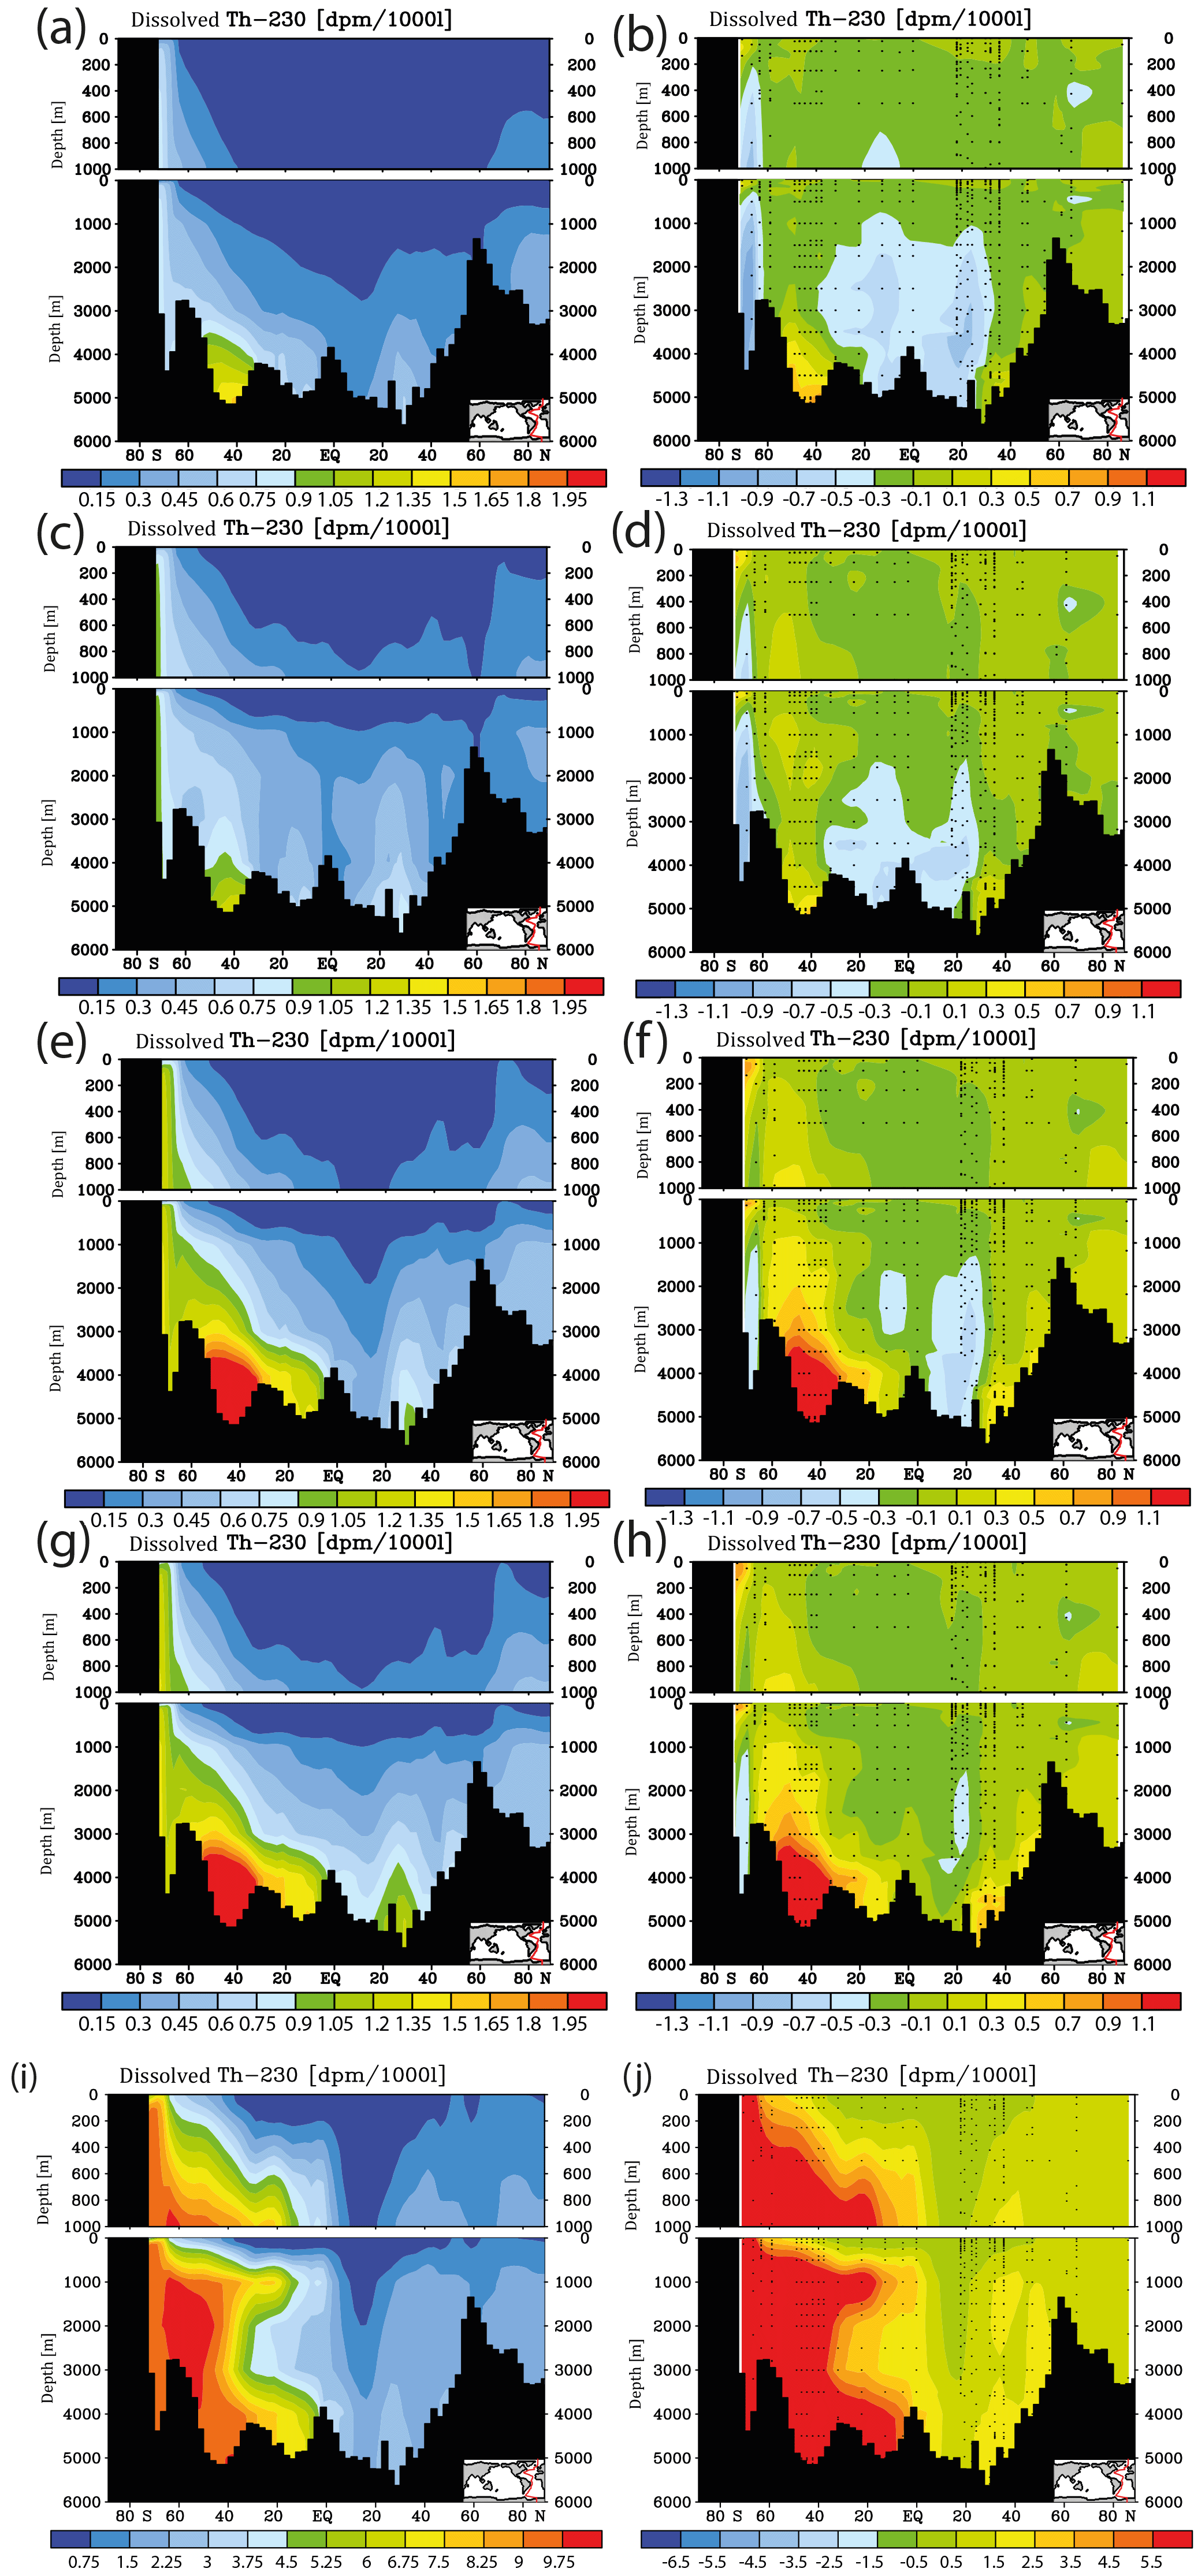
Figure 7Meridional dissolved 230Th Atlantic Ocean cross sections in dpm/1000 L (dpm indicates disintegration per minute) for sensitivity experiments. (a) Kd increased everywhere (by log (Kd) = +0.2). (b) Same as panel (a) but the difference between model and observations. (c) Kd increased only in the model grid cells directly over the ocean floor (see text). (d) Same as panel (c) but the difference between model and observations. (e) Clay flux increased to 100 % of control run value. (f) Same as panel (e) but the difference between model and observations. (g) No scavenging to POC. (h) Same as panel (g) but the difference between model and observations. (i) No scavenging to CaCO3. (j) Same as panel (i) but the difference between model and observations. Please note changes in colour codes relative to panels (a)–(h). (Observed data are from the GEOTRACES intermediate data product; for references, please see the text.)
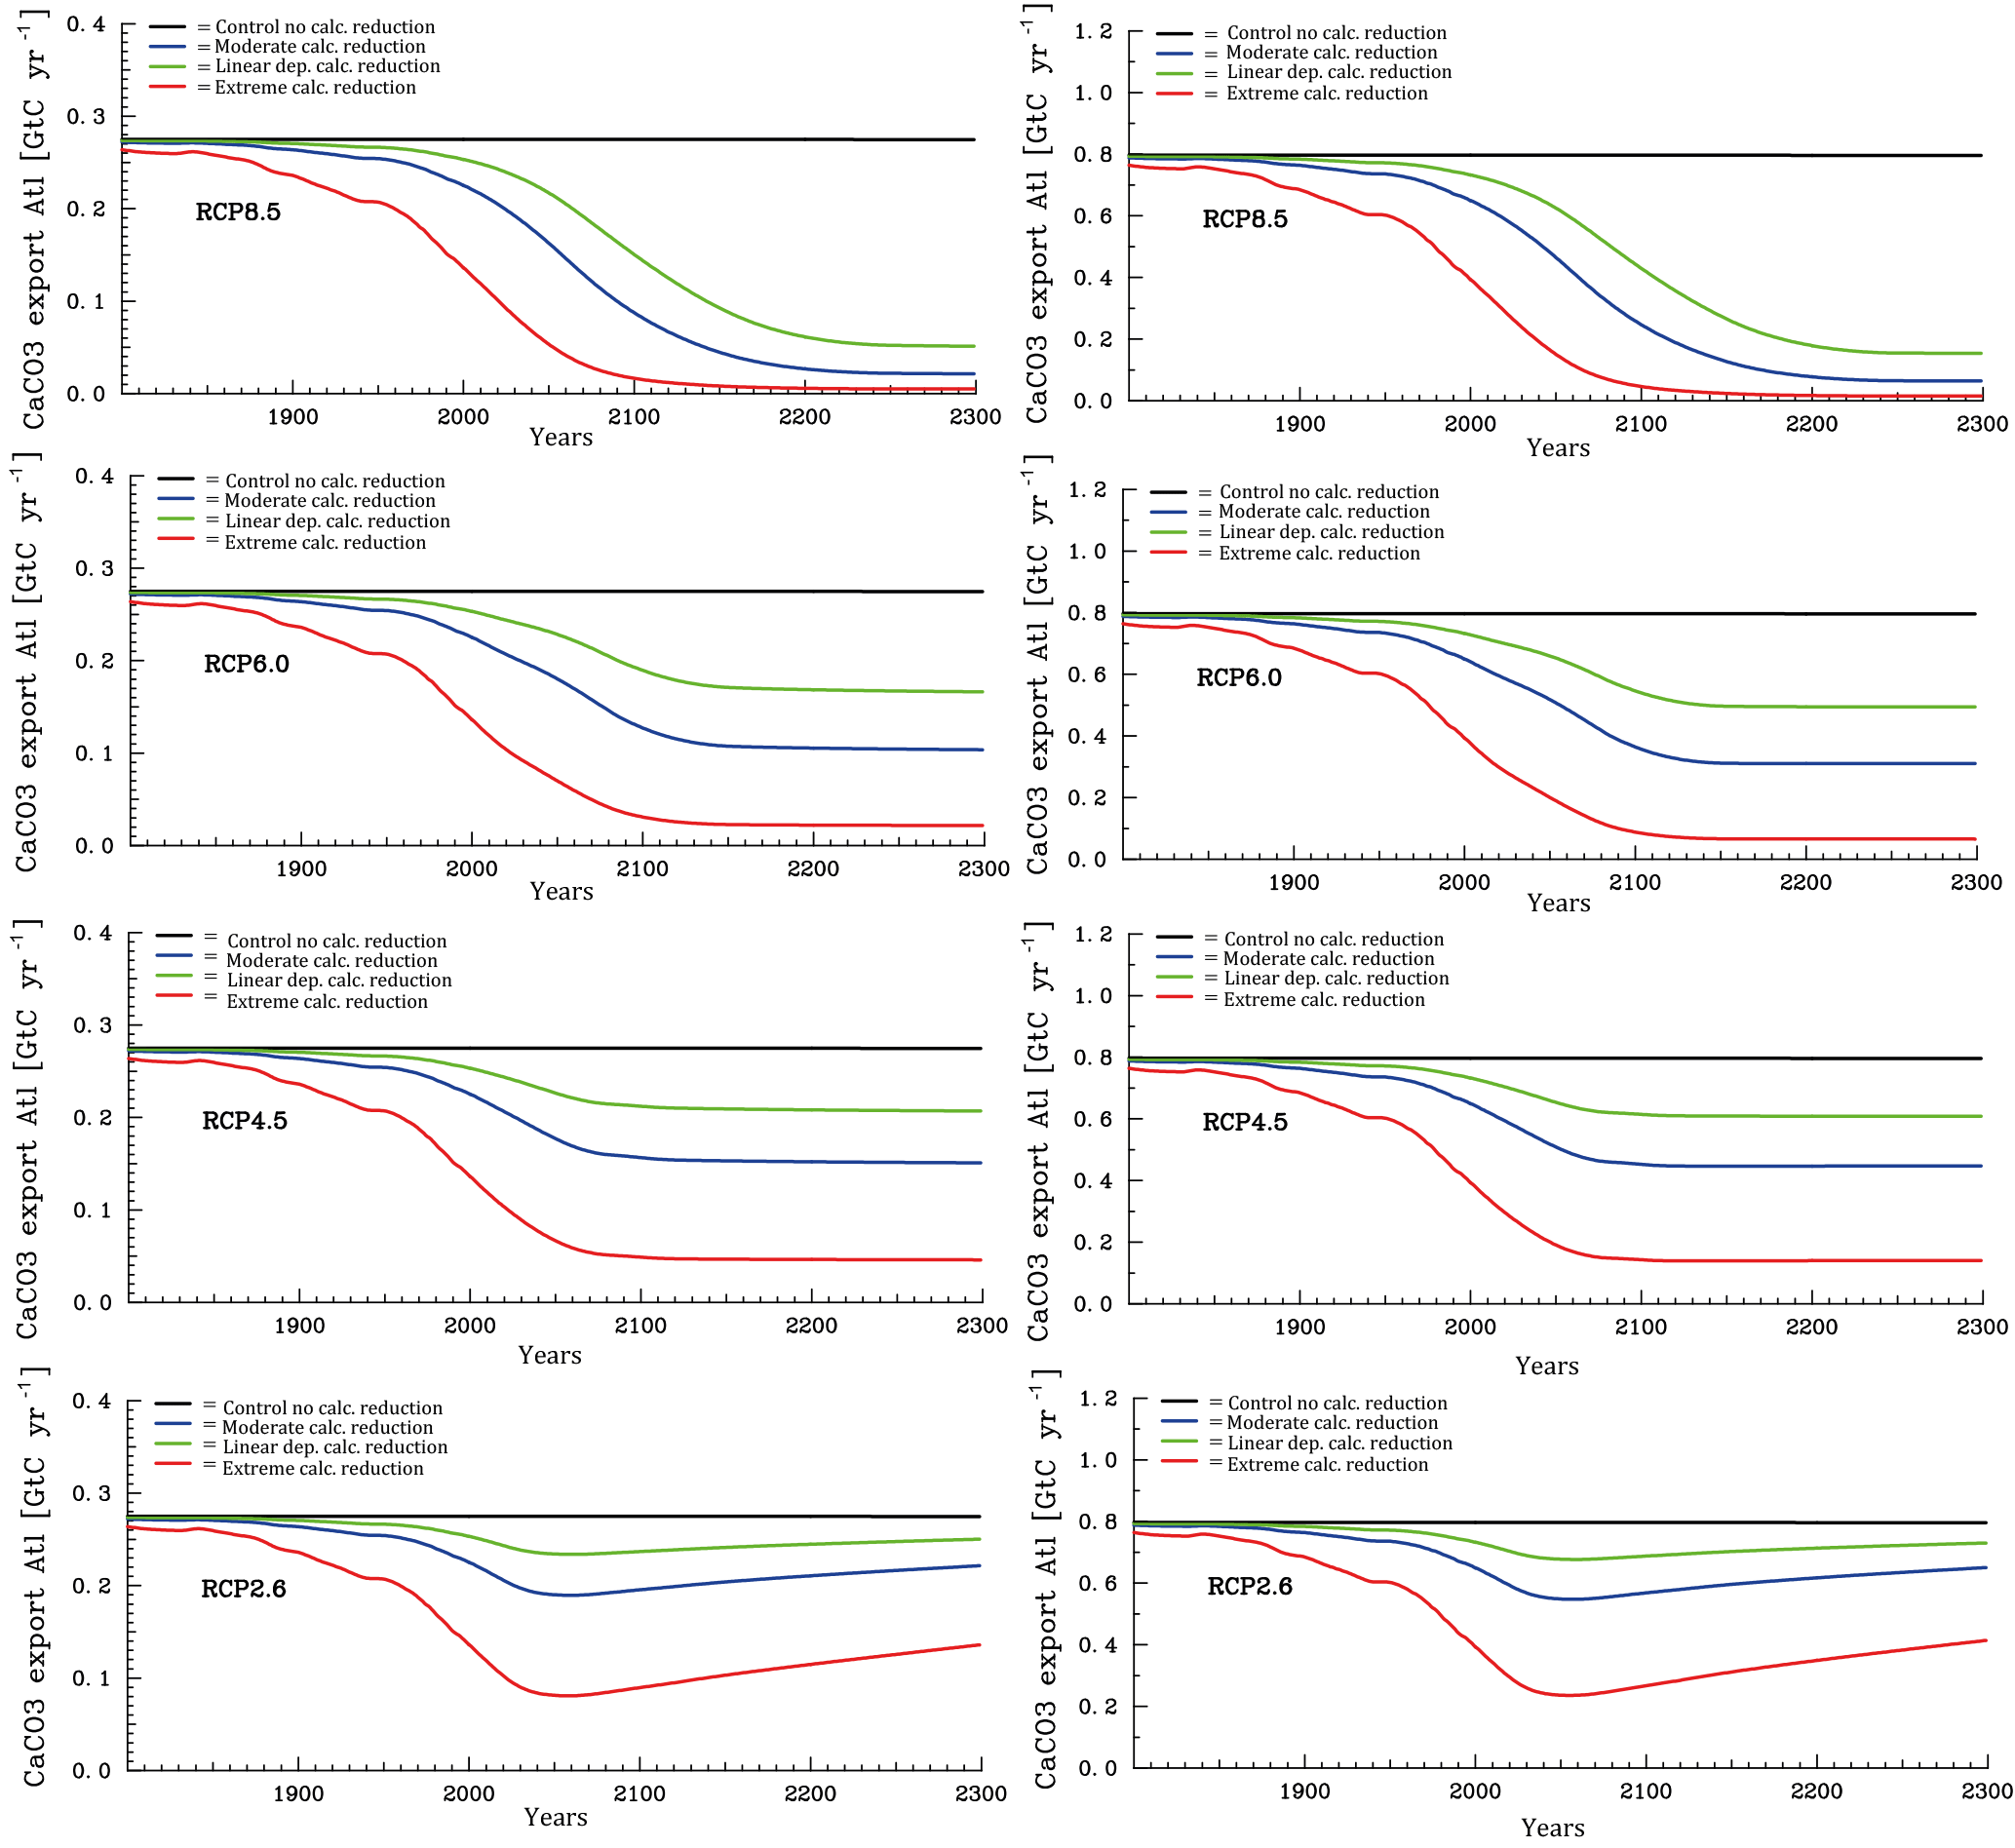
Figure 8Temporal evolution of Atlantic (left column panels) and Pacific (right column panels) annual mean CaCO3 export production under the different scenarios for the sensitivity of calcification under high CO2 (unit: Gt C yr−1). From top to bottom for greenhouse gas scenarios RCP8.5, RCP6.0, RCP4.5, and RCP2.6.

Figure 9Time series for the evolution of mean Atlantic (left column panels) and Pacific (right column panels) dissolved 230Th concentrations at 2000 m under the different scenarios for reduction of calcification under high CO2 (unit: dpm/1000 L). From top to bottom for greenhouse gas scenarios RCP8.5. RCP 6.0, RCP4.5, and RCP2.6. The orange line indicates the theoretical detection limit for changes with respect to the pre-industrial limit. (Respective diagrams for depth levels 700 and 4000 m are given in Figs. S3 and S4.)
The results from the sensitivity experiments relative to the pre-industrial control run are summarised in Fig. 7. Increasing the scavenging equilibrium coefficient in general (run P1, Fig. 7a and b) or over the ocean bottom (run P2, Fig. 7c and d) corrects to a substantial degree the too high bottom water vales for dissolved 230Th in the southern Atlantic but leads to high relative errors in the upper few hundred metres (where 230Th concentrations are generally low). Too low upper ocean 230Th concentrations occur also for increasing the scavenging to 100 % of the clay flux (run P3, Fig. 7e and f). Omitting, the scavenging to POC has only minor influence on the 230Th distribution because of the relatively shallow recycling of POC (run P4, Fig. 7g and h). In contrast, cancelling the scavenging to CaCO3 (and only retaining that to POC and clay) leads to a completely unrealistic dissolved 230Th distribution with at least a 5-fold overestimation (run P5, Fig. 7i and j; note change of colour code in Fig. 7i and j). These results demonstrate that the choice of critical parameters for our pre-industrial reference simulation (run P0) results in a reasonable dissolved 230Th distribution. The crucial role of CaCO3 particles for determining water column 230Th has been confirmed.
We discuss now the results for the projections. According to the various scenarios applied, considerable changes in surface alkalinity (not shown) and corresponding changes in CaCO3 export production evolve at high CO2 (Fig. 8). The effect is on average larger in the Pacific than in the Atlantic due to the overall higher modelled biological production rates of CaCO3 in the Pacific Ocean. The extreme calcification scenario would lead to vastly reduced CaCO3 export production after the year 2100 in all RCPs except the most moderate (RCP2.6), where even a partial recovery occurs.
For dissolved 230Th, we show here time series for depth levels 700, 2000, and 4000 m (Figs. S3, 9, and S4, respectively). According to recent intercalibration experiments, sizable discrepancies still exist between the absolute values in 230Th measurements from different laboratories, though these measurements show a smaller scatter for replicates within a single laboratory. Intercalibration experiments reveal a standard deviation for measurements on one sample by different laboratories of about 0.07–0.08 dpm/1000 L (Anderson et al., 2012). We take 0.075 dpm/1000 L as an approximate indicative value for the detection level for changes in dissolved 230Th concentrations in seawater (Figs. S3, S4, and 9; see orange lines therein). This may be a somewhat optimistic estimate for samples of past decades, but future developments of measuring techniques could possibly reduce measurement errors and the spread across analyses from different laboratories and application of different measurement methods. The detection level is shown here relative to the modelled pre-industrial values. The time of emergence as indicated by the orange line in Figs. S3, S4, and 9 is therefore the earliest possible time of detection if pre-industrial 230Th would be known. Figures S3, S4, and 9 show the increase of dissolved 230Th activities with depth from 700 m (Fig. S3), over 2000 m (Fig. 9), to finally 4000 m (Fig. S4). At 700 m, the increase in 230Th activities due to the assumed ocean acidification effect is too small to unambiguously show an effect for RCP2.6 (Fig. S3). This picture changes when going down to 2000 m and below, where an effect would be detectable within this century at least for the stronger forcing scenarios (RCP8.5 and RCP6.0) (Figs. 9 and S4). For constant CaCO3 production, the intermediate and deep-water 230Th activities start to rise around the year 2100 as well (see black curves in Figs. S3, S4, and 9). This effect is due to the increasing dissolution of CaCO3 particles in the water column in parallel with downward mixing of waters that carry anthropogenic loads of dissolved organic carbon and hence subsurface and deep acidification. The effect is most important in areas where anthropogenic carbon is mixed down quickly and induces a significant shoaling of the CaCO3 saturation level and CaCO3 lysocline as well the carbonate compensation depth through deep-water acidification. Parts of the deep Pacific are not as much influenced by this as compared to the Atlantic within the 21st century. The control run in the figures does not represent the reference run with constant pre-industrial atmospheric pCO2 but the run with constant CaCO3 production and rising pCO2 according to the RCP scenarios.
In order to look for most suitable regions for detection of ocean acidification effects on CaCO3 particle fluxes using modern 230Th data, we plotted the year of emergence for different reference years and different assumed detection levels (Fig. 10). The year of emergence is defined here as the earliest possible year of a potential detection in the case that the 230Th signal (rate of change over time) is only influenced by a decrease in calcification and not any other processes (such as potential shifts in circulation and associated changes in biological particle production). We choose 2010 as reference year, to which the 230Th activity at a later stage would be compared to, and 0.075 dpm/1000 L as the limit for the detection of a signal. For the moderate calcification scenario, the time of emergence at least at 4000 m would be comparable to the time of emergence as potentially inferable through repeat surface alkalinity measurements (Ilyina et al., 2009) (Fig. 10a and b). For the extreme scenario, the signal would be identifiable considerably earlier. The signal emerges earliest in deep Pacific waters.
The results on the early warning indicator as shown in Fig. 10 are based on the simplifying assumption that only changes in calcification caused by ocean acidification influence the water column 230Th concentrations under progressing acidification and climate forcing. We therefore also mimicked the effect of interannual/decadal variability in circulation and biogeochemical parameters (runs S1–S5, Table 2). Comparing the projections under RCP8.5 and the moderate calcification scenario for the case without interannual/decadal variability (run M8.5, Table 2) with the one including variability (runs S1–S3, Table 2) for the middle of this century reveals differences in the order of the assumed detection level for changes in the velocity field and the particle sinking velocity and smaller changes for varying Vmax (Fig. 11a–f). The effect on modulating water column 230Th can be quite variable for different oceanic domains. Deviations can add up or compensate for each other locally. For simultaneous changes of circulation, Vmax, and particle sinking velocity, the overall deviations from the run without variability amount to 2–3 times the theoretical detection limit (Fig. 11g and h). We repeated the analysis of the time of emergence with the runs including interannual variability for the moderate (S4) and also the extreme (S5) scenario. For this analysis, we again chose 2010 as the reference year but increased the detection limit to 2.5 × 0.075 dpm/1000 L. Under these more realistic conditions, the time of emergence would be shifted to the end of the century for the moderate calcification scenario and to the middle of the century for the extreme scenario (Fig. 12).

Figure 10Prospective year of emergence for an ocean-acidification-induced signal in dissolved 230Th activity as derived from the model runs. Shown are the calendar years of emergence for the depth levels at 2000 and 4000 m. All figures are shown for the strong RCP8.5 scenario concerning atmospheric CO2 concentration and the moderate scenario of calcification decrease with saturation state, with the year 2010 as a reference year for 230Th activity and 0.075 dpm/1000 L as analytical threshold between different samples. (a) For the moderate calcification scenario, at 2000 m depth. (b) Same as panel (a) but for depth level 4000 m. (c) For the extreme calcification scenario, at 2000 m depth. (d) Same as panel (c) but for depth level 4000 m.
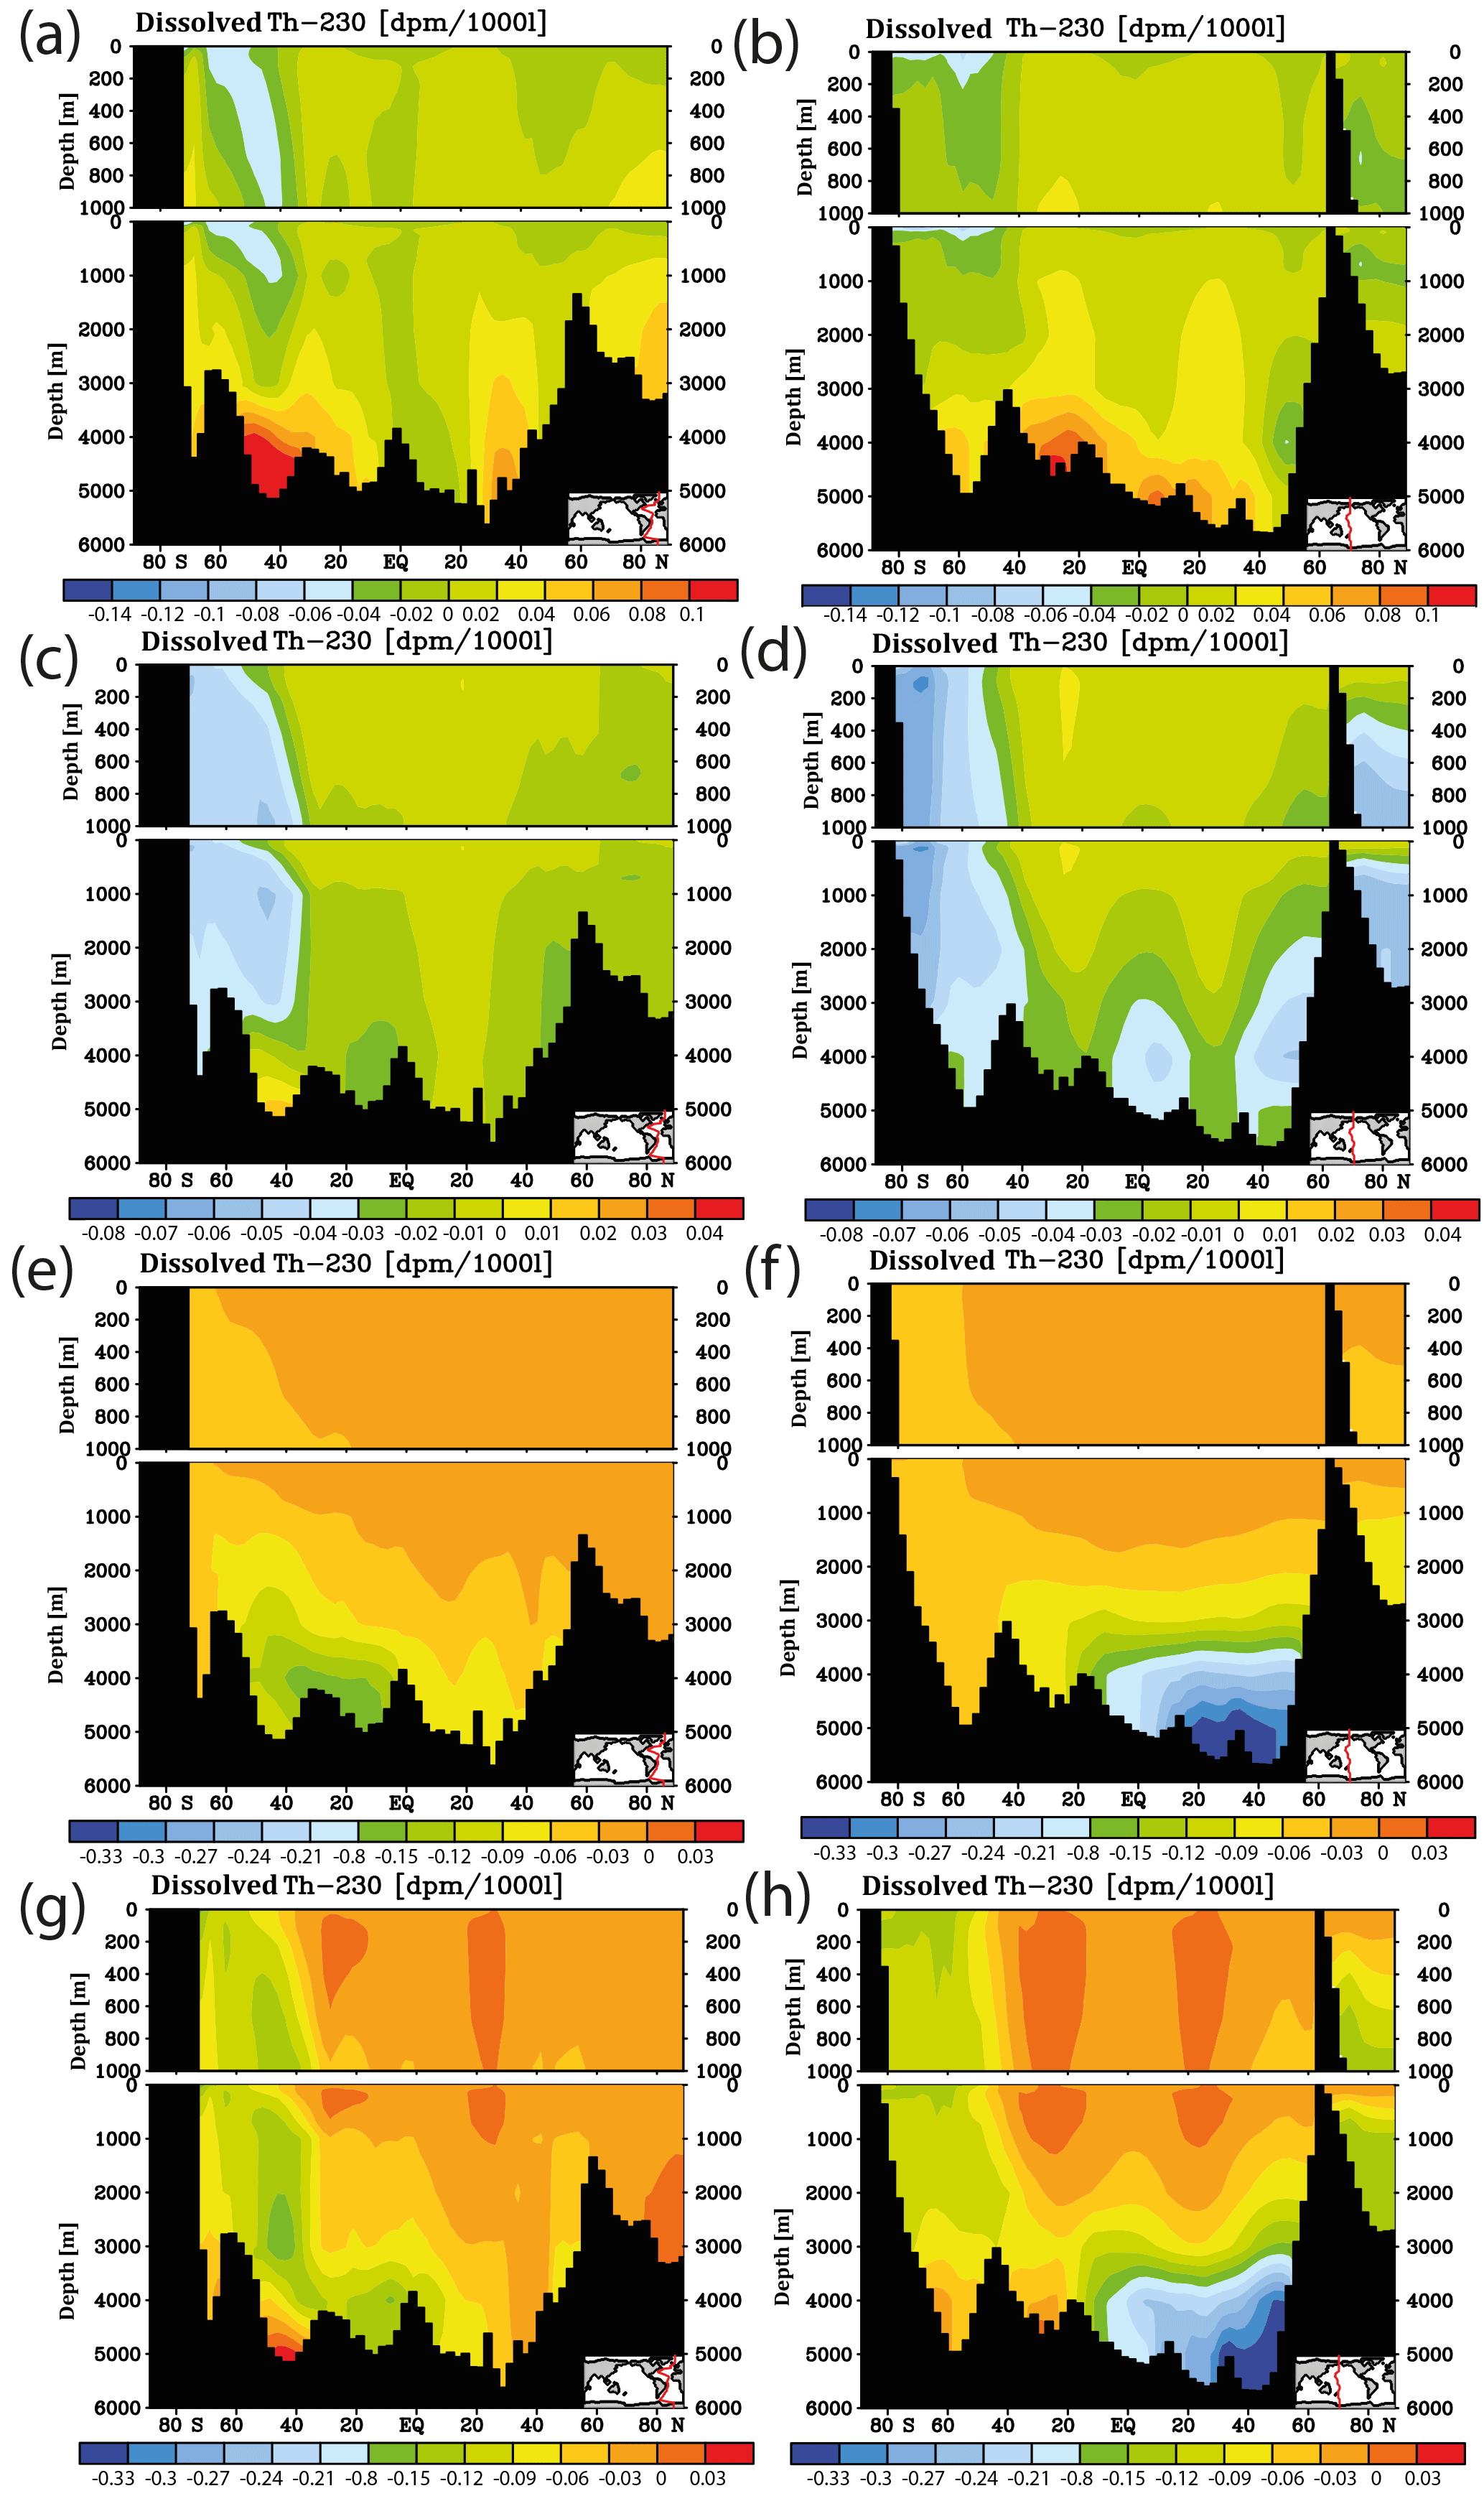
Figure 11Meridional cross sections for sensitivity experiments concerning the projections including a representation of interannual/decadal variability. Shown are differences in dissolved 230Th for forcing relative to the normal run with RCP8.5 and the moderate calcification scenario for the year 2050. (a) Change in velocity field (for details, see the text). (b) As (a) but for the Pacific. (c) Change of Vmax for phosphate uptake (for details, see the text), Atlantic. (d) As (c) but for the Pacific. (e) Change of the sinking velocity of particulate matter (for details, see the text). (f) As (e) but for the Pacific. (g) Simultaneous change of velocity field, Vmax, and sinking velocity. (h) As (g) but for the Pacific.

Figure 12Prospective year of emergence for an ocean-acidification-induced signal in dissolved 230Th activity as derived from the model runs. Shown are the calendar years of emergence for the depth levels at 2000 and 4000 m. All figures are shown for the strong RCP8.5 scenario concerning atmospheric CO2 concentration and the moderate scenario of calcification decrease with saturation state, with the year 2010 as a reference year for 230Th activity and 2.5 ⋅ 0.075 dpm/1000 L as analytical threshold between different samples. In contrast to Fig. 11, here, an analysis including interannual/decadal variability in selected biogeochemical parameters is shown. (a) For the moderate calcification scenario, at 2000 m depth. (b) Same as panel (a) but for depth level 4000 m. (c) For the extreme calcification scenario, at 2000 m depth. (d) Same as panel (c) but for depth level 4000 m.
The question arises whether surface alkalinity and deep 230Th measurements possibly could be combined successfully in order to detect ocean acidification impacts on calcification. We could, so far, not detect any simple relationship between surface changes in CaCO3 export production, surface alkalinity, and 230Th in spite of the conceptually clear interdependencies. In order to illustrate this, we plotted changes in surface alkalinity and 3000 m 230Th over time for the run with the moderate calcification scenario and RCP8.5 forcing between 2040 and 2010.
The distributions show a somewhat consistent picture without interannual/decadal variability (run M8.5, Fig. 13a and b) with general rises in both surface alkalinity and deep 230Th. For the case including interannual/decadal variability (run S4, Fig. 13c and d), the temporal gradients in both variables become smaller and the deep 230Th even may reverse. This does not mean that it would be impossible to construct a combined Alk-230Th tracer – only that such a tracer cannot be derived from this study.
As compared to the detection approach for ocean acidification impacts through total alkalinity measurements as pursued by Ilyina et al. (2009), the 230Th method presented here results in similar time of emergence of a signal reflecting changes in biocalcification if one omits interannual/decadal variability and other possible influence factors. Probably the most important limitation of the approach here is the fixed velocity field which does not vary realistically with seasons, interannual variability, and climatic variability modes (such as the El Niño–Southern Oscillation or North Atlantic Oscillation). Also the effect of boundary scavenging (Anderson et al., 1983; Roy-Barman et al., 2009), i.e. the transport of dissolved 230Th from areas of low particle concentrations to those with high particle concentrations (especially at ocean margins and shelf seas), is not spatially resolved in our model. Further uncertainties are associated with the choice of the kd values and particle-specific reactivity.
The extreme scenario on pH-dependent CaCO3 production is likely to be an overestimation. According to the results from this study and Ilyina et al. (2009), a respective large change in the real world would probably have already been detected through the alkalinity signal and other methods such as remote sensing and sediment trap measurements. In addition, the reaction of CaCO3 shell producing organisms to sinking carbonate saturation levels is not a simple function and can vary between taxa (Kroeker et al., 2013).
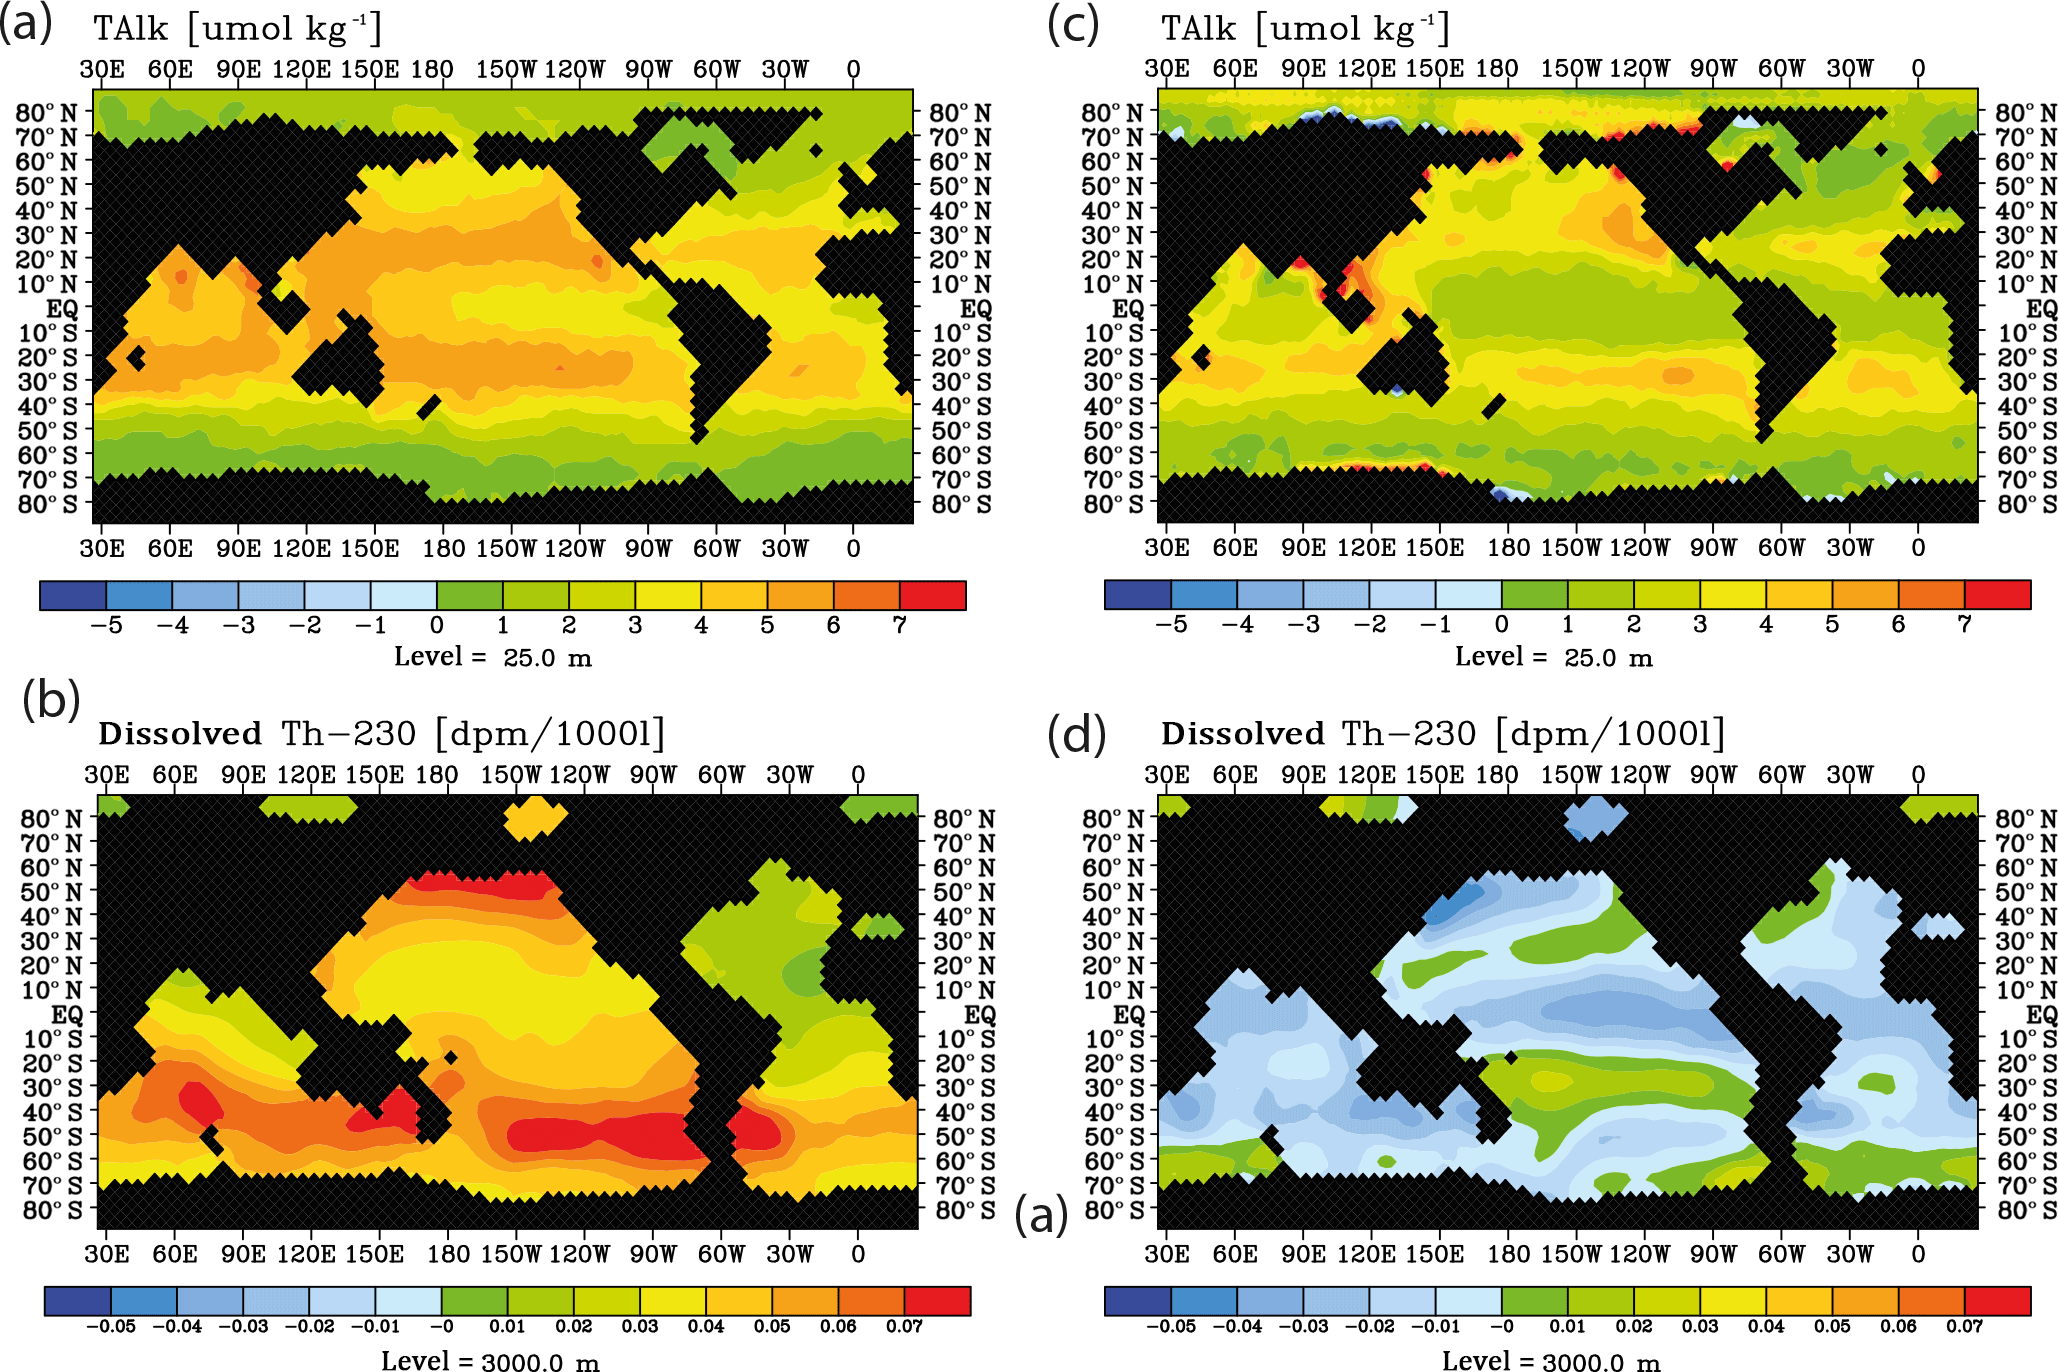
Figure 13Surface alkalinity changes and deep 230Th changes during 2040–2010 as for the RCP8.5 projection using moderate calcification changes. Left column without variability, (a) at the sea surface, (b) at 3000 m. Right column with decadal parameter variability, (c) at the sea surface, (b) at 3000 m.
The detection method for ocean acidification impacts through 230Th would work best if the pre-industrial values for dissolved oceanic 230Th activities could reliably be reconstructed. From core top samples and corals, one could possibly determine whether the particle-attached 230Th activities and hence those of the dissolved fraction would have undergone any variations over the last centuries and millennia. However, the overall uncertainties associated with the formation and analysis of the paleo-record values may be too high to provide an accurate enough baseline for comparisons with modern water column measurements.
In this study, we investigated the potential of the particle reactive radionuclide 230Th for detection of reduced calcification by biota due to progressing ocean acidification. The time of emergence of a dissolved 230Th activity signal with respect to a reference year and reference activity is about the same as for detection approaches employing alkalinity if one disregards effects of interannual/decadal variability in the flow field and influence factors other than ocean-acidification-induced changes in CaCO3 export production. Taking into account interannual/decadal variability including ocean circulation changes may delay the signal emergence by several decades. Nevertheless, regular selected reoccupations of a series of deep stations in the Pacific Ocean and Southern Ocean with highest-quality 230Th measurements would be helpful to accompany alkalinity measurements that are easier to make in order to see whether both tracers give consistent results. Surface alkalinity measurements include signals of natural variability on seasonal and multiyear scales. Likewise, changes in ocean circulation and changes in biological particle production due to processes other than ocean acidification may lead to changes in the marine 230Th distribution (and alkalinity). As the deep ocean is less prone to effects of natural variability and the quality of observations does not change with depth, deep-ocean observations of 230Th could be advantageous for monitoring and detecting ocean acidification effects on calcification. In any case, 230Th represents a fascinating magnifying glass for changes in ocean surface processes seen through the deep-ocean signal. Its potential has not yet been fully exploited.
The model output data and the model code data are available from the corresponding author by request.
The supplement related to this article is available online at: https://doi.org/10.5194/bg-15-3521-2018-supplement.
The authors declare that they have no conflict of interest.
This article is part of the special issue “Progress in quantifying ocean biogeochemistry – in honour of Ernst Maier-Reimer”. It is not associated with a conference.
This work was partially supported through the “European
Project on Ocean Acidification” EPOCA and the project “Changes in Carbon
Uptake and Emissions by Oceans in a Changing Climate” CARBOCHANGE that
received funding from the European Community's Seventh Framework Programme (FP7)
under grant agreement nos. 211384 and 264879, respectively. The
Research Council of Norway supported this study through the project
“Overturning circulation and its implications for global carbon cycle in
coupled models” (ORGANIC; grant no. 239965) and the nationally coordinated
project “Earth system modelling of climate variations in the Anthropocene”
(EVA; grant no. 229771). This is a contribution to the Bjerknes Centre for
Climate Research (Bergen, Norway). A part of the computations was carried
out under project NN2980K at the Norwegian Metacenter for Computational
Science (NOTUR) and its dedicated storage and archiving project NorStore (NS2980k).
This is an in-kind contribution to the GEOTRACES project. We
would like to thank the GEOTRACES scientists for the interesting discussions
during several workshops and for the fabulous new observational data. Jerry Tjiputra
kindly made available the AMOC data from NorESM. Two constructive
referees helped to improve the manuscript. Christoph Heinze acknowledges
sabbatical funds from the University of Bergen.
Edited by: Arne Winguth
Reviewed by: two anonymous referees
Anderson, R. F., Bacon, M. P., and Brewer, P. G.: Removal of 230Th and 231Pa at Ocean Margins, Earth Planet. Sc. Lett., 66, 73–90, 1983.
Anderson, R. F., Fleisher, M. Q., Robinson, L. F., Edwards, R. L., Hoff, J. A., Moran, S. B., van der Loeff, M. R., Thomas, A. L., Roy-Barman, M., and Francois, R.: GEOTRACES intercalibration of 230Th, 232Th, 231Pa, and prospects for 10Be, Limnol. Oceanogr.-Meth., 10, 179–213, 2012.
Bacon, M. P. and Anderson, R. F.: Distribution of Thorium Isotopes between Dissolved and Particulate Forms in the Deep-Sea, J. Geophys. Res.-Oceans, 87, 2045–2056, 1982.
Bacon, M. P., Huh, C. A., and Moore, R. M.: Vertical Profiles of Some Natural Radionuclides over the Alpha-Ridge, Arctic Ocean, Earth Planet. Sc. Lett., 95, 15–22, 1989.
Bates, N. R.: Interannual variability of the oceanic CO2 sink in the subtropical gyre of the North Atlantic Ocean over the last 2 decades, J. Geophys. Res.-Oceans, 112, C09013, https://doi.org/10.1029/2006JC003759, 2007.
Bopp, L., Resplandy, L., Orr, J. C., Doney, S. C., Dunne, J. P., Gehlen, M., Halloran, P., Heinze, C., Ilyina, T., Séférian, R., Tjiputra, J., and Vichi, M.: Multiple stressors of ocean ecosystems in the 21st century: projections with CMIP5 models, Biogeosciences, 10, 6225–6245, https://doi.org/10.5194/bg-10-6225-2013, 2013.
Boudreau, B. P.: Diagenetic models and their implementation – modelling transport and reactions in aquatic systems, Springer, Heidelberg, 1997.
Carter, B. R., Frolicher, T. L., Dunne, J. P., Rodgers, K. B., Slater, R. D., and Sarmiento, J. L.: When can ocean acidification impacts be detected from decadal alkalinity measurements?, Global Biogeochem. Cy., 30, 595–612, 2016.
Chase, Z., Anderson, R. F., Fleisher, M. Q., and Kubik, P. W.: The influence of particle composition and particle flux on scavenging of Th, Pa and Be in the ocean, Earth Planet. Sc. Lett., 204, 215–229, 2002.
Chase, Z., Anderson, R. F., Fleisher, M. Q., and Kubik, P. W.: Scavenging of 230Th, 231Pa and 10Be in the Southern Ocean (SW Pacific sector): the importance of particle flux, particle composition and advection, Deep-Sea Res. Pt. II, 50, 739–768, 2003.
Cochran, J. K., Livingston, H. D., Hirschberg, D. J., and Surprenant, L. D.: Natural and Anthropogenic Radionuclide Distributions in the Northwest Atlantic-Ocean, Earth Planet. Sc. Lett., 84, 135–152, 1987.
Cochran, J. K., Hirschberg, D. J., Livingston, H. D., Buesseler, K. O., and Key, R. M.: Natural and anthropogenic radionuclide distributions in the Nansen Basin, Arctic Ocean: Scavenging rates and circulation timescales, Deep-Sea Res. Pt. II, 42, 1495–1517, 1995.
Colley, S., Thomson, J., and Newton, P. P.: Detailed 230Th, 232Th and 210Pb Fluxes Recorded by the 1989/90 Bofs Sediment Trap Time-Series at 48-Degrees-N, 20-Degrees-W, Deep-Sea Res. Pt. I, 42, 833–848, 1995.
Deng, F., Thomas, A. L., Rijkenberg, M. J. A., and Henderson, G. M.: Controls on seawater 231Pa, 230Th and 232Th concentrations along the flow paths of deep waters in the Southwest Atlantic, Earth Planet. Sc. Lett., 390, 93–102, 2014.
Dickson, A. G., Sabine, C. L., and Christian, J. R. (Eds.): Guide to best practices for ocean CO2 measurements, PICES Special Publication 3, IOCCP Report No. 8, North Pacific Marine Science Organization, Sidney, BC, Canada, 191 pp., 2007.
Dore, J. E., Lukas, R., Sadler, D. W., Church, M. J., and Karl, D. M.: Physical and biogeochemical modulation of ocean acidification in the central North Pacific, P. Natl. Acad. Sci. USA, 106, 12235–12240, 2009.
Gehlen, M., Heinze, C., Maier-Reimer, E., and Measures, C. I.: Coupled Al–Si geochemistry in an ocean general circulation model: A tool for the validation of oceanic dust deposition fields?, Global Biogeochem. Cy., 17, 1028, https://doi.org/10.1029/2001GB001549, 2003.
Guo, L. D., Santschi, P. H., Baskaran, M., and Zindler, A.: Distribution of Dissolved and Particulate 230Th and 232Th in Seawater from the Gulf-of-Mexico and Off Cape-Hatteras as Measured by Sims, Earth Planet. Sc. Lett., 133, 117–128, 1995.
Hayes, C. T., Anderson, R. F., Fleisher, Huang, K.-F., Robinson, L. F., Lu, Y., Cheng, H., Edwards, R. L., and Moran, S. B.: 230Th and 231Pa on GEOTRACES GA03, theU.S.GEOTRACES North Atlantic transect, and implications for modernand paleoceanographic chemical fluxes, Deep-Sea Res. Pt. II, 116, 29–41, 2015a.
Hayes, C. T., Anderson, R. F., Fleisher, M. Q, Vivancos, S. M, Lam, P. J., Ohnemus, D. C., Huang, K.-F., Robinson, L. F., Lu, Y., Cheng, H., Edwards, R. L., and Moran, S. B.: Intensity of Th and Pa scavenging partitioned by particle chemistry in the North Atlantic Ocean, Mar. Chem., 170, 49–60, 2015b.
Heinze, C. and Maier-Reimer, E.: The Hamburg Oceanic Carbon Cycle Circulation Model Version “HAMOCC2s” for long time integrations, Deutsches Klimarechenzentrum (German Climate Computing Center), Hamburg, Germany, 71 pp., 1999.
Heinze, C., Hupe, A., Maier-Reimer, E., Dittert, N., and Ragueneau, O.: Sensitivity of the marine biospheric Si cycle for biogeochemical parameter variations, Global Biogeochem. Cy., 17, 1086, https://doi.org/10.1029/2002GB001943, 2003.
Heinze, C., Gehlen, M., and Land, C.: On the potential of 230Th, 231Pa, and 10Be for marine rain ratio determinations: A modeling study, Global Biogeochem. Cy., 20, GB2018, https://doi.org/10.1029/2005GB002595, 2006.
Heinze, C., Kriest, I., and Maier-Reimer, E.: Age offsets among different biogenic and lithogenic components of sediment cores revealed by numerical modeling, Paleoceanography, 24, PA4214, https://doi.org/10.1029/2008PA001662, 2009.
Heinze, C., Hoogakker, B. A. A., and Winguth, A.: Ocean carbon cycling during the past 130 000 years – a pilot study on inverse palaeoclimate record modelling, Clim. Past, 12, 1949–1978, https://doi.org/10.5194/cp-12-1949-2016, 2016.
Henderson, G. M., Heinze, C., Anderson, R. F., and Winguth, A. M. E.: Global distribution of the 230Th flux to ocean sediments constrained by GCM modelling, Deep-Sea Res. Pt. I, 46, 1861–1893, 1999.
Honeyman, B. D., Balistrieri, L. S., and Murray, J. W.: Oceanic Trace-Metal Scavenging – the Importance of Particle Concentration, Deep-Sea Res., 35, 227–246, 1988.
Honjo, S.: Fluxes of particles to the interior of the open oceans, in: Particle Flux in the Ocean, edited by: Ittekkot, V., Schäfer, P., Honjo, S., and Depetris, P. J., John Wiley & Sons, New York, 91–154, 1996.
Huh, C. A. and Beasley, T. M.: Profiles of Dissolved and Particulate Thorium Isotopes in the Water Column of Coastal Southern-California, Earth Planet. Sc. Lett., 85, 1–10, 1987.
Iglesias-Rodriguez, M. D., Halloran, P. R., Rickaby, R. E. M., Hall, I. R., Colmenero-Hidalgo, E., Gittins, J. R., Green, D. R. H., Tyrrell, T., Gibbs, S. J., von Dassow, P., Rehm, E., Armbrust, E. V., and Boessenkool, K. P.: Phytoplankton calcification in a high-CO2 world, Science, 320, 336–340, 2008.
Ilyina, T., Zeebe, R. E., Maier-Reimer, E., and Heinze, C.: Early detection of ocean acidification effects on marine calcification, Global Biogeochem. Cy., 23, GB1008, https://doi.org/10.1029/2008GB003278, 2009.
Kleypas, J. A., Buddemeier, R. W., Archer, D., Gattuso, J. P., Langdon, C., and Opdyke, B. N.: Geochemical consequences of increased atmospheric carbon dioxide on coral reefs, Science, 284, 118–120, 1999.
Kroeker, K. J., Kordas, R. L., Crim, R., Hendriks, I. E., Ramajo, L., Singh, G. S., Duarte, C. M., and Gattuso, J. P.: Impacts of ocean acidification on marine organisms: quantifying sensitivities and interaction with warming, Global Change Biol., 19, 1884–1896, 2013.
Luo, S. D. and Ku, T. L.: Oceanic 231Pa ∕ 230Th ratio influenced by particle composition and remineralization, Earth Planet. Sc. Lett., 167, 183–195, 1999.
Mahowald, N., Kohfeld, K., Hansson, M., Balkanski, Y., Harrison, S. P., Prentice, I. C., Schulz, M., and Rodhe, H.: Dust sources and deposition during the last glacial maximum and current climate: A comparison of model results with paleodata from ice cores and marine sediments, J. Geophys. Res.-Atmos., 104, 15895–15916, 1999.
Maier-Reimer, E.: Geochemical cycles in an ocean general circulation model. Preindustrial tracer distributions, Global Biogeochem. Cy., 7, 645–677, 1993.
Mawji, E., Schlitzer, R., Dodas, E. M., Abadie, C., Abouchami, W., Anderson, R. F., Baars, O., Bakker, K., Baskaran, M., Bates, N. R., Bluhm, K., Bowie, A., Bown, J., Boye, M., Boyle, E. A., Branellec, P., Bruland, K. W., Brzezinski, M. A., Bucciarelli, E., Buesseler, K., Butler, E., Cai, P. H., Cardinal, D., Casciotti, K., Chaves, J., Cheng, H., Chever, F., Church, T. M., Colman, A. S., Conway, T. M., Croot, P. L., Cutter, G. A., de Baar, H. J. W., de Souza, G. F., Dehairs, F., Deng, F. F., Dieu, H. T., Dulaquais, G., Echegoyen-Sanz, Y., Edwards, R. L., Fahrbach, E., Fitzsimmons, J., Fleisher, M., Frank, M., Friedrich, J., Fripiat, F., Galer, S. J. G., Gamo, T., Solsona, E. G., Gerringa, L. J. A., Godoy, J. M., Gonzalez, S., Grossteffan, E., Hatta, M., Hayes, C. T., Heller, M. I., Henderson, G., Huang, K. F., Jeandel, C., Jenkins, W. J., John, S., Kenna, T. C., Klunder, M.,Kretschmer, S., Kumamoto, Y., Laan, P., Labatut, M., Lacan, F., Lam, P. J., Lannuzel, D., le Moigne, F., Lechtenfeld, O. J., Lohan, M. C., Lu, Y. B., Masque, P., McClain, C. R., Measures, C., Middag, R., Moffett, J., Navidad, A., Nishioka, J., Noble, A., Obata, H., Ohnemus, D. C., Owens, S., Planchon, F., Pradoux, C., Puigcorbe, V., Quay, P., Radic, A., Rehkamper, M., Remenyi, T., Rijkenberg, M. J. A., Rintoul, S., Robinson, L. F., Roeske, T., Rosenberg, M. van der Loeff, M. R., Ryabenko, E., Saito, M. A., Roshan, S., Salt, L., Sarthou, G., Schauer, U., Scott, P., Sedwick, P. N., Sha, L. J., Shiller, A. M., Sigman, D. M., Smethie, W., Smith, G. J., Sohrin, Y., Speich, S., Stichel, T., Stutsman, J., Swift, J. H., Tagliabue, A., Thomas, A., Tsunogai, U., Twining, B. S., van Aken, H. M., van Heuven, S., van Ooijen, J., van Weerlee, E., Venchiarutti, C., Voelker, A. H. L., Wake, B., Warner, M. J., Woodward, E. M. S., Wu, J. F., Wyatt, N., Yoshikawa, H., Zheng, X. Y., Xue, Z. C., Zieringer, M., and Zimmer, L. A.: The GEOTRACES Intermediate Data Product 2014, Mar. Chem., 177, 1–8, 2015.
Meyer, J. and Riebesell, U.: Reviews and Syntheses: Responses of coccolithophores to ocean acidification: a meta-analysis, Biogeosciences, 12, 1671–1682, https://doi.org/10.5194/bg-12-1671-2015, 2015.
Moore, W. S.: The Thorium Isotope Content of Ocean Water, Earth Planet. Sc. Lett., 53, 419–426, 1981.
Moran, S. B., Hoff, J. A., Buesseler, K. O., and Edwards, R. L.: High-Precision 230Th and 232Th in the Norwegian Sea and Denmark by Thermal Ionization Mass-Spectrometry, Geophys. Res. Lett., 22, 2589–2592, 1995.
Moran, S. B., Charette, M. A., Hoff, J. A., Edwards, R. L., and Landing, W. M.: Distribution of 230Th in the Labrador Sea and its relation to ventilation, Earth Planet. Sc. Lett., 150, 151–160, 1997.
Nozaki, Y. and Horibe, Y.: Alpha-Emitting Thorium Isotopes in Northwest Pacific Deep Waters, Earth Planet. Sc. Lett., 65, 39–50, 1983.
Nozaki, Y. and Yang, H.-S.: Th and Pa isotopes in the waters of the western margin of the Pacific near Japan: Evidence for release of 228Ra and 227Ac from slope sediments, J. Oceanogr. Soc. Jpn., 43, 217–227, 1987.
Nozaki, Y., Yang, H. S., and Yamada, M.: Scavenging of Thorium in the Ocean, J. Geophys. Res.-Oceans, 92, 772–778, 1987.
Olafsson, J., Olafsdottir, S. R., Benoit-Cattin, A., Danielsen, M., Arnarson, T. S., and Takahashi, T.: Rate of Iceland Sea acidification from time series measurements, Biogeosciences, 6, 2661–2668, https://doi.org/10.5194/bg-6-2661-2009, 2009.
Orr, J. C., Fabry, V. J., Aumont, O., Bopp, L., Doney, S. C., Feely, R. A., Gnanadesikan, A., Gruber, N., Ishida, A., Joos, F., Key, R. M., Lindsay, K., Maier-Reimer, E., Matear, R., Monfray, P., Mouchet, A., Najjar, R. G., Plattner, G. K., Rodgers, K. B., Sabine, C. L., Sarmiento, J. L., Schlitzer, R., Slater, R. D., Totterdell, I. J., Weirig, M. F., Yamanaka, Y., and Yool, A.: Anthropogenic ocean acidification over the twenty-first century and its impact on calcifying organisms, Nature, 437, 681–686, 2005.
Raven, J., Caldeira, K., Elderfield, H., Hoegh-Guldberg, O., Liss, P., Riebesell, U., Shepherd, J., Turley, C., and Watson, A.: Ocean acidification due to increasing atmospheric carbon dioxide, The Royal Society, London, UK, 2005.
Riebesell, U., Schulz, K. G., Bellerby, R. G. J., Botros, M., Fritsche, P., Meyerhofer, M., Neill, C., Nondal, G., Oschlies, A., Wohlers, J., and Zollner, E.: Enhanced biological carbon consumption in a high CO2 ocean, Nature, 450, 245–248, 2007.
Roy-Barman, M., Chen, J. H., and Wasserburg, G. J.: 230Th–232Th systematics in the central Pacific Ocean: The sources and the fates of thorium, Earth Planet. Sc. Lett., 139, 351–363, 1996.
Roy-Barman, M., Lemaitre, C., Ayrault, S., Jeandel, C., Souhaut, M., and Miquel, J. C.: The influence of particle composition on Thorium scavenging in the Mediterranean Sea, Earth Planet. Sc. Lett., 286, 526–534, 2009.
Santana-Casiano, J. M., Gonzalez-Davila, M., Rueda, M. J., Llinas, O., and Gonzalez-Davila, E. F.: The interannual variability of oceanic CO2 parameters in the northeast Atlantic subtropical gyre at the ESTOC site, Global Biogeochem. Cy., 21, GB1015, https://doi.org/10.1029/2006GB002788, 2007.
Sarmiento, J. L. and Gruber, N.: Ocean biogeochemical dynamics, Princeton University Press, Princeton, Oxford, 2006.
Scholten, J. C., VanderLoeff, M. M. R., and Michel, A.: Distribution of 230Th and 231Pa in the water column in relation to the ventilation of the deep Arctic basins, Deep-Sea Res. Pt. II, 42, 1519–1531, 1995.
Scholten, J. C., Fietzke, J., Mangini, A., Stoffers, P., Rixen, T., Gaye-Haake, B., Blanz, T., Ramaswamy, V., Sirocko, F., Schulz, H., and Ittekkot, V.: Radionuclide fluxes in the Arabian Sea: the role of particle composition, Earth Planet. Sc. Lett., 230, 319–337, 2005.
Smith, C. R. and Rabouille, C.: What controls the mixed-layer depth in deep-sea sediments? The importance of POC flux, Limnol. Oceanogr., 47, 418–426, 2002.
Steinacher, M., Joos, F., Frölicher, T. L., Plattner, G.-K., and Doney, S. C.: Imminent ocean acidification in the Arctic projected with the NCAR global coupled carbon cycle-climate model, Biogeosciences, 6, 515–533, https://doi.org/10.5194/bg-6-515-2009, 2009.
Tjiputra, J., Grini, F. A., and Lee, H.: Impact of idealized future stratospheric aerosol injection on the large-scale ocean and land carbon cycles, J. Geophys. Res.-Biogeo., 121, 2–27, 2016.
Vanderloeff, M. M. R. and Berger, G. W.: Scavenging of 230Th and 231Pa near the Antarctic Polar Front in the South-Atlantic, Deep-Sea Res. Pt. I, 40, 339–357, 1993.
van Vuuren, D. P., Edmonds, J., Kainuma, M., Riahi, K., Thomson, A., Hibbard, K., Hurtt, G. C., Kram, T., Krey, V., Lamarque, J. F., Masui, T., Meinshausen, M., Nakicenovic, N., Smith, S. J., and Rose, S. K.: The representative concentration pathways: an overview, Climatic Change, 109, 5–31, 2011.
Vogler, S., Scholten, J., van der Loeff, M. R., and Mangini, A.: 230Th in the eastern North Atlantic: The importance of water mass ventilation in the balance of 230Th, Earth Planet. Sc. Lett., 156, 61–74, 1998.
Yu, E. F., Francois, R., and Bacon, M. P.: Similar rates of modern and last-glacial ocean thermohaline circulation inferred from radiochemical data, Nature, 379, 689–694, 1996.