the Creative Commons Attribution 4.0 License.
the Creative Commons Attribution 4.0 License.
 | 26 Jul 2018
Patterns of longer-term climate change effects on CO2 efflux from biocrusted soils differ from those observed in the short term
Anthony Darrouzet-Nardi
Sasha C. Reed
Edmund E. Grote
Jayne Belnap
Biological soil crusts (biocrusts) are predicted to be sensitive to the increased temperature and altered precipitation associated with climate change. We assessed the effects of these factors on soil carbon dioxide (CO2) balance in biocrusted soils using a sequence of manipulations over a 9-year period. We warmed biocrusted soils by 2 and, later, by 4 ∘C to better capture updated forecasts of future temperature at a site on the Colorado Plateau, USA. We also watered soils to alter monsoon-season precipitation amount and frequency and had plots that received both warming and altered precipitation treatments. Within treatment plots, we used 20 automated flux chambers to monitor net soil exchange (NSE) of CO2 hourly, first in 2006–2007 and then again in 2013–2014, for a total of 39 months. Net CO2 efflux from biocrusted soils in the warming treatment increased a year after the experiment began (2006–2007). However, after 9 years and even greater warming (4 ∘C), results were more mixed, with a reversal of the increase in 2013 (i.e., controls showed higher net CO2 efflux than treatment plots) and with similarly high rates in all treatments during 2014, a wet year. Over the longer term, we saw evidence of reduced photosynthetic capacity of the biocrusts in response to both the temperature and altered precipitation treatments. Patterns in biocrusted soil CO2 exchange under experimentally altered climate suggest that (1) warming stimulation of CO2 efflux was diminished later in the experiment, even in the face of greater warming; and (2) treatment effects on CO2 flux patterns were likely driven by changes in biocrust species composition and by changes in root respiration due to vascular plant responses.
- Article
(1210 KB) - Full-text XML
-
Supplement
(542 KB) - BibTeX
- EndNote


Soils with active biological soil crust (biocrust) communities are essential components of dryland ecosystems worldwide and are also one of the most sensitive components of drylands to climate change (Ferrenberg et al., 2017; Reed et al., 2016). Given the vast and growing global extent of dryland regions (Safriel et al., 2005; Prăvălie, 2016), the response of biocrusts to major global change phenomena, such as climate change, may be an important aspect of the overall response of Earth's ecosystems. In particular, due to the potential for dryland feedbacks to future climate (Poulter et al., 2014; Ahlström et al., 2015; Rutherford et al., 2017), a key parameter to consider as dryland ecosystems warm is carbon (C) balance, specifically carbon exchange of biocrusted soils. Dryland soils are characterized by low soil organic matter that is negatively correlated with aridity across many drylands (Delgado-Baquerizo et al., 2013) and there is an association between C loss and the phenomenon of desertification (Lal, 2004). Drylands can also show large year-to-year variation in C fluxes that are relevant for explaining global-scale fluxes (Ahlström et al., 2015; Poulter et al., 2014; Biederman et al., 2017). At the ecosystem scale, biocrusted soils within drylands are often substantial contributors to both C uptake (Elbert et al., 2012) and ecosystem respiration (Castillo-Monroy et al., 2011). At the organism scale, the viability of biocrust is linked to their ability to maintain a positive C balance among hydration–desiccation cycles (Grote et al., 2010; Coe et al., 2012; Oliver et al., 2005). Despite the importance of C balance to understanding biocrust function and dryland ecosystem feedbacks to global change, few studies have addressed how biocrust soil CO2 fluxes will respond to changing temperature and precipitation.
Carbon balance in biocrusted soils includes not only the activities of the biocrusts themselves, but also the activities of subsurface vascular plant roots and soil heterotrophic microbes. Considering biocrusted soils together with the function of adjacent vascular plants is important given that there is increasing evidence for biotic connections, possibly mediated by fungi, between these functional groups (Green et al., 2008) and for linkages in plant–soil C cycle responses to warming. For example, at another site on the Colorado Plateau, measurements of plant photosynthesis, coupled with spot measurements of soil respiration under plant canopies, showed plant photosynthetic rates were tightly coupled to soil respiration rates, with both showing reduced fluxes in response to warming during the spring when plants are most active (Wertin et al., 2017). While these patterns could be the result of independent climate controls, such as temperature and moisture, on each individual flux, vascular plant C allocation to roots and heterotrophs belowground or biotic connections between biocrust organisms and vascular plants could also help explain the coupling between above- and belowground CO2 fluxes.
In addition to affecting soil C balance through direct physiological means, warming has been shown to have substantial effects on biocrust species composition, including macroscopic components such as moss and lichens (Ferrenberg et al., 2015; Escolar et al., 2012; Maestre et al., 2015) and microbial communities (Steven et al., 2015; Johnson et al., 2012). Climate models predict rapidly rising temperatures for already hot and moisture-limited dryland regions, including the site of our study in the southwestern United States (IPCC, 2013; Jardine et al., 2013). Forecasts of future precipitation patterns are less certain, but overall drier conditions with changes in precipitation event size and frequency are likely (Seager et al., 2007). Climate models predict increases in dryland annual average temperature of up to 4 ∘C by the end of the 21st century, as well as significant alterations to the amount and timing of rainfall (Christensen et al., 2007). For example, the Intergovernmental Panel on Climate Change (IPCC) A1B scenario suggests a decrease in precipitation amount of 5–10 % for the southwestern United States, as well as significant changes to the timing and magnitude of precipitation (D'Odorico and Bhattachan, 2012). Across many ecosystems, including drylands, both plant C uptake and soil respiration show an optimum, such that rates are positively correlated with increased temperatures and moisture (Wu et al., 2011) until a point at which high temperatures (often accompanied with drying) begin suppressing both photosynthesis (e.g., Wertin et al., 2015) and soil respiration (Tucker and Reed, 2016). Drought also tends to reduce vascular plant production and respiration, with greater sensitivity in drier areas (Knapp et al., 2015). In soils overlain by biocrusts (hereafter, biocrusted soils) specifically, temperature and moisture are key physiological parameters for C flux (Grote et al., 2010; Darrouzet-Nardi et al., 2015) and, although few, the warming experiments that do exist suggest that biocrusted soils will have higher net CO2 efflux with a warming climate (Darrouzet-Nardi et al., 2015; Maestre et al., 2013). There is evidence for a limit to this association though, with very high temperatures leading to reduced biotic activity, including microbial respiration, in biocrusted soils (Tucker and Reed, 2016).
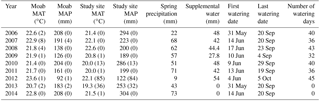
Table 1MAT is the mean annual temperature. Values are shown for the nearby Moab site (see Fig. S2 for long-term record) as well as for the instruments at our study site. Values in parentheses indicate the number of days of missing data for the given year. MAP is the mean annual precipitation and spring precipitation totals were determined by a rain gauge at the study site. Detailed timing of temperature and precipitation over the study period are shown in Fig. S1. Supplemental water was only added to the watering and combined treatments and was not added on days when natural precipitation occurred. Spring rainfall is from day of year 80–173 and is the time of peak plant growth.
To improve our understanding of dryland C flux responses to global change, we used a warming by watering manipulation experiment on the Colorado Plateau established in 2005. When the study began, we explored the hypothesis that warming would increase net losses of CO2 from soils covered with late successional biocrusts (∼50 % moss, ∼30 % lichen cover) via detrimental impacts on biocrust physiology caused by warming. At the same time we wanted to explore how altered precipitation could directly affect biocrust soil CO2 exchange and/or interact with the effects of increased temperatures. These early results supported the basic hypothesis concerning the warming-only treatment, showing that warming led to increased CO2 loss after 1–2 years, with the largest differences during periods in which soils were wet enough to support substantial biocrust photosynthesis (Darrouzet-Nardi et al., 2015). Crucially, we also found that the increased frequency of small frequent precipitation events negatively affected biocrusts: the treatment caused the death of a major biocrust component, the moss Syntrichia caninervis (Coe et al., 2012; Reed et al., 2012; Zelikova et al., 2012). This finding represented a substantial alteration to the system and led to a second phase of the experiment. In this phase, we ceased the watering treatment that had caused moss death and increased the warming treatment from 2 to 4∘ to see if greater warming would negatively impact biocrusts. We found that the greater warming did in fact reduce moss and lichen cover as well, though not as rapidly as the watering treatment (Ferrenberg et al., 2015). Here we report the C balance response to these multiple phases of the experiment. Our main goals were to (1) determine if the increased net soil CO2 loss observed after a year of warming was maintained after 8 years and (2) to assess how the altered precipitation patterns affected net soil CO2 exchange during the early phase when mosses were dying and, then later, after mosses were lost and the increased watering had ceased.
2.1 Site description
The study was located in a semiarid ecosystem on the Colorado Plateau (36.675∘ N, −109.416∘ W; elevation = 1310 m; mean annual temperature = 13 ∘C, mean annual precipitation = 269 mm; WRCC 2014) that supports multiple species of grasses and shrubs. Soils are Rizno series Aridisols and the dominant plants include Achnatherum hymenoides, Pleuraphis jamesii, Atriplex confertifolia, and Bromus tectorum. Biocrust communities are dominated by the cyanobacterium Microcoleus vaginatus the moss Syntrichia caninervis, and the cyanolichens Collema tenax and Collema coccophorum. The site is on a moderate hillslope (∼10 %) surrounded by steep gullies that make it hard to access for livestock, which may explain its relict biocrust and plant composition that includes late successional crusts with well-developed communities of native grasses and shrubs, similar to sites found in Canyonlands National Park (Belnap and Phillips, 2001). Rainfall during the study period was distributed around the mean (Table 1, Fig. S1 in the Supplement), with several slightly above average years including the first and last year of the experiment (2006: 294 mm; 2014: 304 mm) and with 1 year with substantial drought (2012: 122 mm). Rainfall and temperatures went up and down across years, with no notable directional shift over the 9-year course of the study. Long-term records from a nearby weather station in Moab, UT, show that mean annual temperatures have been increasing (21.3 ∘C for 1900–1924 vs. 22.9 ∘C for 1991–2016, a difference of 1.5 ∘C). Precipitation trends since 1925 do not show a clear trend (Fig. S2).
2.2 Warming and watering treatments
The experiment contained 20 plots with five replicates (n=5) for each of four treatments: control, warmed, watered, and combined (warmed + watered). Plots were 2×2.5 m in size and grouped into five blocks determined by spatial location on the hillslope. Each plot contained one automated CO2 chamber (described below). The warming treatment began in October 2005 in plots fitted with 800 W infrared radiant (IR) heat lamps (Kalglo model MRM-2408) mounted at a height of 1.3 m. Control plots had dummy lamps that do not provide heat. The heating treatment was regulated by altering the voltage supplied to each lamp. While some drying of soil moisture from the lamps may have occurred, we saw little evidence for this phenomenon in soil moisture values, with drying after precipitation events occurring at similar rates in all treatments (Fig. S3). A previously published analysis also reported no easily detectable moisture effects from the infrared lamps in either this experiment or a similar co-located experiment despite soil moisture probes at 2, 5, and 10 cm throughout all plots (Wertin et al., 2015). However, we cannot rule out very shallow surface moisture effects, which could be important (Tucker et al., 2017).
The target temperature increase was ambient soil temperature +2 ∘C from 2005 to 2008, at which point a second lamp was added to each plot and the warming treatment was increased to +4 ∘C, where it remained through the end of the automated chamber sampling in September 2014. The treatment temperatures were increased from 2 to 4 ∘C above ambient in order to better match changing predictions of future temperature by 2100 (Christensen et al., 2007). To simulate predictions of increased frequency of small precipitation events (Weltzin et al., 2003; Christensen et al., 2007), water was added in 1.2 mm events manually with backpack sprayers and was applied 40 times from 31 May to 20 September 2006 and 36 times from 14 June to 20 September 2007, with an average time between watering of 2.8 days (∼4 × natural frequency; Table 1). This watering treatment continued through 2012 (Table 1). The amount of water varied by year because watering did not occur on days when natural rainfall occurred. Watering was stopped after 2012 because the late successional biocrust community had been eliminated after the first year and was showing no further change through time (Reed et al., 2012; Ferrenberg et al., 2015).
2.3 Net soil exchange measurements with automated chambers
Carbon dioxide fluxes were assessed with automated CO2 flux chambers, described in detail in Darrouzet-Nardi et al. (2015). The chambers were placed within the soil, open at the bottom, and have clear lids at the top that are closed once per hour for 3 min to assess net CO2 flux. The chambers allow in sunlight and hence allow photosynthesis by biocrust organisms. Fluxes of CO2 during that time are calculated as the rate of change in CO2 concentrations during the 3 min period. During that 3 min period, CO2 was recorded every 2 s and averaged every 10 s. Aberrant points were down-weighted with a smoothing function (“supsmu” implemented in MATLAB; Friedman, 1984), allowing a robust calculation of slope for a given 3 min interval (Bowling et al., 2011). The chambers were 30 cm tall × 38 cm inner diameter, covering a soil surface area of 0.11 m2. Chambers were installed to a depth of 27 cm in the soil, leaving ∼3 cm of the chamber protruding above the soil surface. The chambers were placed in plot locations containing biocrusts but no vascular plants. Values from these chambers were reported as net soil exchange (NSE) of CO2. The concept of NSE is defined in Darrouzet-Nardi et al. (2015) to include biocrust photosynthesis as the sole form of CO2 uptake (i.e., because the chambers do not include vascular plants) along with CO2 losses via respiration from biocrusts, other soil microbes, plant roots, and any abiotic soil sources. While it would have been ideal to operate the chambers year round for the entire course of the experiment, it was beyond the operational capacity of the project to do so and there are times when the systems were not operational. The chambers have more frequent malfunctions during the winter due to weather conditions, so those months are least represented. There were intermittent automated chamber measurements in 2012, the last year of watering, crossed with the higher warming level, providing enough data for analyses of daily patterns, though not enough to assess seasonal total rates.
Biocrust community composition of the autochambers was measured at the initiation of the experiment in 2005 and again in 2017. Assessment of the biocrust community was performed using a frame that covered the autochamber area in which the cover of 31 individual 25.8 cm2 squares was estimated for all biocrust species. The total cover of each species was summed from the individual quadrats and the quadrats covered 800 cm2 of the chambers' 1100 cm2 area.
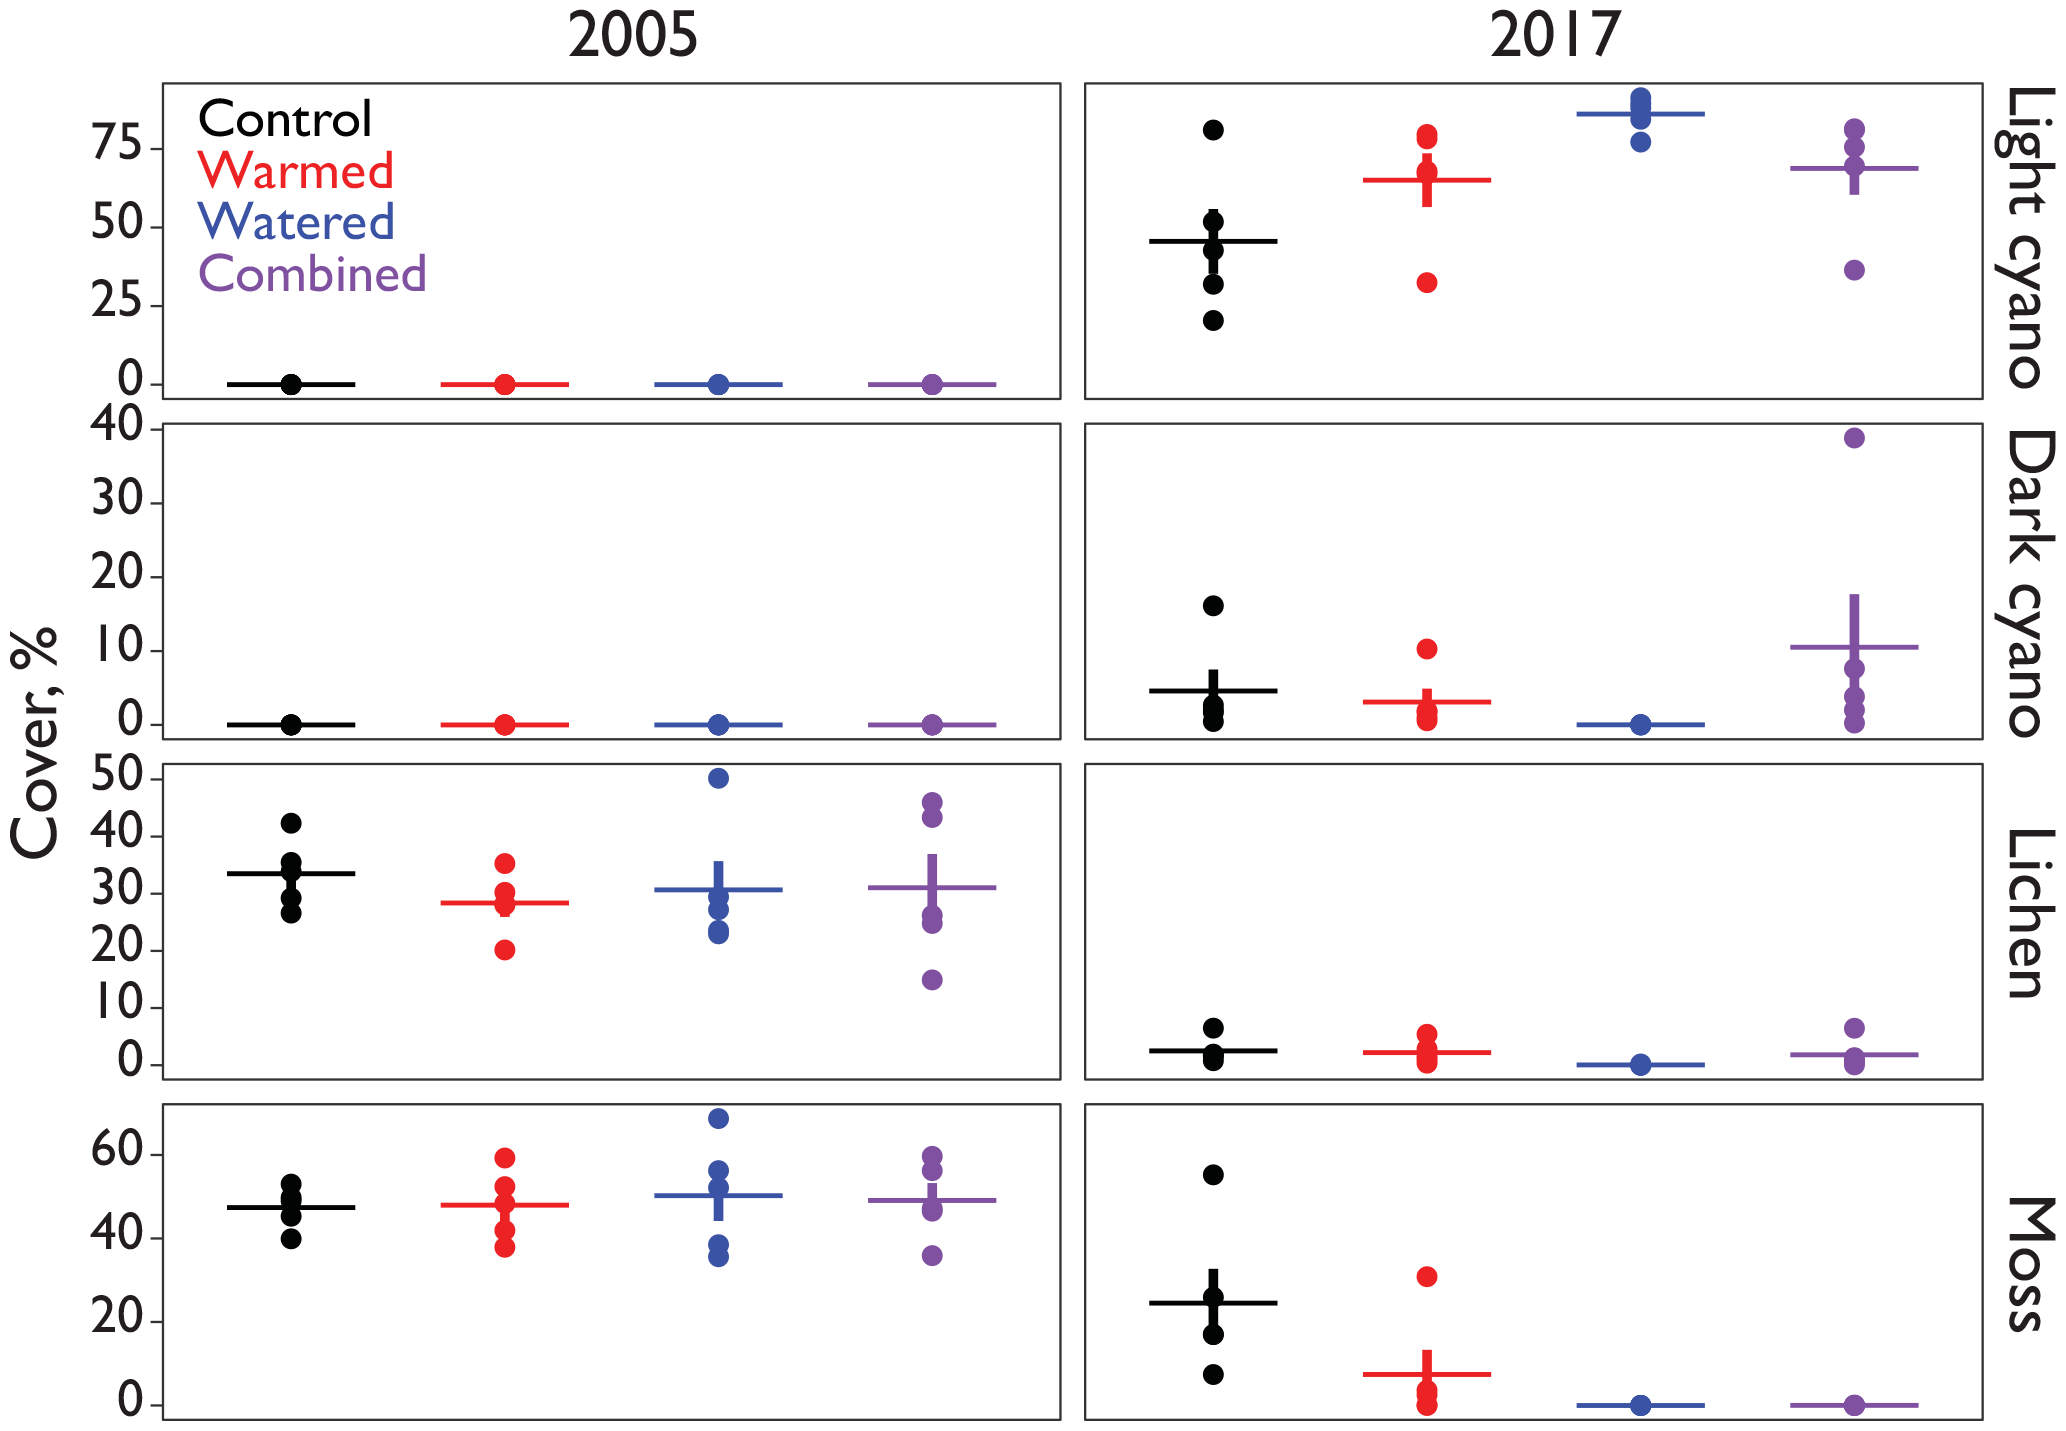
Figure 1Cover (%) of major biocrust constituents inside of the automated CO2 flux chambers representative of the early and later periods of the study.
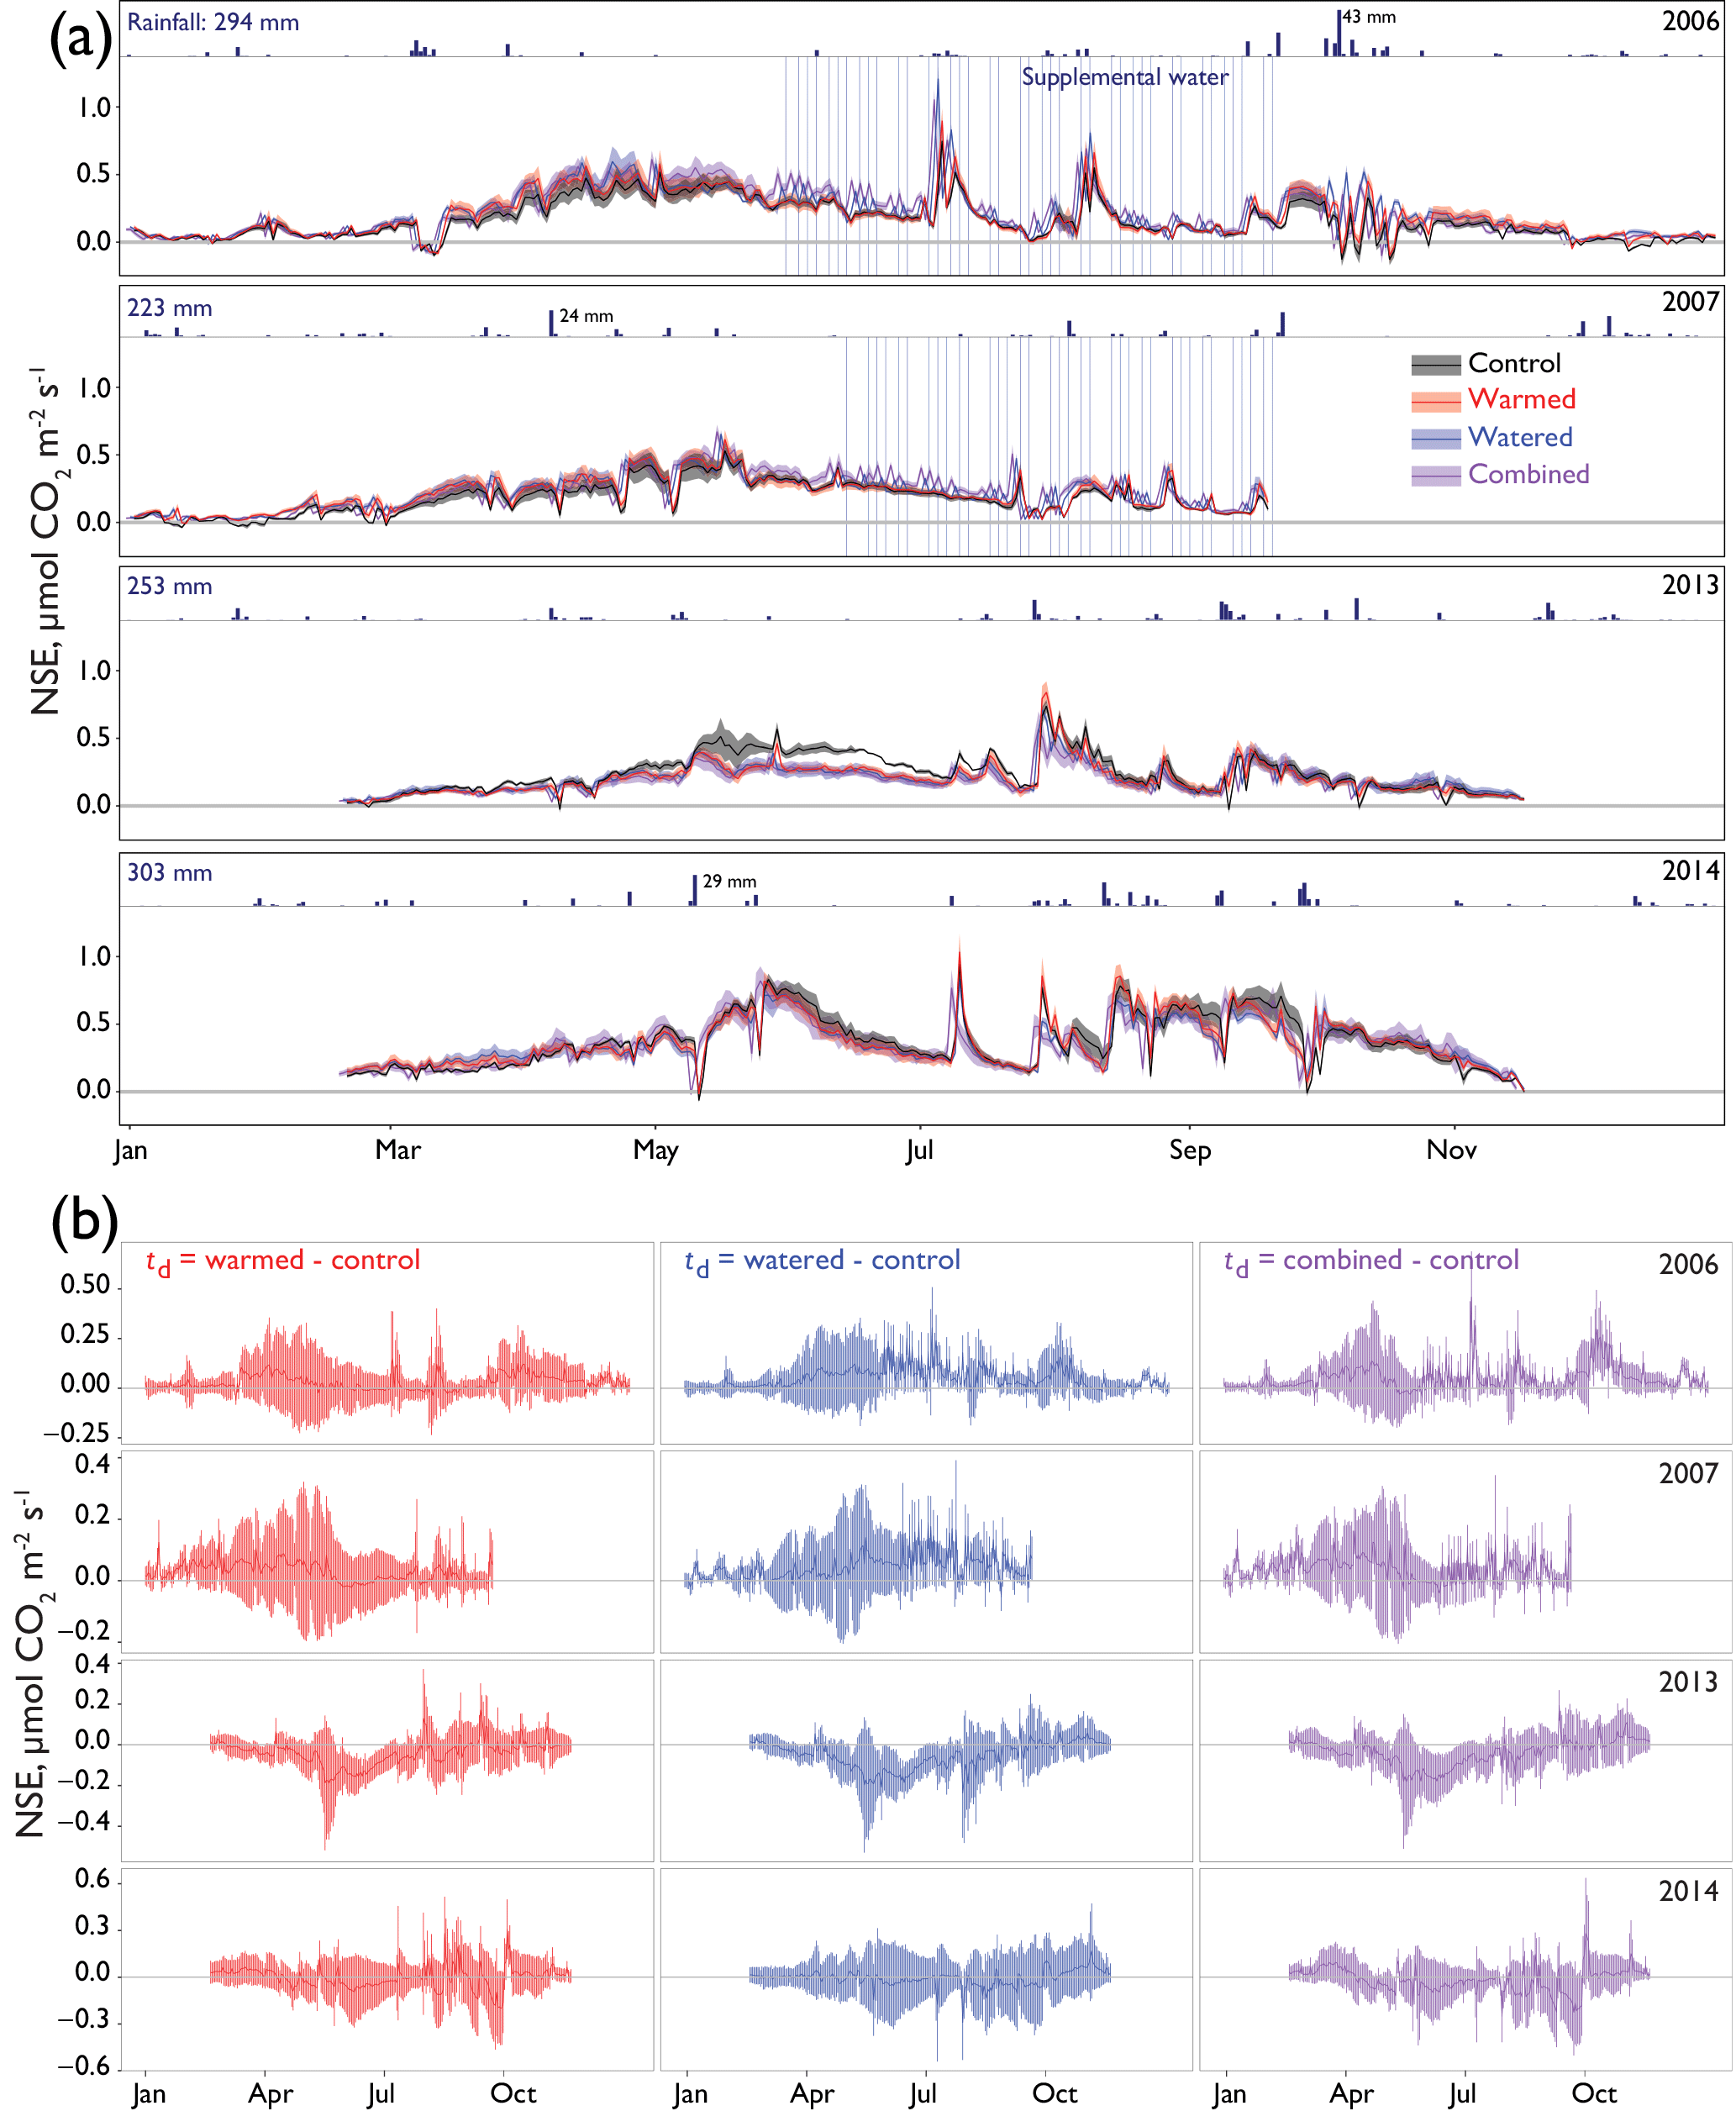
Figure 2(a) The 24 h average net soil exchange (NSE) of CO2 through all treatments and years. Dates of supplemental watering applications are shown as vertical blue lines. Ribbons indicate ±1 SE. Precipitation is shown above each year's data, with annual totals shown on the left and the size of several of the largest events noted for scale. Means for each treatment are shown with different colors representing different treatments (control = black, warmed = red, altered monsoonal precipitation [watered] = blue, warmed × watered [combined] = purple). Positive NSE rates depict respiratory losses that were greater than CO2 uptake and negative NSE rates depict C fixation rates that outpaced respiratory losses. (b) Differences between treatments and control (td) are shown as solid lines ±95 % CI calculated for each daily average shown with shading. Values were calculated by subtracting the control rates from the treatment (red = warmed − control; blue = altered monsoonal precipitation [watered] − control; purple = warmed × watered [combined] − control).
2.4 Imputation and statistical analysis
Hourly data from the automated chambers were collected from 1 January 2006–20 September 2007, 19 February–17 November 2013, and 14 February–17 November 2014, for a total of 28 058 time points for each of the 20 chambers. Of these time points, 29 % of the data were missing, primarily due to technical issues with the chambers. To allow calculations of cumulative NSE, data were imputed following the same procedure as in our previous work (Darrouzet-Nardi et al., 2015). Data were assembled into a data frame containing columns for (i) each of the 20 chambers; (ii) environmental data including soil and air temperature, soil moisture, 24 h rainfall totals, and photosynthetically active radiation (PAR); and (iii) 6 days of time-shifted fluxes (before and after each measurement; i.e., −72, −48, −24, +24, +48, +72 h) for one chamber from each treatment, soil temperature, and soil moisture. Lagged values were added due to their ability to greatly improve prediction of missing time points, particularly for short time intervals such as those caused by, for example, several hours of power outage at the site. One data frame was created for each of the three continuous recording periods – 2006–2007, 2013, and 2014 – and each was imputed separately. Imputation was performed using the missForest algorithm, which iteratively fills missing data in all columns of a data frame using predictions based on random forest models (Stekhoven and Buhlmann, 2012; Breiman, 2001).
After imputing the hourly values, cumulative fluxes were calculated by summing NSE over 7-month periods (19 February–19 September) for each year (2006, 2007, 2013, and 2014). This 7-month period was selected due to availability of data in all four analysis years. The total number of cumulative fluxes evaluated was 80 (4 years × 4 treatments × 5 replicates). We also made separate cumulative estimates of time periods in which we observed active photosynthesis, defining these periods as days during which the NSE values were −0.2 µmol CO2 m−2 s−1 or lower, with more negative numbers showing higher net photosynthesis. These periods typically correspond to times with sufficient precipitation to activate biocrusts. The effect of the warmed, watered, and combined treatments on cumulative NSE values was evaluated by calculating the size of the differences between each treatment and the control (Nakagawa and Cuthill, 2007; Cumming, 2013). Treatment differences, which we notate as td, were calculated as treatment − control (paired by block) with 95 % confidence intervals estimated using mixed effects linear models for each year with treatment as a fixed effect and block as random effect (Pinheiro and Bates, 2000). Analyses were facilitated by a custom-made R package “treateffect”, available at https://github.com/anthonydn/treateffect (2bb5ed2, last access: 7 May 2018). The data used for these analyses are available at https://doi.org/10.6084/m9.figshare.6347741.v2. Finally, to evaluate differences over time, differences between 2006 data for each treatment and each subsequent year were calculated, also using mixed effects models.
Biocrust cover within the soil collars used by the automated chambers was relatively similar in all treatments at the beginning of the experiment, with an average of 49 % moss and 31 % lichen in each treatment (Fig. 1). Between 2005 and 2017, these percentages fell in all treatments including the controls, eventually being replaced primarily by lightly pigmented cyanobacterial crusts, probably Microcoleus vaginatus (Gundlapally and Garcia-Pichel, 2006). Lichen went to <3 % in all treatments. Mosses were more variable, remaining at 25 % in controls, but falling to 7 % in warmed plots and to 0 % in both watering plots. Cyanobacteria cover started at 0 % in all chambers and rose to 50–90 %.
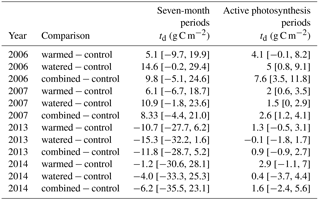
Table 2Effect sizes of our treatments are shown as mean differences in NSE between treatments and controls with 95 % confidence intervals (td). Values were calculated as the control plot rate subtracted from the rate in the treatment plot, with positive values indicating higher NSE values in the treatment plot relative to the control and vice versa. Analyses correspond to the NSE data shown in Fig. 4. Note that all underlying fluxes are positive (source to atmosphere), but here the differences between treatments are shown.
Seasonal time courses of NSE showed similar patterns among years and treatments, with peaks in NSE in the spring associated with peak vascular plant activity and peaks in both negative and positive NSE associated with rain events (Fig. 2a). In the early time period (1–2 years after treatments began), the supplemental 1.2 mm watering treatment caused large “puffs” of CO2 when water was added. By the final year of watering (2012), the size of these puffs was substantially smaller and after watering ceased (2014); they did not occur even with natural rainfall events (Fig. 3).
In the early time period (2006–2007), interannual comparisons of cumulative 19 February–19 September (7-month) CO2 fluxes were consistent with the hypothesized trend of the warming and watering treatments increasing CO2 flux to the atmosphere. In the early time period, shortly after the establishment of the treatments, we observed higher NSE (greater movement of CO2 from soil to the atmosphere) in both watered and combined treatment plots, with less evidence of difference in the warming-only treatment (Fig. 4a; Table 2). Fluxes were similar between 2006 and 2007 (Table S1 in the Supplement).
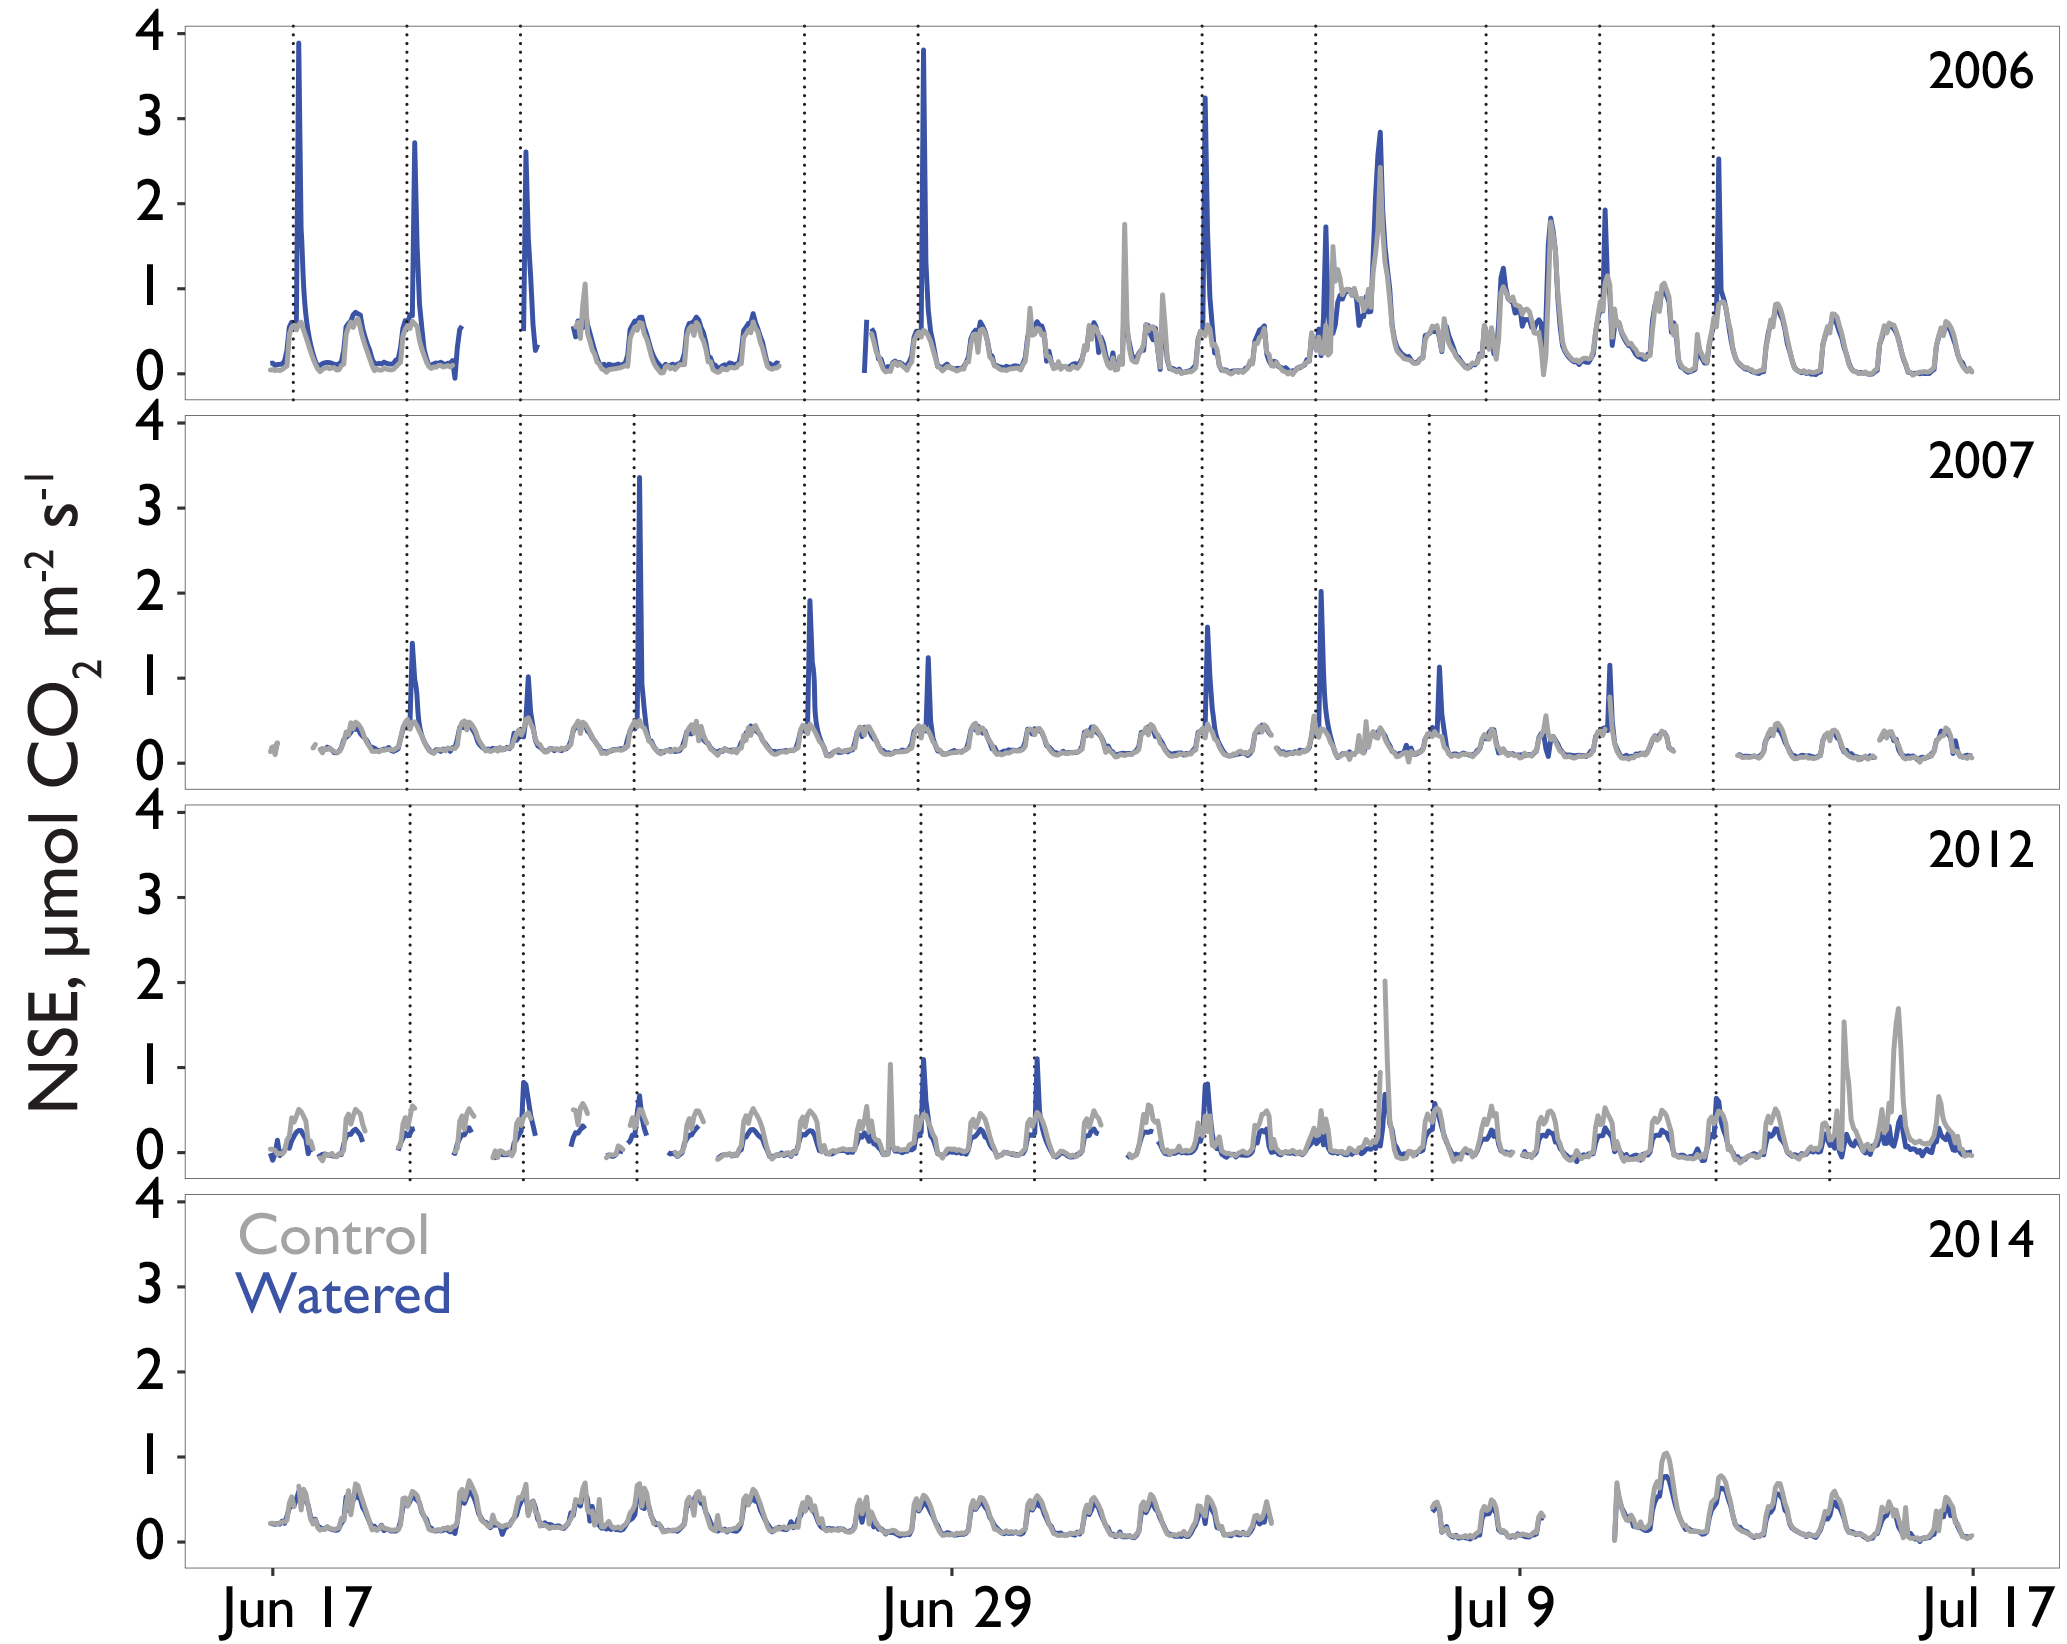
Figure 3Interannual comparison of “puffs” of CO2 from single automated flux chambers (watering treatment, block 2 in blue and comparable control chambers in gray) observed in response to midsummer experimental watering treatments. Time resolution is hourly. Plots were experimentally watered from 2005 to 2012, with no watering in the final panel (2014). Timing of the watering treatments is shown by the vertical dotted lines. The puffs shown here are CO2 fluxes at or above ∼1 µmol CO2 m2 s−1 and these occurred in response to active watering treatments.
In the later time period (2013–2014), the treatments showed varying results. In 2013, after the watering treatment had ceased, we observed a reversal of the treatment trend from the early period, with lower CO2 efflux from soils in all three treatments (Fig. 4a; Table 2). This trend was particularly visible in the months of May and June (Fig. 2a, b). However, in the following year, 2014, a wet year with high spring rainfall (Table 1, Fig. 2a), all plots showed the highest CO2 efflux observed in the experiment (e.g., 36.2 [21.7, 52.9] µmol m−2 s−1 higher compared to 2006 in control plots; Table S1). While no obvious treatment effects were observed, treatment effect sizes were relatively poorly constrained due to the higher variation that year (Table 2).

Figure 4(a) The 7-month cumulative CO2 fluxes during 4 measurement years – 2006, 2007, 2013, and 2014 – for the period of 19 February–18 September, a period chosen due to availability of data in all measurement years. (b) Cumulative CO2 flux during periods with active photosynthesis (defined as days during which NSE was µmol CO2 m−2 s−1 or lower, largely corresponding with wet periods). Though selection was made on this daily minimum, numbers are positive because 24 h totals during these periods were still largely net sources of CO2 to the atmosphere despite active photosynthesis during peak hours. Dots indicate values from individual automated chambers and horizontal and vertical bars indicate mean ±SE. For effect sizes associated with each treatment, see Table 2.
Interannual comparisons of cumulative CO2 fluxes during periods of active photosynthesis showed higher photosynthesis in all treatments during the early measurement period (e.g., 2006 warmed td=4.1 [−0.1, 8.2]; Fig. 4b; Table 2). In the later period (8–9 years after treatments began), subsequent to the cessation of watering, warmed plots still showed elevated CO2 losses during periods of active photosynthesis but this difference was smaller than in the earlier measurements (e.g., 2013 warmed td=1.3 [−0.5, 3.1]; Fig. 4b; Table 2). In contrast, watered plots that were not warmed were similar to control plots.
In examining the daily cycles in the hourly data, further detail on the nature of the treatment effects was observed. After 1 year, watered treatments in which mosses had died showed strong reductions in CO2 uptake capacity during wet-up events, but warmed treatments still showed a similar maximum uptake capacity relative to controls (e.g., minimum NSE on 15 October 2006 control = µmol m2 s−1; warmed = , watered = , combined = ; Fig. 5a). However, after 8 years of treatment, clear differences were present in the CO2 flux dynamics in response to natural rainfall events (Fig. 5b). Biocrusted soils in control plots still exhibited substantial net uptake of CO2 (e.g., minimum NSE on 14 August, control = µmol m2 s−1), whereas the other treatments showed less uptake relative to the control, with a similar trend visible on 23 August.
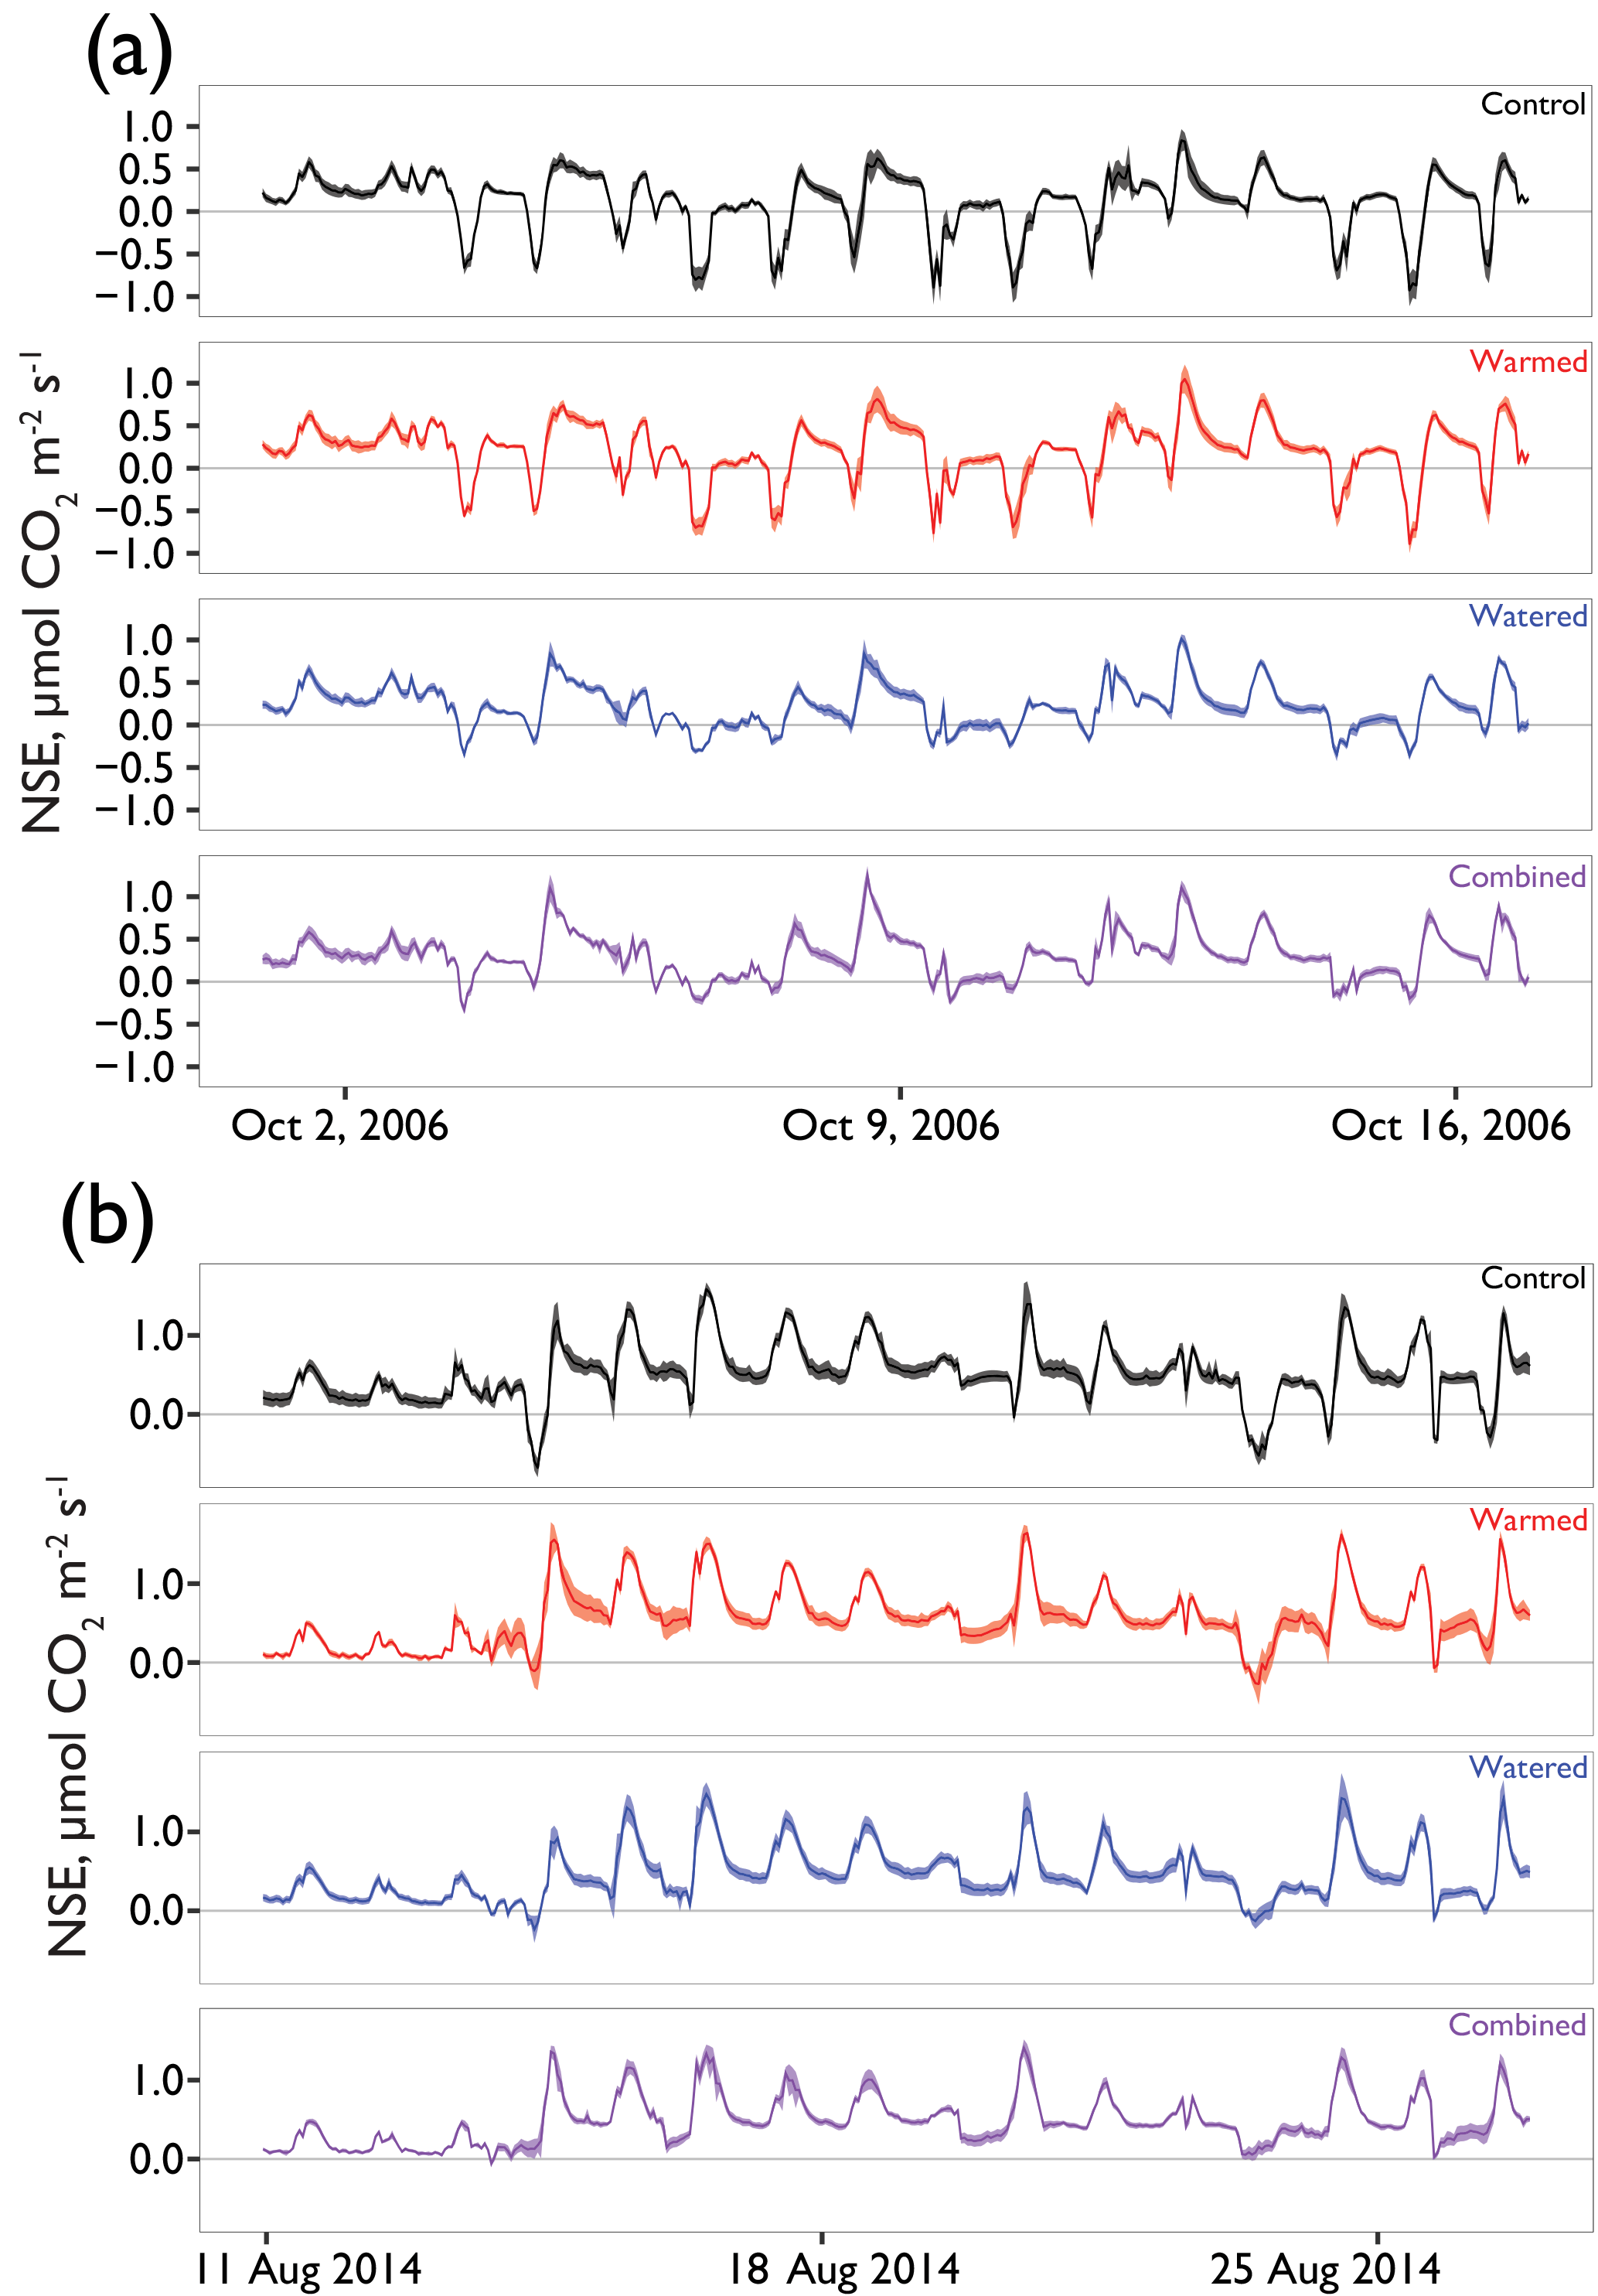
Figure 5Examples of hourly CO2 flux patterns during rain events (a) early in the experiment and (b) in the final season of measurement. Solid lines are the mean and ribbons indicate ±1 SE. See Fig. 1a for rainfall patterns at these times.
4.1 Early period: 2 ∘C warming × watering (2006–2007)
The increase in CO2 effluxes in the watered treatments during the early period (Fig. 4, Table 2) were likely driven by both the loss of photosynthetic biocrust organisms during that time (Reed et al., 2012) and increased soil respiration from soil heterotrophs. Moss death may have contributed to net soil C loss via (i) eliminating CO2 uptake from this important biocrust CO2 fixer (Reed et al., 2012; Coe et al., 2012) and (ii) decomposition of dead mosses. Elevated soil respiration with warming and watering is broadly consistent with the results of similar experiments across many ecosystems (Wu et al., 2011; Rustad et al., 2001), dryland sites specifically (Nielsen and Ball, 2015; López-Ballesteros et al., 2016; Patrick et al., 2007; Thomey et al., 2011), and previously documented effects in biocrusted soils at this site and others (Darrouzet-Nardi et al., 2015; Maestre et al., 2013; Escolar et al., 2015). In the warmed treatment, elevated NSE was not as evident in 2006 as in the watered and combined treatments, and this is consistent with the biocrust community changes. While moss died off quickly in the watered plots, mosses in the warmed plots took longer to show negative effects (Ferrenberg et al., 2017). Indeed, increased CO2 efflux with warming was clearer in the following year (2007) and moss cover was substantially reduced by 2010 (Ferrenberg et al., 2015). Such rapid species composition changes have been repeatedly implicated as drivers of system change in drylands, even with seemingly subtle changes in climate (Wu et al., 2012; Collins et al., 2010).
4.2 Late period: 9-year warming (2–4 ∘C) × legacy watering (2013–2014)
During the later period (2013) when warming had been increased to +4 ∘C (in 2009) and watering had ceased (effectively making the treatments control, +4 ∘C, legacy watering, and +4 ∘C × legacy watering), several differences in treatment effects emerged in comparison to the early measurement period (2006–2007). First, the trend in the 2013 7-month cumulative CO2 fluxes (Fig. 4, Table 2) was reversed from those of the early measurement period (2006–2007), with the control plots having the highest NSE and all other treatments showing lower CO2 efflux. The reversal of the NSE trend in the +4 and +4 ∘C × legacy watering treatments is likely influenced by changes in biocrust community composition, with mosses largely eliminated in relation to the control plots where about half of the mosses were retained (Fig. 1). By 2013, lower NSE in warmed and watered plots may have been linked to the completion of moss and lichen decline and thus cessation of fluxes from sources such as decomposition or exudation. Reductions in biocrust cover were also observed in the control plots perhaps due to the longer-term effects of infrastructure, human variation in community assessment, or natural variation in community composition (Belnap et al., 2006), and such changes could help explain the higher NSE in controls in 2013. Another possibility is that the reduced vascular plant photosynthesis observed for multiple plant species with warming in this area (Wertin et al., 2015, 2017) reduced plant allocation of C belowground. This trend could reduce root C efflux and heterotrophic breakdown of root exudate C, leading to the observed lower NSE values. A number of warming experiments in more mesic systems that do not have photosynthetic soils have shown an initial warming-induced increase in soil CO2 respiratory loss followed by subsequent declines in warmed plots; in these situations, reduced soil C availability for heterotrophic respiration and changes to heterotroph C use efficiency are often suggested to play a role (Bradford et al., 2008; Bradford, 2013; Tucker et al., 2013). Such effects would also be consistent with drying from the infrared heat lamps, a mechanism that was supported in a Wyoming grassland experiment (Pendall et al., 2013). Our soil moisture data showed little evidence of such drying effects (Fig. S3). However, with a minimum moisture probe depth of 2 cm, we may have missed moisture effects relevant only to the top several millimeters of soil, an area of current active investigation at the site: more recent results suggest that surface moisture (0–2 mm) can be a potent predictor of soil C fluxes on these biocrusted soils (Tucker et al., 2017). The reduction in CO2 efflux with warming was also seen in a nearby set of plots in 2011, in which soil respiration was measured at individual time points with non-automated chambers (Wertin et al., 2017). In that study, the reduction with warming was observed 3 years after +2 ∘C warming treatment was implemented. The dark respiration measurements were made in the spring (at peak plant activity) and it was at the same point in the season (see Fig. 2) that we saw the strongest seasonal driver for the 7-month cumulative data. In sum, although our NSE data do not allow us to disentangle the driving mechanisms, changes in (i) biocrust composition, (ii) nearby plant activity, and (iii) possibly surface moisture could all have contributed to the reversal in the effect of the warming treatment in the late period of the study. Regardless of the cause, these data suggest large, sustained changes to dryland soil C cycling at our site in response to climate change treatments.
We also observed reduced NSE values in the 2012–2013 sampling period in plots that were previously watered plots compared to the control plots, suggesting some legacy treatment effects. This was likely linked to loss of mosses, cyanobacteria, or changes in vascular plant physiology. For example, at a European site, biocrusted soil microsites were shown to be a dominant source of midday soil respiration (Castillo-Monroy et al., 2011). Furthermore, reductions in the autotrophic biomass seen with the climate treatments could reduce respiration rates (Ferrenberg et al., 2017; Reed et al., 2016). Plants accustomed to the extra water may also have responded negatively to its absence, causing reduced physiological activity and hence lower root respiration, an effect that has been documented in drought simulation experiments (Talmon et al., 2011). Soil heterotrophs can also show legacy effects of their species composition in response to changes in precipitation regime (Kaisermann et al., 2017). Water retention may also have been reduced due to the decline in biocrust cover, an effect for which there is some evidence, particularly in semiarid ecosystems like our study site (Belnap, 2006; Chamizo et al., 2012). Mosses have unique adaptations allowing them to absorb high fractions of precipitation without loss to splash and evaporation (Pan et al., 2016), a process that would be lessened in the climate manipulation plots due to moss death. In addition to effects on soil moisture, changes in biocrust community composition can have significant effects on soil nutrient availability (Reed et al., 2012) and nutrient availability can be tightly coupled with soil respiration rates (Reed et al., 2011). Although the NSE data do not allow us to determine which gross C fluxes caused the opposing treatment effects between the early (2006–2007) and late (2012–2013) measurement periods, the observation of a reversal like this is important because, if the larger CO2 loss had been sustained, it would have indicated the potential for large feedbacks to increasing atmospheric CO2 concentrations.
Interestingly, the CO2 loss reversal observed in 2013 did not continue in 2014, likely due to the higher rainfall, particularly during spring. In 2014, we saw high NSE in all plots in the 7-month cumulative data, with no significant differences among treatments. Accompanying the higher precipitation in 2014 – which occurred in a series of large rain events in April and May – perennial plants were noticeably greener and there was a flush of annual plants (Sasha C. Reed, unpublished data). During wet conditions, warmed plots had higher NSE values, which could have been due to higher root respiration or higher subsoil microbial activity, potentially linked to root turnover or rhizodeposition (Jones et al., 2004). These results from the later period of the experiment (2013–2014) underscore that taking a long-term perspective (i.e., nearly a decade of warming) may be necessary for understanding climate change effects, particularly those that maintain interactions with species composition changes. Further, these data suggest more complexity in soil CO2 efflux controls, such that some systems may not manifest a simple transition from temperature-induced increases in soil CO2 loss to temperature-induced decreases at later stages of warming. The interannual variations in the magnitude of NSE fit with results from other drylands that show high interannual variation in net ecosystem exchange (NEE) as measured with eddy flux towers (Biederman et al., 2017). At least one other longer-term manipulation in a dryland has also observed early stimulation of plant growth with warming that then lessened over time, with longer-term effects driven by changes in species composition (Wu et al., 2012). The finding that decadal-scale studies can have mixed and context-dependent effects not visible at the annual scale (Nielsen and Ball, 2015) is exemplified in our study by the reversal in effects seen in 2013, followed by the swamping out of those effects in a subsequent wet year.
4.3 Source of CO2 efflux
Observed NSE fluxes were almost always net positive (C loss to atmosphere), indicating that soil profile C losses are greatly outpacing biocrust photosynthetic uptake (Fig. 2). This necessitates a non-biocrust C source as biocrusts cannot persist with consistently negative C balance (e.g., Coe et al., 2012). The CO2 efflux data also support these non-biocrust sources. For example, although we did lose biocrusts, even in control plots, C losses continued even in plots where the larger biocrust constituents were gone (e.g., watered plots in 2014). In addition to biocrust organisms, there are three other potential sources of CO2 efflux: soil heterotrophs, vascular plant roots, and pedogenic carbonates (Darrouzet-Nardi et al., 2015). All three are possible contributors and further work is needed to partition their contributions.
We would expect the biocrusts themselves to have the biggest impact on NSE when soils are wet and biocrusts are active. During such time periods, we saw treatment effects that were distinct from the 7-month totals (Fig. 2b), which could be interpreted as evidence of a biocrust signal that did not follow the general vascular plant trends of spring activity. Indeed, several pieces of evidence point directly to a biocrust signal. First, in the later time period (2013–2014), the reduction in minimum daily NSE during precipitation events (Fig. 5) suggests that loss of biocrust CO2 uptake contributed to higher net C loss from these soils. In particular, the combined treatment lost a large proportion of its capacity to assimilate C, as well as much of the biocrust biomass. Second, the decline in the size of the puffs of CO2 that were associated with the 1.2 mm watering treatments is likely driven by declines in biocrust activity (Fig. 3), as these small watering events primarily affect the surface of the soil. These biocrust activities could include both biocrust respiration and decomposition of dead biocrust material. In our previous work (Darrouzet-Nardi et al., 2015), we saw evidence of these puffs in control plots without supplemental watering, though they were presumably not frequent enough to kill the mosses under natural conditions, a situation that could be altered if precipitation is altered in the future (Reed et al., 2012; Coe et al., 2012).
Heterotrophic respiration could also be a substantial contributor to the CO2 effluxes we observed. The soil CO2 efflux was observed rapidly after each rain pulse (natural or experimental), which could indicate soil heterotrophic respiration since plant photosynthesis may take longer to become activated (López-Ballesteros et al., 2016). The soil organic C pool in these soils includes ∼300 g C m−2 in the 0–2 cm biocrust layer, which would be depleted rapidly if it were the sole C source. However, the sub-biocrust 2–10 cm layer has ∼430 g m−2 and soils are on average 50 cm deep at the site, suggesting that the total sub-crust soil C is >1500 g C m−2 (data not shown). With a C pool of that magnitude, depletion of soil organic matter C stocks could be substantial contributors to the C losses we observed. However, if losses on the order of 62 g C m−2 (the amount lost in control plots during 2006) were to continue, these stocks would be completely depleted (which normally does not occur in soils) in ∼25 years, suggesting another source is also extremely likely.
Root respiration is a contributor we consider highly likely. During excavations of the chambers in 2017, root biomass was observed inside the chambers, making a root signal plausible. Previously published measurements from a nearby site that did not have a well-developed biocrust community showed tightly coupled measurements of plant photosynthesis with soil respiration directly beneath plant canopies (Wertin et al., 2015) while correlations between soil C concentration and soil respiration were much weaker (Wertin et al., 2018). Furthermore, the seasonal NSE trends are broadly consistent with a plant photosynthetic signal, particularly the peak in fluxes during the spring growing season, which coincides with plant uptake as indicated by negative NEE seen using eddy flux towers (Darrouzet-Nardi et al., 2015; Bowling et al., 2010). The interannual trends presented in this study are also consistent with a plant signal: for example, the wettest year, 2014, was the year in which the highest CO2 efflux rates were observed, a phenomenon that was likely driven by both increased activity in perennials and the flush of annual plants observed in that year. Finally, not only is a strong plant signal likely in these NSE measurements, but the interpretation of the treatment differences, particularly the unexpected finding of a reversal in the 7-month cumulative fluxes discussed above, is clearer in light of a plant signal. We believe that by 2013, reductions in plant productivity could have resulted in reduced root respiration in the non-control plots.
Finally, pedogenic carbonates can contribute to CO2 efflux and we cannot rule out their contribution in this study (Emmerich, 2003; Stevenson and Verburg, 2006). Some studies suggest that CO2 efflux during dry periods is likely to be from inorganic sources (Emmerich, 2003). Others make the case that the timing of CO2 efflux from CaCO3 would be more likely to overlap with the times when plants were active and calcite could be dissolved in conjunction with a source of acidity such as acid deposition, root exudation, or nitrification (Tamir et al., 2011). Either way, long-term loss of CO2 from dissolved calcite from our site cannot be ruled out and a field investigation of the isotopic composition of released CO2 would be particularly valuable in assessing inorganic contributions.
4.4 Conclusions
Both warming and watering with the associated moss death initially led to higher CO2 losses in our experimental plots. After the cessation of watering, the patterns in the C balances were reversed in an average moisture year (2013), with the climate manipulation plots of all treatments showing lowered soil CO2 loss relative to controls. These data are in line with warming experiments from a range of climates, suggesting warming-induced increases in soil CO2 are not a long-term phenomenon, at least within these experimental frameworks. Moreover, in a subsequent wet year (2014), CO2 fluxes were uniformly high among treatments. When focusing just on periods of active biocrust photosynthesis, after 8 years, biocrust photosynthetic performance was much weaker in both warmed and legacy watered treatments relative to the control plots despite biocrust changes in control plots as well. These results suggest that the community composition changes that are highly likely in dryland plants (Collins et al., 2010; Wu et al., 2011) and biocrusts (Ferrenberg et al., 2017; Johnson et al., 2012) as a response to global change are likely to affect C balances even if effects are not consistent year to year. Our results show how community shifts, such as the loss of a major photosynthetic component like mosses, will contribute to an altered C balance of these biocrusted soils. Finally, our results underscore a strong role for biocrust, root, and possibly soil heterotrophic and inorganic signals in NSE, suggesting that further study of the balance of plant assimilation and root/rhizosphere respiration of C, as well as patterns in biocrust C, in response to climate change will be an important determinant of future C fluxes in drylands.
Data and analysis scripts are available at figshare: https://doi.org/10.6084/m9.figshare.6347741.v2 (Darrouzet-Nardi, 2018).
The supplement related to this article is available online at: https://doi.org/10.5194/bg-15-4561-2018-supplement.
JB initiated the experiment and JB and SCR gained funding for the work. All authors performed the experiment, with EEG leading design and construction of the automated chambers and data management. ADN analyzed the data and led the manuscript writing, and all authors contributed to the writing.
The authors declare that they have no conflict of interest.
This work was supported by the U.S. Department of Energy Office of Science,
Office of Biological and Environmental Research Terrestrial Ecosystem
Sciences Program, under award number DE-SC-0008168, as well as U.S. Geological
Survey's Climate and Land Use and Ecosystems Mission Areas. We thank the
multitudinous technicians and collaborators who have contributed to the field
operations on this project.
Edited by: Paul Stoy
Reviewed by: two anonymous referees
Ahlström, A., Raupach, M. R., Schurgers, G., Smith, B., Arneth, A., Jung, M., Reichstein, M., Canadell, J. G., Friedlingstein, P., Jain, A. K., Kato, E., Poulter, B., Sitch, S., Stocker, B. D., Viovy, N., Wang, Y. P., Wiltshire, A., Zaehle, S., and Zeng, N.: The dominant role of semi-arid ecosystems in the trend and variability of the land CO2 sink, Science, 348, 895–899, https://doi.org/10.1126/science.aaa1668, 2015.
Belnap, J.: The potential roles of biological soil crusts in dryland hydrologic cycles, Hydrol. Process., 20, 3159–3178, https://doi.org/10.1002/hyp.6325, 2006.
Belnap, J. and Phillips, S. L.: Soil biota in an ungrazed grassland: Response to annual grass (Bromus tectorum) invasion, Ecol. Appl., 11, 1261–1275, 2001.
Belnap, J., Phillips, S. L., and Troxler, T.: Soil lichen and moss cover and species richness can be highly dynamic: The effects of invasion by the annual exotic grass Bromus tectorum, precipitation, and temperature on biological soil crusts in SE Utah, Appl. Soil Ecol., 32, 63–76, https://doi.org/10.1016/j.apsoil.2004.12.010, 2006.
Biederman, J. A., Scott, R. L., Bell, T. W., Bowling, D. R., Dore, S., Garatuza-Payan, J., Kolb, T. E., Krishnan, P., Krofcheck, D. J., Litvak, M. E., Maurer, G. E., Meyers, T. P., Oechel, W. C., Papuga, S. A., Ponce-Campos, G. E., Rodriguez, J. C., Smith, W. K., Vargas, R., Watts, C. J., Yepez, E. A., and Goulden, M. L.: CO2 exchange and evapotranspiration across dryland ecosystems of southwestern North America, Glob. Change Biol., 23, 4204–4221, https://doi.org/10.1111/gcb.13686, 2017.
Bowling, D. R., Bethers-Marchetti, S., Lunch, C. K., Grote, E. E., and Belnap, J.: Carbon, water, and energy fluxes in a semiarid cold desert grassland during and following multiyear drought, J. Geophys. Res., 115, G04026, https://doi.org/10.1029/2010JG001322, 2010.
Bowling, D. R., Grote, E. E., and Belnap, J.: Rain pulse response of soil CO2 exchange by biological soil crusts and grasslands of the semiarid Colorado Plateau, United States, J. Geophys. Res.-Biogeo., 116, G03028, https://doi.org/10.1029/2011JG001643, 2011.
Bradford, M.: Thermal adaptation of decomposer communities in warming soils, Front. Microbiol., 4, 333, https://doi.org/10.3389/fmicb.2013.00333, 2013.
Bradford, M. A., Davies, C. A., Frey, S. D., Maddox, T. R., Melillo, J. M., Mohan, J. E., Reynolds, J. F., Treseder, K. K., and Wallenstein, M. D.: Thermal adaptation of soil microbial respiration to elevated temperature, Ecol. Lett., 11, 1316–1327, 2008.
Breiman, L.: Random forests, Mach. Learn., 45, 5–32, 2001.
Castillo-Monroy, A., Maestre, F., Rey, A., Soliveres, S., and García-Palacios, P.: Biological Soil Crust Microsites Are the Main Contributor to Soil Respiration in a Semiarid Ecosystem, Ecosystems, 14, 835–847, https://doi.org/10.1007/s10021-011-9449-3, 2011.
Chamizo, S., Cantón, Y., Lázaro, R., Solé-Benet, A., and Domingo, F.: Crust composition and disturbance drive infiltration through biological soil crusts in semiarid ecosystems, Ecosystems, 15, 148–161, 2012.
Christensen, J. H., Hewitson, B., Busuioc, A., Chen, A., Gao, X., Held, I., Jones, R., Kolli, R. K., Kwon, W.-T., Laprise, R., Magaña Rueda, V., Mearns, L., Menéndez, C. G., Räisänen, J., Rinke, A., Sarr, A., and Whetton, P.: Regional Climate Projections, in: Climate Change 2007: The Physical Science Basis. Contribution of Working Group I to the Fourth Assessment Report of the Intergovernmental Panel on Climate Change, edited by: Solomon, S., Qin, D., Manning, M., Chen, Z., Marquis, M., Averyt, K. B., Tignor, M., and Miller, H. L., Cambridge University Press, Cambridge, 848–940, 2007.
Coe, K. K., Belnap, J., and Sparks, J. P.: Precipitation-driven carbon balance controls survivorship of desert biocrust mosses, Ecology, 93, 1626–1636, https://doi.org/10.1890/11-2247.1, 2012.
Collins, S. L., Fargione, J. E., Crenshaw, C. L., Nonaka, E., Elliott, J. R., Xia, Y., and Pockman, W. T.: Rapid plant community responses during the summer monsoon to nighttime warming in a northern Chihuahuan Desert grassland, J. Arid Environ., 74, 611–617, https://doi.org/10.1016/j.jaridenv.2009.10.005, 2010.
Cumming, G.: Understanding the new statistics: Effect sizes, confidence intervals, and meta-analysis, Routledge, Taylor & Francis Group, New York London, 2013.
Darrouzet-Nardi, A.: warmed_biocrusts_nine_years, figshare, Dataset, https://doi.org/10.6084/m9.figshare.6347741.v2, 2018.
Darrouzet-Nardi, A., Reed, S., Grote, E., and Belnap, J.: Observations of net soil exchange of CO2 in a dryland show experimental warming increases carbon losses in biocrust soils, Biogeochemistry, 126, 363–378, https://doi.org/10.1007/s10533-015-0163-7, 2015.
Delgado-Baquerizo, M., Maestre, F. T., Gallardo, A., Bowker, M. A., Wallenstein, M. D., Quero, J. L., Ochoa, V., Gozalo, B., Garcia-Gomez, M., Soliveres, S., Garcia-Palacios, P., Berdugo, M., Valencia, E., Escolar, C., Arredondo, T., Barraza-Zepeda, C., Bran, D., Carreira, J. A., Chaieb, M., Conceicao, A. A., Derak, M., Eldridge, D. J., Escudero, A., Espinosa, C. I., Gaitan, J., Gatica, M. G., Gomez-Gonzalez, S., Guzman, E., Gutierrez, J. R., Florentino, A., Hepper, E., Hernandez, R. M., Huber-Sannwald, E., Jankju, M., Liu, J., Mau, R. L., Miriti, M., Monerris, J., Naseri, K., Noumi, Z., Polo, V., Prina, A., Pucheta, E., Ramirez, E., Ramirez-Collantes, D. A., Romao, R., Tighe, M., Torres, D., Torres-Diaz, C., Ungar, E. D., Val, J., Wamiti, W., Wang, D., and Zaady, E.: Decoupling of soil nutrient cycles as a function of aridity in global drylands, Nature, 502, 672–676, https://doi.org/10.1038/nature12670, 2013.
D'Odorico, P. and Bhattachan, A.: Hydrologic variability in dryland regions: impacts on ecosystem dynamics and food security, Philos. T. R. Soc. B, 367, 3145–3157, 2012.
Elbert, W., Weber, B., Burrows, S., Steinkamp, J., Budel, B., Andreae, M. O., and Pöschl, U.: Contribution of cryptogamic covers to the global cycles of carbon and nitrogen, Nat. Geosci., 5, 459–462, 2012.
Emmerich, W. E.: Carbon dioxide fluxes in a semiarid environment with high carbonate soils, Agr. Forest Meteorol., 116, 91–102, https://doi.org/10.1016/S0168-1923(02)00231-9, 2003.
Escolar, C., Martínez, I., Bowker, M. A., and Maestre, F. T.: Warming reduces the growth and diversity of biological soil crusts in a semi-arid environment: implications for ecosystem structure and functioning, Philos. T. Roy. Soc. B, 367, 3087–3099, 2012.
Escolar, C., Maestre, F. T., and Rey, A.: Biocrusts modulate warming and rainfall exclusion effects on soil respiration in a semi-arid grassland, Soil Biol. Biochem., 80, 9–17, 2015.
Ferrenberg, S., Reed, S. C., and Belnap, J.: Climate change and physical disturbance cause similar community shifts in biological soil crusts, P. Natl. Acad. Sci. USA, 112, 12116–12121, https://doi.org/10.1073/pnas.1509150112, 2015.
Ferrenberg, S., Tucker, C. L., and Reed, S. C.: Biological soil crusts: diminutive communities of potential global importance, Front. Ecol. Environ., 15, 160–167, 2017.
Friedman, J. H.: A variable span smoother, Stanford Univ., Lab for Computational Statistics, CA, 1984.
Green, L. E., Porras-Alfaro, A., and Sinsabaugh, R. L.: Translocation of nitrogen and carbon integrates biotic crust and grass production in desert grassland, J. Ecol., 96, 1076–1085, https://doi.org/10.1111/j.1365-2745.2008.01388.x, 2008.
Grote, E. E., Belnap, J., Housman, D. C., and Sparks, J. P.: Carbon exchange in biological soil crust communities under differential temperatures and soil water contents: implications for global change, Glob. Change Biol., 16, 2763–2774, https://doi.org/10.1111/j.1365-2486.2010.02201.x, 2010.
Gundlapally, S. R. and Garcia-Pichel, F.: The Community and Phylogenetic Diversity of Biological Soil Crusts in the Colorado Plateau Studied by Molecular Fingerprinting and Intensive Cultivation, Microb. Ecol., 52, 345–357, https://doi.org/10.1007/s00248-006-9011-6, 2006.
IPCC: Climate Change 2013: The Physical Science Basis. Contribution of Working Group I to the Fifth Assessment Report of the Intergovernmental Panel on Climate Change, edited by: Stocker, T. F., Qin, D., Plattner, G.-K., Tignor, M., Allen, S. K., Boschung, J., Nauels, A., Xia, Y., Bex, V., and Midgley, P. M., Cambridge University Press, Cambridge, UK and New York, NY, USA, 1535 pp., 2013.
Jardine, A., Merideth, R., Black, M., and LeRoy, S.: Assessment of climate change in the southwest United States: a report prepared for the National Climate Assessment, Island press, Washington D.C., 2013.
Johnson, S. L., Kuske, C. R., Carney, T. D., Housman, D. C., Gallegos-Graves, L. V., and Belnap, J.: Increased temperature and altered summer precipitation have differential effects on biological soil crusts in a dryland ecosystem, Glob. Change Biol., 18, 2583–2593, https://doi.org/10.1111/j.1365-2486.2012.02709.x, 2012.
Jones, D. L., Hodge, A., and Kuzyakov, Y.: Plant and mycorrhizal regulation of rhizodeposition, New Phytol., 163, 459–480, https://doi.org/10.1111/j.1469-8137.2004.01130.x, 2004.
Kaisermann, A., de Vries, F. T., Griffiths, R. I., and Bardgett, R. D.: Legacy effects of drought on plant–soil feedbacks and plant–plant interactions, New Phytol., 215, 1413–1424, https://doi.org/10.1111/nph.14661, 2017.
Knapp, A. K., Carroll, C. J. W., Denton, E. M., La Pierre, K. J., Collins, S. L., and Smith, M. D.: Differential sensitivity to regional-scale drought in six central US grasslands, Oecologia, 177, 949–957, https://doi.org/10.1007/s00442-015-3233-6, 2015.
Lal, R.: Carbon sequestration in dryland ecosystems, Environ. Manage., 33, 528–544, 2004.
López-Ballesteros, A., Serrano-Ortiz, P., Sánchez-Cañete, E. P., Oyonarte, C., Kowalski, A. S., Pérez-Priego, Ó., and Domingo, F.: Enhancement of the net CO2 release of a semiarid grassland in SE Spain by rain pulses, J. Geophys. Res.-Biogeo., 121, 52–66, https://doi.org/10.1002/2015JG003091, 2016.
Maestre, F. T., Escolar, C., de Guevara, M. L., Quero, J. L., Lázaro, R., Delgado-Baquerizo, M., Ochoa, V., Berdugo, M., Gozalo, B., and Gallardo, A.: Changes in biocrust cover drive carbon cycle responses to climate change in drylands, Glob. Change Biol., 19, 3835–3847, https://doi.org/10.1111/gcb.12306, 2013.
Maestre, F. T., Escolar, C., Bardgett, R. D., Dungait, J. A., Gozalo, B., and Ochoa, V.: Warming reduces the cover and diversity of biocrust-forming mosses and lichens, and increases the physiological stress of soil microbial communities in a semi-arid Pinus halepensis plantation, Front. Microbiol., 6, 865, https://doi.org/10.3389/fmicb.2015.00865, 2015.
Nakagawa, S. and Cuthill, I. C.: Effect size, confidence interval and statistical significance: a practical guide for biologists, Biol. Rev., 82, 591–605, https://doi.org/10.1111/j.1469-185X.2007.00027.x, 2007.
Nielsen, U. N. and Ball, B. A.: Impacts of altered precipitation regimes on soil communities and biogeochemistry in arid and semi-arid ecosystems, Glob. Change Biol., 21, 1407–1421, https://doi.org/10.1111/gcb.12789, 2015.
Oliver, M. J., Velten, J., and Mishler, B. D.: Desiccation tolerance in bryophytes: a reflection of the primitive strategy for plant survival in dehydrating habitats?, Integr. Comp. Biol., 45, 788–799, 2005.
Pan, Z., Pitt, W. G., Zhang, Y., Wu, N., Tao, Y., and Truscott, T. T.: The upside-down water collection system of Syntrichia caninervis, Nat. Plants, 2, 16076, 2016.
Patrick, L., Cable, J., Potts, D., Ignace, D., Barron-Gafford, G., Griffith, A., Alpert, H., Van Gestel, N., Robertson, T., and Huxman, T. E.: Effects of an increase in summer precipitation on leaf, soil, and ecosystem fluxes of CO2 and H2O in a sotol grassland in Big Bend National Park, Texas, Oecologia, 151, 704–718, 2007.
Pendall, E., Heisler-White, J. L., Williams, D. G., Dijkstra, F. A., Carrillo, Y., Morgan, J. A., and LeCain, D. R.: Warming reduces carbon losses from grassland exposed to elevated atmospheric carbon dioxide, PLoS One, 8, e71921, https://doi.org/10.1371/journal.pone.0071921, 2013.
Pinheiro, J. C. and Bates, D. M.: Mixed-effects models in S and S-PLUS, Springer, New York, xvi, 528 pp., 2000.
Poulter, B., Frank, D., Ciais, P., Myneni, R. B., Andela, N., Bi, J., Broquet, G., Canadell, J. G., Chevallier, F., Liu, Y. Y., Running, S. W., Sitch, S., and van der Werf, G. R.: Contribution of semi-arid ecosystems to interannual variability of the global carbon cycle, Nature, 509, 600–603, https://doi.org/10.1038/nature13376, 2014.
Prăvălie, R.: Drylands extent and environmental issues. A global approach, Earth-Sci. Rev., 161, 259–278, https://doi.org/10.1016/j.earscirev.2016.08.003, 2016.
Reed, S. C., Vitousek, P. M., and Cleveland, C. C.: Are patterns in nutrient limitation belowground consistent with those aboveground: results from a 4 million year chronosequence, Biogeochemistry, 106, 323–336, 2011.
Reed, S. C., Coe, K. K., Sparks, J. P., Housman, D. C., Zelikova, T. J., and Belnap, J.: Changes to dryland rainfall result in rapid moss mortality and altered soil fertility, Nat. Clim. Change, 2, 752–755, 2012.
Reed, S. C., Maestre, F. T., Ochoa-Hueso, R., Kuske, C. R., Darrouzet-Nardi, A., Oliver, M., Darby, B., Sancho, L. G., Sinsabaugh, R. L., and Belnap, J.: Biocrusts in the context of global change, in: Biological Soil Crusts: An Organizing Principle in Drylands, Springer, 451–476, 2016.
Rustad, L., Campbell, J., Marion, G., Norby, R., Mitchell, M., Hartley, A., Cornelissen, J., Gurevitch, J., and Gcte, N.: A meta-analysis of the response of soil respiration, net nitrogen mineralization, and aboveground plant growth to experimental ecosystem warming, Oecologia, 126, 543–562, https://doi.org/10.1007/s004420000544, 2001.
Rutherford, W. A., Painter, T. H., Ferrenberg, S., Belnap, J., Okin, G. S., Flagg, C., and Reed, S. C.: Albedo feedbacks to future climate via climate change impacts on dryland biocrusts, Sci. Rep.-UK, 7, 44188, https://doi.org/10.1038/srep44188, 2017.
Safriel, U., Adeel, Z., Niemeijer, D., Puigdefabregas, J., White, R., Lal, R., Winslow, M., Ziedler, J., Prince, S., Archer, E., King, C., Shapiro, B., Wessels, K., Nielsen, T., Portnov, B., Reshef, I., Thonell, J., Lachman, E., and McNab, D.: Dryland systems, in: Millenium Ecosystem Assessment, edited by: Mohammed El-Kassas, E. E., World Resources Institute, Washington, D.C., 623–662, 2005.
Seager, R., Ting, M., Held, I., Kushnir, Y., Lu, J., Vecchi, G., Huang, H.-P., Harnik, N., Leetmaa, A., and Lau, N.-C.: Model projections of an imminent transition to a more arid climate in southwestern North America, Science, 316, 1181–1184, 2007.
Stekhoven, D. J. and Buhlmann, P.: MissForest-non-parametric missing value imputation for mixed-type data, Bioinformatics, 28, 112–118, https://doi.org/10.1093/bioinformatics/btr597, 2012.
Steven, B., Kuske, C. R., Gallegos-Graves, L. V., Reed, S. C., and Belnap, J.: Climate Change and Physical Disturbance Manipulations Result in Distinct Biological Soil Crust Communities, Appl. Environ. Microb., 81, 7448–7459, https://doi.org/10.1128/aem.01443-15, 2015.
Stevenson, B. A. and Verburg, P. S. J.: Effluxed CO2-13C from sterilized and unsterilized treatments of a calcareous soil, Soil Biol. Biochem., 38, 1727–1733, https://doi.org/10.1016/j.soilbio.2005.11.028, 2006.
Talmon, Y., Sternberg, M., and Gruenzweig, J. M.: Impact of rainfall manipulations and biotic controls on soil respiration in Mediterranean and desert ecosystems along an aridity gradient, Glob. Change Biol., 17, 1108–1118, 2011.
Tamir, G., Shenker, M., Heller, H., Bloom, P. R., Fine, P., and Bar-Tal, A.: Can Soil Carbonate Dissolution Lead to Overestimation of Soil Respiration?, Soil Sci. Soc. Am. J., 75, 1414–1422, https://doi.org/10.2136/sssaj2010.0396, 2011.
Thomey, M. L., Collins, S. L., Vargas, R., Johnson, J. E., Brown, R. F., Natvig, D. O., and Friggens, M. T.: Effect of precipitation variability on net primary production and soil respiration in a Chihuahuan Desert grassland, Glob. Change Biol., 17, 1505–1515, 2011.
Tucker, C. L. and Reed, S. C.: Low soil moisture during hot periods drives apparent negative temperature sensitivity of soil respiration in a dryland ecosystem: a multi-model comparison, Biogeochemistry, 128, 155–169, 2016.
Tucker, C. L., Bell, J., Pendall, E., and Ogle, K.: Does declining carbon-use efficiency explain thermal acclimation of soil respiration with warming?, Glob. Change Biol., 19, 252–263, 2013.
Tucker, C. L., McHugh, T. A., Howell, A., Gill, R., Weber, B., Belnap, J., Grote, E., and Reed, S. C.: The concurrent use of novel soil surface microclimate measurements to evaluate CO2 pulses in biocrusted interspaces in a cool desert ecosystem, Biogeochemistry, 135, 239–249, https://doi.org/10.1007/s10533-017-0372-3, 2017.
Weltzin, J. F., Loik, M. E., Schwinning, S., Williams, D. G., Fay, P. A., Haddad, B. M., Harte, J., Huxman, T. E., Knapp, A. K., Lin, G. H., Pockman, W. T., Shaw, M. R., Small, E. E., Smith, M. D., Smith, S. D., Tissue, D. T., and Zak, J. C.: Assessing the response of terrestrial ecosystems to potential changes in precipitation, Bioscience, 53, 941–952, 2003.
Wertin, T. M., Reed, S. C., and Belnap, J.: C3 and C4 plant responses to increased temperatures and altered monsoonal precipitation in a cool desert on the Colorado Plateau, USA, Oecologia, 177, 997–1013, 2015.
Wertin, T. M., Belnap, J., and Reed, S. C.: Experimental warming in a dryland community reduced plant photosynthesis and soil CO2 efflux although the relationship between the fluxes remained unchanged, Funct. Ecol., 31, 297–305, 2017.
Wertin, T. M., Young, K., and Reed, S. C.: Spatially explicit patterns in a dryland's soil respiration and relationships with climate, whole plant photosynthesis, and soil fertility, Oikos, https://doi.org/10.1111/oik.04935, online first, 2018.
Wu, Z., Dijkstra, P., Koch, G. W., Peñuelas, J., and Hungate, B. A.: Responses of terrestrial ecosystems to temperature and precipitation change: a meta-analysis of experimental manipulation, Glob. Change Biol., 17, 927–942, 2011.
Wu, Z., Dijkstra, P., Koch, G. W., and Hungate, B. A.: Biogeochemical and ecological feedbacks in grassland responses to warming, Nat. Clim. Change, 2, 458–461, 2012.
Zelikova, T. J., Housman, D. C., Grote, E. E., Neher, D. A., and Belnap, J.: Warming and increased precipitation frequency on the Colorado Plateau: implications for biological soil crusts and soil processes, Plant Soil, 355, 265–282, 2012.