the Creative Commons Attribution 4.0 License.
the Creative Commons Attribution 4.0 License.
 | 14 Dec 2018
Modelling the biogeochemical effects of heterotrophic and autotrophic N2 fixation in the Gulf of Aqaba (Israel), Red Sea
Angela M. Kuhn
Katja Fennel
Ilana Berman-Frank
Recent studies demonstrate that marine N2 fixation can be carried out without light by heterotrophic N2 fixers (diazotrophs). However, direct measurements of N2 fixation in aphotic environments are relatively scarce. Heterotrophic as well as unicellular and colonial photoautotrophic diazotrophs are present in the oligotrophic Gulf of Aqaba (northern Red Sea). This study evaluates the relative importance of these different diazotrophs by combining biogeochemical models with time series measurements at a 700 m deep monitoring station in the Gulf of Aqaba. At this location, an excess of nitrate, relative to phosphate, is present throughout most of the water column and especially in deep waters during stratified conditions. A relative excess of phosphate occurs only at the water surface during nutrient-starved conditions in summer. We show that a model without N2 fixation can replicate the observed surface chlorophyll but fails to accurately simulate inorganic nutrient concentrations throughout the water column. Models with N2 fixation improve simulated deep nitrate by enriching sinking organic matter in nitrogen, suggesting that N2 fixation is necessary to explain the observations. The observed vertical structure of nutrient ratios and oxygen is reproduced best with a model that includes heterotrophic as well as colonial and unicellular autotrophic diazotrophs. These results suggest that heterotrophic N2 fixation contributes to the observed excess nitrogen in deep water at this location. If heterotrophic diazotrophs are generally present in oligotrophic ocean regions, their consideration would increase current estimates of global N2 fixation and may require explicit representation in large-scale models.
- Article
(15346 KB) - Full-text XML
-
Supplement
(413 KB) - BibTeX
- EndNote


Biological nitrogen fixation refers to the conversion of dinitrogen gas (N2) via reduction to ammonium (NH4) into bioavailable forms of nitrogen by a specialized group of microbes containing the nitrogenase enzyme complex. On geological timescales, the size of the oceanic reservoir of bioavailable nitrogen, and thus the ocean's capacity for exporting carbon to depth, is controlled by the balance between removal of fixed nitrogen by denitrification and input by N2 fixation (Falkowski, 1997; Haug et al., 1998; Deutsch et al., 2007; Gruber and Galloway, 2008; Fennel et al., 2005). The amount of organic matter exported from the surface to the deep ocean (i.e. export production) depends on allochthonous inputs of nitrogen (i.e. “new nitrogen”) into the euphotic zone (Eppley and Peterson, 1979). These new nitrogen inputs determine the amount of “new production”, which is directly related to the exported fraction. Locally the supply of new nitrogen can occur through several mechanisms, including microbially mediated N2 fixation, diapycnal mixing injecting deep nitrate (NO3) into the surface, lateral transport, atmospheric sources and riverine input. While the injection of deep NO3 is often regarded as the dominant source of new nitrogen that drives the seasonal cycle of marine primary production, there is significant interest in quantifying the contribution of N2 fixation to primary production, particularly in oligotrophic areas (Karl, 2002; Zehr and Ward, 2002; Capone et al., 2005; Luo et al., 2012).
Diazotrophs contain nitrogenase, the catalyst enzyme for N2 reduction, which is encoded by nif genes. Trichodesmium spp., a group of non-heterocystous filamentous cyanobacteria that form large colonies, were traditionally considered the main contributors to N2 fixation in the surface subtropical and tropical ocean (Carpenter and McCarthy, 1975; Capone et al., 2005). Increased sampling efforts and method improvements subsequently led to the discovery of diverse diazotroph groups including heterocystous endosymbiotic cyanobacteria (Zehr et al., 1998; Carpenter et al., 1999), free-living unicellular cyanobacteria (Zehr et al., 2001; Montoya, 2004; Moisander et al., 2010) and other cyanobacterial symbionts (Zehr et al., 2000). Most recently, genetic techniques have allowed the detection of nif genes in a number of anaerobic and heterotrophic phylotypes (Zehr et al., 2008; Zehr, 2011; Rahav et al., 2013, 2015). The abundance of nif genes does not necessarily imply that these organisms are actively fixing N2 (Zehr et al., 2000; Moisander et al., 2017); however, the correlation between heterotrophic bacterial productivity and N2 fixation rates suggests that significant aphotic N2 fixation may occur in the Red Sea (Rahav et al., 2013, 2015; Benavides et al., 2018). The differences in size and physiology of these diverse diazotrophs also suggest that they occupy distinct niches and thus may affect primary productivity and export production differently (Bonnet et al., 2016; Moisander et al., 2010).
Most biogeochemical models treat N2 fixation as a purely light-dependent, autotrophic process. These models either use standard formulations of light limitation for the diazotrophic groups (e.g. Fennel et al., 2002; Moore, et al., 2004; Gregg, 2008; Dutkiewicz et al., 2012) or include theoretical considerations to introduce an empirical N2 fixation flux in the model (e.g. Bisset et al., 1999). Some approaches neglect light limitation on diazotrophy and instead infer global N2 fixation patterns from the distribution of dissolved inorganic nitrogen (DIN) and phosphorus (DIP), as well as estimates of ocean circulation (e.g. Deutsch et al., 2007). In trait-based models, diazotrophs are usually accounted for by a single functional group with biological rate parameters intended to represent either Trichodesmium spp., unicellular cyanobacteria or a generic autotrophic diazotroph. More complex models of diazotroph growth have explored cellular function and the effects of a variable cellular stoichiometry, however still limited by light (Kreuss et al., 2015; Fernández-Castro et al., 2016). Only a few modelling studies have evaluated multiple autotrophic diazotroph groups simultaneously, by considering separate groups for Trichodesmium spp., unicellular cyanobacteria and diatom–cyanobacterial associations (e.g. Monteiro et al., 2010; Dutkiewicz et al., 2012, 2015). To our knowledge, heterotrophic N2 fixation has not yet been considered explicitly in biogeochemical models.
Understanding the ecological dynamics of different types of diazotrophs should significantly improve predictive capabilities in biogeochemical models and lead to more accurate estimates of global N2 fixation rates. It has been suggested that N2 fixation rates are underestimated globally due to limited knowledge about the distribution and characteristics of N2-fixing organisms (Montoya, 2004; Zehr, 2011). It is also assumed that marine N2 fixation may increase globally, as a result of ocean warming and higher concentrations of dissolved CO2 in seawater (Hutchins et al., 2007; Levitan et al., 2007; Dutkiewicz et al., 2015). To our knowledge, these laboratory experiments have only explored the response of Trichodesmium. Less information is available about the effects of climate trends on other diazotrophic organisms.
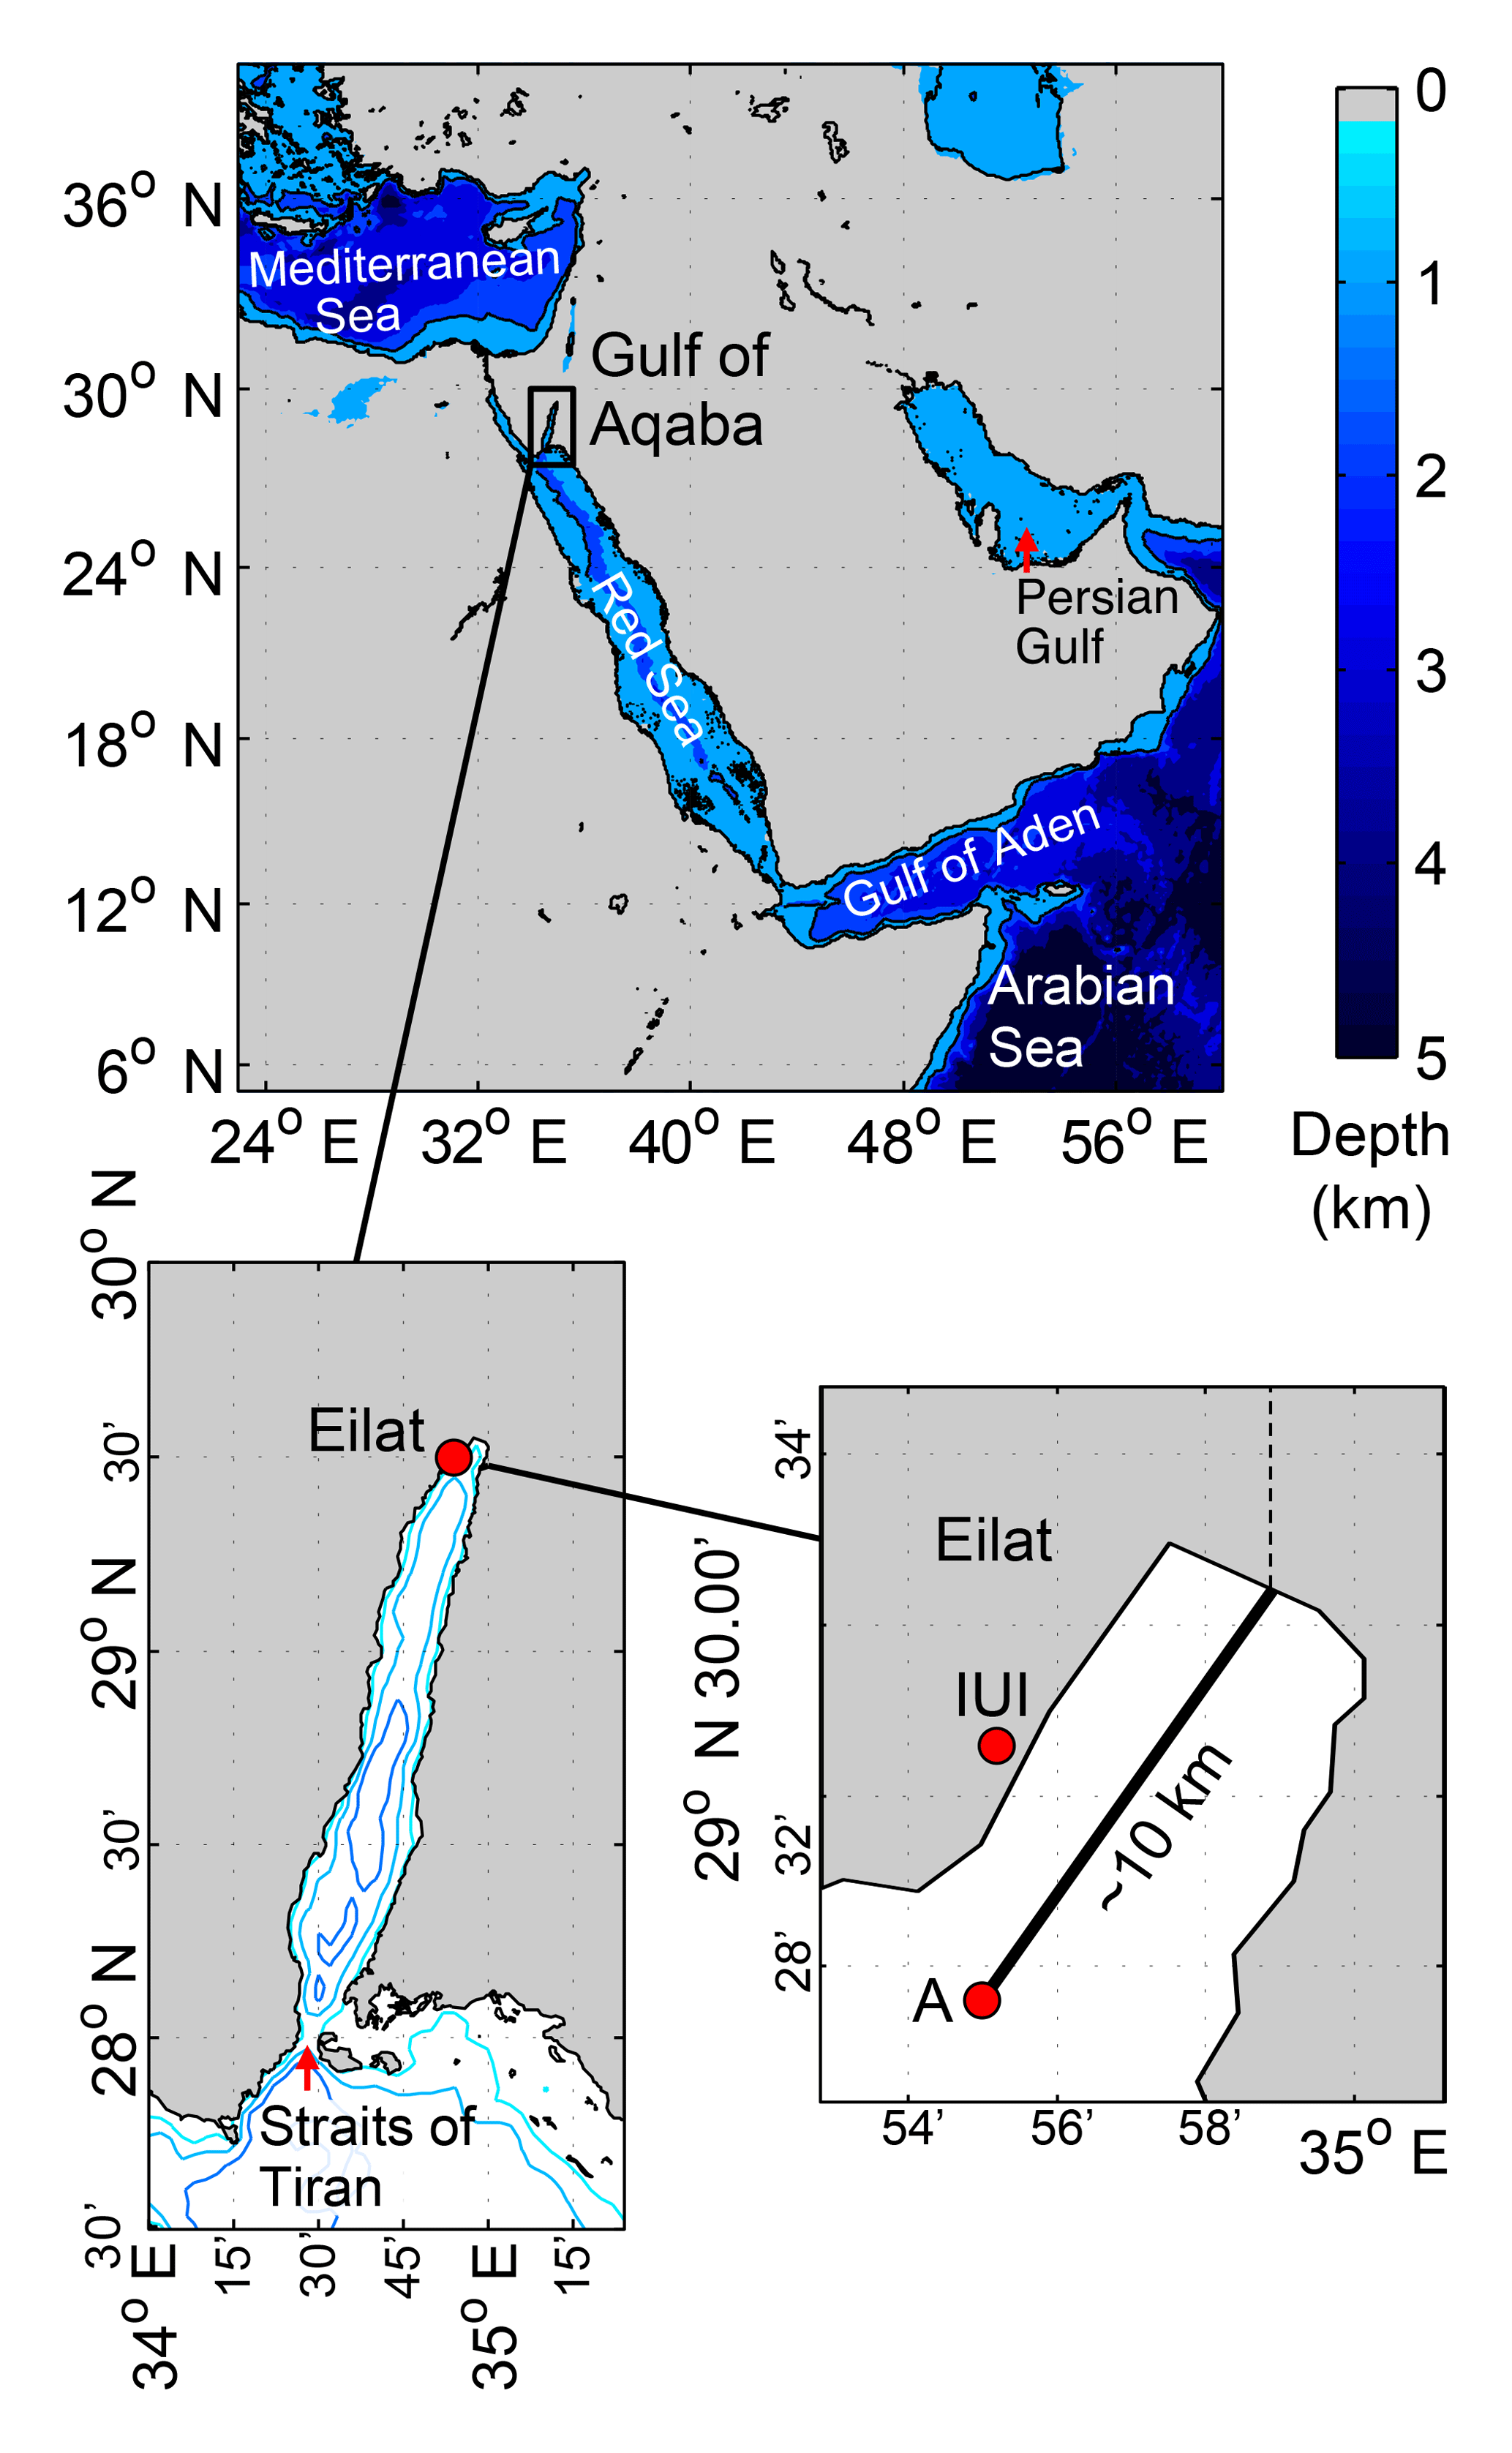
Figure 1Map of study area showing the location of monitoring stations and geographic references.
In this study we explore the biogeochemical signatures that result from different assumptions about the ecological niches occupied by diazotrophs. Our study area is the Gulf of Aqaba, a northern extension of the Red Sea. Aside from the reported presence of diverse diazotroph types, the morphology of the Gulf of Aqaba limits horizontal transport of deep waters, thus allowing us to simplify the physical model's complexity and focus on the biological component. We aim to answer the following two questions. (i) How important is N2 fixation as a source of new nitrogen in the Gulf of Aqaba? (ii) How important is heterotrophic, light-independent N2 fixation? To address these questions, we implemented a one-dimensional model at a monitoring station for which monthly quality-controlled measurements of physical and biogeochemical variables are available from 2004 onward. We then systematically tested different model assumptions about diazotrophy and calibrated selected model parameters to facilitate an objective comparison between the different biogeochemical model versions. The different assumptions about diazotrophy consider the characteristics of organisms identified in the Gulf of Aqaba, including heterotrophic fixing α and γ proteobacteria (Rahav et al., 2013), unicellular cyanobacteria and Trichodesmium spp. (Post et al., 2002; Foster et al., 2009; Rubin et al., 2011). Our most important conclusion is that aphotic N2 fixation is necessary to reproduce the observed excess nitrogen in deep waters of the Gulf of Aqaba, while maintaining reasonable surface N2 fixation rates. Our best-performing biogeochemical model of the Gulf of Aqaba estimates annual N2 fixation rates in overall agreement with local- and large-scale estimates in the literature.
The Gulf of Aqaba is a quasi-rectangular, 200 km long, 20 km wide, semi-enclosed basin in the northeast region of the Red Sea (Fig. 1). The average depth of the Gulf of Aqaba is 800 m, its deepest point is approximately 1800 m and it is surrounded by arid mountains that steer the dominantly northerly winds (Berman et al., 2003). Two shallow sills, the Bab-el-Mandeb (∼140 m) and the Straits of Tiran (∼240 m), inhibit the entrance of cold and dense deep waters from the Indian Ocean. Since inflow is restricted to warm surface waters, the Gulf of Aqaba's deep-water masses (> 300 m) are locally formed (Wolf-Vecht et al., 1992; Biton et al., 2008) and have negligible horizontal transport toward the exterior (Klinker et al., 1976; Manasrah et al., 2006).

Figure 2Observed vertical nitrate and phosphate distributions at Station A (Gulf of Aqaba) from 2004 to 2014. Tick marks are placed on 1 April of every year.
The annual hydrographic cycle exhibits a well-defined seasonality where vertical temperature and salinity distributions are dominantly affected by surface heat fluxes and modified by surface advective fluxes (Carlson et al., 2014). During winter (December to March), convective vertical mixing usually extends to depths > 300 m (Labiosa et al., 2003) and even reaches the bottom (∼700–800 m bottom depth) in some extreme years (Figs. 2, 3). From April to September, the water column is thermally stratified, and inflowing warm surface waters from outside the Gulf of Aqaba occupy the layer above the thermocline (Genin and Paldor, 1998; Berman et al., 2000; Biton and Gildor, 2011). During fall (October to December), surface cooling and high evaporation rates erode the seasonal stratification and re-establish a well-mixed water column (Berman et al., 2003; Monismith and Genin, 2004). The Gulf experiences net evaporation of approximately 1.6 m yr−1 (Ben-Sasson et al., 2009) due to negligible precipitation and run-off (Wolf-Vecht et al., 1992).
The Gulf is oligotrophic, with surface nitrate (NO3) and phosphate (PO4) concentrations usually close to their detection limits during summer stratification (Fuller et al., 2005; Mackey et al., 2009; Meeder et al., 2012). Deep winter mixing supplies inorganic nutrients to the surface, and NO3 and PO4 reach ∼2 and ∼0.1 µM, respectively (Fig. 2; Lindell and Post 1995; Lazar et al. 2008). Dust from the desert provides a sufficient atmospheric source of soluble iron (Fe) for microbial growth in the Gulf of Aqaba (Chase et al., 2006; Chen et al., 2007). Phytoplankton spring blooms reach a maximum chlorophyll concentration of ∼2 mg Chl a m−3 and their initiation is strongly correlated with the termination of winter cooling of the water column (Zarubin et al., 2017). Interannual variability in the depth of winter convective mixing results in periods of nutrient accumulation in deep waters (Fig. 2; Wolf-Vecht et al., 1992; Lazar et al., 2008; Carlson et al., 2012), which is reset during extreme winter mixing events approximately every 4 years (Silverman and Gildor, 2008). The periodicity of these extreme mixing events has been associated with regional weather patterns that modify the Red Sea water temperatures (Silverman and Gildor, 2008).
We analysed the role of autotrophic and heterotrophic N2-fixing organisms in determining biogeochemical patterns at an open pelagic site (Station A), located in the northern Gulf of Aqaba, by testing four main alternative ecosystem model versions and six model subversions with minor variations. The ecosystem models are evaluated in terms of their ability to replicate observations of oxygen (O2), NO3, PO4, and chlorophyll. In this section, we first describe the available observations, then the models and finally the systematic model calibration method.
3.1 Observations
Meteorological and oceanographic observations are available from the Interuniversity Institute (IUI) for Marine Sciences in Eilat, Israel (http://www.iui-eilat.ac.il/, last access: December 2018). Meteorological observations are used to calculate surface heat and momentum fluxes for the physical model and incoming light for the biological models. Observed meteorological variables include wind speed, air temperature, air humidity, air pressure, irradiance and cloud cover. These data have been collected continuously and automatically at 10 min intervals by the meteorological instrumental array at the end of the IUI pier since 2006.
Monthly conductivity–temperature–depth (CTD) and biochemical profiles at Station A (29.5∘ N, 34.9∘ E) were collected during monthly surveys of the National Monitoring Program (NMP) from 2004 to 2014 (http://www.iui-eilat.ac.il/). CTD profiles are used to nudge temperature and salinity in the physical model (see Sect. 3.2). Biochemical profiles, including NO3, nitrite (NH2), ammonium (NH4), PO4, O2 and chlorophyll a (Chl a), are used for biogeochemical model calibration (years 2006 to 2010) and model validation against unassimilated data (years 2011 to 2014). Nutrients were measured using spectrophotometry (QuickChem 8000 flow injection), O2 was determined by Winkler titrations and Chl a concentrations are estimated using fluorometry (Turner Designs 10-AU).
3.2 Model descriptions
The ecosystem models are implemented within the General Ocean Turbulence Model (GOTM), a one-dimensional physical model that computes solutions to differential equations for the vertical transport of momentum, salt and heat (Burchard et al., 1999). GOTM is implemented for the 700 m deep station with a vertical resolution of 3 m and forced with hourly meteorological observations from the IUI pier. Temperature and salinity are nudged to observed CTD profiles with a nudging timescale of 30 days. This is done to account for the influence of horizontal advection of heat and salt in the one-dimensional model and ensures a realistic representation of density stratification. The effect of temperature and salinity nudging on the results is analysed below (Sect. 4.2.1). As model calibration is computationally expensive, model simulations run only from January 2005 to September 2010. The first year of each simulation is considered model spin-up and excluded from further analysis (climatological meteorological forcing is used for the first year, as this database starts in 2006). NO3, NH4, PO4 and O2 initial total concentrations match the observed total inventories, using homogenous concentrations throughout the water column of 2.5, 0.05, 0.15 and 150 mmol m−3, respectively. Vertical nutrient and oxygen concentrations are redistributed within a few months and replicate the observed vertical distributions well starting from October 2005. Non-N2-fixing phytoplankton, zooplankton and detritus are initially set to a homogeneous small value of 0.1 mmol N m−3 and also readjust rapidly because the adjustment timescales for these variables are short (Fennel et al., 2006). Diazotrophs initial values are set to lower densities than non-N2-fixing organisms, with a homogenous total value of 0.03 mmol N m−3 (i.e. models with multiple diazotrophs maintain the same amount of initial diazotrophic biomass by dividing initial values equally among organisms).
Four main ecosystem model versions of increasing complexity (referred to as H0, H1, H2 and H3) are treated as alternative hypotheses of how biological processes, especially diazotrophy, control the vertical distribution and temporal variability of dissolved inorganic nutrients and oxygen. H0 is the base model without diazotrophs and follows the model equations described in Fennel et al. (2006, 2013). In general, the model follows Monod kinetics using a fixed N : P ratio (). Sensitivity to the constant N : P ratio is explored in Sect. 4.2.3. We test the H0 model with and without a sediment denitrification flux (model versions H0 and H0′, respectively). H0 includes denitrification but no N2 fixation, as no diazotrophs are considered. H0′ does not include either denitrification or diazotrophic organisms, and thus the underlying assumption of this model version is that there is a balance between inputs from N2 fixation and losses of fixed nitrogen due to denitrification. When present, the denitrification flux follows Fennel et al. (2013) with a loss fraction of 6 mol N2 per mol of organic matter remineralized at the sediment–water interface. This generates an average sediment denitrification flux of 0.25±0.46 mmol N m−2 d−1, with a maximum value of 3.01 mmol N m−2 d−1.
Table 1Summary of model version characteristics and assumptions about diazotroph groups. N: no diazotrophs; A: autotrophic diazotrophs; H: heterotrophic diazotrophs. Checkmarks (✓) represent presence of a model characteristic/functional diazotrophic group in the model; dashes represent their absence.
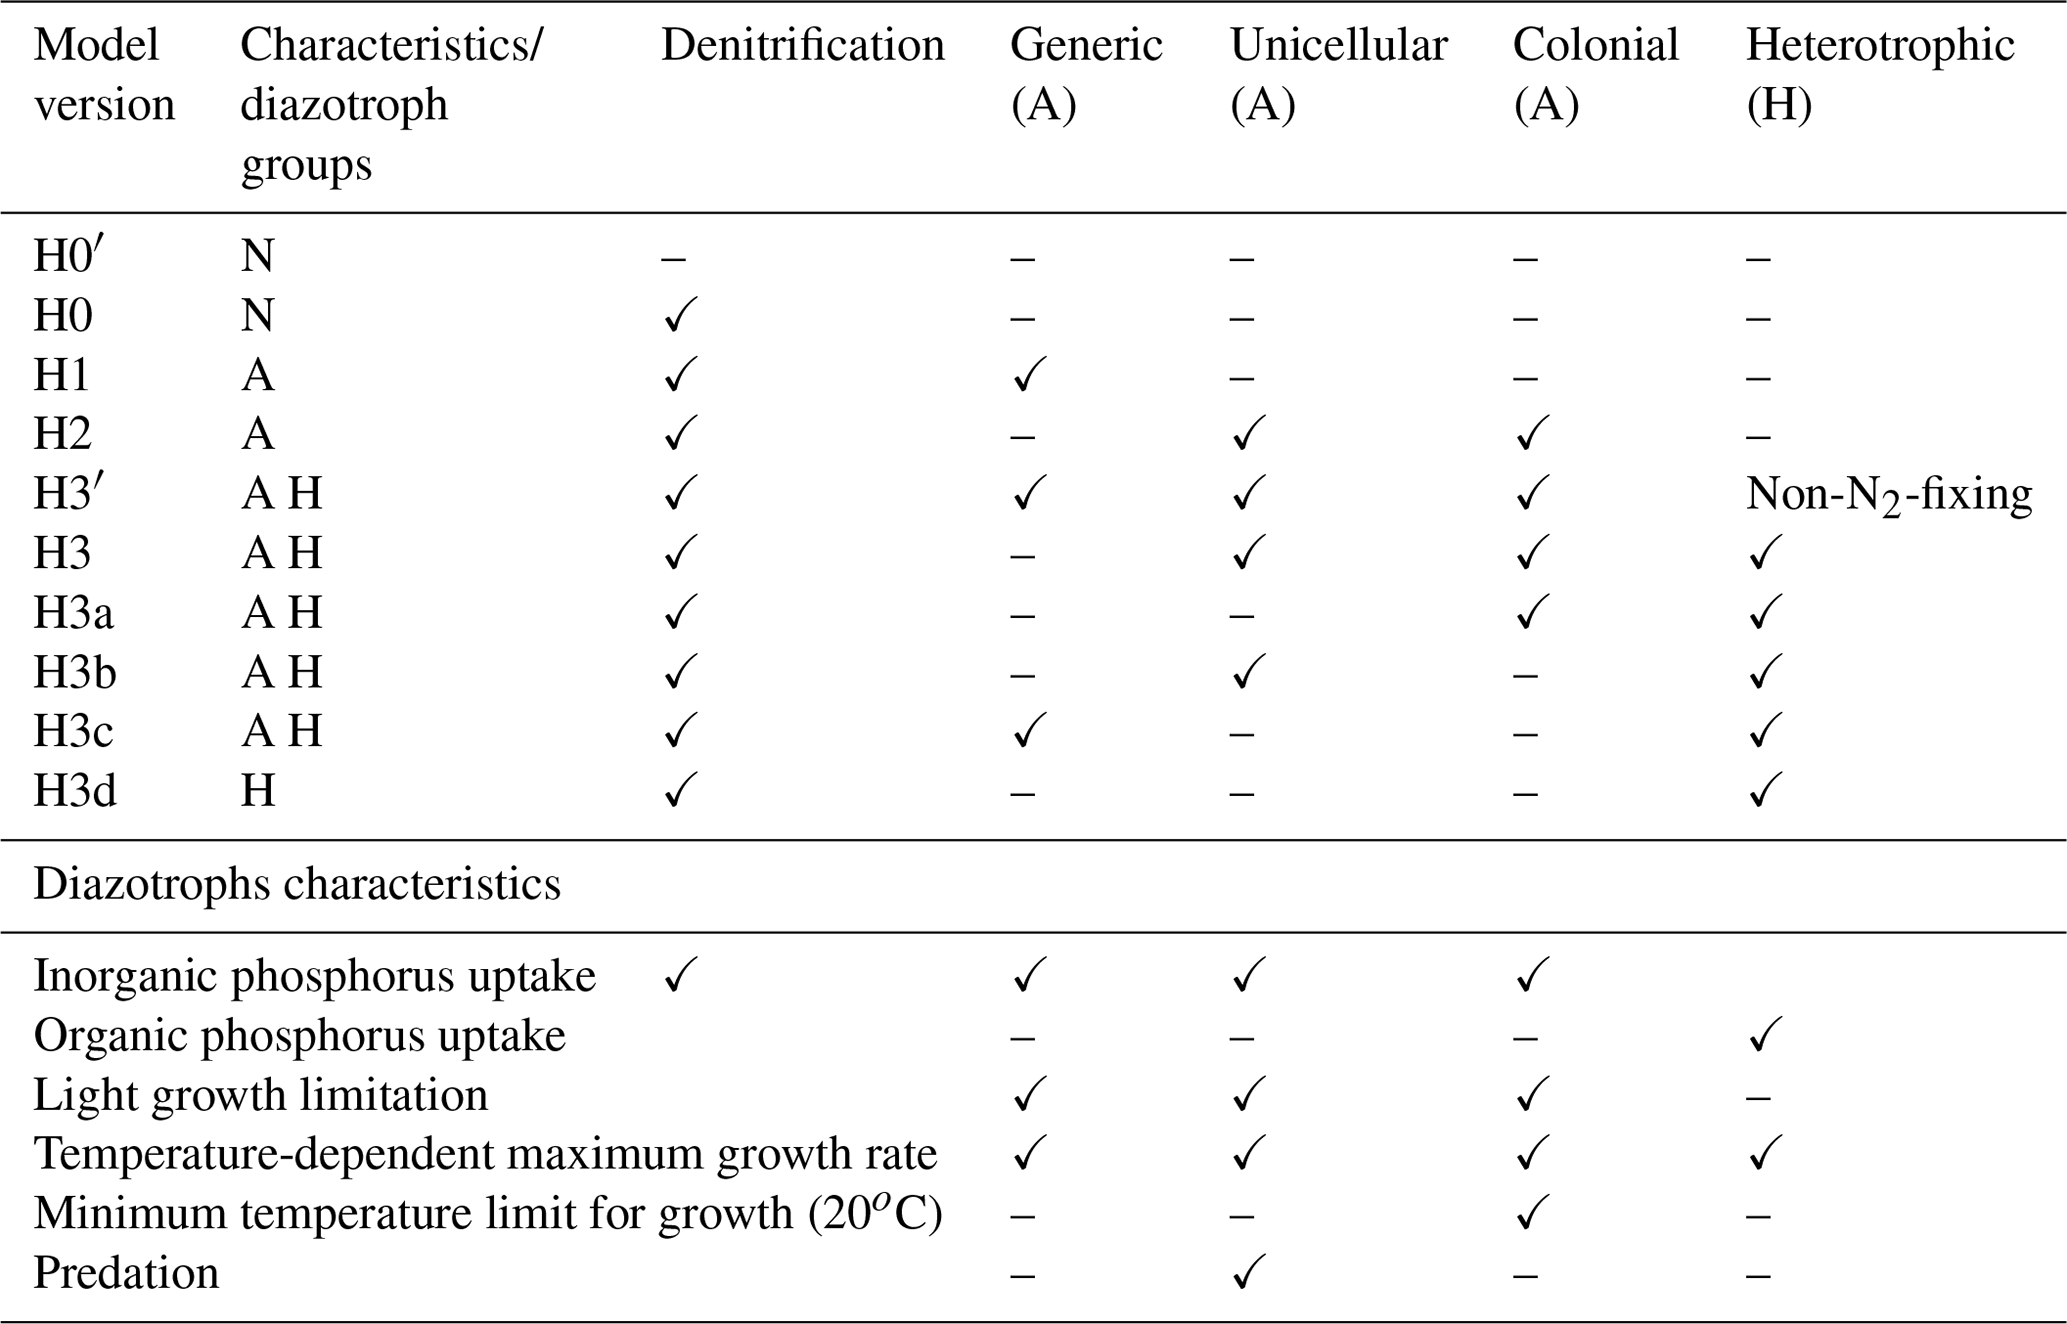
H1, H2 and H3 are modified versions of H0, in which different groups of diazotrophic organisms are added sequentially. Diazotrophic growth formulations are similar to those of non-N2-fixing phytoplankton, except that they are not limited by nitrogen and have a higher N : P ratio (). H1 introduces a generic autotrophic diazotroph; H2 replaces H1's generic diazotroph with two autotrophs representing unicellular and colonial (e.g. Trichodesmium spp.) cyanobacteria. The unicellular group overall follows the same formulation as the generic diazotrophs, except that no aggregation term is included. We simplify unicellular diazotroph behaviour in this manner because this group represents free-living picoplanktonic cells that typically do not form large colonies although they can aggregate (Bonnet et al., 2016). Instead, we assume this group is grazed by zooplankton at similar rates as non-N2-fixing phytoplankton. This difference between colonial and unicellular groups is consistent with studies suggesting that colonies represent an evolutionary adaptation to decrease grazing pressure (Nielsen, 2006). Aside from their size, Trichodesmium spp. colonies may be less palatable and harder to digest due to toxins (Kerbrat et al., 2010, 2011). Grazing is not a major fate of this group (O'Neil and Roman, 1994).
The last model version, H3, adds a heterotrophic group to the model structure of H2. This functional group is not limited by light and grows by consuming both dissolved inorganic and organic forms of nutrients. An intermediate version H3′ is used as a control, where the heterotrophic organisms do not fix nitrogen and are limited by the availability of nitrogen in inorganic forms and from small detritus. Model H3 eliminates the nitrogen limitation and the heterotrophic group becomes a heterotrophic diazotroph group. In a subsequent set of four model experiments (H3a, H3b, H3c and H3d), we remove complexity from H3. The heterotrophic group remains, but we sequentially remove the autotrophic groups one at a time: first the colonial cyanobacteria (H3a), then the unicellular cyanobacteria (H3b), then the generic autotrophic diazotroph (H3c) and finally we remove all autotrophic diazotrophs (H3d). A summary of all model versions is given in Table 1 and a description of state variables and full model equations in the Supplement.
We acknowledge that some of these model assumptions are still simplifications of diazotroph behaviour. For example, Trichodesmium spp., as well as other autotrophic and diazotrophic organisms, may also take up dissolved organic matter (DOM) to support growth (Benavides et al., 2017). Nevertheless, model assumptions and formulations used here are in line with the most commonly accepted understanding of the dominant controls on microbial and diazotrophic growth.
3.3 Model parameters
3.3.1 Parameter optimization method
Parameter optimization refers to the minimization of misfit between model and observations by adjusting model parameters. We applied the method first to systematically calibrate the most sensitive parameters of H0 (see Supplement), and then to independently recalibrate parameters in H1 to H3 after the introduction of diazotrophs. We used an evolutionary algorithm, where changes in the parameter values follow a set of rules inspired by the process of natural selection (Houck et al., 1995; Kuhn et al., 2015). The algorithm starts with a randomly generated “population” of 30 parameter sets (p). Each p is a vector composed of the parameters to be optimized, which are iteratively modified over a number of generations. During each generation of the population, the cost J(p) of the model with parameter set p is calculated as
where represents a model estimate and y the corresponding observation. N is the number of observations included for each variable v. Here the number of variables V is 5 (nitrate + nitrite, ammonium, phosphate, chlorophyll a and oxygen measured as profiles at Station A between 2006 and 2010). Model–data misfits are weighted by the factor , i.e, the inverse standard deviation of each variable. Half of the parameter sets with the lowest J value “survive” to the next generation. The other half of the population is regenerated from new parameter sets obtained by recombination of two random “parent” sets drawn from the better-performing half (i.e. the “survivors” of the previous generation). Parameters also “mutate”, i.e. random noise is added, for additional variability in the parameter space. An allowable range of values is set for each parameter based on the literature (Table 2).
Table 2Parameters used in the base biogeochemical model (H0), including minimum and maximum parameters ranges based on the literature. Parameters values followed by * were obtained by the optimization.
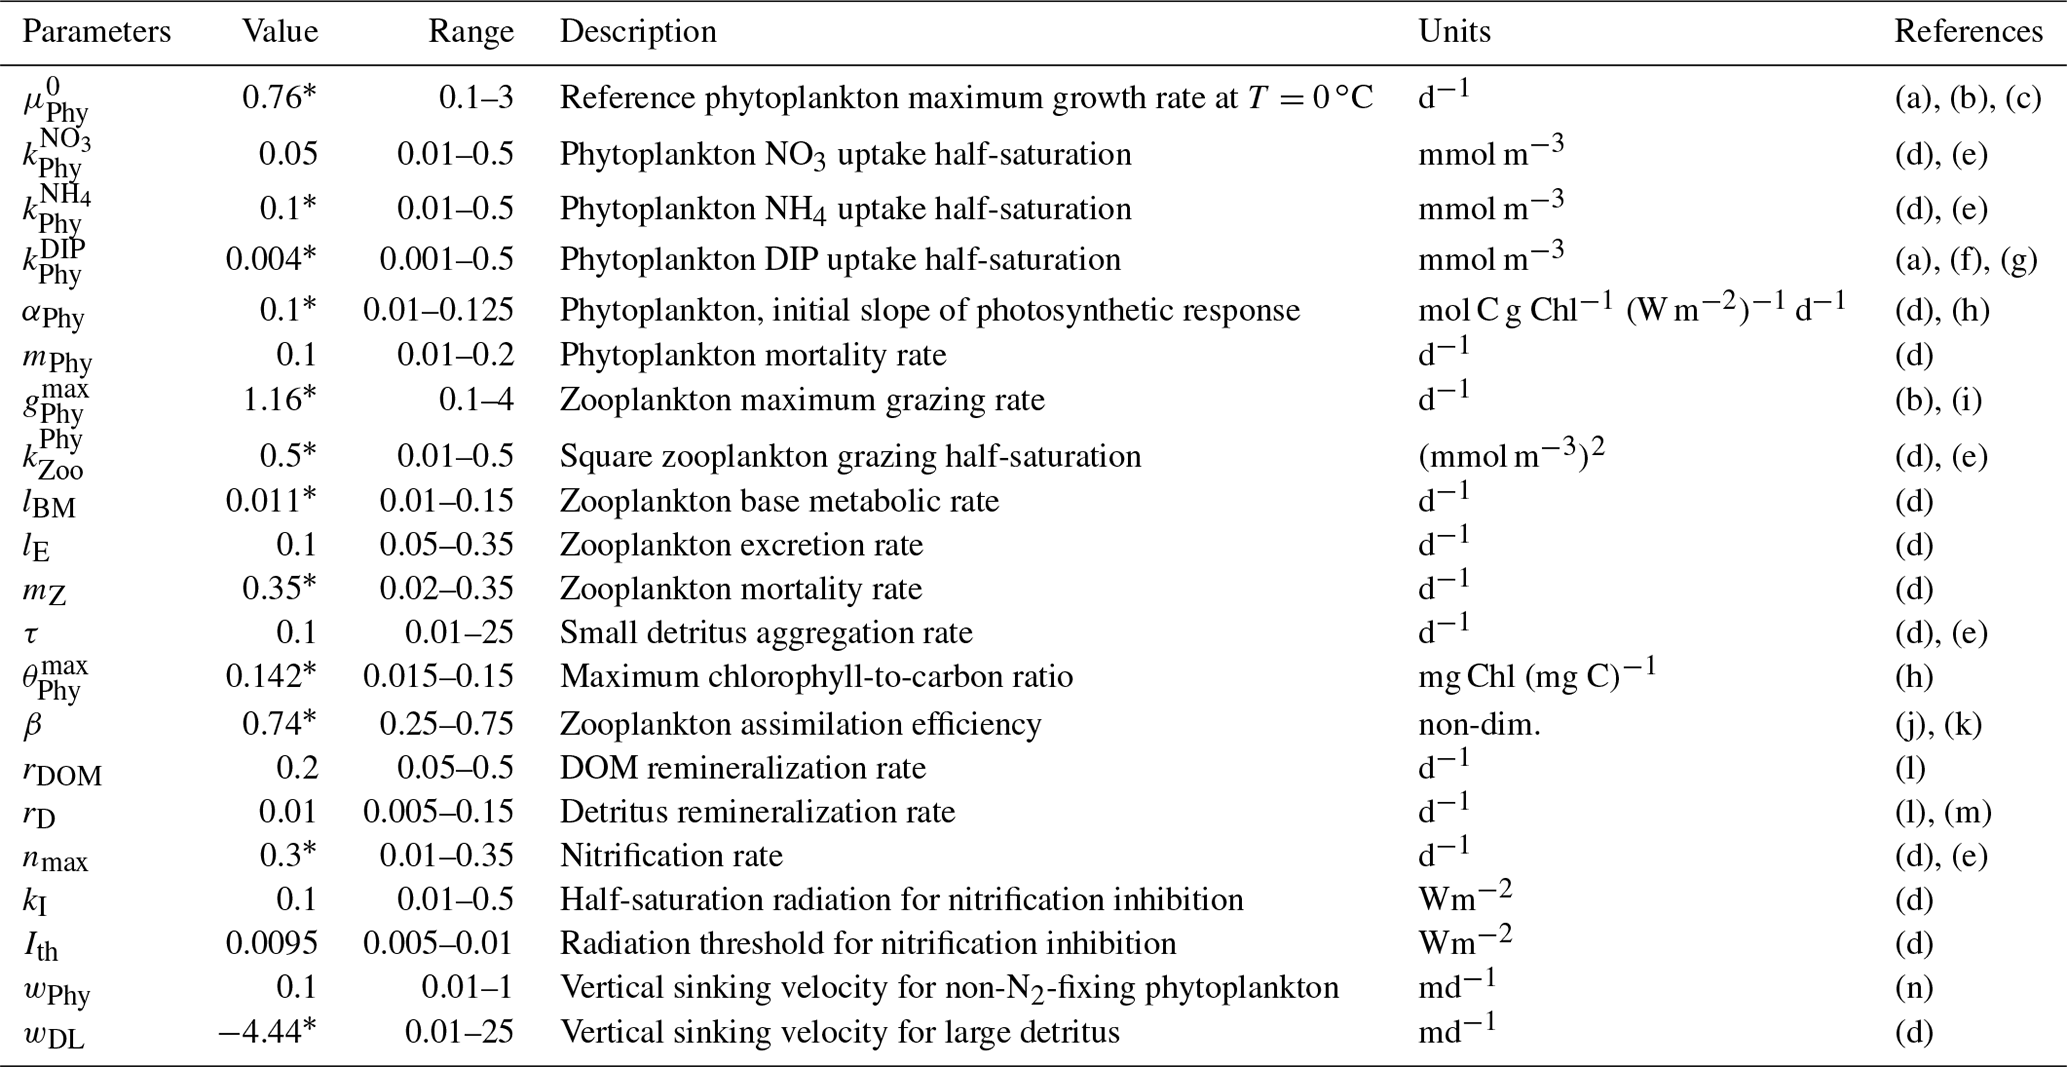
(a) Fennel et al. (2002), (b) Fahnenstiel et al. (1995), (c) Veldhuis et al. (2005), (d) Fennel et al. (2006), (e) Lima and Doney (2004), (f) Ward et al. (2013), (g) Moore, et al. (2002), (h) Geider et al. (1997), (i) Gifford et al. (1995), (j) Landry et al. (1984), (k) Tande and Slagstad (1985), (l) Amon and Benner (1996), (m) Enríquez et al. (1993), (n) Smayda and Bienfang (1983).
3.3.2 Optimized parameters
The parameter optimization method has limitations. Most importantly, the optimization cannot estimate with confidence parameters that are unconstrained by the observations (Fennel et al., 2001; Schartau and Oschlies, 2003; Ward et al., 2010). To avoid this, a subset of H0′s most sensitive parameters was selected for optimization through a preliminary sensitivity analysis. Optimized parameters for H0 are identified in Table 2 along with the optimal values. The optimization was replicated 10 times over 100 generations using the algorithm described in Sect. 3.3.1. Non-optimized parameters are fixed at their a priori estimates based on Fennel et al. (2006, 2013).
For each model version with diazotrophs (H1, H2 and H3), some of the parameters already optimized for H0 required recalibration to properly accommodate the changes in system dynamics. Recalibrated parameters for each model version are presented in Table 3. No recalibration was performed for model versions (H0′ and H3a-d), as they are aimed to test the relative importance of individual model components.
3.3.3 Diazotroph parameters
Since none of the parameters directly related to the diazotroph groups are constrained by the available observations, they were predefined for H1, H2 and H3, based on the observational and modelling literature (Table 3). Previous modelling studies have used maximum growth rates of generic N2 fixers ranging from 0.4 d−1 (Moore et al., 2004) to 1.25 d−1 (Ward et al., 2013). When model diazotrophs are assumed to represent Trichodesmium spp. values range between 0.17 d−1 (Hood et al., 2001) and 0.3 d−1 (Fennel et al., 2002). From the observational literature, Cyanothece (unicellular cyanobacteria) and Trichodesmium spp. cultured under various combinations of Fe and light availability exhibit maximum rates around 0.3±0.05 d−1 (Capone et al., 1997; Berman-Frank et al., 2001; Hutchins et al., 2007). Growth rates can be higher (up to 0.5 d−1) at high CO2 and high light availability (Kranz et al., 2010; Hong et al., 2017). We chose a common reference maximum growth rate of 0.25 d−1 for all photosynthetic diazotrophs, such that differences between the model versions result only from the different assumptions about the losses of each group (e.g. predation of unicellular cyanobacteria vs. sinking of large aggregates). Based on growth rates measured for cultured heterotrophic bacteria, we chose a value of 0.2 d−1 for the heterotrophic diazotrophs (Pomeroy and Wiebe, 2001). Observational and modelling studies were also considered to set the photosynthetic initial slope of photosynthetic diazotrophs (Geider et al., 1997; Moore et al., 2004; Hutchins et al., 2007). Other parameters are based on Fennel et al. (2002).
Table 3Diazotroph parameters and recalibrated non-N2-fixing phytoplankton parameters for each model version. H0: no N2 fixers; H1: generic autotrophic diazotrophs; H2: unicellular and colonial cyanobacteria; H3: heterotrophs, unicellular and colonial cyanobacteria. Superscripts in the parameter descriptions denote the corresponding literature references used to define the generic diazotroph parameter values within a realistic range. In order to tease apart the effect of different diazotroph niches or behaviour, unicellular, colonial and heterotrophic diazotrophs maintain the same parameter values as the generic organism. An exception is the slightly lower reference growth rate used for heterotrophic diazotrophs.
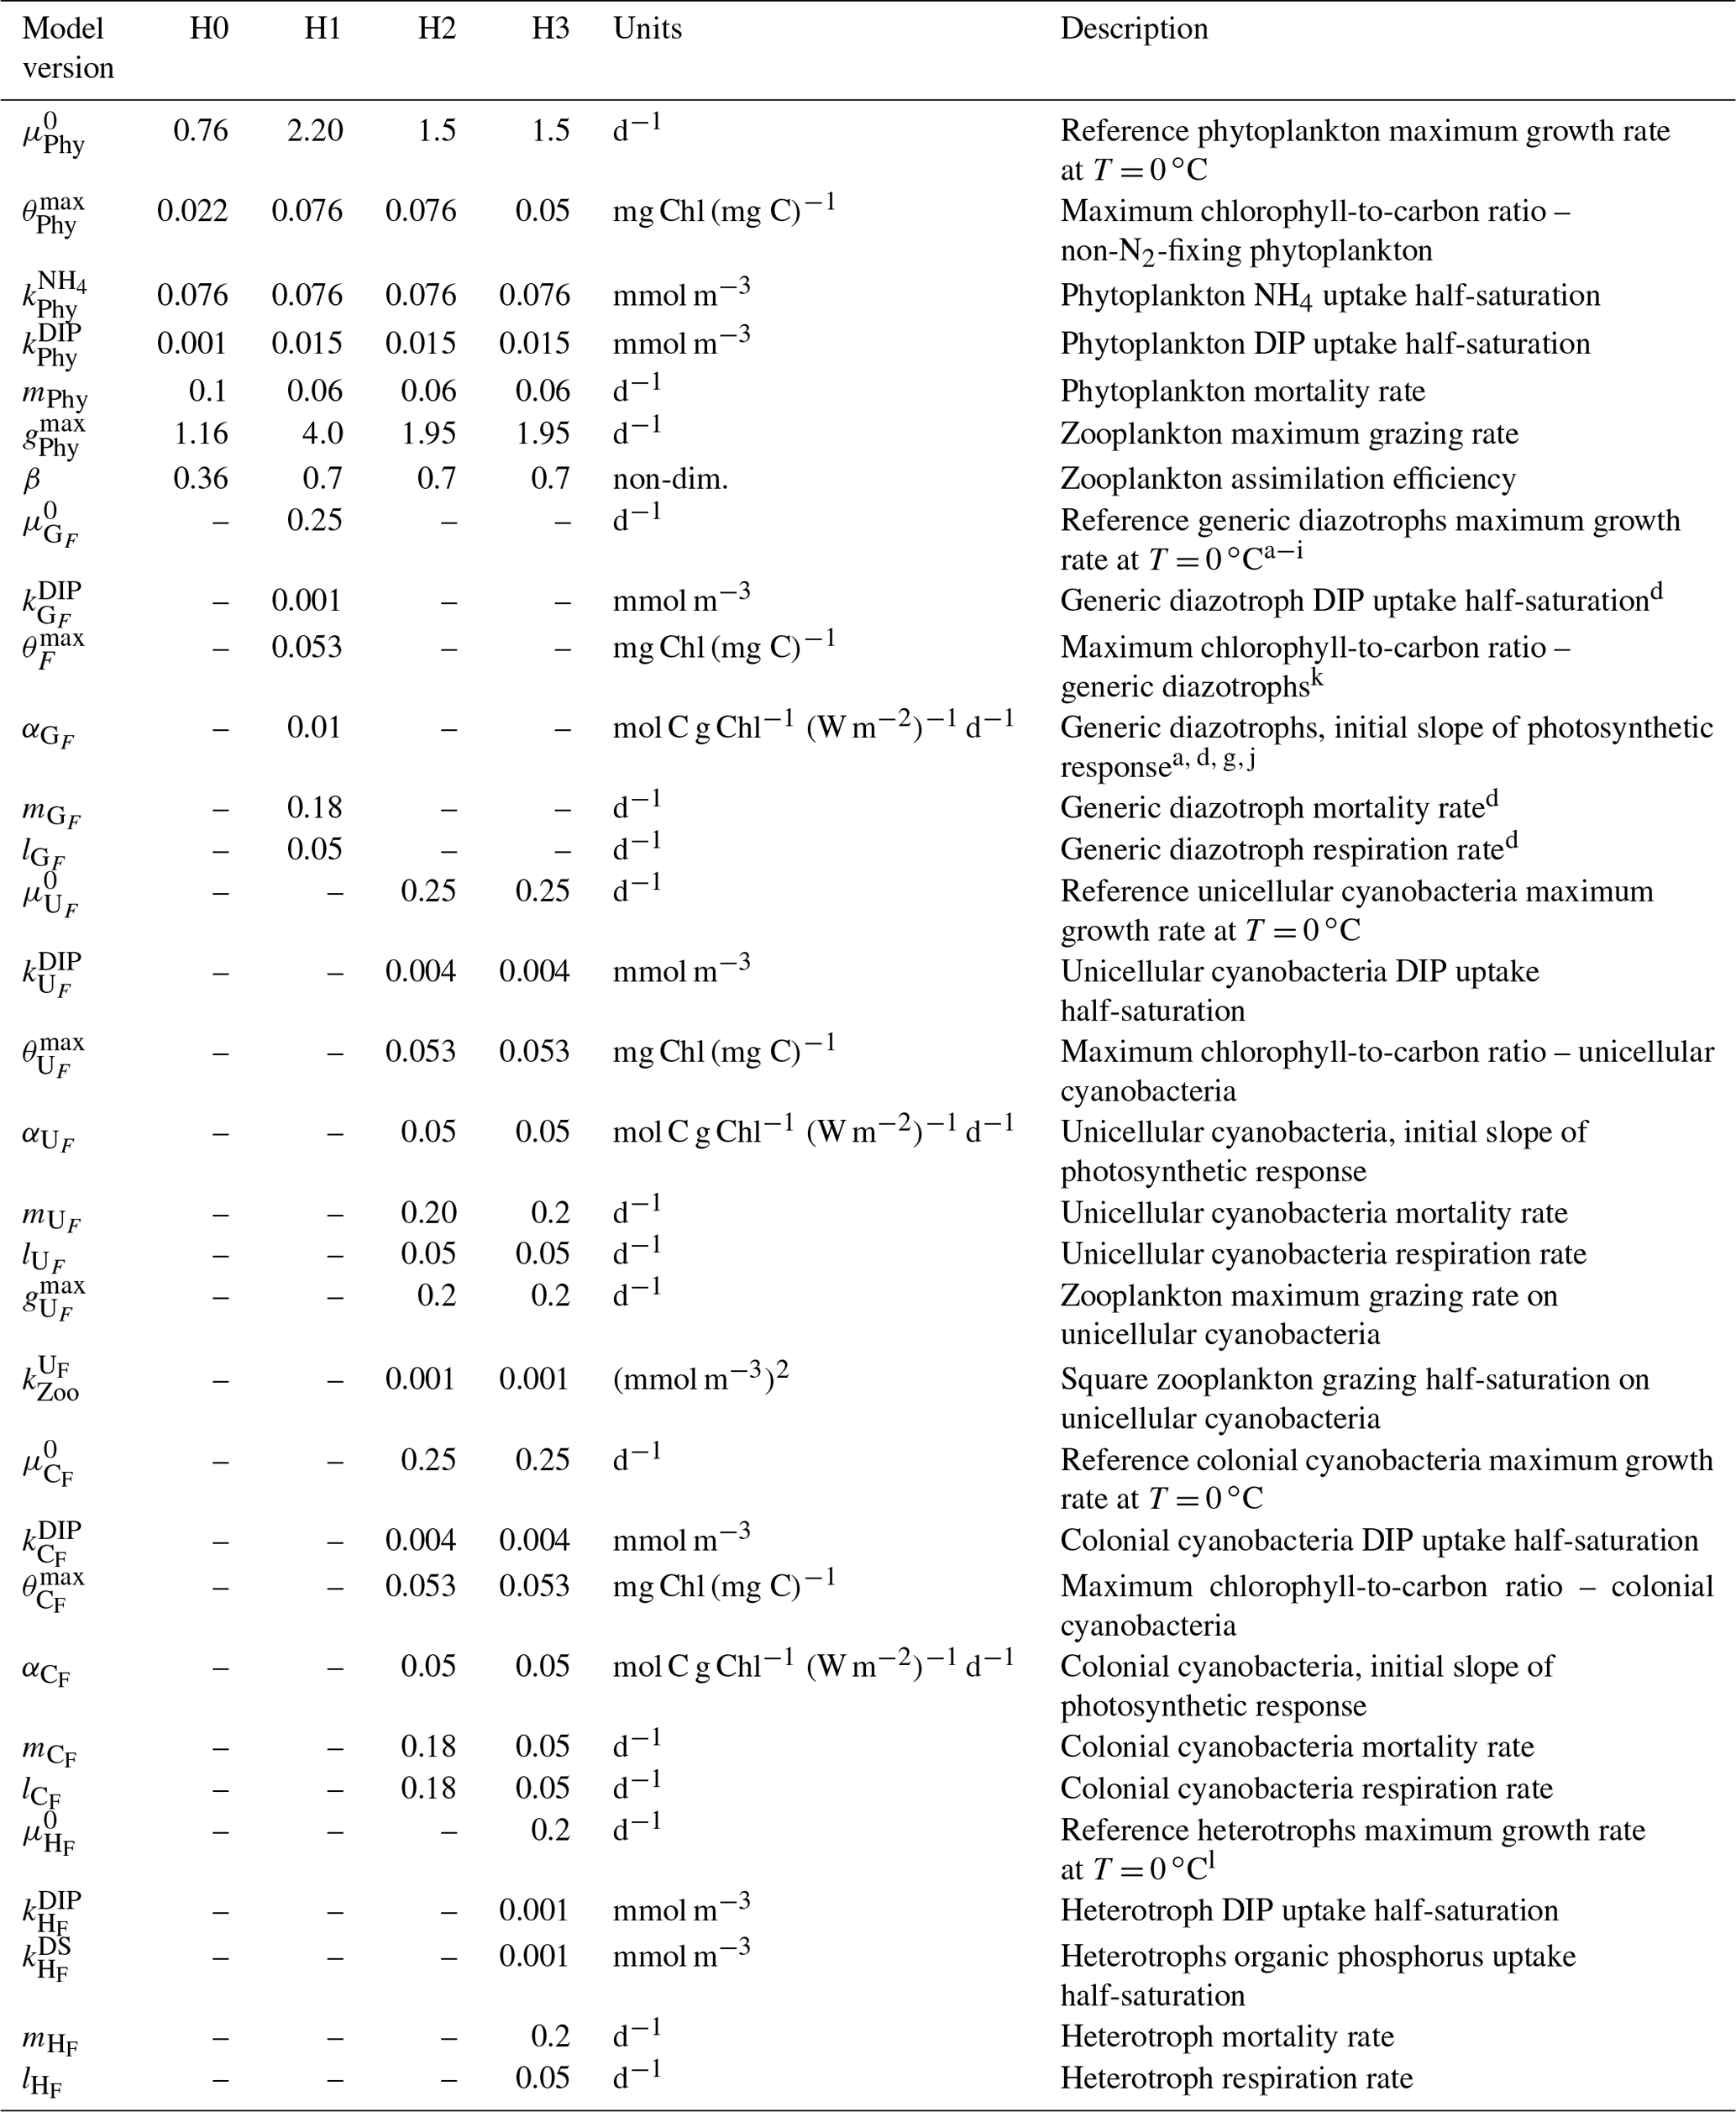
a Moore, et al. (2004); b Ward et al. (2013); c Hood et al. (2001); d Fennel et al. (2002); e Capone et al. (1997); f Berman-Frank et al., (2001); g Hutchins et al. (2007); h Kranz et al. (2010); i Hong et al., (2017); j Geider et al. (1997); k Fennel et al. (2006); l Pomeroy and Wiebe (2001).
4.1 Observed NO3 and PO4 patterns
To provide context for the evaluation of our model simulations, we first describe the observed interannual and seasonal variability of NO3 and PO4 for the complete time series (2004 to 2014) at Station A (Fig. 2). From May to January vertical distributions of NO3 and PO4 show depletion of nutrients in the euphotic zone and a nutricline between 100 and 200 m. From February to April, nutrient concentrations increase near the surface and decrease in deep waters (> 200 m) as result of vertical mixing. Multi-year periods of accumulation of nutrients in deep waters were observed from (i) the beginning of the series to the end of 2006, (ii) after the winter of 2008 until February 2012 and (iii) after the winter of 2013 until the end of the series. These periods are bookended by winters with extremely deep mixing events in 2007, 2008, 2012 and 2013 during which nutrient concentrations are nearly homogenized in the entire water column. Two prolonged periods of these vertically homogenous conditions were observed in 2007 and 2008, lasting 2 to 3 months.
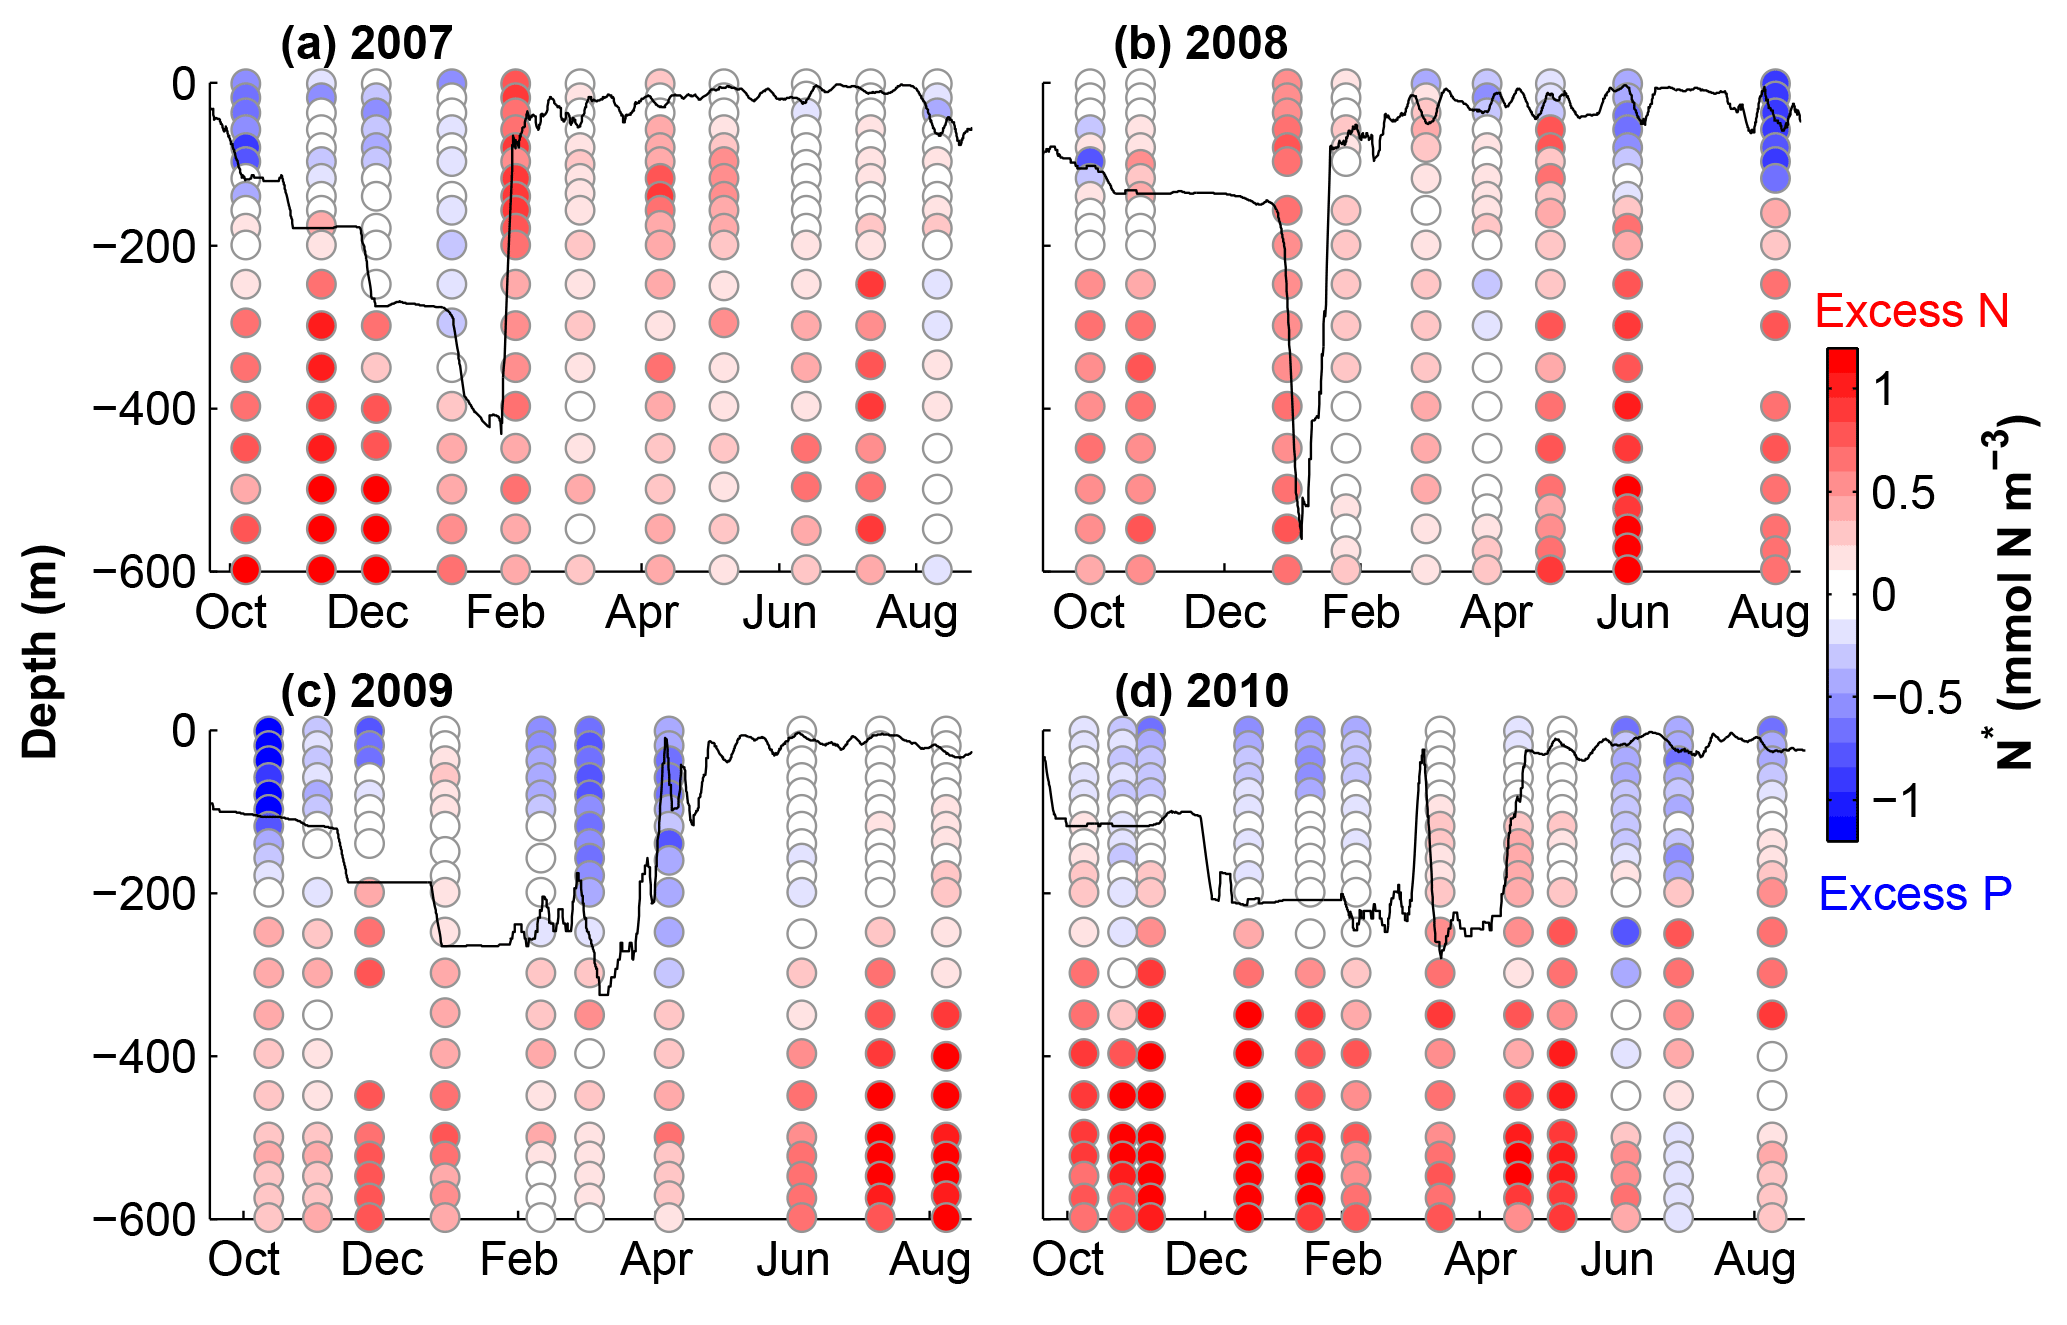
Figure 3N* calculated from NO3 and PO4 profiles from Fig. 2. The black lines show estimated mixed layer depths using a maximum density gradient criterion.
Our model calibration simulations are from 2006 to 2010, allowing us to include 2 years with deep winter mixing (2007 and 2008) and 2 years with moderate winter mixing (2009 and 2010). Figure 3 shows the linear metric N* (N* = DIN − 16DIP) for our simulation period which quantifies excess and deficit of nitrogen relative to phosphorus with respect to the canonical Redfield ratio (N : P = 16 : 1). This metric thus allows diagnosing patterns of net nitrogen addition, i.e. the balance of N2 fixation and denitrification, on global and local scales (e.g. Gruber and Sarmiento, 1997). Using the Redfield ratio as a reference, N* is insensitive to changes in nutrient concentrations that result from nutrient uptake by non-N2-fixing phytoplankton and remineralization of organic matter, assuming these processes occur in Redfield stoichiometry. Positive N* reflects an excess of nitrogen (DIN) and can be interpreted as a signature of N2 fixation.
N* values presented in Fig. 3 are calculated using the observations from Fig. 2. Excess nitrogen (between +0.20 and +1.06 mmol N m−3) dominates throughout most of the water column, except at the surface during stratified summer conditions, when nutrients are depleted and surface waters exhibit an excess of phosphate ( mmol N m−3). Waters with excess nitrate are brought to the surface during winter; however, N* values rapidly return to negative at the surface. The magnitude and duration of positive surface N* values appear to be related to the depth of winter mixing.

Figure 4Observed (coloured circles) and simulated (background) NO3 and PO4 using model versions H0 (no nitrogen fixers), H1 (generic autotrophic fixer), H2 (unicellular and colonial autotrophic fixers), H3′ (non-N2-fixing heterotrophic as well as unicellular and colonial autotrophic fixers), H3 (heterotrophic as well as unicellular and colonial autotrophic fixers). The spin-up period is not shown.
4.2 Model results
4.2.1 Sensitivity to physical nudging
Model runs, with and without temperature and salinity nudging towards observations, demonstrate that nudging has a negligible effect below 200 m, indicating that horizontal advection does not modify the lower part of the water column in a significant way (Supplement). Above 200 m, nudging corrected model errors in the representation of vertical mixing and surface forcing. The average magnitude of the differences due to nudging in the top 200 m is 0.20±0.45 ∘C and 0.5±0.16 kg m−3. Since these effects are small and limited to the surface, we conclude that neither nudging nor the neglect of horizontal advection affects our conclusions significantly.
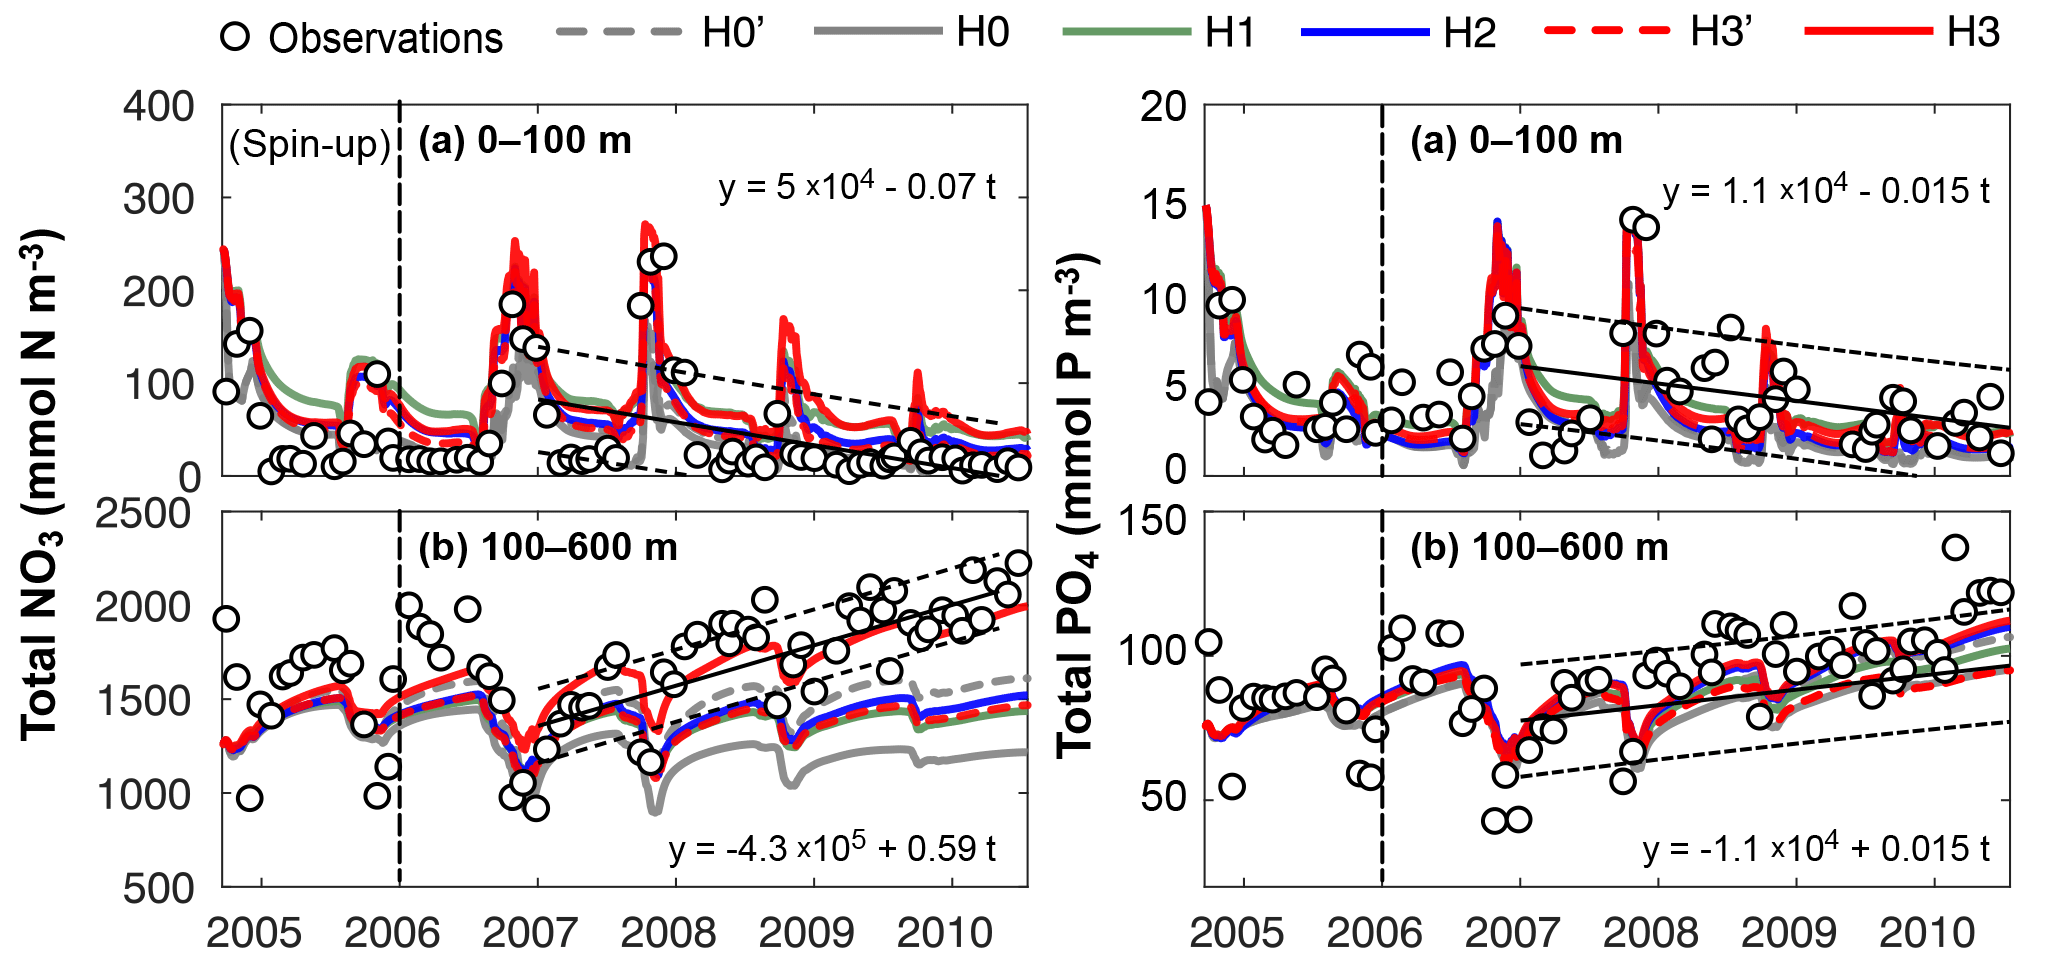
Figure 5Observed and simulated vertically integrated NO3 and PO4 between 0 and 100 m and between 100 and 600 m using model versions H0 (no nitrogen fixers), H0′ (no sediment denitrification – no fixers), H1 (generic autotrophic fixer), H2 (unicellular and colonial autotrophic fixers), H3′ (non-N2-fixing heterotrophic as well as unicellular and colonial autotrophic fixers), H3 (heterotrophic as well as unicellular and colonial autotrophic fixers). Tick marks are placed on 1 April of every year.
4.2.2 Effects of N2 fixation on DIP and DIN
Figure 4 shows simulated NO3 and PO4 concentrations from models H0′, H0, H1, H2, H3′ and H3, along with the corresponding measurements. Observed NO3 and PO4 concentrations exhibit a marked increase in deep water after the strong winter mixing of 2008. Weaker winter mixing after 2008 results in deep-nutrient accumulation, which is more pronounced for NO3 than PO4. Model H0′ reproduces some deep-nitrate accumulation, but underestimates NO3 concentrations in comparison to observations. Model H0 strongly underestimates inorganic nitrogen below the nutricline. Model H1, where N2 fixation was introduced via a generic autotroph, generates only small changes in the vertical distribution of nutrients. In model H2 the representation of NO3 below the nutricline is slightly improved; however, underestimation of mid-water NO3 is still noticeable. Model H3 significantly improves the representation of deep-NO3 accumulation. All model versions represent similar vertical distributions of PO4 and underestimate its deep-water concentrations by the end of the series.
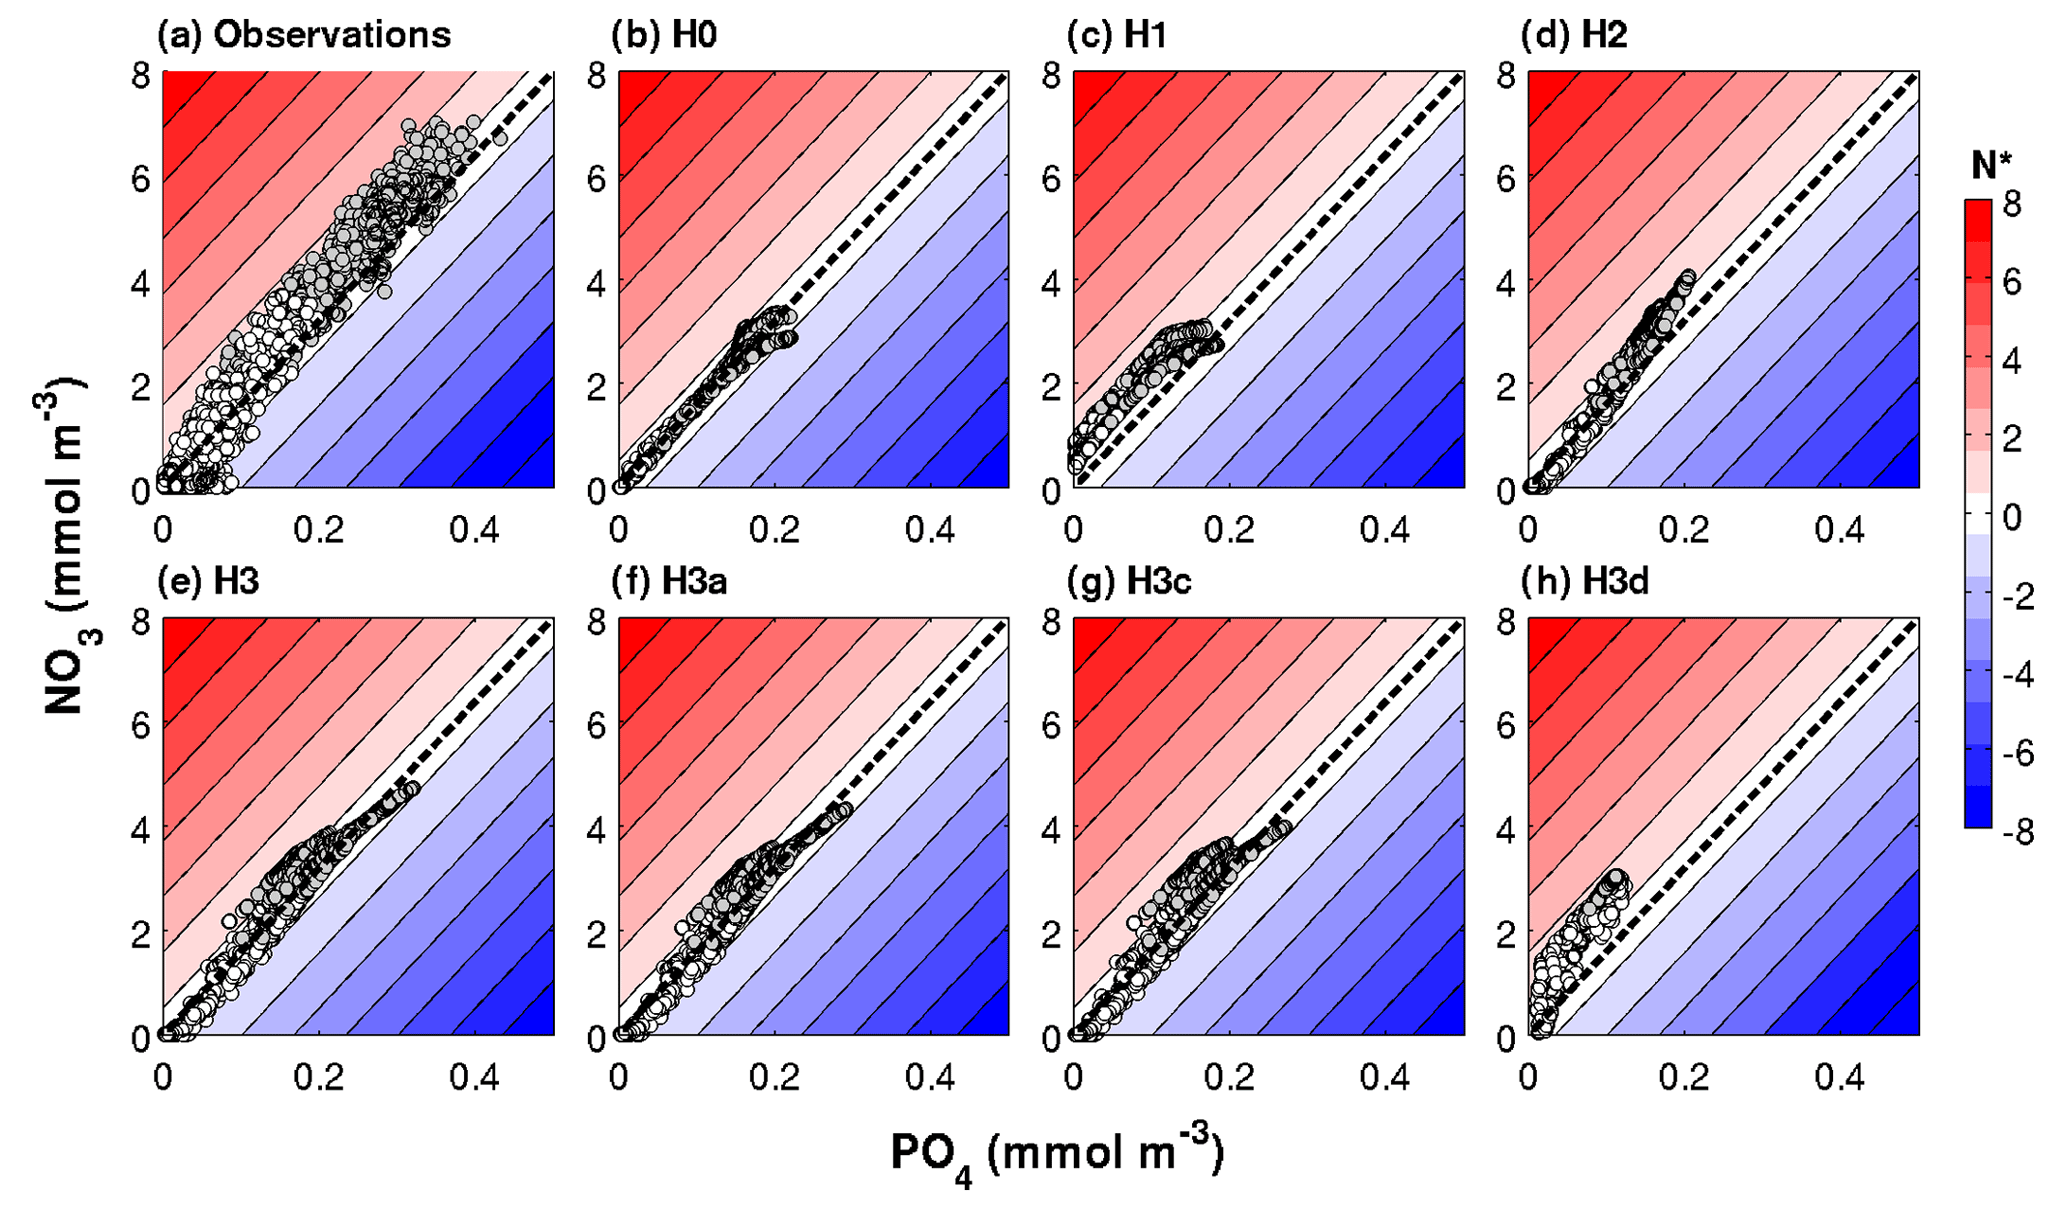
Figure 6Observed and simulated N* range in a subset of the optimized biogeochemical models. The dashed black diagonal line marks the N* = 0 or N : P = 16 line.
These model differences are also summarized in Fig. 5, which shows the simulated and observed NO3 and PO4 inventories in surface and deep waters. According to the observations deep NO3 accumulates between 2007 and 2010 at a rate of 0.59±0.08 mmol m−2 d−1, whereas deep PO4 accumulates at 0.015±0.009 mmol m−2 d−1. During this accumulation period approximately 36 mmol NO3 per mmol PO4 appear in deep waters. All five model versions simulate similar magnitudes and temporal variability of PO4, but NO3, in particular below 100 m, diverges over time among the models. H0 has the largest deviations from the other models, simulating approximately constant deep NO3 after 2007. H0′, the version without denitrification, produces a rate of increase in deep NO3 similar to that of model version H2. H3 has the highest accumulation rate of deep NO3, matching the observed slope the best.
The PO4 versus NO3 plots in Fig. 6 visualize these results in terms of N* values. Observed N* values above 200 m depth can become negative at low nitrate concentrations but are positive at intermediate nutrient concentrations. Below 200 m, observed N* values are positive. This observed pattern in the distribution of nutrients and N* values is not replicated by models H0 and H1. In H0 simulated N* values do not deviate from zero. In H1 N* is consistently positive. As already seen in Fig. 4, neither of the two produces large enough nutrient concentrations in deep waters. N* values in H2 qualitatively approach the observed pattern, but maximum nutrient concentrations in deep waters remain too low. Model H3, where heterotrophic diazotrophs coexist with colonial and unicellular autotrophic diazotrophs, is best able to replicate the range of NO3 and PO4 concentrations and the pattern of N*, although N* values are lower than observed especially at high nutrient concentrations.
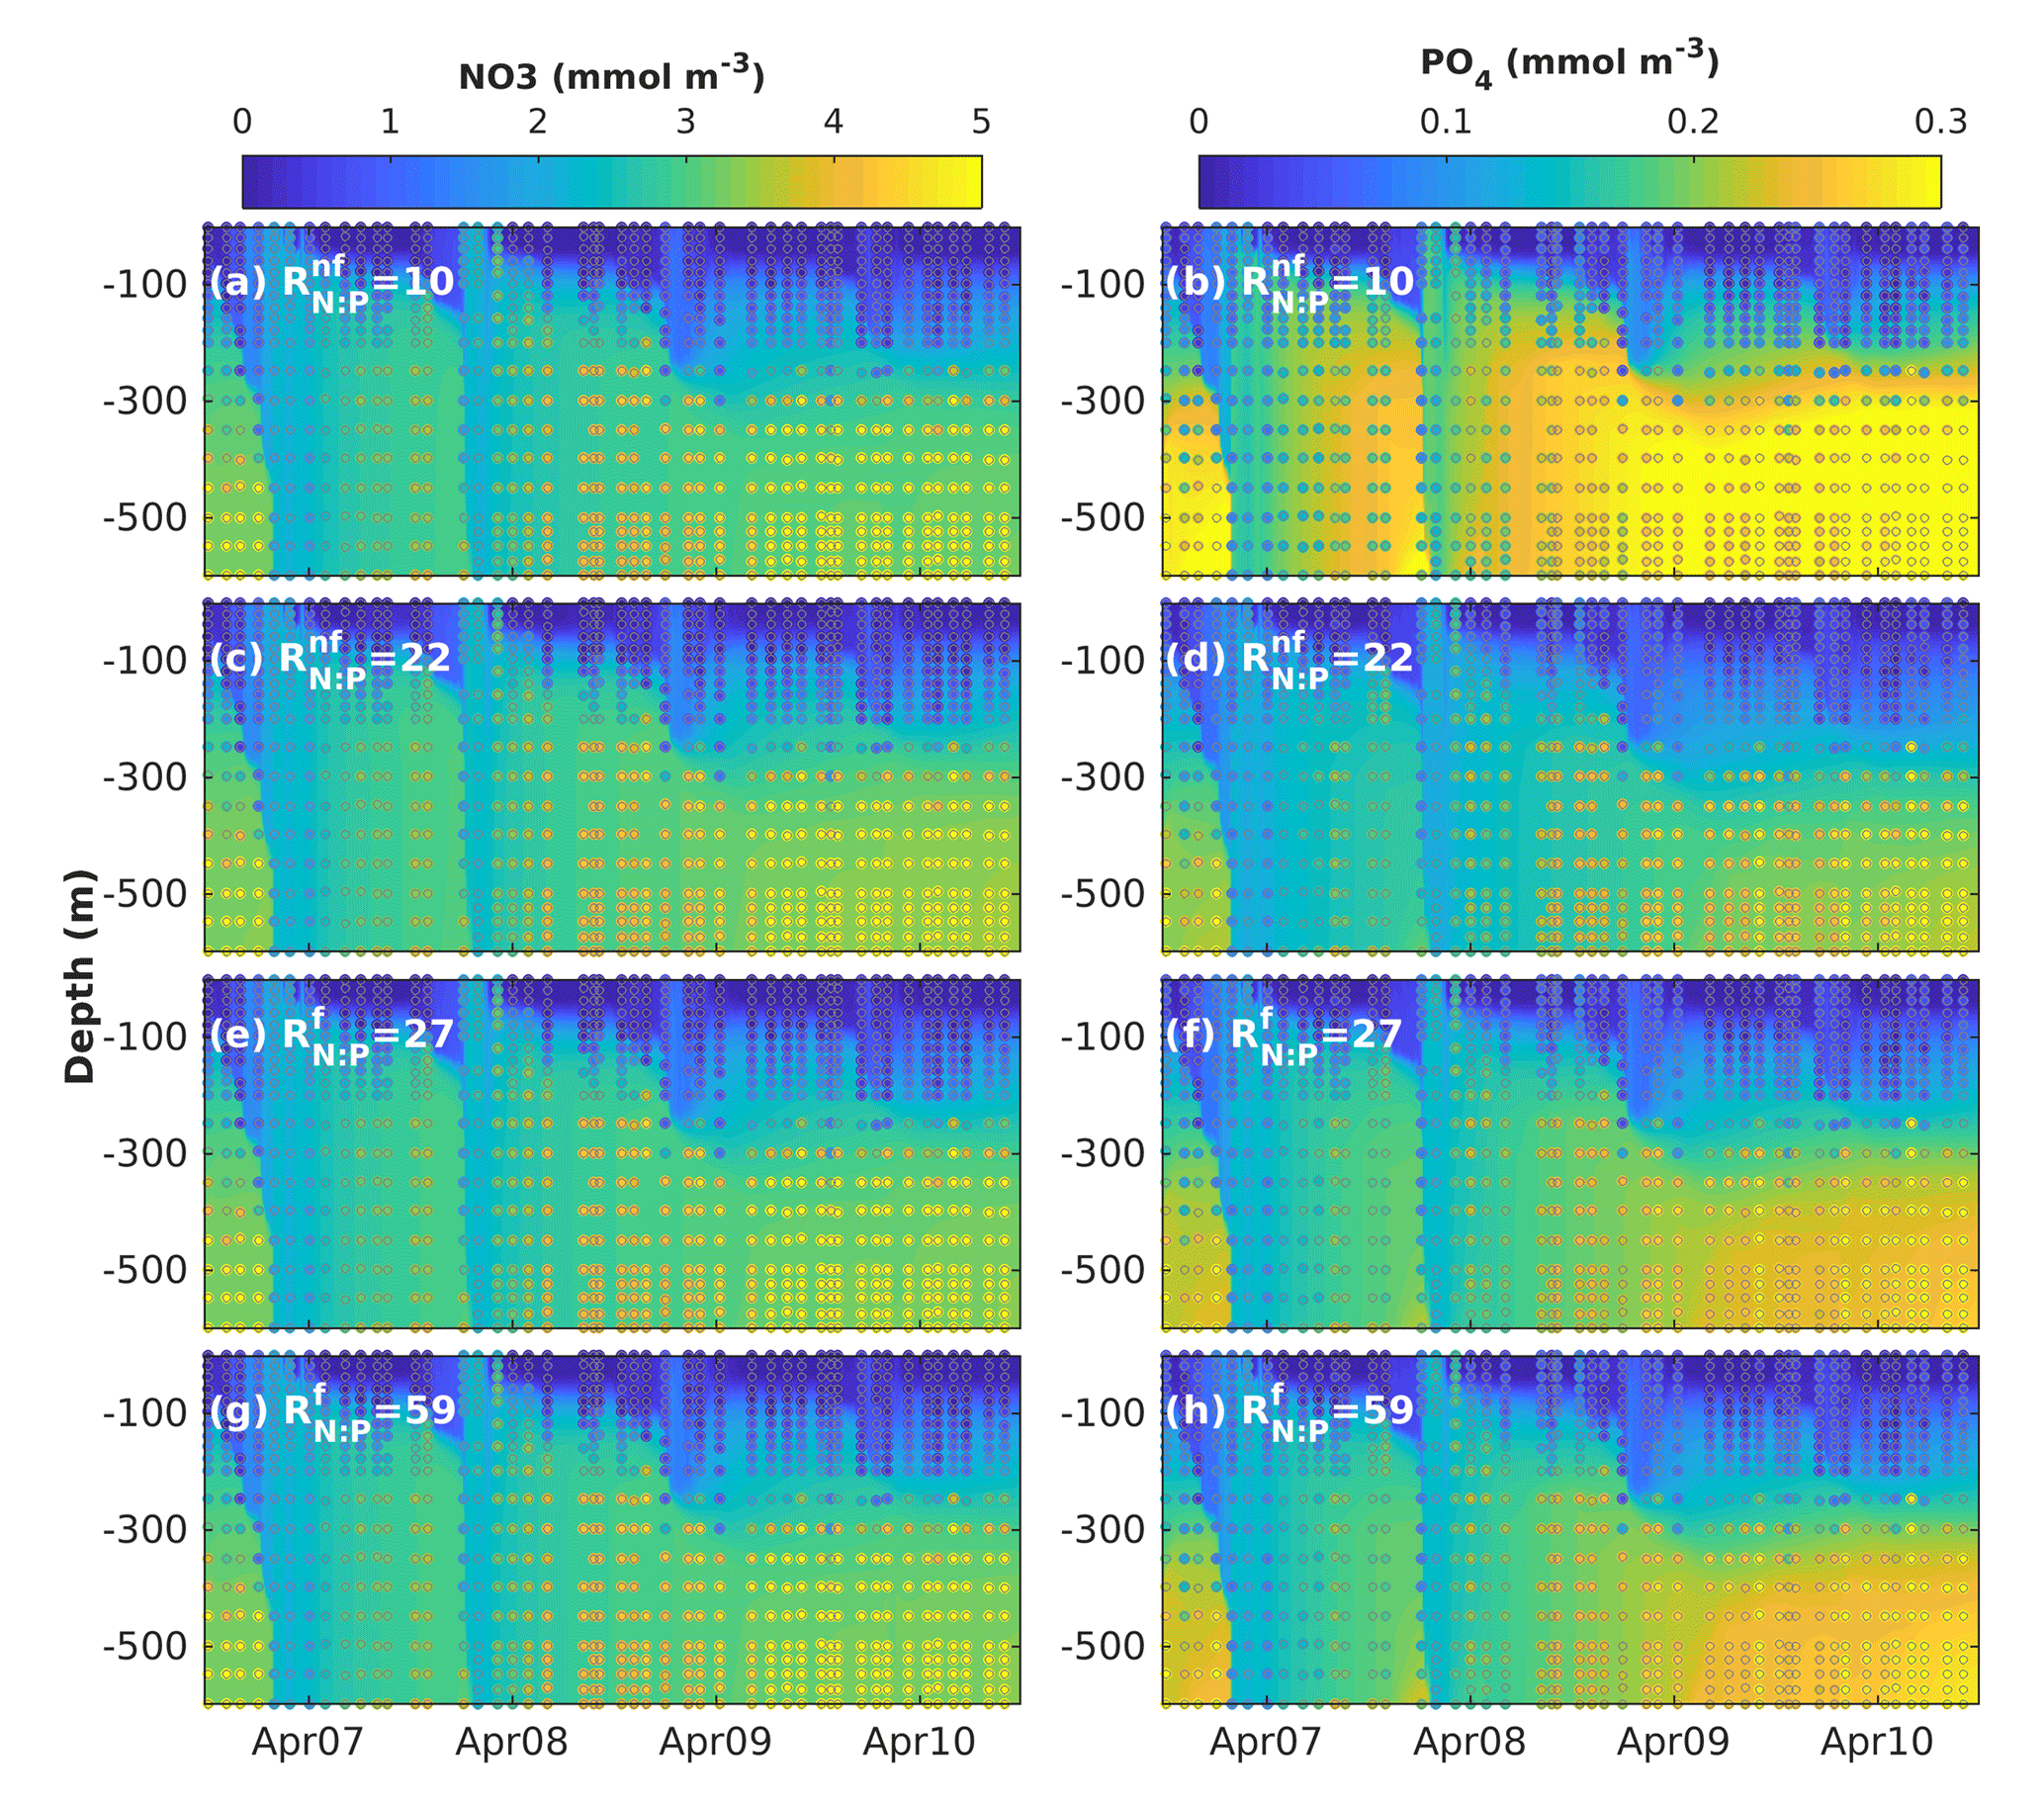
Figure 7Results of sensitivity analyses modifying the fixed N : P ratios in non-N2-fixing phytoplankton () and N2-fixing generic diazotrophs (). Observed (coloured circles) and simulated (background) NO3 and PO4 using model version H1 (generic autotrophic fixer). The spin-up period is not shown.
Of the additional model versions based on H3 (H3a, H3b, H3c and H3d), results from H3a (heterotrophic and colonial diazotrophs) come closest to H3, while the model without autotrophic diazotrophs has the narrowest and most unrealistic range of nutrient concentrations (not shown).
4.2.3 Sensitivity to planktonic stoichiometry
To investigate whether the vertical distribution of dissolved inorganic nutrients was affected by our assumption of fixed N : P phytoplankton and diazotroph ratios, we explored the sensitivity of NO3 and PO4 to changes in the non-N2-fixing phytoplankton N : P ratio () and the diazotrophs' N : P ratio (). In this analysis we used model version H1, which includes a single non-N2-fixing group and a single generic N2-fixing group and varied the ratios one at a time. As all diazotrophic groups share some characteristics of the phosphate uptake parameterizations, the behaviour of the generic diazotroph is indicative of potential effects in the most extensive model versions in a simplified context. The range of values for varied from 10 to 28 and the range for from 19 to 59. Figure 7 shows examples of the results obtained by increasing and decreasing each ratio.
Changes in the N : P ratios had negligible effects on the vertical distribution of NO3, but strongly affected PO4 distribution. In general, lower-than-Redfield of diazotrophs increases PO4 below 300 m, most strongly at depth. This occurs possibly because more phosphorus returns to the dissolved pool per unit nitrogen trough excretion and remineralization. In contrast, a decrease of more than half the of non-diazotrophs produces only a minor decline in deep PO4, while increases in the ratio did not have a significant effect. The decline in deep PO4 occurs because, in the absence of nitrogen limitation, diazotrophs can utilize additional phosphorus.
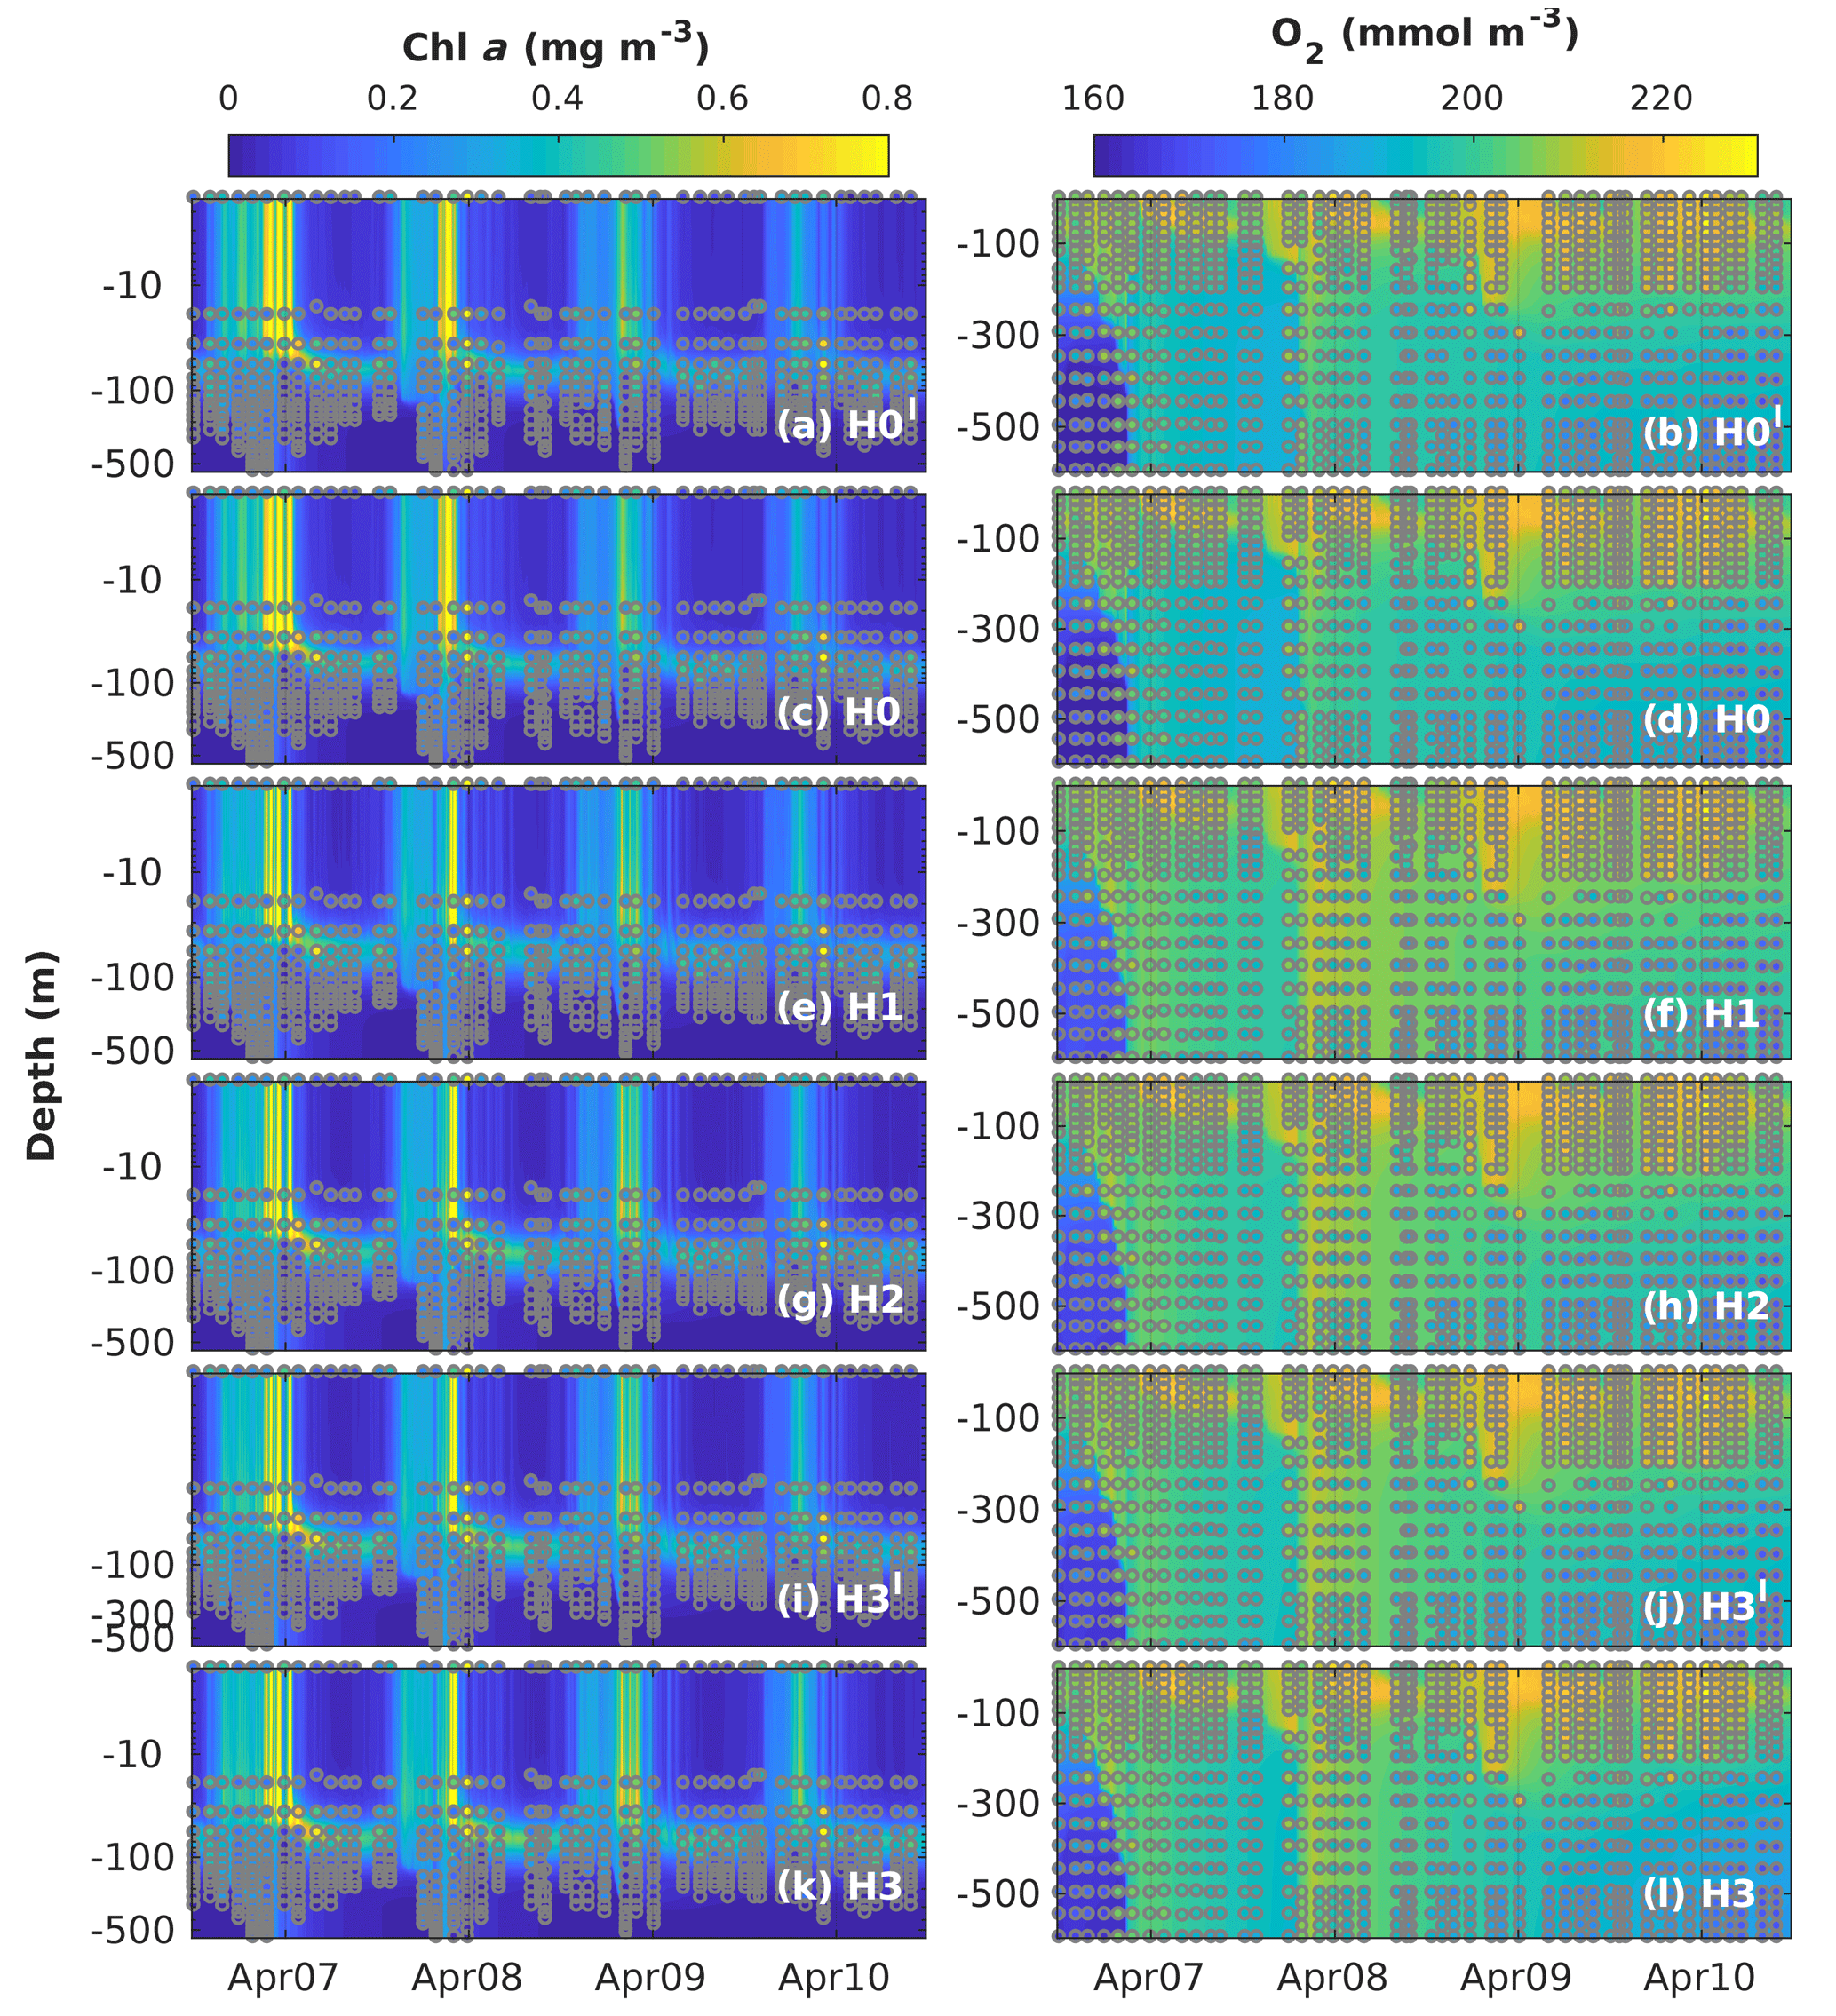
Figure 8Observed (coloured circles) and simulated (background) Chl a and O2 using model versions H0′ (no sediment denitrification – no fixers), H0 (no nitrogen fixers), H1 (generic autotrophic fixer), H2 (unicellular and colonial autotrophic fixers), H3′ (unicellular and colonial autotrophic fixers and heterotrophic non-fixer), H3 (non-N2-fixing heterotrophic as well as unicellular and colonial autotrophic fixers) and H3 (heterotrophic as well as unicellular and colonial autotrophic fixers). Vertical scale in the Chl a subplots is logarithmic to exaggerate the surface. The spin-up period is not shown.
4.2.4 Effect of N2 fixation on chlorophyll and O2
Figure 8 shows simulated and observed chlorophyll and dissolved oxygen values. The seasonal variability of total chlorophyll concentrations is reproduced well by all models, with higher chlorophyll between November and April. During these months, simulated chlorophyll concentrations are homogeneous down to 200 m. In 2007 and 2008, chlorophyll concentrations of ∼0.13 mg m−3 are observed in the measurements reaching as deep as 500 m. This feature is also captured well by our models, as is the location of the deep chlorophyll maximum (DCM) at ∼80 m between March and October. However, there are some discrepancies between model results and observations. The models overestimate spring bloom peak concentrations in 2007 and predict peak timing 2 months earlier than observed in 2008. Model H0 tends to underestimate chlorophyll concentrations from the surface to the DCM during summer months. As chlorophyll concentrations are extremely low during this time of the year, these model–data differences are on the order of 0.05 to 0.1 mg m−3. These discrepancies during summer months are corrected in the models with N2 fixation.
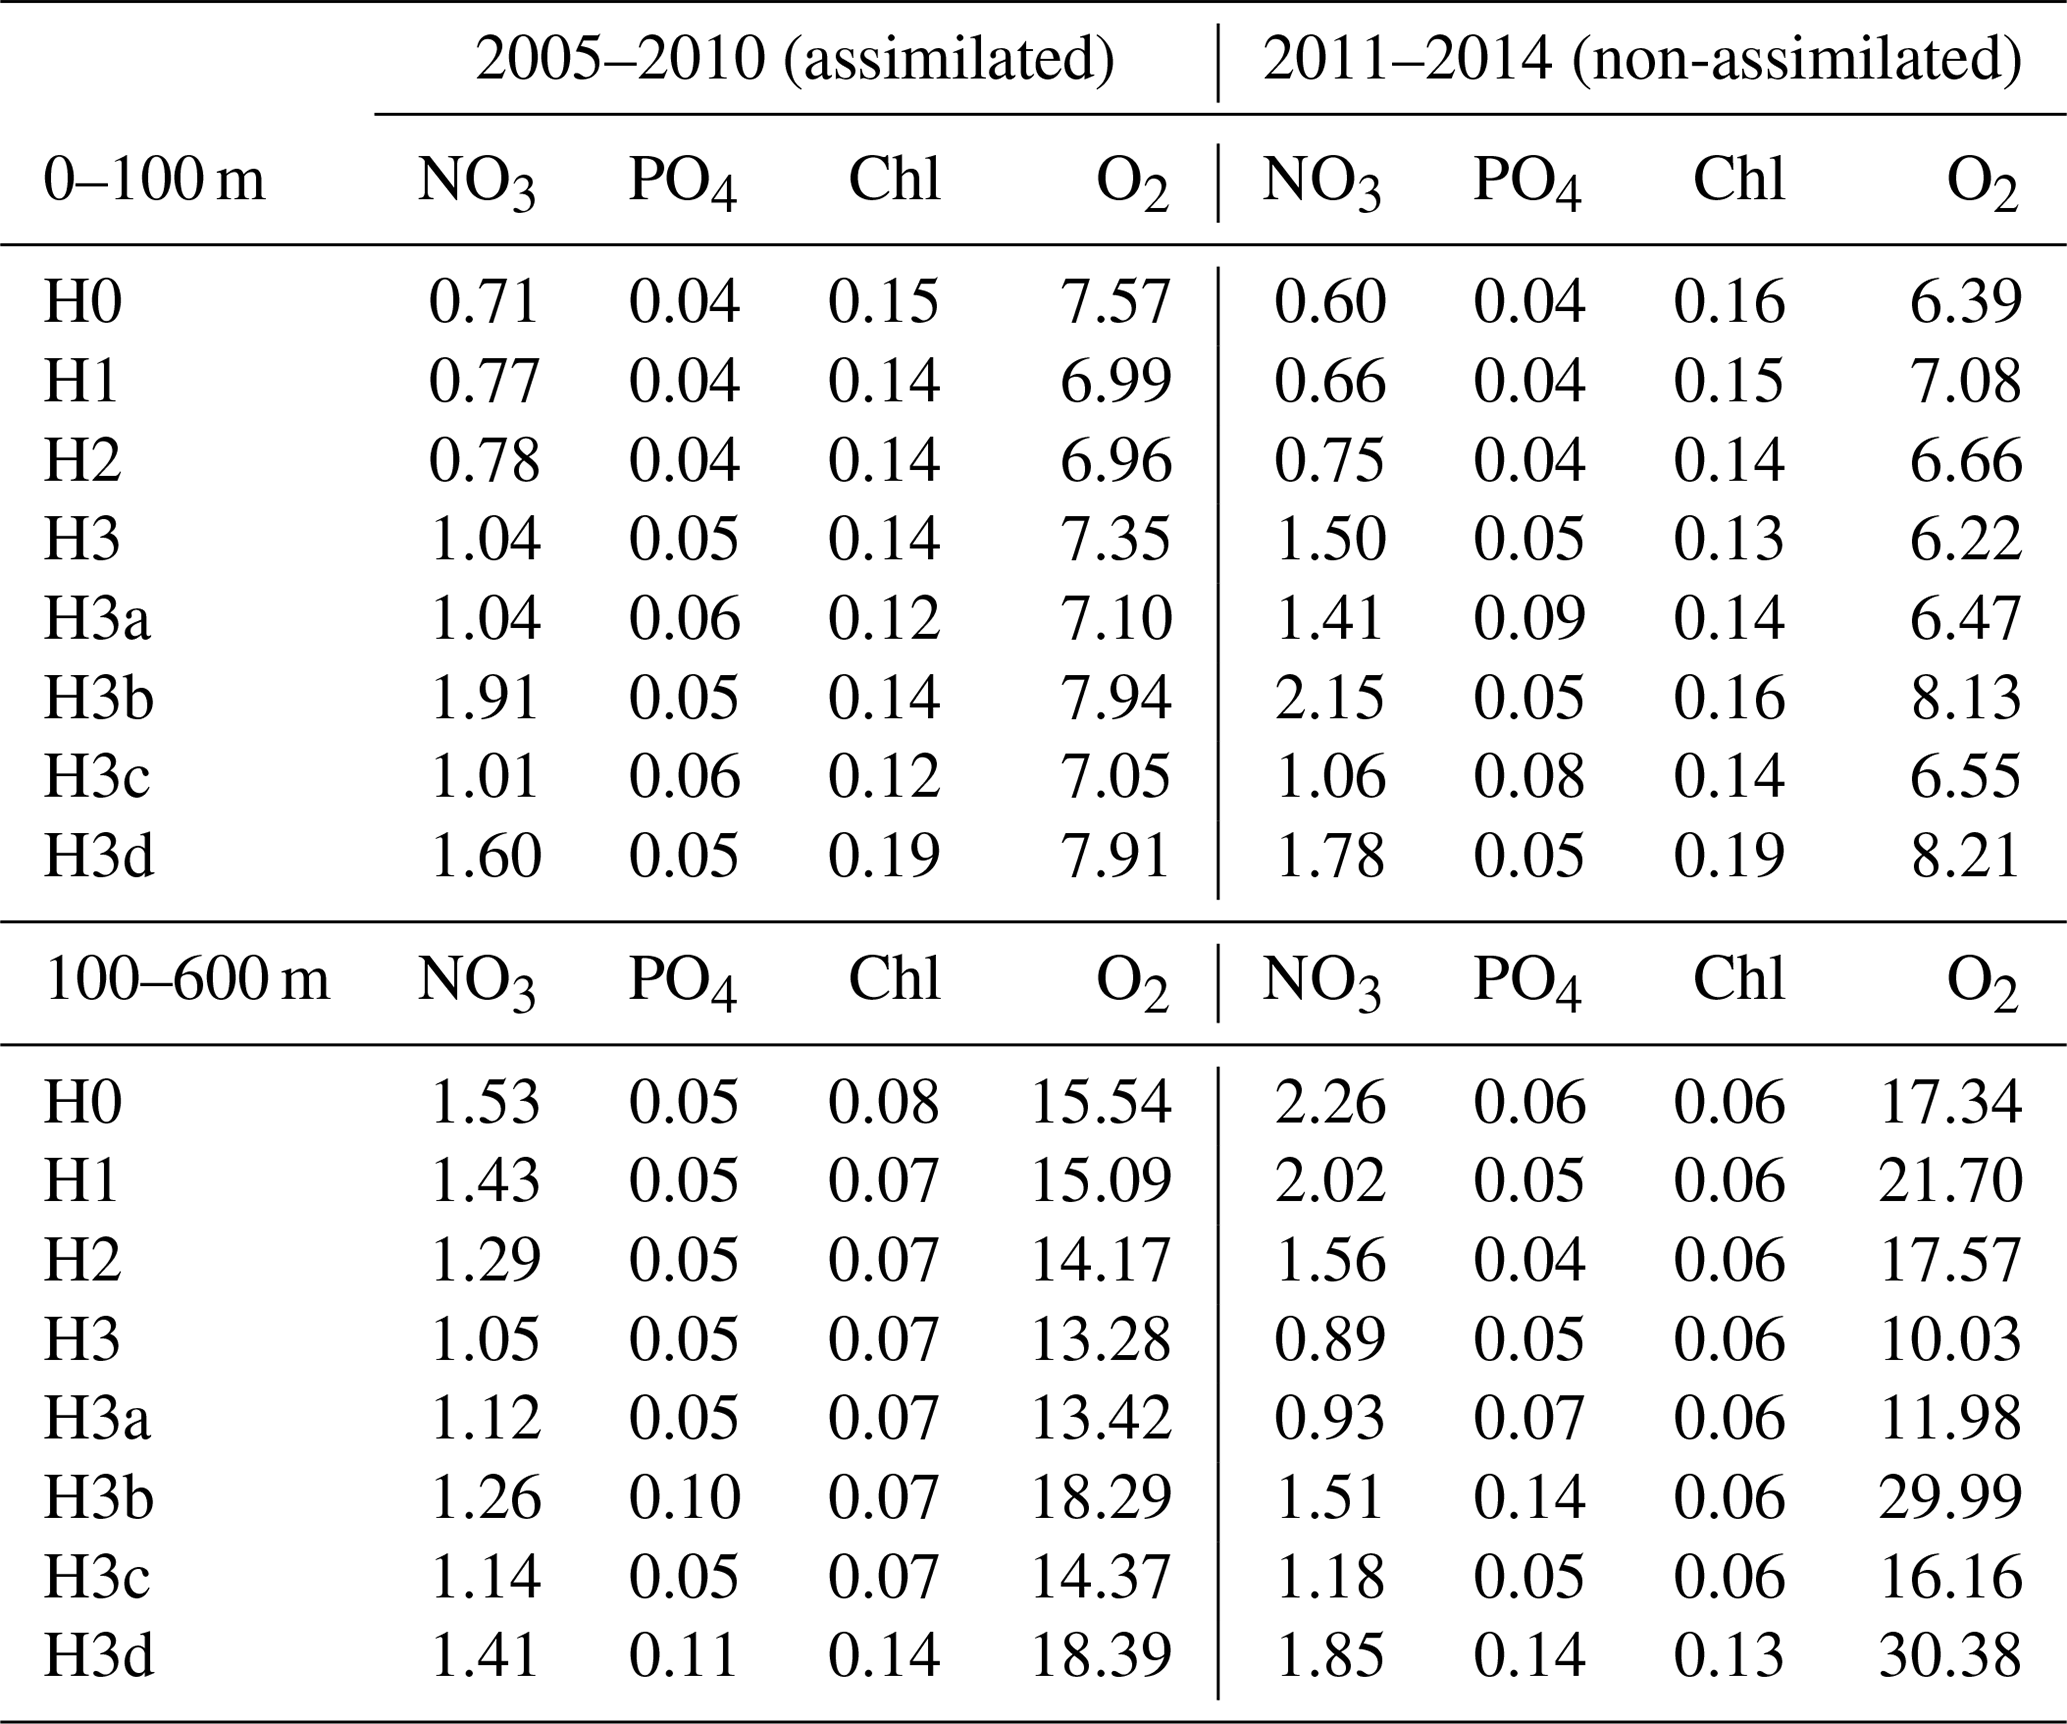
Table 4Root-mean-square errors between observations and corresponding simulated variables. Observations between 2005 and 2010 were used during model calibrations (i.e. assimilated). Observations between 2011 and 2014 are used for independent model validations (non-assimilated). Control versions H0′ and H3′ are not shown.
Simulated oxygen concentrations exhibit larger differences between models and observations, in particular below the mixed layer, where air–sea fluxes do not directly affect oxygen concentrations. Model versions without diazotrophs (H0 and H0′) show similar deep-oxygen variability, with a small underestimation of oxygen during the winter of 2007 and a small overestimation after the winter of 2008. Model recalibration for the model versions with diazotrophs results in changes in deep oxygen. H1, the model with generic diazotrophs, exhibits the largest model–observation misfits. As in the case of deep NO3, the best deep-oxygen representation is obtained with H3.
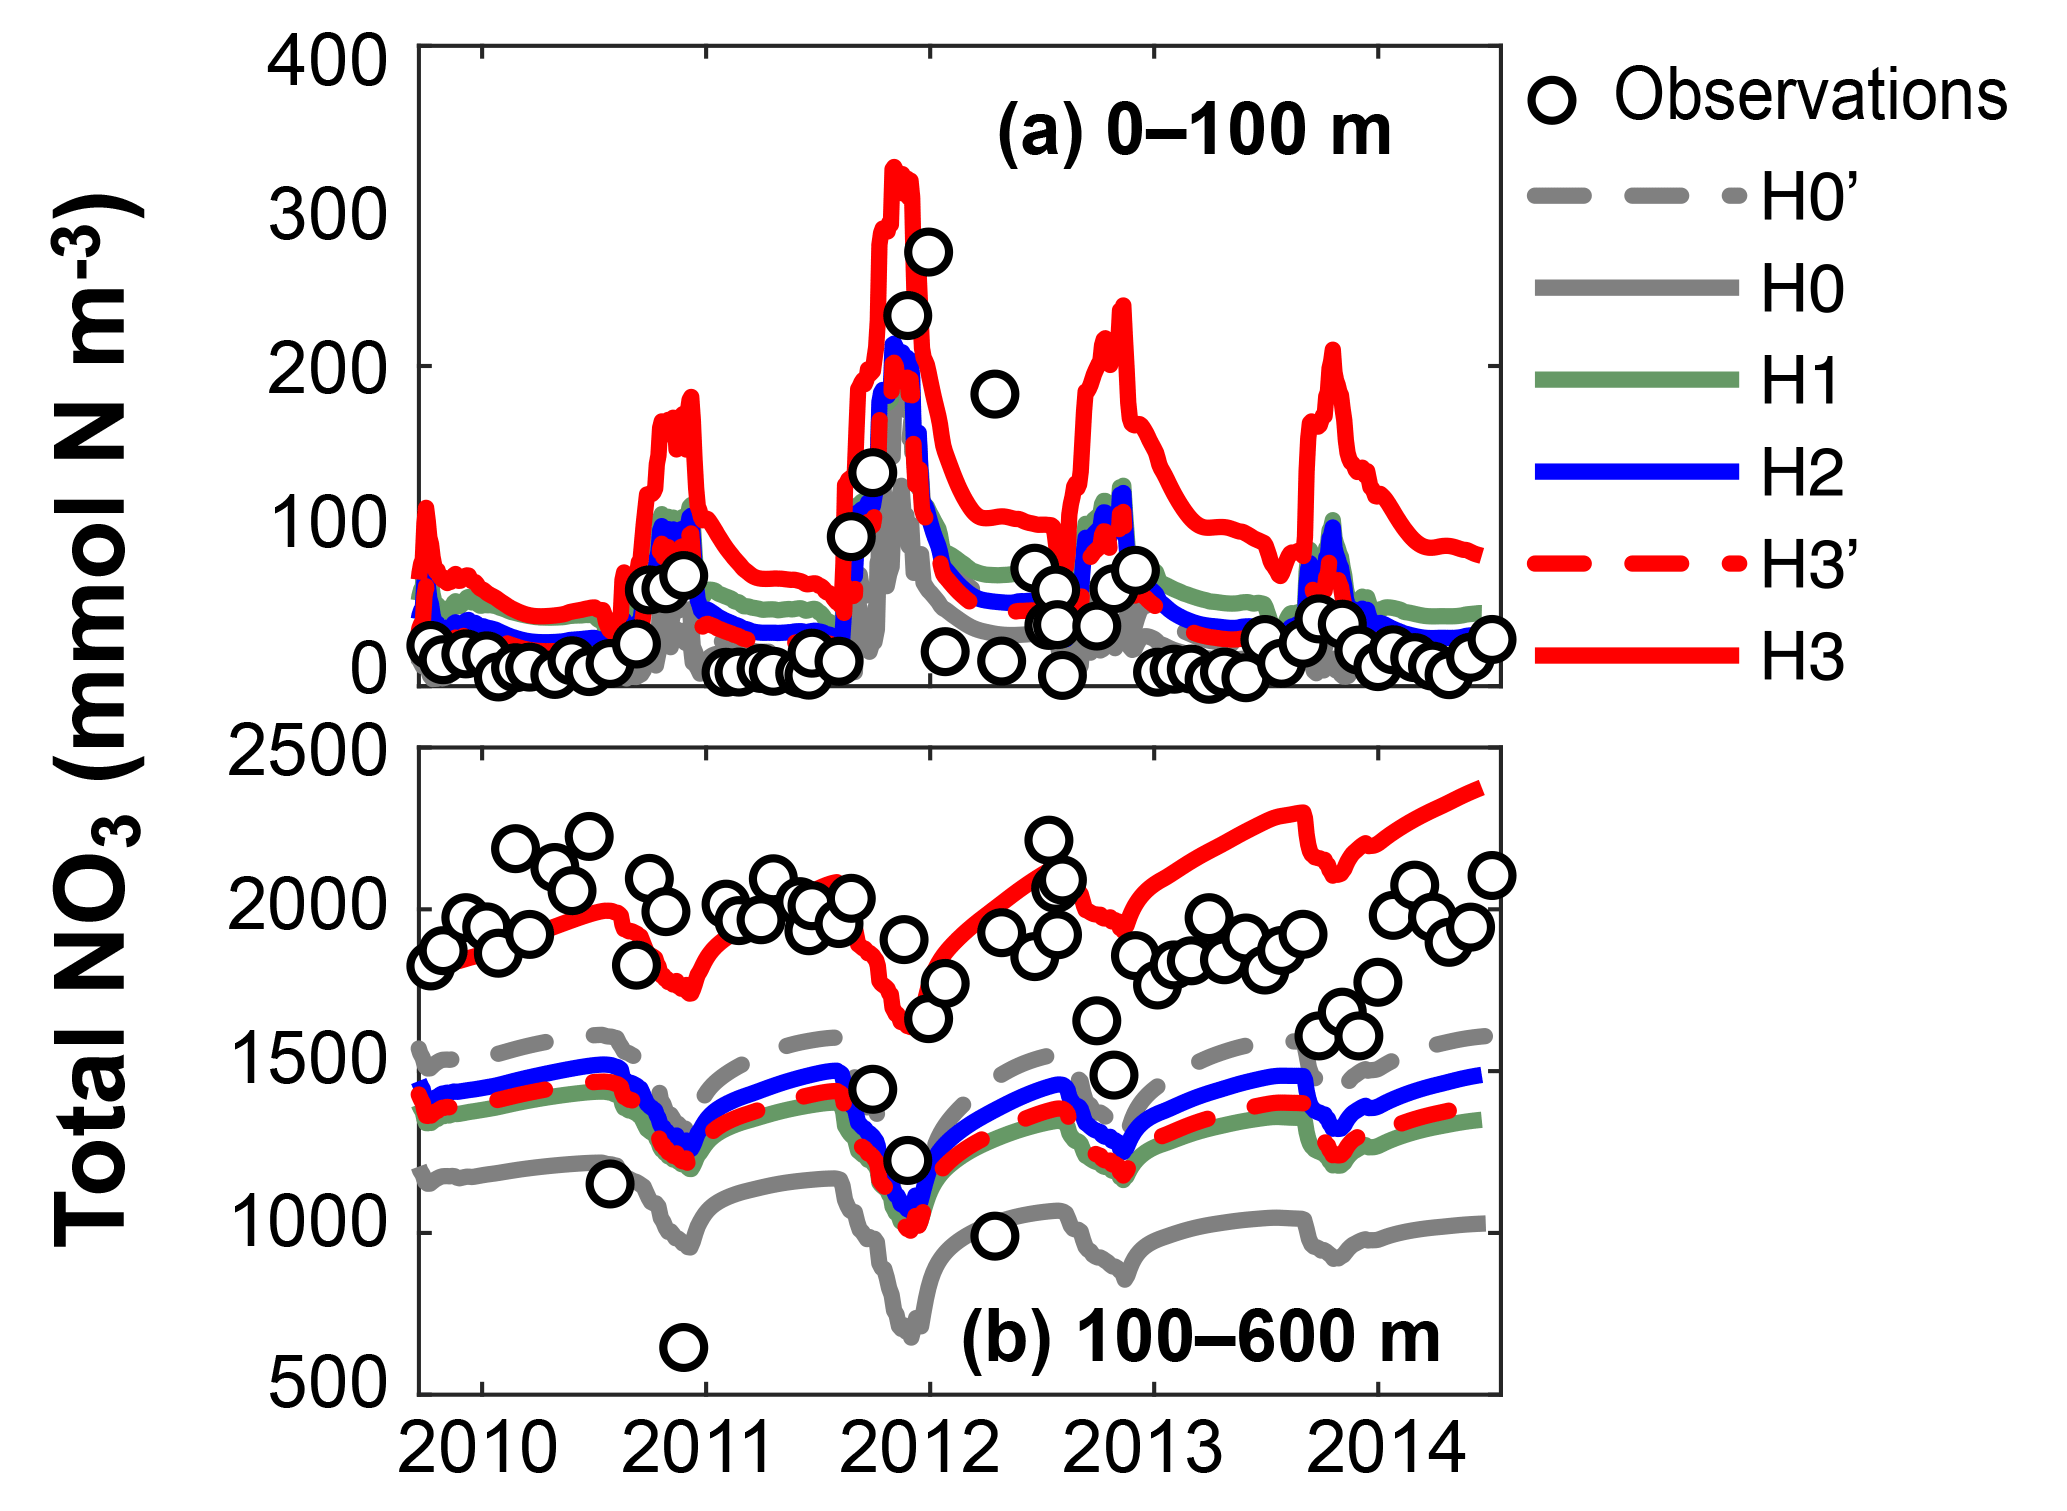
Figure 9Observed (circles) and simulated (lines) total nitrate in the surface and deep waters at Station A during the model validation period from 2010 to 2014. Tick marks are placed on 1 April of every year.
4.2.5 Validation against independent observations
Observations from 2010 to 2014 (outside the optimization period) are used to independently validate the models. The root-mean-square errors (RMSEs) in Table 4 show that, in terms of chlorophyll, PO4 and surface O2, all models behave similarly and achieve similar agreement for assimilated and independent observations. As demonstrated in the previous sections, the model versions mainly diverge in their behaviour with respect to NO3, with some differences in O2 concentrations. Between 0 and 100 m, H3 has the largest RMSEs for NO3, but below 100 m it has the lowest values, particularly against unassimilated NO3. H3 also has the lowest RMSEs for surface and deep oxygen (Table 4).
Figure 9 shows observed and simulated NO3 inventories in 0–100 m and below 100 m outside the assimilation period. Compared against the other model versions, H3 increasingly overestimates surface NO3 over time. However, the deep-NO3 inventory is best represented by H3. By the end of the observed time series, between 2013 and 2014, H3 starts to also overestimate deep NO3.
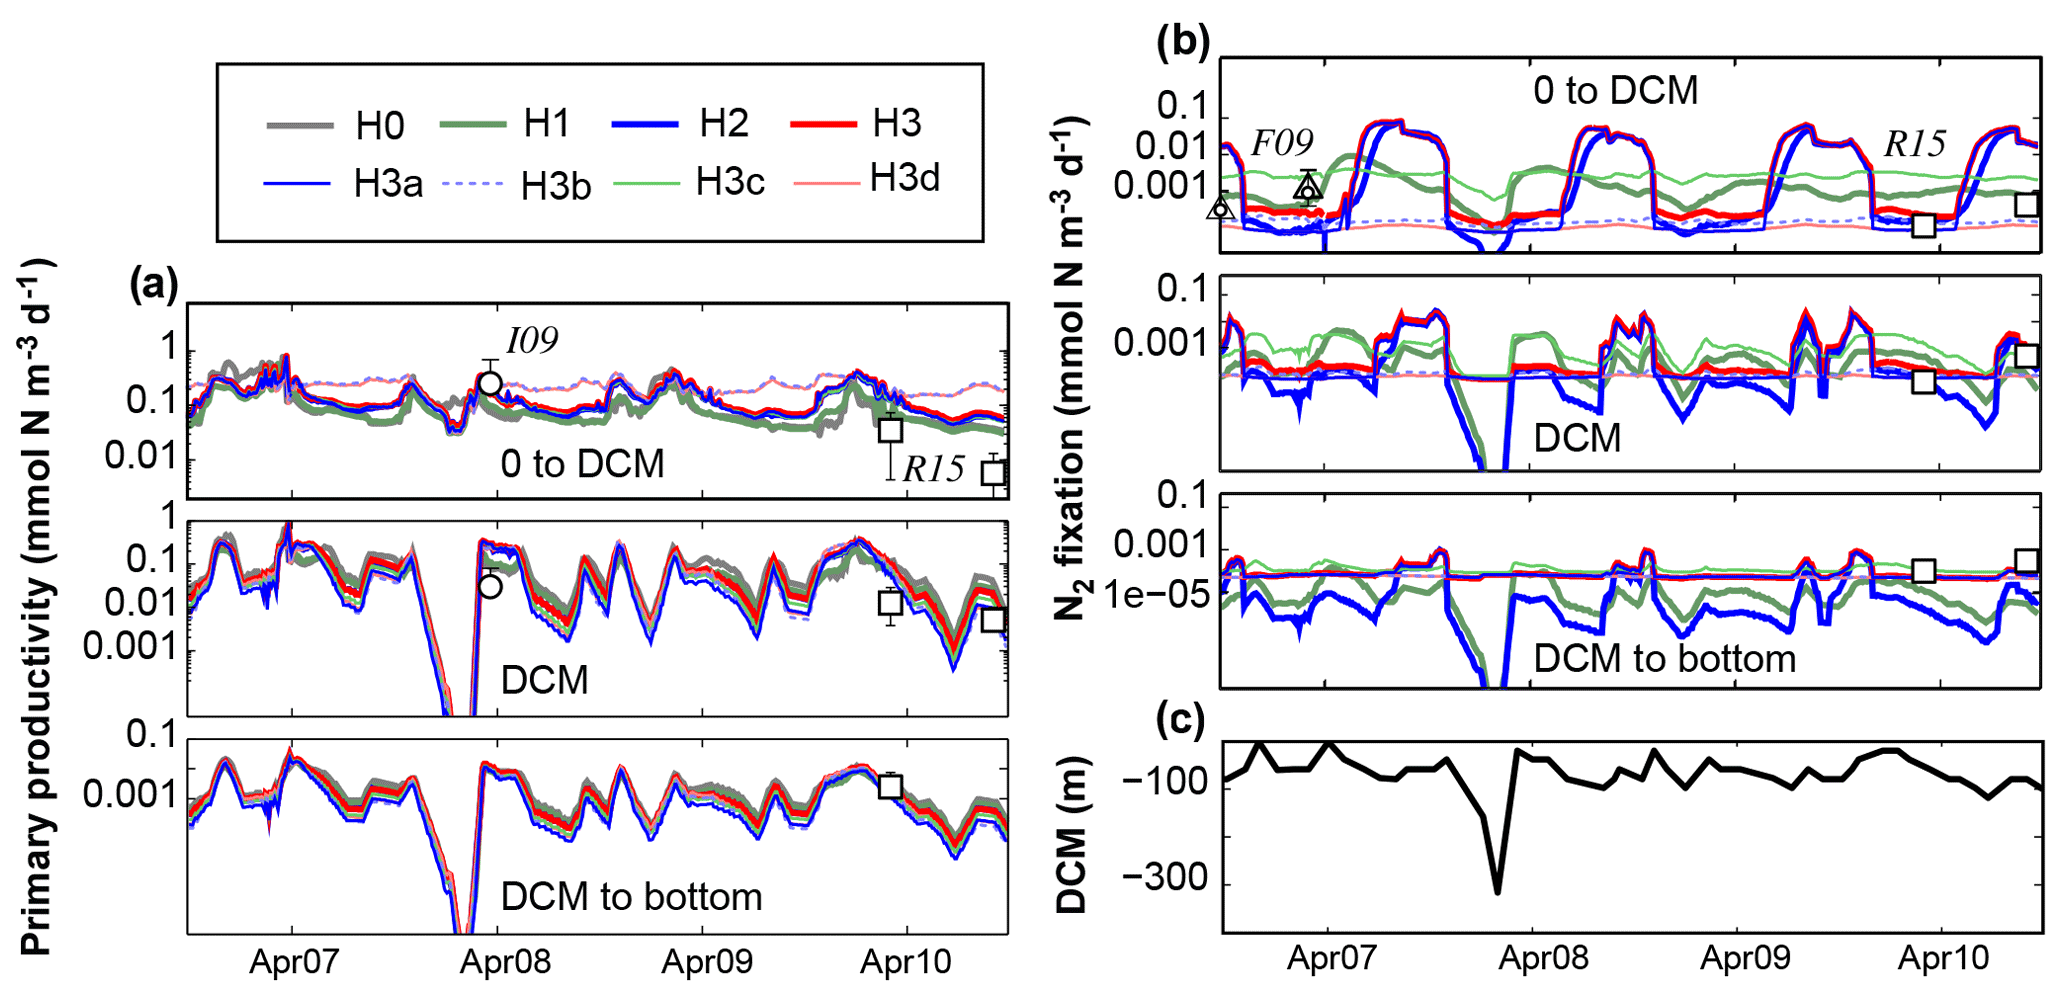
Figure 10Comparison of previously reported in situ measurements and model results of primary production (a) and N2 fixation rates (b), averaged at three depth levels. Depth levels are from the surface to the deep chlorophyll maximum, at the DCM and below it. (c) DCM estimated from observed Chl a profiles at Station A. I09, F09 and R15 refer to Iluz et al. (2009), Foster et al. (2009) and Rahav et al. (2015), respectively. Control versions H0′ and H3′ are not shown.
4.2.6 Primary production and N2 fixation rates
We now compare the simulated rates of primary production with those reported for the Gulf of Aqaba by Rahav et al. (2015) and Iluz et al. (2009) (Fig. 10a) and the simulated rates of N2 fixation with those measured by Rahav et al. (2015) and Foster et al. (2009) (Fig. 10b). Following Rahav et al. (2015), we show the rates at the DCM and their averages above and below the DCM. The depth-resolved in situ primary production rates reported by Iluz et al. (2009) were also averaged in the same way for comparison. Where necessary, observations of primary production in carbon units were converted to the model's nitrogen units using the Redfield ratio.
Simulated primary production above the DCM ranges from 0.02 to 0.85 mmol N m−3 d−1 and exhibits an annual cycle with peaks of productivity in October and April. A prolonged period of low primary production extends from April to September in most model versions. Model versions H3b and H3d maintain rates twice as large as the rest of the models during the summer–fall period. Aside from H3b and H3d, differences between models are small and simulated rates agree with those measured by Iluz et al. (2009) and Rahav et al. (2015).
Above the DCM, models H1, H2, H3 and H3a show a well-defined N2 fixation peak during summer months (i.e. after the peak in primary production). Maximum rates in these models range from 0.001 to 0.1 mmol N m−3 d−1, which agrees with the observed rates by Foster et al. (2009) and Rahav et al. (2015). In general, simulated N2 fixation rates are low during winter and spring. Similar temporal patterns and differences between model versions occur at the DCM and below. Peaks in N2 fixation at these depth levels occur after the surface peak and have a shorter duration and smaller amplitude. Deep-N2 fixation rates estimated by models without heterotrophic diazotrophs do not match the observed rates by Rahav et al. (2015).
5.1 Is N2 fixation relevant in the Gulf of Aqaba?
In this study we implemented and optimized a series of models with different assumptions about N2 fixation in the Gulf of Aqaba. The models range from one neglecting N2 fixation to another assuming that, in addition to two autotrophic diazotroph groups, N2 fixation can occur in the entire water column (i.e. independent of light availability). While the models are very similar in their abilities to replicate chlorophyll and PO4, model H3 performed the best in reproducing the observed pattern of deep-NO3 accumulation and O2. Overall, all models that consider N2 fixation accumulate nitrogen at different rates, as they enrich the nitrogen content of detritus, which is then remineralized at depth over time.
The best model performance was obtained with two groups of autotrophic organisms and a group of heterotrophic organisms (H3). A model without explicit N2 fixation, but in the absence of sediment denitrification, also increases the accumulation of deep NO3 in a similar fashion as version H2 but not sufficiently high to match the observations. This suggests that N2 fixation in the area must exceed denitrification rates. In the models with denitrification, the average sediment denitrification flux is 0.25±0.46 mmol N m−2 d−1, with a maximum value of 3.01 mmol N m−2 d−1. These values are at the lower end of a global compilation of sediment denitrification rates by Fennel et al. (2009), which have a mean of 2.2 mmol N m−2 d−1 and maximum values exceeding 10 mmol N m−2 d−1.
Observations from the Gulf of Aqaba exhibit an excess of nitrogen that contrasts to exterior waters from the Arabian Sea and Indian Ocean, which are considered net nitrogen sink regions (Gruber and Sarmiento, 1997). As demonstrated by the N* values shown in this study, excess nitrogen in the Gulf of Aqaba varies seasonally in surface waters but is more prevalent in deep waters. We showed that the models' levels of performance at replicating vertical NO3 distributions are directly linked to their ability to reproduce N*. When we neglect N2 fixation, excess phosphate tends to dominate the whole water column, contrary to the observations. Explicitly accounting for N2 fixation (H1, H2, H3) improves models' abilities to replicate N*. Nevertheless, the model's limitations at replicating PO4 also affect their ability to fully simulate the range of observed N* values. This suggest that the model requires further improvements in the representation of processes differentially affecting PO4 (see Sect. 5.4).
There are too few reported values of dissolved inorganic nitrogen and phosphorus for the Red Sea region from Bab-el-Mandeb to the Straits of Tiran to provide a complete idea of the spatial distribution of N*; however, the limited available information supports our conclusions. Naqvi et al. (1986) found a significant difference in N : P ratios between surface incoming and subsurface outflowing waters at Bab-el-Mandeb, concluding that N2 fixation was a process required to explain these anomalies in the nitrogen budget. Higher nitrogen concentrations (N* mmol m−3) have been observed in the Red Sea in comparison to the Arabian Sea and Indian Ocean, where a strong deficit of nitrogen develops as losses due to denitrification exceed the input of newly fixed nitrogen (Burkill et al., 1993; Naqvi, 1994; Gruber and Sarmiento, 1997; Morrison et al., 1998, 1999). Close to the entrance of the Persian Gulf, average N* values have been estimated to be below −5 mmol m−3 at all depths and seasons reported, with minimum N* values on the order of −8 mmol m−3 (Gruber and Sarmiento, 1997). Thus, it has been hypothesized that limited deep-water exchange at Bab-el-Mandeb allows waters of the Red Sea outside of the Gulf of Aqaba to acquire different characteristics from inflowing Arabian Sea waters (Naqvi et al., 1986). Our model results support this hypothesis and suggest that N2 fixation is key for the formation of the distinct biochemical characteristics in the Gulf of Aqaba. Considering the regional context, our models suggest that, despite low rates, N2 fixation is necessary to explain the nitrogen vertical distribution in the Gulf of Aqaba and the interannual accumulation of deep nitrate during years with weak convection.
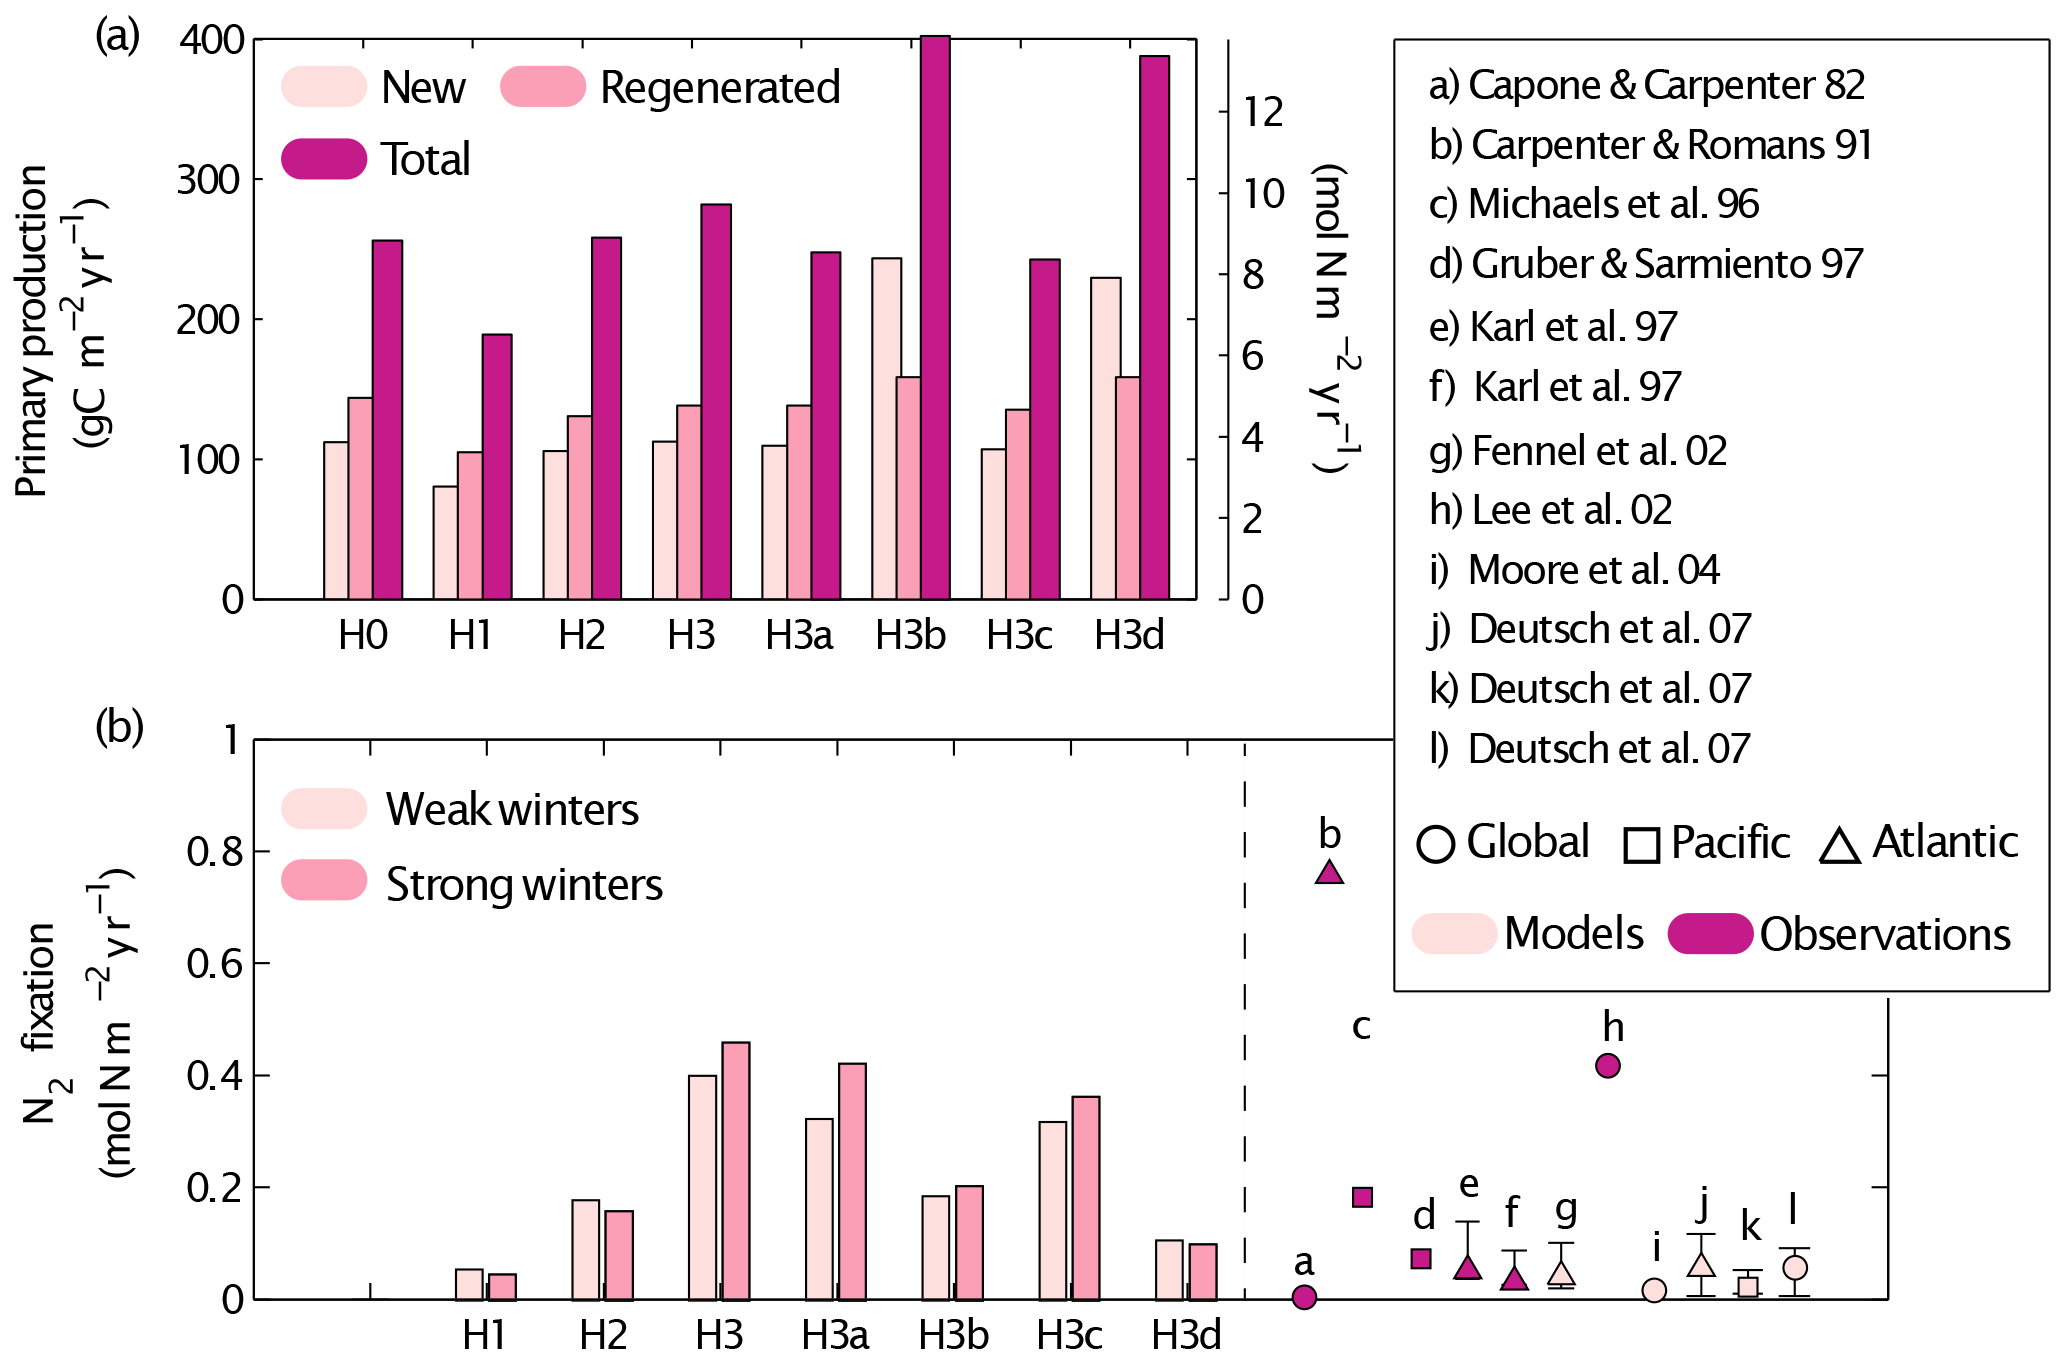
Figure 11Simulated new, regenerated and total primary production (a) and N2 fixation rates (b) obtained by the different simulations (see Table 1 for key to different simulations). A summary of previous estimates of N2 fixation rates in observational and model studies is included in (b). The Redfield C : N ratio is used to transform the model results' nitrogen units to carbon units. Control versions H0′ and H3′ are not shown.
The lowest negative N* values observed in surface waters in the Gulf of Aqaba during summer are not fully captured by any of our model versions. In the context of a one-dimensional framework, we cannot reject the possibility that these minimum N* values are a remnant signal of denitrification in the distant Arabian Sea. During their passage through the Red Sea, N2 fixation may be responsible for transforming waters with significant excess phosphorus into these summer surface waters with small negative N* deviations. If we consider the global average correction to N* values of +2.89 µmol kg−1 used by Gruber and Sarmiento (1997), N* values in the Gulf of Aqaba hold a permanent excess of nitrate with respect to other geographical regions. Similarly, the overestimation of surface NO3 obtained with the model that performs the best for deep NO3 suggests that the Gulf of Aqaba has the potential to export newly fixated nitrogen to the outside waters through horizontal advection in the surface to mid-water layers. This was not tested within our one-dimensional model. Given our model results in the context of these regional characteristics, we consider that N2 fixation is necessary to explain positive N* values in the Gulf of Aqaba and the interannual accumulation of deep nitrate during years with weak convection.
5.2 How does N2 fixation contribute to primary production?
In this section we discuss the contribution of N2 fixation to primary production in the Gulf of Aqaba and our quantitative estimates of N2 fixation with respect to global rates (Figs. 9–11). Our estimates of surface primary productivity agree with those reported by Iluz et al. (2009) for March–April of 2008. However, our models overestimate surface primary productivity values in 2010 when compared to those reported by Rahav et al. (2015). On average, our best-performing model version yields an annual primary production rate of 304±56.9 g C m−2 yr−1 (H3). This rate is higher than previously published annual averages, which range from 80 g C m−2 yr−1 (Levanon-Spanier et al., 1979) to 170 g C m−2 yr−1 (Iluz, 1991), whereas more recent unpublished primary production estimates at IUI range between 141 and 197 g C m−2 yr−1 (Yonni Shaked, personal communication, 2017).
The ratio of new to total primary production (f-ratio) in our model experiments ranges from 15 % to 80 %. Maximum f-ratios are estimated in January and February due to significant contributions from deep NO3, whereas f-ratios are at their minimum during stratified conditions (June–August). Our best-performing model version, H3, estimates a summer minimum f-ratio 0.22. The average f ratio for all scenarios is 0.47. This agrees with published estimates for the Gulf of Aqaba of 0.5 during the stratified period as determined from a nitrate-diffusion model (Badran et al., 2005).
Total annual N2 fixation rates from our best-performing model versions (H3 and H3a) are similar to high estimates reported for other regions (Capone and Carpenter, 1982; Michaels et al., 1996; Lee et al., 2002), while those obtained in the other model experiments are within the range of values reported for the Gulf of Aqaba. The intensity of winter mixing has a minor effect on N2 fixation rates; the largest effect occurred in H3a where N2 fixation increased by 15 % after deep winter mixing. Based on our best-performing model version (H3), we estimate that 10 % to 14 % of the total primary production is supported by N2 fixation.
5.3 Are heterotrophic N2 fixers important?
In contrast to previous models (e.g. Hood et al., 2001; Fennel et al., 2002; Monteiro et al., 2010; Moore et al., 2004), our model version H3 relaxes the assumption of light dependence for diazotrophy, through the inclusion of heterotrophic diazotrophs in addition to two groups of autotrophic diazotrophs. This model improves the representation of NO3 and O2 at depth (Figs. 3, 6). Changes in deep NO3 can be explained through the enrichment of detritus, while changes in O2 may reflect the additional sink of O2 at depth due to the heterotrophic group. All model versions with heterotrophic organisms also match observed estimates of N2 fixation in deep waters of the Gulf of Aqaba, and without them N2 fixation rates below the DCM are underestimated (Fig. 8). Heterotrophic N2 fixation also impacts total N2 fixation (Fig. 9).
There is growing evidence of non-cyanobacterial N2 fixation in aphotic waters (Benavides et al., 2017; Moisander et al., 2017). For instance, N2 fixation rates in mesopelagic and abyssopelagic waters down to 2000 m (Fernandez et al., 2011; Bonnet et al., 2013; Loescher et al., 2014) have been attributed to non-cyanobacterial organisms, including proteobacteria (Turk-Kubo et al., 2014). These nifH-expressing heterotrophic phylotypes can be as abundant as unicellular cyanobacterial groups and dominate the deep and dark zones of the water column (Church et al. 2005; Langlois et al., 2005; Riemann et al., 2010). Genetic evidence and rate estimates from the Gulf of Aqaba suggest that nifH-expressing heterotrophic proteobacteria α and γ may explain the correlation of bacterial productivity rates with N2 fixation rates (Rahav et al., 2013, 2015). Aside from the Gulf of Aqaba, aphotic N2 fixation and nifH gene expression have also been reported in the Baltic Sea (Farnelid et al., 2013), Arabian Sea (Jayakumar et al., 2012) and Mediterranean Sea (Rahav et al., 2013).
Despite the importance of heterotrophic diazotrophs in our model, the simulated colonial diazotroph blooms are responsible for the highest N2 fixation rates, so they are a necessary model aspect to achieve resemblance with the observations. This is in line with evidence of extensive blooms of Trichodesmium spp. being responsible for the high N2 fixation rates observed in the Arabian Sea and Red Sea (Capone et al., 1998; Post et al., 2002; Foster et al., 2009). In the northern Gulf of Aqaba, colonies and free trichomes of Trichodesmium spp. are found throughout the year down to 100 m depth (Post et al., 2002). Ephemeral blooms of T. erythraeum and T. thiebautii have been documented near the coast of Eilat (Post et al., 2002; Gordon et al., 1994; Kimor and Golandsky, 1977). However, massive blooms are rare in the Gulf of Aqaba (Foster et al., 2009; Mackey et al., 2007; Ilana Berman-Frank, personal communication, 2017) and the model probably overestimates the contribution of Trichodesmium spp.'s annual blooming to total N2 fixation rates, as seen in the much larger surface N2 fixation rates generated by H2 and H3. As new observational information is collected, further model refinements may be necessary to better reflect the actual contribution of different diazotrophic groups in the Gulf of Aqaba.
5.4 Limitations and uncertainties
The one-dimensional nature of our physical setting, which neglects the contribution of horizontal advection to the vertical structure of simulated tracers, can be considered a limitation of this study. This simplification is, however, necessary to perform model calibration and test multiple model structures at a manageable computational expense. We applied temperature and salinity nudging to ensure accurate representation of the vertical density structure. Comparison of the simulated vertical structure with and without nudging shows that this correction has negligible effects on deep waters, where the effects of N2 fixation are the most relevant. This is consistent with the existing literature about circulation of the Gulf of Aqaba, which describes how geomorphology and bathymetry limit water exchange between the Gulf of Aqaba and the Red Sea to the upper 300 m (Wolf-Vecht et al., 1992; Biton and Gildor, 2011). It is, therefore, unlikely that horizontal transport could explain the observed accumulation of deep NO3. Nevertheless, transport of nitrogen-enriched subsurface waters from the Gulf of Aqaba towards the exterior may dampen and modulate the long-term accumulation of nitrogen observed in Fig. 9.
There are other sources of nitrogen that were not explored in the present study that we discuss here briefly. For instance, we did not include contributions to N2 fixation by diatom–diazotroph associations, which are significant in other regions. While diatom–diazotroph associations have been detected in the Gulf of Aqaba, they are not as abundant as unicellular diazotrophs, Trichodesmium and proteobacteria (Kimor et al. 1992; Foster et al., 2009; Ilana Berman-Frank, personal communication, 2016). In general, due to the oligotrophic characteristics of the region, small phytoplankton species (< 8 µm) contribute more than 90 % of the chlorophyll a standing stock (Lindell and Post, 1995; Yahel et al., 1998). Dinoflagellates and diatoms together correspond to less than 5 % of the phytoplankton biomass, except during ephemeral diatom blooms during spring when they can account for nearly 50 % of the total biomass (Al-Najjar et al., 2006).
Another source of nitrogen which could significantly affect this region is atmospheric deposition, as the Gulf of Aqaba receives considerable dust input from the surrounding deserts. Recently, it has been shown that atmospheric dust input does not correlate with chlorophyll variability in surface waters of the Gulf of Aqaba (Torfstein and Kienast, 2018). In contrast, a previous study suggested that atmospheric deposition of nitrogen could support over 10 % of surface primary production in the region, based on measurements of local aerosol composition and a dust deposition model (Chen et al., 2007). However, this estimate had a relatively large uncertainty due to errors associated with the deposition flux calculation and the temporal variability in dust flux (Chen et al., 2007). Moreover, very low nitrogen concentrations and N : P ratios lower than Redfield from the surface down to 80 m were observed during the same time period (Foster et al., 2009). Therefore, the role of atmospheric nitrogen inputs remains uncertain.
In contrast to the improvement in NO3 distributions with the addition of heterotrophic diazotrophs, all model versions exhibit similar underestimation of deep total PO4. This suggests that their structure lacks a process affecting this nutrient. Several processes can independently affect PO4. Prior knowledge suggests that seasonal advection of nitrogen-depleted surface waters may contribute to changes in PO4, while having minimum impact on NO3 concentrations. Other relevant missing processes include variable plankton stoichiometry and PO4 remineralization. Our sensitivity analysis highlighted that varying the planktonic N : P ratios has an evident effect on PO4 but does not affect NO3 distributions significantly. A related effect was noticed when comparing fixed constant vs. variable plankton nutrient uptake stoichiometry in a model of the central Baltic Sea: seasonal particulate organic C : N ratios were very similar, but C : P diverged (Kreuss et al., 2015). Moreover, preferential PO4 remineralization may more directly increase deep-PO4 concentrations as organic matter is decomposed in the bottom layers. The inclusion of this process in a model of the North Atlantic Ocean improved the representations of biogeochemical characteristics of the area and increased the N2 fixation rates obtained by the model (Monteiro and Follows, 2012). Variable nitrogen allocation within diazotrophs also improved the performance of a model representing annual cycles in the North Atlantic subtropical gyre (Fernández-Castro et al., 2016). Further investigation of this process is recommended.
Finally, an intrinsic caveat that should accompany all biological models is the uncertainty associated with parameter values (Denman, 2003). We reduced this uncertainty by using systematic parameter optimization for a subset of parameters, yet others were kept fixed at a priori assumed values. In the case of N : P ratios, a simple sensitivity analysis suggests that they do not affect conclusions with respect to inorganic dissolved nitrogen but modify phosphorus concentrations. In the case of parameters related to diazotrophs, these are largely unconstrained by the observations we used, which are the typically available ones in long-term data sets (i.e. Chl a, NO3, PO4, O2). We emphasize that results in this study are exploratory, testing the effects of assumptions about diazotroph behaviour rather than modifying such behaviour by subjectively tuning parameter values.
We implemented and optimized biogeochemical models that represent a range of different assumptions about diazotrophy in a 700 m deep pelagic station from the northern Gulf of Aqaba. Our model results demonstrate the importance of N2 fixation in replicating the observed water-column-integrated nitrogen and oxygen inventories. The model without N2 fixation is unable to replicate the observed vertical structure of inorganic nitrogen. The models that include diazotrophs significantly modify this variable by increasing the fraction of remineralized nitrogen from organic matter decomposition. The effect of N2 fixation on O2 distributions depends on the type of nitrogen fixer. N2 fixation by autotrophic-photosynthetic organisms increases oxygen concentrations, while heterotrophic organisms decrease deep oxygen due to increased respiration and organic matter decomposition. The observed vertical structure of NO3 and oxygen is reproduced best with a model that includes heterotrophic as well as colonial and unicellular autotrophic diazotrophs, suggesting that heterotrophic N2 fixation is necessary to explain the observed excess nitrogen at this location. N2 fixation assumptions do not affect PO4 concentrations significantly, but they are affected by assumptions about N : P ratios of organic matter. The N2 fixation rates simulated by this model are similar to the highest observational estimates from the Gulf of Aqaba. Aphotic N2 fixation is simulated to occur at lower rates than maximum autotrophic N2 fixation yet occurs continuously over a large portion of the water column. This suggests that heterotrophic diazotrophs set a background rate of N2 fixation in the ocean that should be considered further in global estimates and biogeochemical models.
Observational data are available at http://www.iui-eilat.ac.il/Research/NMPMeteoData.aspx (Israel National Monitoring Program (NMP), 2018). The General Ocean Turbulence Model source code is available at https://github.com/gotm-model/code (last access: December 2018), and relevant documentation is available at http://gotm.net (Umlauf et al., 2018). Modified model code for these specific application, model output and code analysis results can be obtained from the corresponding author (angela.kuhn@dal.ca).
The supplement related to this article is available online at: https://doi.org/10.5194/bg-15-7379-2018-supplement.
KF and IBF obtained research funding. All the co-authors contributed to the design of the methodology. AMK configured and performed model experiments, reviewed the relevant literature and wrote the original draft. KF supervised the project development. IBF provided knowledge about the study area and diazotrophic organisms. All the co-authors interpreted results and reviewed and edited the manuscript.
The authors declare that they have no conflict of interest.
We thank the Inter University Institute for Marine
Sciences in Eilat and Amatzia Genin for providing the
observational data, as well as Etai Landou, Boaz Lazar, Stephanie Kienast, Hezi Gildor, Emmanuel Boss, Adi Torfstein and Marlon Lewis for insightful discussions. We gratefully acknowledge financial
support from the Schulich Marine Studies Initiative to Katja Fennel, Ilana Berman-Frank, Boaz Lazar and Marlon Lewis.
Edited by: Jack Middelburg
Reviewed by: Fanny Monteiro and three anonymous referees
Al-Najjar, T., Badran, M. I., Richter, C., Meyerhoefer, M., and Sommer, U.: Seasonal dynamics of phytoplankton in the Gulf of Aqaba, Red Sea, Hydrobiologia, 579, 69–83, 2007.
Amon, R. M. W. and Benner, R.: Photochemical and microbial consumption of dissolved organic carbon and dissolved oxygen in the Amazon River system, Geochim. Cosmochim. Ac., 60, 1783–1792, 1996.
Badran, M. I., Rasheed, M., Manasrah, R., and Al-Najjar, T.: Nutrient flux fuels the summer primary productivity in the oligotrophic waters of the Gulf of Aqaba, Red Sea, Oceanologia, 47, 47–60, 2005.
Benavides, M., Berthelot, H., Duhamel, S., Raimbault, P., and Bonnet, S.: Dissolved organic matter uptake by Trichodesmium in the Southwest Pacific, Sci. Rep., 7, 41315, https://doi.org/10.1038/srep41315, 2017.
Benavides, M., Bonnet, S., Berman-Frank, I., and Riemann, L.: Deep Into Oceanic N2 Fixation, Front. Mar. Sci., 5, 1–4, https://doi.org/10.3389/fmars.2018.00108, 2018.
Ben-Sasson, M., Brenner, S., and Paldor, N.: Estimating air–sea heat fluxes in semienclosed basins: The case of the Gulf of Elat (Aqaba), J. Phys. Oceanogr., 39, 185–202, 2009.
Berman, T., Paldor, N., and Brenner, S.: Simulation of wind-driven circulation in the Gulf of Elat (Aqaba), J. Mar. Syst., 26, 349–365. https://doi.org/10.1016/S0924-7963(00)00045-2, 2000.
Berman, T., Paldor, N., and Brenner, S.: The seasonality of tidal circulation in the Gulf of Elat, Isr. J. Earth Sci., 52, 11–19, 2003.
Berman-Frank, I., Cullen, J. T., Shaked, Y., Sherrell, R. M., and Falkowski, P. G.: Iron availability, cellular iron quotas, and nitrogen fixation in Trichodesmium, Limnol. Oceanogr., 46, 1249–1260, 2001.
Bissett, W. P., Walsh, J. J., Dieterle, D. A., and Carder, K. L.: Carbon cycling in the upper waters of the Sargasso Sea: I. Numerical simulation of differential carbon and nitrogen fluxes, Deep-Sea Res. Pt. I, 46, 205–269, 1999.
Biton, E. and Gildor, H.: The general circulation of the Gulf of Aqaba (Gulf of Eilat) revisited: The interplay between the exchange flow through the Straits of Tiran and surface fluxes, J. Geophys. Res., 116, 1–15, https://doi.org/10.1029/2010JC006860, 2011.
Biton, E., Silverman, J., and Gildor, H.: Observations and modeling of a pulsating density current, Geophys. Res. Lett., 35, 1–5, https://doi.org/10.1029/2008GL034123, 2008.
Bonnet, S., Dekaezemacker, J., Turk-Kubo, K. A., Moutin, T., Hamersley, R. M., Grosso, O., Zehr, J. P., and Capone, D. G.: Aphotic N2 fixation in the eastern tropical South Pacific Ocean, PloS one, 8, e81265, https://doi.org/10.1371/journal.pone.0081265, 2013.
Bonnet, S., Bethelot, H., Turk-Kubo, K., Fawcett, S., Rahav, E., L'Helguen, S., and Berman-Frank, I.: Dynamics of N2 fixation and fate of diazotroph-derived nitrogen in a low-nutrient, low-chlorophyll ecosystem: results from the VAHINE mesocosm experiment (New Caledonia), Biogeosciences, 13, 2653–2673, https://doi.org/10.5194/bg-13-2653-2016, 2016.
Breitbarth, E., Oschlies, A., and LaRoche, J.: Physiological constraints on the global distribution of Trichodesmium – effect of temperature on diazotrophy, Biogeosciences, 4, 53–61, https://doi.org/10.5194/bg-4-53-2007, 2007.
Burchard, H., Bolding, K., and Villarreal, M.: GOTM – a general ocean turbulence model. Theory, applications and test cases (Technical Report No. EUR 18745 EN), European Commission, 1999.
Burkill, P. H., Mantoura, R. F. C., and Owens, N. J. P.: Biogeochemical cycling in the northwestern Indian Ocean: a brief overview, Deep-Sea Res. Pt. II, 40, 643–649, 1993.
Capone, D. G. and Carpenter, E. J.: Nitrogen fixation in the marine environment, Science, 217, 1140–1142, 1982.
Capone, D. G., Zehr, J. P., Paerl, H. W., Bergman, B., and Carpenter, E. J.: Trichodesmium, a globally significant marine cyanobacterium, Science, 276, 1221–1229, 1997.
Capone, D. G., Subramaniam, A., Montoya, J. P., Voss, M., Humborg, C., Johansen, A. M., Siefert, R. L., and Carpenter, E. J.: An extensive bloom of the N2-fixing cyanobacterium Trichodesmium erythraeum in the central Arabian Sea, Mar. Ecol. Prog. Ser., 172, 281–292, 1998.
Capone, D. G., Burns, J. A., Montoya, J. P., Subramaniam, A., Mahaffey, C., Gunderson, T., Michaels, A. F., and Carpenter, E. J.: Nitrogen fixation by Trichodesmium spp.: An important source of new nitrogen to the tropical and subtropical North Atlantic Ocean, Global Biogeochem. Cy., 19, 1–17, https://doi.org/10.1029/2004GB002331, 2005.
Carlson, D. F., Fredj, E., Gildor, H., Biton, E., Steinbuck, J. V., Monismith, S. G., and Genin, A.: Observations of tidal currents in the northern Gulf of Eilat/Aqaba (Red Sea), J. Mar. Syst., 102, 14–28, 2012.
Carlson, D. F., Fredj, E., and Gildor, H.: The annual cycle of vertical mixing and restratification in the Northern Gulf of Eilat/Aqaba (Red Sea) based on high temporal and vertical resolution observations, Deep-Sea Res. Pt. I, 84, 1–17, 2014.
Carpenter, E. J. and McCarthy, J. J.: Nitrogen fixation and uptake of combined nitrogenous nutrients by Oscillatoria (Trichodesmium) thiebutii in the western Sargasso Sea, Limnol. Oceanogr., 20, 389–401, 1975.
Carpenter, E. J., Montoya, J. P., Burns, J.A., Mulholland, M. R., Subramaniam, A., and Capone, D. G.: Extensive bloom of a N2-fixing diatom/cyanobacterial association in the tropical Atlantic Ocean, Mar. Ecol. Prog. Ser., 185, 273–283, 1999.
Carpenter, E. J. and Romans, K.: Major role of the cyanobacterium Trichodesmium in nutrient cycling in the North Atlantic Ocean, Science, 254, 1356–1358, 1991.
Chase, Z., Paytan, A., Johnson, K. S., Street, J., and Chen, Y.: Input and cycling of iron in the Gulf of Aqaba, Red Sea, Global Biogeochem. Cy., 20, 1–11, https://doi.org/10.1029/2005GB002646, 2006.
Chen, Y., Mills, S., Street, J., Golan, D., Post, A., Jacobson, M., and Paytan, A.: Estimates of atmospheric dry deposition and associated input of nutrients to Gulf of Aqaba seawater, J. Geophys. Res.-Atmos., 112, 1–14, https://doi.org/10.1029/2006JD007858, 2007.
Church, M. K., Jenkinks, Bethany D., Karl, D. M., and Zehr, J.: Vertical distributions of nitrogen-fixing phylotypes at Stn ALOHA in the oligotrophic North Pacific Ocean, Aquat. Microb. Ecol., 38, 3–14, 2005.
Denman, K. L.: Modelling planktonic ecosystems: parameterizing complexity, Prog. Oceanogr., 57, 429–452, 2003.
Deutsch, C., Sigman, D. M., Gruber, N., and Dunne, J. P.: Spatial coupling of nitrogen inputs and losses in the ocean, Nature, 445, 163–168, https://doi.org/10.1038/nature05392, 2007.
Dutkiewicz, S., Ward, B. A., Monteiro, F. M., and Follows, M.: Interconnection nitrogen fixers and iron in the Pacific Ocean: Theory and numerical simulations, Global Biogeochem. Cy., 26, 1–16, https://doi.org/10.1029/2011GB004039, 2012.
Dutkiewicz, S., Morris, J., Follows, M. J., Scott, J., Levitan, O., Dyhrman, S. T., and Berman-Frank, I.: Impact of ocean acidification on the structure of future phytoplankton communities, Nat. Clim. Change, 5, 1002–1006, 2015.
Enríquez, S. C. M. D., Duarte, C. M., and Sand-Jensen, K. A. J.: Patterns in decomposition rates among photosynthetic organisms: the importance of detritus C : N : P content, Oecologia, 94, 457–471, 1993.
Eppley, R. W. and Peterson, B. J.: Particulate organic matter flux and planktonic new production in the deep ocean, Nature, 282, 677–680, 1979.
Fahnenstiel, G. L., McCormick, M. J., Lang, G. A., Redalje, D. G., Lohrenz, S. E., Markowitz, M., Wagoner, B., and Carrick, H. J.: Taxon-specific growth and loss rates for dominant phytoplankton populations from the northern Gulf of Mexico, Mar. Ecol. Prog. Ser., Oldendorf, 117, 229–239, 1995.
Falkowski, P. G.: Evolution of the nitrogen cycle and its influence on the biological sequestration of CO2 in the ocean, Nature, 387, 272–274, 1997.
Farnelid, H., Bentzon-Tilia, M., Andersson, A. F., Bertilsson, S., Jost, G., Labrenz, M., Jürgens, K., and Riemann, L.: Active nitrogen-fixing heterotrophic bacteria at and below the chemocline of the central Baltic Sea, ISME J., 7, 1413–1423, https://doi.org/10.1038/ismej.2013.26, 2013.
Fennel, K., Losch, M., Schröter, J., and Wenzel M.: Testing a marine ecosystem model: Sensitivity analysis and parameter optimization, J. Mar. Syst., 28, 45–63, 2001.
Fennel, K., Spitz, Y. H., Letelier, R., and Abbott, M. R.: A deterministic model for N2 fixation at stn. ALOHA in the subtropical North Pacific Ocean, Deep-Sea Res. Pt. II, 49, 149–174, 2002.
Fennel, K., Follows, M., and Falkowski, P. G.: The co-evolution of the nitrogen, carbon and oxygen cycles in the Proterozoic, Ocean. Am. J. Sci., 305, 526–545, 2005.
Fennel, K., Wilkin, J., Levin, J., Moisan, J., O'Reilly, J. E., and Haidvogel, D.: Nitrogen cycling in the Middle Atlantic Bight: Results from a three-dimensional model and implications for the North Atlantic nitrogen budget, Global Biogeochem. Cy., 20, 1–14, https://doi.org/10.1029/2005GB002456, 2006.
Fennel, K., Brady, D., DiToro, D., Fulwiler, R. W., Gardner, W. S., Giblin, A., McCarthy, M. J., Rao, A., Seitzinger, S., Thouvenot-Korppoo, M., and Tobias, C.: Modeling denitrification in aquatic sediments, Biogeochemistry, 93, 159–178, 2009.
Fennel, K., Hu, J., Laurent, A., Marta-Almeida, M., and Hetland, R.: Sensitivity of hypoxia predictions for the northern Gulf of Mexico to sediment oxygen consumption and model nesting, J. Geophys. Res.-Ocean., 118, 990–1002, 2013.
Fernandez, C., Farías, L., and Ulloa, O.: Nitrogen fixation in denitrified marine waters, PloS one, 6, e20539, https://doi.org/10.1371/journal.pone.0020539, 2011.
Fernández-Castro, B., Pahlow, M., Mouriño-Carballido, B., Marañón, E., and Oschlies, A.: Optimality-based Trichodesmium diazotrophy in the North Atlantic subtropical gyre, J. Plank. Res., 38, 946–963, 2016.
Foster, R. A., Paytan, A., and Zehr, J. P.: Seasonality of N2 fixation and nifH gene diversity in the Gulf of Aqaba (Red Sea), Limnol. Oceanogr., 54, 219–233, 2009.
Fuller, N. J., West, N. J., Marie, D., Yallop, M., Rivlin, T., Post, A. F., and Scanlan, D. J.: Dynamics of community structure and phosphate status of picocyanobacterial populations in the Gulf of Aqaba, Red Sea, Limnol. Oceanogr., 50, 363–375, 2005.
Garcia, H. E. and Gordon, L. I.: Oxygen solubility in seawater: Better fitting equations, Limnol. Oceanogr., 37, 1307–1312, 1992.
Geider, R. J., MacIntyre, H. L., and Kana, T. M.: Dynamic model of phytoplankton growth and acclimation: responses of the balanced growth rate and the chlorophyll a: carbon ratio to light, nutrient-limitation and temperature, Mar. Ecol. Prog. Ser., 148, 187–200, 1997.
Genin, A. and Paldor, N.: Changes in the circulation and current spectrum near the tip of the narrow, seasonally mixed Gulf of Elat, Isr. J. Earth. Sci., 47, 87–92, 1998.
Gifford, D. J., Fessenden, L. M., Garrahan, P. R., and Martin, E.: Grazing by microzooplankton and mesozooplankton in the high-latitude North Atlantic Ocean: Spring versus summer dynamics, J. Geophys. Res.-Ocean., 100, 6665–6675, 1995.
Gordon, N., Angel, D. L., Neori, A., Kress, N., and Kimor, B.: Heterotrophic dinoflagellates with symbiotic cyanobacteria and nitrogen limitation in the Gulf of Aqaba, Mar. Ecol. Prog. Ser., 107, 83–88, 1994.
Gregg, W. W.: Assimilation of SeaWiFS ocean chlorophyll data into a three-dimensional global ocean model, J. Mar. Syst., 69, 205–225, 2008.
Gruber, N. and Galloway, J. N.: An Earth-system perspective of the global nitrogen cycle, Nature, 451, 293–296, 2008.
Gruber, N. and Sarmiento, J. L.: Global patterns of marine nitrogen fixation and denitrification, Global Biogeochem. Cy., 11, 235–266, 1997.
Haug, G. H., Pedersen, T. F., Sigman, D. M., Calvert, Nielsen, B., and Peterson, L. C.: Glacial/interglacial variations in production in nitrogen fixation in the Cariaco Basin during the last 580 kyr, Paleoceanography, 13, 427–432, 1998.
Hong, H., Shen, R., Zhang, F., Wen, Z., Chang, S., Lin, W., and Shi, D.: The complex effects of ocean acidification on the prominent N2-fixing cyanobacterium Trichodesmium, Science, 356, 527–531, 2017.
Hood, R., Bates, N. R., Capone, D. G., and Olson, D. B.: Modeling the effect of nitrogen fixation on carbon and nitrogen fluxes BATS, Deep-Sea Res. Pt. II, 48, 1609–1648, 2001.
Houck, C. R., Joines, J. A., and Kay, M. G.: A genetic algorithm for function optimization: A Matlab implementation (Technical Report No. NCSU-IE-TR-95-09), North Carolina State University, Raleigh, NC, 1995.
Hutchins, D. A., Fu, F.-X., Zhang, Y., Warner, M. E., Feng, Y., Portune, K., Bernhardt, P., and Mullholland, M. R.: CO2 control of Trichodesmium N2 fixation, photosynthesis, growth rates, and elemental ratios: Implications for past, present, and future ocean biogeochemistry, Limnol. Oceanogr., 52, 1293–1304, 2007.
Iluz, D.: Primary production of phytoplankton in the northern Gulf of Eilat, Red Sea, MSc thesis, Bar-Ilan University, Ramat-Gan (in Hebrew with English abstract), 1991.
Iluz, D., Dishon, G., Capuzzo, E., Meeder, E., Astoreca, R., Montecino, V., Znachor, P., Ediger, D., and Marra, J.: Short-term variability in primary productivity during a wind-driven diatom bloom in the Gulf of Eilat (Aqaba), Aquat. Microb. Ecol., 56, 205–215, 2009.
Israel National Monitoring Program (NMP): Refered to “Meteorological data” and “Ecological and oceanographic data”, available at: http://www.iui-eilat.ac.il/Research/NMPMeteoData.aspx, last access: December 2018.
Jayakumar, A., Al-Rshaidat, M. M. D., Ward, B. B., and Mulholland, M. R.: Diversity, distribution, and expression of diazotroph nifH genes in oxygen-deficient waters of the Arabian Sea, FEMS Microbiol. Ecol., 82, 597–606, https://doi.org/10.1111/j.1574-6941.2012.01430.x, 2012.
Karl, D.: Nutrient dynamics in the deep blue sea, TRENDS Microbiol., 10, 410–418, 2002.
Karl, D., Letelier, R., Tupas, L., Dore, J., Christian, J., and Hebel, D. The role of nitrogen fixation in biogeochemical cycling in the subtropical North Pacific Ocean, Nature, 388, 533–538, 1997.
Kerbrat, A. S., Darius, H. T., Pauillac, S., Chinain, M., and Laurent, D.: Detection of ciguatoxin-like and paralysing toxins in Trichodesmium spp. from New Caledonia lagoon, Mar. Pollut. Bull., 61, 360–366, 2010.
Kerbrat, A. S., Amzil, Z., Pawlowiez, R., Golubic, S., Sibat, M., Darius, H. T., Chinain, M., and Laurent, D.: First Evidence of Palytoxin and 42-Hydroxy-palytoxin in the Marine Cyanobacterium Trichodesmium, Mar. Drugs, 9, 543–560, https://doi.org/10.3390/md9040543, 2011.
Kimor, B. and Golandsky, B.: Microplankton of the Gulf of Elat: aspects of seasonal and bathymetric distribution, Mar. Biol., 42, 55–67, 1977.
Kimor, B., Gordon, N., and Neori, A.: Symbiotic associations among the microplankton in oligotrophic marine environments, with special reference to the Gulf of Aqaba, Red Sea, J. Plank. Res., 14, 1217–1231, 1992.
Klinker, J., Reiss, Z., Kropach, C., Levanon, I., Harpaz, H., Halicz, E., and Assaf, G.: Observations on the circulation pattern in the Gulf of Elat (Aqaba), Red Sea, Isr. J. Earth Sci., 25, 85–103, 1976.
Kranz, S. A., Levitan, O., Richter, K. U., Prášil, O., Berman-Frank, I., and Rost, B.: Combined effects of CO2 and light on the N2-fixing cyanobacterium Trichodesmium IMS101: physiological responses, Plant Physiol., 154, 334–345, 2010.
Kreus, M., Schartau, M., Engel, A., Nausch, M., and Voss, M. Variations in the elemental ratio of organic matter in the central Baltic Sea: Part I – Linking primary production to remineralization, Cont. Shelf Res., 100, 25–45, 2015.
Kuhn, A. M., Fennel, K., and Mattern, J. P.: Model investigations of the North Atlantic spring bloom initiation, Prog. Oceanogr., 138, 176–193, 2015.
Labiosa, R. G., Arrigo, K. R., Genin, A., Monismith, S. G., and van Dijken, G.: The interplay between upwelling and deep convective mixing in determining the seasonal phytoplankton dynamics in the Gulf of Aqaba: Evidence from SeaWiFS and MODIS, Limnol. Oceanogr., 48, 2355–2368, 2003.
Landry, M. R., Hasset, R. P., Fagerness, V., Downs, J., and Lorenzen, C. J.: Effect of food acclimation on assimilation efficiency of Calanus pacificus, Limnol. Oceanogr., 29, 361–364, 1984.
Langlois, R., Großkopf, T., Mills, M., Takeda, S., and LaRoche, J.: Widespread distribution and expression of Gamma A (UMB), an uncultured, diazotrophic, γ-proteobacterial nifH phylotype, PLoS One, 10, e0128912, https://doi.org/10.1371/journal.pone.0128912, 2015.
Lazar, B., Erez, J., Silverman, J., Rivlin, T., Rivlin, A., Dray, M., Meeder, E., and Iluz, D.: Recent environmental changes in the chemical-biological oceanography of the Gulf of Aqaba (Eilat), Aqaba-Eilat Improbable Gulf Environment, Biodiversity and Preservation, Magnes Press, Jerusalem, 49–62, 2008.
Lee, K., Karl, D. M., Wanninkhof, R., and Zhang, J. Z.: Global estimates of net carbon production in the nitrate-depleted tropical and subtropical oceans, Geophys. Res. Lett., 29, 1–4, https://doi.org/10.1029/2001GL014198, 2002.
Levanon-Spanier, I., Padan, E., and Reiss, Z.: Primary production in a desert-enclosed sea-the Gulf of Elat (Aqaba), Red Sea, Deep-Sea Res. Pt. I, 26, 673–685, 1979.
Levitan, O., Rosenberg, G., Setlik, I., Setlikova, E., Grigel, J., Klepetar, J., Prasil, O., and Berman-Frank, I.: Elevated CO2 enhances nitrogen fixation and growth in the marine cyanobacterium Trichodesmium, Glob. Change Biol., 13, 531–538, 2007.
Lima, I. D. and Doney, S. C.: A three-dimensional, multinutrient, and size-structured ecosystem model for the North Atlantic, Global Biogeochem. Cy., 18, 1–21, https://doi.org/10.1029/2003GB002146, 2004.
Lindell, D. and Post, A. F.: Ultraphytoplankton succession is triggered by deep winter mixing in the Gulf of Aqaba (Eilat), Red Sea, Limnol. Oceanogr., 40, 1130–1141, 1995.
Loescher, C. R., Großkopf, T., Desai, F. D., Gill, D., Schunck, H., Croot, P. L., Schlosser, C., Neulinger, S. C., Pinnow, N., Lavik, G., and Kuypers, M. M.: Facets of diazotrophy in the oxygen minimum zone waters off Peru, ISME J., 8, 2180–2192, https://doi.org/10.1038/ismej.2014.71, 2014
Luo, Y.-W., Doney, S. C., Anderson, L. A., Benavides, M., Berman-Frank, I., Bode, A., Bonnet, S., Boström, K. H., Böttjer, D., Capone, D. G., Carpenter, E. J., Chen, Y. L., Church, M. J., Dore, J. E., Falcón, L. I., Fernández, A., Foster, R. A., Furuya, K., Gómez, F., Gundersen, K., Hynes, A. M., Karl, D. M., Kitajima, S., Langlois, R. J., LaRoche, J., Letelier, R. M., Marañón, E., McGillicuddy Jr., D. J., Moisander, P. H., Moore, C. M., Mouriño-Carballido, B., Mulholland, M. R., Needoba, J. A., Orcutt, K. M., Poulton, A. J., Rahav, E., Raimbault, P., Rees, A. P., Riemann, L., Shiozaki, T., Subramaniam, A., Tyrrell, T., Turk-Kubo, K. A., Varela, M., Villareal, T. A., Webb, E. A., White, A. E., Wu, J., and Zehr, J. P.: Database of diazotrophs in global ocean: abundance, biomass and nitrogen fixation rates, Earth Syst. Sci. Data, 4, 47–73, https://doi.org/10.5194/essd-4-47-2012, 2012.
Mackey, K. R., Labiosa, R. G., Calhoun, M., Street, J. H., Post, A. F., and Paytan, A.: Phosphorus availability, phytoplankton community dynamics, and taxon-specific phosphorus status in the Gulf of Aqaba, Red Sea, Limnol. Oceanogr., 52, 873–885, 2007.
Mackey, K. R., Rivlin, T., Grossman, A. R., Post, A. F., and Paytan, A.: Picophytoplankton responses to changing nutrient and light regimes during a bloom, Mar. Biol., 156, 1531–1546, 2009.
Manasrah, R., Raheed, M., and Badran, M. I.: Relationships between water temperature, nutrients and dissolved oxygen in the northern Gulf of Aqaba, Red Sea, Oceanologia, 48, 237–253, 2006.
Meeder, E., Mackey, K. R., Paytan, A., Shaked, Y., Iluz, D., Stambler, N., Rivlin, T., Post, A. F., and Lazar, B.: Nitrite dynamics in the open ocean-clues from seasonal and diurnal variations, Mar. Ecol. Prog. Ser., 453, 11–26, https://doi.org/10.3354/meps09525, 2012.
Michaelis, L. and Menten, M. L.: The kinetics of the inversion effect, Biochem. Z., 49, 333–369, 1913.
Michaels, A. F., Olson, D., Sarmiento, J. L., Ammerman, J. W., Fanning, K., Jahnke, R., Knap, A. H., Lipschultz, F., and Prospero, J. M.: Inputs, losses and transformations of nitrogen and phosphorus in the pelagic North Atlantic Ocean, in: Nitrogen Cycling in the North Atlantic Ocean and Its Watersheds, Springer, 181–226, 1996.
Moisander, P., Beinart, R. A., Hewson, I., White, A. E., Johnson, K. S., Carlson, C. A., Montoya, J. P., and Zehr, J. P.: Unicellular cyanobacterial distribution broaden the oceanic N2 fixation domain, Science, 327, 1512–1514, 2010.
Moisander, P., Benavides, M., Bonnet, S., and Berman-Frank, I.: Chasing after Non-cyanobacterial Nitrogen Fixation in Marine Pelagic Environments, Front. Microbiol., 8, 1736, https://doi.org/10.3389/fmicb.2017.01736, 2017.
Monismith, S. G. and Genin, A.: Tides and sea level in the Gulf of Aqaba (Eilat), J. Geophys. Res.-Ocean., 109, 1–6, https://doi.org/10.1029/2003JC002069, 2004.
Monteiro, F. M. and Follows, M. J.: On nitrogen fixation and preferential remineralization of phosphorus, Geophys. Res. Lett., 39, L06607, https://doi.org/10.1029/2012GL050897, 2012.
Monteiro, F. M., Follows, M., and Dutkiewicz, S.: Distribution of diverse nitrogen fixers in the global ocean, Global Biogeochem. Cy., 24, GB3017, https://doi.org/10.1029/2009GB003731, 2010.
Montoya, J. P., Holl, C. M., Zehr, J. P., Hansen, A., Villareal, T. A., and Capone, D. G.: High rates of N2 fixation by unicellular diazotrophs in the oligotrophic Pacific Ocean, Nature, 420, 1027–1032, 2004.
Moore, J. K., Doney, S. C., Kleypas, J. C., Glover, D. M., and Fung, I. Y.: An intermediate complexity marine ecosystem model for the global domain, Deep-Sea Res. Pt. II, 49, 403–462, 2002.
Moore, J. K., Doney, S., and Lindsay, K.: Upper ocean ecosystem dynamics and iron cycling in a global three-dimensional model, Global Biogeochem. Cy., 18, GB4028, https://doi.org/10.1029/2004GB002220, 2004.
Morrison, J. M., Codispoti, L. A., Gaurin, S., Jones, B., Manghnani, V., and Zheng, Z.: Seasonal variation of hydrographic and nutrient fields during the US JGOFS Arabian Sea Process Study, Deep-Sea Res. Pt. II, 45, 2053–2101, 1998.
Morrison, J. M., Codispoti, L. A., Smith, S. L., Wishner, K., Flagg, C., Gardner, W. D., Gaurin, S., Naqvi, S. W. A., Manghnani, V., Prosperie, L., and Gundersen, J. S.: The oxygen minimum zone in the Arabian Sea during 1995, Deep-Sea Res. Pt. II, 46, 1903–1931, 1999.
Naqvi, S. W. A.: Denitrification processes in the Arabian Sea, Proc. Indian Acad. Sci., 103, 279–300, 1994.
Naqvi, S. W. A., Hansen, H. P., and Kureishy, T. W.: Nutrient-uptake and regeneration ratios in the Red-Sea with reference to the nutrient budgets, Oceanol. Acta, 9, 271–275, 1986.
Nielsen, S. L.: Size-dependent growth rates in eukaryotic and prokaryotic algae exemplified by green algae and cyanobacteria: comparisons between unicells and colonial growth forms, J. Plank. Res., 28, 489–498, 2006.
O'Neil, J. M. and Roman, M. R.: Ingestion of the cyanobacterium Trichodesmium spp. by pelagic harpacticoid copepods Macrosetella, Miracia and Oculosetella, Ecology and Morphology of Copepods, Springer, 235–240, 1994.
Pomeroy, L. R. and Wiebe, W. J.: Temperature and substrates as interactive limiting factors for marine heterotrophic bacteria, Aquat. Microb. Ecol., 23, 187–204, 2001.
Post, A. F., Dedej, Z., Gottlieb, R., Li, H., Thomas, D. N., El-Absawi, M., El-Naggar, A., El-Gharabawi, M., and Sommer, U.: Spatial and temporal distribution of Trichodesmium spp. in the stratified Gulf of Aqaba, Red Sea, Mar. Ecol. Prog. Ser., 239, 241–250, 2002.
Rahav, E., Bar-Zeev, E., Ohayion, S., Elifantz, H., Belkin, N., Herut, B., Mulholland, M. R., and Berman-Frank, I. R.: Dinitrogen fixation in aphotic oxygenated marine environments, Front. Microbiol., 4, 1–11, https://doi.org/10.3389/fmicb.2013.00227, 2013.
Rahav, E., Herut, B., Mulholland, M. R., Belkin, N., Elifantz, H., and Berman-Frank, I.: Heterotrophic and autotrophic contribution to dinitrogen fixation in the Gulf of Aqaba, Mar. Ecol. Prog. Ser., 522, 67–77, 2015.
Riemann, L., Farnelid, H., and Steward, G. F.: Nitrogenase genes in non-cyanobacterial plankton: prevalence, diversity and regulation in marine waters, Aquat. Microb. Ecol., 61, 235–247, 2010.
Rubin, M., Berman-Frank, I., and Shaked, Y.: Dust-and mineral-iron utilization by the marine dinitrogen-fixer Trichodesmium, Nat. Geosci., 4, 529–534, 2011.
Schartau, M. and Oschlies, A.: Simultaneous data-based optimization of a 1D-ecosystem model at three locations in the North Atlantic: Part I – Method and parameter estimates, J. Mar. Res., 61, 765–793, 2003.
Silverman, J. and Gildor, H.: The residence time of an active versus a passive tracer in the Gulf of Aqaba: A box model approach, J. Mar. Syst., 71, 159–170, 2008.
Smayda, T. and Bienfang, P. K.: Suspension properties of various phyletic groups of phytoplankton and tintinnids in an oligotrophic, subtropical system, Mar. Ecol., 4, 289–300, 1983.
Smith, E. L.: Photosynthesis in relation to light and carbon dioxide, P. Natl. Acad. Sci. USA, 22, 504–511, 1936.
Tande, K. S. and Slagstad, D.: Assimilation efficiency in herbivorous aquatic organisms – The potential of the ratio method using 14C and biogenic silica as markers, Limnol. Oceanogr., 30, 1093–1099, 1985.
Torfstein, A. and Kienast, S. S.: No Correlation Between Atmospheric Dust and Surface Ocean Chlorophyll-a in the Oligotrophic Gulf of Aqaba, Northern Red Sea, J. Geophys. Res.-Biogeo., 123, 391–405, 2018.
Turk-Kubo, K. A., Frank, I. E., Hogan, M. E., Desnues, A., Bonnet, S., and Zehr, J. P.: Diazotroph community succession during the VAHINE mesocosm experiment (New Caledonia lagoon), Biogeosciences, 12, 7435–7452, https://doi.org/10.5194/bg-12-7435-2015, 2015.
Umlauf, L., Burchard, H., and Bolding, K.: GOTM sourcecode and test case documentation Version 4.0, available at: http://gotm.netTS3, last access: December 2018.
Veldhuis, M. J. W, Timmermans, K. R., Croot, P., and van der Wagt, B.: Picophytoplankton; a comparative study of their biochemical composition and photosynthetic properties, J. Sea Res., 53, 7–24, 2005.
Wanninkhof, R. and McGillis, W. R.: A cubic relationship between air-sea CO2 exchange and wind speed, Geophys. Res. Lett., 26, 1889–1892, 1999.
Ward, B. A., Friedrichs, M. A. M., Anderson, T. R., and Oschlies, A.: Parameter optimization techniques and the problem of underdetermination in marine biogeochemical models, J. Mar. Syst., 81, 34–43, 2010.
Ward, B. A., Dutkiewicz, S., Moore, C. M., and Follows, M.: Iron, phosphorus, and nitrogen supply ratios define the biogeography of nitrogen fixation, Limnol. Oceanogr., 58, 2059–2075, 2013.
Wolf-Vecht, A., Paldor, N., and Brenner, S.: Hydrographic indications of advection/convection effects in the Gulf of Elat, Deep-Sea Res. Pt. I, 39, 1393–1401, 1992.
Yahel, G., Post, A. F., Fabricius, K., Marie, D., Vaulot, D., and Genin, A.: Phytoplankton distribution and grazing near coral reefs, Limnol. Oceanogr., 43, 551–563, 1998.
Zarubin, M., Lindemann, Y., and Genin, A.: The dispersion-confinement mechanism: Phytoplankton dynamics and the spring bloom in a deeply-mixing subtropical sea, Prog. Oceanogr., 155, 13–27, 2017.
Zehr, J. P.: Nitrogen fixation by marine cyanobacteria, Curr. Trend. Microbiol., 19, 162–173, 2011.
Zehr, J. P. and Ward, B. B.: Nitrogen cycling in the ocean: new perspectives on processes and paradigms, Appl. Environ. Microbiol., 68, 1015–1024, 2002.
Zehr, J. P., Mellon, M. T., and Zani, S.: New Nitrogen-Fixing Microorganisms Detected in Oligotrophic Oceans by Amplification of Nitrogenase (nifH) Genes, Appl. Environ. Microbiol., 64, 3444–3450, 1998.
Zehr, J. P., Carpenter, E. J., and Villareal, T. A.: New perspectives on nitrogen-fixing microorganisms in tropical and subtropical oceans, Curr. Trend. Microbiol., 8, 68–73, 2000.
Zehr, J. P., Waterbury, J. B., Turner, P., Montoya, J. P., Omoregie, E., Steward, G. F., Hansen, A., and Karl, D. M.: Unicellular cyanobacteria fix N2 in the subtropical North Pacific Ocean, Nature, 412, 635–637, 2001.
Zehr, J. P., Bench, S. R., Carter, B. J., Hewson, I., Niazi, F., Shi, T., Tripp, H. J., and Affourtit, J.: Globally distributed uncultivated oceanic N2-fixing cyanobacteria lack ocygenic photosystem II, Science, 322, 1110–1112, 2008.