the Creative Commons Attribution 4.0 License.
the Creative Commons Attribution 4.0 License.
 | 23 May 2019
Latitudinal variations in δ30Si and δ15N signatures along the Peruvian shelf: quantifying the effects of nutrient utilization versus denitrification over the past 600 years
Claudia Ehlert
Philippe Martinez
Martin Frank
Ralph Schneider
The stable sedimentary nitrogen isotope compositions of bulk organic matter (δ15Nbulk) and the silicon isotope composition of diatoms (δ30SiBSi) both mainly reflect the degree of past nutrient utilization by primary producers. However, in ocean areas where anoxic and suboxic conditions prevail, the δ15Nbulk signal ultimately recorded within the sediments is also influenced by water column denitrification, causing an increase in the subsurface δ15N signature of dissolved nitrate () upwelled to the surface. Such conditions are found in the oxygen minimum zone off the coast of Peru, where, at present, an increase in subsurface from north to south along the shelf is observed due to ongoing denitrification within the poleward-flowing subsurface waters, while the δ30Si signature of silicic acid (δ30Si(OH)4) at the same time remains unchanged.
Here, we present three new δ30SiBSi records between 11 and 15∘ S and compare these to previously published δ30SiBSi and δ15Nbulk records from Peru covering the past 600 years. We present a new approach to calculate past subsurface signatures based on the direct comparison of δ30SiBSi and δ15Nbulk signatures at a latitudinal resolution for different time periods. Our results show that, during the Current Warm Period (CWP, since 1800 CE) and prior short-term arid events, source water compositions have been close to modern values, increasing southward from 7 to 10 ‰ (between 11 and 15∘ S). In contrast, during the Little Ice Age (LIA) we calculate low values between 6 ‰ and 7.5 ‰. Furthermore, the direct δ30SiBSi versus δ15Nbulk comparison also enables us to relate the short-term variability in both isotope compositions to changes in the ratio of nutrients () taken up by different dominating phytoplankton groups (diatoms and non-siliceous phytoplankton) under the variable climatic conditions of the past 600 years. Accordingly, we estimate a shift from a 1:1 (or 1:2) ratio during the CWP and a 2:1 (up to 15:1) ratio during the LIA, associated with a shift from overall high nutrient utilization to -dominated (and thus non-siliceous phytoplankton) utilization.
- Article
(6249 KB) - Full-text XML
-
Supplement
(155 KB) - BibTeX
- EndNote


Investigations of the isotopic compositions of the macro-nutrients, such as silicic acid (Si(OH)4) and nitrate (), have been used to infer changes of biogeochemical cycles in the past (Brunelle et al., 2007; Horn et al., 2011; Robinson et al., 2014). The preferential incorporation of the lighter isotopes 14N and 28Si into organic matter (OM) and biogenic opal (BSi), respectively, during primary production in surface waters leads to an increase in the δ15N and δ30Si in the remaining dissolved nutrients (i.e., and δ30Si(OH)4), as a result of progressive consumption of the nutrient pools (Altabet et al., 1991; De La Rocha et al., 1997; Wada and Hattori, 1978). This preferential incorporation is associated with an approximate enrichment factor of −5 ‰ for (Waser et al., 1998) and −1.1 ‰ for Si(OH)4 (De La Rocha et al., 1997), which agree well with estimates for the Peruvian shelf (Ehlert et al., 2012; Mollier-Vogel et al., 2012; Grasse et al., 2016). While a potential fractionation of δ30Si signatures of biogenic opal during dissolution of −0.55 ‰ has been reported previously (Demarest, 2009), investigations from the water column of the Southern Ocean did not find significant difference between the δ30Si values of particles in the water column and in surface sediments (Varela et al., 2004; Fripiat et al., 2012; Closset et al., 2015). Furthermore, field studies and laboratory experiments based on sediments have so far indicated that δ30Si signatures of diatoms within the sediments are generally unaffected by diagenetic alteration (e.g., Egan et al., 2012; Wetzel et al., 2014; Ehlert et al., 2016). Accordingly, the degree of utilization of and Si(OH)4 is recorded in the δ15Nbulk and δ30SiBSi of the organic matter (OM) and BSi produced. In combination with parameters such as organic carbon, BSi or barium accumulation rates, both δ15Nbulk and δ30SiBSi have been employed as proxies for the evaluation of past productivity and corresponding nutrient utilization (De La Rocha et al., 1998; François et al., 1992; Horn et al., 2011; Pichevin et al., 2005).
However, in coastal upwelling areas, where upwelling of nutrient-rich subsurface waters causes high surface productivity, subsequent degradation of the high amounts of OM leads to extensive oxygen consumption in the water column (Pennington et al., 2006; Zuta and Guillén, 1970). As a result of the low oxygen concentrations, is used as an oxidant during OM degradation and is transferred to N2, leading to a net loss of bioavailable nitrogen, e.g., denitrification and anaerobe ammonium oxidation (Codispoti, 2007; Lam et al., 2009). Due to the high isotope fractionation factor ( ‰) associated with denitrification, the signatures of subsurface waters strongly increase and consequently supply a heavy signal to surface waters during upwelling (Cline and Kaplan, 1975). This 15N-enriched is incorporated by phytoplankton and ultimately deposited and buried in marine sediments. Accordingly, although δ15Nbulk also varied in phase with productivity proxies, elevated δ15Nbulk values in highly productive and poorly ventilated regions, including most of the coastal upwelling areas, have been generally interpreted as the consequence of stronger denitrification associated with intense oxygen depletion (Agnihotri et al., 2006, 2008; De Pol-Holz et al., 2007; Fleury et al., 2015; Gutiérrez et al., 2009; Mollier-Vogel et al., 2012; Salvatteci et al., 2014b). However, given that dissolved is influenced by both nutrient utilization and denitrification – associated with water column deoxygenation – both processes should also influence the δ15Nbulk signatures recorded by the sedimentary OM.
In contrast, δ30SiBSi signatures are primarily controlled by surface water diatom productivity and Si(OH)4 utilization (Brzezinski, 2002; De La Rocha et al., 1998), closely coupled to the amount of upwelling strength in the study area (Doering et al., 2016; Ehlert et al., 2013, 2015, 2012; Grasse et al., 2013). Accordingly, downcore records of δ30SiBSi off the coast of Peru are closely coupled to changes in the diatom assemblage, with high signatures (>1 ‰) reflecting strong upwelling conditions and lower signatures (0.5 ‰–1 ‰) reflecting weak upwelling conditions (Doering et al., 2016). This coupling was previously shown to be mainly the consequence of changes in the relative abundance of different diatom groups during diatom succession linked to different upwelling strength (Doering et al., 2016) rather than potential species-specific fractionation (Sutton et al., 2013).
Thus, the combination of both δ30SiBSi and δ15Nbulk compositions in the water column and late Quaternary sediments off the coast of Peru has been applied as a measure to disentangle modern and past nutrient utilization and denitrification processes (Ehlert et al., 2015; Grasse et al., 2016). Comparison of modern dissolved Si(OH)4 and distributions and their corresponding isotopic ratios has shown that Si(OH)4 and concentrations and their stable isotopic signatures are strongly correlated within the surface mixed layer at nearshore and offshore areas, indicating that the signal preserved in the sediments depends on the degree of utilization of both nutrients (Grasse et al., 2016). Similarly, an initial comparison for the past 600 years based on one sediment core indicated that both isotope compositions were largely influenced by nutrient utilization, suggesting that denitrification in the water column only had a significant influence since ∼1850 CE (Ehlert et al., 2015), thus partly contradicting previous interpretations of N-loss having been the main driver of changes in past δ15Nbulk records.
At present, the features of the Peruvian upwelling system vary significantly with the El Niño–Southern Oscillation (ENSO) on interannual timescales. During warm phases of ENSO (El Niño) a weakening of the trade winds over the equatorial Pacific and an eastward displacement of the West Pacific warm pool (Picaut et al., 1996) cause warmer sea surface temperature anomalies in the central and eastern Pacific Ocean. Off the coast of Peru this causes the mixed layer (and thermocline/nutricline) depth to increase, decreasing the nutrient content ( and iron, Fe) of upwelled waters and leading to a decrease in phytoplankton (mainly diatoms) abundance and productivity (Barber and Chávez, 1983; Chavez, 1989; Espinoza-Morriberón et al., 2017; Sanchez et al., 2000). In contrast, the cold phases of ENSO (La Niña) are associated with a stronger Walker circulation (west–east or zonal) and upwelling-favorable winds off the coast of Peru, resulting in negative sea surface temperature (SST) anomalies (Morón, 2000), a thermocline shoaling and higher phytoplankton productivity (Espinoza-Morriberón et al., 2017). Similar conditions have been reported to alternate on the multicentennial timescales during Northern Hemisphere cold and warm periods. These so-called El Niño- and La Niña-like mean states reflect larger-scale oceanographic and climatic changes (Fleury et al., 2015; Rein, 2004; Yan et al., 2011). Accordingly, the climate of the last 600 years can be divided into two climatic phases consisting of the Current Warm Period (CWP, since 1800 CE) and the Little Ice Age (LIA, ca. 1400 to 1800 CE). Off the coast of Peru, the CWP has been characterized by dry (arid) conditions, strong upwelling intensity, as well as high productivity and intense N-loss processes, reflecting overall dominant La Niña conditions (Fleury et al., 2015; Salvatteci et al., 2014b; Sifeddine et al., 2008). In contrast, within the present day main upwelling area between 10 and 15∘ S, the LIA was characterized by lower productivity and low denitrification intensity for the present day main upwelling area between 10 and 15∘ S (Díaz-Ochoa et al., 2009; Salvatteci et al., 2014b; Sifeddine et al., 2008). Previous paleo-reconstructions agreed that these conditions were induced by weakening of the Walker circulation and reduction of the South Pacific Subtropical High (SPSH), as well as by a southward shift of the mean position of the Intertropical Convergence Zone (ITCZ) and the associated precipitation belt (Fleury et al., 2015; Sachs et al., 2009; Salvatteci et al., 2014b; Sifeddine et al., 2008). These changes resulted in reduced LIA surface productivity and more oxygenated subsurface waters off the coast of Peru, as reflected by lower sedimentary BSi and total organic carbon (TOC) concentrations (Ehlert et al., 2015; Gutiérrez et al., 2009; Salvatteci et al., 2014a) and Si∕Fe ratios (Fleury et al., 2015) and supported by a marked reduction in the sedimentary concentrations of redox sensitive trace metals such as molybdenum and rhenium (Salvatteci et al., 2014b; Sifeddine et al., 2008). However, these conditions did not prevail continuously but instead short-term variations during both the LIA and the CWP are, for example, mirrored by changes in diatom abundances, productivity sensitive element ratios indicative of productivity changes (Br∕Fe) and δ15Nbulk values (Fleury et al., 2015). These proxy records indicate multidecadal shifts between arid and humid conditions during the CWP and during the LIA when pronounced short-term periods of arid conditions occurred in particular (Fleury et al., 2015). The well-studied biogeochemical evolution of the Peruvian shelf over the last 600 years and the significant differences in productivity and subsurface oxygenation between the CWP and the LIA form the basis for our study to gain new insights into the relationship between nutrient utilization and denitrification via δ30SiBSi and δ15Nbulk records.
Here, our goal is to verify whether the southward increase in due to denitrification observed in the present day has persisted during the marked changes in upwelling intensity during the LIA and CWP, and therefore under different ENSO conditions, based on comparison of δ30SiBSi and δ15Nbulk signatures of four different sediment cores retrieved along the entire gradient of upwelling strength of the southern Peruvian shelf. More specifically, we aim to detect the extent of variability in δ15Nbulk caused as a function of denitrification and nutrient utilization during specific time periods (i.e., LIA and CWP). Therefore, we present three new records for δ30SiBSi and BSi concentrations from the Peruvian shelf between 11 and 15∘ S covering the last 600 years. These are compared to previously published δ15Nbulk data obtained from the same cores (Fleury et al., 2015) and δ30SiBSi and δ15Nbulk records from a fourth core from 14∘ S (Fig. 1; Ehlert et al., 2015).
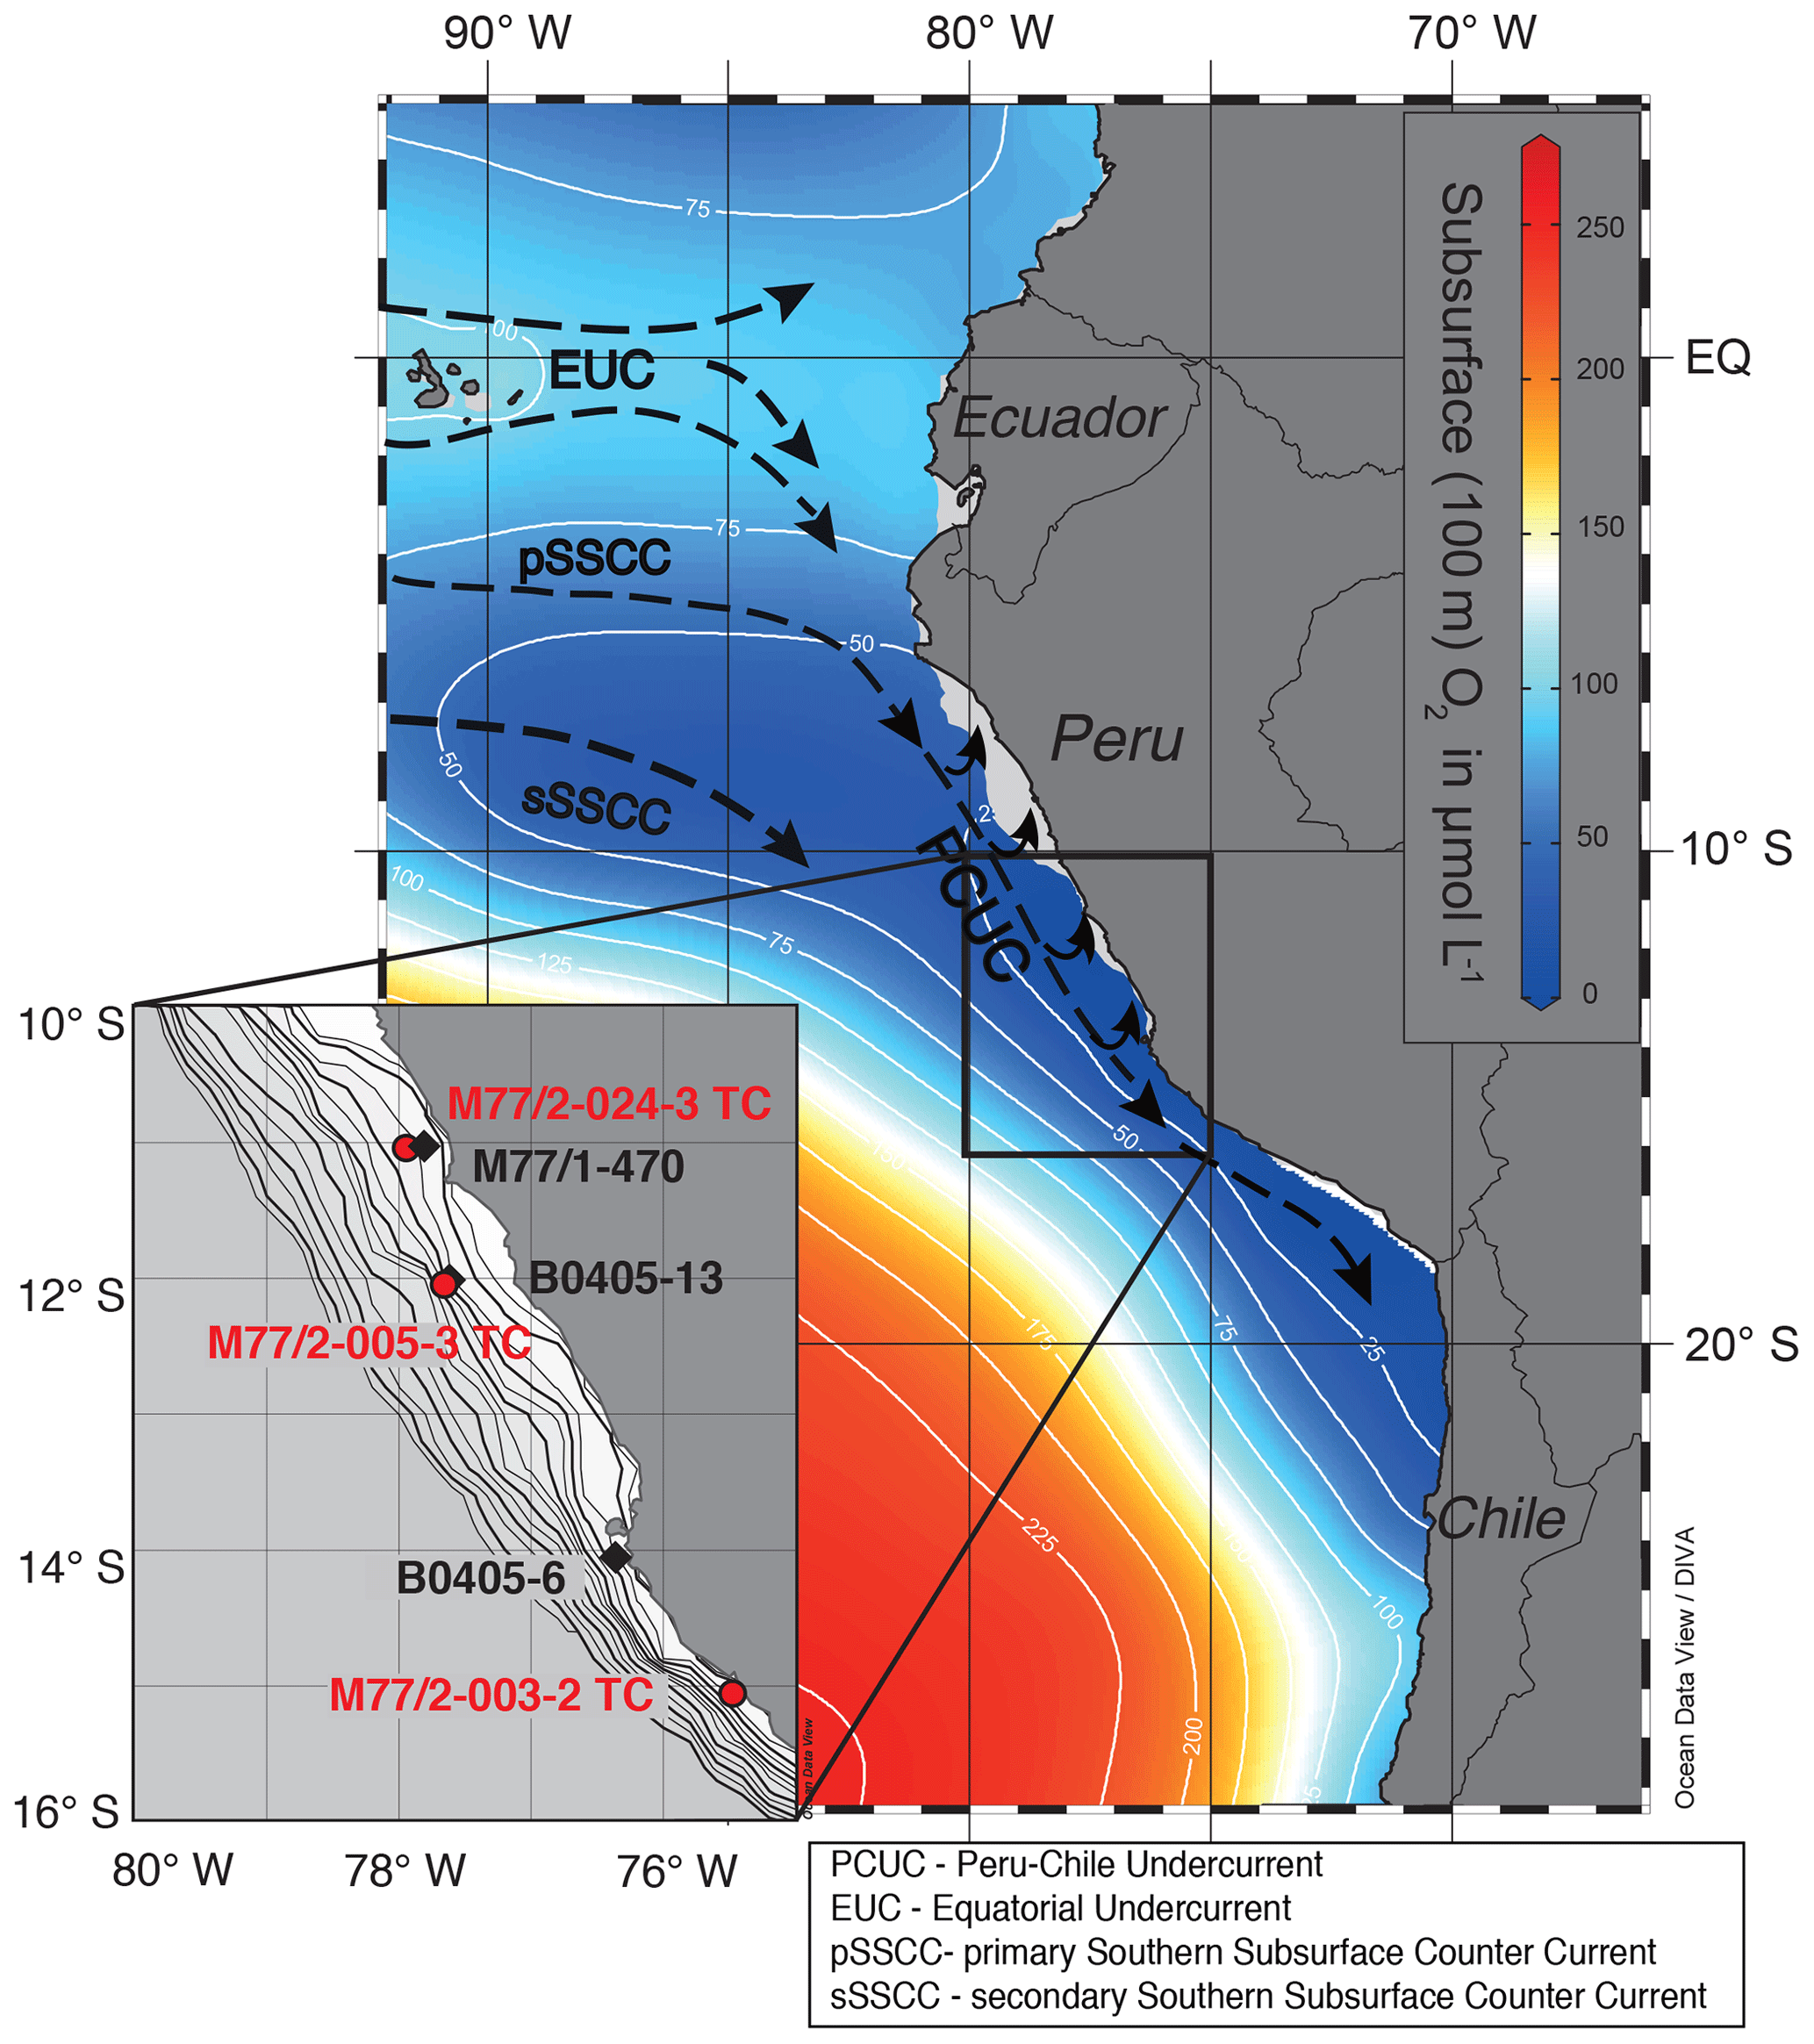
Figure 1Subsurface (100 m) oxygen concentration and current directions in the eastern equatorial Pacific. Inset map shows locations of cores M77/2-024-3 TC, M77/2-005-3 TC, M77/2-003-2 TC (this study), M77/1-470, B0405-13 and B0405-6 (Ehlert et al., 2015; Gutiérrez et al., 2009) in more detail. The bathymetry is given for 0 to 1000 m water depth in 50 m increments.
Regional setting
Along the Peruvian margin the main source for the high amounts of upwelled nutrients (30 µmol L−1 for both Si(OH)4 and ; Bruland et al., 2005) is the subsurface Peru-Chile Undercurrent (PCUC), which flows southward along the continental slope and outer shelf between 4 and 14∘ S at a depth between 50 and 150 m, before it detaches from the shelf south of 15∘ S (Brink et al., 1983; Chaigneau et al., 2013; Toggweiler et al., 1991). Eastward-flowing subsurface waters of the Equatorial Undercurrent (EUC) and the Southern Subsurface Counter Current (SSCC) (see Fig. 1) feed the PCUC. These subsurface currents deliver Si(OH)4 and with mean preformed source signatures for δ30Si(OH)4 of 1.5±0.2 ‰ (Beucher et al., 2011; Ehlert et al., 2012; Grasse et al., 2013) and of 7.1±0.3 ‰ (1 SD; Rafter et al., 2012; Rafter and Sigman, 2016) for the EUC. Within the SSCC preformed values of 5.5±0.3 ‰ (Rafter et al., 2012) are about 1.6 ‰ lower than the EUC, resulting in an approximate average PCUC value of ∼6 ‰ (Fig. 2a; Mollier-Vogel et al., 2012).
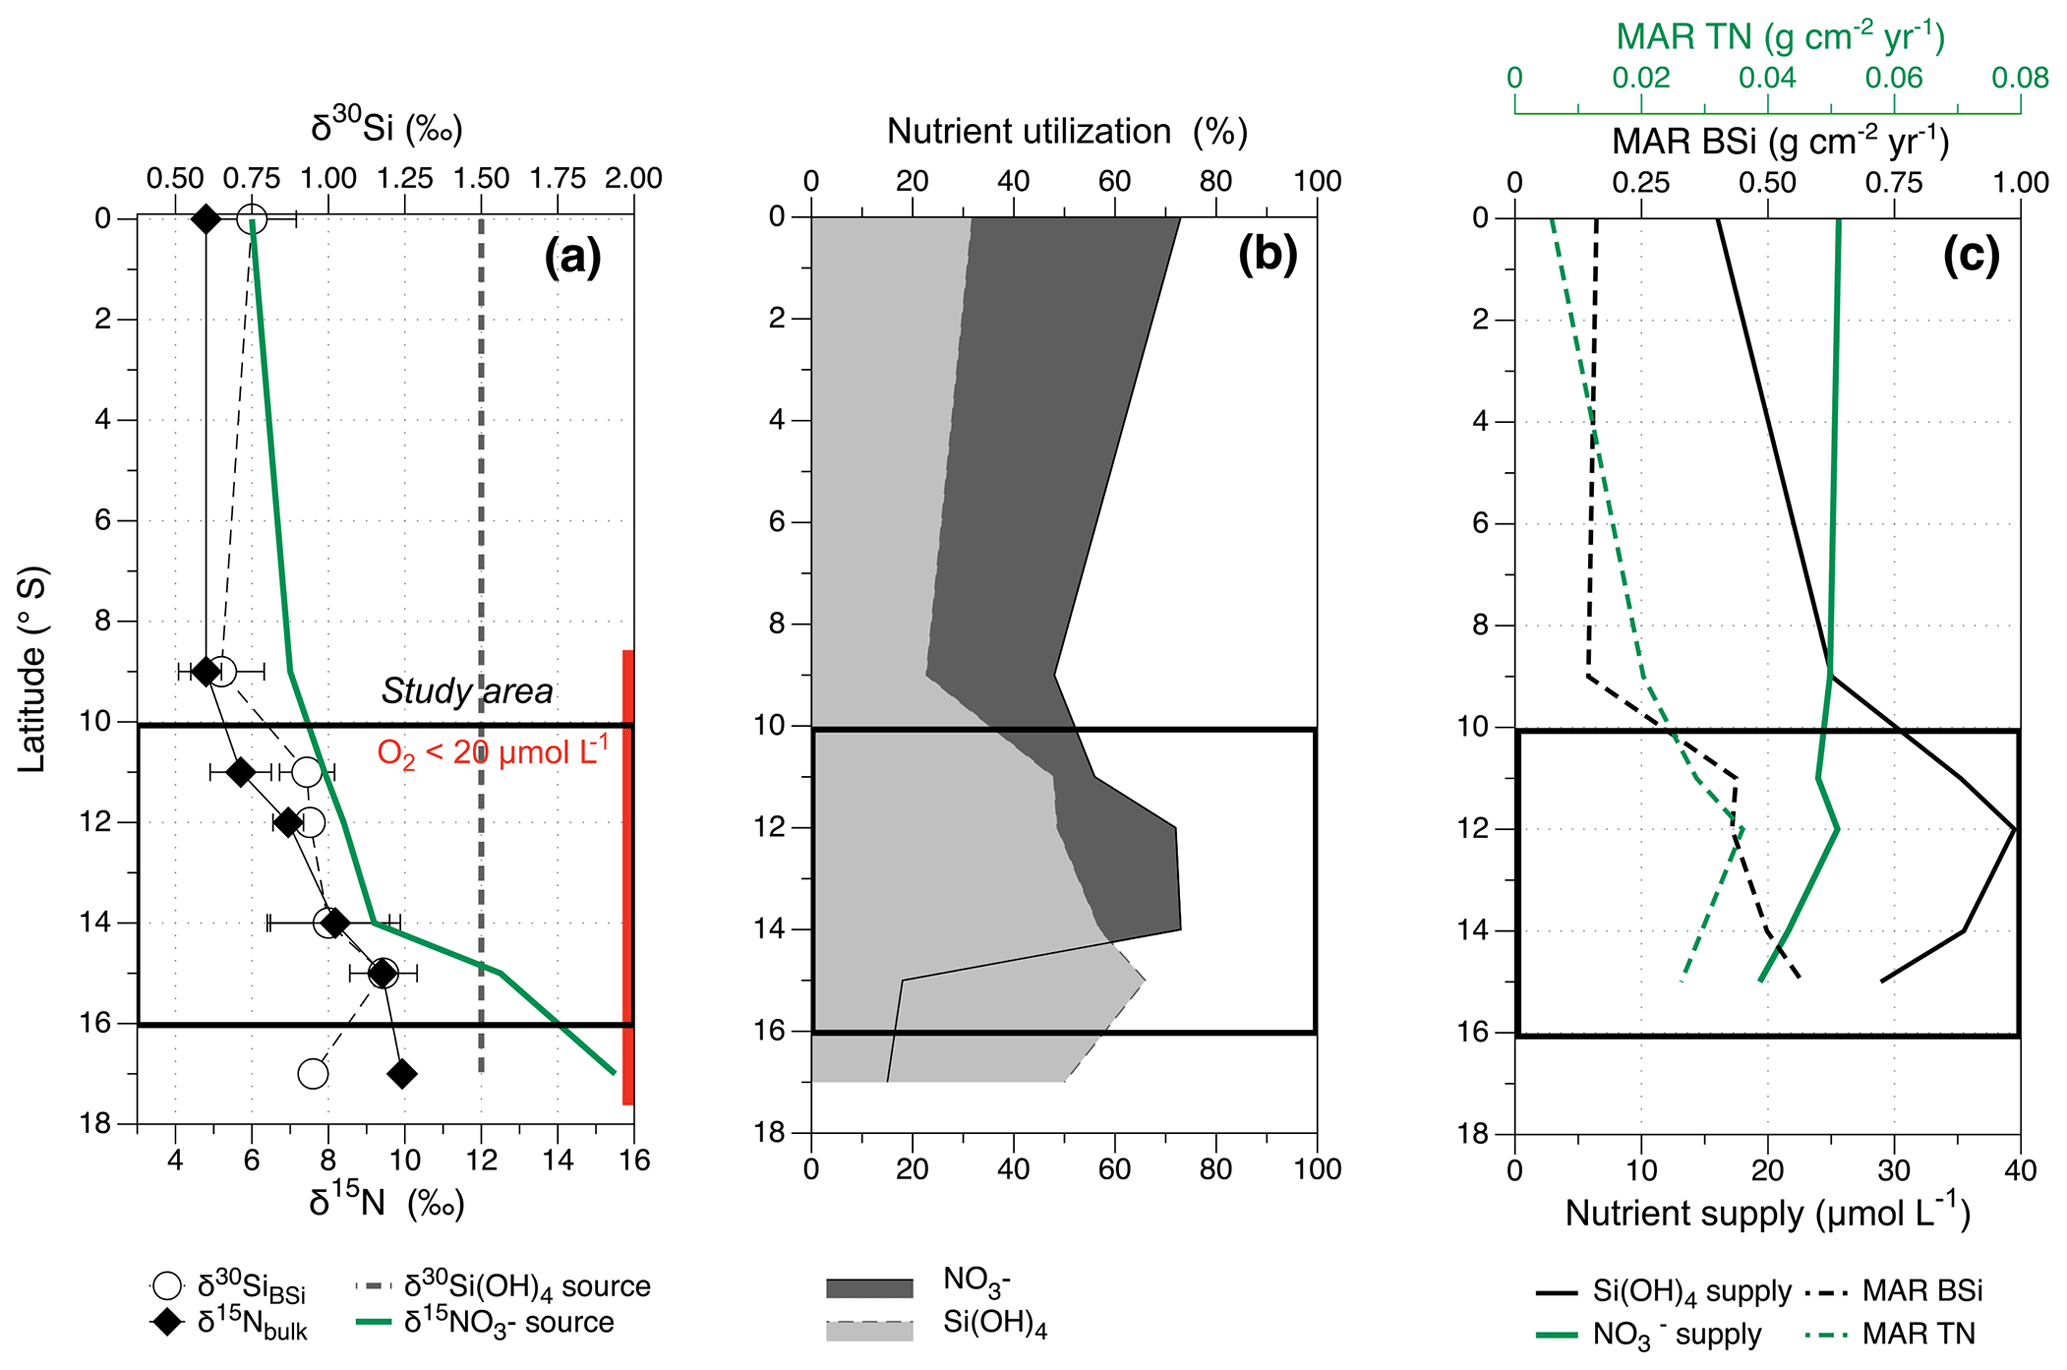
Figure 2Latitudinal overview of present day (a) mean δ15Nbulk (‰, black diamonds, 2 SD error bars) and δ30SiBSi (‰, white circles, 2 SD error bars), the dashed black line indicates the subsurface δ30Si(OH)4 source value of 1.5 ‰, the green solid line marks the source value, increasing southwards from 6 ‰ (0–8∘ S), to about 8 ‰ (10–12∘ S) and 12.5 ‰ (15∘ S). The red bar indicates the area of suboxic conditions in subsurface waters. The black rectangle marks the study area for downcore reconstruction (see also Fig. 1). (b) Nutrient utilization for (%, dark grey area) and Si(OH)4 (%, dashed area). (c) MAR TN (g cm−2 yr−1), MAR BSi (g cm−2 yr−1; for calculation see Sect. 2.6) and the nutrient supply (modified following Mollier-Vogel et al., 2012 and Ehlert et al., 2012).
The dissolved of subsurface waters (50–150 m water depth) increases southward (Equator, EQ, to 17∘ S; Mollier-Vogel et al., 2012) as a consequence of water column denitrification, while the dissolved δ30Si(OH)4 signature remains close to the source value of 1.5 ‰ for the PCUC (Fig. 2a; Ehlert et al., 2012). This difference in the evolution of the isotopic signature from north to south is caused by the anoxic conditions off the coast of Peru only increasing the signatures via denitrification in the subsurface but not affecting the δ30Si(OH)4 signatures. Accordingly, at the northern shelf between 1∘ N and 10∘ S, where subsurface O2 concentrations [O2] are >20 µmol L−1, N-loss is not observed and the δ15Nbulk values in the sediments range between 4 ‰ and 5 ‰, close to the source value of 6 ‰, thus indicating a high degree of utilization (Fig. 2b; Mollier-Vogel et al., 2012). In contrast, the δ30SiBSi signatures north of 10∘ S are more variable, reflecting an overall lower degree of Si(OH)4 utilization (Doering et al., 2016; Ehlert et al., 2012). At the central Peruvian shelf (10–12∘ S), where subsurface [O2] is <20 µmol L−1 (Fig. 2a), the subsurface source value of increases to 8.6 ‰ due to denitrification (Mollier-Vogel et al., 2012). The δ30SiBSi and δ15Nbulk values both increase as a consequence of higher Si(OH)4 utilization but decrease in utilization compared to the northern part of the study area (Fig. 2b), which reflects the interplay between increased upwelling intensity, high nutrient resupply and higher consumption via diatom productivity. In the southernmost part of the shelf (13–16∘ S), the highest productivity and upwelling intensity prevail today, leading to a further increase in the subsurface signature of up to 12.5 ‰ at 15∘ S, whereas surface sediment mean δ30SiBSi and δ15Nbulk values further increase, reflecting moderate utilization of both Si(OH)4 and (Fig. 2a–b). The supply of dissolved Si(OH)4 strongly increases from the northern shelf to the southern shelf area (Fig. 2c), reflecting the strength of the upwelling conditions. This increase in upwelling and productivity between 10 and 15∘ S results in high accumulation rates of BSi (0.4–0.6 g cm−2 yr−1; Ehlert et al., 2012) and total nitrogen (TN, 0.026–0.035 g cm−2 yr−1; Mollier-Vogel et al., 2012) in the sediment (based on accumulation rates of Gutierréz et al., 2009). However, the supply, as indicated by subsurface (50–150 m) concentrations in the water column, slightly decreases from north to south, reflecting the loss of via denitrification.
2.1 Core locations and age models
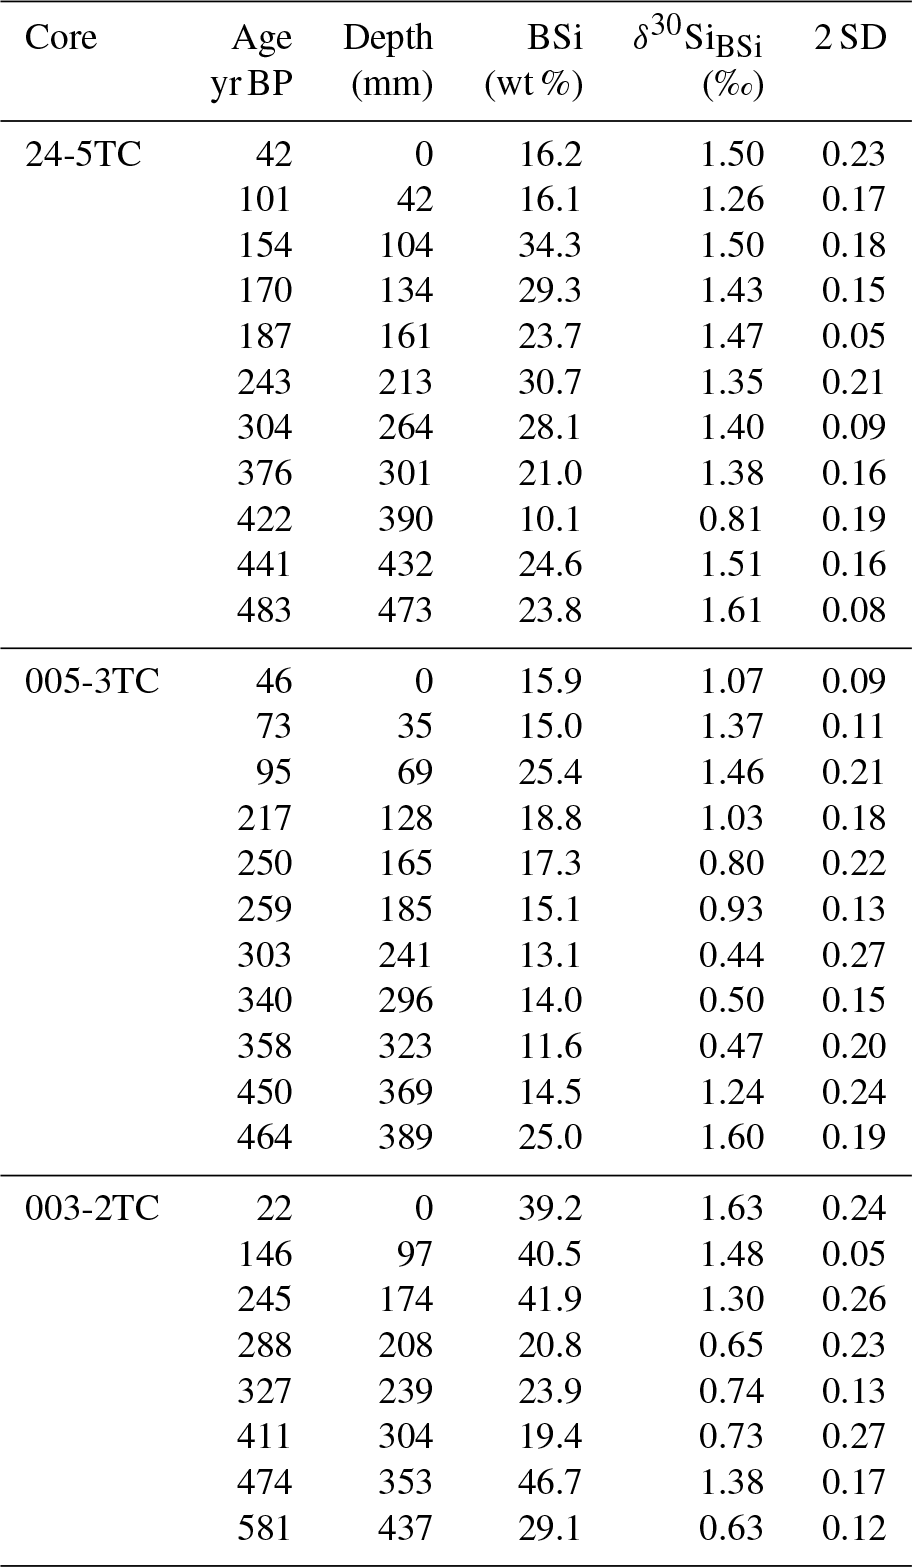
The new data in this study were obtained from three short, fine-laminated trigger cores retrieved from the main upwelling region off the Peruvian margin during the German R/V Meteor cruise M77/2 in 2008 as part of the Collaborative Research Center (SFB) 754 (Fig. 1). New records of δ30SiBSi and BSi concentrations were generated for cores M77/2-024-5TC (024-5TC; 11∘05′ S, 78∘00′ W, 210 m water depth), M77/2-005-3TC (005-3TC; 12∘05′ S, 77∘40′ W, 214 m water depth) and core M77/2-003-2TC (003-2TC; 15∘06′ S, 75∘41′ W, 271 m water depth). Single centimeter slices of the sediment cores were sampled for BSi and Si isotope measurements to ensure the availability of sufficient amounts of diatoms for silicon isotope analysis (Table 1). For core 003-2TC, additional BSi concentration measurements of material extracted from individual laminations was possible (Fleury et al., 2015). As previously published δ15Nbulk values are based on samples from single laminations, these were averaged to 1 cm resolution when directly compared to the δ30Si data in the following. Core locations are shown in Fig. 1. The age models were published before in Fleury et al. (2015). The age models for all cores are given in years CE.
Table 1Downcore record of core M77/2-024-5TC, M77/2-005-3TC and M77/2-003-2TC for δ30SiBSi (‰) and BSi content (wt %). The 2 SD represents the external reproducibility of repeated sample measurements.
2.2 Biogenic opal and silicon isotope analyses
The amount of BSi in the sediments was measured following an automated leaching method using sodium hydroxide (DeMaster, 1981; Müller and Schneider, 1993) with a precision of 1 %–2 % (1 SD). Unfortunately, no material was left of the cores studied here to estimate dry bulk densities to calculate mass accumulation rates (MARs). Therefore, MAR values were used from nearby cores BO413 (12∘ S) and BO406 (14∘ S; Gutierréz et al., 2009), which were generally close to 0.02 (g cm−2 yr−1) during the LIA and 0.03 g cm−2 yr−1 during the CWP. The exact bulk MAR values (g cm−2 yr−1) for each time period were multiplied by the fractional concentration of BSi and TN (Fleury et al., 2015) to calculate the MAR BSi and MAR TN (Figs. 2c and 6).
For the Si isotope measurements diatoms were extracted from the sediment by chemical and physical cleaning (11 and 32 µm sieve; heavy liquid separation with a sodium polytungstate solution set at 2.15 g mL−1), as described in detail in Ehlert et al. (2012, 2013) and Doering et al. (2016). For all samples, the purity of the small diatom fraction (11–32 µm) was evaluated via light microscopy prior to dissolution and only pure (>95 %) diatom samples were treated further. All samples were dissolved in 1 mL 0.1 M NaOH and treated with 200 µL concentrated H2O2 (Suprapur). Sample solutions were diluted with 4 mL MQ water and neutralized with 0.1 mL 1 M HCl (Reynolds et al., 2008), followed by a chromatographic purification using 1 mL pre-cleaned AG50W-X8 cation exchange resin (BioRad, mesh 200–400) (de Souza et al., 2012). The Si isotopic compositions were determined in 0.6 ppm sample solutions on a NuPlasma HR MC-ICPMS at GEOMAR applying a standard-sample bracketing method (Albarède et al., 2004). Silicon isotopic compositions are reported in the δ-notation relative to the reference standard NBS28 in parts per thousand: , where Rsample is the 30Si∕28Si ratio of the sample and Rstandard is the 30Si∕28Si ratio of the NBS28. All δ30Si measurements were run at least in triplicate, with uncertainties ranging between 0.05 ‰ and 0.27 ‰ (2 SD). Repeated measurements of an in-house diatom matrix standard gave average δ30Si values of 1.03±0.21 ‰ (2 SD n=15). Long-term repeated measurements of the reference materials NBS28, IRMM018 and Big Batch gave average δ30Si values of 0.00±0.24 ‰ (2 SD), ‰ (2 SD, n=15) and ‰ (2 SD, n=15), respectively, in good agreement with literature values (Reynolds et al., 2007).
2.3 Diatom assemblage data
Diatom analysis of cores M77/2-024-5TC, 005-3TC and 003-2TC were published previously based on three slides per sample and counting of a minimum of 300 valves for each sample (for details see Fleury et al., 2015). The diatom abundances are presented here for three groups representing different environmental conditions (Fig. 4e–g): upwelling species – Chaetoceros sp., Skeletonema costatum, Thalassionema nitzschioides var. nitzschioides; coastal planktonic species – Actinocyclus spp., Atinoptychus spp., Asteromphalus spp., and Coscinodiscus sp.; and other diatom species – Nitzschia spp., Rhizosolenia spp. and Thalassiosira spp., Cyclotella spp., and Cocconeis sp.;
The diatom assemblage abundance is compared to δ30SiBSi compositions for cores M77/2-024-5TC, 005-4TC and 003-2TC to investigate if changes in the assemblage have influenced the isotopic record. While diatom counts have been performed on bulk sediment samples δ30SiBSi was measured on the 11–32 µm size fraction. However, it was shown previously that this size range closely resembles the main assemblage, which allows for studying the influence of changes in the diatom assemblage on the δ30SiBSi record (Ehlert et al., 2012, 2013).
2.4 Nutrient utilization
The degree of nutrient utilization can be described assuming either Rayleigh-type (single input followed by no additional nutrients newly supplied to a particular parcel of water followed by fractional loss as a function of production and export) or steady-state (continuous supply and partial consumption of nutrients causing a dynamic equilibrium of the dissolved nutrient concentration and the product) fractionation behavior (Mariotti et al., 1981). For simplification purposes we will only provide the values derived from steady-state fractionation, which was shown to better reflect upwelling conditions off the coast of Peru (Ehlert et al., 2012).
with or being the percentages of the supplied Si(OH)4 and that have been utilized. For this calculation we apply enrichment factors of −1.1 ‰ 30ε (δ30Si, (De La Rocha et al., 1997) and −5 ‰ 15ε (δ15N) and assume a constant source water signature of 1.5 ‰ for (i.e., the mean δ30Si(OH)4 of the PCUC). The nutrient utilization for surface sediments calculated here is identical to the original publications (Fig. 2b; Mollier-Vogel et al., 2012; Ehlert et al., 2012). To evaluate the impact of changes in 30ε on the δ30Si signatures the potential influence of species-specific fractionation was tested based on the impact of a −2.1 ‰ enrichment factors of Chaetoceros brevis (Sutton et al., 2013). However, the estimated impact on past δ30SiBSi records, due to a change in the amount of Chaetoceros sp. present in the sediment was less than 5 % for all cores (M77/2-024-5TC, 005-3TC and 003-2TC) and thus did not alter the assumed 30ε of −1.1 ‰ substantially (based on calculations presented in Doering et al., 2016; not shown). The impact of denitrification on the signatures of the past is assessed in the following section before calculating past utilization for the respective latitudes.
2.5 Calculation of the source signatures
Based on modern observations from the water column it is known that and Si(OH)4 are incorporated in a 1:1 ratio when diatoms dominate the phytoplankton assemblage (Brzezinski, 1985; Ragueneau et al., 2000). The ratio of nutrients in the water column can, however, vary between 2:1 and 1:2 on the shallow Peruvian shelf (Grasse et al., 2016). Assuming a strict 1:1 uptake ratio of nutrients, the respective δ30SiBSi and δ15NBulk values in the underlying sediments should also reflect a 1:1 ratio (indicated by white star “1” in Fig. 3a). Based on the known δ30Si(OH)4 and source signatures of modern subsurface waters, we can calculate the actual nutrient utilization (see Sect. 2.4) and estimate the uptake ratio for (Fig. 3b). However, it is not possible to observe a significant correlation for the entire shelf area, given that there are only a few data points for the areas along the shelf (Figs. 2, 5a). We calculate past nutrient utilization and estimate the influence of denitrification on the δ15Nbulk values based on the fact that on the shelf δ30SiBSi and δ15Nbulk values generally follow a positive linear regression (Figs. 3b, 5a). In order to estimate past changes in the source values, the δ30SiBSi and δ15Nbulk values were separately plotted against each other for the time periods of the CWP, the arid LIA and the humid LIA (Fig. 5b–d). Accordingly, the source value for each period was calculated based on the linear function assuming that the source δ30Si(OH)4 signature always remained stable at 1.5 ‰ over time:
or
with a indicating the slope of the line and b the intercept. For δ30Si(OH)4 we used the value of 0.4 ‰ representing near 0 % utilization (= source water δ30Si(OH)4 of 1.5 ‰ of the PCUC – 1.1 ‰ fractionation during uptake) to estimate the source. Accordingly, the values estimated by Eq. (3) represent the source value also assuming near 0 % utilization of .
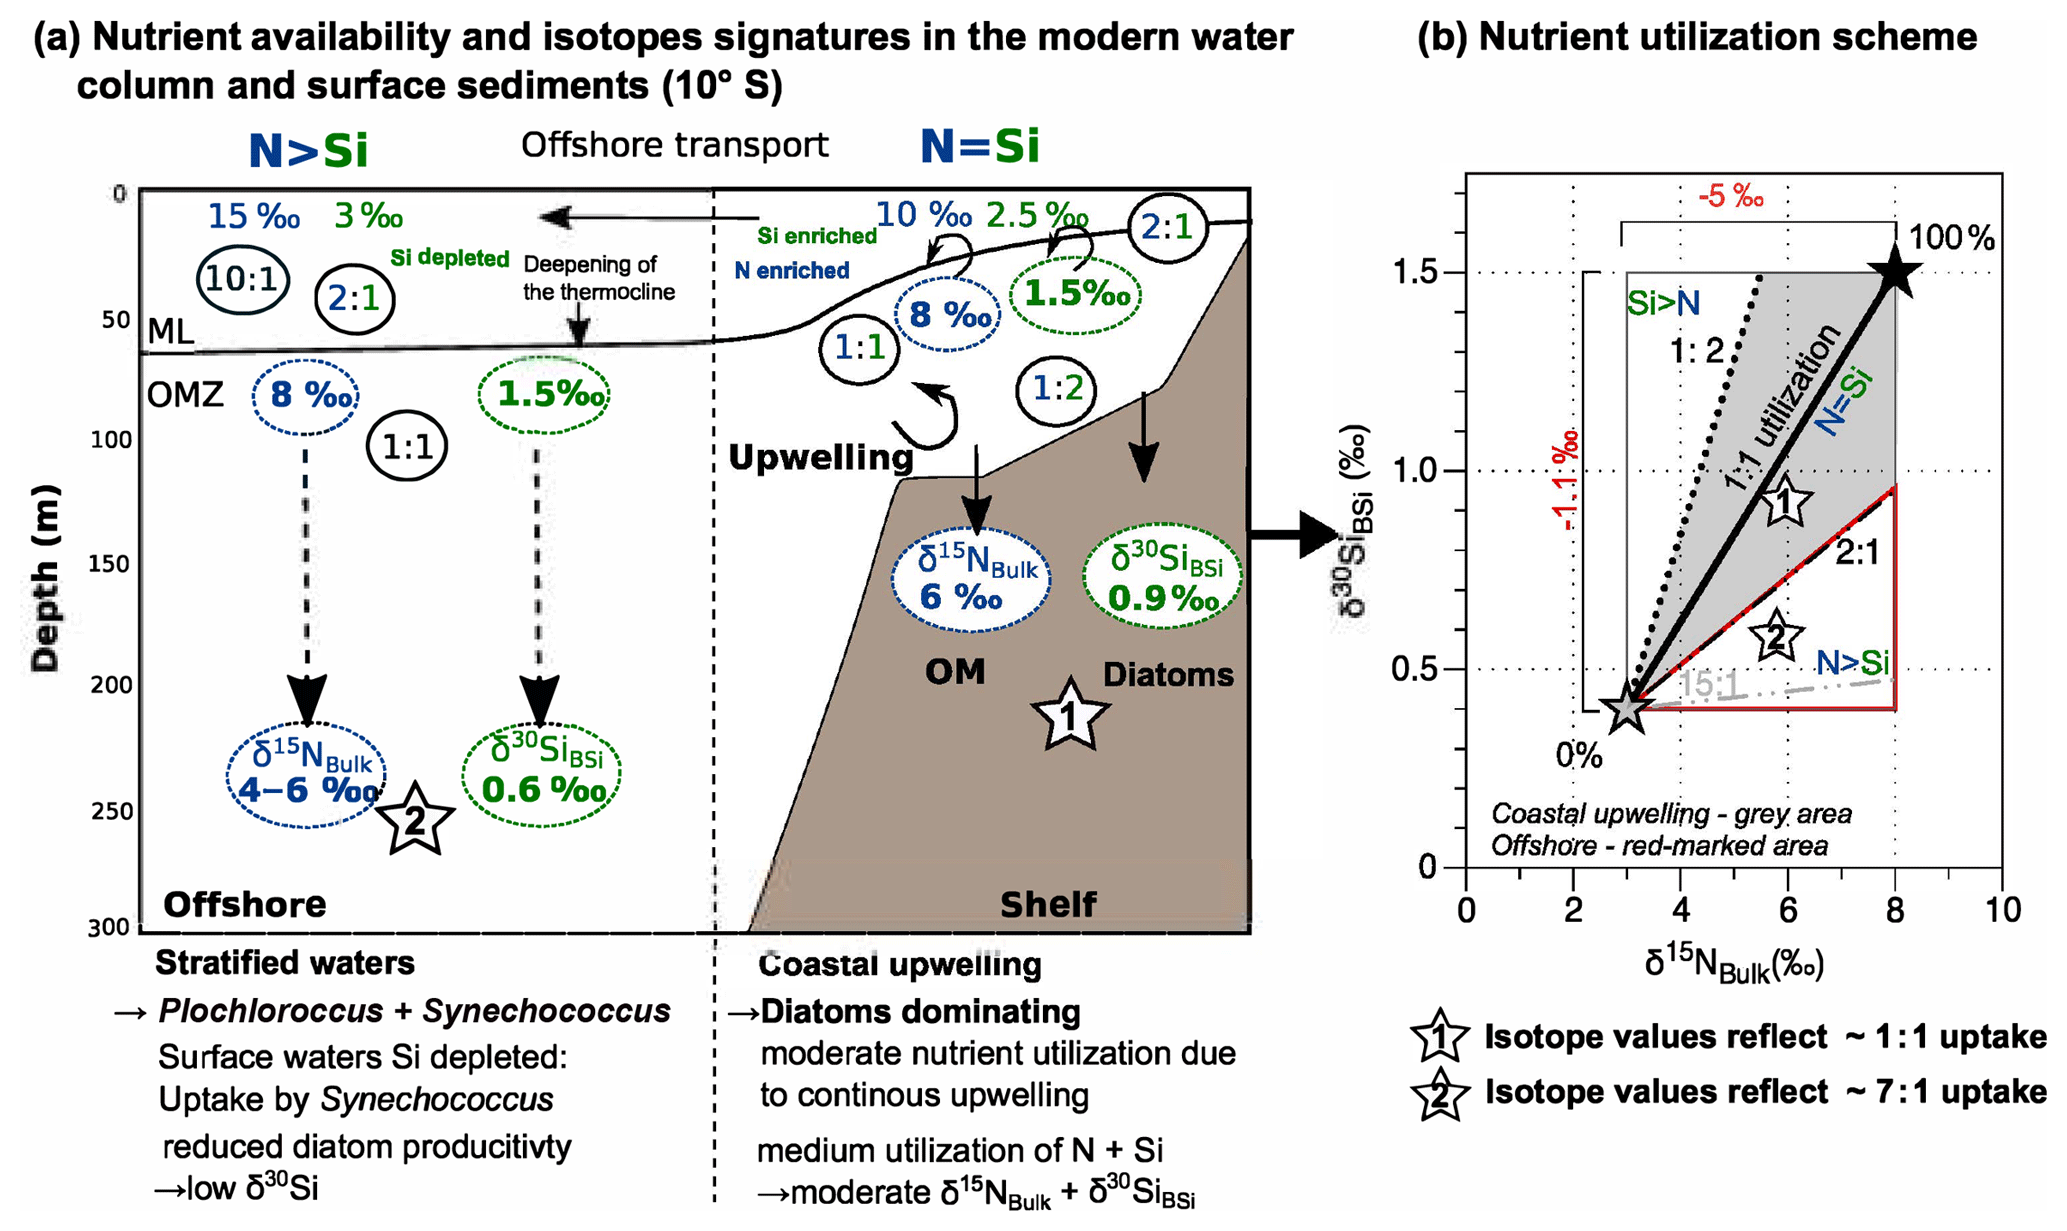
Figure 3(a) Simplified schematic figure of the 10∘ S transect off the coast of Peru indicating the concentrations of Si(OH)4 (green) and (blue; given as enriched or depleted) together with the ratios (N:Si). The stable isotope composition in the water column given as δ30Si(OH)4 and and the δ30SiBSi and δ15NBulk signatures in underlying sediments. Diatoms are dominant on the shelf, whereas non-siliceous organisms (Synechococcus, Prochlorococcus) dominate the offshore productivity (modified from Grasse et al., 2016). (b) Schematic overview of nutrient utilization: the black star marks the source signature (or 100 % utilization) for (8 ‰) and for δ30Si(OH)4 (1.5 ‰) at the location, the grey star marks the theoretical isotopic compositions for ∼0 % utilization, and the thick black solid line indicates the 1:1 utilization for N=Si. The δ30SiBSi and δ15NBulk signatures from the shelf (white star 1) reflect an N:S uptake close to 1:1 while offshore signatures (white star 2) indicate higher N over Si utilization (N>Si). The rectangle indicates the total range of possible isotopic values. The respective fractionation factors are given in red.
We calculated the linear regression based on all samples of the different cores from the different latitudes (11, 12, 14 and 15∘ S) during the CWP and the LIA. We also further differentiated between short-term productive phases (arid phases) and the generally prevailing humid El Niño-like conditions during the LIA (grey shadings in Fig. 4) and resolved the resulting equation based on Eq. (2) to estimate . Only for the LIA (humid) phases was it not possible to directly calculate values based on the linear function from Eq. (2), due to near horizontal alignment of the δ15Nbulk versus δ30SiBSi values (Fig. 5b). Therefore, for this time period the highest δ15NBulk value for each latitude was assumed to reflect ∼100 % utilization and was thus used as source value. This assumption might slightly overestimate the maximum utilization, which is only ∼80 % today (Fig. 2b), and therefore might underestimate the source value slightly. For all time periods and latitudes, the linear regressions as well as correlation coefficient (r2) are given in the Supplement (Fig. S1). The results are presented in the following as the resulting source values and the theoretical ratio of nutrient utilization (i.e., 1:1 or 2:1, 15:1, etc.; Fig. 5b–d) for each latitudinal range to compare the latitudinal trends between the CWP and the LIA.
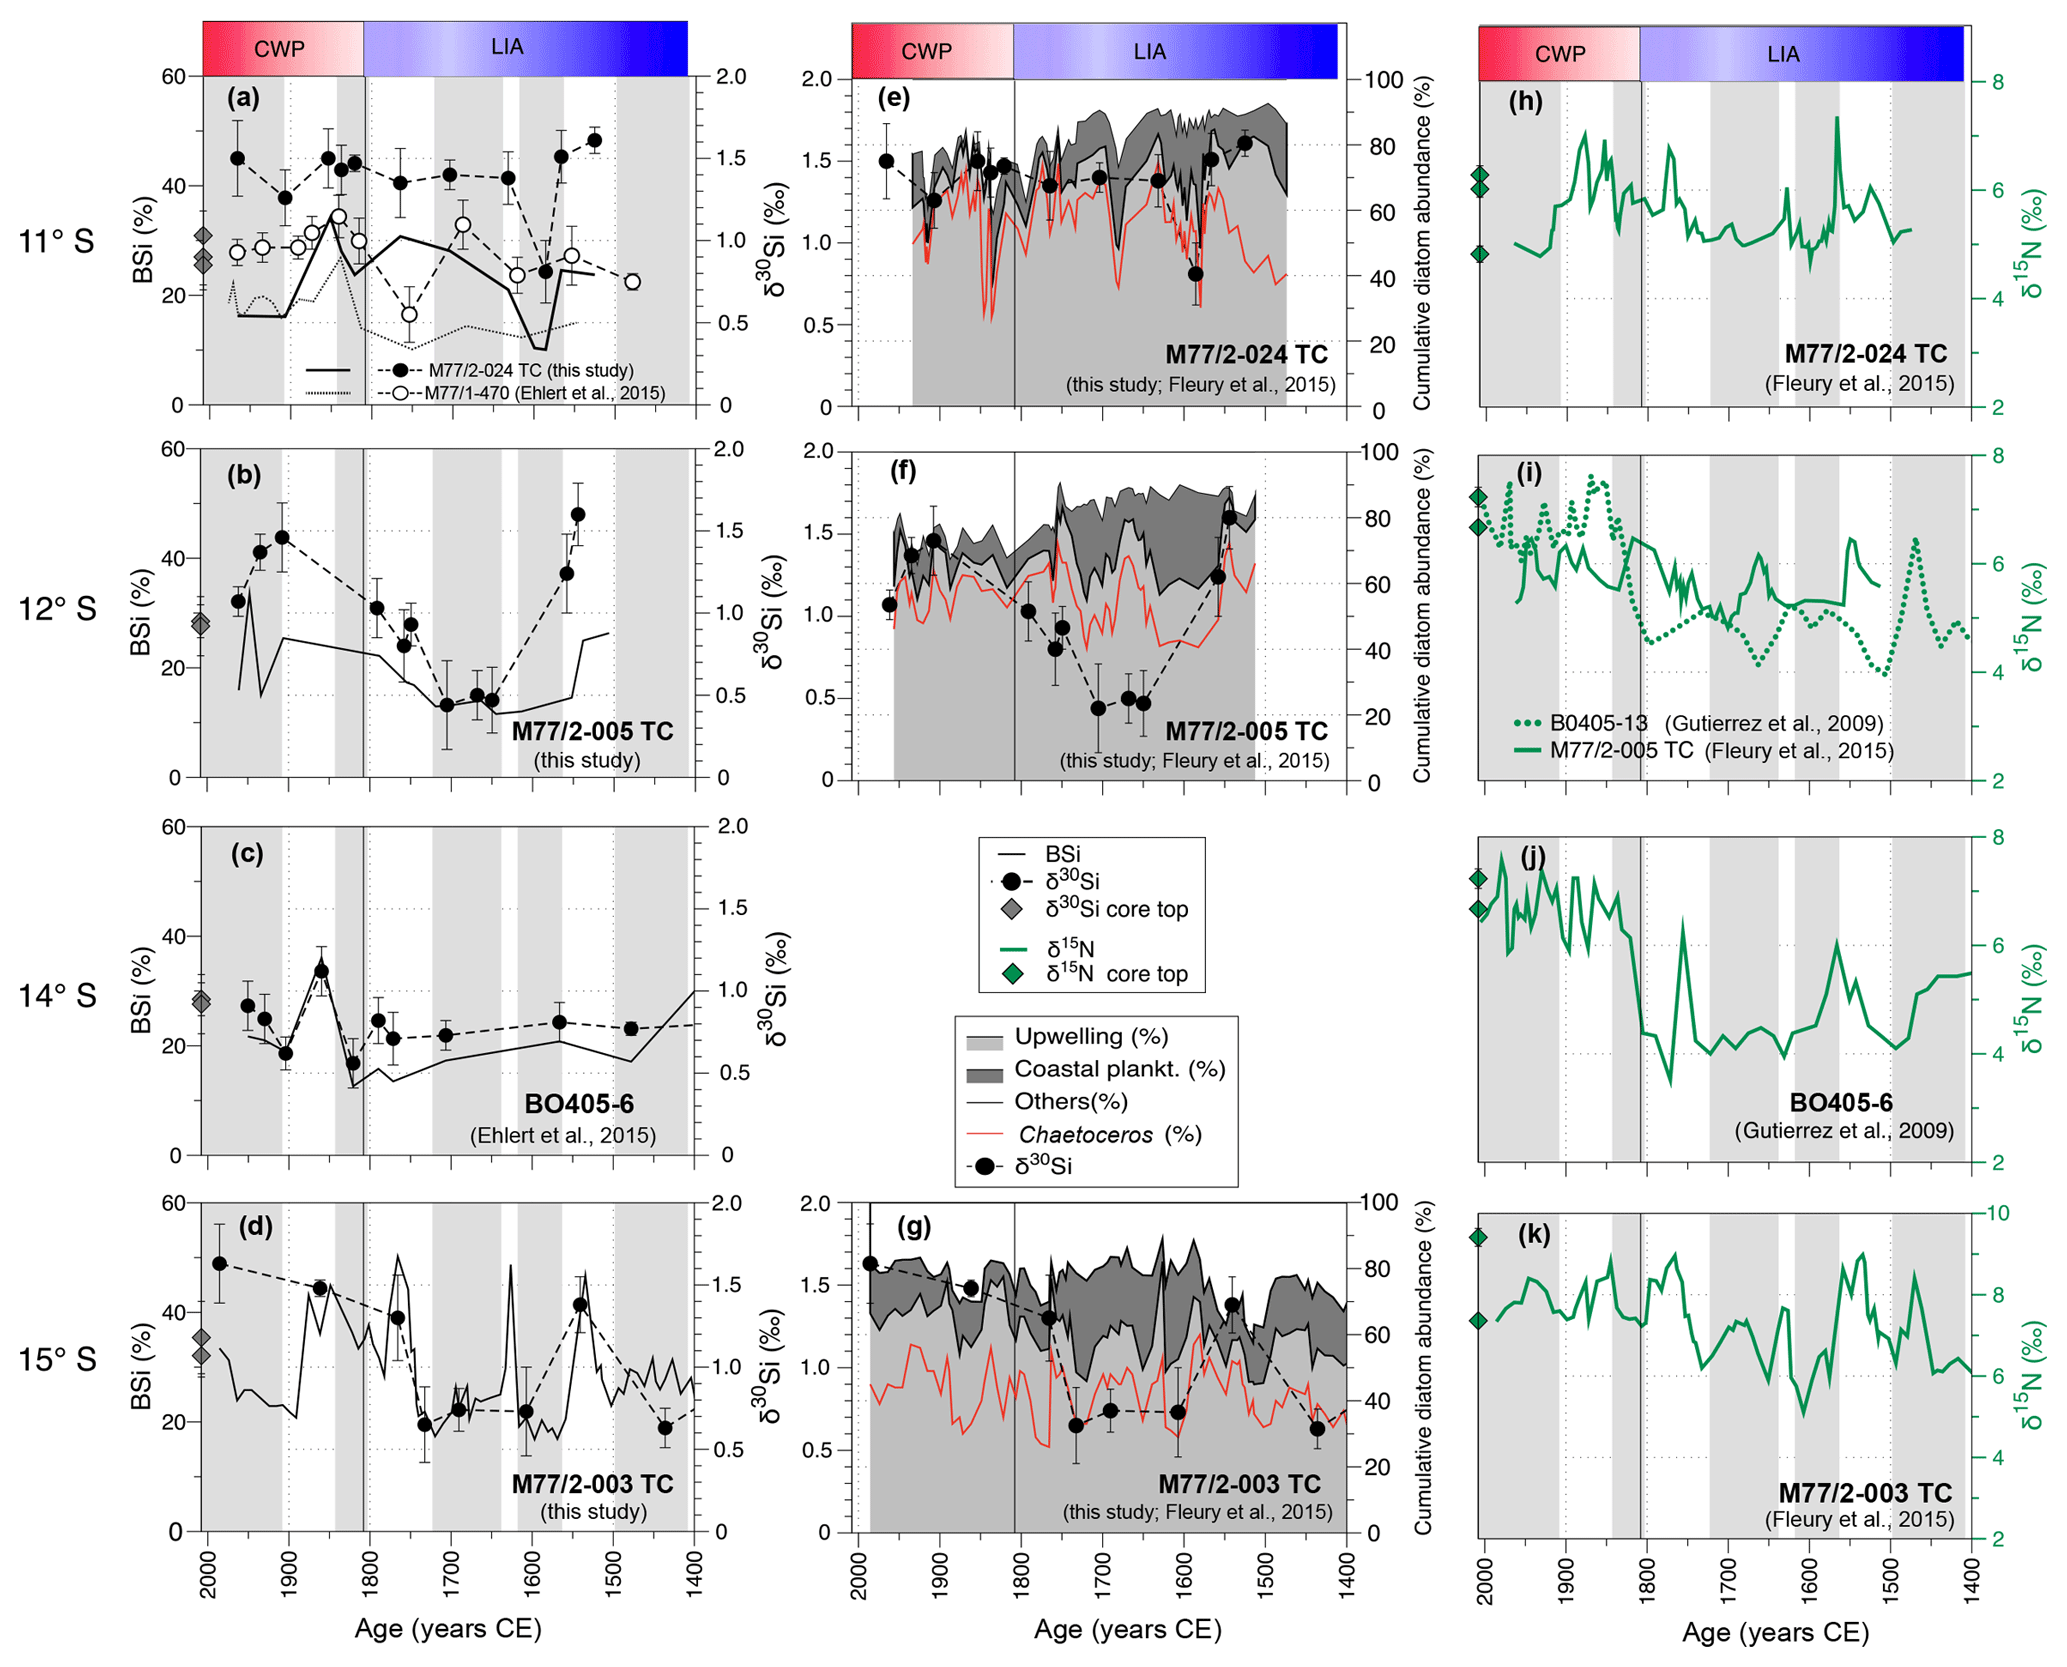
Figure 4Downcore records of BSi (wt %) and δ30SiBSi (‰, 2 SD error bar of repeated sample measurements) records of cores: (a) M77/2-024-5TC and M77/1-470 (Ehlert et al., 2015), (b) M77/2-005-3TC (c), BO405-6 (Ehlert et al., 2015; Gutiérrez et al., 2009), and (d) M77/2-003-2TC. The cumulative diatom assemblages are compared to δ30Si for core (e) M77/2-024-5TC, (f) M77/2-005-3TC and (g) M77/2-003-2TC. Upwelling species – light gray; coastal planktonic species – gray; other species – white; Chaetoceros sp. – dashed red line; δ30SiBSi – black dots. The black line indicates the transition between the LIA and the CWP. For comparison, previously published δ15Nbulk (‰) are shown for cores (h) M77/2-024-5TC (Fleury et al., 2015), (i) M77/2-005-3TC (Fleury et al., 2015) and BO405-13 (Gutiérrez et al., 2009), (j) BO405-6 (Gutiérrez et al., 2009), and (k) M77/2-003-2TC (Fleury et al., 2015). All records are sorted by latitude from top (11∘ S) to bottom (15∘ S). The time intervals for the CWP (red) and the LIA (blue) are highlighted in (a); the horizontal grey shading indicates humid periods (Fleury et al., 2015).
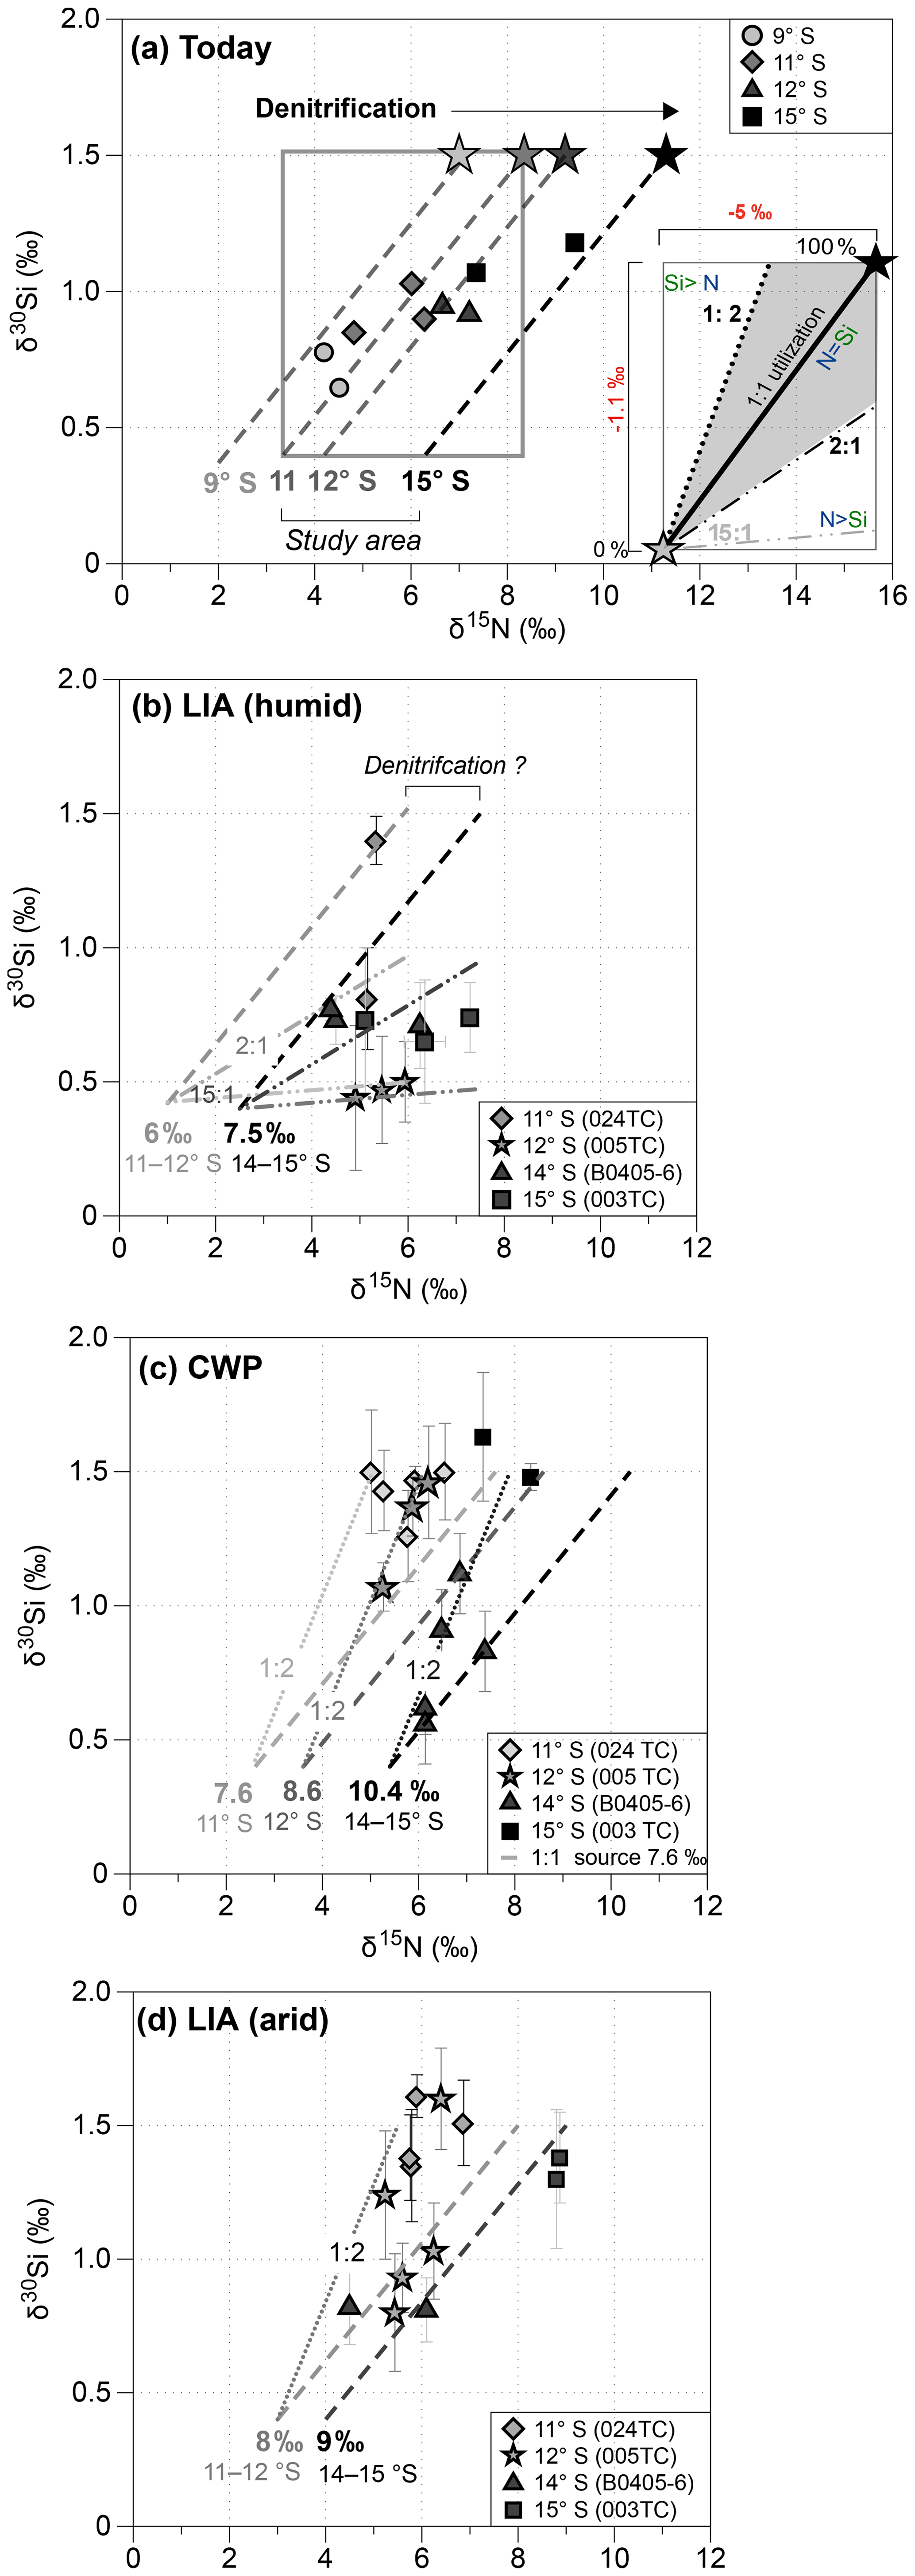
Figure 5(a) Direct comparison of δ15Nbulk versus δ30SiBSi for modern surface sediments (modified from Ehlert et al., 2015): the dashed lines indicate 1:1 utilization of different source values (7 ‰, 7.9 ‰, 8.35 ‰ and 11.3 ‰) between 9 and 15∘ S (based on Mollier-Vogel et al., 2012); the rectangle marks the respective range of isotope values that can be expected in sediment samples for nutrient utilization with source values of 1.5 ‰ (δ30Si(OH)4) and 8.35 ‰ (). (inset of a) Schematic overview of nutrient utilization associated with changes in the isotopic compositions of both δ15N and δ30Si: the black star marks the source signature (or 100 % utilization) for δ15N and for δ30Si, the grey star marks the respective isotopic compositions for 0 % utilization, and the dashed black line indicates the 1:1 utilization for . Ratios that plot above the utilization lines reflect Si(OH)4 limitation, as indicated by the dotted dark grey and dotted light grey lines, representing ratios of 1:2, whereas data points below record stronger limitation, as indicated by the dashed dark grey and light grey lines representing ratios of 2:1 and 15:1. The rectangle indicates the total range of possible isotopic values. (b–d) Downcore comparison of δ15Nbulk and δ30SiBSi for cores 024TC (diamonds), 005TC (grey stars), 003TC (grey squares) and BO405-6 (grey triangles; Ehlert et al., 2015) for the CWP and the LIA. For the LIA the sample values are separated into arid (d) and humid periods (b).
2.6 Calculation of nutrient supply
Based on these calculated subsurface values, we further calculated the change in nutrient utilization as well as nutrient supply for the different latitudes. Past nutrient utilization was calculated following Eq. (1). Given the estimate of nutrient demand and export productivity it is further possible to estimate changes in the supply with the relationship by applying the equation of Horn et al. (2011) given by
Fopal∕TN is the flux of BSi or TN and %nutrientconsumed is the percent of the Si(OH)4 or supply consumed (i.e., nutrient utilization). Given that there are no accumulation rates available for either the surface sediment samples or for any of the cores studied here to directly determine the export productivity directly, we used the BSi and TN values previously published (surface sediments; Mollier-Vogel et al., 2012; Ehlert et al., 2012) and the new BSi values presented in this study, together with mass accumulation rates (g cm−2 yr−1) for cores BO406-13 and 406-5 from Gutierréz et al., 2009, to calculate the accumulation rates of BSi and TN (MAR; g cm−2 yr−1). For the different time periods mean values for MAR BSi and MAR TN were calculated and the respective nutrient supply was calculated based on Eq. (4), indicating changes in the nutrient supply compared to modern values.
3.1 Biogenic opal and silicon isotope signatures
The data of the sediment cores from the shelf area between 12 and 15∘ S presented here show an increase in BSi content from mean values of 13 %–23 % during the LIA to values of 21 %–29 % during the CWP. The δ30Si records follow a similar trend of lower mean δ30SiBSi values of 0.8±0.2 ‰ (2 SD, 12∘ S), 0.8±0.1 ‰ (14∘ S) and 1±0.2 ‰ (15∘ S) during the LIA to more variable and higher mean values of 1.3±0.4 ‰ (12∘ S), 0.8±0.4 ‰ (14∘ S) and 1.5±0.2 ‰ (15∘ S) during the CWP (Fig. 3a–d; Table 1).
The diatom assemblages (Fig. 4e–g; based on Fleury et al., 2015) show an association of the amount of upwelling species and δ30SiBSi signatures, with decreases of up to 20 % in upwelling species often accompanied by a reduction of δ30SiBSi by about 0.5 ‰–1 ‰. However, not every decrease in δ30SiBSi is mirrored by a change in the diatom assemblage and vice versa (e.g., Fig. 4f at 1650 CE). Overall, the diatom assemblage data indicate little change in the mean conditions and a slight reduction of upwelling strength at 12 and 15∘ S during the LIA in comparison to the CWP (Fig. 6). The most distinct shift of lower abundances of upwelling species (∼50 %) to higher values during the CWP (∼70 %) is found at 15∘ S (003-2TC) corresponding to the strongest changes in BSi and δ30SiBSi at this location.
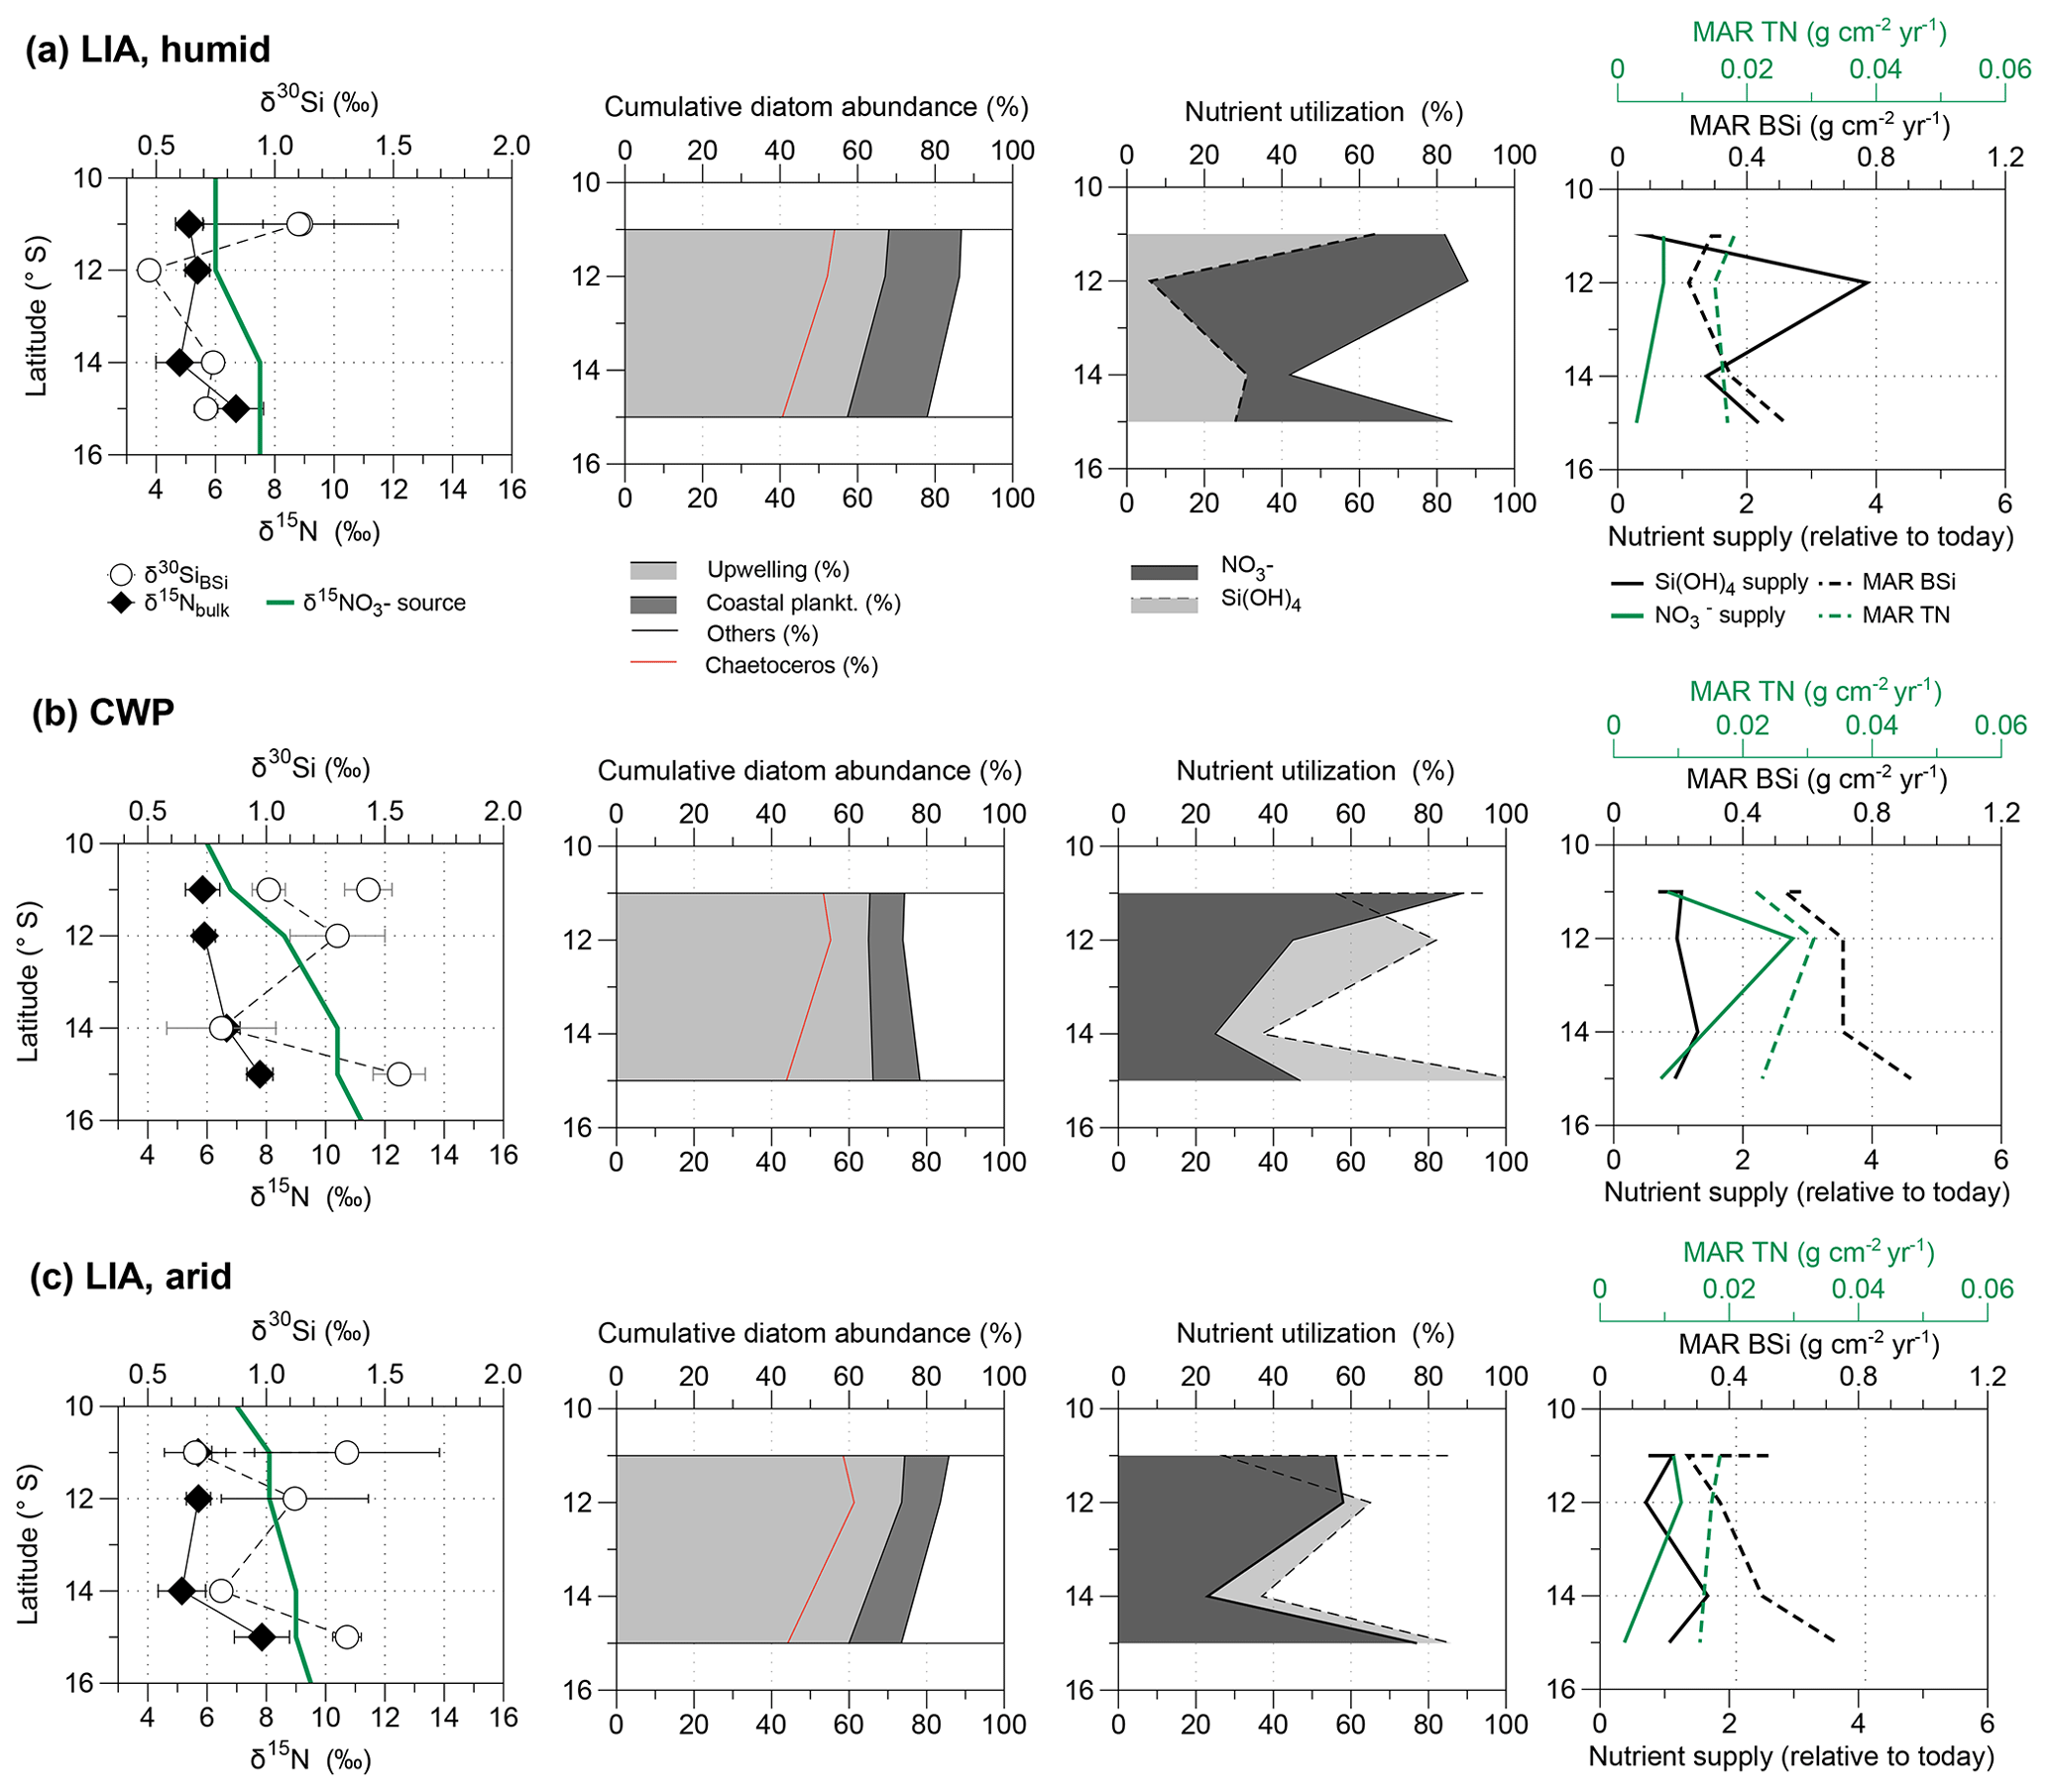
Figure 6Latitudinal comparison of (from left to right) mean δ15Nbulk (‰, black diamonds) and δ30SiBSi (‰, white circles) and the calculated source values (green line); the mean cumulative diatom abundance (%; calculated from Fleury et al., 2015); the respective nutrient utilization of (grey, solid line) and Si(OH)4 (dashed area and line); and MAR TN (g cm−2 yr−1) and MAR BSi (g cm−2 yr−1), together with nutrient supply relative to today for (a) the humid phases of the LIA, (b) the CWP, and (c) the arid phases of the LIA. Please note that for δ15Nbulk values the mean was calculated for all available values for each time period and not only for samples for which δ30SiBSi values are also available. Error bars mark the 1 SD of the mean values.
The sedimentary BSi concentrations and δ30SiBSi signatures at 12∘ S (005-3TC) and 15∘ S (003-2TC) were lowest during the LIA (Fig. 4c, e), in agreement with previously published records from 11∘ S (M77/1-470; Fig. 4a) and 14∘ S (Ehlert et al., 2015; Fig. 4d). An exception is core 024-5TC (Fig. 4a) from 11∘ S, where δ30Si mean values of the LIA (1.3±0.4 ‰) are similar to CWP mean values (1.4±0.1 ‰). Furthermore, both the BSi concentrations and δ30SiBSi signatures of core 024-5TC were significantly higher during the LIA than at nearby core M77/1-470 (Fig. 4a; Ehlert et al., 2015). However, comparison with the cumulative diatom assemblage indicates overall little difference in the amount of upwelling and coastal planktonic diatom species between the LIA and the CWP at 11∘ S (Fig. 4f), with intervals of reduced abundances of upwelling species generally lasting less than 50 years, much shorter than the 100 to 150 years intervals observed at 12 and 15∘ S. Furthermore, the finely laminated sediment layers do indicate short periods of higher productivity during the LIA in a phase with more arid conditions (Fig. 4, grey shading; for details see Fleury et al., 2015). Accordingly, the high mean BSi and δ30SiBSi values obtained from core 024-5TC may be an artifact of low sampling resolution with only two δ30SiBSi samples representing the time period between 1700 and 1800 CE and δ30SiBSi analyses not evenly covering all the short events (∼50 years) of reductions in the abundance of upwelling diatom species (Fig. 4f). Alternatively, the increase in Si(OH)4 utilization, decoupled from an increase in diatom abundance (Fleury et al., 2015; not shown here) may indicate stronger silicification of the diatom frustules, as often observed under Fe-deficient conditions and associated with an increase in the incorporated by the diatoms (De La Rocha et al., 2000; Takeda, 1998; Wilken et al., 2011).
As previously shown, the δ15Nbulk values of the three cores (M77/2-024-5TC, 005-3TC and 003-2TC) presented in this study were on average 0.8 ‰ lower during the LIA than during the CWP (Fleury et al., 2015). The δ15Nbulk values reported for core 005-3TC (12∘ S) are close to values of nearby core B0406-13 (Gutiérrez et al., 2009). Similarly, the δ15Nbulk values of core 003-2TC (15∘ S) agree well with previously published δ15Nbulk record of core B0405-6 (14∘ S, Fig. 4j, k; Gutiérrez et al., 2009).
3.2 source signatures, nutrient utilization and supply
During the humid phases of the LIA the calculated source values were lower, reaching values of 6 ‰ between 11 and 12∘ S and 7.5 ‰ between 14 and 15∘ S (Figs. 5b, 6a). The calculated utilization was higher during this time, reaching values between 70 % and 90 %, while Si(OH)4 utilization ranged between 6 % and 60 %. The MAR TN was lowest (<0.02 g cm−2 yr−1) during the LIA, however, with little difference between humid and arid phases (Fig. 6a, c, right side). The MAR BSi values were similar to today during the LIA (humid) ranging between 0.2 and 0.5 g cm−2 yr−1 (Figs. 2, 6a right side). The calculated supply was lowest during the LIA (humid) ranging between 0.3 and 0.7, with little change over latitude in accordance with the prevalence of more oxygenated waters, whereas the Si(OH)4 supply strongly increased from 0.5 to 3.8 at 12∘ S (Fig. 6a).
During the CWP the calculated source signatures based on Eqs. (2) and (3) result in values of 7.6 ‰ at 11∘ S, 8.6 ‰ at 12∘ S and 10.4 ‰ between 14 and 15∘ S during the CWP (Figs. 5c, 6b, S1 in the Supplement (Please confirm.)), which reflects a southward increase in source signatures as observed today (Fig. 2a). Based on these values the nutrient utilizations estimated based on Eq. (1) range between 30 % and 90 % for and 40 %–100 % for Si(OH)4 (Fig. 6b). During the LIA (arid) similar values are calculated with a mean value of 8 ‰ between 11 and 12∘ S, increasing to a value of 9 ‰ between 14 and 15∘ S (Fig. 6c). The respective nutrient utilization ranges between 2 % to 70 % for and 20 % to 85 % for Si(OH)4. The MAR TN were lower during the CWP by about 0.02 (g cm−2 yr−1) than today and MAR BSi values were generally higher by about 0.1–0.35 (g cm−2 yr−1). The calculated Si(OH)4 supply indicates a slight increase compared to today (as indicated by positive values) but has remained rather stable around 1 over all latitudes, while supply also indicates values of ∼1 at 11 and 15∘ S but the supply increased to 2 at 12∘ S (Fig. 6b, right side). During the LIA (arid) MARs of TN and BSi were both lower in comparison to the CWP, ranging between 0.014 and 0.017 (g cm−2 yr−1) and 0.25–0.7 (g cm−2 yr−1), respectively. The Si(OH)4 supply was similarly stable, as observed during the CWP, but slightly higher ranging from 0.6 to 1.55, while the supply was lower and decreased from north to south from 1 to 0.3.
The aim of this study is to reconstruct the extent of variability in δ15Nbulk caused as a function of denitrification versus nutrient utilization during specific time periods, i.e., the CWP and recurring short-term arid and humid periods during the LIA. The combination of δ15NBulk and δ30SiBSi signatures enables us to calculate the source signatures during these time periods and enabled us to estimate the extent of utilization that additionally contributed to the δ15Nbulk recorded in the sediments. These data are combined with the δ30SiBSi signatures, calculated Si(OH)4 utilization calculations and nutrient supply, which will be discussed in the following (1) in comparison to modern conditions and (2) in the context of consistency with ENSO variability observed off the coast Peru and the eastern equatorial Pacific (EEP) during the last 600 years. Due to similar conditions prevailing during the CWP and arid phases of the LIA we will discuss these time periods together in the following.
4.1 Disentangling nutrient supply, utilization and N-loss processes: changes in the source water nitrate isotopic composition
4.1.1 Humid conditions of the Little Ice Age
During the humid LIA the δ30SiBSi values remain remarkably stable, whereas δ15Nbulk values show a wide range, potentially reflecting enhanced limitation prevailing during humid phases (Fig. 5b). Such a shift towards increasing δ15Nbulk values with consistently low δ30SiBSi values is indicative of weaker denitrification due to the higher subsurface oxygenation (only suboxic and not anoxic conditions), in agreement with reconstructions of redox conditions (Salvatteci et al., 2014b; Sifeddine et al., 2008). This in agreement with the lower source signatures (6 ‰–7.5 ‰) and a decrease in the abundance of upwelling-indicating diatom species and Chaetoceros sp. (Figs. 4e–f and 6a; data from Fleury et al., 2015). Furthermore, our results indicate much higher utilization over Si(OH)4 utilization with ratios of up to 15:1 (Figs. 5b, 7a). This is in agreement with phytoplankton assemblage analyses during El Niño events when productivity has been reported to be dominated by non-siliceous phytoplankton groups (Sanchez et al., 2000), which is also observed today further off the coast of Peru (Fig. 3a; Grasse et al., 2016). Accordingly, with the prevalence of non-siliceous phytoplankton groups, more than Si(OH)4 is utilized (Conley and Malone, 1992; Wilkerson and Dugdale, 1996) and the ratio might shift to ratios of up to 15:1 (Figs. 3b, 7a; Grasse et al., 2016). However, the conditions found offshore today are based on surface waters that originate from the shelf area where diatom blooms prevail, thus already being depleted in Si(OH)4 and might not provide an adequate analogue for the conditions prevailing during the humid LIA phases (Figs. 5b, 6a). The calculated supply was lowest with little change over latitude in accordance with prevalence of more oxygenated waters, whereas the Si(OH)4 supply strongly increased, especially at 12∘ S (Fig. 6a). However, the calculated increased Si(OH)4 supply likely reflects the change in nutrient uptake (i.e., nutrient ratio) due to stratification and potential Fe limitation rather than an actual increase in Si(OH)4 supply reaching surface waters. Accordingly, we observe a high Si(OH)4 supply but low utilization, reflecting a low Si(OH)4 demand at the time. The supply appears to be lower than today, but the strongly enhanced utilization indicates a higher demand. This shift towards a decreased Si(OH)4 but an increased demand further supports a change in the nutrient uptake ratio by phytoplankton ( or 15:1, Figs. 5b, 7a). Regarding the high Si supply, it is also possible that is was actually bound by non-siliceous phytoplankton species, such as Synechococcus and not by diatoms as observed further offshore today (Fig. 3a; Grasse et al., 2016). However, these species are more likely to be recycled within the water column and Si stored within their cells is thus remineralized and not transported to the sediment. This might be the reason we observe low BSi (%) values and the δ30SiBSi remain equally low (Figs. 4, 5b).
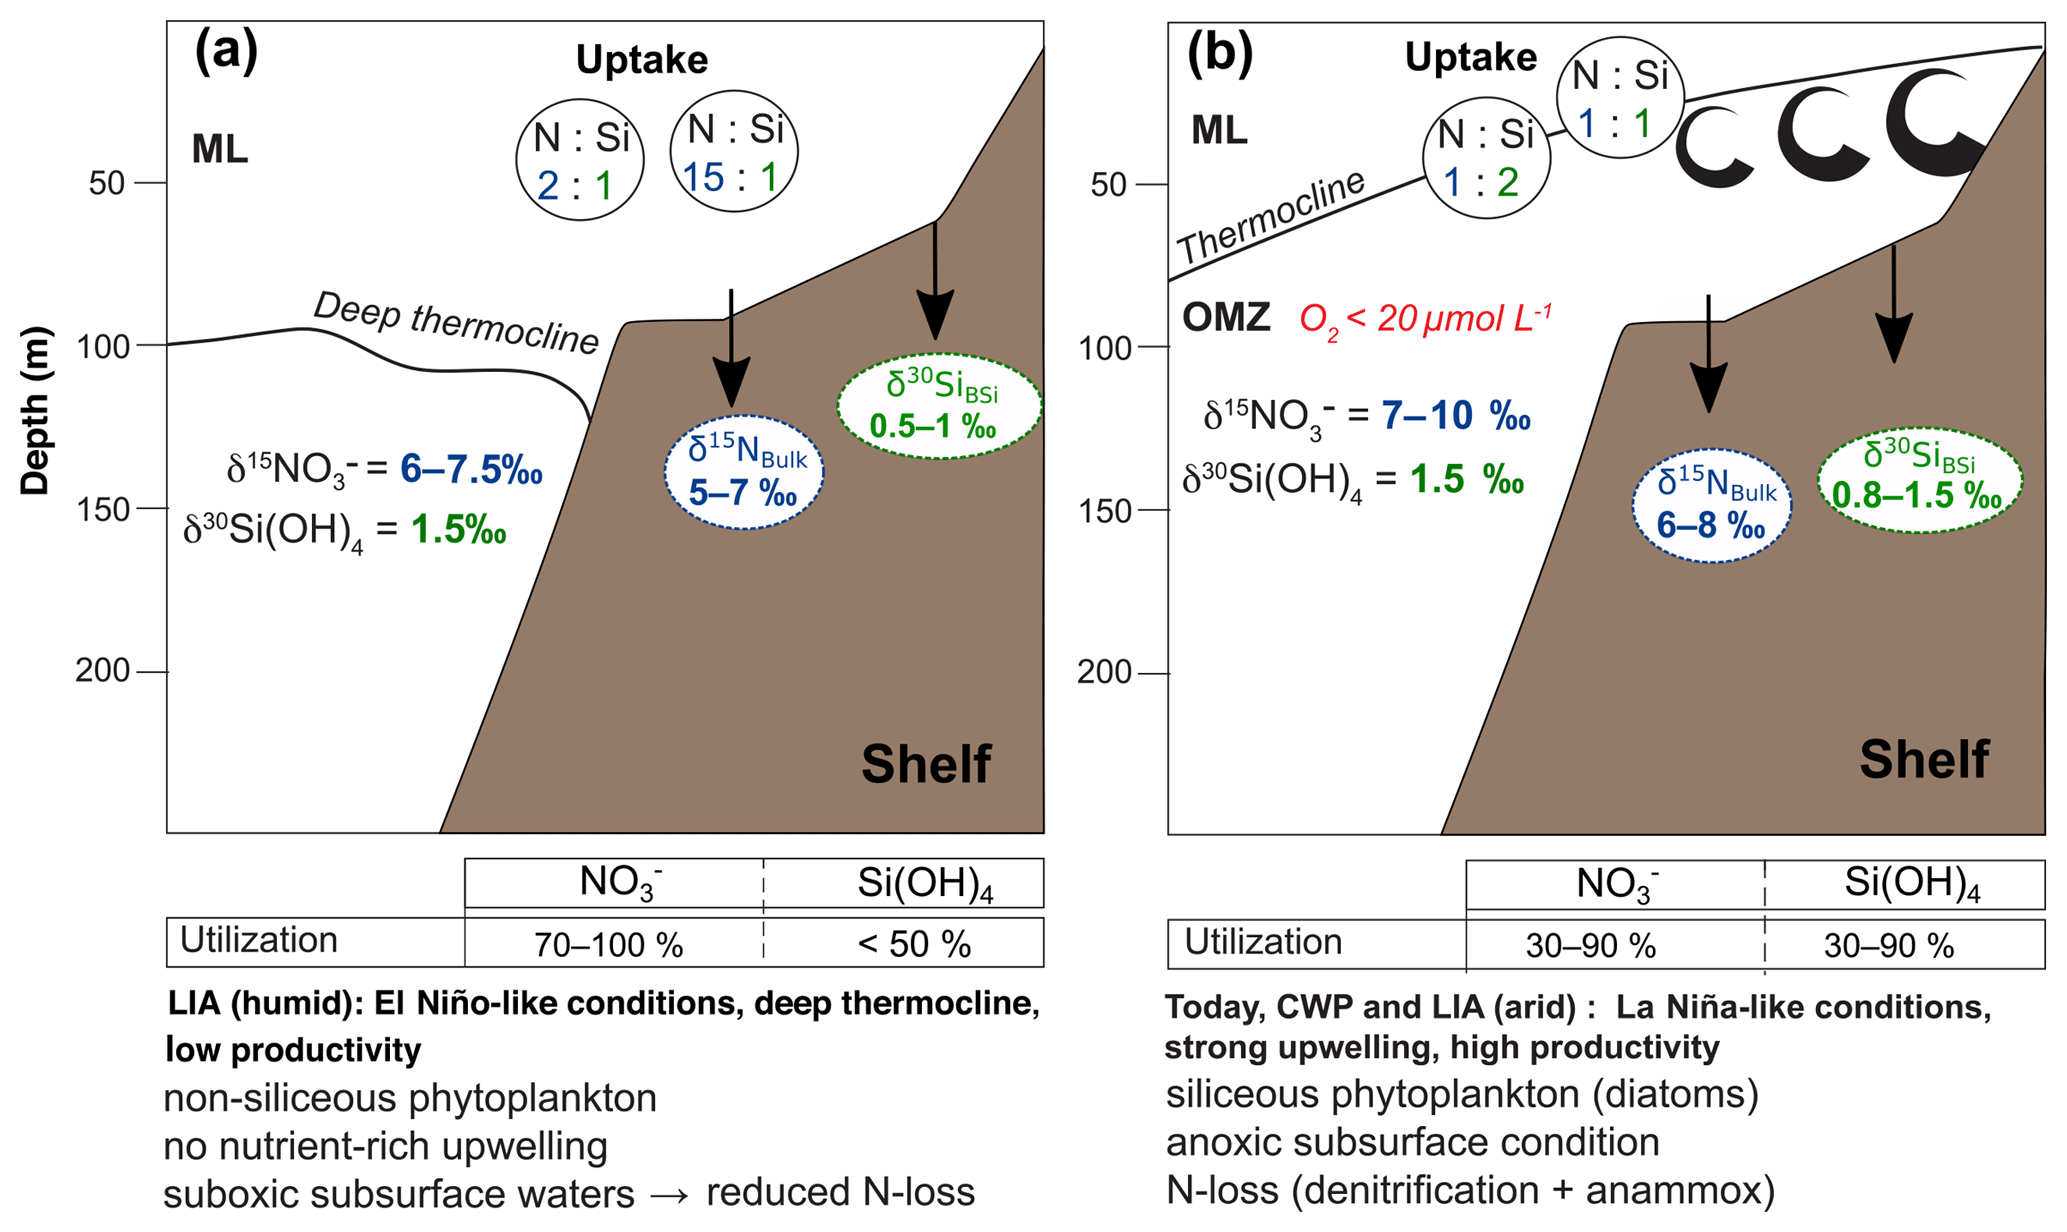
Figure 7Schematic nutrient (Si(OH)4 and ) cycle models for the Peruvian mixed layer (ML) and oxygen minimum zone (OMZ) along the shelf area (0–200 m water depth) during the last 600 years. The (N:Si) indicates the ratio in which both nutrients are taken up during biological production in surface waters.
4.1.2 The Current Warm Period and arid phases of the Little Ice Age
The calculated source values based on linear regression between δ15NBulk and δ30SiBSi indicate an increase in the source signatures of upwelled subsurface waters from north to south from ∼7 ‰ to 10 ‰ during the CWP and arid phases of the LIA, similar to those observations for modern conditions (Figs. 2a, 5c–d, 7b). This is in agreement with high contributions of upwelling diatoms and Chaetoceros sp. during both time periods (Figs. 4e–g. and 6b–c; data from Fleury et al., 2015). The calculated Si(OH)4 and supplies indicate a slight increase compared to today with Si(OH)4 supply increasing and supply decreasing towards the southern shelf. The latter agrees with continuous denitrification in the southern area causing a loss of . Furthermore, nutrient utilization for both and Si(OH)4 were moderate to high (∼30 %–90 %; Figs. 6b–c, 7b), similar to modern values between 10 and 15∘ S (Fig. 2b; Mollier-Vogel et al., 2012; Ehlert et al., 2012). Due to the incomplete utilization of , the increasing source values are also only partially reflected in the δ15NBulk signatures for the CWP and the LIA (arid) as previously reported for signatures from surface sediments (Mollier-Vogel et al., 2012). Especially during the CWP, we calculate about 20 %–40 % lower utilization compared to today (Fig. 2b) but at the same time supply increased, while Si(OH)4 supply was only slightly higher compared to today and remained rather stable with latitude (Fig. 6b, right side). Apparently, the nutrient concentration of upwelled waters during the CWP has been different from today, which is also supported by a difference in the ratio of :Si(OH)4 utilization (Fig. 5c). Accordingly, unlike today's surface sediment data, the cores at 11S and 12∘ S show substantially higher δ30SiBSi values during both the CWP and the LIA (arid) (Fig. 5c–d). These higher δ30SiBSi signatures result in a utilization that has shifted towards a 1:2 ratio, indicating enhanced utilization of Si(OH)4 over , potentially leading to Si(OH)4 limitation, in agreement with the lower Si(OH)4 supply in comparison to and higher Si(OH)4 than utilization rates (Fig. 6b–c). Such a decoupling of Si and N within diatoms can be caused by biogeochemical changes, such as Fe availability altering the Si:N uptake dynamics (Hutchins and Bruland, 1998; Takeda, 1998), whereby elevated Si:N ratios are characteristic for Fe-limited diatom communities (Takeda, 1998). Accordingly, increased uptake of Si over N can lead to a Si(OH)4 limitation, as found during the CWP and the LIA arid phases at 11 to 12∘ S (Figs. 5c–d, 6b–c, 7b). The reason may have been that less Fe was upwelled at the narrow shelf between 11 and 16∘ S, which led to Fe-limitation during progressing diatom blooms (Doering et al., 2016).
4.2 The coupling between the biogeochemical cycle and ENSO variability
Recent evidence shows that a cool EEP plays a key role in climate change due to its linkage to a slowdown in global warming (England et al., 2014; Kosaka and Xie, 2013), highlighting the importance of understanding Pacific climate variability in the past (Rustic et al., 2015). The last millennium has been divided into warmer global conditions over the Medieval Warm Period (MWP), colder temperatures over the LIA and rising temperatures since the beginning of the CWP (Mann et al., 1999). The transition between the MWP and the LIA (∼1150 to 1500 CE) has been associated with an anomalous strong zonal SST gradient and with transitional Northern Hemisphere (NH) cooling into the LIA, as evidenced by cooler SSTs at Galápagos (Rustic et al., 2015). After ∼1500 CE, the EEP cooling trend ended and local SSTs began to increase until around 1600 CE, when an anomalous weak zonal gradient was established when the EEP temperatures reversed from cooling to warming. This reversal occurred when the NH descended into the coldest part of the LIA and persisted throughout most of the LIA resulting in an extended El Niño-like mean state (Mann et al., 2009). Evidence links the ITCZ to hemispheric warming and cooling cycles, implying southward ITCZ displacements during NH cold periods (Chiang and Bitz, 2005; Schneider et al., 2014). Accordingly, a southward shift of the ITCZ during the MWP-LIA transition has been proposed for the Atlantic and Pacific (Haug et al., 2001; Peterson and Haug, 2006; Sachs et al., 2009). The El Niño-like conditions during the LIA have been associated to a gradual intensification of the fluvial input of sediments to the continental shelf, as reflected by an increase in the terrigenous sediment flux (Briceño-Zuluaga et al., 2016; Gutiérrez et al., 2009; Sifeddine et al., 2008) and changes in the radiogenic isotopic composition of the terrigenous fraction due to changes in the provenance and material transport (Ehlert et al., 2015), as well as better oxygenation and a lower productivity in the Peruvian upwelling area (Gutiérrez et al., 2009; Salvatteci et al., 2014b; Sifeddine et al., 2008). Accordingly, most of the LIA, i.e., the humid phases, have been characterized by low productivity and weak denitrification intensity between 10 and 15∘ S (Díaz-Ochoa et al., 2009; Salvatteci et al., 2014b; Sifeddine et al., 2008), which is supported by the absence of a significant southward increase in the source value of reconstructed from our records (Figs. 5b, 6a). Correspondingly, high δ15Nbulk and little change in reconstructed supply indicate more complete utilization during the LIA (humid), while δ30SiBSi signatures and utilization remained low and Si supply high (Fig. 6a). This indicates a shift towards a dominance of non-siliceous phytoplankton productivity causing limitation and low uptake of Si. This is in agreement with modern conditions during El Nino events for which physical-biogeochemical models, together with in situ and satellite observations (1958–2008), have shown that the temperatures and sea level increase, the thermocline and nutricline deepens, and the phytoplankton (mainly diatoms) and nutrient concentration decrease along the Peruvian coast (Espinoza-Morriberón et al., 2017). Coastal trapped waves propagating along the coast can seasonally increase the depth of thermocline and nutricline, decreasing the vertical flux into the surface layer. The and Fe content of the upwelling source waters may also strongly decline (Espinoza-Morriberón et al., 2017). Our calculations show that phases of lower productivity during so-called El Niño-like conditions during the LIA (humid) have a source delivered to the Peru upwelling area similar to today (Fig. 6a), but due to less or no denitrification source does not increase southward (Figs. 5b, 6a). Instead δ15NBulk values are mainly affected by the variability of concentrations, which seem to be the limiting factor for primary productivity (PP) similar to that observed during El Niño events today (Espinoza-Morriberón et al., 2017). The stronger stratification due to deepening of the nutricline potentially does not allow for similarly efficient N remineralization (or N is transported offshore due to eddy activity, Espinoza-Morriberón et al., 2017) and may result in to be utilized more strongly than Si(OH)4 (Fig. 7a). Accordingly, the supply was diminished while Si(OH)4 was still available.
Finely laminated sediment from the LIA from the oxygen minimum zones (OMZs), which have also been used in this study, resolve multidecadal variations in precipitation over the continent, and of variations in detrital and biogenic fluxes in relation to precipitation and upwelling intensity (Briceño-Zuluaga et al., 2016, Díaz-Ochoa et al., 2009; Fleury et al., 2015, 2016; Salvatteci et al., 2014a). Stable oxygen isotope compositions of individual planktic foraminifera point to greater ENSO activity (high frequency between alternating La Niña and El Niño conditions) in the EEP based on records from the Galápagos (Rustic et al., 2015). It was shown by coupled models that such multi-decadal variation in ENSO amplitude can arise from episodic strengthening and weakening of the thermocline feedback (Borlace et al., 2013). The difference we observed in the isotopic evolution of nutrients (δ15N and δ30Si) between the arid and humid phases during the LIA support the development of multidecadal phases of prevailing La Niña- or El Niño-like conditions. Similar interannual variance has been observed based on organic carbon and carbonate proxies during the LIA within the California current system, which the authors related to large ENSO events in contrast with an apparent reduction in such variability during the CWP (Abella-Gutiérrez and Herguera, 2016).
This El Niño-like mean state appears to have ended at the beginning of the CWP (Rustic et al., 2015). Evidence for increasing precipitation off the coast of Panama after 1700 CE likely reflects the northward shift of the ITCZ (Linsley et al., 1994) from its more southerly LIA position. During the CWP the OMZ intensified and marine productivity increased together with surface temperature cooling and an increase in terrigenous material input (Briceño-Zuluaga et al., 2016; Gutiérrez et al., 2011). We find that the CWP and the LIA (arid) are characterized by high upwelling intensity, productivity, and N-loss processes (Fleury et al., 2015; Salvatteci et al., 2014b; Sifeddine et al., 2008) and are associated with southward increasing source signatures caused by denitrification, reflecting moderate utilization and moderate to high Si(OH)4 utilization (Fig. 7b). The highest δ30SiBSi and utilization values at 15∘ S are potentially caused by progressive Fe limitation during diatom blooms, causing a ratio of up to 1:2. Southward increasing δ15Nbulk values and calculated demonstrate the consistent incorporation of higher isotopic compositions due to subsurface denitrification under anoxic subsurface conditions, in agreement with decreasing supply illustrating the N-loss process.
Based on a compilation of new and previously published δ30SiBSi and δ15Nbulk records of several short sediment cores from the southern Peruvian shelf (11–15∘ S), we present a new evaluation of the impact of denitrification on the isotopic source signature of and its subsequent utilization. As denitrification increases southward along the shelf today, we applied a latitudinal comparison between δ30SiBSi and δ15Nbulk signatures in modern surface and latest Holocene sediments. Given that during the last 600 years both proxies have mainly been influenced by nutrient utilization, we performed a novel calculation of subsurface based on the linear regression of δ30SiBSi and δ15Nbulk signatures for the CWP and the LIA (arid versus humid conditions). Our results show that low productivity and higher subsurface oxygenation (suboxic conditions) during the humid phases of LIA were associated with low δ30SiBSi and δ15Nbulk signatures. The latitudinal comparison of δ30SiBSi versus δ15Nbulk signatures supports decreased influence of subsurface denitrification on the isotope distribution, with lower and more uniform source signatures between 6 ‰ and 7.5 ‰. However, utilization was significantly higher, while Si(OH)4 utilization was lower because the Si(OH)4 supply was higher compared to the demand. This change in nutrient utilization is reflected by a uptake ratio of up to 15:1, suggesting a shift from a diatom-dominated regime to one dominated by non-siliceous phytoplankton. This agrees with El Niño-like conditions prevailing during most of the LIA, accompanied by a deepening of the thermocline and lower nutrient availability. During the CWP and the sporadic arid conditions during the LIA, the isotopic compositions of increased southward due to subsurface denitrification under strong oxygen depletion, similar to modern conditions. Furthermore, enhanced Si(OH)4 over uptake characterized nutrient utilization over uptake, reflecting strong diatom blooms, as can observed, potentially leading to progressive Fe limitation increasing the Si:N uptake ratio of diatoms to 2:1.
In summary, our results constitute an improvement of the application of combined δ30SiBSi and δ15Nbulk signatures as a powerful tool to differentiate between past changes in subsurface denitrification, nutrient utilization and supply but also changes in the nutrient ratios as a result of either micro-(Fe) or macro-nutrient limitation.
All data are available at https://doi.pangaea.de/10.1594/PANGAEA.901858 (Doering et al., 2019).
The supplement related to this article is available online at: https://doi.org/10.5194/bg-16-2163-2019-supplement.
KD conducted the sampling of the sediment cores at Bordeaux University. KD prepared the samples and performed the isotope measurements. KD wrote the manuscript with contributions from all co-authors.
The authors declare that they have no conflict of interest.
This work is a contribution of the Collaborative Research Centre 754 “Climate-Biogeochemistry interactions in the Tropical Ocean” (https://www.sfb754.de/, last access: 21 May 2019), which is supported by the Deutsche Forschungsgemeinschaft (DFG).
The article processing charges for this open-access publication were covered by a Research Centre of the Helmholtz Association.
This paper was edited by Xinming Wang and reviewed by Patrick Rafter and one anonymous referee.
Abella-Gutiérrez, J. and Herguera, J. C.: Sensitivity of carbon paleoproductivity in the Southern California Current System on different time scales for the last 2 ka, Paleoceanography, 31, 953–970, https://doi.org/10.1002/2015PA002872, 2016.
Agnihotri, R., Altabet, M. A., and Herbert, T. D.: Influence of marine denitrification on atmospheric variability during the Holocene, Geophys. Res. Lett., 33, L13704, https://doi.org/10.1029/2006GL025864, 2006.
Agnihotri, R., Altabet, M. A., Herbert, T. D., and Tierney, J. E.: Subdecadally resolved paleoceanography of the Peru margin during the last two millennia, Geochem. Geophys. Geosyst., 9, Q05013, https://doi.org/10.1029/2007GC001744, 2008.
Albarède, F., Telouk, P., Blichert-Toft, J., Boyet, M., Agranier, A., and Nelson, B.: Precise and accurate isotopic measurements using multiple-collector ICPMS, Geochim. Cosmochim. Acta, 68, 2725–2744, https://doi.org/10.1016/j.gca.2003.11.024, 2004.
Altabet, M. A., Deuser, W. G., Honjo, S., and Stienen, C.: Seasonal and Depth-Related Changes in the Source of Sinking Particles in the North-Atlantic, Nature, 354, 136–139, 1991.
Barber, R. T. and Chávez, F. P.: Biological Consequences of El Nino, Science, 222, 1203–1210, https://doi.org/10.1126/science.222.4629.1203, 1983.
Beucher, C. P., Brzezinski, M. A., and Jones, J. L.: Mechanisms controlling silicon isotope distribution in the Eastern Equatorial Pacific, Geochim. Cosmochim. Acta, 75, 4286–4294, https://doi.org/10.1016/j.gca.2011.05.024, 2011.
Borlace, S., Cai, W., and Santoso, A.: Multi-decadal ENSO amplitude variability in a 1000-year simulation of a coupled global climate model: Implication for observed ENSO variability, J. Climate, 26, 9399–9407, https://doi.org/10.1175/JCLI-D-13-00281.1, 2013.
Briceño-Zuluaga, F. J., Sifeddine, A., Caquineau, S., Cardich, J., Salvatteci, R., Gutierrez, D., Ortlieb, L., Velazco, F., Boucher, H., and Machado, C.: Terrigenous material supply to the Peruvian central continental shelf (Pisco, 14∘ S) during the last 1000 years: paleoclimatic implications, Clim. Past, 12, 787–798, https://doi.org/10.5194/cp-12-787-2016, 2016.
Brink, K. H., Halpern, D., Huyer, A., and Smith, R. L.: The Physical-Environment of the Peruvian Upwelling System, Prog. Oceanogr., 12, 285–305, 1983.
Bruland, K. W., Rue, E. L., Smith, G. J., and DiTullio, G. R.: Iron, macronutrients and diatom blooms in the Peru upwelling regime: brown and blue waters of Peru, Mar. Chem., 93, 81–103, https://doi.org/10.1016/j.marchem.2004.06.011, 2005.
Brunelle, B. G., Sigman, D. M., Cook, M. S., Keigwin, L. D., Haug, G. H., Plessen, B., Schettler, G., and Jaccard, S. L.: Evidence from diatom-bound nitrogen isotopes for subarctic Pacific stratification during the last ice age and a link to North Pacific denitrification changes, Paleoceanography, 22, PA1215, https://doi.org/10.1029/2005PA001205, 2007.
Brzezinski, M. A.: The Si:C:N Ratio of Marine Diatoms: Interspecific variability and the Effect of some Environmental Variables, J. Phycol., 21, 347–357, https://doi.org/10.1111/j.0022-3646.1985.00347.x, 1985.
Brzezinski, M. A.: A switch from Si(OH)4 to NO depletion in the glacial Southern Ocean, Geophys. Res. Lett., 29, 1564, https://doi.org/10.1029/2001GL014349, 2002.
Chaigneau, A., Dominguez, N., Eldin, G., Vasquez, L., Flores, R., Grados, C., and Echevin, V.: Near-coastal circulation in the Northern Humboldt Current System from shipboard ADCP data, J. Geophys. Res.-Oceans, 118, 5251–5266, https://doi.org/10.1002/jgrc.20328, 2013.
Chavez, F. P.: Size Distribution of phytoplankton in the central and eastern tropical Pacific, Global Biogeochem. Cy., 3, 27–35, https://doi.org/10.1029/GB003i001p00027, 1989.
Chiang, J. C. H. and Bitz, C. M.: Influence of high latitude ice cover on the marine Intertropical Convergence Zone, Clim. Dyn., 25, 477–496, https://doi.org/10.1007/s00382-005-0040-5, 2005.
Cline, J. D. and Kaplan, I. R.: Isotopic fractionation of dissolved nitrate during denitrification in the eastern tropical North Pacific Ocean, Mar. Chem., 3, 271–299, 1975.
Closset, I., Cardinal, D., Bray, S. G., Thil, F., Djouraev, I., Rigual-Hernández, A. S., and Trull, T. W.: Seasonal variations, origin, and fate of settling diatoms in the Southern Ocean tracked by silicon isotope records in deep sediment traps, Global Biogeochem. Cy., 29, 1495–1510, https://doi.org/10.1002/2015GB005180, 2015.
Codispoti, L. A.: An oceanic fixed nitrogen sink exceeding 400 Tg N a−1 vs the concept of homeostasis in the fixed-nitrogen inventory, Biogeosciences, 4, 233–253, https://doi.org/10.5194/bg-4-233-2007, 2007.
Conley, D. J. and Malone, T. C.: Annual cycle of dissolved silicate in Chesapeake Bay: implications for the production and fate of phytoplankton biomass, Mar. Ecol. Prog. Ser., 81, 121–128, 1992.
De La Rocha, C. L., Brzezinski, M. A., and DeNiro, M. J.: Fractionation of silicon isotopes by marine diatoms during biogenic silica formation, Geochim. Cosmochim. Acta, 61, 5051–5056, 1997.
De La Rocha, C. L., Brzezinski, M. A., DeNiro, M. J., and Shemesh, A.: Silicon-isotope composition of diatoms as an indicator of past oceanic change, Nature, 395, 680–683, 1998.
De La Rocha, C. L., Hutchins, D. A., Brzezinski, M. A., and Zhang, Y.: Effects of iron and zinc deficiency on elemental composition and silica production by diatoms, Mar. Ecol. Prog. Ser., 195, 71–79, 2000.
Demarest, M. S., Brzezinski, M. A., and Beucher, C. P.: Fractionation of silicon isotopes during biogenic silica dissolution, Geochim. Cosmochim. Acta, 73, 5572–5583, https://doi.org/10.1016/j.gca.2009.06.019, 2009.
DeMaster, D. J.: The Supply and Accumulation of Silica in the Marine-Environment, Geochim. Cosmochim. Acta, 45, 1715–1732, 1981.
De Pol-Holz, R., Ulloa, O., Lamy, F., Dezileau, L., Sabatier, P., and Hebbeln, D.: Late Quaternary variability of sedimentary nitrogen isotopes in the eastern South Pacific Ocean, Paleoceanography, 22, PA2207, https://doi.org/10.1029/2006PA001308, 2007.
de Souza, G. F., Reynolds, B. C., Rickli, J., Frank, M., Saito, M. A., Gerringa, L. J. A., and Bourdon, B.: Southern Ocean control of silicon stable isotope distribution in the deep Atlantic Ocean, Global Biogeochem. Cy., 26, 2035–2047, https://doi.org/10.1029/2011GB004141, 2012.
Díaz-Ochoa, J. A., Lange, C. B., Pantoja, S., De Lange, G. J., Gutiérrez, D., Muñoz, P., and Salamanca, M.: Fish scales in sediments from off Callao, central Peru, Deep Sea Res. Pt. II, 56, 1124–1135, https://doi.org/10.1016/j.dsr2.2008.09.015, 2009.
Doering, K., Ehlert, C., Grasse, P., Crosta, X., Fleury, S., Frank, M., and Schneider, R.: Differences between mono-generic and mixed diatom silicon isotope compositions trace present and past nutrient utilisation off Peru, Geochim. Cosmochim. Acta, 177, 30–47, https://doi.org/10.1016/j.gca.2015.12.029, 2016.
Doering, K., Ehlert, C., Martinez, P., Frank, M., and Schneider, R. R.: Stable Silicon Isotopes data and biogenic opal concentrations of Trigger cores M772-024, 005 and 003 off Peru, PANGAEA, https://doi.pangaea.de/10.1594/PANGAEA.901858, 2019.
Egan, K. E., Rickaby, R. E. M., Leng, M. J., Hendry, K. R., Hermoso, M., Sloane, H. J., Bostock, H., and Halliday, A. N.: Diatom silicon isotopes as a proxy for silicic acid utilisation: A Southern Ocean core top calibration, Geochim. Cosmochim. Acta, 96, 174–192, https://doi.org/10.1016/j.gca.2012.08.002, 2012.
Ehlert, C., Grasse, P., Mollier-Vogel, E., Böschen, T., Franz, J., de Souza, G. F., Ben C Reynolds, Stramma, L., and Frank, M.: Factors controlling the silicon isotope distribution in waters and surface sediments of the Peruvian coastal upwelling, Geochim. Cosmochim. Acta, 99, 128–145, https://doi.org/10.1016/j.gca.2012.09.038, 2012.
Ehlert, C., Grasse, P., and Frank, M.: Changes in silicate utilisation and upwelling intensity off Peru since the Last Glacial Maximum - insights from silicon and neodymium isotopes, Quaternary Sci. Rev., 72, 18–35, https://doi.org/10.1016/j.quascirev.2013.04.013, 2013.
Ehlert, C., Grasse, P., Gutiérrez, D., Salvatteci, R., and Frank, M.: Nutrient utilisation and weathering inputs in the Peruvian upwelling region since the Little Ice Age, Clim. Past, 11, 187–202, https://doi.org/10.5194/cp-11-187-2015, 2015.
Ehlert, C., Doering, K., Wallmann, K., Scholz, F., Sommer, S., Grasse, P., Geilert, S., and Frank, M.: Stable silicon isotope signatures of marine pore waters – Biogenic opal dissolution versus authigenic clay mineral formation, Geochim. Cosmochim. Acta, 191, 102–117, https://doi.org/10.1016/j.gca.2016.07.022, 2016.
England, M. H., McGregor, S., Spence, P., Meehl, G. A., Timmermann, A., Cai, W., Gupta, A. S., McPhaden, M. J., Purich, A., and Santoso, A.: Recent intensification of wind-driven circulation in the Pacific and the ongoing warming hiatus, Nature Clim. Change, 4, 222–227, https://doi.org/10.1038/nclimate2106, 2014.
Espinoza-Morriberón, D., Echevin, V., Colas, F., Tam, J., Ledesma, J., Vásquez, L., and Graco, M.: Impacts of El Niño events on the Peruvian upwelling system productivity, J. Geophys. Res.-Oceans, 115, 201, https://doi.org/10.1002/2016JC012439, 2017.
Fleury, S., Martinez, P., Crosta, X., Charlier, K., Billy, I., Hanquiez, V., Blanz, T., and Schneider, R. R.: Pervasive multidecadal variations in productivity within the Peruvian Upwelling System over the last millennium, Quaternary Sci. Rev., 125, 78–90, https://doi.org/10.1016/j.quascirev.2015.08.006, 2015.
Fleury, S., Crosta, X., Schneider, R., Blanz, T., Ther, O., and Martinez, P.: Centennial-scale variations in diatom productivity off Peru over the last 3000 years, Holocene, 26, 520–531, https://doi.org/10.1177/0959683615612589, 2016.
François, R., Altabet, M. A., and Burckle, L. H.: Glacial to interglacial changes in surface nitrate utilization in the Indian sector of the Southern Ocean as recorded by sediment δ15N, Paleoceanography, 7, 589–606, 1992.
Fripiat, F., Cavagna, A.-J., Dehairs, F., de Brauwere, A., André, L., and Cardinal, D.: Processes controlling the Si-isotopic composition in the Southern Ocean and application for paleoceanography, Biogeosciences, 9, 2443–2457, https://doi.org/10.5194/bg-9-2443-2012, 2012.
Grasse, P., Ehlert, C., and Frank, M.: The influence of water mass mixing on the dissolved Si isotope composition in the Eastern Equatorial Pacific, Earth Planet. Sc. Lett., 380, 60–71, https://doi.org/10.1016/j.epsl.2013.07.033, 2013.
Grasse, P., Ryabenko, E., Ehlert, C., Altabet, M. A., and Frank, M.: Silicon and nitrogen cycling in the upwelling area off Peru: A dual isotope approach, Limnol. Oceangr., 61, 1661–1676, https://doi.org/10.1002/lno.10324, 2016.
Gutiérrez, D., Sifeddine, A., Field, D. B., Ortlieb, L., Vargas, G., Chávez, F. P., Velazco, F., Ferreira, V., Tapia, P., Salvatteci, R., Boucher, H., Morales, M. C., Valdés, J., Reyss, J.-L., Campusano, A., Boussafir, M., Mandeng-Yogo, M., García, M., and Baumgartner, T.: Rapid reorganization in ocean biogeochemistry off Peru towards the end of the Little Ice Age, Biogeosciences, 6, 835–848, https://doi.org/10.5194/bg-6-835-2009, 2009.
Gutiérrez, D., Bouloubassi, I., and Sifeddine, A.: Coastal cooling and increased productivity in the main upwelling zone off Peru since the mid-twentieth century, Geophys. Res. Lett., 38, L07603, https://doi.org/10.1029/2010GL046324, 2011.
Haug, G. H., Hughen, K. A., Sigman, D. M., Peterson, L. C., and Röhl, U.: Southward Migration of the Intertropical Convergence Zone Through the Holocene, Science, 293, 1304–1308, https://doi.org/10.1126/science.1059725, 2001.
Horn, M. G., Beucher, C. P., Robinson, R. S., and Brzezinski, M. A.: Southern ocean nitrogen and silicon dynamics during the last deglaciation, Earth Planet. Sc. Lett., 310, 334–339, https://doi.org/10.1016/j.epsl.2011.08.016, 2011.
Hutchins, D. A. and Bruland, K. W.: Iron-limited diatom growth and Si: N uptake ratios in a coastal upwelling regime, Nature, 393, 561–564, 1998.
Kosaka, Y. and Xie, S.-P.: Recent global-warming hiatus tied to equatorial Pacific surface cooling, Nature, 501, 403, https://doi.org/10.1038/nature12534, 2013.
Lam, P., Lavik, G., Jensen, M. M., van de Vossenberg, J., Schmid, M., Woebken, D., Gutiérrez, D., Amann, R., Jetten, M. S., and Kuypers, M. M.: Revising the nitrogen cycle in the Peruvian oxygen minimum zone, P. Natl. Acad. Sci., 106, 4752–4757, 2009.
Linsley, B. K., Dunbar, R. B., Wellington, G. M., and Mucciarone, D. A.: A coral-based reconstruction of Intertropical Convergence Zone variability over Central America since 1707, J. Geophys. Res.-Oceans, 99, 9977–9994, https://doi.org/10.1029/94JC00360, 1994.
Mann, M. E., Bradley, R. S., and Hughes, M. K.: Northern hemisphere temperatures during the past millennium: Inferences, uncertainties, and limitations, Geophys. Res. Lett., 26, 759–762, https://doi.org/10.1029/1999GL900070, 1999.
Mann, M. E., Zhang, Z., Rutherford, S., Bradley, R. S., Hughes, M. K., Shindell, D., Ammann, C., Faluvegi, G., and Ni, F.: Global Signatures and Dynamical Origins of the Little Ice Age and Medieval Climate Anomaly, Science, 326, 1256–1260, https://doi.org/10.1126/science.1177303, 2009.
Mariotti, A., Germon, J. C., Hubert, P., Kaiser, P., Letolle, R., Tardieux, A., and Tardieux, P.: Experimental determination of nitrogen kinetic isotope fractionation: some principles; illustration for the denitrification and nitrification processes, Plant Soil, 62, 413–430, 1981.
Mollier-Vogel, E., Ryabenko, E., Martinez, P., Wallace, D., Altabet, M. A., and Schneider, R.: Nitrogen isotope gradients off Peru and Ecuador related to upwelling, productivity, nutrient uptake and oxygen deficiency, Deep-Sea Res. Pt. I, 70, 14–25, https://doi.org/10.1016/j.dsr.2012.06.003, 2012.
Morón, A. O.: Características del ambiente marino frente a la costa peruana, Bol. Inst. Mar Peru, 19, 179–204, 2000.
Müller, P. J. and Schneider, R.: An Automated Leaching Method for the Determination of Opal in Sediments and Particulate Matter, Deep-Sea Res. Pt. I, 40, 425–444, 1993.
Pennington, J. T., Mahoney, K. L., Kuwahara, V. S., Kolber, D. D., Calienes, R., and Chavez, F. P.: Primary production in the eastern tropical Pacific: A review, Prog. Oceanogr., 69, 285–317, https://doi.org/10.1016/j.pocean.2006.03.012, 2006.
Peterson, L. C. and Haug, G. H.: Variability in the mean latitude of the Atlantic Intertropical Convergence Zone as recorded by riverine input of sediments to the Cariaco Basin (Venezuela), Paleogeogr. Paleoclimatol. Paleoecol., 234, 97–113, https://doi.org/10.1016/j.palaeo.2005.10.021, 2006.
Picaut, J., Ioualalen, M., Menkes, C., Delcroix, T., and McPhaden, M. J.: Mechanism of the Zonal Displacements of the Pacific Warm Pool: Implications for ENSO, Science, 274), 1486–1489, https://doi.org/10.1126/science.274.5292.1486, 1996.
Pichevin, L., Martinez, P., Bertrand, P., Schneider, R., Giraudeau, J., and Emeis, K.: Nitrogen cycling on the Namibian shelf and slope over the last two climatic cycles: Local and global forcings, Paleoceanography, 20, PA2006, https://doi.org/10.1029/2004PA001001, 2005.
Rafter, P. A. and Sigman, D. M.: Spatial distribution and temporal variation of nitrate nitrogen and oxygen isotopes in the upper equatorial Pacific Ocean, Limnol. Oceangr., 61, 14–31, https://doi.org/10.1002/lno.10152, 2016.
Rafter, P. A., Sigman, D. M., Charles, C. D., Kaiser, J., and Haug, G. H.: Subsurface tropical Pacific nitrogen isotopic composition of nitrate: Biogeochemical signals and their transport, Global Biogeochem. Cy., 26, GB1003, https://doi.org/10.1029/2010GB003979, 2012.
Ragueneau, O., Tréguer, P., Leynaert, A., Anderson, R. F., Brzezinski, M. A., DeMaster, D. J., Dugdale, R. C., Dymond, J., Fischer, G., and Francois, R.: A review of the Si cycle in the modern ocean: recent progress and missing gaps in the application of biogenic opal as a paleoproductivity proxy, Global Planet. Change, 26, 317–365, 2000.
Rein, B.: A major Holocene ENSO anomaly during the Medieval period, Geophys. Res. Lett., 31, L17211, https://doi.org/10.1029/2004GL020161, 2004.
Reynolds, B. C., Frank, M., and Halliday, A. N.: Evidence for a major change in silicon cycling in the subarctic North Pacific at 2.73 Ma, Paleoceanography, 23, PA4219, https://doi.org/10.1029/2007PA001563, 2008.
Robinson, R. S., Brzezinski, M. A., Beucher, C. P., Horn, M. G. S., and Bedsole, P.: The changing roles of iron and vertical mixing in regulating nitrogen and silicon cycling in the Southern Ocean over the last glacial cycle, Paleoceanography, 29, 1179–1195, https://doi.org/10.1002/2014PA002686, 2014.
Rustic, G. T., Koutavas, A., Marchitto, T. M., and Linsley, B. K.: Dynamical excitation of the tropical Pacific Ocean and ENSO variability by Little Ice Age cooling, Science, 350, 1537–1541, https://doi.org/10.1126/science.aac9937, 2015.
Sachs, J. P., Sachse, D., Smittenberg, R. H., Zhang, Z., Battisti, D. S., and Golubic, S.: Southward movement of the Pacific intertropical convergence zone AD 1400–1850, Nature Geosci., 2, 519–525, https://doi.org/10.1038/ngeo554, 2009.
Salvatteci, R., Field, D., Sifeddine, A., Ortlieb, L., Ferreira, V., Baumgartner, T., Caquineau, S., Velazco, F., Reyss, J.-L., Sanchez-Cabeza, J. A., and Gutiérrez, D.: Cross-stratigraphies from a seismically active mud lens off Peru indicate horizontal extensions of laminae, missing sequences, and a need for multiple cores for high resolution records, Mar. Geol., 357, 72–89, https://doi.org/10.1016/j.margeo.2014.07.008, 2014a.
Salvatteci, R., Gutiérrez, D., Field, D., Sifeddine, A., Ortlieb, L., Bouloubassi, I., Boussafir, M., Boucher, H., and Cetin, F.: The response of the Peruvian Upwelling Ecosystem to centennial-scale global change during the last two millennia, Clim. Past, 10, 715–731, https://doi.org/10.5194/cp-10-715-2014, 2014b.
Sanchez, G., Calienes, R., and Zuta, S.: The 1997–98 El Niño and its effects on the coastal marine ecosystem off Peru, Reports of California Cooperative Oceanic Fisheries Investigations, 41, 62–86, 2000.
Schneider, T., Bischoff, T., and Haug, G. H.: Migrations and dynamics of the intertropical convergence zone, Nature, 513, 45, https://doi.org/10.1038/nature13636, 2014.
Sifeddine, A., Gutiérrez, D., Ortlieb, L., Boucher, H., Velazco, F., Field, D., Vargas, G., Boussafir, M., Salvatteci, R., Ferreira, V., García, M., Valdés, J., Caquineau, S., Mandeng Yogo, M., Cetin, F., Solis, J., Soler, P., and Baumgartner, T.: Laminated sediments from the central Peruvian continental slope: A 500 year record of upwelling system productivity, terrestrial runoff and redox conditions, Prog. Oceanogr., 79, 190–197, https://doi.org/10.1016/j.pocean.2008.10.024, 2008.
Sutton, J. N., Varela, D. E., Brzezinski, M. A., and Beucher, C. P.: Species-dependent silicon isotope fractionation by marine diatoms, Geochim. Cosmochim. Acta, 104, 300–309, https://doi.org/10.1016/j.gca.2012.10.057, 2013.
Toggweiler, J. R., Dixon, K., and Broecker, W. S.: The Peru Upwelling and the Ventilation of the South-Pacific Thermocline, J. Geophys. Res., 96, 20467–20497, 1991.
Varela, D. E., Pride, C. J., and Brzezinski, M. A.: Biological fractionation of silicon isotopes in Southern Ocean surface waters, Global Biogeochem. Cy., 18, 1047–1054, https://doi.org/10.1029/2003GB002140, 2004.
Wada, E. and Hattori, A.: Nitrogen isotope effects in the assimilation of inorganic nitrogenous compounds by marine diatoms, Geomicrobiol. J., 1, 85–101, https://doi.org/10.1080/01490457809377725, 1978.
Waser, N., Harrison, P. J., Nielsen, B., Calvert, S. E., and Turpin, D. H.: Nitrogen isotope fractionation during the uptake and assimilation of nitrate, nitrite, ammonium, and urea by a marine diatom, Limnol. Oceangr., 43, 215–224, 1998.
Wetzel, F., de Souza, G. F., and Reynolds, B. C.: What controls silicon isotope fractionation during dissolution of diatom opal?, Geochim. Cosmochim. Acta, 131, 128–137, https://doi.org/10.1016/j.gca.2014.01.028, 2014.
Wilken, S., Hoffmann, B., Hersch, N., Kirchgessner, N., Dieluweit, S., Rubner, W., Hoffmann, L. J., Merkel, R., and Peeken, I.: Diatom frustules show increased mechanical strength and altered valve morphology under iron limitation, Limnol. Oceangr., 56, 1399–1410, https://doi.org/10.4319/lo.2011.56.4.1399, 2011.
Wilkerson, F. P. and Dugdale, R. C.: Silicate versus nitrate limitation in the equatorial Pacific estimated from satellite-derived sea-surface temperatures, Adv. Space Res., 18, 81–89, 1996.
Yan, H., Sun, L., Oppo, D. W., Wang, Y., Liu, Z., Xie, Z., Liu, X., and Cheng, W.: South China Sea hydrological changes and Pacific Walker Circulation variations over the last millennium, Nat. Comms., 2, 293, https://doi.org/10.1038/ncomms1297, 2011.
Zuta, S. and Guillén, O.: Oceanografía de las aguas costeras del Perú, Bo. Inst. Mar. Perú, 2, 157–324, 1970.