the Creative Commons Attribution 4.0 License.
the Creative Commons Attribution 4.0 License.
 | 15 Nov 2019
Nitrous oxide (N2O) and methane (CH4) in rivers and estuaries of northwestern Borneo
Chun Hock Sim
Daniel Bastian
Jennifer Kallert
Annette Kock
Aazani Mujahid
Moritz Müller
Nitrous oxide (N2O) and methane (CH4) are atmospheric trace gases which play important roles in the climate and atmospheric chemistry of the Earth. However, little is known about their emissions from rivers and estuaries, which seem to contribute significantly to the atmospheric budget of both gases. To this end concentrations of N2O and CH4 were measured in the Rajang, Maludam, Sebuyau and Simunjan rivers draining peatland in northwestern (NW) Borneo during two campaigns in March and September 2017. The Rajang River was additionally sampled in August 2016 and the Samunsam and Sematan rivers were additionally sampled in March 2017. The Maludam, Sebuyau, and Simunjan rivers are typical “blackwater” rivers with very low pH (3.7–7.8), very high dissolved organic carbon (DOC) concentrations (235–4387 mmol L−1) and very low O2 concentrations (31–246 µmol L−1; i.e. 13 %–116 % O2 saturation). The spatial and temporal variability of N2O and CH4 concentrations (saturations) in the six rivers or estuaries was large and ranged from 2.0 nmol L−1 (28 %) to 41.4 nmol L−1 (570 %) and from 2.5 nmol L−1 (106 %) to 1372 nmol L−1 (57 459 %), respectively. We found no overall trends of N2O with O2 or , or , and there were no trends of CH4 with O2 or dissolved nutrients or DOC. N2O concentrations showed a positive linear correlation with rainfall. We conclude, therefore, that rainfall is the main factor determining the riverine N2O concentrations since N2O production or consumption in the blackwater rivers themselves seems to be low because of the low pH. CH4 concentrations were highest at salinity = 0 and most probably result from methanogenesis as part of the decomposition of organic matter under anoxic conditions. CH4 in the concentrations in the blackwater rivers showed an inverse relationship with rainfall. We suggest that CH4 oxidation in combination with an enhanced river flow after the rainfall events might be responsible for the decrease in the CH4 concentrations. The rivers and estuaries studied here were an overall net source of N2O and CH4 to the atmosphere. The total annual N2O and CH4 emissions were 1.09 Gg N2O yr−1 (0.7 Gg N yr−1) and 23.8 Gg CH4 yr−1, respectively. This represents about 0.3 %–0.7 % of the global annual riverine and estuarine N2O emissions and about 0.1 %–1 % of the global riverine and estuarine CH4 emissions. Therefore, we conclude that rivers and estuaries in NW Borneo – despite the fact their water area covers only 0.05 % of the global river/estuarine area – contribute significantly to global riverine and estuarine emissions of N2O and CH4.
- Article
(1136 KB) - Full-text XML
- BibTeX
- EndNote


Nitrous oxide (N2O) and methane (CH4) are atmospheric trace gases which influence the climate and atmospheric chemistry of the Earth (IPCC, 2013; WMO, 2014). They act as greenhouse gases in the troposphere and are indirectly involved in stratospheric ozone depletion. Emission estimates indicate that rivers and estuaries contribute significantly to the atmospheric budget of both N2O and CH4. N2O emission estimates for rivers and estuaries range from 0.05 to 3.3 Tg N2O yr−1 and from 0.09 to 5.7 Tg N2O yr−1, respectively (see overview in Maavara et al., 2019). Thus, the combined riverine and estuarine emissions may contribute up to 32 % of the global natural and anthropogenic emissions of N2O (28.1 Tg N2O yr−1; IPCC, 2013). CH4 emission estimates for rivers and estuaries are in the range of 1.5–26.8 Tg CH4 yr−1 (Bastviken et al., 2011; Stanley et al., 2016) and 0.8–6.6 Tg CH4 yr−1 (see overview in Borges and Abril, 2011), respectively. The combined emissions from rivers and estuaries can contribute up to 6 % of the global natural and anthropogenic atmospheric emissions of CH4 (556 Tg CH4 yr−1; IPCC, 2013). As indicated by the wide range of the estimates cited above, the emission estimates of both gases are associated with a high degree of uncertainty, which is mainly caused by an inadequate coverage of the temporal and spatial distributions of N2O and CH4 in rivers and estuaries and the inherent errors of the model approaches to estimate their exchange across the water–atmosphere interface (see, e.g., Alin et al., 2011; Borges and Abril, 2011).
N2O is produced by microbial processes such as nitrification (i.e. oxidation of ammonia, NH3, to nitrite, ) in estuarine waters (see, e.g., Barnes and Upstill-Goddard, 2011) and heterotrophic denitrification (i.e. reduction of nitrate, , to dinitrogen, N2) in river sediments (Beaulieu et al., 2011). The yields of N2O from these processes are enhanced under low-oxygen (i.e. suboxic) conditions (see, e.g., Brase et al., 2017; Zhang et al., 2010), whereas N2O can be reduced to N2 under anoxic conditions via sedimentary denitrification in rivers (see, e.g., Upstill-Goddard et al., 2017). Apart from ambient oxygen (O2) concentrations, riverine and estuarine N2O production is also dependent on the concentrations of dissolved inorganic nitrogen (DIN; = ) and organic carbon (Quick et al., 2019). There seems to be a general trend towards high estuarine/riverine N2O concentrations when DIN concentrations are high as well (Barnes and Upstill-Goddard, 2011; Quick et al., 2019; Zhang et al., 2010). However, this trend masks the fact that in many cases the spatial and temporal variability of riverine and estuarine N2O is often not related to DIN (see, e.g., Borges et al., 2015; Brase et al., 2017; Müller et al., 2016a; Quick et al., 2019).
CH4 is produced during microbial respiration of organic matter by anaerobic methanogenesis in riverine and estuarine sediments (see, e.g., Borges and Abril, 2011; Romeijn et al., 2019; Stanley et al., 2016). A significant fraction of the CH4 produced in sediments can be oxidized to carbon dioxide (CO2) via anaerobic CH4 oxidation in sulfate-reducing zones of estuarine sediments (see, e.g., Maltby et al., 2018) and aerobic CH4 oxidation in riverine sediments (see, e.g., Shelley et al., 2017). When released to the overlying riverine or estuarine water, CH4 can be oxidized by aerobic CH4 oxidation before reaching the atmosphere (see, e.g., Borges and Abril, 2011; Sawakuchi et al., 2016; Steinle et al., 2017).
In general, the temporal and spatial distributions of N2O and CH4 in rivers and estuaries are driven by the complex interplay of microbial production and consumption pathways (see above) as well as physical processes such as input via shallow groundwater, river discharge, tidal pumping, release to the atmosphere and export to coastal waters (Barnes and Upstill-Goddard, 2011; Borges and Abril, 2011; Quick et al., 2019; Stanley et al., 2016).
Peatlands, which are found in the tropics and at high latitudes, constitute one of the largest reservoirs of organic-bound carbon worldwide (Minasny et al., 2019; Page et al., 2011; Treat et al., 2019; Yu et al., 2010). Rivers and streams draining peatlands have exceptionally high concentrations of dissolved organic carbon (DOC) and low pH and, thus, belong to the “blackwater” river type, which is also found in southeast (SE) Asia (see, e.g., Alkhatib et al., 2007; Martin et al., 2018; Moore et al., 2011).
Despite the fact that a number of studies about N2O and CH4 emissions from peatlands in SE Asia have been published (see, e.g., Couwenberg et al., 2010; Hatano et al., 2016; Jauhiainen et al., 2012), only a few studies about their emissions from peatland-draining rivers in SE Asia have been published so far (Jauhiainen and Silvennoinen, 2012; Mü et al., 2016a). Therefore, our knowledge about the biogeochemistry and emissions of N2O and CH4 from peatland-draining rivers is still rudimentary at best.
Here we present measurements of dissolved N2O and CH4 in six rivers and estuaries in northwestern (NW) Borneo during August 2016, March 2017 and September 2017. The objectives of our study were (i) to measure the distributions of dissolved N2O and CH4, (ii) to identify the major factors influencing their distributions, and (iii) to estimate the N2O and CH4 emissions to the atmosphere.
Discrete samples of surface water were taken at several stations along the salinity gradients of the Rajang, Maludam, Sebuyau and Simunjan rivers in NW Borneo during two campaigns in March and September 2017 (Fig. 1, Table 1). The Rajang River was additionally sampled in August 2016, and the Samunsam and Sematan rivers were additionally sampled in March 2017. The environmental settings of the river basins are summarized in Table 2. Based on the areas affected by oil palm plantations and logging in combination with our own observations during several sampling campaigns, we classified the Rajang and Simunjan River basins as “disturbed” and the Maludam, Sebuyau, Sematan and Samunsam River basins as “undisturbed” (Table 2).

Figure 1Map of the study area with locations of the sampling stations. Sampling stations from August 2016 are displayed in red circles, from March 2017 in blue triangles, and from September 2017 in green diamonds. Major cities are highlighted in bold plus symbols. Inset is adapted from Staub et al. (2000).
Table 1Overview of sampling and sampled ranges of salinity, pH as well as O2 concentration and saturation (in percent, given in parentheses) and concentrations of dissolved inorganic nitrogen (DIN = ), silicate (SiO2) and dissolved organic carbon (DOC). All concentrations are given in µmol L−1. NA stands for not available and “Stat.” stands for sampling station. DOC data were taken from Martin et al. (2018).
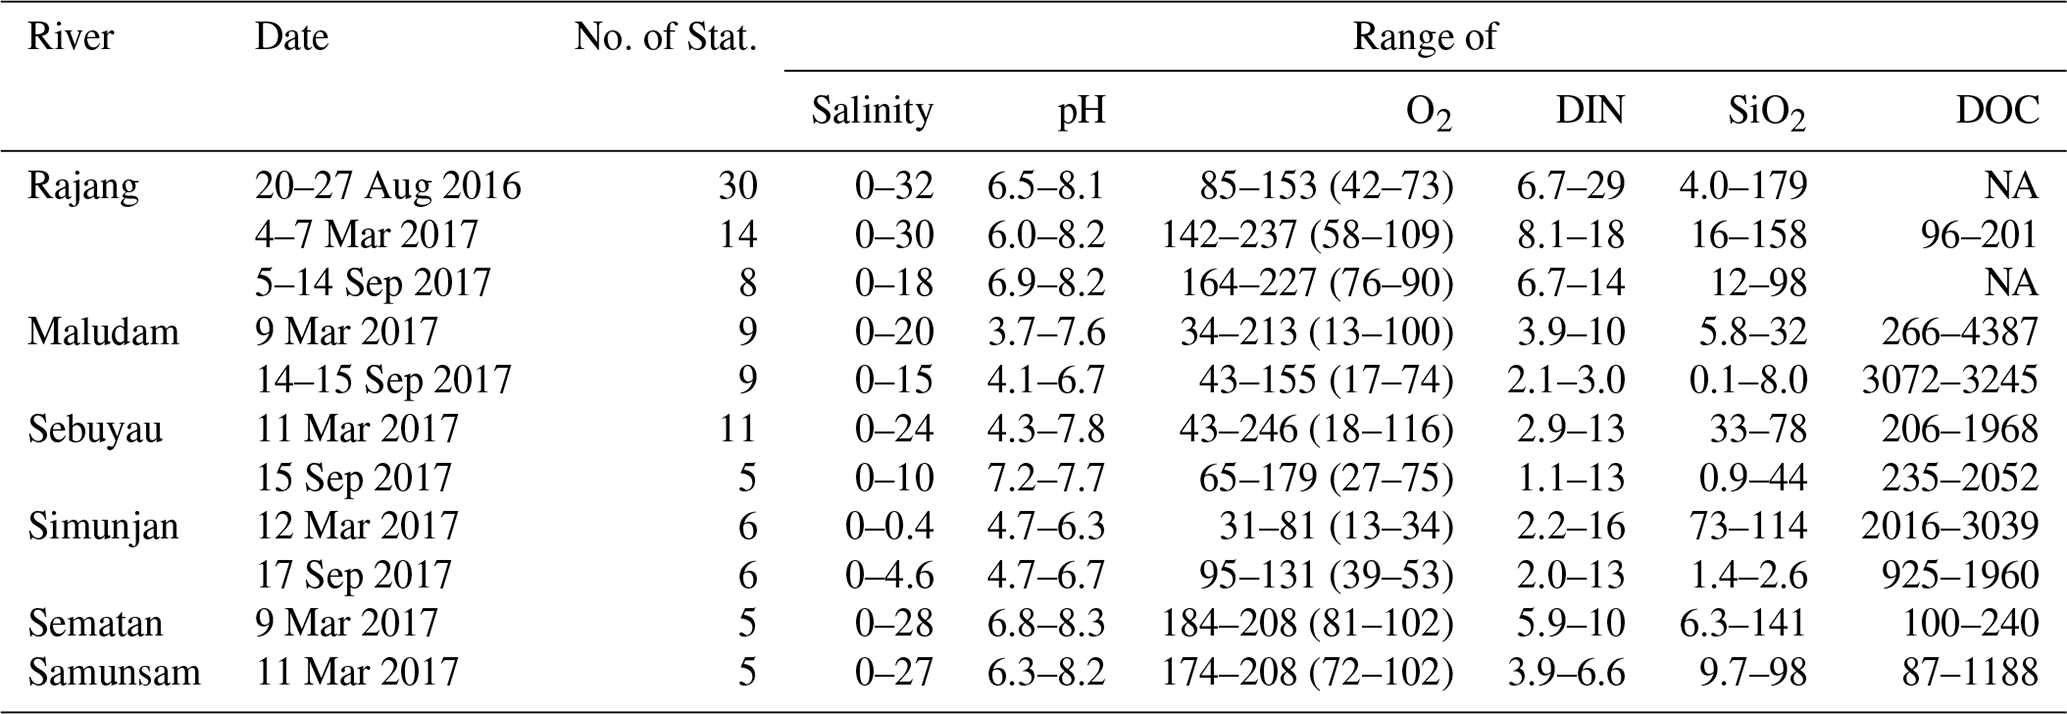
Table 2Summary of the environmental settings of the river basins. Based on the area percentage of oil palm, logging, and our own surveys and observations, we classified the river basins as undisturbed (U) and disturbed (D). All areas are given in kilometres.
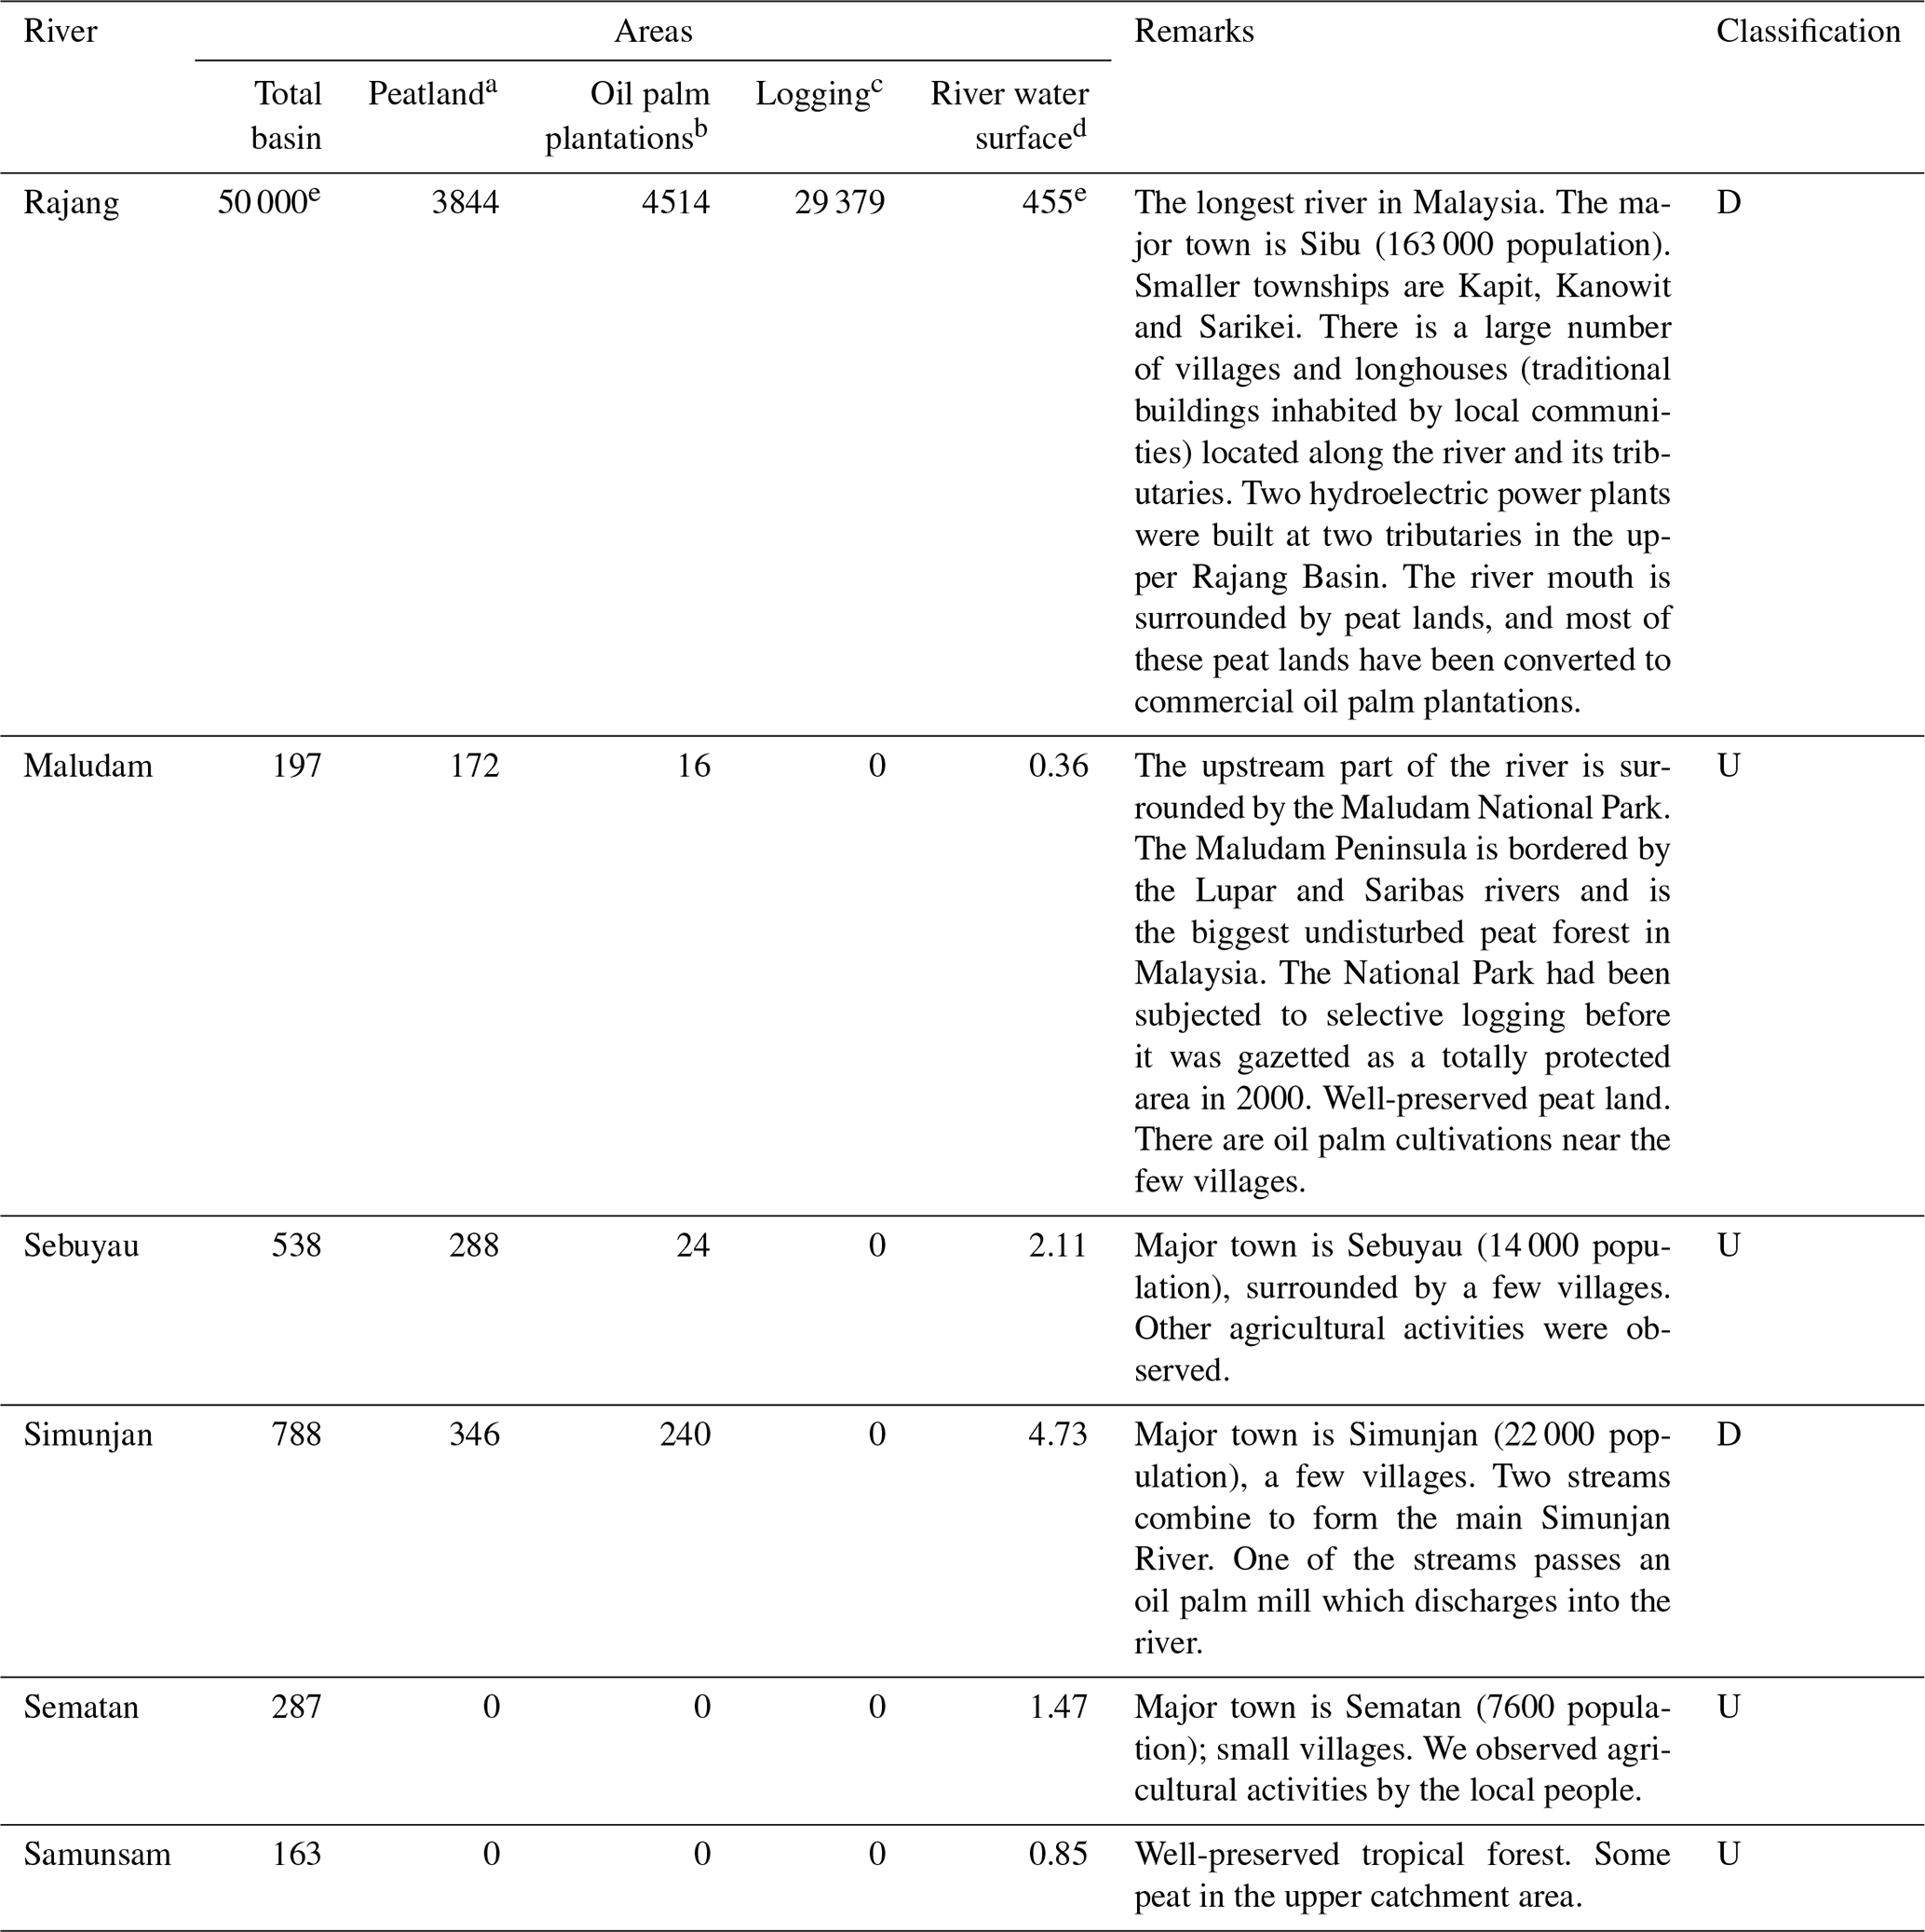
a Estimate is based on “Wetlands International”. “Malaysia peat lands”. Accessed through Global Forest Watch on 22 November 2018 (https://www.globalforestwatch.org). b Estimate is based on “Oil palm concessions”. Accessed through Global Forest Watch on 22 November 2018 (https://www.globalforestwatch.org). c Estimate is based on “Managed forest concessions”. Accessed through Global Forest Watch on 22 November 2018 (https://www.globalforestwatch.org). d Area estimates are based on the length and width of the primary course and main tributaries of the rivers. Length and width of the rivers were estimated using Google Earth (multiple readings). e Estimate from Staub et al. (2000).
3.1 Measurements of N2O and CH4
Water was collected from 1 m depth by using a Niskin sampler. Subsamples for N2O and CH4 were taken as duplicates or triplicates in 20 or 37 mL glass vials. The vials were first rinsed with sample water, then filled to the maximum (without air bubbles), and finally sealed on the spot using a crimper. The samples were kept on ice for a maximum of 3 h. When returned to the field station, 50 µL of saturated aqueous mercuric chloride (HgCl2) solution was immediately added to stop any biological activity, and samples were stored at 4 ∘C until shipment. The samples were shipped to GEOMAR Helmholtz Centre for Ocean Research Kiel, Germany, for further analysis within a few weeks after sampling. For the determination of the N2O and CH4 concentrations, we applied the static-headspace equilibration method followed by gas chromatographic separation and detection with an electron capture detector (ECD; for N2O) and a flame ionization detector (FID; for CH4) as described in Bastian (2017) and Kallert (2017). Calibration of the ECD and FID was performed with standard gas mixtures of 348.4–1476.1 ppb N2O and 1806.10–3003.79 ppb CH4 in synthetic air which have been calibrated against NOAA-certified primary gas standards in the laboratory of the Max Planck Institute for Biogeochemistry in Jena, Germany.
Dissolved N2O∕CH4 concentrations (Cobs in nmol L−1) were calculated with
where x′ is the dry mole fraction of N2O or CH4 in the headspace of the sample, P is the ambient pressure (set to 1013.25 hPa), and Vhs and Vwp are the volumes of the headspace and the water phase, respectively. R stands for the gas constant (8.31451 m3 Pa K−1 mol−1), T is the temperature during equilibration, and β is the solubility of N2O or CH4 (Weiss and Price, 1980; Wiesenburg and Guinasso Jr., 1979). The estimated mean relative errors of the measurements were ±9 % and ±13 % for N2O and CH4, respectively. These comparably high relative errors most probably resulted from the long storage time (6–7 months after sampling) for some of the samples. The higher mean measurement error of the CH4 samples (compared to the N2O measurements) was attributed to the fact that CH4 samples are more sensitive to storage time than N2O samples (Wilson et al., 2018).
3.2 Ancillary measurements
Water temperature, dissolved oxygen and salinity were recorded with an Aquaread® 2000. Nutrient measurements are described in detail in Sia et al. (2019). In short, all samples were collected within the upper 1 m (surface) using pre-washed bottles via a pole sampler to reduce contamination from the surface of the boat and engine coolant waters (Zhang et al., 2015). Samples were filtered through a 0.4 µm pore-size polycarbonate membrane filter (Whatman) into pre-rinsed bottles, conserved with concentrated HgCl2 solution and kept in a cool, dark room. Nutrients were determined utilizing a Skalar SANplus auto analyser with an analytical precision <5 %. pH was measured using a YSI Aquaread® multiple-parameter probe (AP-2000). The measurements of DOC are described in detail in Martin et al. (2018). The performance of the DOC measurements was monitored by using deep-sea water samples with a certified DOC concentration of 42–45 µmol L−1 provided by the Hansell Laboratory, University of Miami. Our analyses consistently yielded slightly higher concentration for the reference water, with a long-term mean (±1 SD) of 47±2.0 µmol L−1 (n=51). The DOC data are available from the Supplement in Martin et al. (2018).
3.3 Computations of saturations and flux densities
The saturations (Sat, %) for N2O, CH4 and O2 were calculated as
where Ceq is the equilibrium concentration of calculated according to Weiss and Price (1980), Wiesenburg and Guinasso Jr. (1979), or Weiss (1970), respectively, with the in situ temperature and salinity as well as the mean dry mole fractions of N2O∕CH4 at the time of the sampling. Mean monthly N2O∕CH4 dry mole fractions of (ppb), 331∕1880 and 330∕1852 ppb for August 2016, March 2017 and September 2017, respectively, were measured at the atmospheric monitoring station Bukit Kototabang, located on the west coast of Sumatra (Indonesia). This station is operated by the NOAA/ESRL Global Monitoring Division program and data are available from http://www.esrl.noaa.gov/gmd (last access: 4 November 2019). A saturation <100 % indicates a concentration lower than the theoretical equilibrium concentration (i.e. undersaturation), and a saturation >100 % indicates supersaturation.
Flux densities (F, nmol m−2 s−1) were calculated as
kw is the gas transfer velocity and Sc is the Schmidt number, which was calculated with the equations for the kinematic viscosity of water (Siedler and Peters, 1986) and the diffusion of N2O or CH4 in water (Jähne et al., 1987; Rhee et al., 2009). k600 was determined in a study for the Lupar and Saribas rivers which are located in close vicinity to the Maludam River (Müller et al., 2016a, b). Both rivers have similar environmental and morphological settings in comparison to the rivers studied here. Therefore, we assume that the k600 values measured by Müller et al. (2016a) are representative of the rivers in NW Borneo studied here. Mean k600 ranges from 13.2±11 to 23.9±14.8 cm h−1. On the basis of the data in Müller et al. (2016a), we computed a mean k600 of 19.2 cm h−1 ( m s−1), which we used to estimate the flux densities of N2O and CH4. This k600 is in good agreement with the mean k600 for rivers <100 m wide (22.4±14.3 cm h−1) and estuaries/rivers >100 m wide (10.3±7.7 cm h−1) listed in Alin et al. (2011), which range from 6.0 to 35.3 and 4.8 to 30.6 cm h−1, respectively. kw in rivers depends on the turbulence at the river is water–atmosphere interface, which in turn is mainly affected by water current velocity, water depth and riverbed roughness and to a lesser extent by the wind speed (Alin et al., 2011; Borges and Abril, 2011). Since the k600 reported by Müller et al. (2016a) was determined only during the wet season (March 2014), our mean k600 is biased because it does not account for a lower k600, which is to be expected during the dry season (resulting from a lower water current velocity; Alin et al., 2011). This results in an overestimation of the flux densities.
3.4 Rainfall data
In order to account for the regional variability of the rainfall in NW Borneo, we used rainfall data with a 3 h resolution recorded at the weather stations in Kuching, Bandar Sri Aman and Sibu (all in NW Borneo). The rainfall data were provided by World Weather Online (Dubai, UAE, and Manchester, UK) and are available via https://www.worldweatheronline.com/ (last access: 4 November 2019). Representative weather stations were chosen for each river basin studied here and allocated as follows. The rainfall data for the Simunjan, Sematan and Samunsam River basins are represented by the data from Kuching; the Maludam–Sebuyau and the Rajang River basins are represented by the data from the Bandar Sri Aman and Sibu weather stations, respectively. We also included the N2O and CH4 concentration data from two measurement campaigns to the Lupar and Saribas rivers in June 2013 and March 2014 (Müller et al., 2016a). The Lupar and Saribas data were associated with the rainfall data from the weather station in Bandar Sri Aman. Accumulated rainfall amount was computed by summing up the 3 h rainfall data for the periods of 1–4 weeks prior to the sampling dates.
All rivers showed low concentrations of DIN in the range of 1.1 to 29 µmol L−1 (Table 1). concentrations ranged from below the detection limit of 0.14 up to 19 µmol L−1, and concentrations were in the range of 0.3 to 17 µmol L−1. The Maludam, Sebuyau and Simunjan rivers can be classified as blackwater rivers with low pH (3.7–4.8), high DOC concentrations (1960–4387 µmol L−1) and low O2 concentrations (31–95 µmol L−1; 13 %–39 % saturation) at salinity = 0 (Table 1). Comparable settings have been reported from other tropical blackwater rivers in SE Asia as well (Alkhatib et al., 2007; Baum et al., 2007; Moore et al., 2011; Rixen et al., 2008; Wit et al., 2015).
4.1 Nitrous oxide
The measured ranges of N2O concentrations and saturations are listed in Table 3 and the distributions of N2O saturations along the salinity gradients are shown in Fig. 2. N2O concentrations (saturations) were highly variable and ranged from 2.0 nmol L−1 (28 %) in the Rajang River (at salinity = 0 in August 2016) to 41.4 nmol L−1 (570 %) in the Simunjan River (at salinity = 0 in March 2017). N2O concentrations in the Rajang, Maludam and Sebuyau rivers were generally higher in September compared to March 2017 (Fig. 2a–c). A decreasing linear trend of the N2O saturations with salinity was only observed for the Rajang River in March 2017 (Fig. 2a) indicating a conservative mixing and no N2O sources or sinks along the salinity gradient. Our results are in general agreement with the N2O measurements in the Lupar and Saribas rivers (which are located in close vicinity of the Maludam River) in June 2013 and March 2014: Müller et al. (2016a) measured N2O concentrations (saturations) from 6.6 to 117 nmol L−1 (102 % to 1679 %) in the Lupar and Saribas rivers. Salinity and N2O concentrations in the Lupar and Saribas rivers were negatively correlated in June 2013 but were not correlated in March 2014 (Müller et al., 2016a). In contrast with our study, no N2O undersaturations have been observed by Müller et al. (2016a). Our results are at the lower end of N2O concentrations reported from rivers around the globe, which can range from extreme undersaturation (down to about 3 %, i.e. almost devoid of N2O) as measured in a tropical river in Africa (Borges et al., 2015) to extreme supersaturation (of up to 12 500 %) as measured in an agriculture-dominated river in Europe (Borges et al., 2018).
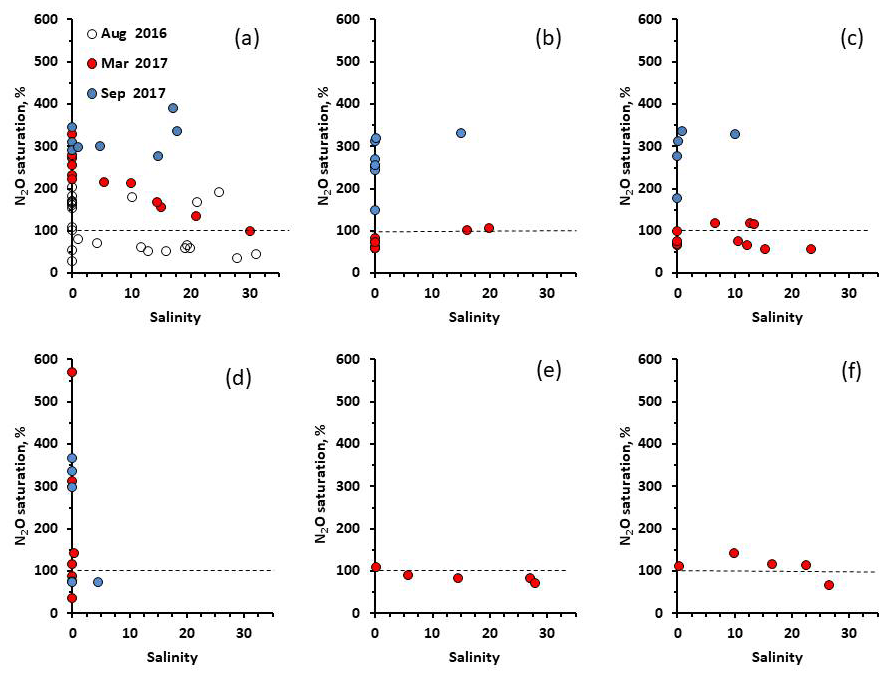
Figure 2N2O saturations along the salinity gradients of (a) Rajang, (b) Maludam, (c) Sebuyau, (d) Simunjan, (e) Sematan and (f) Samunsam. The dashed lines indicate the equilibrium (100 %) saturation. The open circles depict measurements from August 2016, the filled red circles depict measurements from March 2017 and the filled blue circles depict measurements from September 2017.
Table 3Overview of N2O and CH4 concentrations, saturations and flux densities in rivers and estuaries of NW Borneo.
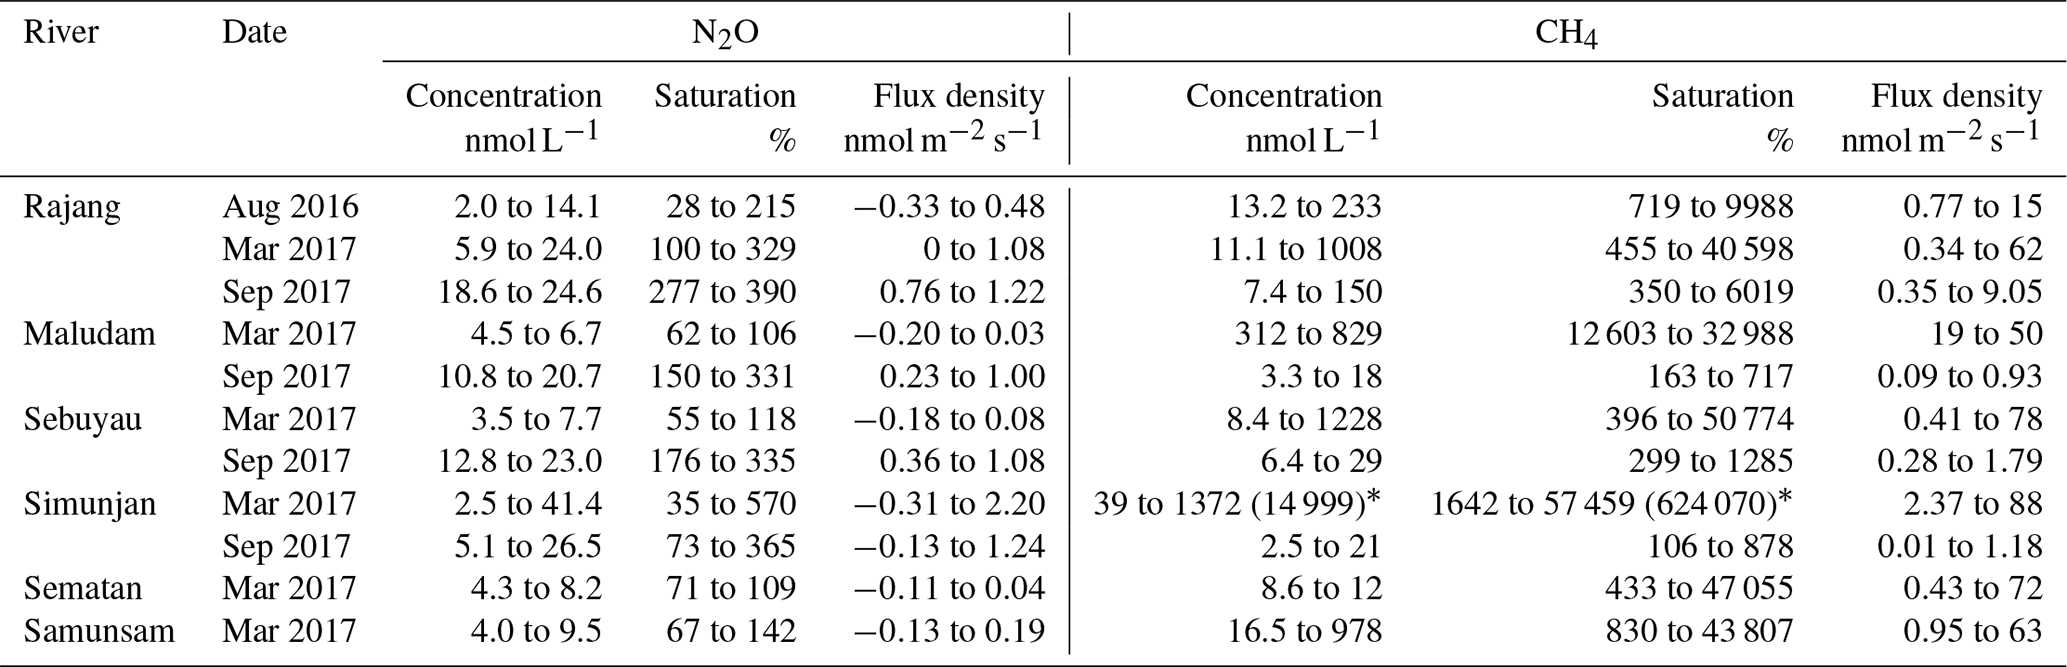
* This extreme value was not included in further computations.
Maximum N2O saturations measured in March 2017 were in the range of 106 % to 142 % for the rivers classified as undisturbed (Maludam, Sebuyau, Sematan and Samunsam), whereas the maximum saturation for the rivers classified as disturbed (Rajang and Simunjan) was in the range of 329 % to 570 % (Tables 2 and 3) indicating higher emissions from the disturbed rivers. The maximum N2O saturations in September 2017 ranged from 329 % to 390 %, and no differences were observed between undisturbed and disturbed rivers (Table 3).
We found no overall trends of N2O with O2 or , , and DIN. Therefore, it is difficult to decipher the major consumption or production processes of N2O or to locate the influence of (local) anthropogenic input of nitrogen compounds on riverine N2O cycling. This is in line with results from studies of other tropical rivers (Borges et al., 2015; Müller et al., 2016a). There are, however, occasional observations of N2O correlations with O2 or nutrients in tropical rivers which were attributed to river types such as swamp and savannah rivers (Upstill-Goddard et al., 2017). Figure 3 shows the N2O concentrations along the pH gradients. Obviously there are no trends except for an enhancement of the N2O concentrations in September 2017. N2O production via nitrification depends on the prevailing pH because nitrifiers prefer to take up ammonia (NH3). The concentration of dissolved NH3 drops significantly at pH < 8–9 (Bange, 2008) because of its easy protonation to ammonium (). A low pH of about 5–6 can reduce nitrification ( oxidation) significantly as was recently shown for the Tay Ninh River in Vietnam (Le et al., 2019). Moreover, the optimum for a net N2O production by nitrification, nitrifier denitrification and denitrification lies between a pH of 7 and 7.5 (Blum et al., 2018). Therefore, a net N2O production may be low in the blackwater rivers studied here because of their low pH (see Table 1). The observed N2O supersaturations, therefore, might have been mainly the result of external inputs of N2O-enriched waters or groundwater. The observed N2O undersaturations were most probably resulting from heterotrophic denitrification which could have taken place either in organic matter-enriched anoxic river sediments or in anoxic environments of the surrounding soils. However, the main factor for riverine N2O under- or supersaturation might be rainfall because rainfall events determine the height of the water table in the surrounding soils, which, in turn, determines the amount of suboxic–anoxic conditions favourable for N2O production or consumption (Jauhiainen et al., 2016). See also discussion in Sect. 4.3.
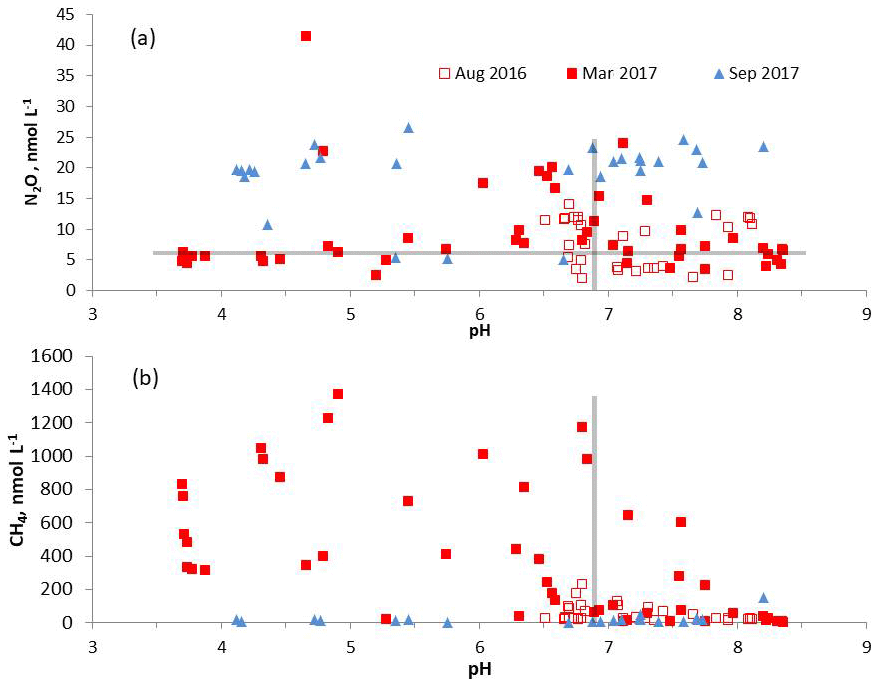
Figure 3Concentrations of N2O (a) and CH4 (b) from rivers or estuaries along the pH gradients. The open red squares depict data from August 2016, the filled red squares depict data from March 2017 and the filled blue triangles depict data from September 2017. The vertical bars in (a) and (b) roughly indicate salinity = 0. Concentrations to the left of the vertical bar are at salinity = 0 and concentrations to the right of the vertical bars are at salinity >0. The horizontal bar in (a) indicates the equilibrium concentration of N2O. Please note that in August 2016, only the Rajang River was sampled.
4.2 Methane
The measured ranges of CH4 concentrations and saturations are listed in Table 3, and the distributions of CH4 saturations along the salinity gradients are shown in Fig. 4. CH4 concentrations (saturations) were highly variable and ranged from 2.5 nmol L−1 (106 %) in the Simunjan River (at salinity = 0 in September 2017) to 1372 nmol L−1 (57 459 %) in the Simunjan River (at salinity = 0 in March 2017). (Please note that we also measured a CH4 concentration of 14 999 nmol L−1 (624 070 %) at one station in the Simunjan River at salinity = 0 in March 2017, which, however, was not included in Fig. 4 and which was excluded in the emission estimates for statistical reasons.) CH4 saturations in the Rajang, Maludam, Sebuyau and Simunjan rivers were higher in March 2017 compared to September 2017. Maximum CH4 concentrations were measured at salinity = 0, and there was a general decrease in CH4 concentrations with increasing salinity. Exceptions from this trend occurred at individual stations in the Maludam, Sebuyau and Samunsam rivers which point to local sources of CH4 (Fig. 3). The range of CH4 concentrations (saturations) from our study is larger compared to the concentration range measured in the Lupar and Saribas rivers (3.7–113.9 nmol L−1; 168 %–5058 %) (Müller et al., 2016a). Borges et al. (2015) reported a maximum CH4 concentration (saturation) of 62 966 nmol L−1 (approx. 954 000 %) in their study of tropical rivers in Africa, which is much higher than the maximum concentration measured in our study. We found no differences in the CH4 saturations between the rivers classified as undisturbed and those classified as disturbed in both March and September 2017.
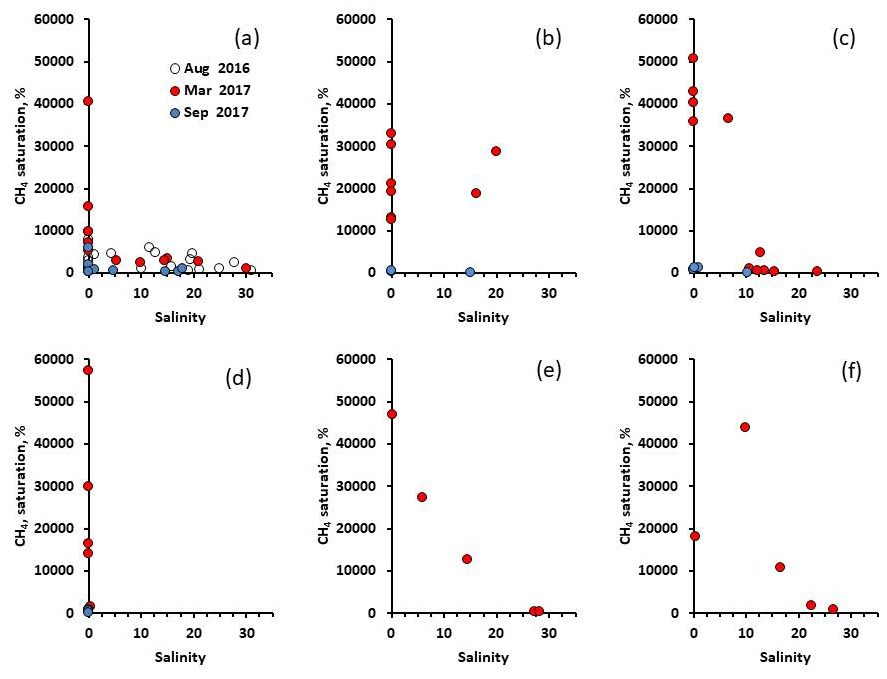
Figure 4CH4 saturations along the salinity gradients of (a) Rajang, (b) Maludam, (c) Sebuyau, (d) Simunjan, (e) Sematan and (f) Samunsam. The dashed lines indicate the equilibrium (100 %) saturation. The open circles depict measurements from August 2016, the filled red circles depict measurements from March 2017 and the filled blue circles depict measurements from September 2017.
We found no overall trends of CH4 with O2 or dissolved nutrients or DOC along the salinity gradients. There are, however, occasional observations in tropical rivers of CH4 relationships with O2, which were attributed to different river types such as swamp and savannah rivers (Upstill-Goddard et al., 2017). High CH4 concentrations, which were often associated with high DOC and low O2 concentrations at salinity = 0 and pH < 7 (see Fig. 3b), might have been produced by methanogenesis in anoxic riverine sediments rich in organic material or in anoxic parts of the surrounding soils drained by the rivers. The decrease in CH4 with increasing salinity can be attributed to the gas exchange across the river water–atmosphere interface in combination with CH4 oxidation (Borges and Abril, 2011; Sawakuchi et al., 2016).
4.3 N2O∕CH4 concentrations and rainfall
Mean N2O concentrations showed linear correlations with accumulated rainfall during different periods from 1–4 weeks before the dates of sampling (Fig. 5, Table 6). Enhanced N2O emissions from (peat) soils are usually associated with rainfall when the water table approaches the soil surface (Couwenberg et al., 2010; Jauhiainen et al., 2016). A high water table, in turn, allows decomposition of previously deposited fresh organic material (Jauhiainen et al., 2016) and, thus, will result in favourable conditions for microbial N2O production mainly via denitrification in a suboxic–anoxic soil environment (Espenberg et al., 2018; Pihlatie et al., 2004). N2O production via nitrification may be less important at a high water table (Pihlatie et al., 2004; Regina et al., 1996). Therefore, the positive linear relationship of the riverine N2O concentrations with rainfall might result from enhanced N2O production in the adjacent soils drained by the rivers. A decreasing trend of N2O concentrations, which would be expected to be caused by enhanced river discharge after the rain events – which in turn can lead to dilution of the concentrations and enhanced fluxes across the river–atmosphere interface (Alin et al., 2011) – is obviously outcompeted by an enhanced input of N2O.

Figure 5Average N2O and CH4 concentrations for the individual rivers and estuaries vs. the accumulated rainfall amount during 1 (a, c) and 3 weeks (b, d) before the dates of sampling. We also included the average N2O and CH4 concentrations for the Lupar and Saribas rivers and the Saribas tributary from Müller et al. (2016a).
In contrast with N2O, the response of riverine or estuarine CH4 concentrations to increasing rainfall does not result in increasing CH4 concentrations (Fig. 5). When considering the periods of 1 or 1.5 weeks of accumulated rainfall there seems to be a pronounced decrease in CH4 concentrations with increasing rainfall (Fig. 5c and Table 6). This trend is no longer significant when considering the periods of 2–4 weeks of accumulated rainfall (Table 6). A closer inspection of the data reveals that the response to increasing rainfall seems to be different for individual rivers or estuaries. There is a clear negative relationship with rainfall for the Maludam, Sebuyau and Simunjan rivers, whereas no obvious trends were observed for the other rivers (Fig. 5c and d). Under the assumption that rainfall is a predictor for river discharge/high water we can argue that our results are in agreement with the often observed inverse relationship between CH4 concentrations and river discharge (Anthony et al., 2012; Bouillon et al., 2014; Dinsmore et al., 2013; Hope et al., 2001). This relationship can be explained by an interplay of various processes such as (i) a decrease in CH4 concentrations caused by a higher water flow (i.e. dilution under the assumption that the net CH4 production does not change significantly), (ii) higher flux across the river–atmosphere interface during periods of higher discharge (caused by an enlarged river surface area and/or a more turbulent water flow) (Alin et al., 2011) and (iii) the enhancement of CH4 oxidation during high waters: Sawakuchi et al. (2016) showed that CH4 oxidation in blackwater rivers of the Amazon Basin was maximal during the high-water season.
4.4 Emission estimates
The N2O flux densities from the six rivers studied here are comparable to the N2O flux densities from other aqueous and soil systems reported from Borneo and other sites in SE Asia; see Table 4. The corresponding CH4 flux densities are higher than the CH4 flux densities reported for the Lupar and Saribas rivers but much lower than the flux densities from drainage canals in Central Kalimantan and Sumatra (Jauhiainen and Silvennoinen, 2012) (Table 4). Our CH4 flux densities are, however, comparable to recently published CH4 eddy covariance measurements (Tang et al., 2018) in the Maludam National Park, which is drained by the Maludam River, and measurements of the CH4 release from peat soils when the water table is high and CH4 from rice paddies (Couwenberg et al., 2010); see Table 4. The mean annual N2O and CH4 emissions for the individual rivers were calculated by multiplying the mean flux density, F, for each river (Table 4) with the river surface area given in Table 2. The results are listed in Table 5. The resulting total annual N2O emissions for the rivers in NW Borneo – including the emissions from the Lupar and Saribas rivers (Müller et al., 2016a) – are 1.09 Gg N2O yr−1 (0.7 Gg N yr−1). This represents about 0.3–0.7 % of the global annual riverine and estuarine N2O emissions of 166–322 Gg N2O (106–205 Gg N yr−1) recently estimated by Maavara et al. (2019). The total annual CH4 emissions from rivers in NW Borneo are 23.8 Gg CH4 yr−1. This represents about 0.1 %–1 % of the global riverine and estuarine CH4 emissions of 2300–33 400 Gg CH4 yr−1 (the emission range is based on the minimum and maximum estimates given in Bange et al., 1994; Bastviken et al., 2011; Borges and Abril, 2011; and Stanley et al., 2016). However, we caution that our estimates are associated with a high degree of uncertainty because (i) our data are biased by the fact that for some rivers it was not possible to cover the entire salinity gradient, (ii) seasonal and interannual variabilities of the N2O and CH4 concentrations are not adequately represented in our data set, (iii) the wind-speed-driven gas exchange in estuaries is not adequately represented, and (iv) the mean k600 used here is most probably too high (see Sect. 3.3), resulting in an overestimation of the emissions.
Table 4Overview of N2O and CH4 flux densities from aqueous and soils ecosystems in SE Asia.
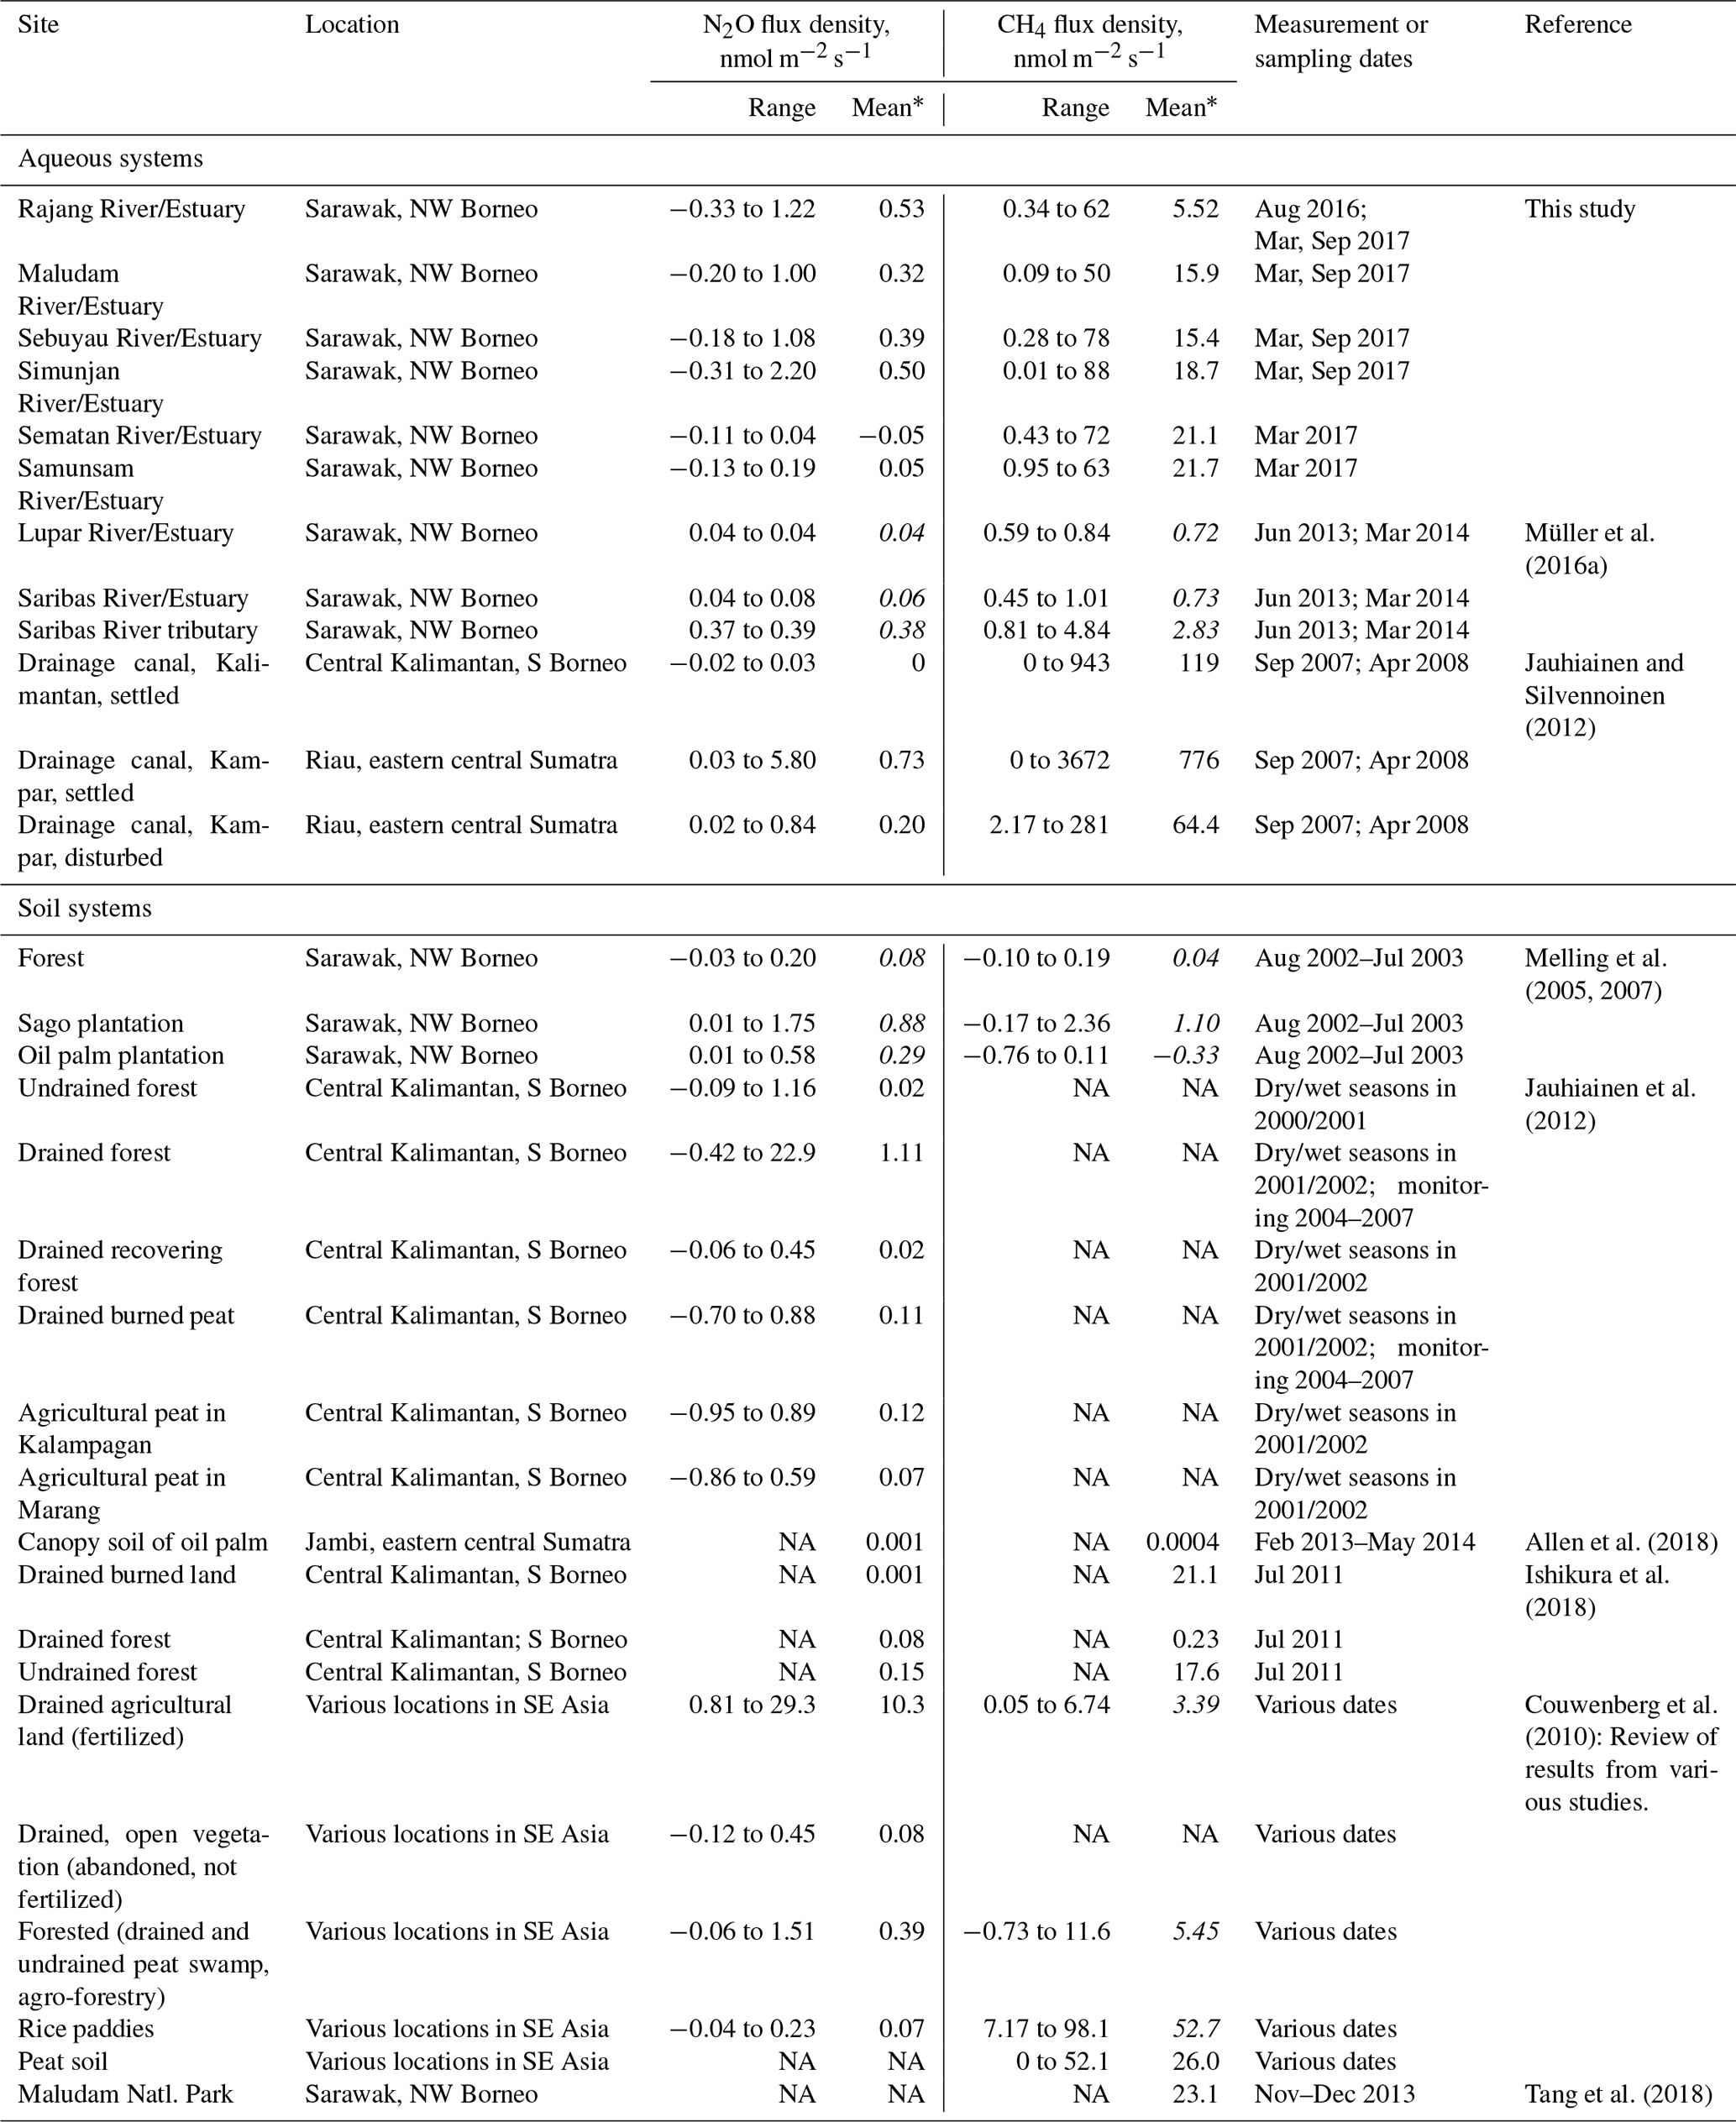
* Values in italics indicate a mean flux density computed from the range given in the table (when no mean flux density was given in the reference). NA stands for not available/not measured.
Table 5Mean annual emissions of N2O and CH4 from rivers and estuaries in NW Borneo. The estimates for the Lupar and Saribas rivers are from Müller et al. (2016a).
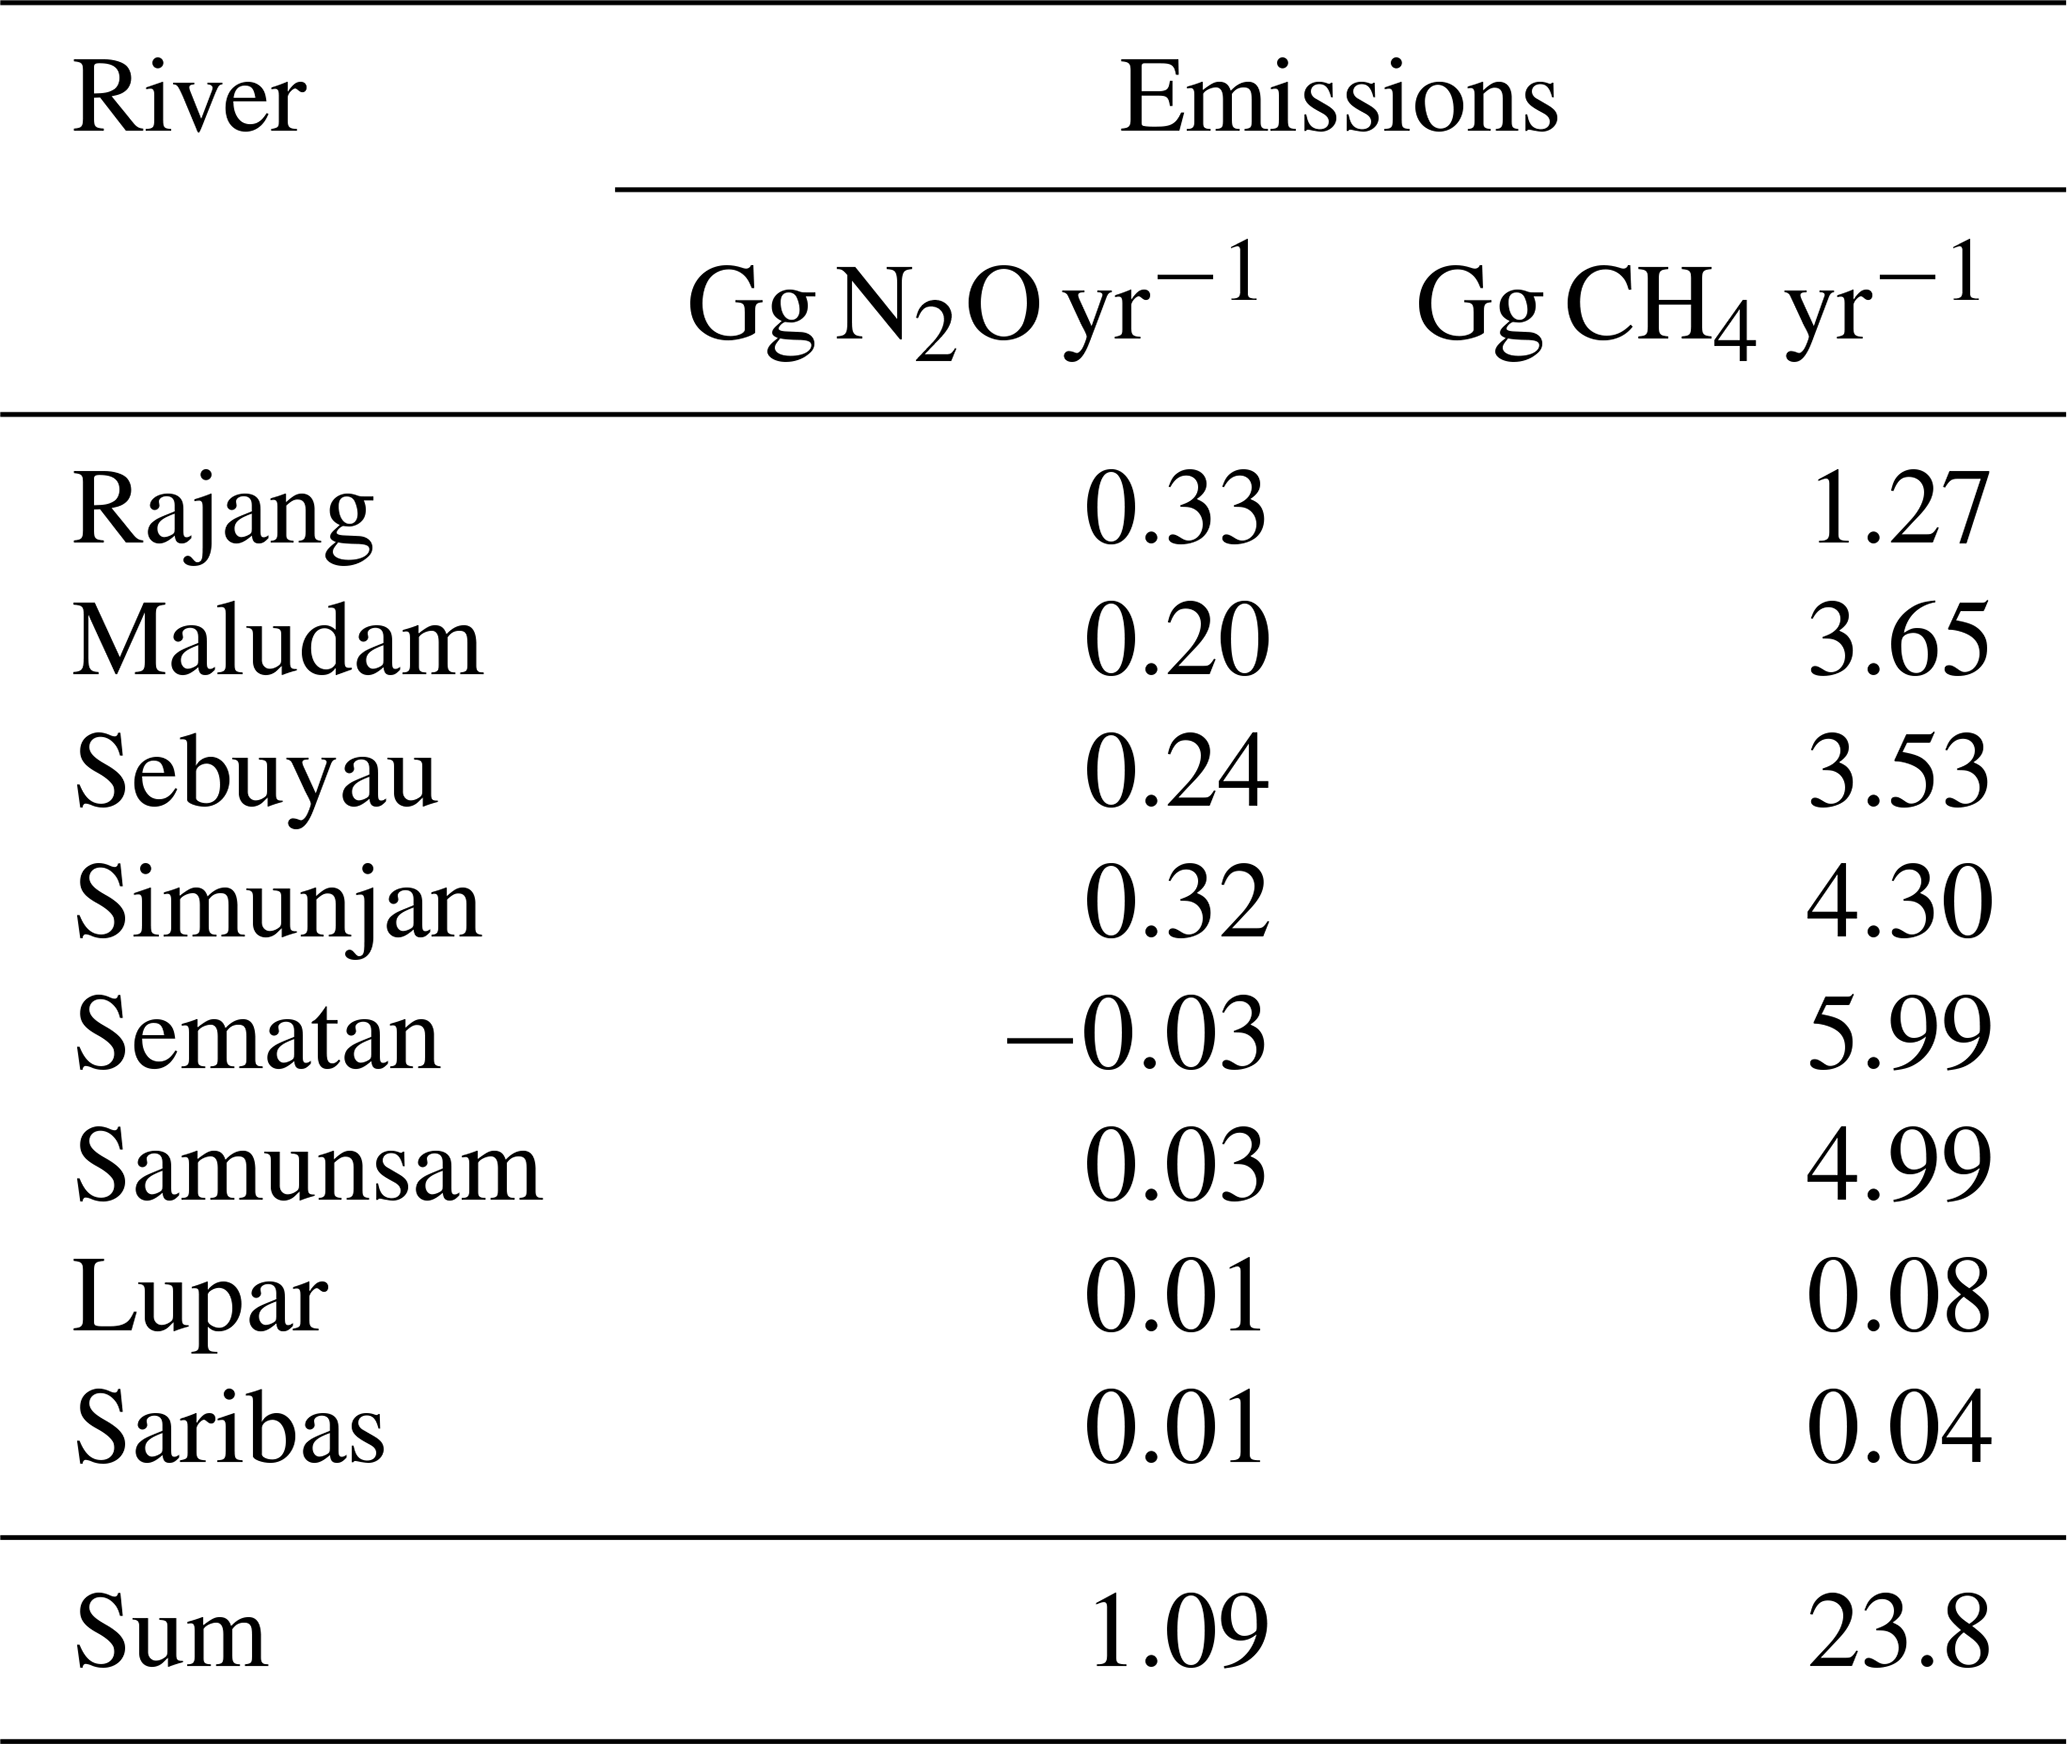
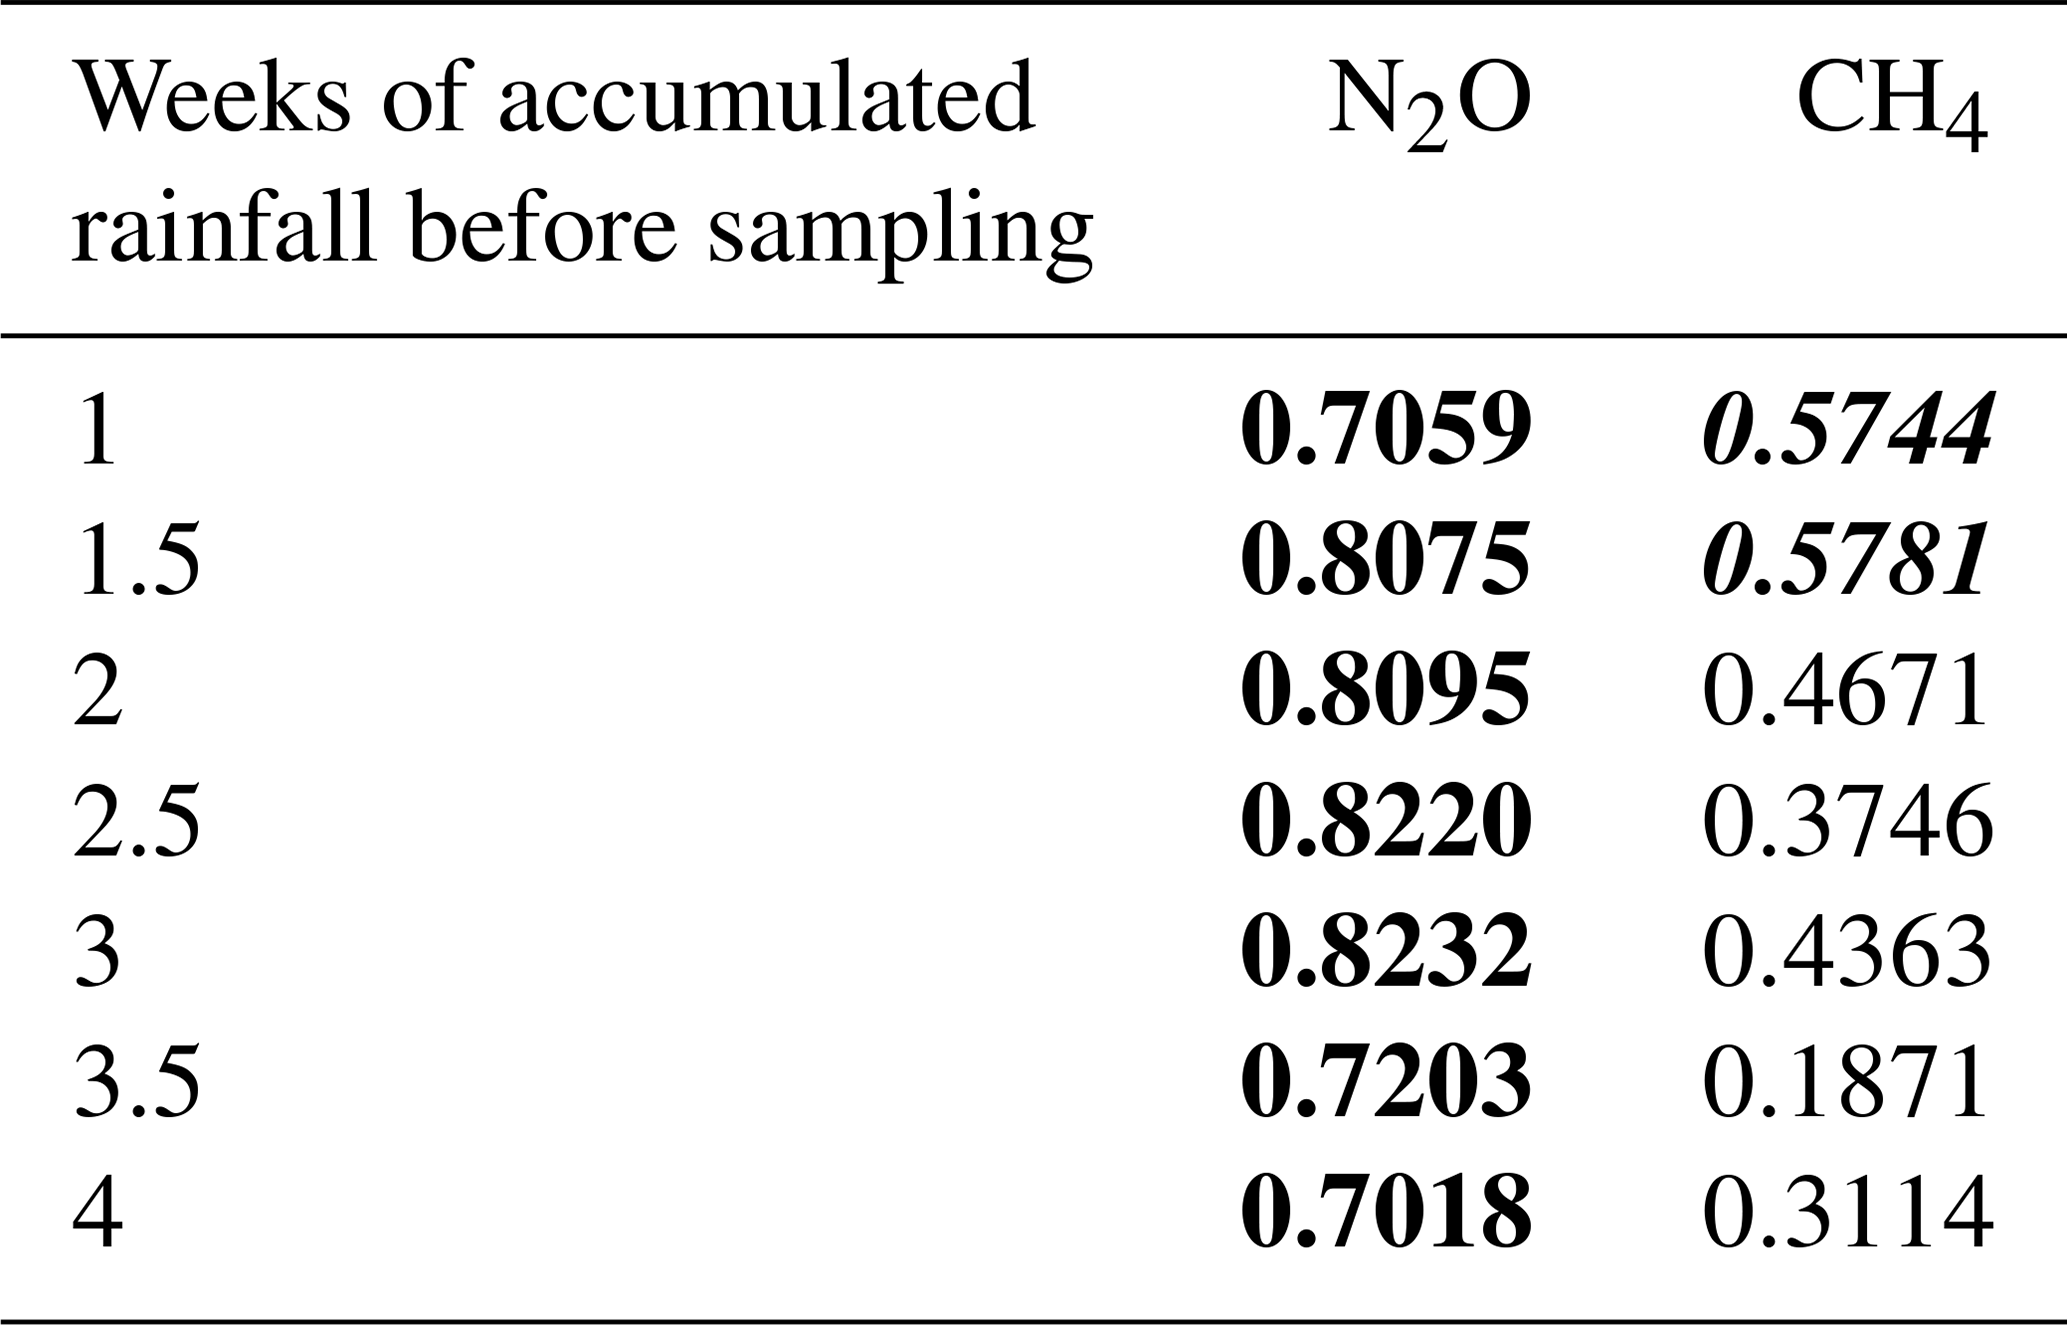
Table 6Correlation coefficients (r) of the linear correlations between the accumulated rainfall for different periods before the dates of sampling and the average N2O∕CH4 concentrations of the various rivers and estuaries. Values in bold are significant at the 99 % level and values in italics are significant at the 95 % level; n=17.
N2O and CH4 were measured in the Rajang, Maludam, Sebuyau and Simuntan rivers and estuaries in NW Borneo during two campaigns in March and September 2017. The Rajang River was additionally sampled in August 2016, and the Samunsam and Sematan rivers were additionally sampled in March 2017. The spatial and temporal variability of N2O and CH4 concentrations was large. N2O concentrations (saturations) ranged from 2.0 nmol L−1 (28 %) in the Rajang River (at salinity = 0 in August 2016) to 41.4 nmol L−1 (570 %) in the Simunjan River (at salinity = 0 in March 2017). CH4 concentrations (saturations) were in the range of 2.5 nmol L−1 (106 %) in the Simunjan River (at salinity = 0 in September 2017) to 1372 nmol L−1 (57 459 %) in the Simunjan River (at salinity = 0 in March 2017). N2O concentrations showed a positive linear correlation with rainfall. We conclude, therefore, that rainfall, which determines the N2O production or consumption in the surrounding soils, is the main factor determining the riverine N2O concentrations. N2O production in the blackwater rivers themselves seems to be low because of the low pH. CH4 concentrations were highest at salinity = 0 and most probably result from methanogenesis as part of the decomposition of organic matter under anoxic conditions. CH4 concentrations in the blackwater rivers showed an inverse relationship with rainfall. We suggest that enhanced CH4 oxidation in combination with a higher flux across the river–atmosphere interface during periods of higher river flow (after rainfall events) is responsible for the reduction in the CH4 concentrations along the salinity gradient. The rivers and estuaries studied here were an overall net source of N2O and CH4 to the atmosphere. The total annual N2O and CH4 emissions were 1.09 Gg N2O yr−1 (0.7 Gg N yr−1) and 23.8 Gg CH4 yr−1, respectively. This represents about 0.3 %–0.7 % of the global annual riverine and estuarine N2O emissions and about 0.1 %–1 % of the global riverine and estuarine CH4 emissions. Rivers and estuaries in NW Borneo contribute only 0.05 % (= 7.9×10² km2 including the surface areas of the Lupar and Saribas rivers; Müller et al., 2016a) to the global water surface area of rivers and estuaries ( km2; Maavara et al., 2019). Therefore we conclude that rivers and estuaries in NW Borneo contribute significantly to the global riverine and estuarine emissions of both N2O and CH4.
The environment of Borneo (and SE Asia) is affected by rapid changes due to (i) anthropogenic activities such as conversion of peatland into oil palm plantations (see, e.g., Austin et al., 2018; McAlpine et al., 2018; Schoneveld et al., 2019) and (ii) climatic changes (see, e.g., Sa'adi et al., 2017a, b; Tang, 2019) which, in turn, could significantly affect N2O and CH4 emissions from soils (see, e.g., Jauhiainen et al., 2016; Oktarita et al., 2017). But little is known about how these changes will affect N2O and CH4 emissions from aqueous systems such as rivers and estuaries in the future. The obvious relationship of N2O and CH4 concentrations and rainfall could be used to predict future concentrations and its associated emissions to the atmosphere. However, the trends of rainfall and river discharge in Borneo show a high local variability and no general common trend (Sa'adi et al., 2017a; Tang, 2019). Therefore, predictions of future trends of N2O and CH4 emissions will be associated with a high degree of uncertainty. In order to improve our knowledge of predicted future changes in N2O and CH4 riverine or estuarine emissions, we suggest establishing regular measurements in the rivers and along the salinity gradients. This will help decipher the temporal and spatial variability of N2O and CH4 emissions from tropical rivers and estuaries. Moreover, studies of the relevant production or consumption pathways (and their main driving factors) for both gases are required. A suitable framework for this could be the recently published concept of the global N2O Ocean Observation Network (N2O-ON) (Bange et al., 2019).
All N2O∕CH4 data presented here are archived in and available from the MEMENTO (the MarineE MethanE and NiTrous Oxide) database: https://memento.geomar.de (last access: 4 November 2019).
MM, CHS, AM and HWB designed the study. CHS performed the sample preparation during the campaigns. DB and JK performed the N2O∕CH4 measurements with support from AK. HWB prepared the paper with contributions from all co-authors.
The authors declare that they have no conflict of interest.
This article is part of the special issue “Biogeochemical processes in highly dynamic peat-draining rivers and estuaries in Borneo”. It is not associated with a conference.
We would like to thank the Sarawak Forestry Department and Sarawak Biodiversity Centre for permission to conduct collaborative research in Sarawak waters under permit numbers NPW.907.4.4(Jld.14)-161, Park Permit no. WL83/2017 and SBC-RA-0097-MM. We are very grateful to the boat men who helped us to collect samples, in particular Lukas Chin, Captain Juble and their crew during the Rajang River and eastern region cruises and Minhad and Pak Mat while sampling the western region. We are grateful to Claire Evans and Joost Brandsma for their participation in planning the overall research project and helping to lead expeditions to the Maludam, Sebuyau and Simunjan rivers. Faddrine Yang, Gonzalo Carrasco, Florina Richard and Fakharuddin Muhamad assisted greatly during fieldwork and with logistics. We thank Edwin Sia and Faddrine Holt for the fantastic support of the N2O∕CH4 sampling during the fieldwork campaigns. We acknowledge the help of Lasse Sieberth with the N2O∕CH4 measurements. We thank two anonymous reviewers for their comments, which helped to improve the paper significantly.
This research has been supported by the Newton-Ungku
Omar Fund (grant no. NE/P020283/1), the MOHE FRGS 15 Grant (grant no. FRGS/1/2015/WAB08/SWIN/02/1)
and the SKLEC Open Research Fund (grant no. SKLEC-KF201610).
The article processing charges for this open-access
publication were covered by a Research
Centre of the Helmholtz Association.
This paper was edited by Palanisamy Shanmugam and reviewed by two anonymous referees.
Alin, S. R., Rasera, M. d. F. F. L., Salimon, C. I., Richey, J. E., Holtgrieve, G. W., Krusche, A. V., and Snidvongs, A.: Physical controls on carbon dioxide transfer velocity and flux in low-gradient river systems and implications for regional carbon budgets, J. Geophys. Res.-Biogeo., 116, G01009, https://doi.org/10.1029/2010JG001398, 2011.
Alkhatib, M., Jennerjahn, T. C., and Samiaji, J.: Biogeochemistry of the Dumai River estuary, Sumatra, Indonesia, a tropical black-water river, Limnol. Oceanogr., 52, 2410–2417, 2007.
Allen, K., Hassler, E., Kurniawan, S., Veldkamp, E., and Correa, M. D.: Canopy soil of oil palm plantations emits methane and nitrous oxide, Soil Biol. Biochem., 122, 1–6, 2018.
Anthony, S. E., Prahl, F. G., and Peterson, T. D.: Methane dynamics in the Willamette River, Oregon, Limnol. Oceanogr., 57, 1517–1530, 2012.
Austin, K. G., Harris, N. L., Wijaya, A., Murdiyarso, D., Harvey, T., Stolle, F., and Kasibhatla, P. S.: A review of land-based greenhouse gas flux estimates in Indonesia, Environ. Res. Lett., 13, 055003, https://doi.org/10.1088/1748-9326/aab531, 2018.
Bange, H. W.: Gaseous nitrogen compounds (NO, N2O, N2, NH3) in the ocean, in: Nitrogen in the Marine Environment, 2nd Edn., edited by: Capone, D. G., Bronk, D. A., Mulholland, M. R., and Carpenter, E. J., Elsevier, Amsterdam, 2008.
Bange, H. W., Bartell, U. H., Rapsomanikis, S., and Andreae, M. O.: Methane in the Baltic and North Seas and a reassessment of the marine emissions of methane, Global Biogeochem. Cy., 8, 465–480, 1994.
Bange, H. W., Arévalo-Martínez, D. L., de la Paz, M., Farías, L., Kaiser, J., Kock, A., Law, C. S., Rees, A. P., Rehder, G., Tortell, P. D., Upstill-Goddard, R. C., and Wilson, S. T.: A harmonized nitrous oxide (N2O) ocean observation network for the 21st century, Front. Mar. Sci., 6, 157, https://doi.org/10.3389/fmars.2019.00157, 2019.
Barnes, J. and Upstill-Goddard, R. C.: N2O seasonal distribution and air-sea exchange in UK estuaries: Implications for tropospheric N2O source from European coastal waters, J. Geophys. Res., 116, G01006, https://doi.org/10.1029/2009JG001156, 2011.
Bastian, D.: N2O und CH4 Verteilung in Ästuaren und Flüssen im Nordwesten von Borneo, 2017, BSc thesis, Kiel University, Kiel, 50 pp., 2017.
Bastviken, D., Tranvik, L. J., Downing, J. A., Crill, P. M., and Enrich-Prast, A.: Freshwater methane emissions offset continental carbon sink, Science, 331, 50, https://doi.org/10.1126/science.1196808, 2011.
Baum, A., Rixen, T., and Samiaji, J.: Relevance of peat draining rivers in central Sumatra for the riverine input of dissolved organic carbon into the ocean, Estuar. Coast. Shelf S., 73, 563–570, 2007.
Beaulieu, J. J., Tank, J. L., Hamilton, S. K., Wollheim, W. M., Hall, R. O., Mulholland, P. J., Peterson, B. J., Ashkenas, L. R., Cooper, L. W., Dahm, C. N., Dodds, W. K., Grimm, N. B., Johnson, S. L., McDowell, W. H., Poole, G. C., Valett, H. M., Arango, C. P., Bernot, M. J., Burgin, A. J., Crenshaw, C. L., Helton, A. M., Johnson, L. T., O'Brien, J. M., Potter, J. D., Sheibley, R. W., Sobota, D. J., and Thomas, S. M.: Nitrous oxide emission from denitrification in stream and river networks, P. Natl. Acad. Sci. USA, 108, 214–219, 2011.
Blum, J.-M., Su, Q., Ma, Y., Valverde-Pérez, B., Domingo-Félez, C., Jensen, M. M., and Smets, B. F.: The pH dependency of N-converting enzymatic processes, pathways and microbes: effect on net N2O production, Environ. Microbiol., 20, 1623–1640, 2018.
Borges, A. V. and Abril, G.: Carbon dioxide and methane dynamics in estuaries, in: Treatise on estuarine and coastal science – Vol. 5, Biogeochemistry, edited by: Wolanski, E. and McLusky, D., Academkic Press, Waltham, 2011.
Borges, A. V., Darchambeau, F., Teodoru, C. R., Marwick, T. R., Tamooh, F., Geeraert, N., Omengo, F. O., Guérin, F., Lambert, T., Morana, C., Okuku, E., and Bouillon, S.: Globally significant greenhouse-gas emissions from African inland waters, Nat. Geosci., 8, 673–642, 2015.
Borges, A. V., Darchambeau, F., Lambert, T., Bouillon, S., Morana, C., Brouyère, S., Hakoun, V., Jurado, A., Tseng, H. C., Descy, J. P., and Roland, F. A. E.: Effects of agricultural land use on fluvial carbon dioxide, methane and nitrous oxide concentrations in a large European river, the Meuse (Belgium), Sci. Total Environ., 610–611, 342–355, 2018.
Bouillon, S., Yambélé, A., Gillikin, D. P., Teodoru, C., Darchambeau, F., Lambert, T., and Borges, A. V.: Contrasting biogeochemical characteristics of the Oubangui River and tributaries (Congo River basin), Sci. Rep.-UK, 4, 5402, https://doi.org/10.1038/srep05402, 2014.
Brase, L., Bange, H. W., Lendt, R., Sanders, T., and Dähnke, K.: High resolution measurements of nitrous oxide (N2O) in the Elbe estuary, Frontiers in Marine Science, 4, 2017.
Couwenberg, J., Dommain, R., and Joosten, H.: Greenhouse gas fluxes from tropical peatlands in south-east Asia, Glob. Change Biol., 16, 1715–1732, 2010.
Dinsmore, K. J., Billett, M. F., and Dyson, K. E.: Temperature and precipitation drive temporal variability in aquatic carbon and GHG concentrations and fluxes in a peatland catchment, Glob. Change Biol., 19, 2133–2148, 2013.
Espenberg, M., Truu, M., Mander, Ü., Kasak, K., Nõlvak, H., Ligi, T., Oopkaup, K., Maddison, M., and Truu, J.: Differences in microbial community structure and nitrogen cycling in natural and drained tropical peatland soils, Sci. Rep.-UK, 8, 4742, https://doi.org/10.1038/s41598-018-23032-y, 2018.
Hatano, R., Toma, Y., Hamada, Y., Arai, H., Susilawati, H. L., and Inubushi, K.: Methane and nitrous oxide emissions from tropical peat soil, in: Tropical Peatland Ecosystems, edited by: Osaki, M. and Tsuji, N., Springer Japan, Tokyo, 2016.
Hope, D., Palmer, S. M., Billett, M. F., and Dawson, J. J. C.: Carbon dioxide and methane evasion from a temperate peatland stream, Limnol. Oceanogr., 46, 847–857, 2001.
IPCC: Climate Change 2013: The Physical Science Basis. Contribution of Working Group I to the Fifth Assessment Report of the Intergovernmental Panel on Climate Change, Cambridge University Press, Cambridge UK and New York, NY, USA, 2013.
Ishikura, K., Darung, U., Inoue, T., and Hatano, R.: Variation in Soil Properties Regulate Greenhouse Gas Fluxes and Global Warming Potential in Three Land Use Types on Tropical Peat, Atmosphere, 9, 465, https://doi.org/10.3390/atmos9120465, 2018.
Jähne, B., Heinz, G., and Dietrich, W.: Measurements of the diffusion coefficients of sparingly soluble gases in water, J. Geophys. Res., 92, 10767–10776, 1987.
Jauhiainen, J. and Silvennoinen, H.: Diffusion GHG fluxes at tropical peatland drainage canal water surfaces, Suo, 63, 93–105, 2012.
Jauhiainen, J., Silvennoinen, H., Hämäläinen, R., Kusin, K., Limin, S., Raison, R. J., and Vasander, H.: Nitrous oxide fluxes from tropical peat with different disturbance history and management, Biogeosciences, 9, 1337–1350, https://doi.org/10.5194/bg-9-1337-2012, 2012.
Jauhiainen, J., Page, S. E., and Vasander, H.: Greenhouse gas dynamics in degraded and restored tropical peatlands, Mires Peat, 17, 1–12, 2016.
Kallert, J.: Verteilung von Lachgas (N2O) und Methan (CH4) im Fluss Rajang (Malaysia), 2017, BSc, University of Kiel, Kiel, 25 pp., 2017.
Le, T. T. H., Fettig, J., and Meon, G.: Kinetics and simulation of nitrification at various pH values of a polluted river in the tropics, Ecohydrol. Hydrobiol., 19, 54–65, 2019.
Maavara, T., Lauerwald, R., Laruelle, G. G., Akbarzadeh, Z., Bouskill, N. J., Van Cappellen, P., and Regnier, P.: Nitrous oxide emissions from inland waters: Are IPCC estimates too high?, Glob. Change Biol., 25, 473–488, 2019.
Maltby, J., Steinle, L., Löscher, C. R., Bange, H. W., Fischer, M. A., Schmidt, M., and Treude, T.: Microbial methanogenesis in the sulfate-reducing zone of sediments in the Eckernförde Bay, SW Baltic Sea, Biogeosciences, 15, 137–157, https://doi.org/10.5194/bg-15-137-2018, 2018.
Martin, P., Cherukuru, N., Tan, A. S. Y., Sanwlani, N., Mujahid, A., and Müller, M.: Distribution and cycling of terrigenous dissolved organic carbon in peatland-draining rivers and coastal waters of Sarawak, Borneo, Biogeosciences, 15, 6847–6865, https://doi.org/10.5194/bg-15-6847-2018, 2018.
McAlpine, C. A., Johnson, A., Salazar, A., Syktus, J., Wilson, K., Meijaard, E., Seabrook, L., Dargusch, P., Nordin, H., and Sheil, D.: Forest loss and Borneo's climate, Environ. Res. Lett., 13, 044009, https://doi.org/10.1088/1748-9326/aaa4ff, 2018.
Melling, L., Hatano, R., and Goh, K. J.: Methane fluxes from three ecosystems in tropical peatland of Sarawak, Malaysia, Soil Biol. Biochem., 37, 1445–1453, 2005.
Melling, L., Hatano, R., and Goh, K. J.: Nitrous oxide emissions from three ecosystems in tropical peatland of Sarawak, Malaysia, Soil Sci. Plant Nutr., 53, 792–805, 2007.
Minasny, B., Berglund, Ö., Connolly, J., Hedley, C., de Vries, F., Gimona, A., Kempen, B., Kidd, D., Lilja, H., Malone, B., McBratney, A., Roudier, P., O'Rourke, S., Rudiyanto, Padarian, J., Poggio, L., ten Caten, A., Thompson, D., Tuve, C., and Widyatmanti, W.: Digital mapping of peatlands – A critical review, Earth-Sci. Rev., 196, 102870, https://doi.org/10.1016/j.earscirev.2019.05.014, 2019.
Moore, S., Gauci, V., Evans, C. D., and Page, S. E.: Fluvial organic carbon losses from a Bornean blackwater river, Biogeosciences, 8, 901–909, https://doi.org/10.5194/bg-8-901-2011, 2011.
Müller, D., Bange, H. W., Warneke, T., Rixen, T., Müller, M., Mujahid, A., and Notholt, J.: Nitrous oxide and methane in two tropical estuaries in a peat-dominated region of northwestern Borneo, Biogeosciences, 13, 2415–2428, https://doi.org/10.5194/bg-13-2415-2016, 2016a.
Müller, D., Warneke, T., Rixen, T., Müller, M., Mujahid, A., Bange, H. W., and Notholt, J.: Fate of terrestrial organic carbon and associated CO2 and CO emissions from two Southeast Asian estuaries, Biogeosciences, 13, 691–705, https://doi.org/10.5194/bg-13-691-2016, 2016b.
Oktarita, S., Hergoualc'h, K., Anwar, S., and Verchot, L. V.: Substantial N2O emissions from peat decomposition and N fertilization in an oil palm plantation exacerbated by hotspots, Environ. Res. Lett., 12, https://doi.org/10.1088/1748-9326/aa80f1, 2017.
Page, S. E., Riley, J. O., and Banks, C. J.: Global and regional importance of the tropical peatland carbon pool, Glob. Change Biol., 17, 798–818, 2011.
Pihlatie, M., Syväsalo, E., Simojoki, A., Esala, M., and Regina, K.: Contribution of nitrification and denitrification to N2O production in peat, clay and loamy sand soils under different soil moisture conditions, Nutrient Cycling in Agroecosystems, 70, 135–141, 2004.
Quick, A. M., Reeder, W. J., Farrell, T. B., Tonina, D., Feris, K. P., and Benner, S. G.: Nitrous oxide from streams and rivers: A review of primary biogeochemical pathways and environmental variables, Earth-Sci. Rev., 191, 224–262, 2019.
Regina, K., Nykänen, H., Silvola, J., and Martikainen, P. J.: Fluxes of nitrous oxide from boreal peatlands as affected by peatland type, water table level and nitrification capacity, Biogeochemistry, 35, 401–418, 1996.
Rhee, T. S., Kettle, A. J., and Andreae, M. O.: Methane and nitrous oxide emissions from the ocean: A reassessment using basin-wide observations in the Atlantic, J. Geophys. Res., 114, D12304, https://doi.org/10.1029/2008JD011662, 2009.
Rixen, T., Baum, A., Pohlmann, T., Balzer, W., Samiaji, J., and Jose, C.: The Siak, a tropical black water river in central Sumatra on the verge of anoxia, Biogeochemistry, 90, 129–140, 2008.
Romeijn, P., Comer-Warner, S. A., Ullah, S., Hannah, D. M., and Krause, S.: Streambed Organic Matter Controls on Carbon Dioxide and Methane Emissions from Streams, Environ. Sci. Technol., 53, 2364–2374, 2019.
Sa'adi, Z., Shahid, S., Ismail, T., Chung, E.-S., and Wang, X.-J.: Distributional changes in rainfall and river flow in Sarawak, Malaysia, Asia-Pac. J. Atmos. Sci., 53, 489–500, 2017a.
Sa'adi, Z., Shahid, S., Ismail, T., Chung, E.-S., and Wang, X.-J.: Trends analysis of rainfall and rainfall extremes in Sarawak, Malaysia, using modified Mann–Kendall test, Meteorol. Atmos. Phys., 131, 263–277, https://doi.org/10.1007/s00703-017-0564-3, 2017b.
Sawakuchi, H. O., Bastviken, D., Sawakuchi, A. O., Ward, N. D., Borges, C. D., Tsai, S. M., Richey, J. E., Ballester, M. V. R., and Krusche, A. V.: Oxidative mitigation of aquatic methane emissions in large Amazonian rivers, Glob. Change Biol., 22, 1075–1085, 2016.
Schoneveld, G. C., Ekowati, D., Andrianto, A., and van der Haar, S.: Modeling peat- and forestland conversion by oil palm smallholders in Indonesian Borneo, Environ. Res. Lett., 14, 014006, https://doi.org/10.1088/1748-9326/aaf044, 2019.
Shelley, F., Ings, N., Hildrew, A. G., Trimmer, M., and Grey, J.: Bringing methanotrophy in rivers out of the shadows, Limnol. Oceanogr., 62, 2345–2359, 2017.
Sia, E. S. A., Zhang, J., Jiang, S., Zhu, Z., Carrasco, G., Holt Jang, F., Mujahid, A., and Müller, M.: Behaviour of Dissolved Phosphorus with the associated nutrients in relation to phytoplankton biomass of the Rajang River-South China Sea continuum, Biogeosciences Discuss., https://doi.org/10.5194/bg-2019-219, in review, 2019.
Siedler, G. and Peters, H.: Properties of sea water, in: Oceanography, edited by: Sündermann, J., Landolt-Börnstein, New Series, Springer Verlag, Berlin, 1986.
Stanley, E. H., Casson, N. J., Christel, S. T., Crawford, J. T., Loken, L. C., and Oliver, S. K.: The ecology of methane in streams and rivers: Patterns, controls, and global significance, Ecol. Monogr., 86, 146–171, 2016.
Staub, J. R., Among, H. L., and Gastaldo, R. A.: Seasonal sediment transport and deposition in the Rajang River delta, Sarawak, East Malaysia, Sediment. Geol., 133, 249–264, 2000.
Steinle, L., Maltby, J., Treude, T., Kock, A., Bange, H. W., Engbersen, N., Zopfi, J., Lehmann, M. F., and Niemann, H.: Effects of low oxygen concentrations on aerobic methane oxidation in seasonally hypoxic coastal waters, Biogeosciences, 14, 1631–1645, https://doi.org/10.5194/bg-14-1631-2017, 2017.
Tang, A. C. I., Stoy, P. C., Hirata, R., Musin, K. K., Aeries, E. B., Wenceslaus, J., and Melling, L.: Eddy covariance measurements of methane flux at a tropical peat forest in Sarawak, Malaysian Borneo, Geophys. Res. Lett., 45, 4390–4399, 2018.
Tang, K. H. D.: Climate change in Malaysia: Trends, contributors, impacts, mitigation and adaptations, Sci. Total Environ., 650, 1858–1871, 2019.
Treat, C. C., Kleinen, T., Broothaerts, N., Dalton, A. S., Dommain, R., Douglas, T. A., Drexler, J. Z., Finkelstein, S. A., Grosse, G., Hope, G., Hutchings, J., Jones, M. C., Kuhry, P., Lacourse, T., Lähteenoja, O., Loisel, J., Notebaert, B., Payne, R. J., Peteet, D. M., Sannel, A. B. K., Stelling, J. M., Strauss, J., Swindles, G. T., Talbot, J., Tarnocai, C., Verstraeten, G., Williams, C. J., Xia, Z., Yu, Z., Väliranta, M., Hättestrand, M., Alexanderson, H., and Brovkin, V.: Widespread global peatland establishment and persistence over the last 130,000 y, P. Natl. Acad. Sci., 116, 4822–4827, 2019.
Upstill-Goddard, R. C., Salter, M. E., Mann, P. J., Barnes, J., Poulsen, J., Dinga, B., Fiske, G. J., and Holmes, R. M.: The riverine source of CH4 and N2O from the Republic of Congo, western Congo Basin, Biogeosciences, 14, 2267–2281, https://doi.org/10.5194/bg-14-2267-2017, 2017.
Weiss, R. F.: The solubility of nitrogen, oxygen and argon in water and seawater, Deep-Sea Res., 17, 721–735, 1970.
Weiss, R. F. and Price, B. A.: Nitrous oxide solubility in water and seawater, Mar. Chem., 8, 347–359, 1980.
Wiesenburg, D. A. and Guinasso Jr., N. L.: Equilibrium solubilities of methane, carbon monoxide, hydrogen in water and seawater, J. Chem. Eng. Data, 24, 356–360, 1979.
Wilson, S. T., Bange, H. W., Arévalo-Martínez, D. L., Barnes, J., Borges, A. V., Brown, I., Bullister, J. L., Burgos, M., Capelle, D. W., Casso, M., de la Paz, M., Farías, L., Fenwick, L., Ferrón, S., Garcia, G., Glockzin, M., Karl, D. M., Kock, A., Laperriere, S., Law, C. S., Manning, C. C., Marriner, A., Myllykangas, J.-P., Pohlman, J. W., Rees, A. P., Santoro, A. E., Tortell, P. D., Upstill-Goddard, R. C., Wisegarver, D. P., Zhang, G.-L., and Rehder, G.: An intercomparison of oceanic methane and nitrous oxide measurements, Biogeosciences, 15, 5891–5907, https://doi.org/10.5194/bg-15-5891-2018, 2018.
Wit, F., Müller, D., Baum, A., Warneke, T., Pranowo, W. S., Müller, M., and Rixen, T.: The impact of disturbed peatlands on river outgassing in Southeast Asia, Nat. Commun., 6, 10155, https://doi.org/10.1038/ncomms10155, 2015.
WMO: Scientific Assessment of Ozone Depletion: 2014, SwitzerlandGlobal Ozone Research and Monitoring Project – Report No. 55, 416 pp., WMO, Geneva, 2014.
Yu, Z., Loisel, J., Brosseau, D. P., Beilman, D. W., and Hunt, S. J.: Global peatland dynamics since the Last Glacial Maximum, Geophys. Res. Lett., 37, L13402, https://doi.org/10.1029/2010GL043584, 2010.
Zhang, G.-L., Zhang, J., Liu, S.-M., Ren, J.-L., and Zhao, Y.-C.: Nitrous oxide in the Changjiang (Yangtze River) Estuary and its adjacent marine area: Riverine input, sediment release and atmospheric fluxes, Biogeosciences, 7, 3505–3516, https://doi.org/10.5194/bg-7-3505-2010, 2010.
Zhang, R., John, S. G., Zhang, J., Ren, J., Wu, Y., Zhu, Z., Liu, S., Zhu, X., Marsay, C. M., and Wenger, F.: Transport and reaction of iron and iron stable isotopes in glacial meltwaters on Svalbard near Kongsfjorden: From rivers to estuary to ocean, Earth Planet. Sc. Lett., 424, 201–211, 2015.