the Creative Commons Attribution 4.0 License.
the Creative Commons Attribution 4.0 License.
 | 10 Dec 2019
Saltwater reduces potential CO2 and CH4 production in peat soils from a coastal freshwater forested wetland
Kevan J. Minick
Bhaskar Mitra
Asko Noormets
John S. King
A major concern for coastal freshwater wetland function and health is the effects of saltwater intrusion on greenhouse gas production from peat soils. Coastal freshwater forested wetlands are likely to experience increased hydroperiod with rising sea level, as well as saltwater intrusion. These potential changes to wetland hydrology may also alter forested wetland structure and lead to a transition from forest to shrub/marsh wetland ecosystems. Loss of forested wetlands is already evident by dying trees and dead standing trees (“ghost” forests) along the Atlantic coast of the US, which will result in significant alterations to plant carbon (C) inputs, particularly that of coarse woody debris, to soils. We investigated the effects of salinity and wood C inputs on soils collected from a coastal freshwater forested wetland in North Carolina, USA, and incubated in the laboratory with either freshwater or saltwater (2.5 or 5.0 ppt) and with or without the additions of wood. Saltwater additions at 2.5 and 5.0 ppt reduced CO2 production by 41 % and 37 %, respectively, compared to freshwater. Methane production was reduced by 98 % (wood-free incubations) and by 75 %–87 % (wood-amended incubations) in saltwater treatments compared to the freshwater plus wood treatment. Additions of wood also resulted in lower CH4 production from the freshwater treatment and higher CH4 production from saltwater treatments compared to wood-free incubations. The δ13CH4-C isotopic signature suggested that, in wood-free incubations, CH4 produced from the freshwater treatment originated primarily from the acetoclastic pathway, while CH4 produced from the saltwater treatments originated primarily from the hydrogenotrophic pathway. These results suggest that saltwater intrusion into coastal freshwater forested wetlands will reduce CH4 production, but long-term changes in C dynamics will likely depend on how changes in wetland vegetation and microbial function influence C cycling in peat soils.
- Article
(2225 KB) - Full-text XML
- BibTeX
- EndNote


Sea level rise (SLR) threatens coastal regions around the world. Significantly, the rate of SLR is not uniform around the globe, with the highest rate occurring along the Atlantic coast of North America between Cape Hatteras and Cape Cod due to factors including local currents, tides, and glacial isostatic rebound (Karegar et al., 2017; Sallenger et al., 2012). Along with economic and cultural impacts, the health of coastal forested ecosystems is expected to be impacted by SLR (Langston et al., 2017; Kirwan and Gedan, 2019). For instance, salinization of coastal freshwater wetlands will likely impact vegetation community dynamics and regeneration in low-lying (<1 m) wetlands (Langston et al., 2017). Understanding how coastal wetland ecosystems respond to extreme events, long-term climate change, and a rapidly rising sea is essential to developing the tools needed for sustainable management of natural resources, as well as the building of resilient communities and strong economies. Because it has more than 5180 km2 of coastal ecosystems and urban areas below 1 m elevation, the state of North Carolina is highly vulnerable to climate change and SLR and therefore saltwater intrusion (Riggs and Ames, 2008; Titus and Richman, 2001).
As sea level changes, coastal plant communities move accordingly up and down the continental shelf. In recent geologic time, sea level has risen about 3 m over the past ∼2500 years from sea level reconstructions adjacent to our study site (Kemp et al., 2011). The rate of SLR has varied greatly over that time, with periods of stability and change and a geologically unprecedented acceleration in recent decades. The current distribution of coastal freshwater forested wetlands reflects the hydrologic equilibrium of the recent past climate, but the widespread mortality of such forests suggests that the rate of SLR is in a time of rapid change at a rate potentially faster than the forest's capacity to move upslope, resulting in widespread death of coastal freshwater forested wetlands (Kirwan and Gedan, 2019). Furthermore, dying coastal forests will alter the quantity and quality of organic matter inputs to the soil as vegetation shifts occur, as well as introduce a large pulse of woody debris to soils. This has the potential to alter carbon (C) cycling processes responsible for storage of C in peat soils or loss of C as CO2 and CH4 (Winfrey and Zeikus, 1977).
Wetlands store more than 25 % of global terrestrial soil C in deep soil organic matter deposits due to their unique hydrology and biogeochemistry (Batjes, 1996; Bridgham et al., 2006). Carbon storage capacity is especially high in forested wetlands characterized by abundant woody biomass, forest floors of Sphagnum spp., and deep organic soils. Across the US southeast, soil organic C (SOC) in soils increases with proximity to the coast and is greatest in coastal wetlands (Johnson and Kern, 2003). Carbon densities are even higher in the formations of organic soils (Histosols) that occur across the region, typically ranging from 687 to 940 t ha−1, but can be as high as 1447 t ha−1 (Johnson and Kern, 2003). As noted, forested wetlands, which historically have contributed to terrestrial C sequestration, are in serious decline, and processes leading to destabilization of accumulated soil C are not represented in broad-scale ecosystem and land-surface models. The extent of changes in soil C cycling processes attributable to the altered hydroperiod, saltwater intrusion, and structural changes in vegetation in these ecosystems remains unclear.
Saltwater intrusion, a direct result of SLR, into freshwater wetlands alters soil C cycling processes (Ardón et al., 2016, 2018), particularly that of methanogenesis (Baldwin et al., 2006; Chambers et al., 2011; Dang et al., 2019; Marton et al., 2012) and microbial activity (e.g., extracellular enzyme activity, Morrissey et al., 2014; Neubauer et al., 2013). Saltwater contains high concentrations of ions, notably sulfate (), which support high rates of reduction compared to freshwater wetlands (Weston et al., 2011). Sulfate acts as a terminal electron acceptor in anaerobic respiration of SOC, and reducers will typically increase in abundance in response to saltwater intrusion and outcompete other anaerobic microorganisms, including methanogens, for C (Bridgham et al., 2013; Dang et al., 2019; Winfrey and Zeikus, 1977). The effect of on soil C cycling and competitive interactions with other anaerobic microbial processes also appears dependent on the concentration of the ion (Chambers et al., 2011). Even within freshwater forested wetlands, hydrology and microtopography interact to influence the amount of within soils experiencing different levels of saturation and therefore rates of reduction (Minick et al., 2019a). A majority of saltwater intrusion studies on soil C dynamics though have focused on tidal freshwater wetlands, whereas nontidal freshwater wetlands have received relatively little attention, partially due to their more confined distribution across the landscape. Nonetheless, they occupy critical zones within the coastal wetland ecosystem distribution and will be influenced by SLR differently than that of tidal wetlands. Tidal wetlands may experience short-term pulses of saltwater with tidal movement of water, while SLR effects on saltwater intrusion into nontidal freshwater wetlands may result in more long-term saltwater inundation. This difference in saltwater inundation period may influence rates of soil CO2 efflux, CH4 production, and microbial activity (Neubauer et al., 2013) and therefore should be considered in light of the hydrologic properties of nontidal wetlands.
Saltwater intrusion into freshwater systems may also influence the CH4 production pathways (Dang et al., 2019; Weston et al., 2011), as a result of saltwater-induced shifts in methanogenic microbial communities (Baldwin et al., 2006; Chambers et al., 2011; Dang et al., 2019). Stable isotope analyses of CO2 and CH4 indicate that acetoclastic methanogenesis is the major CH4-producing pathway in freshwater wetlands (Angle et al., 2017), but the influence of saltwater on the pathway of CH4 formation in nontidal freshwater forested wetlands has rarely been studied, particularly through the lens of CO2 and CH4 stable C isotope analysis. As 13C isotopic analysis of CH4 is nondestructive and is long proven as a reliable indicator of the CH4 production pathway (Whiticar et al., 1986), utilization of this analysis provides easily attainable information on the effects of freshwater and saltwater on CH4 production dynamics in coastal wetland ecosystems experiencing SLR-induced changes in hydrology and vegetation.
Our goal in this study was to test whether saltwater additions alter the CO2 and CH4 production and microbial activity from organic soils of a nontidal temperate freshwater forested wetland in coastal North Carolina, US, and whether effects differ in response to additions of wood. Although many studies have focused on salinity pulses in tidal freshwater wetlands, less attention has been given to the effects of sustained saltwater intrusion on soil C dynamics. We expect saltwater intrusion due to SLR will be more persistent in nontidal wetlands. Therefore, we investigated the effects of sustained saltwater inundation, using a laboratory microcosm experiment, on greenhouse gas production and microbial activity (e.g., microbial biomass C and extracellular enzyme activity). Wood additions to microcosms were utilized to mimic the potential large pulses of wood to peat soils as forest dieback occurs along the aquatic–terrestrial fringes of the Atlantic coast and these wetlands transition to shrub/marsh ecosystems (Kirwan and Gedan, 2019), thereby providing a large and widespread pulse of coarse woody debris to wetland soils and potentially altering soil C cycling.
2.1 Field site description
The field site was located in the Alligator River National Wildlife Refuge (ARNWR) in Dare County, North Carolina (35∘47′ N, 75∘54′ W) (Fig. 1). The ARNWR was established in 1984 and is characterized by a diverse assemblage of nontidal pocosin wetland types (Allen et al., 2011). ARNWR has a network of roads and canals but in general contains vast expanses of minimally disturbed forested and shrub wetlands. Thirteen plots were established in a 4 km2 area in the middle of a bottomland hardwood forest surrounding a 35 m eddy covariance flux tower (US-NC4 in the AmeriFlux database; Minick et al., 2019a). Of the 13 plots (7 m radius), four central plots were utilized for this study which have been more intensively measured for plant and soil properties and processes (Miao et al., 2013, 2017; Minick et al., 2019a, b; Mitra et al., 2019). Overstory plant species composition was predominantly composed of black gum (Nyssa sylvatica), swamp tupelo (Nyssa biflora), and bald cypress (Taxodium distichum), with occasional red maple (Acer rubrum), sweet gum (Liquidambar styraciflua), white cedar (Chamaecyparis thyoides), and loblolly pine (Pinus taeda). The understory was predominantly fetterbush (Lyonia lucida), bitter gallberry (Ilex glabra), red bay (Persea borbonia), and sweet bay (Magnolia virginiana). Mean air temperature and precipitation from climate records of an adjacent meteorological station (Manteo AP, NC; 35∘55′ N, 75∘42′ W; National Climatic Data Center) for the period of 2008–2018 were 17.0±0.30 ∘C and 932±38 mm, respectively. These wetlands are characterized by a hydroperiod that responds over short timescales and is driven primarily by variable precipitation patterns. Soils are classified as a Pungo series (very poorly drained dystic thermic typic Haplosaprist) with a deep, highly decomposed muck layer overlain by a shallow, less decomposed peat layer and underlain by highly reduced mineral sediments of Pleistocene origin (Riggs, 1996). Soils from the surface of hummocks have a pH of 4.2±0.1, a C concentration of 49±1.3 %, and a δ13C value of ‰ (Minick et al., 2019b). Ground elevation is below 1 m above sea level. Sea level rise models of coastal NC show that ARNWR will experience almost complete inundation by 2100, with attendant shifts in ecosystem composition (Department of Defense, 2010).
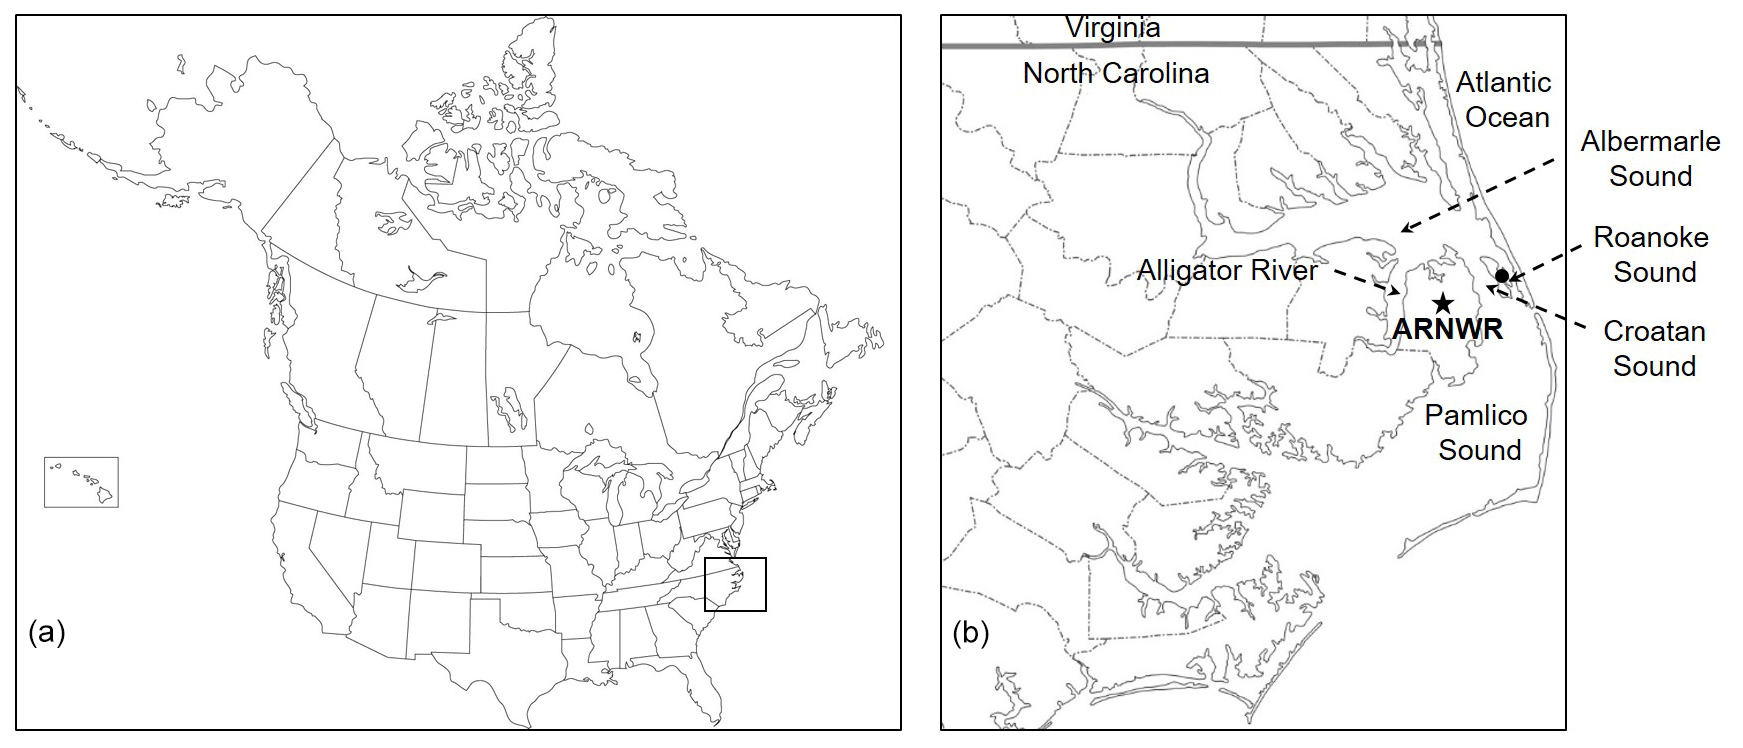
Figure 1Location of the Alligator River National Wildlife Refuge (ARNWR) within North America (a, indicated by box) and location of ARNWR within eastern North Carolina, USA, and surrounding freshwater (Alligator River and Albemarle Sound) and saltwater (Pamlico Sound, Croatan Sound, and Roanoke Sound) bodies (b). Dotted arrows indicate the location of important surrounding water bodies. The star represents the approximate location of soil and freshwater (from Milltail Creek) sampling locations within the freshwater forested wetlands of ARNWR. The black circle represents the approximate location of saltwater sampling (at the Melvin Daniels Bridge, Roanoke Sound) from the Roanoke Sound. The saltwater was sampled approximately 32 km east of the soil and freshwater samples.
2.2 Sample collection
Soil samples were collected on 6 February 2018 from surface organic soils by removing seven 10 cm × 10 cm monoliths from hummocks to the depth of the root mat (approximately 6.3 cm) using a saw and a 10 cm × 10 cm PVC square. The seven soil samples were composited by plot and stored on ice for transport back to the laboratory. In the laboratory, roots and large organic matter were removed by hand and gently homogenized. Soils samples were then stored in the dark at 4 ∘C for 7 weeks before initiating the laboratory incubation.
Freshwater and saltwater for the experiment was collected from water bodies surrounding the ARNWR on 7 March 2018 (Fig. 1). Freshwater was collected from Milltail Creek, which runs northwest from the center of ARNWR to Alligator River and drains our forested wetland study site. Freshwater salt concentration was 0 ppt. Saltwater was collected from Roanoke Sound to the east of ARNWR and had a salt concentration of 19 ppt (Fig. 1). Freshwater and saltwater were mixed together to get the desired salt concentration for the saltwater treatments (2.5 and 5.0 ppt). These concentrations of saltwater were chosen due to the salinity levels in the Croatan and Pamlico sounds, which are adjacent to ARNWR (Fig. 1). Salinity in these waters ranges from approximately 1 to 5 ppt (Kevan Minick, unpublished data). Prior to mixing, freshwater and saltwater was filtered through a Whatman no. 2 filter (8 µm). Neither saltwater nor freshwater were sterile filtered; therefore, microbial communities from each water source were mixed together and added to the incubations. This could influence the response of soil microbes to the various treatments but also represents what would occur under future projections of SLR in this region and the resulting mixing of freshwater and saltwater within the wetland. Four water samples of each freshwater and saltwater mixture were sent to the NCSU Environmental and Agricultural Testing Service laboratory for analysis of total organic C (TOC), ammonium (), nitrate (), phosphate (), , calcium (Ca2+), magnesium (Mg2+), sodium (Na+), potassium (K+), and chlorine (Cl−). Analysis of TOC was made using a TOC analyzer (Schimadzu Scientific Instruments, Durham, NC). Analysis of , , and was made using a Lachat QuikChem 8500 flow injection analysis system (Lachat Instruments, Milwaukee, WI). Sulfate and Cl− were measured on a Dionex ion chromatograph (Thermo Fisher Scientific, Waltham, MA). Finally, a PerkinElmer 8000 inductively coupled plasma optical emission spectrometer (PerkinElmer, Waltham, MA) was used to analyze water samples for Ca2+, Mg2+, Na+, K+, and Cl−.
2.3 Incubation setup
Incubation water treatments included (1) soils incubated at 65 % water holding capacity (WHC) (dry), (2) soils incubated at 100 % WHC with freshwater (0 ppt), (3) soils incubated at 100 % WHC with a saltwater concentration of 2.5 ppt (2.5 ppt), and (4) soils incubated at 100 % WHC with a saltwater concentration of 5.0 ppt (5.0 ppt). A subsample of each fresh soil (soils stored at 4 ∘C) was dried at 105 ∘C to constant mass to determine gravimetric soil water content. Approximately 150–200 g fresh soil (20–25 g dry weight) collected from each plot was weighed into 1 L canning jars. For water addition estimates, WHC was calculated by placing a subsample of fresh soil (approximately 2 g fresh weight) in a funnel with a Whatman no. 1 filter and saturating with deionized H2O (dH2O). The saturated sample was allowed to drain into a conical flask for 2 h. After 2 h, the saturated soil was weighed, dried at 105 ∘C to constant mass, and weighed again to determine WHC. It is important to note that the 100 % WHC moisture level resulted in soils being completely flooded (with either freshwater or saltwater) with water covering the surface of the incubated soils, thereby allowing for the development of CH4-producing conditions similar to that observed in the field for surface soils. After soil and water additions, the remaining headspace was estimated for each individual incubation vessel (approximately 750 mL) and used in the calculation of gas production rates. Following wood additions (see below), incubation vessels from each of the eight treatments were incubated in the dark in the laboratory for 98 d at 20–23 ∘C.
Two sets of incubations were set up with the abovementioned water treatments. We added 13C-depleted American sweetgum (Liquidamber styraciflua) wood to half of the incubation vessels (0.22 g wood per g soil) (wood-amended), while the other half were incubated without wood (wood-free). Trees were grown at the Duke FACE site under elevated CO2 concentrations (200 ppm CO2 above ambient) using natural-gas-derived CO2 with a depleted 13C signature compared to that of the atmosphere (Feng et al., 2010; Schlesinger et al., 2006). The site was established in 1983 after clear-cut and burn (Kim et al., 2016). Trees were grown under elevated CO2 from 1994 to 2010, at which point they were harvested (Kim et al., 2016). Cookies were removed from harvested trees, dried to a constant moisture level, and stored at −20 ∘C until use. The bark layer was removed and the outer six tree rings of multiple cookies were removed with a chisel. Wood was then finely ground in a Wiley Mill (Thomas Scientific, Swedesboro, NJ, USA) and analyzed for C content and 13C signature on a Picarro G2201-i isotopic CO2∕CH4 analyzer outfitted with a Costech combustion module for solid sample analysis (Picarro Inc., Sunnyvale, CA, USA). For δ13C analysis of solids (e.g., wood, microbial biomass extracts, soils), certified solid standards were used to develop a standard curve from the expected and measured δ13C values (R2>0.999). These standards included USGS 40 (L-glutamic acid) (δ13C = −26.39 ‰; USGS Reston Stable Isotope Laboratory, Reston, VA, USA), protein (δ13C = −26.98 ‰; Elemental Microanalysis Ltd, Okehampton, UK), urea (δ13C = −48.63 ‰; Elemental Microanalysis Ltd, Okehampton, UK), atropine (δ13C = −18.96 ‰; Costech Analytical Technologies, Inc, Valencia, CA, USA), and acetanilide (δ13C = −28.10 ‰; Costech Analytical Technologies, Inc, Valencia, CA, USA). For C concentration, atropine standards were weighed out over a range of C concentrations that encompassed the expected C concentrations of the unknown samples and within the measurement range of the instrument. A standard curve for C concentration was also developed from the expected and measured C concentration of the atropine standards (R2>0.99). All unknown samples' C concentrations and δ13C values were adjusted using the linear equations derived from the appropriate standard curve. The δ13C values were reported in parts per thousand (‰) relative to the Vienna Pee Dee Belemnite (VPDB) standard. Wood had a C content of 45.6±0.21 % and δ13C value of ‰, which was within the range of −42 ‰ to −39 ‰ measured on fresh pine needles and fine roots (Schlesinger et al., 2006) and more depleted in 13C compared to that measured in hummock surface soils from our site ( ‰; Minick et al., 2019b).
2.4 CO2 and CH4 sample collection and analysis
Headspace gas samples were collected from incubation vessels 15 times over the course of the 98 d incubation (days 1, 4, 8, 11, 15, 19, 25, 29, 29, 47, 56, 63, 70, 84, 98). Incubation lids were loosened between measurements to allow for gas exchange with the ambient atmosphere. Four blank incubations (empty jars; no soil, water, or wood) were set up and treated in the exact same manner as incubations containing soil, water, and wood. Blanks were used to measure soil-free CO2 and CH4 concentrations in incubations, which were always well below the detection limit of the gas analyzer (described below). Prior to each measurement, incubation vessels were removed from the dark, sealed tightly, and flushed at 20 psi for 3 min with CO2∕CH4-free zero air (Airgas, Radnor, PA, USA). Following flushing, incubation vessels were immediately placed back in the dark (2–6 h over the first 39 d and 12–18 h over the remainder of the incubation) before taking a gas sample for analysis. Approximately 300 mL of headspace gas was removed using a 50 mL gas-tight syringe and transferred to an evacuated 0.5 L Tedlar gas sampling bag (Restek, Bellefonte, PA, USA). Simultaneous analyses of CO2 and CH4 concentrations and δ13C isotopic signature were conducted on a Picarro G2201-i isotopic CO2∕CH4 analyzer (Picarro Inc., Sunnyvale, CA, USA). For δ13C analysis of gases (e.g., CO2 and CH4), certified gas standards were used to develop a standard curve from the expected and measured δ13C values (R2>0.99). The gas standards for 13CO2 analysis included gas tanks containing (1) 372 ppm CO2 with a δ13C value of ‰ (Airgas, Inc., Radnor, PA), (2) 420 ppm CO2 with a δ13C value of ‰ (Airgas, Inc., Radnor, PA), (3) 768 ppm CO2 with a δ13C value of ‰ (Airgas, Inc., Radnor, PA), and (4) 3000 ppm CO2 with a δ13C value of ‰ (Airgas, Inc., Radnor, PA). The gas standards for 13CH4 analysis included gas tanks containing (1) 1.75 ppm CH4 with a δ13C value of ‰ (Airgas, Inc., Radnor, PA), (2) 2.00 ppm CH4 with a δ13C value of ‰ (Airgas, Inc., Radnor, PA), (3) 10.00 ppm CH4 with a δ 13C value of ‰ (Airgas, Inc., Radnor, PA), and (4) 15.08 ppm CH4 with a δ13C value of ‰ (Airgas, Inc., Radnor, PA). For CO2 and CH4 concentration, a concentrated gas standard (gas mixture containing 4043 ppm CO2 and CH4) (Airgas, Inc., Radnor, PA) was diluted with zero air gas, providing a range of CO2 and CH4 concentrations that encompassed the expected gas concentrations of the unknown samples. A standard curve for gas concentration was developed from the expected and measured gas concentration of the diluted gas standards (R2>0.99). All unknown gas sample CO2 and CH4 concentrations and δ13C values were adjusted using the linear equations derived from the appropriate standard curve. The δ13C values were reported in parts per thousand (‰) relative to the Vienna Pee Dee Belemnite (VPDB) standard. Production rates of CO2-C and CH4-C were calculated as well as daily cumulative CO2-C and CH4-C production summed over the course of the 98 d incubation. Small subsamples (approximately 1.0 g dry weight) of soil were removed periodically from each incubation vessel for extracellular enzyme analysis (see below). Removal of soil was accounted for in subsequent calculations of gas production rates. Incubation vessel water levels (mass basis) were checked and adjusted three times per week using either freshwater or saltwater.
The proportion of wood-derived CO2 at each sampling date was calculated using 13CO2 data and the 13C of depleted wood (−40.07) in a two-pool flux model (Fry, 2006), with the depleted wood signature as one end point and the 13CO2 of wood-free incubations as the other endpoint.
where δ13CO2 wood+soil is the δ13C value of CO2 produced from soils incubated with the addition of 13C-depleted wood, δ13Cwood-free soil is the δ13C value of CO2 produced from soils incubated without the addition of 13C-depleted wood, and δ13Cwood is the average δ13C value of the 13C-depleted wood. Total wood-derived CO2 was calculated using cumulative CO2 produced over the 98 d incubation and the average 13CO2 across the whole incubation.
2.5 Soil characteristics
Soil organic C concentration and δ13C were analyzed on the four replicate soil samples prior to the start of the incubation (initial soil samples) and on soils from each of the 32 incubations following the 98 d incubation period. The initial C analysis was performed on samples removed prior to incubation. Soils were finely ground in a Wiley Mill (Thomas Scientific, Swedesboro, NJ, USA) prior to analysis on a Picarro G2201-i isotopic CO2∕CH4 analyzer outfitted with a Costech combustion module for solid sample analysis (Picarro Inc., Sunnyvale, CA, USA). Carbon concentration and 13C calibration standards were the same as those described for the analysis of the 13C-depleted wood.
Soil pH and redox potential (Eh = mV) were measured in each incubation prior to the start of the incubation and within 1 h following each sampling of headspace gas. Soil pH and Eh were measured on four replicate soil samples immediately prior to the start of the incubation in a 1 : 2 mixture (by mass) of soil and distilled water (dH2O). Soil pH and Eh were measured directly in the soil and water mixtures of each incubation vessel during the incubation period. Soil pH was measured using a glass electrode (Thermo Fisher Orion 4 Star pH Meter, Waltham, MA). Soil redox potential (Eh = mV) was measured using a Martini ORP 57 ORP/∘C/∘F meter (Milwaukee Instruments, Inc., Rocky Mount, NC, USA).
2.6 Microbial biomass carbon and δ13C isotopic signature
Microbial biomass C (MBC) was estimated on soils collected from incubations on day 1 (after 24 h posttreatment incubation) and day 98 (following the end of the incubation). The chloroform fumigation extraction (CFE) method was adapted from Vance et al. (1987) in order to estimate MBC and δ13C of MBC. Briefly, one subsample of soil (approximately 0.5 g dry weight each) was placed in a 50 mL beaker in a vacuum desiccator to be fumigated. Another subsample was placed into an extraction bottle for immediate extraction in 0.5 M K2SO4 by shaking for 1 h and subsequently filtering through Whatman no. 2 filter paper to remove soil particles. The samples in the desiccator were fumigated with ethanol-free chloroform (CHCl3) and incubated under vacuum for 3 d. After the 3 d fumigation, samples were extracted similar to that of nonfumigated samples. Filtered 0.5 M K2SO4 extracts were dried at 60 ∘C in a ventilated drying oven and then ground to a fine powder with mortar and pestle before analysis of C concentration and δ13C on a Picarro G2201-i isotopic CO2∕CH4 analyzer outfitted with a Costech combustion module for solid sample analysis (Picarro Inc., Sunnyvale, CA, USA). Carbon concentration and 13C calibration standards were the same as those described for the analysis of the 13C-depleted wood. Microbial C biomass was determined using the following equation:
where the chloroform-labile pool (Fc) is the difference between C in the fumigated and nonfumigated extracts, and kc (extractable portion of MBC after fumigation) is soil-specific and estimated as 0.45 (Joergensen, 1996).
The δ13C of MBC was estimated as the δ13C of the C extracted from the fumigated soil sample in excess of that extracted from the nonfumigated soil sample using the following equation:
where Cf and Cnf are the concentration (mg kg−1 soil) of C extracted from the fumigated and nonfumigated soil samples, respectively, and δ13Cf and δ13Cnf are the 13C natural abundance (‰) of the fumigated and nonfumigated soil samples, respectively.
2.7 Extracellular enzyme analysis
The potential activity of five extracellular enzymes was quantified on soil samples collected on days 1, 8, 35, and 98 of the soil incubation. The enzymes chosen for this experiment represent a range of compounds in which they degrade, including fast and slow cycling C compounds, as well as ones that target nitrogen-, phosphorus-, and sulfate-containing compounds. The Enzyme Commission number (EC) is stated in parentheses after each enzyme, which classifies them by the chemical reaction catalyzed by each enzyme. The specific enzymes measured were β-glucosidase (BG; EC: 3.2.1.21), xylosidase (XYL; EC 3.2.1.37), peroxidase (PER; EC: 1.11.1.7), β-glucosaminidase (NAGase; EC: 3.2.1.30), alkaline phosphatase (AP; EC: 3.1.3.1), and arylsulfatase (AS; EC: 3.1.6.1). Carbon-degrading enzymes BG, XYL, and PER degrade sugar, hemicellulose, and lignin, respectively, while the N-degrading enzyme, NAGase, degrades chitin. Enzymes AP and AS degrade phosphorus- and sulfate-containing compounds, respectively. Substrates for all enzyme assays were dissolved in a 50 mM, pH 5.0 acetate buffer solution for a final concentration of 5 mM substrate.
Hydrolytic enzymes (BG, XYL, NAGase, AP, and AS) were measured using techniques outlined in Sinsabaugh et al. (1993). Approximately 0.8 g dry weight of soil sample was suspended in 50 mL of a 50 mM, pH 5.0 acetate buffer solution and homogenized in a blender for 1 min. In a 2 mL centrifuge tube, a 0.9 mL aliquot of the soil-buffer suspension was combined with 0.9 mL of the appropriate 5 mM p-nitrophenyl substrate solution for a total of three analytical replicates. Additionally, duplicate background controls consisting of a 0.9 mL aliquot of soil-buffer suspension plus 0.9 mL of acetate buffer were analyzed, as well as four substrate controls consisting of a 0.9 mL substrate solution plus a 0.9 mL buffer. The samples were agitated for 2–5 h. Samples were then centrifuged at 8160 g for 3 min. Supernatant (1.5 mL) was transferred to a 15 mL centrifuge tube containing 150 µL of 1.0 M NaOH, followed by the addition of 8.35 mL of dH2O. The resulting mixture was vortexed and a subsample was transferred to a cuvette, and the optical density at 410 nm was measured on a spectrophotometer (Beckman Coulter DU 800 Spectrophotometer, Brea, CA, USA).
The oxidative enzyme (PER) was measured using techniques outlined in Sinsabaugh et al. (1992). PER is primarily involved in oxidation of phenolic compounds and depolymerization of lignin. The same general procedure for hydrolytic enzymes was followed utilizing a 5 mM L-3,4-dihydroxyphenylalanine (L-DOPA) (Sigma-Aldrich Co. LLC, St. Louis, MO, USA) solution as the substrate plus the addition of 0.2 mL of 0.3 % H2O2 to all sample replicates and substrate controls. After the setup of analytical replicates and substrate and background controls, the samples were agitated for 2–3 h. Samples were then centrifuged at 8160 g for 3 min. The resulting supernatant turns an intense indigo color. Supernatant (1.4 mL) was transferred directly to a cuvette and the optical density at 460 nm was measured on a spectrophotometer.
For all enzymes, the mean absorbance of two background controls and four substrate controls was subtracted from that of three analytical replicates and divided by the molar efficiency (1.66 µmol−1), length of incubation (h), and soil dry weight. Enzyme activity was expressed as micromoles (µmol) of substrate converted per gram of dry soil mass per hour (µmol g−1 h−1). Daily cumulative enzyme activity was calculated and summed over the course of the 98 d incubation.
2.8 Statistical analysis
Water chemistry; cumulative CO2 production; cumulative CH4 production; cumulative enzyme activity; postincubation SOC concentration and δ13C; and wood-derived and wood-associated SOC, CO2, and MBC were analyzed using a one-way ANOVA (PROC GLM package). Microbial biomass C, MBC δ13C, pH, Eh, δ13CO2, and δ13CH4 were analyzed using repeated-measures ANOVA (PROC MIXED package) with time (time) as the repeated measure and the incubation treatment as the fixed effect. All data for wood-free and wood-amended soils were analyzed separately. Raw data were natural-log-transformed where necessary to establish homogeneity of variance. If significant main effects or interactions were identified in the one-way or repeated-measures ANOVA (P<0.05), then post hoc comparison of least-squares means was performed. All statistical analyses were performed using SAS 9.4 software (SAS Institute, Cary, NC, USA).
Table 1Total organic C (TOC) and ion concentrations (mg L−1) in freshwater (0 ppt), 2.5 ppt saltwater, and 5.0 ppt saltwater. Standard errors of the mean are in parentheses (n=4). Values with different superscript lowercase letters are significantly different (P<0.05).
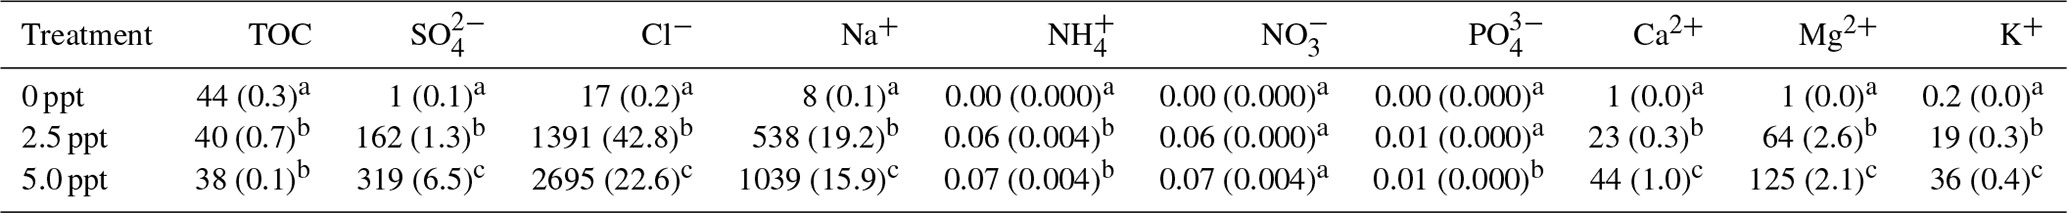
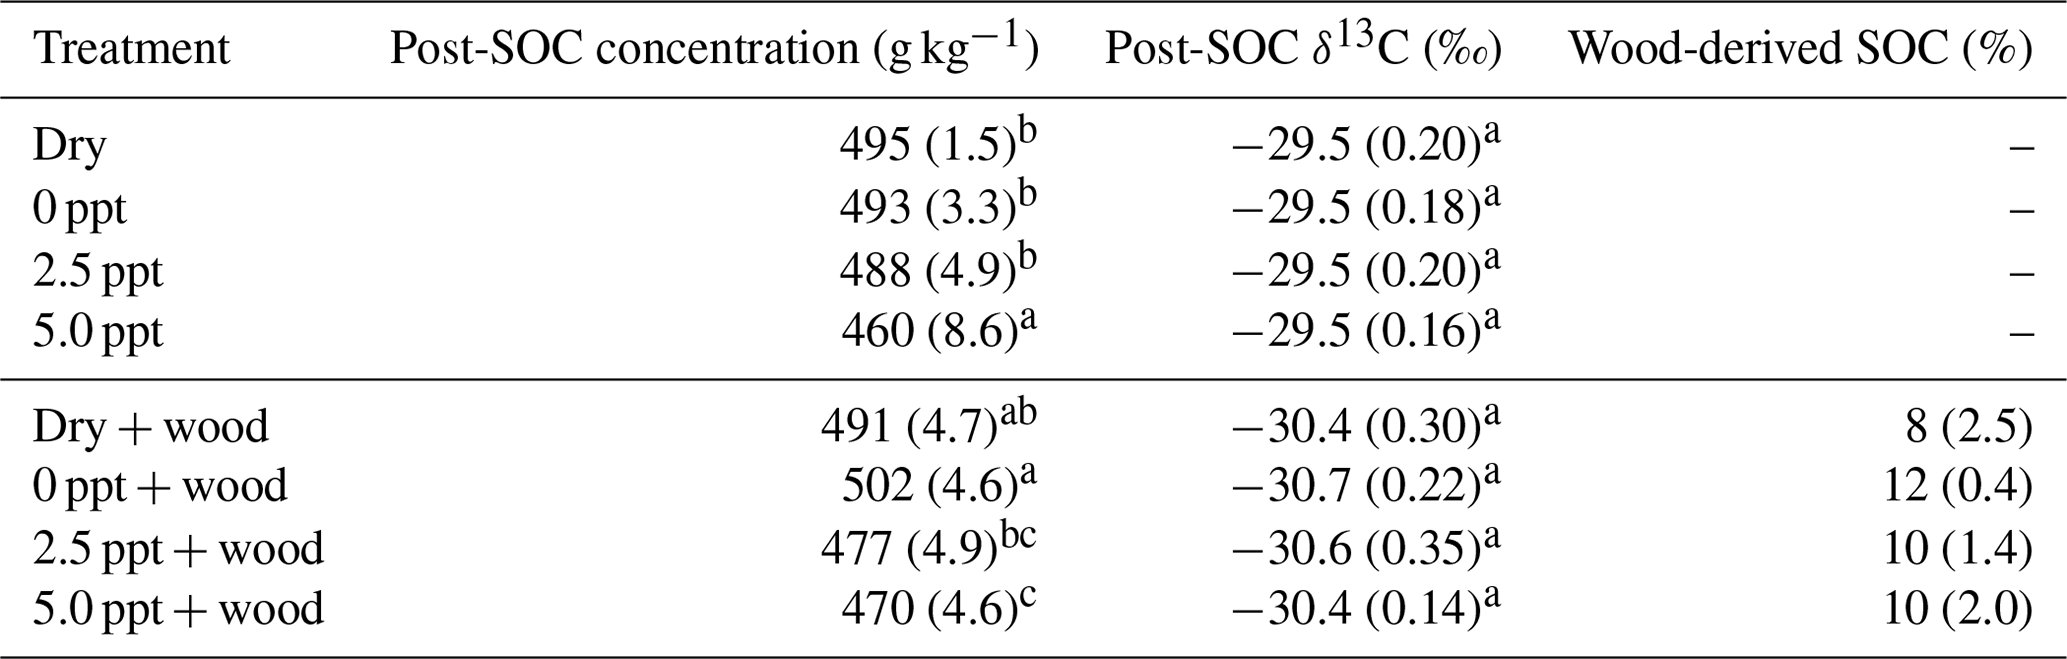
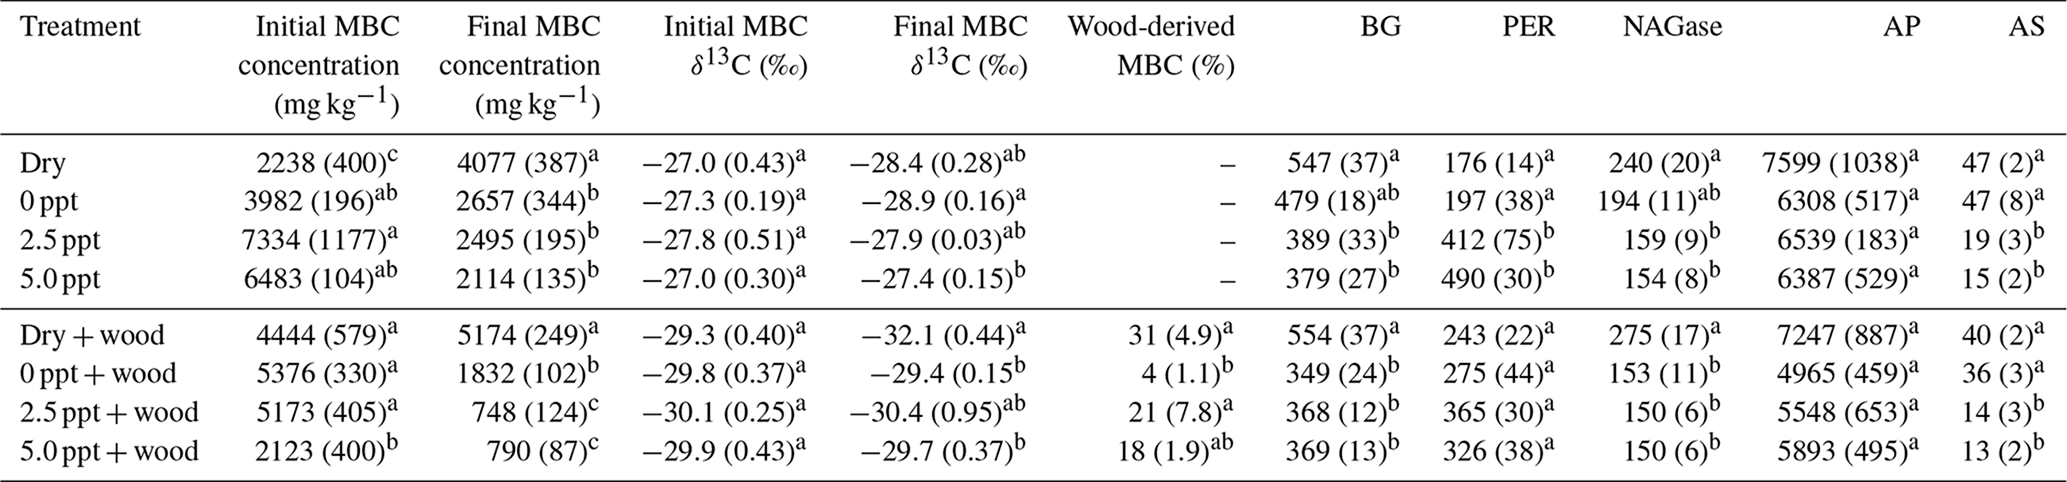
Table 2Postincubation soil organic C (SOC) concentration (g kg−1), SOC δ13C (‰), and wood-derived SOC (%) (estimated from the 13C two-pool mixing model) for soil samples collected from the field and incubated for 98 d in the laboratory under dry conditions (dry) or fully saturated with freshwater (0 ppt) or saltwater (2.5 and 5.0 ppt) and with (+ wood) or without addition of 13C-depleted wood. Standard errors of the mean are in parentheses (n=4). Data from wood-free and wood-amended soils were analyzed separately. Values followed by different superscript lowercase letters are significantly different between the four treatments of the wood-free or wood-amended soils (P<0.05).
3.1 Water and soil properties
Freshwater had higher concentrations of TOC compared to the saltwater treatments (Table 1). Concentration of , Cl−, Na+, Ca2+, Mg2+, and K+ were higher in saltwater treatments compared to freshwater and were approximately twice as high in the 5.0 ppt saltwater treatment compared to 2.5 ppt saltwater (Table 1).
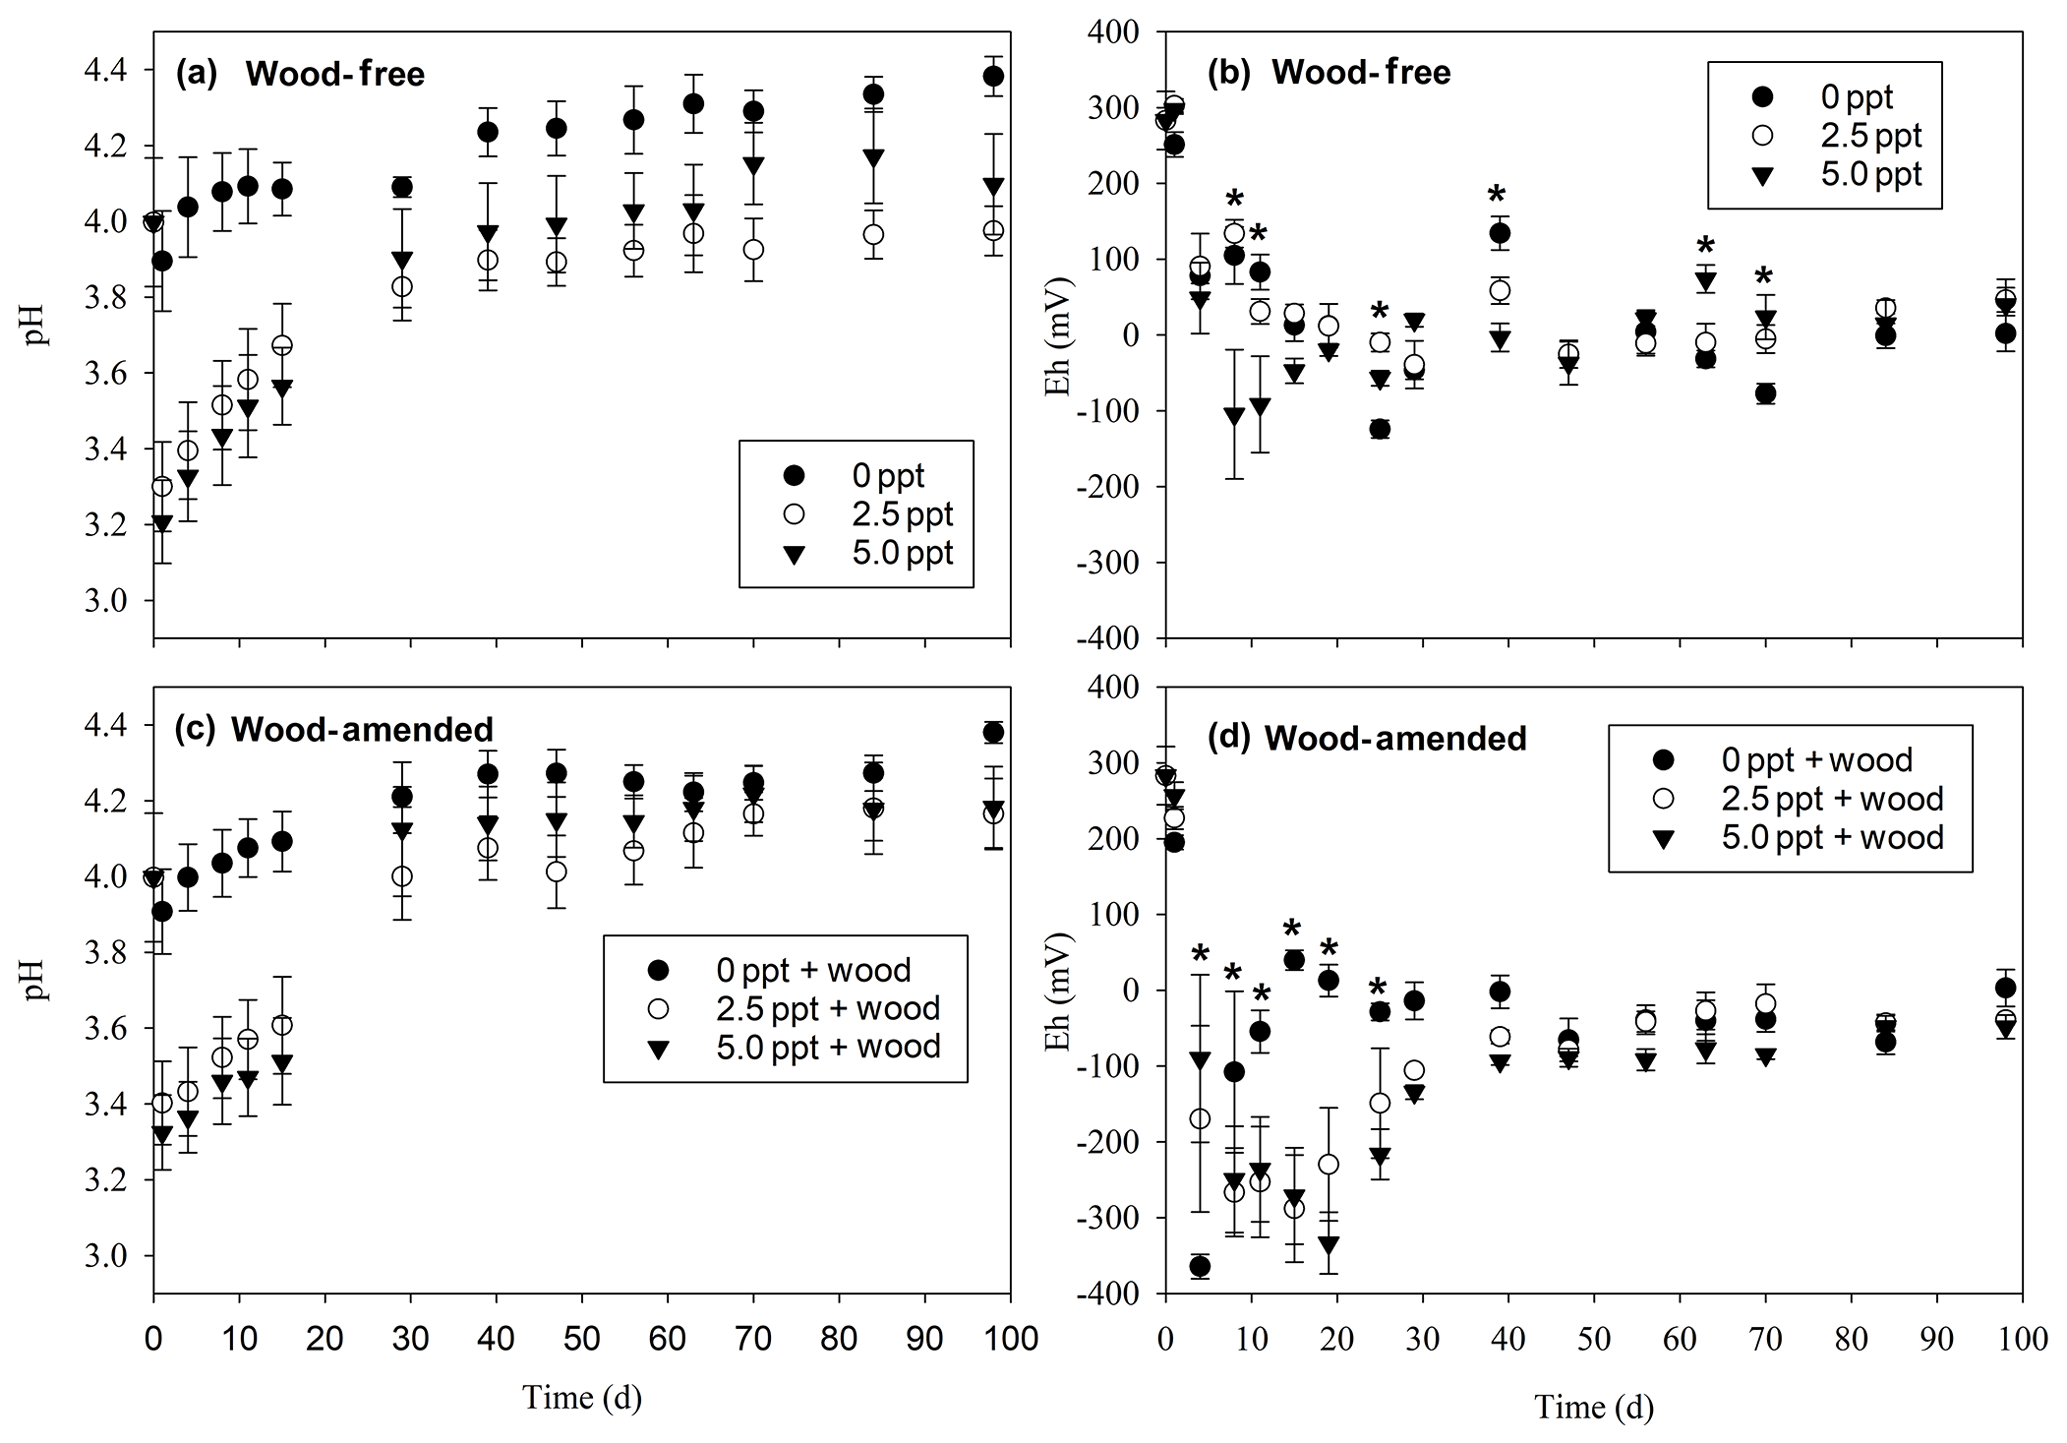
Figure 2pH for wood-free soils (a) and wood-amended soils (b) and redox potential for wood-free soils (c) and wood-amended soils (d) measured over the course of the 98 d laboratory incubation. Symbols represent the mean with standard error (n=4). An asterisk (P<0.05) indicates significant differences between treatment means at each time point.
Initial (preincubation) SOC concentration was 490±27 g kg−1 with a δ13C value of ‰. After 98 d of incubation, SOC concentration in wood-free incubations was lower in the 5.0 ppt saltwater treatment, although no difference in soil δ13C was found between treatments (Table 2). For wood-amended incubations, postincubation SOC concentration was lower in the 5.0 ppt saltwater treatment compared to the dry and freshwater treatment (Table 2). Overall, the δ13C of wood-free ( ‰) and wood-amended soils ( ‰) after 98 d of incubation were significantly different (F=49.6; P<0.0001).
Soil pH was significantly lower in the saltwater treatments in both wood-free and wood-amended soils compared to the dry and freshwater treatments (Table 3; Fig. 2a–c). After an initial drop of pH in saltwater treatments (wood-free and wood-amended) to between 3.2 and 3.4 pH, pH steadily climbed back up to between 3.8 and 4.2 pH. In wood-free soils, differences in soil Eh between treatments were variable over time, with both the 5.0 ppt saltwater treatment and the freshwater treatment having the lowest redox potential at different time points throughout the incubation (Table 3; Fig. 2b), but fell below −124 mV on average. In wood-amended soils, Eh dropped quickly to between −200 and −400 mV over the first 30 d for saltwater-incubated soils (Table 3; Fig. 2d), before rising to between −100 and 0 mV for the rest of the incubation period. In freshwater-incubated soils, Eh rose quickly back to between −50 and 50 mV by day 15 and remained at this level for the rest of the incubation period, while saltwater treatments had significantly lower Eh between days 8 and 25.
Table 3Results (F values and significance) from the repeated-measures ANOVA of pH, Eh, microbial biomass C (MBC), δ13C isotopic signature of MBC, δ13CO2, and δ13CH4 measured in soils collected from a coastal freshwater forested wetland and incubated in the laboratory for 98 d under fully saturated conditions with either freshwater or saltwater (2.5 and 5.0 ppt). Data from wood-free and wood-amended soils were analyzed separately.

* P<0.05, P<0.01, P<0.0001.
3.2 CO2, CH4, δ13CO2-C, and δ13CH4-C
In wood-free incubations, cumulative CO2 production was not different between the dry and freshwater treatments but was higher than that produced from saltwater treatments (Table 4; Fig. 3a). Cumulative CO2 produced from wood-amended soils was highest in the dry treatment compared to all other treatments (Table 4; Fig. 3b). Wood-derived CO2 (calculated as the difference between cumulative CO2 produced from wood-amended and wood-free incubations) was highest in the dry treatment (Table 4; Fig. 3c). This finding was also confirmed by calculating cumulative wood-derived C using the 13C two-pool mixing model, with the highest proportion found in the dry treatment (54±4.6 %) compared to soils incubated with freshwater (42±1.7 %), 2.5 ppt saltwater (37±1.0 %), and 5.0 ppt saltwater (38±1.5 %) (F=10.1; P=0.001).
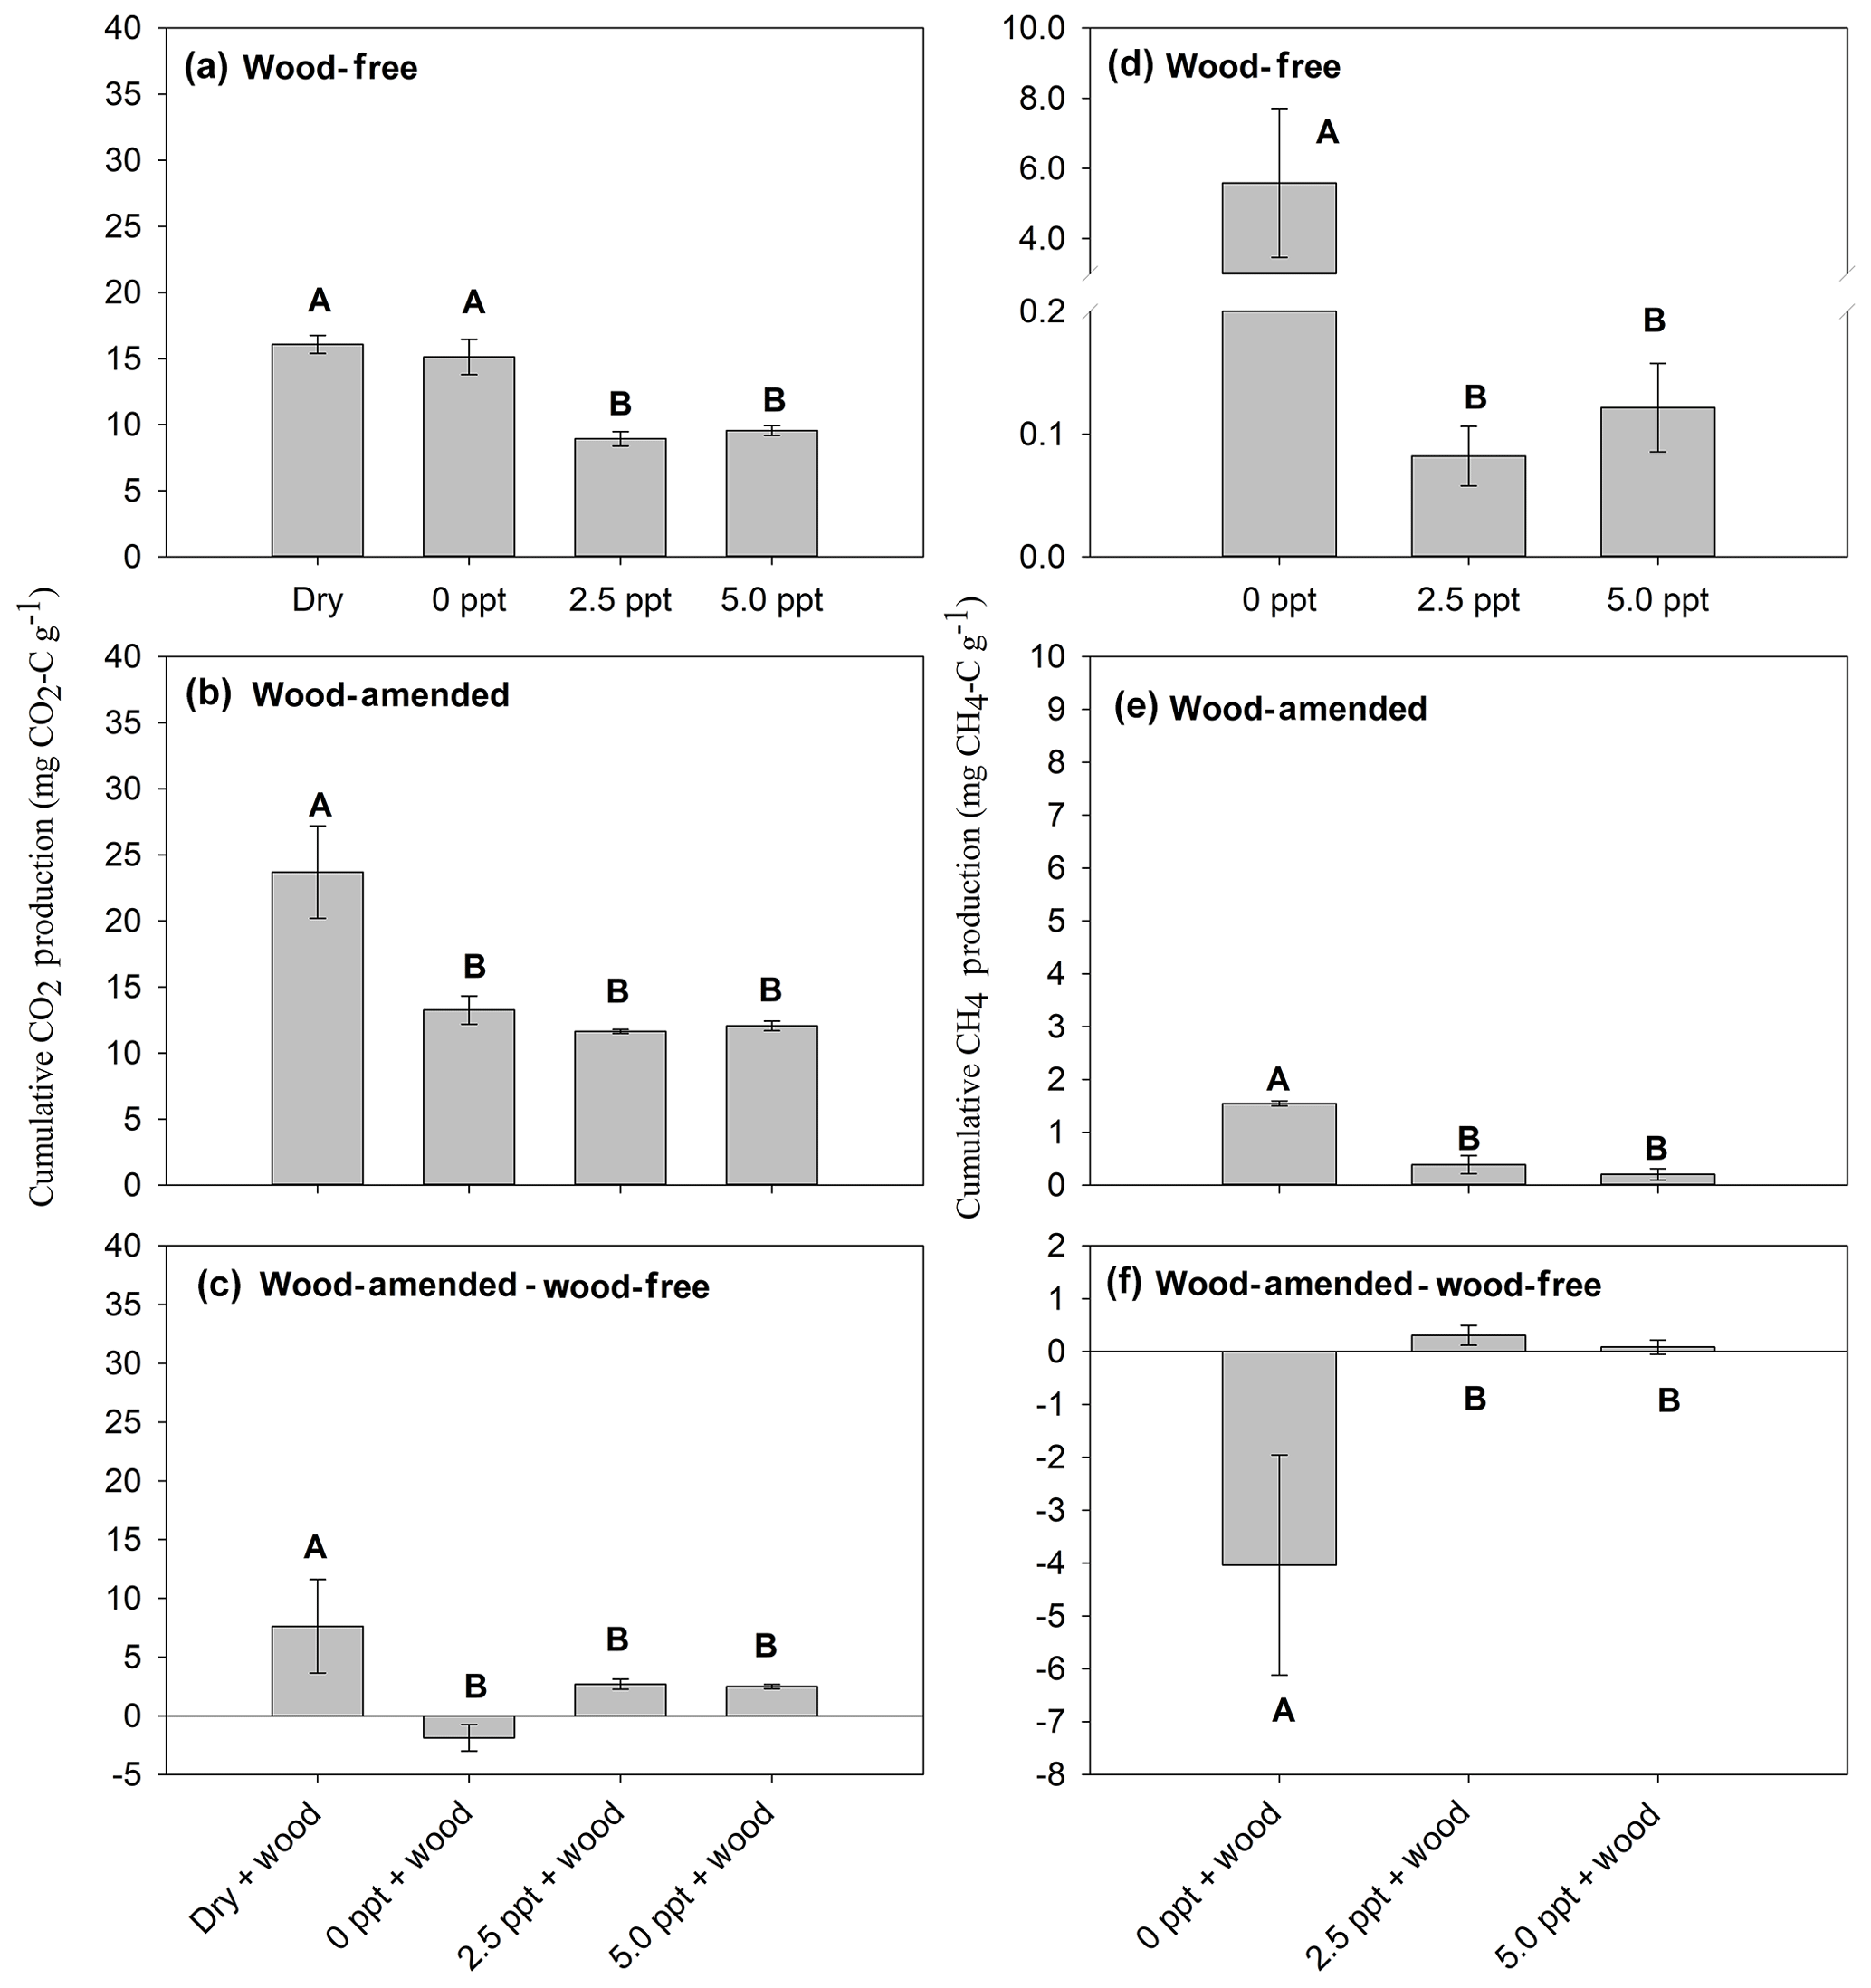
Figure 3Cumulative CO2 production from wood-free soils (a), wood-amended soils (b), and the wood-associated CO2 production (c); and cumulative CH4 production for wood-free soils (d), wood-amended soils (e), and the wood-associated CH4 production (f). Panels (c) and (f) refer to the difference between wood-amended and wood-free soils. Bars represent the mean with standard error (n=4). Bars with different uppercase letters are significantly different (P<0.05).
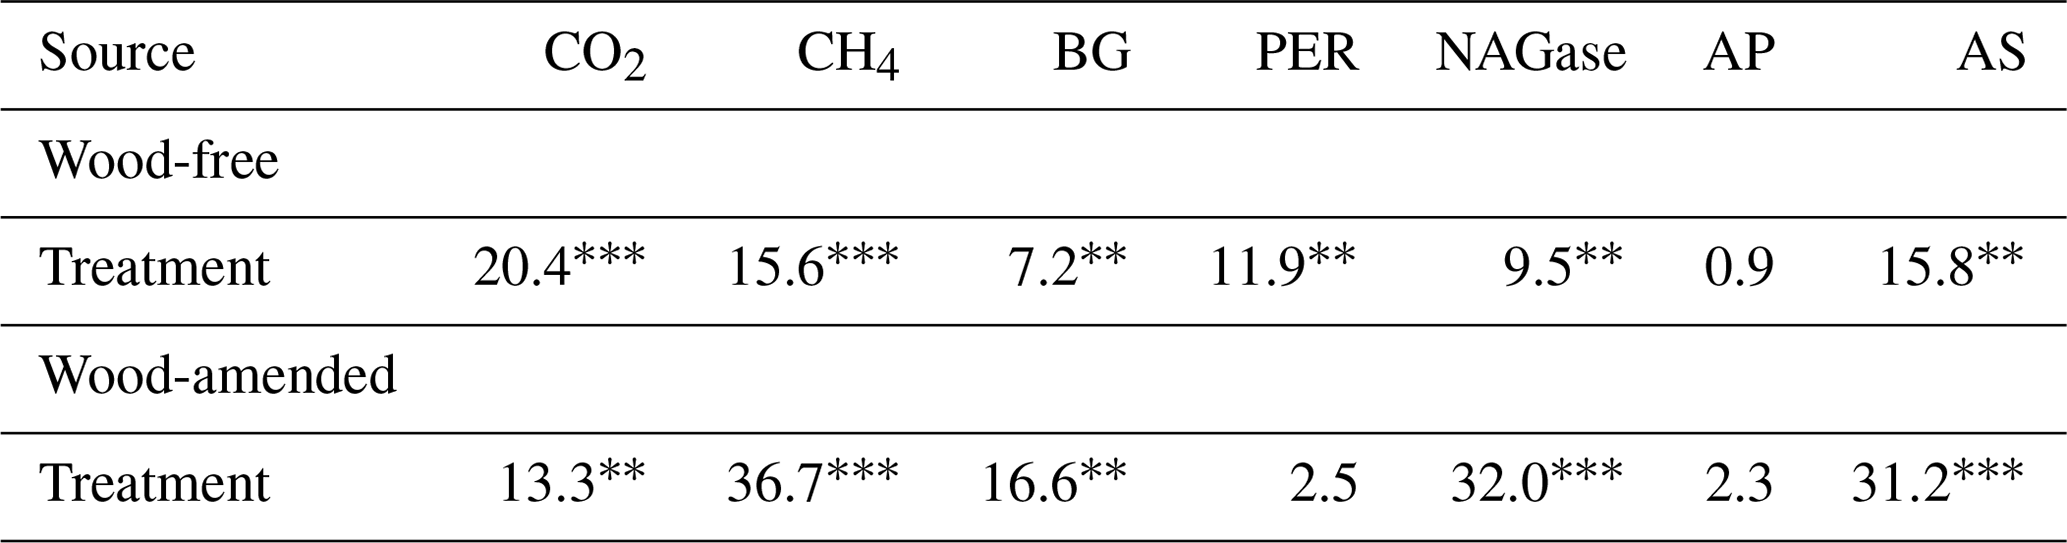
Table 4Results (F values and significance) from the one-way ANOVA of cumulative gas production and extracellular enzyme activity (BG: β-glucosidase; PER: peroxidase; NAGase: glucosaminidase; AP: alkaline phosphatase; and AS: arylsulfatase) from soils collected from a coastal freshwater forested wetland and incubated in the laboratory for 98 d under dry conditions or fully saturated conditions with either freshwater or saltwater (2.5 and 5.0 ppt). Data from wood-free and wood-amended soils were analyzed separately.
* P<0.05, P<0.01, P<0.0001.
Cumulative CH4 production was highest in the freshwater treatment compared to the saltwater treatments in both wood-free and wood-amended incubations (Table 4; Fig. 3d–e). The difference between cumulative CH4 produced from wood-amended and wood-free incubations was lower (and exhibited a negative response to wood additions) in the freshwater treatment compared to both saltwater treatments (Table 3; Fig. 3f), which both had a slight positive response to wood additions.
The CO2:CH4 ratio, in wood-free incubations, was calculated only for soils incubated under saturated conditions with freshwater or saltwater. The CO2:CH4 ratio, in wood-free incubations, was highest in freshwater (6±3.4), compared to the 2.5 ppt saltwater (136±33.9) and 5.0 ppt saltwater (102±30.3) (F=24.8; P=0.0002). The CO2:CH4 ratio, in wood-amended incubations, was highest in freshwater (9±0.8), compared to the 2.5 ppt saltwater (53±20.3) and 5.0 ppt saltwater (107±37.7) (F=9.2; P=0.007).
The δ13CO2-C and wood-derived CO2 (estimated by the 13C two-pool mixing model) exhibited a time by treatment interaction for both wood-free and wood-amended incubations (Table 3; Fig. 4a–b). In general, δ13CO2-C in wood-free and wood-amended incubations was depleted in the dry treatment (and remained steady throughout the incubation period) compared to all other treatments, especially after day 15. The proportion of wood-derived CO2 was initially higher in freshwater and saltwater treatments (after day 1) but gradually dropped over the course of the incubation, while the proportion of wood-derived CO2 from the dry treatment dropped quickly after the first sampling date (day 1) and remained steady (approximately 50 %–60 %) for the remainder of the incubation period (Fig. 4c).
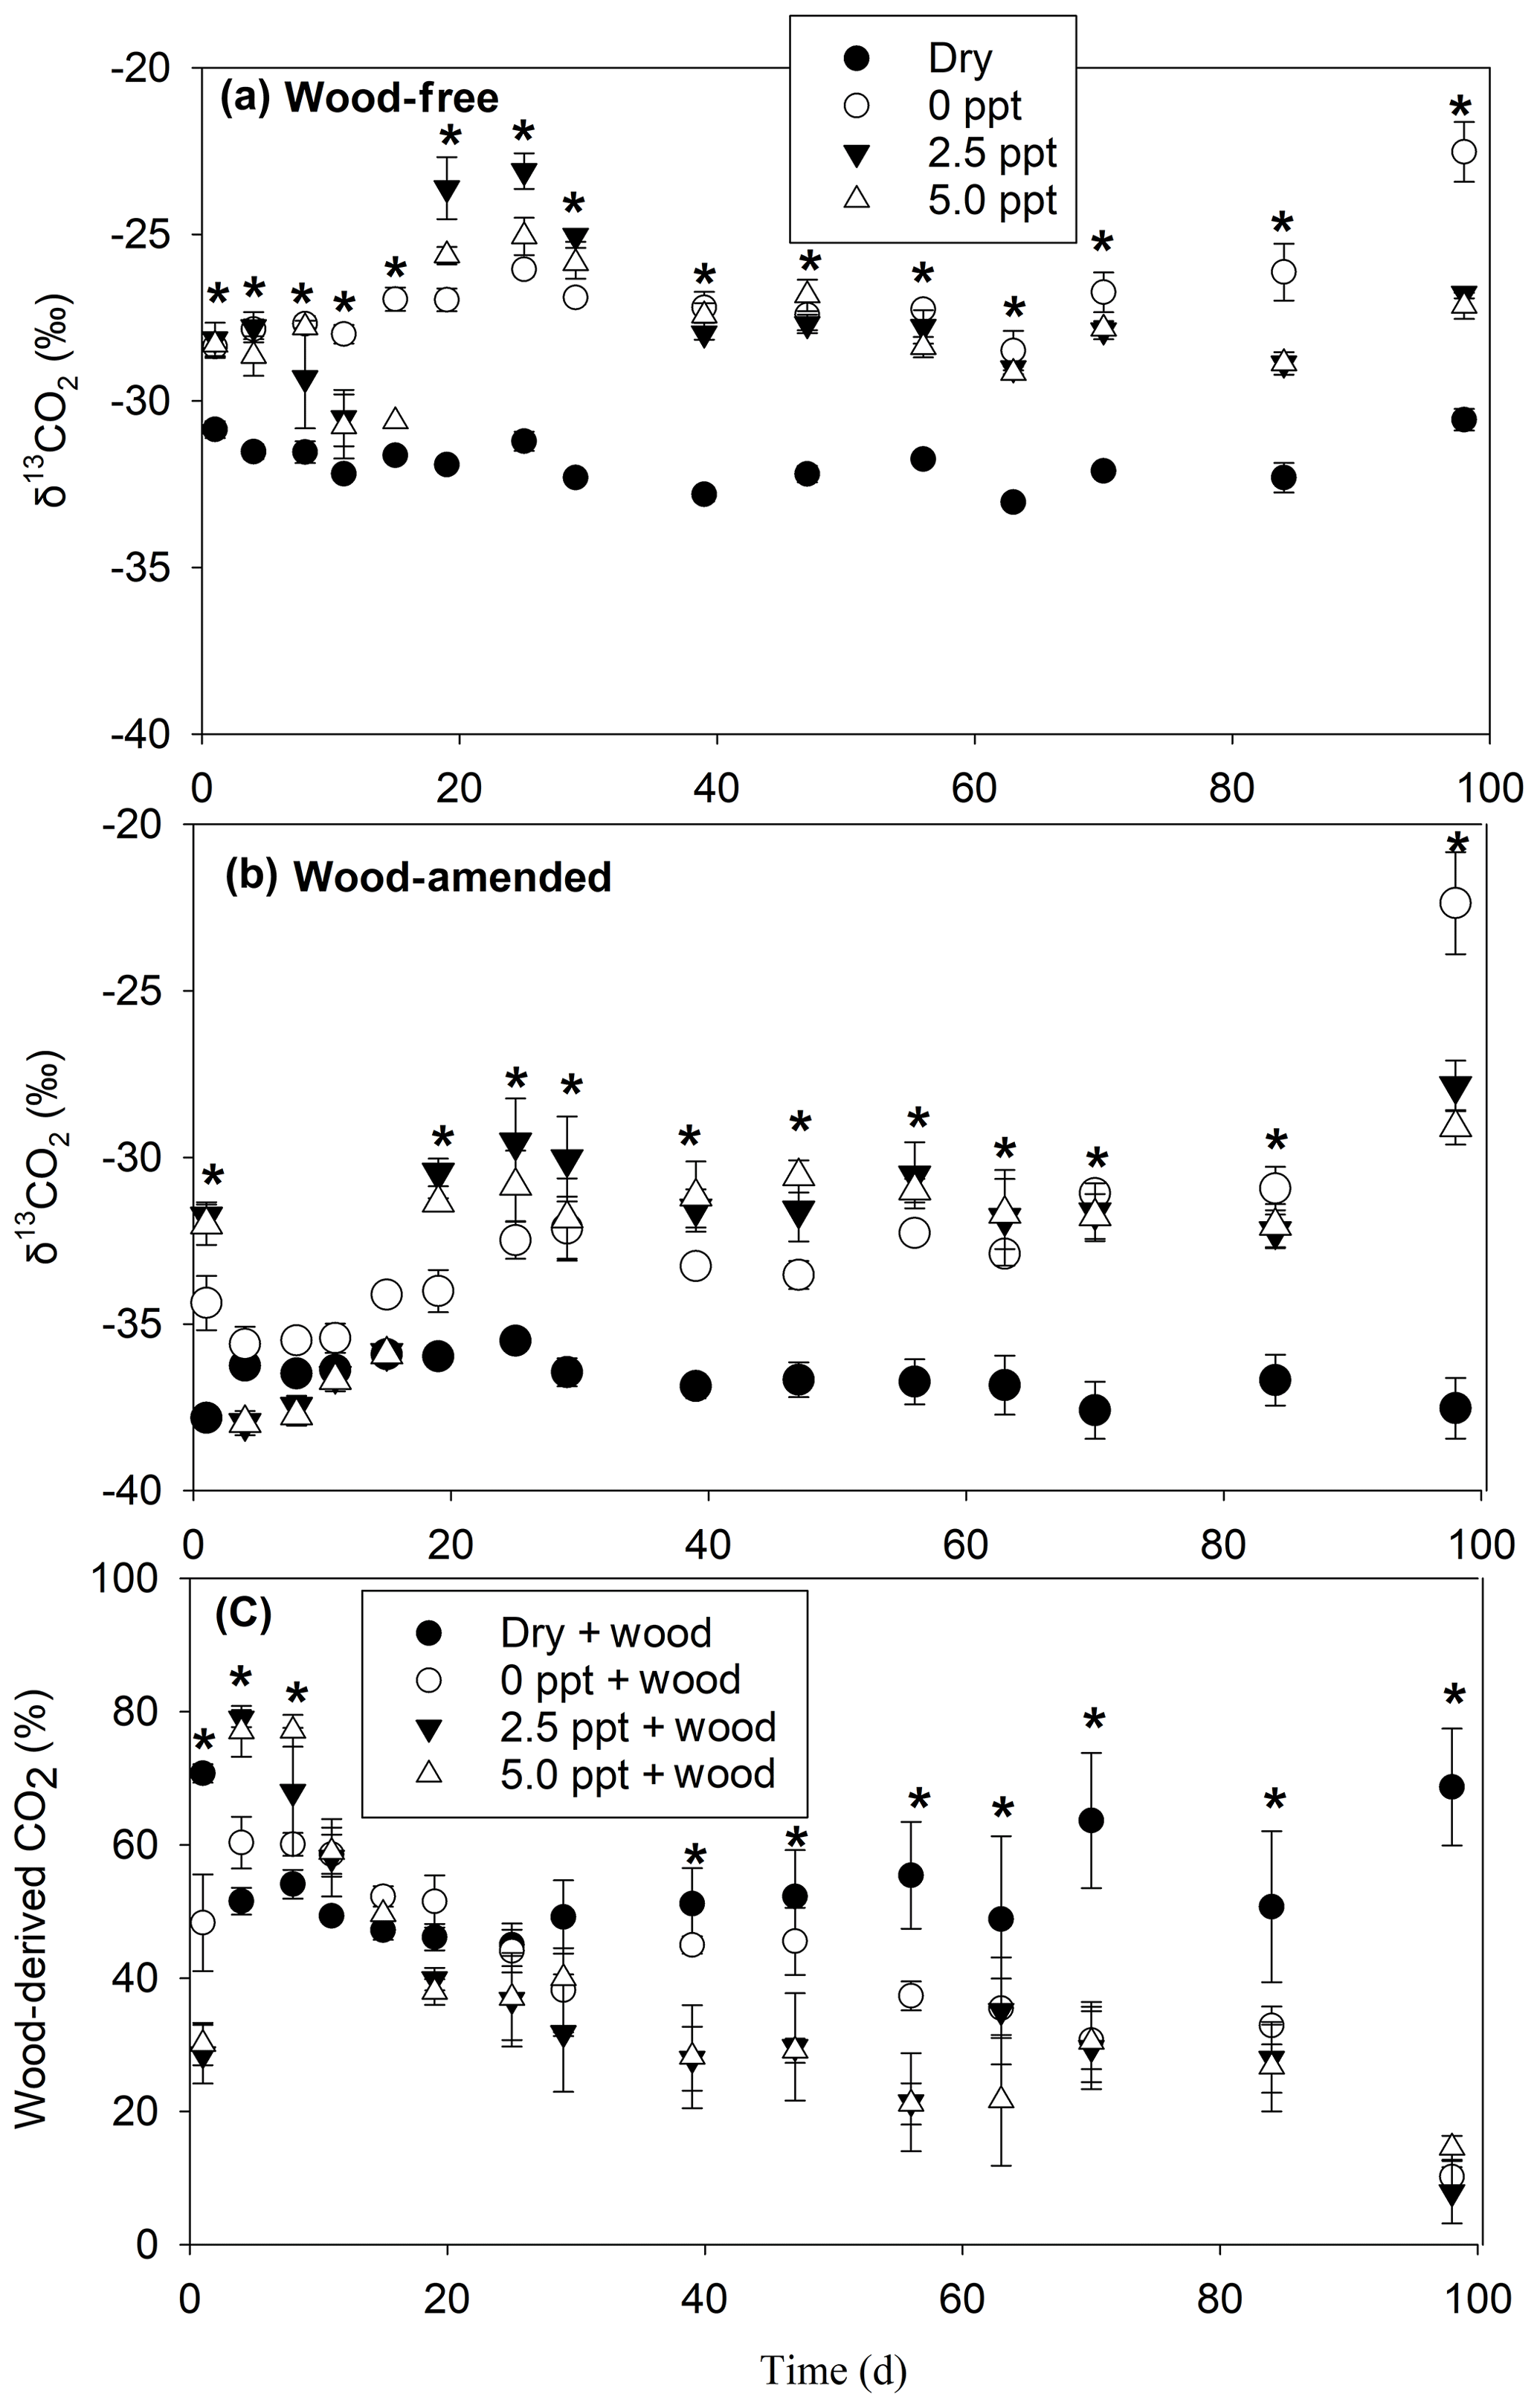
Figure 4The δ13CO2 values measured over the course of the 98 d laboratory incubation for wood-free soils (a), wood-amended soils (b), and the proportion of wood-derived CO2 (c). Bars represent the mean with standard error (n=4). An asterisk (P<0.05) indicates significant differences between treatment means at each time point.
The δ13CH4-C (Table 3; Fig. 5) exhibited a treatment and time effect (Table 3; Fig. 5a–b) but only for wood-free incubations. For wood-free incubations, average δ13CH4-C across the course of the incubation was enriched in the freshwater treatment ( ‰) compared to the 2.5 ppt ( ‰) and 5.0 ppt ( ‰) saltwater treatments (Fig. 5c). No difference in the δ13CH4-C was found in wood-amended incubations (Fig. 4b, d), which ranged from −78 ‰ to −75 ‰ for all treatments.
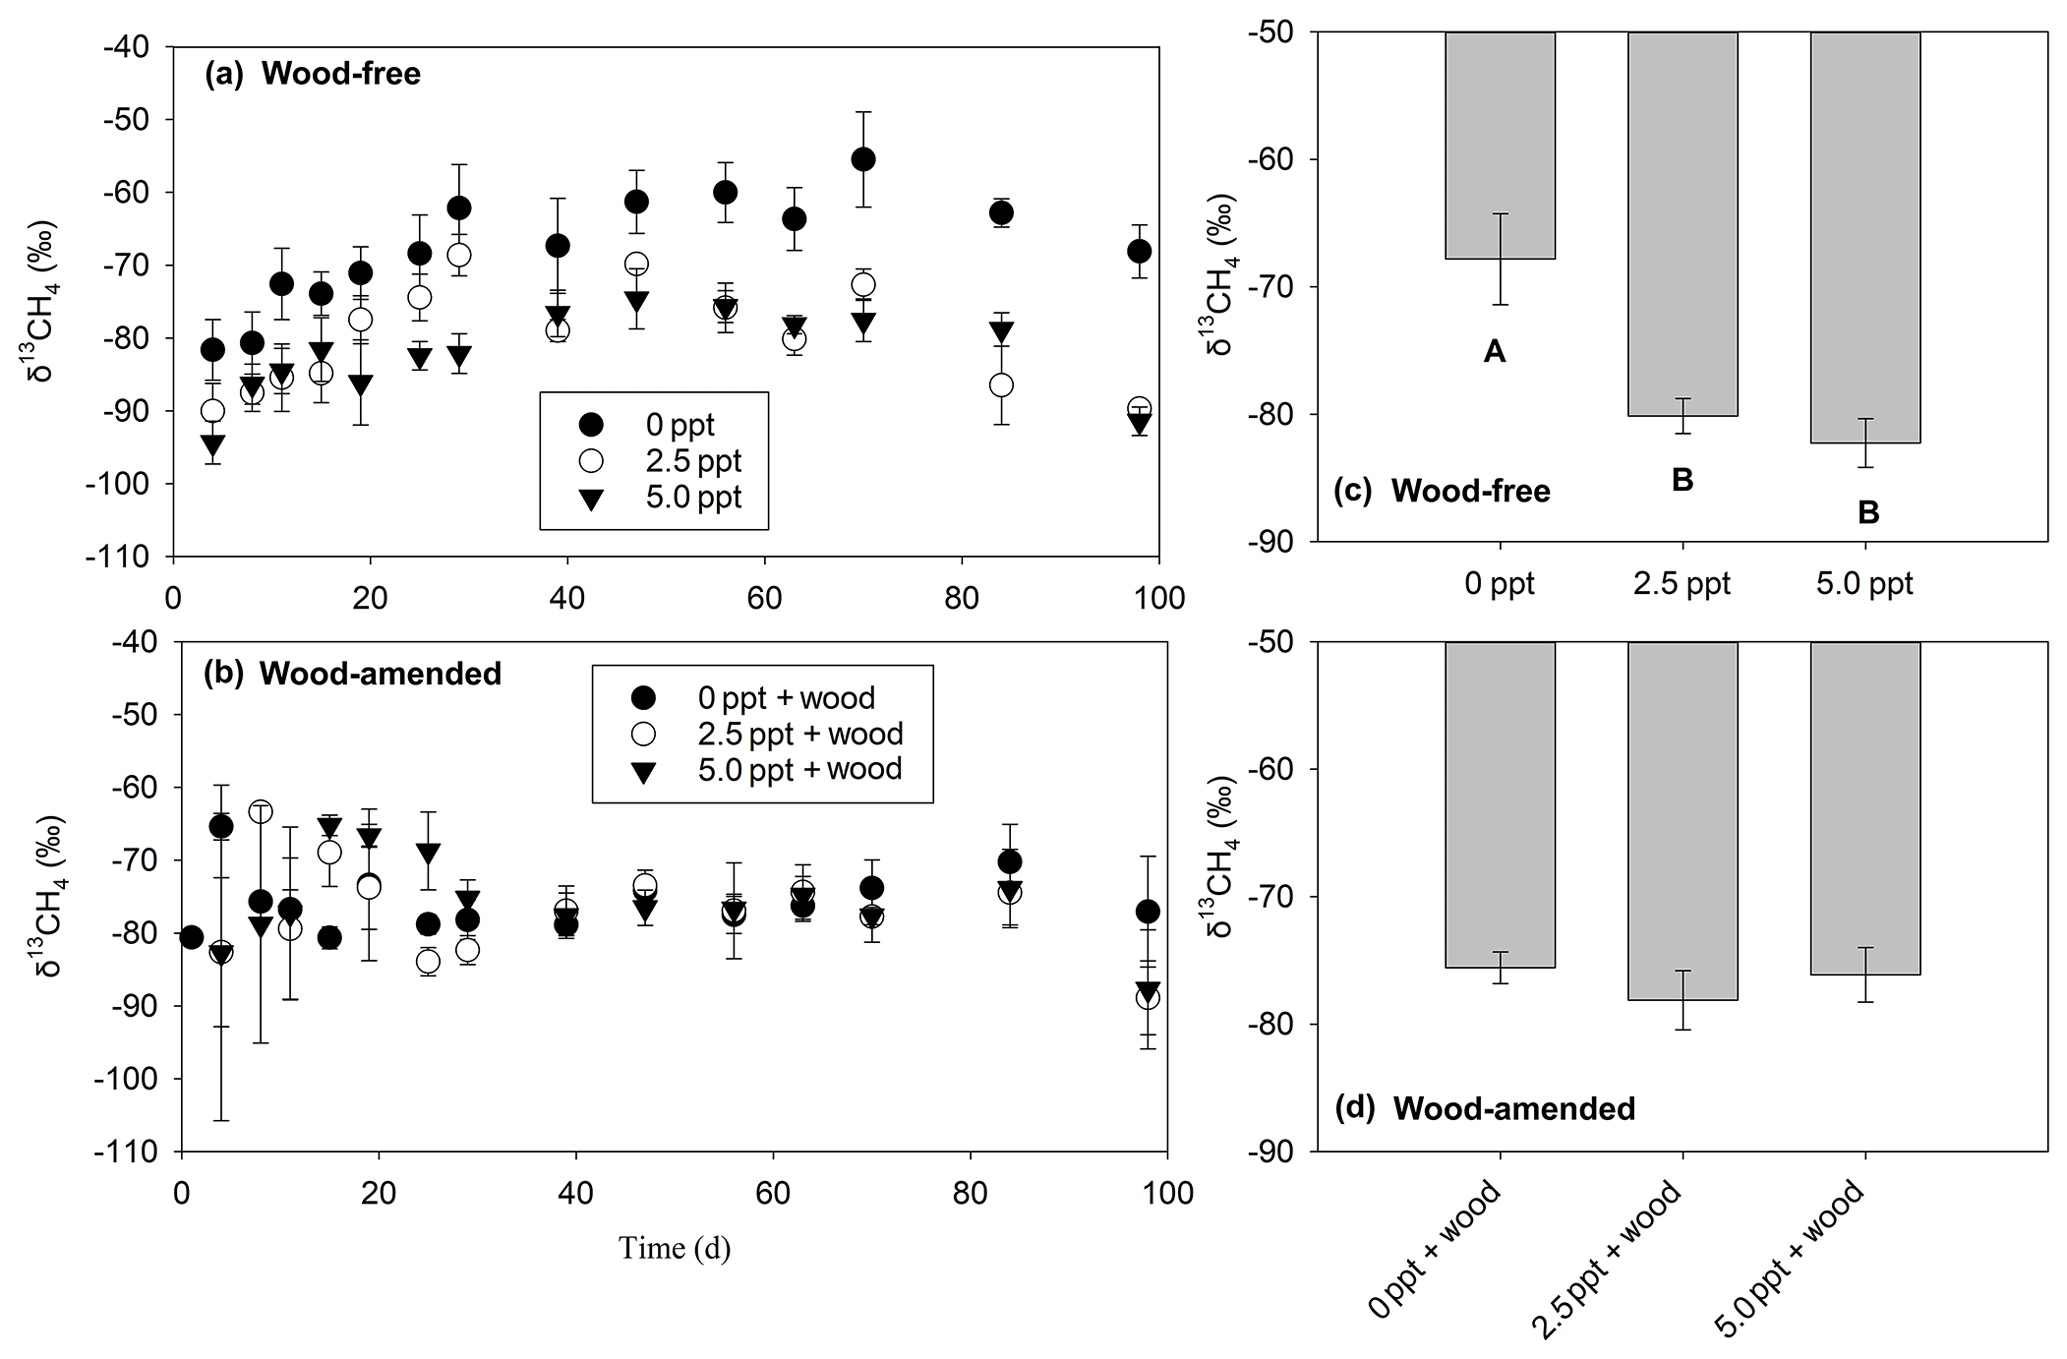
Figure 5The δ13CH4 values measured over the course of the 98 d laboratory incubation for wood-free soils (a) and wood-amended soils (b) and the average δ13CH4 across the entire incubation for wood-free soils (c) and wood-amended soils (d). Symbols or bars represent the mean with standard error (n=4). Treatment means with different lowercase letters are significantly different within a sampling time point (P<0.05).
3.3 Microbial biomass carbon and extracellular enzyme activity
Initially, MBC was lowest in the dry treatment of wood-free incubations and in the 5 ppt treatment of wood-amended incubations (Tables 3; 5). Following the 98 d incubation, MBC was highest in the dry treatment of wood-free incubations, with no differences between the other treatments. In wood-amended incubations, final MBC was also highest in the dry treatment compared to both saltwater treatments. Initial δ13C of MBC did not differ between treatments in either the wood-free or wood-amended soils (Tables 3; 5). After the 98 d incubation, δ13C of MBC in the wood-free treatments was depleted in the freshwater treatment and enriched in the 5.0 ppt saltwater treatment. In wood-amended incubations, δ13C of MBC was depleted in the dry treatment and enriched in the freshwater and 5.0 ppt saltwater treatments. Furthermore, the proportion of wood-derived MBC (as estimated by 13C mixing model calculations) was highest in the dry treatment (31 %) and the 2.5 ppt saltwater treatment (21 %) compared to the freshwater treatment (4 %) (Table 5).
Table 5Initial (1 d) and final (98 d) microbial biomass C (MBC) (mg kg−1), MBC δ13C (‰), wood-derived MBC (%) (estimated using the 13C two-pool mixing model), and cumulative extracellular enzyme activity (µmol g−1) (BG: β-glucosidase; PER: peroxidase; NAGase: glucosaminidase; AP: alkaline phosphatase; and AS: arylsulfatase) for soils incubated under dry conditions (dry) or saturated conditions with freshwater (0 ppt) or saltwater (2.5 and 5.0 ppt) and with (+ wood) or without addition of 13C-depleted wood. Standard errors of the mean are in parentheses (n=4). Values followed by different superscript lowercase letters are significantly different between the four treatments for the wood-free or wood-amended soils (P<0.05).
In wood-free incubations, activity of BG and NAGase was higher, while PER was lower in the dry treatment compared to the saltwater treatments (Tables 4; 5). Activity of AS was higher in the dry and freshwater treatments compared to saltwater treatments, in both wood-free and wood-amended incubations. In wood-amended incubations, BG and NAGase were highest in the dry treatment compared to the saltwater treatments. In the freshwater treatment, wood addition reduced activity of BG and NAGase compared to wood-free incubations (Fig. 6a–b) but enhanced PER activity (Fig. 6c). Wood addition also reduced AS and AP activity across all treatments compared to wood-free incubations (Fig. 6d–e).
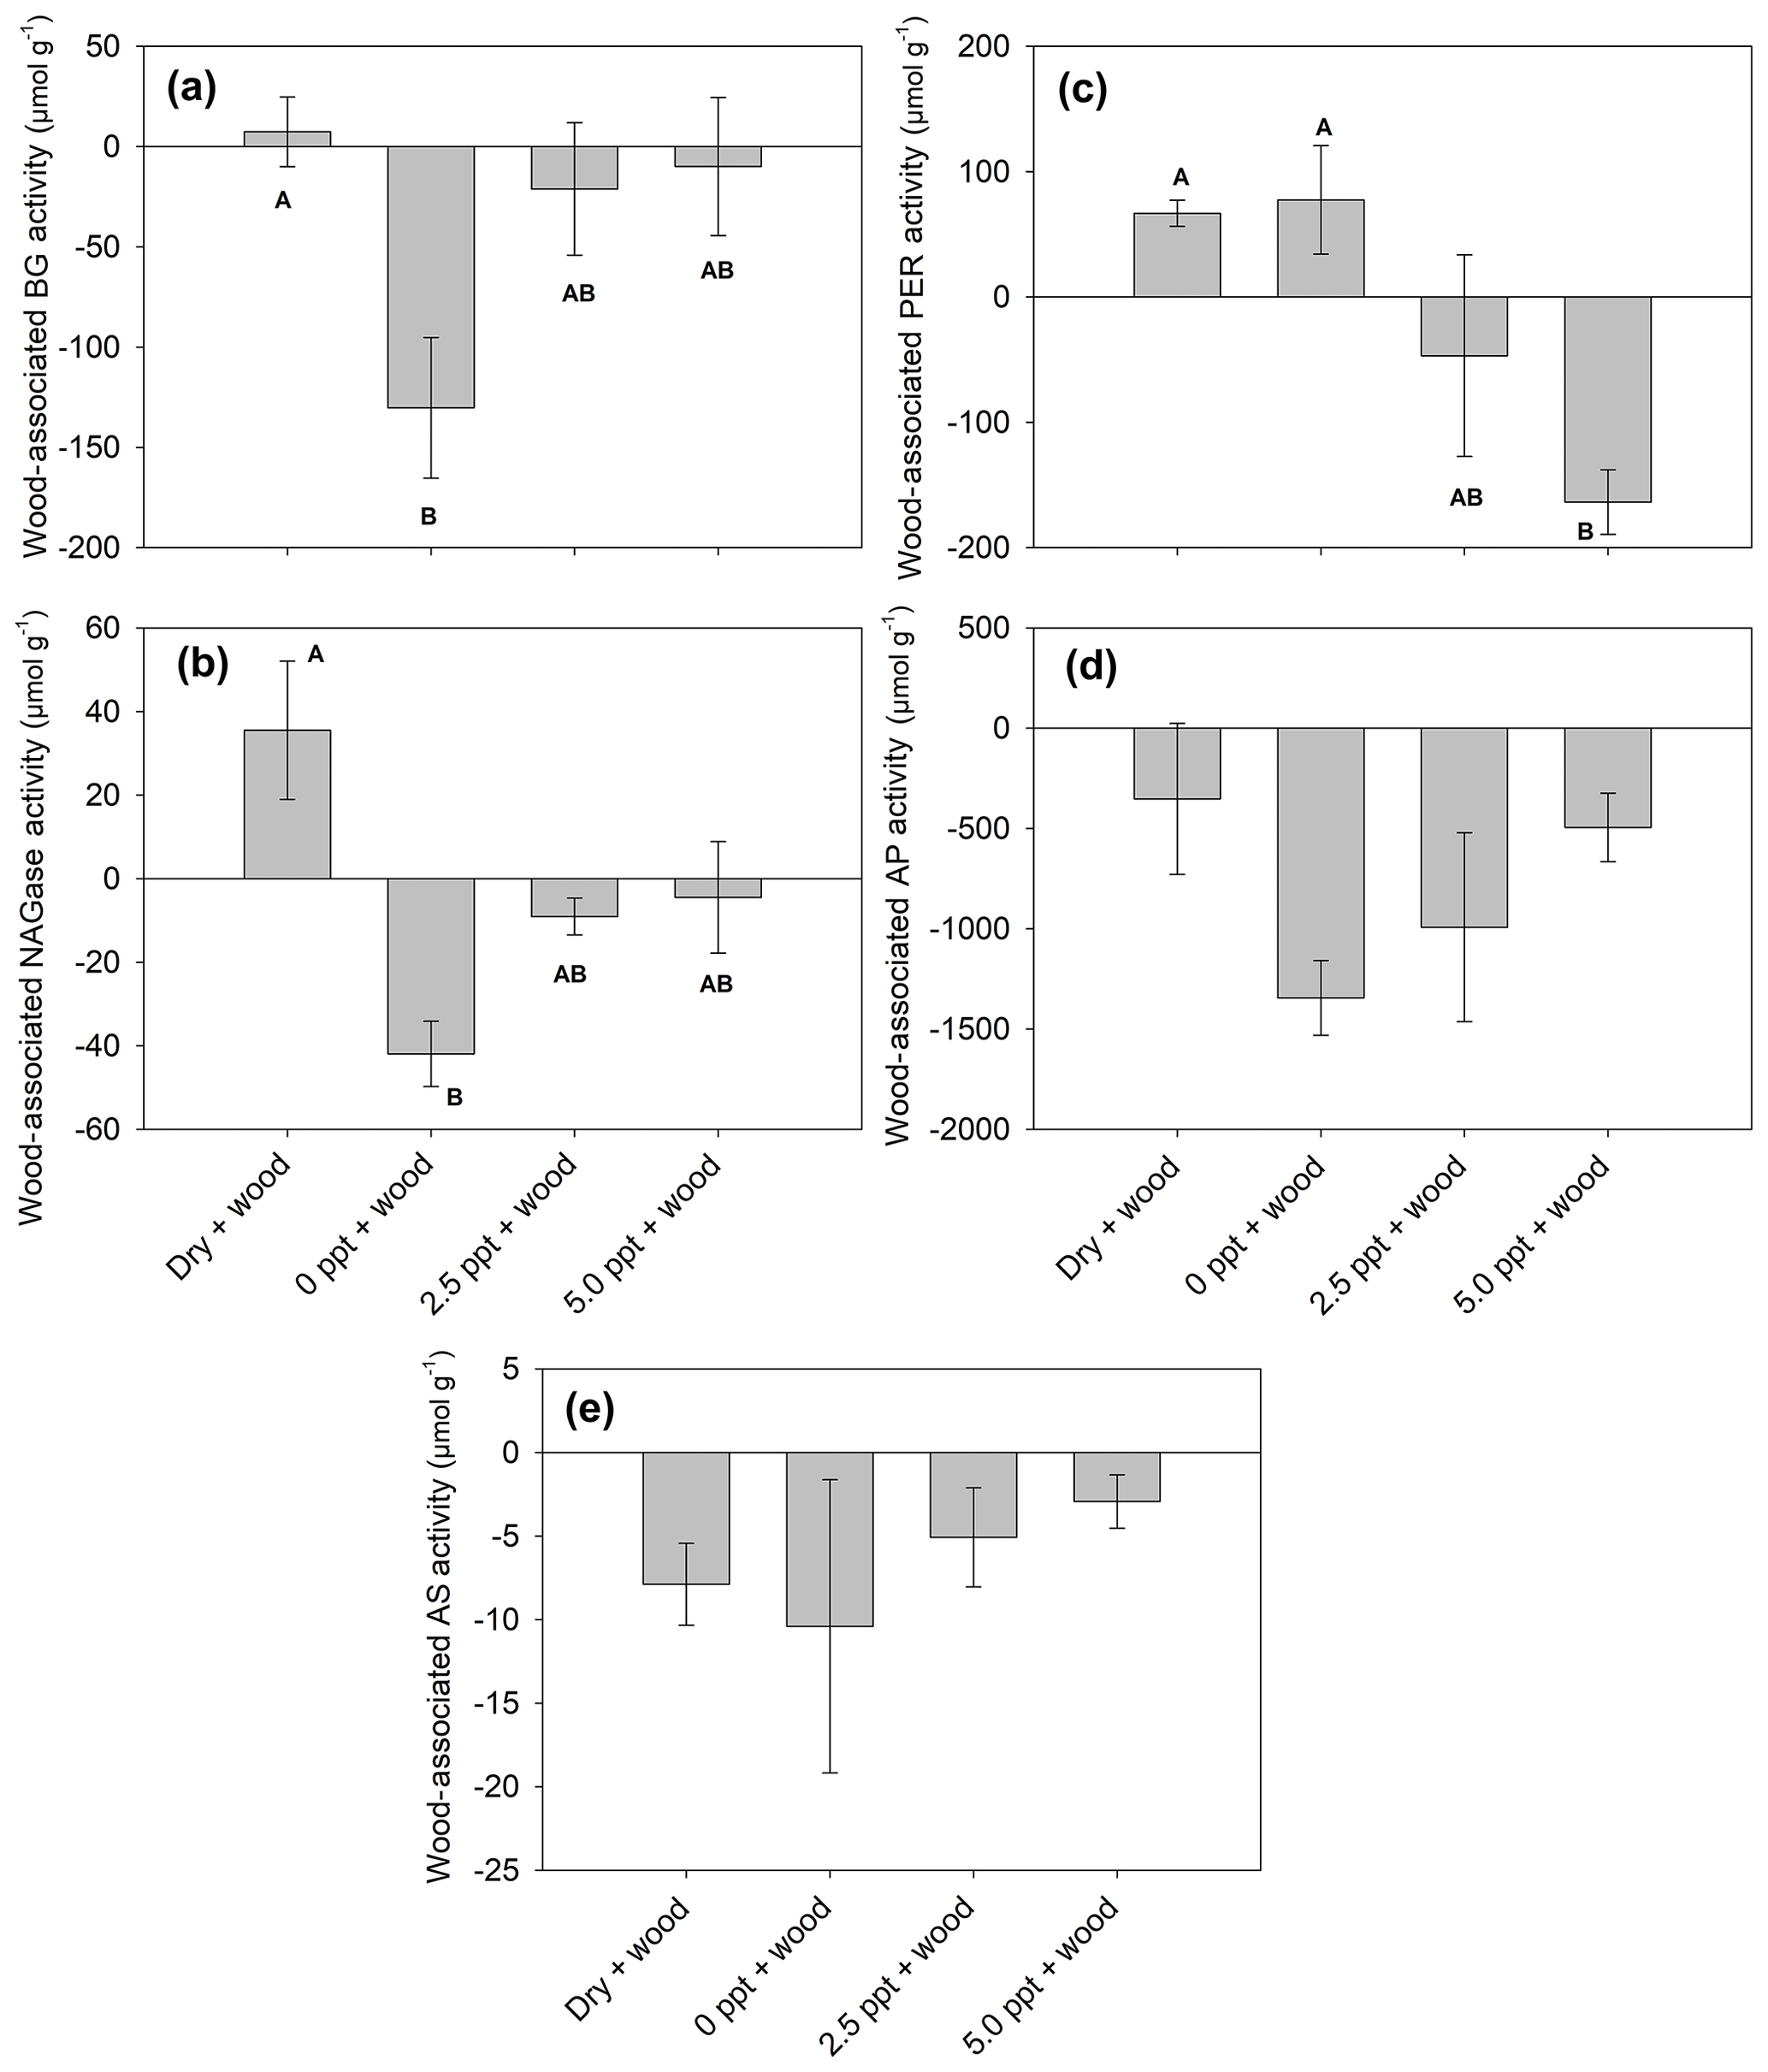
Figure 6Wood-associated (wood-amended – wood-free) enzyme activity (BG: β-glucosidase; PER: peroxidase; NAGase: glucosaminidase; AP: alkaline phosphatase; and AS: arylsulfatase). Bars represent the mean with standard error (n=4). Treatment means with different upper letters are significantly different (P<0.05).
As forests within the lower coastal plain physiographic region of the southeastern US continue to experience increasing stresses from SLR, changes in microbial C cycling processes should be expected. Our results, combined with other field and lab experiments, confirm that saltwater intrusion into coastal freshwater forested wetlands can result in reductions in CO2 and CH4 production (Ardón et al., 2016, 2018), but this may be balanced by long- and short-term effects of saltwater intrusion on these C cycling processes (Weston et al., 2011), as well as changes in C inputs due to forest-to-marsh transition. Further, wood additions to these wetland soils may reduce CH4 production under freshwater conditions compared to the absence wood additions (Fig. 3c and f) but slightly enhance CH4 production under saltwater conditions. Our results also demonstrate that substantial quantities of CH4 can be produced from freshwater wetland soils with redox potential between −100 and 100 mV, which may be related to the specific pathway of CH4 production (acetoclastic versus hydrogenotrophic) (Angle et al., 2017) and challenges the widespread assumption that methanogenesis only occurs at very low redox potentials. Changes in the water table depth at the ARNWR are driven primarily by precipitation patterns (Minick et al., 2019a), resulting in the influx of oxygenated waters. Periodic in situ measurements of redox potential at the ARNWR indicate that standing water is relatively aerated (Eh = 175–260 mV), while surface soils of hummocks when not submerged are more aerated (Eh = 320 mV) than submerged hollow surface soils (Eh = 100 to 150 mV) and deeper organic soils (20–40 cm depth; Eh = 50 to 90 mV) (Kevan Minick, unpublished data). Furthermore, our results indicate that additions of new C to soils as wood may result in short-term reductions in redox potential as anaerobic processes are enhanced due to the added C substrate and terminal electron acceptors are quickly reduced. As SLR continues to rise over the next century, more persistent saltwater intrusion may occur as rising brackish waters mix with nontidal freshwater systems having important implications for both above- and belowground C cycling dynamics. Although our study only looked at these effects in a controlled laboratory experiment, these data provide a baseline understanding of potential changes in C cycling dynamics in these wetlands due to SLR.
Saltwater additions decreased CO2 production compared to freshwater in the wood-free soils, although postincubation MBC and extracellular enzyme activity (e.g., BG, NAGase, and AP) were not different between these treatments. This has been found in other pocosin wetland soils on the coast of North Carolina (Ardón et al., 2018). Variable effects of salinity (and/or additions) have been found on soil respiration, with some studies showing an increase (Marton et al., 2012; Weston et al., 2011), a decrease (Lozanovska et al., 2016; Servais et al., 2019), or no change (Baldwin et al., 2006). Krauss et al. (2012) found that permanently flooded saltwater treatments (expected in nontidal wetlands) in a simulated coastal swamp mesocosm reduced soil respiration, whereas saltwater pulses (expected in tidal wetlands) had a variable effect on soil respiration. Alternatively, CO2 production was not reduced in the saltwater compared to freshwater treatments in wood-amended soils, while postincubation MBC was lower in the saltwater compared to freshwater, which suggests a shift in microbial carbon use efficiency.
Methane production was higher in the freshwater compared to saltwater treatments in both wood-amended and wood-free incubations. Numerous others studies have found that saltwater reduces CH4 fluxes compared to freshwater, both within the field and laboratory. Reduced CH4 production from saltwater treated soils primarily results from the availability of more energetically favorable terminal electron acceptors (primarily ), which leads to the competitive suppression of methanogenic microbial communities by -reducing communities (Bridgham et al., 2013; Chambers et al., 2011; Winfrey and Zeikus, 1977), as methanogens and reducers compete for acetate and electrons (Le Mer and Roger, 2001). Dang et al. (2019) did find partial recovery over time of the methanogenic community following saltwater inundation to freshwater soil cores, but interestingly this community resembled that of microbes performing hydrogenotrophic methanogenesis and not acetoclastic methanogenesis. Activity of arylsulfatase was also lower in saltwater amended soils. This also indicates a functional change in the microbial community, as microbes in the saltwater treatment are utilizing the readily available pool, while microbes in the freshwater and dry treatments are still actively producing -liberating enzymes to support their metabolic activities. Findings by Baldwin et al. (2006) support the effects of saltwater on changing the microbial community structure as well, in which reductions in CH4 production in NaCl-treated freshwater sediments were accompanied by a reduction in archaeal (methanogens) microbial population, establishing a link between shifting microbial populations and changing CH4 flux rates due to saltwater intrusion.
Changes in the CH4 production due to saltwater additions appear to be related to the dominant CH4-producing pathway. The 13CH4 isotopic signature in wood-free freshwater-incubated soils indicated that acetoclastic methanogenesis was the dominant CH4-producing pathway, while hydrogenotrophic methanogenesis dominated in the saltwater treatments. Acetoclastic methanogenesis produces isotopically enriched CH4 compared to that of the hydrogenotrophic methanogenesis (Chasar et al., 2000; Conrad et al., 2010; Krohn et al., 2017; Sugimoto and Wada, 1993; Whiticar et al., 1986; Whiticar, 1999). The differences in C discrimination between the two pathways are greater for the hydrogenotrophic compared to the acetoclastic pathway, resulting in more depleted (−110 ‰ to −60 ‰) and more enriched (−60 ‰ to −50 ‰) 13CH4, respectively. This has been confirmed in field and laboratory experiments (Conrad et al., 2010; Krohn et al. 2017; Krzycki et al., 1987; Sugimoto and Wada, 1993; Whiticar et al., 1986; Whiticar, 1999). Baldwin et al. (2006) also found that saltwater additions promoted the hydrogenotrophic methanogenic pathway. Further, recent studies have found that saltwater additions to soils result in a shift in the relative abundance of hydrogenotrophic methanogens (Chambers et al., 2011; Dang et al., 2019), supporting the idea that saltwater may alter not only the production of CH4 but also the pathway of methane production.
Changes in freshwater and saltwater hydrology due to rising seas is leading to dramatic shifts in the dominant plant communities within the ARNWR and across the southeastern US (Conner et al., 1997; Department of Defense, 2010; Langston et al., 2017; Kirwan and Gedan, 2019). This has the potential to alter the soil C balance due to introduction of large amounts of coarse woody debris as trees die. In our laboratory experiment, additions of wood resulted in changes in both CO2 and CH4 production, but the direction of change depended on if soils were incubated with freshwater or saltwater. Wood additions increased CO2 production compared to wood-free soils, except in the freshwater treatment. This was particularly evident in the dry treatment where wood additions increased CO2 production by approximately 32 %. For the dry treatment, wood-amended soils had the highest MBC and NAGase activity as microbes were likely immobilizing more N to support metabolic activities in the presence of added C (Fisk et al., 2015). Higher respiration with wood additions in the saltwater treatments likely resulted from enhanced metabolic activity of -reducing microbes in the presence of an added C source. On the other hand, wood additions resulted in a decline in CH4 production from the freshwater treatment while slightly enhancing CH4 production from the saltwater treatments. Wood additions also resulted in much lower redox potential, particularly in the saltwater treatments, and coupled with 13CH4 stable isotope composition may have driven the higher levels of CH4 production (via hydrogenotrophic methanogenesis) in the wood plus saltwater treatments. The suppression of CH4 production by wood additions in the freshwater treatment was somewhat surprising given the positive effects of C additions on CH4 production recently found in freshwater sediments (West et al., 2012) but likely resulted from enhancement of other, more energetically favorable redox reactions with the addition of a C source (e.g., wood). Furthermore, wood additions to freshwater incubations resulted in a decrease in MBC and activity of BG and NAGase enzymes compared to wood-free incubations and an increase in PER activity. This suggests that the microbial communities have altered their functional capacity in response to wood additions when exposed to freshwater. The CO2:CH4 ratio further indicated that, in freshwater, CH4 production was quite high in relation to CO2 production. This ratio was significantly higher for saltwater treatments as CH4 production dropped drastically compared to freshwater. In wood-free incubations, the CO2:CH4 trend between freshwater and saltwater treatments was parabolic but was linear upward in wood-amended soils. This suggests that interactions between saltwater concentration and coarse woody debris (in the form of dead and dying trees; Kirwan and Gedan, 2019) may be important to understand when determining effects of saltwater intrusion on greenhouse gas production in freshwater forested wetlands.
Findings from this study indicate that substantial changes in the greenhouse gas production and microbial activity are possible due to saltwater intrusion into freshwater wetland ecosystems but that the availability of C in the form of dead wood (as forests transition to marsh) may alter the magnitude of this effect. At ARNWR and similar coastal freshwater forested wetlands, saltwater intrusion may reduce both CO2 and CH4 emissions from soils to the atmosphere. Sea level rise will likely lead to dramatic and visually striking changes in vegetation, particularly transitioning forested wetlands into shrub or marsh wetlands (Kirwan and Gedan, 2019), which has resulted in the widespread occurrence of “ghost” forests along the Atlantic coast (Kirwan and Gedan, 2019). As forested wetlands are lost, dead trees could provide a significant source of C to already C-rich peat soils, with the potential to alter CO2 and CH4 production. The long-term effect of forest-to-marsh transition on ecosystem C storage will likely depend on the balance between dead wood inputs and effects of SLR and vegetation change on future C inputs and soil microbial C cycling processes. Future work should include investigation of these C cycling and microbial processes at the field scale and expand to a wider range of nontidal wetlands within the southeastern US region.
Datasets analyzed and included in this study are available from the corresponding author by request.
All authors contributed to the conception and design of the study. KJM wrote the first draft of the manuscript. KJM collected the samples from the field and performed laboratory analysis. All authors contributed to manuscript revision and approved the submitted version.
The authors declare that they have no conflict of interest.
We thank numerous undergraduate researchers for their invaluable help in collecting samples from the field and analyzing samples in the laboratory. We also thank two reviewers for their comments, which significantly improved the manuscript. The USFWS Alligator River National Wildlife Refuge provided helpful scientific discussions, the forested wetland research site, and valuable in-kind support.
Primary support was provided by USDA NIFA award 2014-67003-22068. Additional support was provided by DOE NICCR award 08-SC-NICCR-1072, the USDA Forest Service Eastern Forest Environmental Threat Assessment Center award 13-V-11330110-081, and the Carolinas Integrated Sciences and Assessments award 2013-0190/13-2322.
This paper was edited by Helge Niemann and reviewed by Friederike Gründger and one anonymous referee.
Allen, T., Wang, Y., Gore, B., Swords, J., and Newcomb, D.: Coastal Wetland mapping using time series SAR imagery and LiDAR: Alligator River National Wildlife Refuge, North Carolina, in: Proceedings Pecora 18 Symposium, 14–17 November 2011, Herndon, Virginia, 2011.
Angle, J. C., Morin, T. H., Solden, L. M., Narrowe, A. B., Smith, G. J., Borton, M. A., Rey-Sanchez, C., Daly, R. A., Mirfenderesgi, G., and Hoyt, D. W.: Methanogenesis in oxygenated soils is a substantial fraction of wetland methane emissions, Nat. Commun., 8, 1567, https://doi.org/10.1038/s41467-017-01753-4, 2017.
Ardón, M., Helton, A. M., and Bernhardt, E. S.: Drought and saltwater incursion synergistically reduce dissolved organic carbon export from coastal freshwater wetlands, Biogeochemistry, 127, 411–426, https://doi.org/10.1007/s10533-016-0189-5, 2016.
Ardón, M., Helton, A. M., and Bernhardt, E. S.: Salinity effects on greenhouse gas emissions from wetland soils are contingent upon hydrologic setting: a microcosm experiment, Biogeochemistry, 140, 217–232, https://doi.org/10.1007/s10533-018-0486-2, 2018.
Baldwin, D. S., Rees, G. N., Mitchell, A. M., Watson, G., and Williams, J.: The short-term effects of salinization on anaerobic nutrient cycling and microbial community structure in sediment from a freshwater wetland, Wetlands, 26, 455–464, https://doi.org/10.1672/0277-5212(2006)26[455:TSEOSO]2.0.CO;2, 2006.
Batjes, N. H.: Total carbon and nitrogen in the soils of the world, Eur. J. Soil Sci., 47, 151–163, https://doi.org/10.1111/ejss.12114_2, 1996.
Bridgham, S. D., Megonigal, J. P., Keller, J. K., Bliss, N. B., and Trettin, C.: The carbon balance of North American wetlands, Wetlands, 26, 889–916, https://doi.org/10.1672/0277-5212(2006)26[889:TCBONA]2.0.CO;2, 2006.
Bridgham, S. D., Cadillo-Quiroz, H., Keller, J. K., and Zhuang, Q.: Methane emissions from wetlands: biogeochemical, microbial, and modeling perspectives from local to global scales, Glob. Change Biol., 19, 1325–1346, https://doi.org/10.1111/gcb.12131, 2013.
Chambers, L. G., Reddy, K. R., and Osborne, T. Z.: Short-term response of carbon cycling to salinity pulses in a freshwater wetland, Soil Sci. Soc. Am. J., 75, 2000–2007, https://doi.org/10.2136/sssaj2011.0026, 2011.
Chasar, L., Chanton, J., Glaser, P., and Siegel, D.: Methane concentration and stable isotope distribution as evidence of rhizospheric processes: Comparison of a fen and bog in the Glacial Lake Agassiz Peatland complex, Ann. Bot.-London, 86, 655–663, https://doi.org/10.1006/anbo.2000.1172, 2000.
Conner, W., McLeod, K., and McCarron, J.: Flooding and salinity effects on growth and survival of four common forested wetland species, Wetl. Ecol. Manag., 5, 99–109, https://doi.org/10.1023/A:1008251127131, 1997.
Conrad, R., Klose, M., Claus, P., and Enrich-Prast, A.: Methanogenic pathway, 13C isotope fractionation, and archaeal community composition in the sediment of two clear-water lakes of Amazonia, Limnol. Oceanogr., 55, 689–702, https://doi.org/10.4319/lo.2010.55.2.0689, 2010.
Dang, C., Morrissey, E. M., Neubauer, S. C., and Franklin, R. B.: Novel microbial community composition and carbon biogeochemistry emerge over time following saltwater intrusion in wetlands, Glob. Change Biol., 25, 549–561, https://doi.org/10.1111/gcb.14486, 2019.
Department of Defense (DOD): Responding to climate change, Natural Selections, 6, 2–4, 2010.
Feng, X., Xu, Y., Jaffé, R., Schlesinger, W. H., and Simpson, M. J.: Turnover rates of hydrolysable aliphatic lipids in Duke Forest soils determined by compound specific 13C isotopic analysis, Org. Geochem., 41, 573–579, https://doi.org/10.1016/j.orggeochem.2010.02.013, 2010.
Fisk, M., Santangelo, S., and Minick, K.: Carbon mineralization is promoted by phosphorus and reduced by nitrogen addition in the organic horizon of northern hardwood forests, Soil Biol. Biochem., 81, 212–218, https://doi.org/10.1016/j.soilbio.2014.11.022, 2015.
Fry, B.: Stable Isotope Ecology, Springer, New York, NY, 2006.
Joergensen, R. G.: The fumigation-extraction method to estimate soil microbial biomass: calibration of the kEC value, Soil Biol. Biochem., 28, 25–31, https://doi.org/10.1016/0038-0717(95)00102-6, 1996.
Johnson, M. G. and Kern, J. S.: Quantifying the organic carbon held in forested soils of the United States and Puerto Rico, chap. 4, edited by: Kimble, J. S., The Potential of U.S. Forest Soils to Sequester Carbon and Mitigate the Greenhouse Effect, CRC Press LLC, Boca Raton, FL, 2003.
Karegar, M. A., Dixon, T. H., Malservisi, R., Kusche, J., and Engelhart, S. E.: Nuisance flooding and relative sea-level rise: the importance of present-day land motion, Sci. Rep.-UK, 7, 11197, https://doi.org/10.1038/s41598-017-11544-y, 2017.
Kemp, A. C., Horton, B. P., Donnelly, J. P., Mann, M. E., Vermeer, M., and Rahmstorf, S.: Climate related sea-level variations over the past two millennia, P. Natl. Acad. Sci. USA, 108, 11017–11022, https://doi.org/10.1073/pnas.1015619108, 2011.
Kim, D., Oren, R., and Qian, S. S.: Response to CO2 enrichment of understory vegetation in the shade of forests, Glob. Change Biol., 22, 944–956, https://doi.org/10.1111/gcb.13126, 2016.
Kirwan, M. L. and Gedan, K. B.: Sea-level driven land conversion and the formation of ghost forests, Nat. Clim. Change, 9, 450–457, https://doi.org/10.1038/s41558-019-0488-7, 2019.
Krauss, K. W., Whitbeck, J. L., and Howard, R. J.: On the relative roles of hydrology, salinity, temperature, and root productivity in controlling soil respiration from coastal swamps (freshwater), Plant Soil, 358, 265–274, https://doi.org/10.1007/s11104-012-1182-y, 2012.
Krohn, J., Lozanovska, I., Kuzyakov, Y., Parvin, S., and Dorodnikov, M.: CH4 and CO2 production below two contrasting peatland micro-relief forms: An inhibitor and δ13C study, Sci. Total Environ., 586, 142–151, https://doi.org/10.1016/j.scitotenv.2017.01.192, 2017.
Krzycki, J. A., Kenealy, W. R., Deniro, M. J., and Zeikus, J. G.: Stable carbon isotope fractionation by Methanosarcina barkeri during methanogenesis from acetate, methanol, or carbon dioxide-hydrogen, Appl. Environ. Microb., 53, 2597–2599, 1987.
Langston, A. K., Kaplan, D. A., and Putz, F. E.: A casualty of climate change? Loss of freshwater forest islands on Florida's Gulf Coast, Glob. Change Biol., 23, 5383–5397, https://doi.org/10.1111/gcb.13805, 2017.
Le Mer, J. and Roger, P.: Production, oxidation, emission and consumption of methane by soils: a review, Eur. J. Soil Biol., 37, 25–50, https://doi.org/10.1016/S1164-5563(01)01067-6, 2001.
Lozanovska, I., Kuzyakov, Y., Krohn, J., Parvin, S., and Dorodnikov, M.: Effects of nitrate and sulfate on greenhouse gas emission potentials from microform-derived peats of a boreal peatland: A 13C tracer study, Soil Biol. Biochem., 100, 182–191, https://doi.org/10.1016/j.soilbio.2016.06.018, 2016.
Marton, J. M., Herbert, E. R., and Craft, C. B.: Effects of salinity on denitrification and greenhouse gas production from laboratory-incubated tidal forest soils, Wetlands, 32, 347–357, https://doi.org/10.1007/s13157-012-0270-3, 2012.
Miao, G., Noormets, A., Domec, J., Trettin, C. C., McNulty, S. G., Sun, G., and King, J. S.: The effect of water table fluctuation on soil respiration in a lower coastal plain forested wetland in the southeastern US, J. Geophys. Res.-Biogeo., 118, 1748–1762, https://doi.org/10.1002/2013JG002354, 2013.
Miao, G., Noormets, A., Domec, J.-C., Fuentes, M., Trettin, C. C., Sun, G., McNulty, S. G., and King, J. S.: Hydrology and microtopography control carbon dynamics in wetlands: implications in partitioning ecosystem respiration in a coastal plain forested wetland, Agr. Forest Meteorol., 247, 343–355, https://doi.org/10.1016/j.agrformet.2017.08.022, 2017.
Mitra, B., Miao, G., Minick, K. J., McNulty, S., Sun, G., Gavazzi, M., King, J. S., and Noormets, A.: Disentangling the effects of temperature, moisture and substrate availability on soil CO2 efflux, J. Geophys. Res.-Biogeo., 124, 2060–2075, https://doi.org/10.1029/2019JG005148, 2019.
Minick, K. J., Kelley, A. M., Miao, G., Li, X., Noormets, A., Mitra, B., and King, J. S.: Microtopography alters hydrology, phenol oxidase activity and nutrient availability in organic soils of a coastal freshwater forested wetland, Wetlands, 39, 263–273, https://doi.org/10.1007/s13157-018-1107-5, 2019a.
Minick, K. J., Mitra, B., Li, X., Noormets, A., and King, J. S.: Water table drawdown alters soil and microbial carbon pool size and isotope composition in coastal freshwater forested wetlands, Frontiers in Forests and Global Change, 2, 1–19, https://doi.org/10.3389/ffgc.2019.00007, 2019b.
Morrissey, E. M., Gillespie, J. L., Morina, J. C., and Franklin, R. B.: Salinity affects microbial activity and soil organic matter content in tidal wetlands, Glob. Change Biol., 20, 1351–1362, https://doi.org/10.1111/gcb.12431, 2014.
Neubauer, S. C., Franklin, R. B., and Berrier, D. J.: Saltwater intrusion into tidal freshwater marshes alters the biogeochemical processing of organic carbon, Biogeosciences, 10, 8171–8183, https://doi.org/10.5194/bg-10-8171-2013, 2013.
Riggs, S. R.: Sediment evolution and habitat function of organic-rich muds within the Albemarle estuarine system, North Carolina, Estuaries, 19, 169–185, https://doi.org/10.2307/1352223, 1996.
Riggs, S. R. and Ames, D. V.: Drowning the North Carolina coast: Sea-level rise and estuarine dynamics, North Carolina Sea Grant, Raleigh, NC, 2008.
Sallenger, A. H., Doran, K. S., and Howd, P. A.: Hotspot of accelerated sea-level rise on the Atlantic coast of North America, Nat. Clim. Change, 2, 884, https://doi.org/10.1038/nclimate1597, 2012.
Schlesinger, W., Bernhardt, E., DeLucia, E., Ellsworth, D., Finzi, A., Hendrey, G., Hofmockel, K., Lichter, J., Matamala, R., and Moore, D.: The Duke Forest FACE experiment: CO2 enrichment of a loblolly pine forest, in: Managed Ecosystems and CO2, Springer, Berlin, Heidelberg, 197–212, 2006.
Servais, S., Kominoski, J. S., Charles, S. P., Gaiser, E. E., Mazzei, V., Troxler, T. G., and Wilson, B. J.: Saltwater intrusion and soil carbon loss: Testing effects of salinity and phosphorus loading on microbial functions in experimental freshwater wetlands, Geoderma, 337, 1291–300, https://doi.org/10.1016/j.geoderma.2018.11.013, 2019.
Sinsabaugh, R., Antibus, R., Linkins, A., McClaugherty, C., Rayburn, L., Repert, D., and Weiland, T.: Wood decomposition over a first-order watershed: mass loss as a function of lignocellulase activity, Soil Biol. Biochem., 24, 743–749, https://doi.org/10.1016/0038-0717(92)90248-V, 1992.
Sinsabaugh, R. L., Antibus, R., Linkins, A., McClaugherty, C., Rayburn, L., Repert, D., and Weiland, T.: Wood decomposition: nitrogen and phosphorus dynamics in relation to extracellular enzyme activity, Ecology, 74, 1586–1593, https://doi.org/10.2307/1940086, 1993.
Sugimoto, A. and Wada, E.: Carbon isotopic composition of bacterial methane in a soil incubation experiment: Contributions of acetate and CO2H2, Geochim. Cosmochim. Ac., 57, 4015–4027, https://doi.org/10.1016/0016-7037(93)90350-6, 1993.
Titus, J. G. and Richman, C.: Maps of lands vulnerable to sea level rise: modeled elevations along the US Atlantic and Gulf coasts, Clim. Res., 18, 205–228, https://doi.org/10.3354/cr018205, 2001.
Vance, E. D., Brookes, P. C., and Jenkinson, D. S.: An extraction method for measuring soil microbial biomass C, Soil Biol. Biochem., 19, 703–707, https://doi.org/10.1016/0038-0717(87)90052-6, 1987.
West, W. E., Coloso, J. J., and Jones, S. E.: Effects of algal and terrestrial carbon on methane production rates and methanogen community structure in a temperate lake sediment, Freshwater Biol., 57, 949–955, https://doi.org/10.1111/j.1365-2427.2012.02755.x, 2012.
Weston, N. B., Vile, M. A., Neubauer, S. C., and Velinsky, D. J.: Accelerated microbial organic matter mineralization following salt-water intrusion into tidal freshwater marsh soils, Biogeochemistry, 102, 135–151, https://doi.org/10.1007/s10533-010-9427-4, 2011.
Whiticar, M. J.: Carbon and hydrogen isotope systematics of bacterial formation and oxidation of methane, Chem. Geol., 161, 291–314, https://doi.org/10.1016/S0009-2541(99)00092-3, 1999.
Whiticar, M. J., Faber, E., and Schoell, M.: Biogenic methane formation in marine and freshwater environments: CO2 reduction vs. acetate fermentation–isotope evidence, Geochim. Cosmochim. Ac., 50, 693–709, https://doi.org/10.1016/0016-7037(86)90346-7, 1986.
Winfrey, M. R. and Zeikus, J. G.: Effect of sulfate on carbon and electron flow during microbial methanogenesis in freshwater sediments, Appl. Environ. Microb., 33, 275–281, 1977.