the Creative Commons Attribution 4.0 License.
the Creative Commons Attribution 4.0 License.
 | 30 Apr 2020
Evidence of changes in sedimentation rate and sediment fabric in a low-oxygen setting: Santa Monica Basin, CA
Nathaniel Kemnitz
William M. Berelson
Douglas E. Hammond
Laura Morine
Maria Figueroa
Timothy W. Lyons
Simon Scharf
Nick Rollins
Elizabeth Petsios
Sydnie Lemieux
Tina Treude
The Southern California Bight is adjacent to one of the world's largest urban areas, Los Angeles. As a consequence, anthropogenic impacts could disrupt local marine ecosystems due to municipal and industrial waste discharge, pollution, flood control measures, and global warming. Santa Monica Basin (SMB), due to its unique setting in a low-oxygen and high-sedimentation environment, can provide an excellent sedimentary paleorecord of these anthropogenic changes. This study examined 10 sediment cores, collected from different parts of the SMB between spring and summer 2016, and compared them to existing cores in order to document changes in sedimentary dynamics during the last 250 years, with an emphasis on the last 40 years.
The 210Pb-based mass accumulation rates (MARs) for the deepest and lowest oxygen-containing parts of the SMB basin (900–910 m) have been remarkably consistent during the past century, averaging 17.1±0.6 mg cm−2 yr−1. At slightly shallower sites (870–900 m), accumulation rates showed more variation but yield the same accumulation rate, 17.9±1.9 mg cm−2 yr−1. Excess 210Pb sedimentation rates were consistent with rates established using bomb test 137Cs profiles. We also examined 14C profiles from two cores collected in the deepest part of the SMB, where fine laminations are present up to about 450 yr BP. These data indicate that the MAR was slower prior to ∼1900 CE (rates obtained were 9 and 12 mg cm−2 yr−1). The δ13Corg profiles show a relatively constant value where laminations are present, suggesting that the change in sediment accumulation rate is not accompanied by a change in organic carbon sources to the basin. The increase in sedimentation rate towards the Recent occurs at about the time previous studies predicted an increase in siltation and the demise of a shelly shelf benthic fauna on the SMB shelf.
X-radiographs show finely laminated sediments in the deepest part of the basin only, with centimeter-scale layering of sediments or no layering whatsoever in shallower parts of the SMB basin. The absence of finely laminated sediments in cores MUC 10 (893 m) and MUC 3 (777 m) suggests that the rate at which anoxia is spreading has not increased appreciably since cores were last analyzed in the 1980s. Based on core top data collected during the past half century, sedimentary dynamics within SMB have changed minimally during the last 40 years. Specifically, mass accumulation rates, laminated sediment fabric, extent of bioturbation and % Corg have not changed. The only parameter that appeared to have changed in the last 450 years was the MAR, with an apparent > 50 % increase occurring between ∼1850 CE and the early 1900s. The post-1900 CE constancy of sedimentation through a period of massive urbanization in Los Angeles is surprising.
- Article
(9891 KB) - Full-text XML
-
Supplement
(461 KB) - BibTeX
- EndNote


The use of laminated sediments as a record of environmental change has many historical precedents (Koivisto and Saarnisto, 1978; Gorsline, 1992; Algeo et al., 1994). The deepest portion of Santa Monica Basin (SMB, Fig. 1) has been accumulating finely laminated sediments for approximately the past 400 years (Christensen et al., 1994). The presence of fine lamination is evidence that macrofaunal activity on or in the sediment has been minimal to absent. Savrda et al. (1984) documented the transition from laminated to bioturbated sediments as corresponding to a change in oxygen concentration in the bottom water, which is the chief control of benthic macrofauna presence (Levin, 2003). However, two things are necessary to produce laminated sediments. First is the absence of disturbance or mixing, and the other is a pulsed delivery of sediment that produces a distinction in composition or sediment fabric (Kemp, 1996).
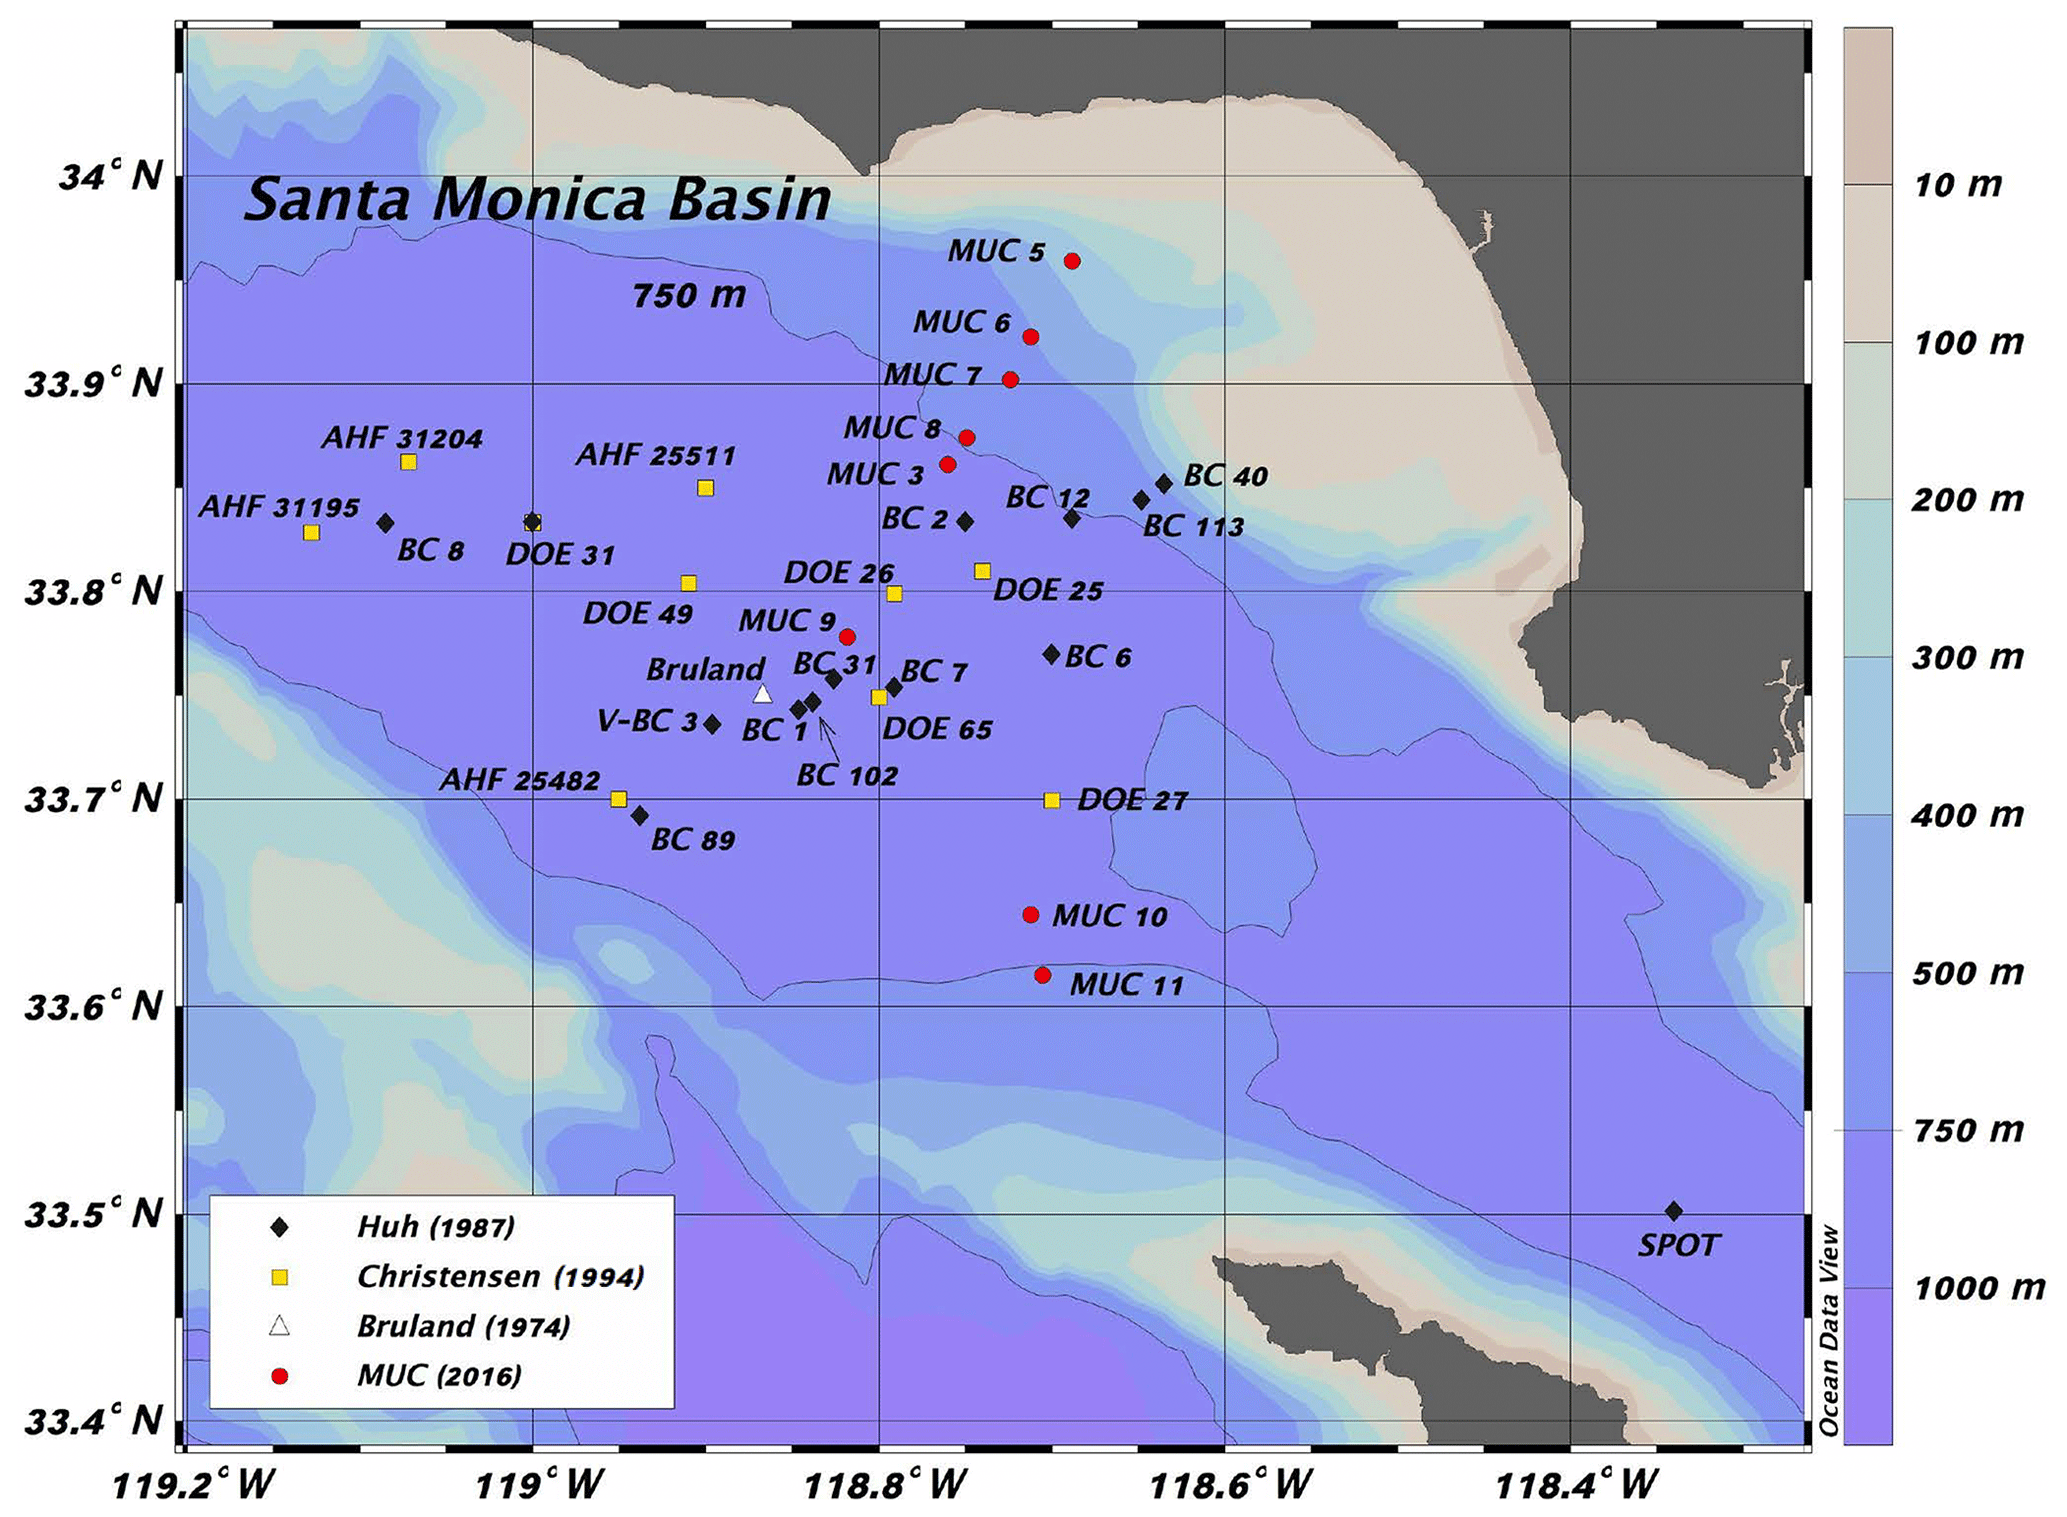
Figure 1Core locations and IDs as documented by the authors cited in the legend. MUC represents multicores analyzed by our group.
Sediment trap studies at a long-term study site (SPOT, Fig. 1) in the adjacent San Pedro Basin demonstrated a seasonal pattern of sedimentation with highest rates in late winter and spring (Collins et al., 2011). Similarly, Haskell et al. (2015) documented seasonality in upwelling velocity and biogenic particle export from the upper ocean at SPOT. In contrast to the annual forcing of sedimentation in local waters, sediments in the SMB show primarily non-annual laminations with a frequency of 3–7 a year. This lamination cycle may be consistent with the frequency of heavy rainfall in Southern California during El Niño years (Quinn et al., 1978; Christensen et al., 1994)
The present study considers changes in SMB sedimentation over the past 150 years, a time period when changes in ocean biogeochemistry have been observed both globally and regionally. For example, the large-scale changes in the size and intensity of global oxygen minimum zones (Stramma et al., 2010; Breitburg et al., 2018) have also been documented for Southern California waters (Bograd et al., 2008). Oxygen concentrations in near-surface waters of the Southern Californian shelf show a 20- to 50-year decline beginning in the early 1960s, which was attributed to increased stratification and/or increased productivity caused by enhanced nutrient supply (Booth et al., 2014). In concert with changes in upper-ocean oxygen content, research by Huh et al. (1989) and Christensen et al. (1994) has documented expansion of the area of laminated sediments in SMB over the past 400 years. Their work with X-radiography showed that homogenized sediment was covered by laminated sediment, marking a transition from bioturbation to lamination preservation.
Age dating of this transition, as deduced by applying a 210Pb-derived sedimentation rate, revealed concentric zones covering the entire basin floor, which accumulated laminated sediments from 400 (basin center) to 50 (shallower depths) years before present (yr BP). This expansion in lamination is taken as evidence of expanding oxygen deficiency and is particularly interesting given the global and local changes mentioned above. Over the past 400 years of laminae accumulation in SMB, the Southern California region has grown into one the world's largest urban areas. Particularly notable was a change in ecosystem structure of benthic shelf fauna during the mid-to-late 1800s, which was attributed to an onset of higher coastal sediment delivery caused by grazing cattle (Tomašových and Kidwell, 2017). This new land use was proposed in order to increase the frequency and amount of sediment entering the coastal zone. Another notable anthropogenic impact was the introduction of sewage waste into the coastal system starting in the early 1900s (Alexander and Venherm, 2003). Advanced treatment of this sewage did not start until the 1970s. Furthermore, channelization of the LA River and construction of sediment-trapping flood basins up-river have occurred over the past century (see the Supplement for LA land usage timeline). Thus, there is ample evidence of environmental change in and around the SMB over the past 150 years.
Starting with a study by Bruland et al. (1974), investigators have been using 210Pb profiles of sediments as a means of documenting sediment accumulation and sediment mixing in the SMB. A compilation of core analyses was published by Huh et al. (1989), and further work by Alexander and Lee (2009) provided a record of sedimentation in the SMB from the 1970s through to the 1990s. Our work here (conducted in 2016) aimed at augmenting this record of coastal sedimentation, quantified by analyses of 210Pb and 14C profiles. We sampled intact surface sediments (top ∼30 cm) and also conducted analyses of (1) sediment fabric by X-radiography, (2) sediment macrofaunal composition and (3) Corg content to study changes in sedimentation in the SMB over the past 150 years. Our study provides new information about sedimentation and the potential expansion or contraction of laminated sediments over the past 150 years, with a focus on the past 40 years.
2.1 Study area
The San Pedro and Santa Monica basins are “bathtub-shaped” basins, oriented northwest to southeast adjacent to the Los Angeles coastline. They are both approximately 900 m deep, separated by a sill. Water entering San Pedro Basin (SPB) from the southeast crosses the sill at ∼740 m and then passes into the SMB (Hickey, 1991). Bottom water circulation below the sill depth is sluggish, < 1.0 cm s−1 and generally moves in a counterclockwise direction. To the northeast of SMB is a slope and the broad Santa Monica shelf, which is incised by Redondo Canyon, in the southeastern portion of the basin, and Santa Monica Canyon, which empties in the middle of SMB; the Malibu and Pt. Dume canyons drain into the northeastern portion of the basin. Sedimentation is characterized as hemipelagic, interrupted by sandy turbidites that primarily originate from the northeastern canyons and spread onto the basin floor (Gorsline, 1992).
The upper-ocean waters (above 300 m) are a mixture of at least two distinctive water masses (Fig. 2), whereas the waters below sill depth have a temperature–salinity (TS) signature suggestive of mixing with a water mass that originates somewhere in the northwestern Pacific (Lynn and Simpson, 1987). All waters below 400 m are low in oxygen (< 20 µM), although the deepest water sometimes has slightly higher concentrations compared to those immediately above (Fig. 2). This phenomenon is rare and identifies a basin “flushing” event (Berelson, 1991). Generally, water enters SMB, and the sluggish circulation and slow rates of replenishment (deep water residence times on the order of 1–3 years; Hammond et al., 1990) tend to deplete oxygen further. Hence, oxygen concentrations range between 1 and 9 µM (Berelson, 1985). Complete bottom water depletion of oxygen and/or the presence of sulfide in bottom waters has never been reported. The sediments of SMB have 15 wt %–20 wt % CaCO3, 2 wt %–6 wt % Corg and 2 wt %–8 wt % SiO2 (Cheng et al., 2008).

2.2 Water column and sediment sampling
Temperature, salinity and dissolved O2 concentrations were profiled in the water column of the SMB (0–907 m water depth) from aboard the RV Yellowfin (Southern California Marine Institute) in April 2016, using a conductivity, temperature, and depth (CTD; Sea-Bird 25) sensor with an attached SBE43 oxygen sensor (calibrated by Winkler titration). For CTD calibration, automated bath systems, sensor stability, primary standards in temperature (water triple point and gallium melting point) and conductivity (International Association for the Physical Sciences of the Oceans, IAPSO) were maintained.
A total of 10 sediment cores were collected in April and July 2016 from eight stations (MUC 3, MUC 5–11) between 319 and 907 m water depth using a miniature multicorer (MUC, K.U.M. Kiel) equipped with four polycarbonate core liners (length: 60 cm; inner diameter: 9.5 cm).
After cores were retrieved, one core was sectioned on board the ship in 1 cm intervals through the upper 10 cm and 2 cm intervals below 10 cm. Aliquots were sealed in porosity vials, and the remaining mud was placed in plastic bags. A second core from the same multicore deployment was preserved intact for X-radiography.
2.3 Porosity and integrated mass
Wet mud from the sectioned core was placed in pre-weighed porosity vials (15 mL snap-cap glass vials), reweighed and dried at 50 ∘C for 48–96 h. Vials were subsequently reweighed to determine water loss. The dry weight was corrected for salt content, assuming a salinity of 35. Porosity was determined assuming a grain density of 2.5 g cm−3. Integrated mass to the midpoint of each sample interval was calculated from the porosity profile and this density, summing to numerically integrate Eq. (1):
where dx is the interval thickness, ρ is solid-phase density, I is integrated mass and ∅ is porosity.
2.4 Macrofauna
Sediment from one of the cores collected from each site was used for faunal surveys. The first 5 cm of each core was sectioned into 1 cm intervals for the purposes of capturing faunal variability near the sediment–water interface. The remaining length of the core was sectioned into 2 cm intervals. The sediments from each interval were then washed with deionized (DI) water through a 2 mm sieve, and the residue was then collected. Macrofauna and meiofauna in each section were identified with the aid of optical light microscopy and were preserved in an ethanol–glycol mixture (80 % ethanol).
2.5 Organic carbon content
Dried porosity samples were ground by mortar and pestle and this homogenized sediment was used for Corg, 210Pb and 137Cs analyses. A portion of the ground sediment was weighed (10–150 mg) and was placed into a 10 mL exetainer tube and acidified with 10 % phosphoric acid. The evolved gas was analyzed for CO2 using a Picarro cavity ring-down spectroscopy (CRDS), following procedures developed at the University of Southern California (USC) (Subhas et al., 2015, 2017). This provided a measure of acid-reactive C, assumed to equal C bound as CaCO3. Another split of powder was weighed into tin capsules and combusted at 800 ∘C on a Costech CN (carbon and nitrogen) analyzer to measure total carbon, with the CO2 and δ13C concentration also determined via the Picarro. USGS standards were used to calibrate wt % Total C in samples. The difference between total C and CaCO3 carbon was taken as the % Corg. Replicates indicate analytical uncertainties in this measurement of ±0.2 wt % Corg on samples that have 2 wt %–6 wt % Corg.
2.6 Photographs and X-radiographs
Replicate cores from each multicorer sampling were photographed at University of California Los Angeles (UCLA). Cores were returned to USC and stored for 2 months to air-dry, which allowed the sediment to lose water and consolidate. A router was used to remove a section of plastic core liner on opposite sides of the core tube. The core was split into two halves with smooth cut faces from top to bottom using a wire. One split core was transferred to a plastic tray with an approximately 2 cm lip along the long edges. The wire was run along the top of the lip, yielding a uniform 2 cm thick slab of sample. Each slab was placed on a large sheet of Kodak film and X-rayed for 90–180 s at 8 mA and 96 V. Negatives were developed in a dark room.
2.7 Excess 210Pb and 137Cs
Approximately 0.5–1.0 g of dried, homogenized sediment was placed in 5 mL polypropylene test tubes for analysis by gamma spectroscopy. Excess 210Pb and 137Cs activities in sediments were measured using high-purity intrinsic germanium well-type detectors (HPGe ORTEC, 120 cm3 active volume). Detector efficiencies were determined by counting the activities of known standards in the same geometry as the samples. Standards used included IAEA-385 marine sediments, EPA diluted pitchblende SRM-DP2 and NIST 210Pb liquid solution. Samples were counted for 2–4 d, and the spectra (keV) were analyzed for the following radioisotopes: 210Pb (46), 214Pb (295), 214Pb (352), 214Bi (609) and 137Cs (661). The 226Ra activity (termed the supported 210Pb) was measured by counting the activity of the short-lived 222Rn daughters (214Pb and 214Bi). A small 10 % correction was applied to each sample to account for radon leakage, based on measurements of radon loss from similar sediments (Hammond, unpublished data). Excess 210Pb was determined by subtracting the supported 210Pb (226Ra, Fig. S2 in the Supplement) from total 210Pb activity and correcting for decay between collection and analysis (see the Supplement for 210Pb calibration).
2.8 Radiocarbon
Radiocarbon values were measured using the accelerator mass spectrometry (AMS) at the University of California Irvine (UCI) Keck Carbon Cycle Accelerator Mass Spectrometry (KCCAMS) laboratory. Samples were subjected to HCl vapor for 4 h to acidify calcium carbonate, dried on a vacuum line, combusted, graphitized and then counted on the AMS. Sample preparation backgrounds were subtracted based on measurements of acidified glycine, ANU and lycine. Radiocarbon results have been corrected for isotopic fractionation according to the conventions of Stuiver and Polach (1977), with δ13Corg measured using a Costech ECS 4010 Analyzer – Delta V Plus IRMS at the University of California, Riverside (UCR). The isotopic ratio is given in delta notation relative to Vienna Pee Dee Belemnite (VPDB) for δ13C values. Glycene, peach, acetate and house soil were used as reference material; the standard error (1σ) was < 0.10 ‰.
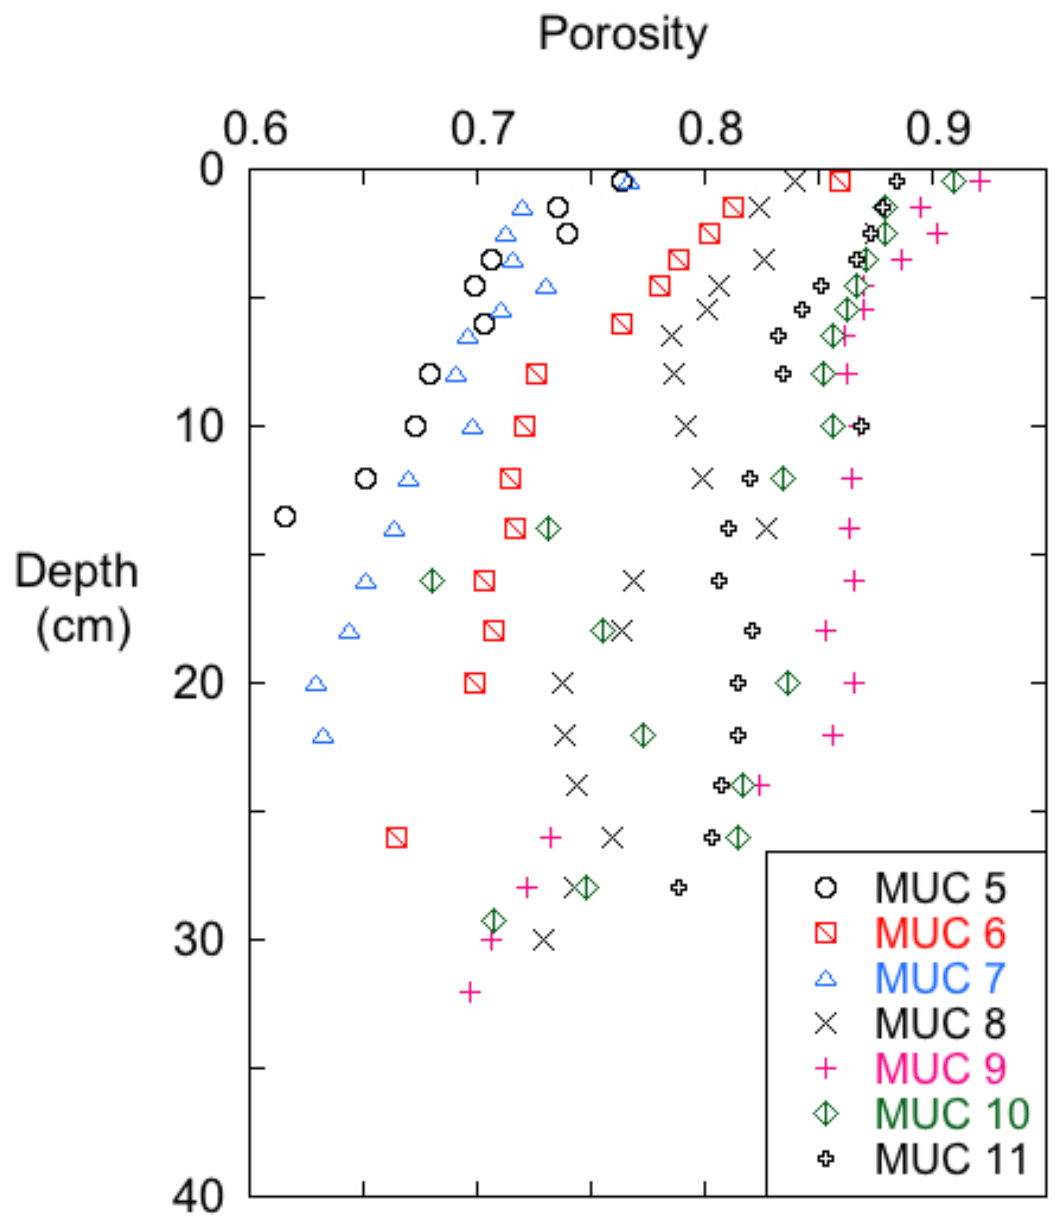
Sediment porosity declined with depth, with generally higher values in cores collected at deeper stations (Fig. 3). At all sites, there was typically a porosity difference of ∼0.2 between the sediment–water interface (SWI) and 30 cm depth horizon. However, several cores showed notable interruptions in the monotonic decline in porosity with depth. Cores MUC 9 and MUC 10 had intervals with lower porosities compared to the overall depth trend. Low-porosity anomalies were observed below 25 cm in MUC 9 and at 13–15, ∼22 and ∼28 cm in MUC 10.
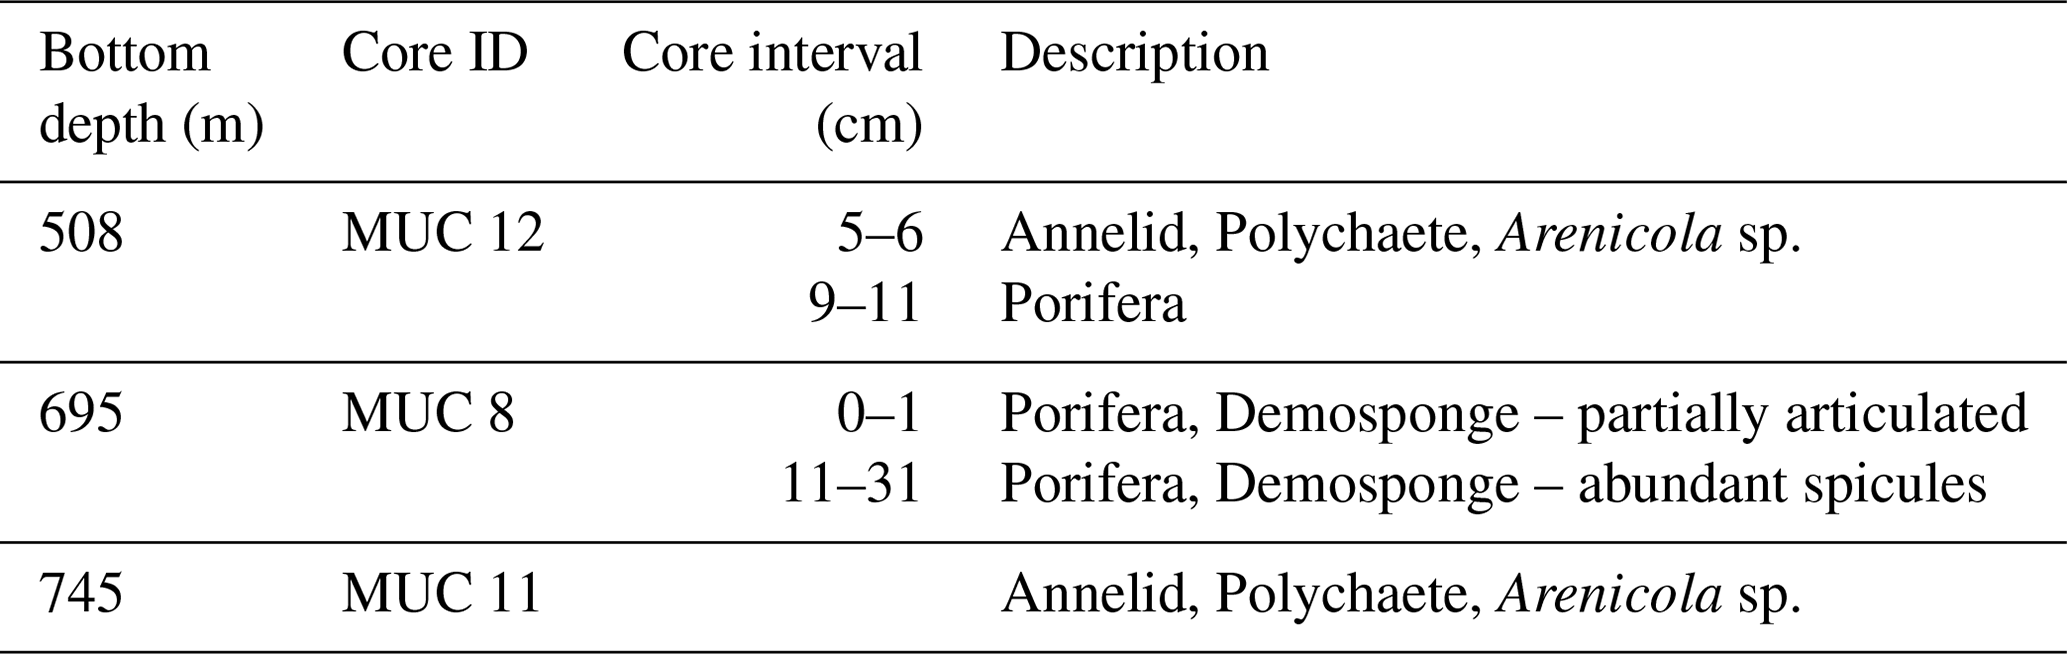
Only three cores (of those collected at depths > 320 m) had macrofauna obtained from sediment sectioning and sieving (Table 1). Notable was the abundance of sponge spicule clusters found throughout much of core MUC 8. An intact annelid worm was found on the surface of MUC 11 (745 m), which had oxygen concentrations < 8 µM near the seafloor.
Weight percent Corg content of the upper cm of the cores collected in 2016 showed a distinct trend of increasing % Corg with water depth (Fig. 4). Basin sediments (MUC 9 and MUC 10) had 5 wt %–6 wt % Corg, whereas slope sediments ranged from 2 wt % to 5 wt %. Cores collected in the 1970s and 1980s show the same trend for core top % Corg vs. water depth as the MUC cores (Gorsline, 1992; Fig. 4).
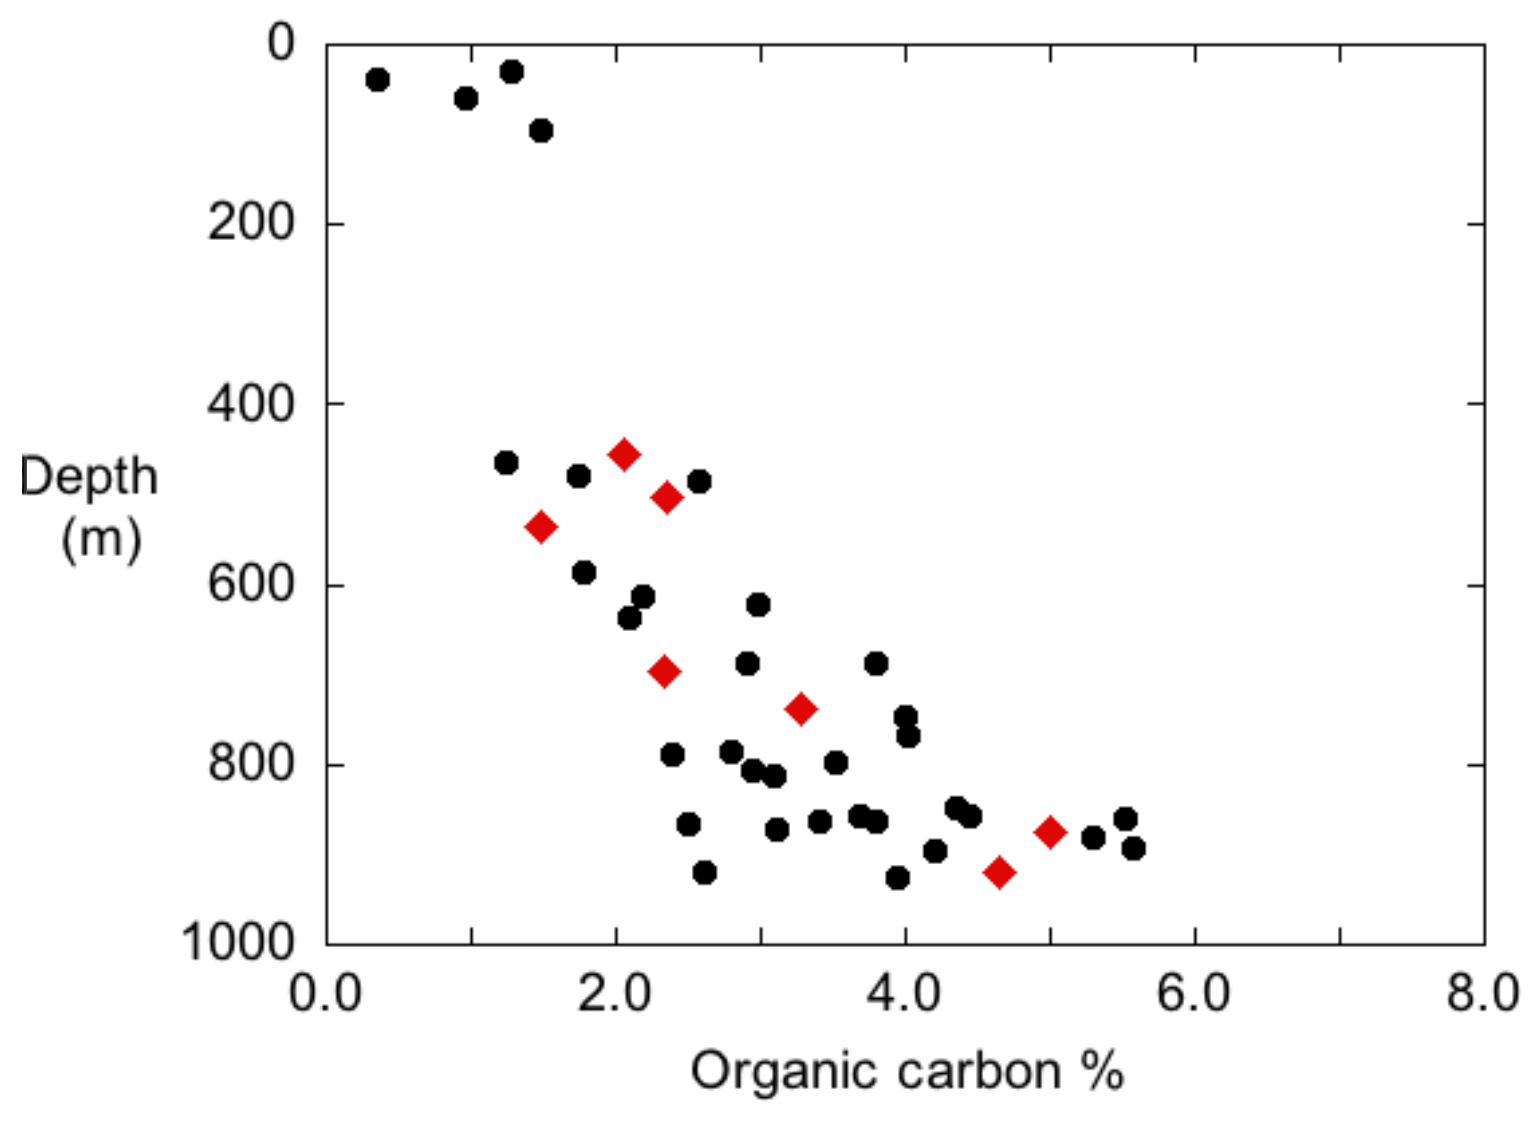
Figure 4The % Corg content for the 0–1 cm intervals from MUC cores (red diamonds) and data from Gorsline (unpublished box core results). Box core data also represent the upper (0–2 cm) sediment Corg fraction.
Photographs of MUC cores showed light reddish-brown colored sediment near the surface of each core and a progression in MUC 9 and MUC 10 toward darker colored sediment with depth (Fig. 5). Only MUC 9 (907 m) had laminations visible by eye. The sediment in the upper 10 cm from other cores (MUC 10, MUC 3 and MUC 11) appeared homogeneous. MUC 11 showed a living polychaete worm present at the sediment–water interface.

X-radiographs of MUC 9 and MUC 10 revealed distinct laminations (Fig. 6). MUC 9 showed clear sediment laminations down to approx. 15 cm. However, MUC 10, collected from a site that was only 14 m more shallow, did not show fine lamination, but broader banding was apparent down to 12 cm. Both cores showed zones of higher-density material (light-colored in X-radiograph negative). A distinct higher-density zone is seen in MUC 9 below 25 cm. Three zones of dense material were detected in the MUC 10 X-radiograph: the first was between 12–17 cm, the second at ∼22 cm and the third below 28 cm. These zones of higher-density material correspond with the zones of anomalously low porosity (Fig. 3).
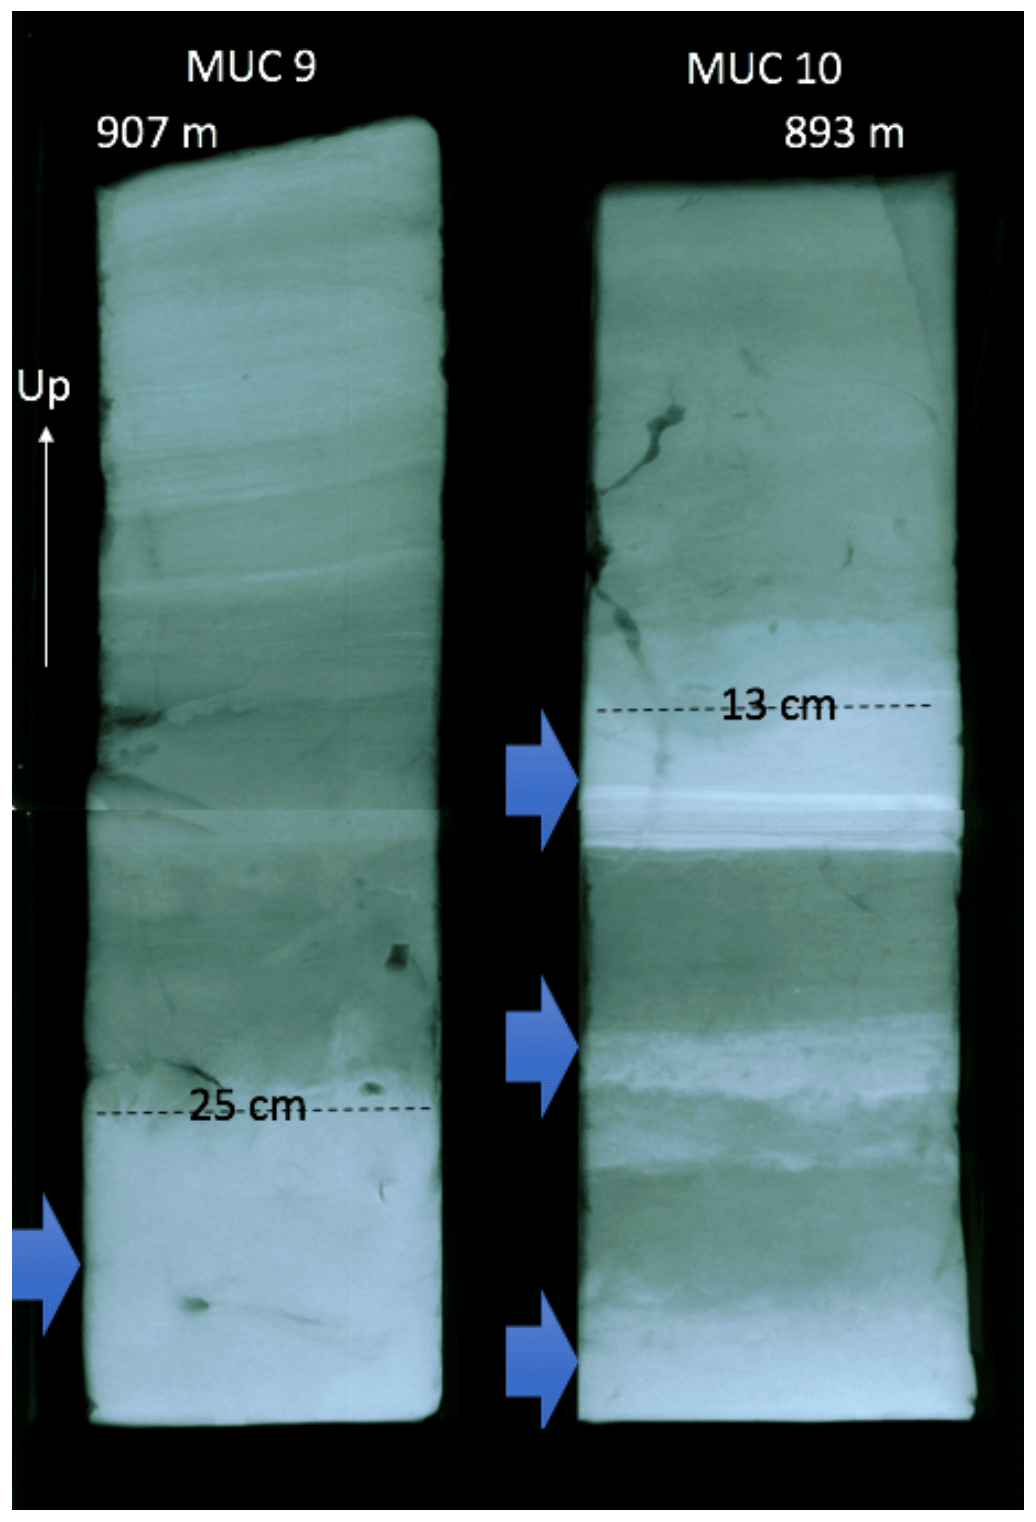
Figure 6X-radiographs of cores MUC 9 and MUC 10. The arrows designate the location of turbidites, which show up under X-rays as more lightly colored (denser). Note the fine laminations visible in the upper portion MUC 9.
3.1 Excess 210Pb and 137Cs
Values of excess 210Pb in surface sediments varied from 25 dpm g−1 at the shallow-water sites to 100 dpm g−1 in deeper waters near the mid-basin (Fig. 7). Many of the cores from the shallower sites (< 800 m) showed a constant activity of excess 210Pb in the top 1–3 cm, below which activity decreased exponentially. MUC 8 deviated from this trend and showed an increase in excess 210Pb at 9 cm. MUC 9 and MUC 10, which are the two cores in the central basin collected from water depths greater than 850 m, showed high values of excess 210Pb near the surface and an exponential decrease below the sediment–water interface. Excess 210Pb in these two cores was restricted to the top 8 cm, whereas excess 210Pb penetrated deeper into the sediment of cores from the basin slope (MUCs 5, 6, 7, 8 and 3).
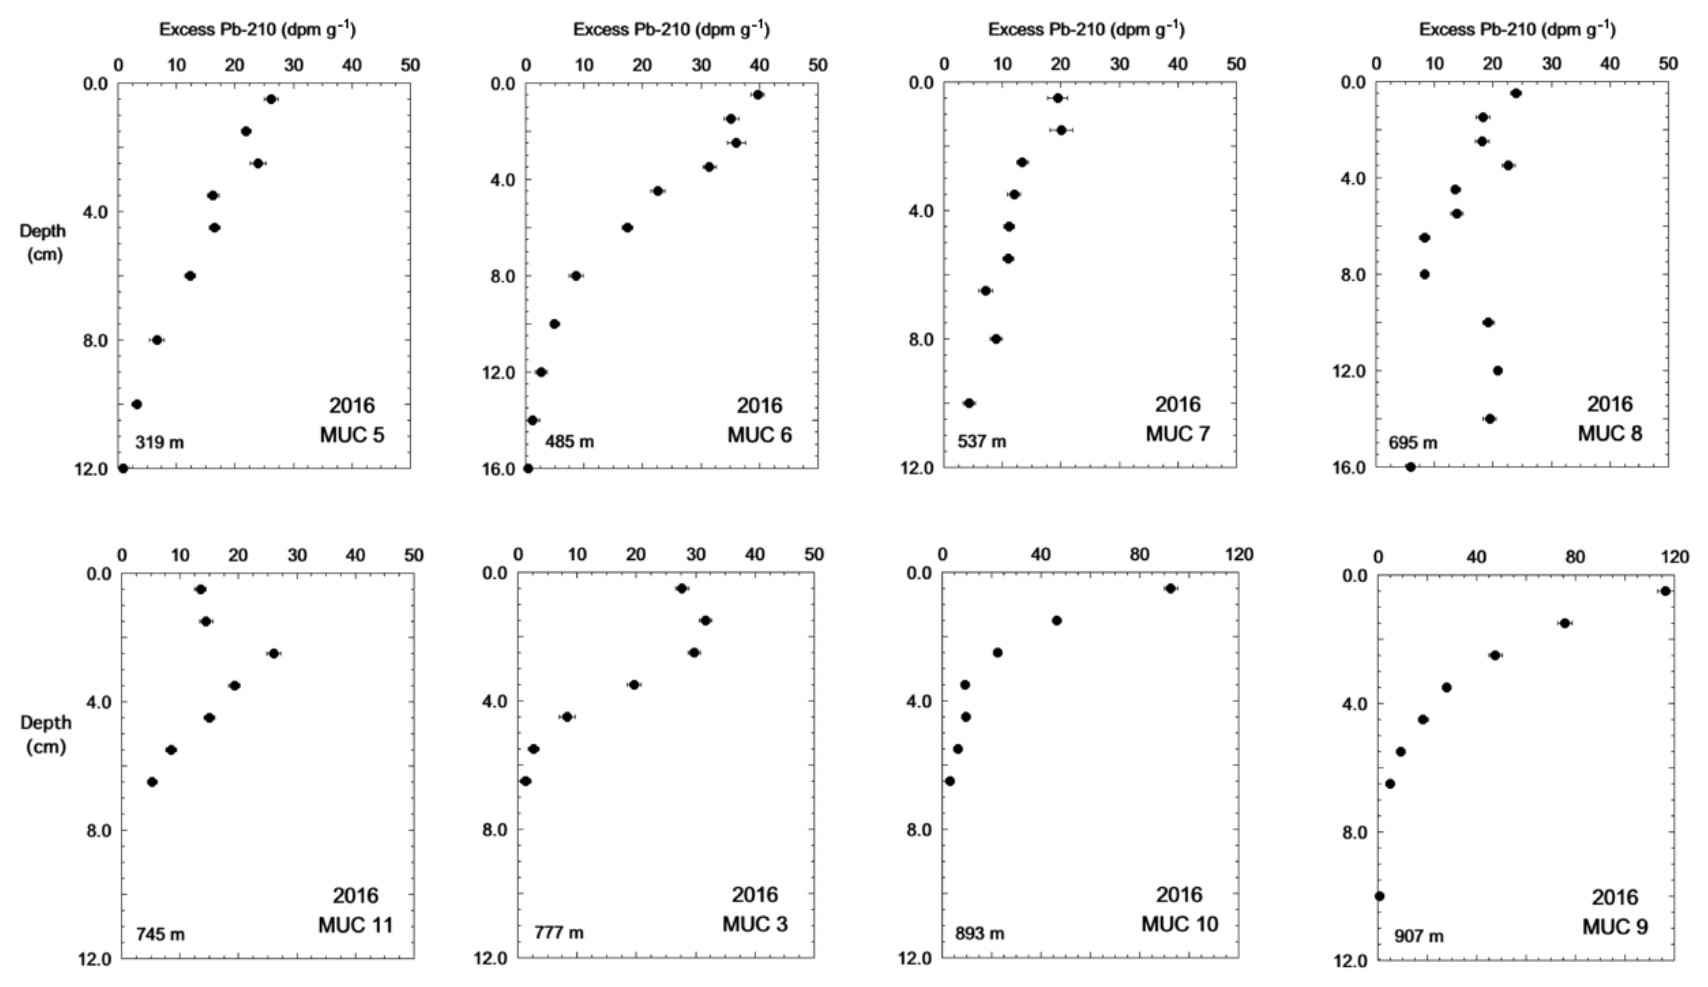
Figure 7Eight multicores sampled for 210Pb in the Santa Monica Basin. The points are plotted in the middle of the depth interval (given in Table 2). Note that the depth and activity scales are different for different cores.
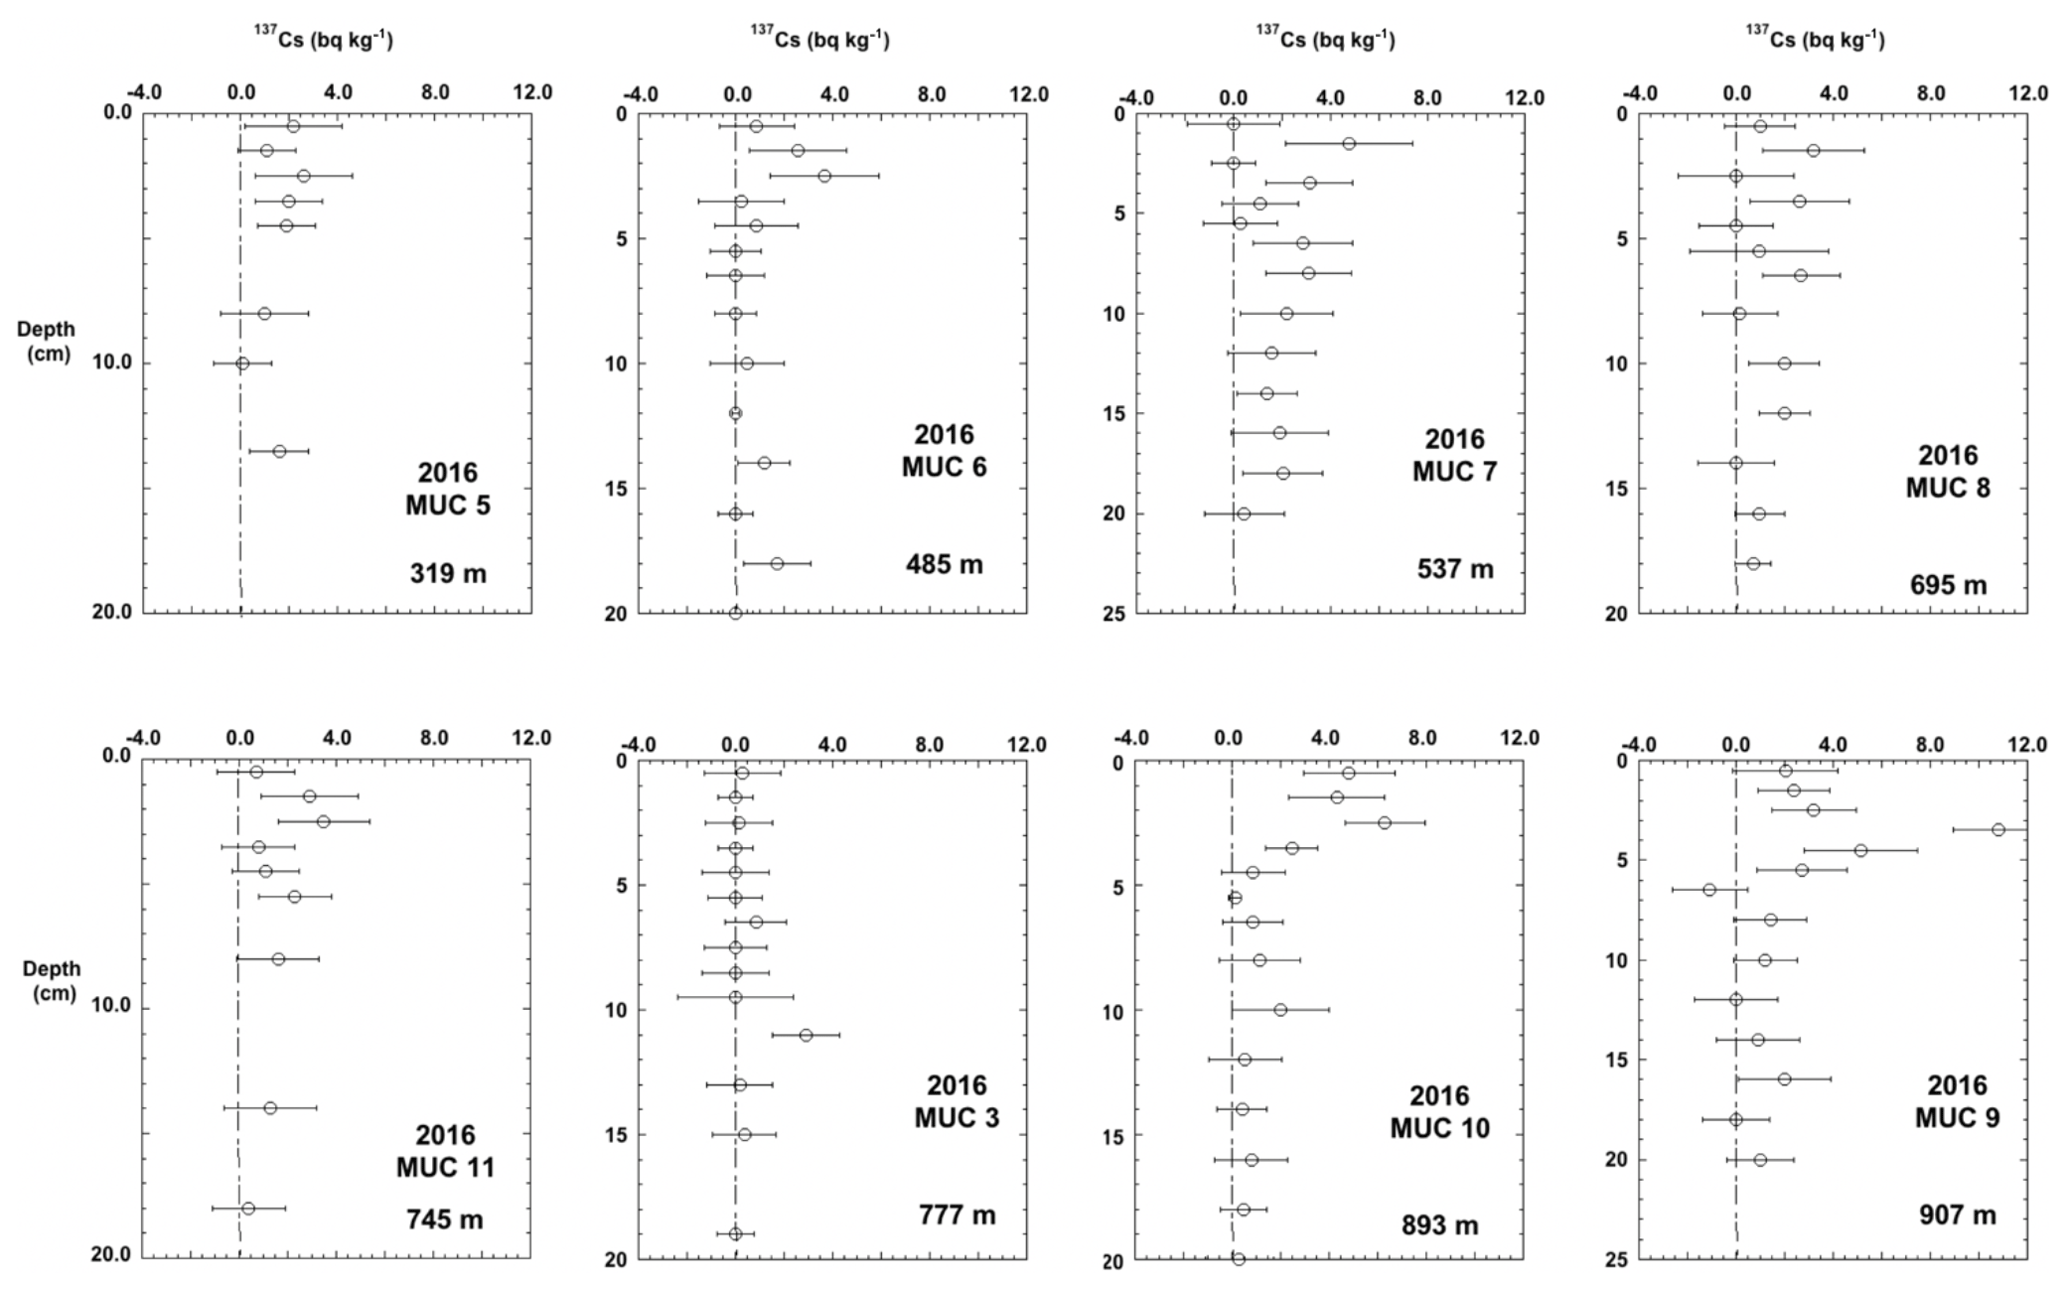
Figure 8Eight multicores sampled for 137Cs in the Santa Monica Basin. MUC 9 and MUC 10 were the only cores with a clear 137Cs peak.
137Cs profiles of MUC 9 and MUC 10 showed peaks between 4.5 and 2.5 cm depth, respectively (Fig. 8), whereas 137Cs profiles of cores taken along the slope showed very low values with large uncertainties.
3.2 Radiocarbon and δ13Corg
The organic carbon from selected intervals from MUC 9 and MUC 10 was measured for radiocarbon content and δ13Corg to depths of 25 cm (Figs. 9, 10). The Δ14C (BP)* and δ13Corg values were plotted vs. integrated mass to provide a normalization for the down-core porosity changes that occur down-core. The Δ14C (BP)* indicates a conventional radiocarbon age that was determined using the method of Stuiver and Polach (1977). A reservoir age adjustment was not applied to the Δ14C (BP)* values. Between the depths equivalent to 2 to 6 mass units (g cm−2), there is a linear relation between age and integrated mass (Fig. 9), consistent with an assumption that reservoir age and mass accumulation rate at these sites remained constant through this interval. In both cores, these intervals were fit with a regression to determine mass accumulation rate for the studied time period (depth ranges of 7–16 cm in MUC 9 and 7–14 cm in MUC 10). Calculations of radiocarbon sedimentation rates for MUC 9 and 10 yield values of 9.0 and 12.0 mg cm−2 yr−1, respectively, spanning an interval of about 400 years between 2 and 6 mass units. This calculation excluded samples in the upper 2 integrated mass units due to apparent bomb 14C contamination, as both cores show a much younger value of Δ14C in the upper 1 cm of sediments relative to the profile below this depth. Below the zone that was fitted, Δ14C (BP)* values for MUC 10 were quite erratic, due to several turbidites that were noted in this core. Turbidite influence is also evident in the δ13Corg profiles (Fig. 10), introducing carbon that is isotopically lighter than the material immediately above and below. All 14C values below 6 integrated mass units were deemed to have turbidite influence. and were also excluded from the fit.
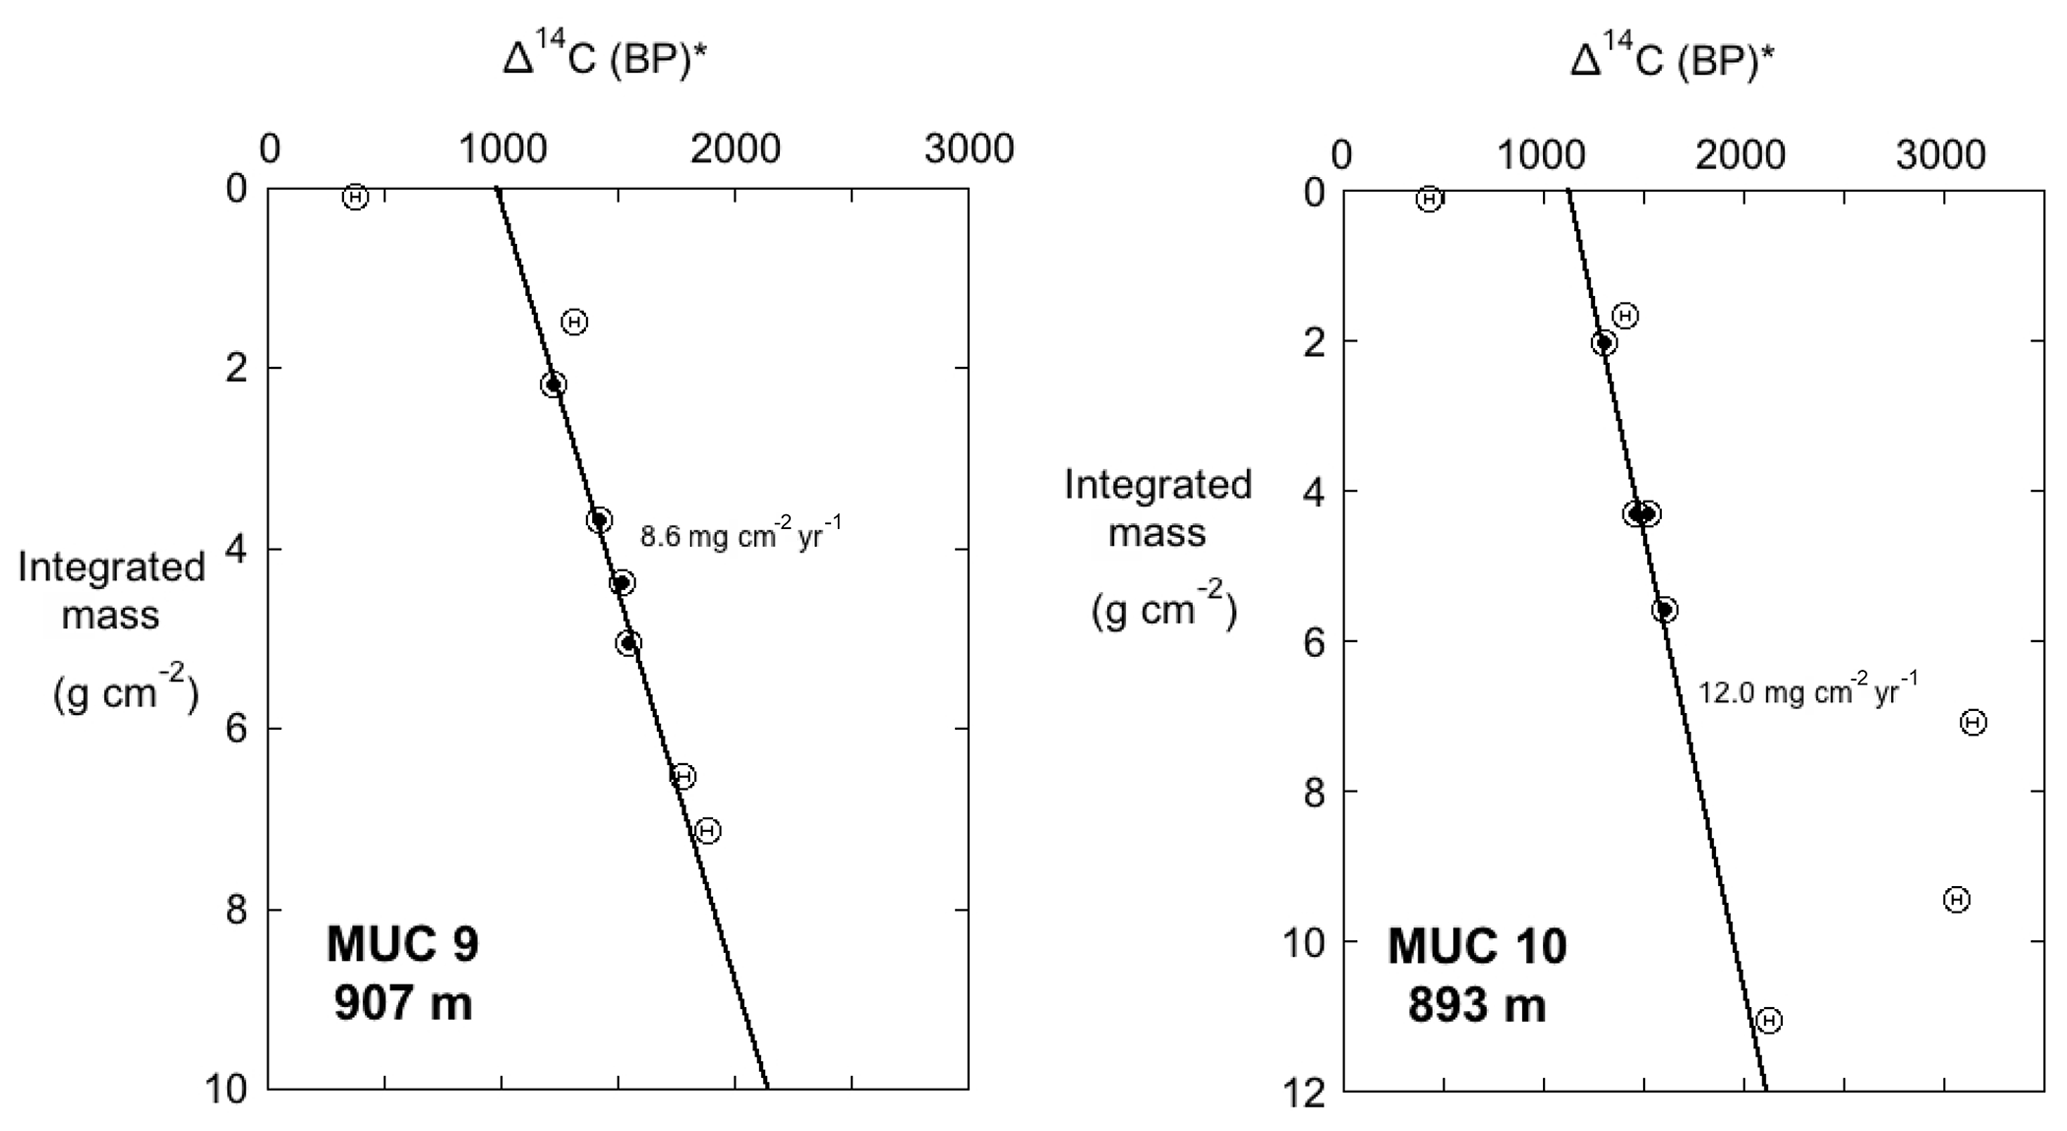
Figure 9Δ14C (BP)* vs. integrated mass (g cm−2) for SMB cores MUC 9 and MUC 10. The Δ14C (BP)* value denotes conventional radiocarbon age without assigning a reservoir age. If reservoir age and mass accumulation rate are unchanging, the plots should be linear. A linear fit was applied to the solid circles (between 2 and 6 mass units; 5–18 cm depth range). Data from above 2 mass units and below 6 mass units were excluded from the fits, as they appear to be influenced by “bomb” carbon or turbidites (see Fig. 10). The regression slope defines mass accumulation (in mg cm−2 yr−1). The depth equivalent to 2 g cm−2 represents an age of approximately 120 yr BP (approximately 1900 CE).
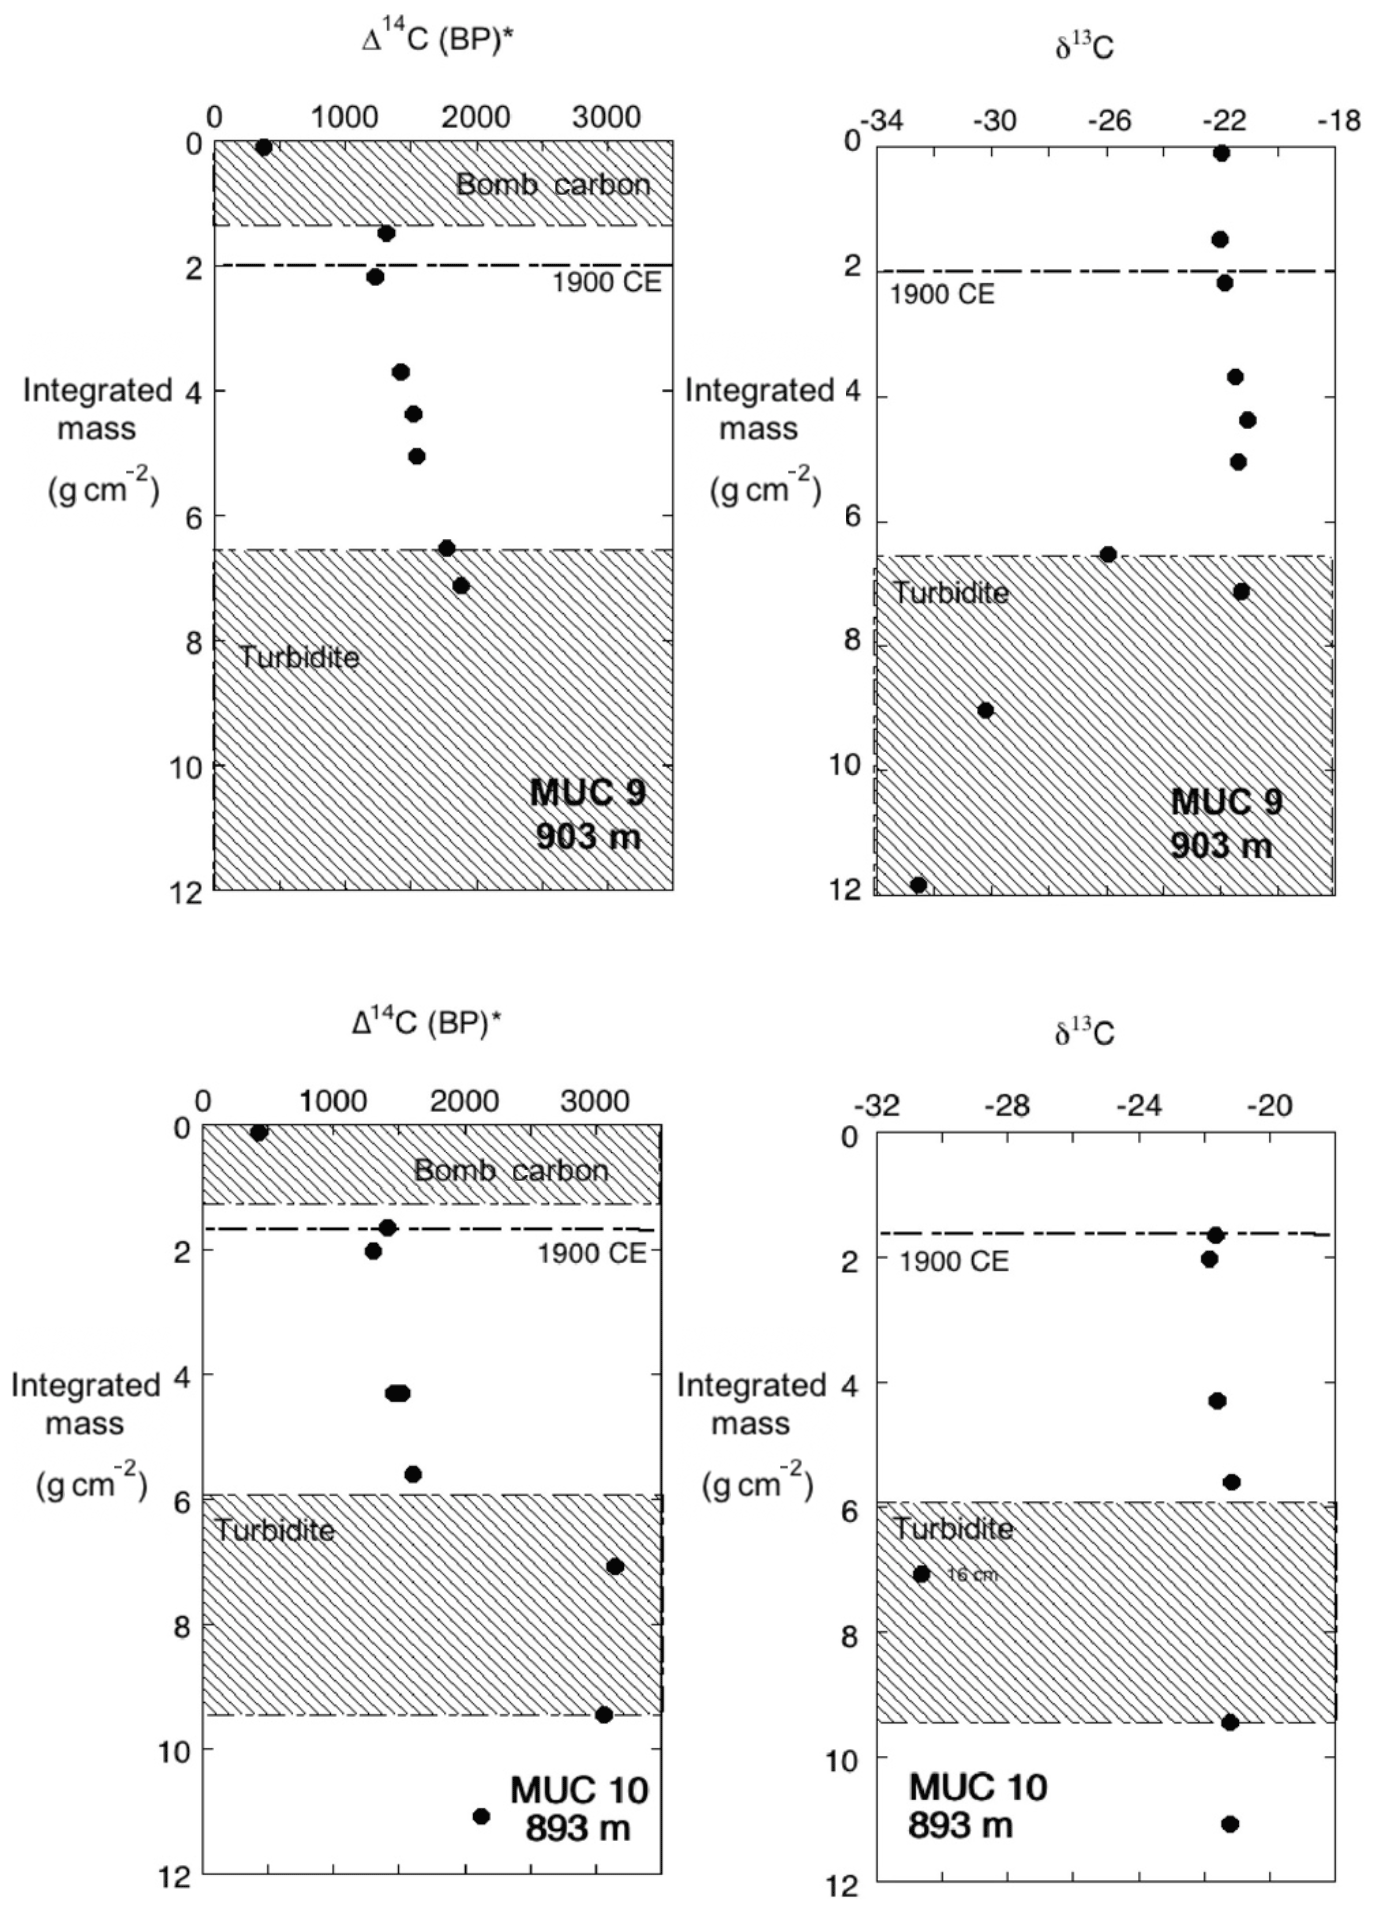
Figure 10Δ14C (BP)* vs. integrated mass (g cm−2), as in Fig. 9, including designation of turbidite and bomb carbon regions (hachured) and corresponding δ13C data. Dashed line at ∼2 cm−2 represents sediments deposited around 1900 CE.
4.1 Excess 210Pb as a measure of sedimentation rate
210Pb has proven to be a useful tracer for sediment accumulation rates in the Santa Monica Basin (Bruland et al., 1974; Huh et al., 1989; Christensen et al., 1994) and similar environments (Souza et al., 2012) during the last 100 years. Past studies derived mass accumulation rates (MARs) using 210Pb by assuming a constant sedimentary flux of 210Pb over the timescale concerned (∼100 years), negligible bioturbation and strong absorption of 210Pb to particles (constant initial concentration method; Benninger and Krishnaswami, 1981; Robbins and Edington, 1975; Robbins, 1978; Appleby, 2001; Oldfield and Appleby, 1984). These assumptions should be valid in the deepest parts of the SMB where sediments are minimally disturbed by bioturbation, as shown by the laminations.
Table 2Station ID, year collected, mass flux, depth, inventory and excess 210Pb at the sediment–water interface (SWI) for all cores greater than 800 m depth in the Santa Monica Basin. The first 13 cores are from deeper than 900 m, and the last 8 cores are from 800 to 900 m water depth. The 210Pb inventory was also computed, but values are not discussed in this article (references: (1) this work; (2) Christensen et al., 1991; (3) Huh et al., 1989; (4) Bruland, 1974.
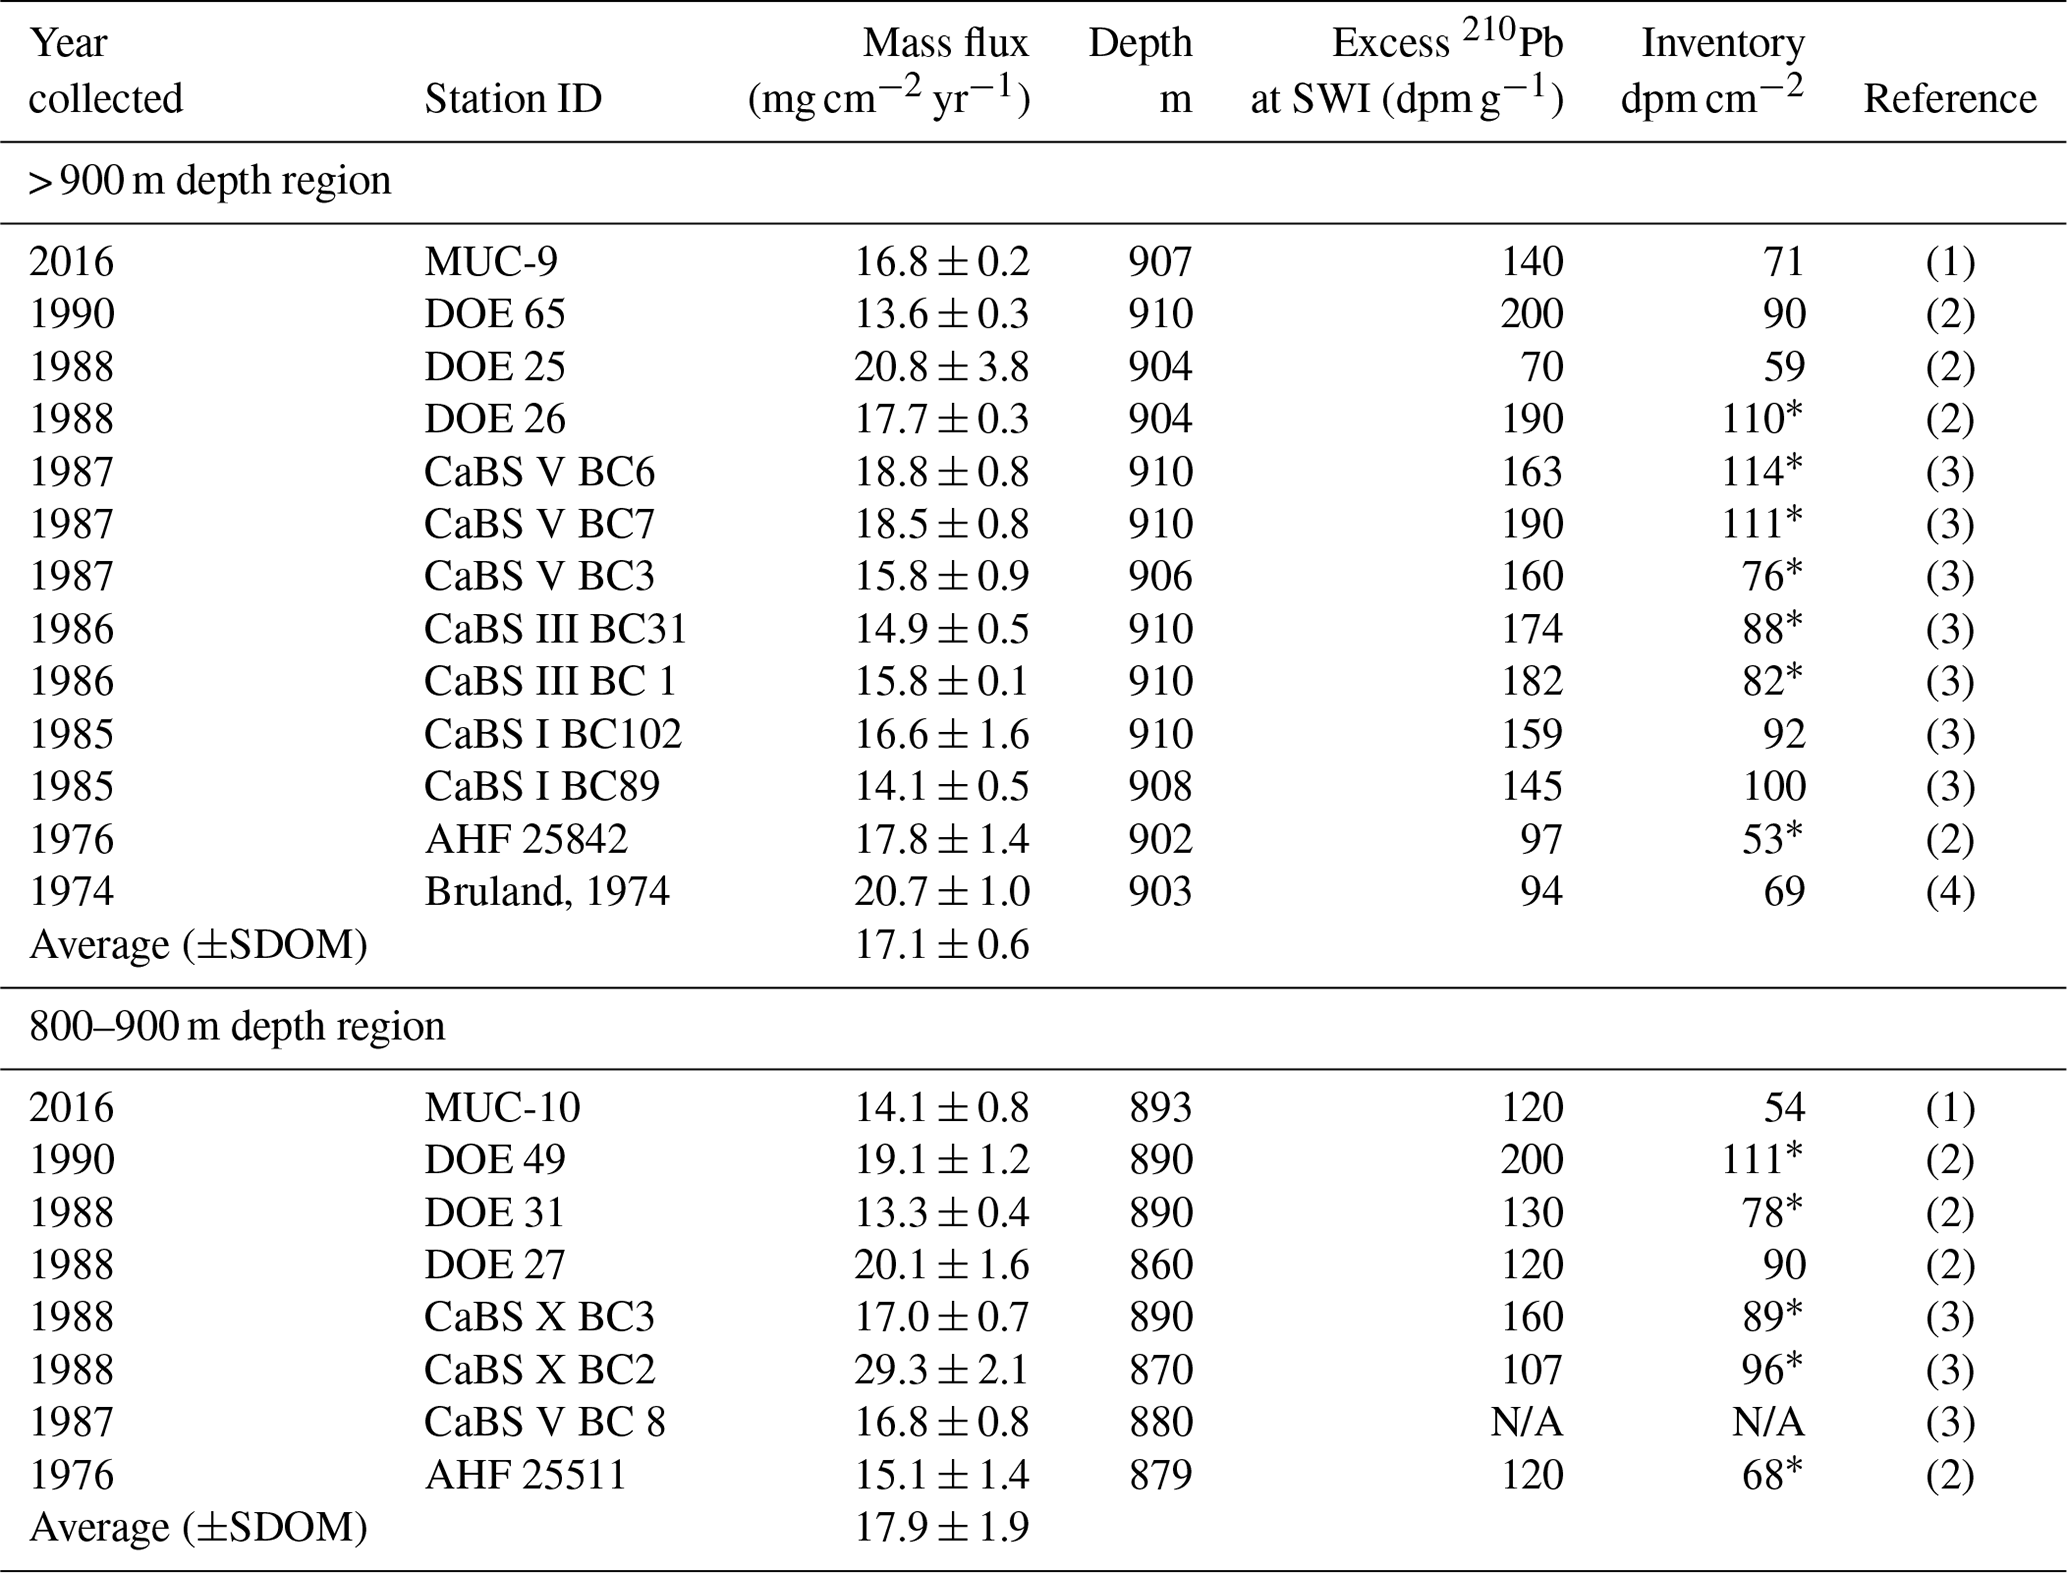
* A graphical integration was used, others are from fitting parameters.
Table 2 shows a compendium of mass accumulation rates for the central portion of SMB, obtained from cores collected during a 42-year interval from 1974 to 2016. MAR values were taken directly from Bruland et al. (1974), Huh et al. (1989) and Christensen et al. (1994), and all studies accounted for sediment compaction. All cores collected from depths > 900 m showed MARs that were remarkably consistent, averaging 17.1±0.6 mg cm−2 yr−1 (±1 standard deviation of the mean, SDOM). There was also no noticeable trend in MAR (Fig. S3) or variation in the amount of excess 210Pb at the sediment–water interface over time. Additionally, excess 210Pb profiles were similar in structure down-core. All cores (Fig. 11), except for those obtained in the present study, were retrieved by box corers, which can disturb the top few centimeters of sediments (Huh et al., 1989). Yet all the cores collected from the deep basin showed remarkable consistency, with no evidence of sedimentation rate change between the 1970s and 2016, as well as no evidence of core disturbance.

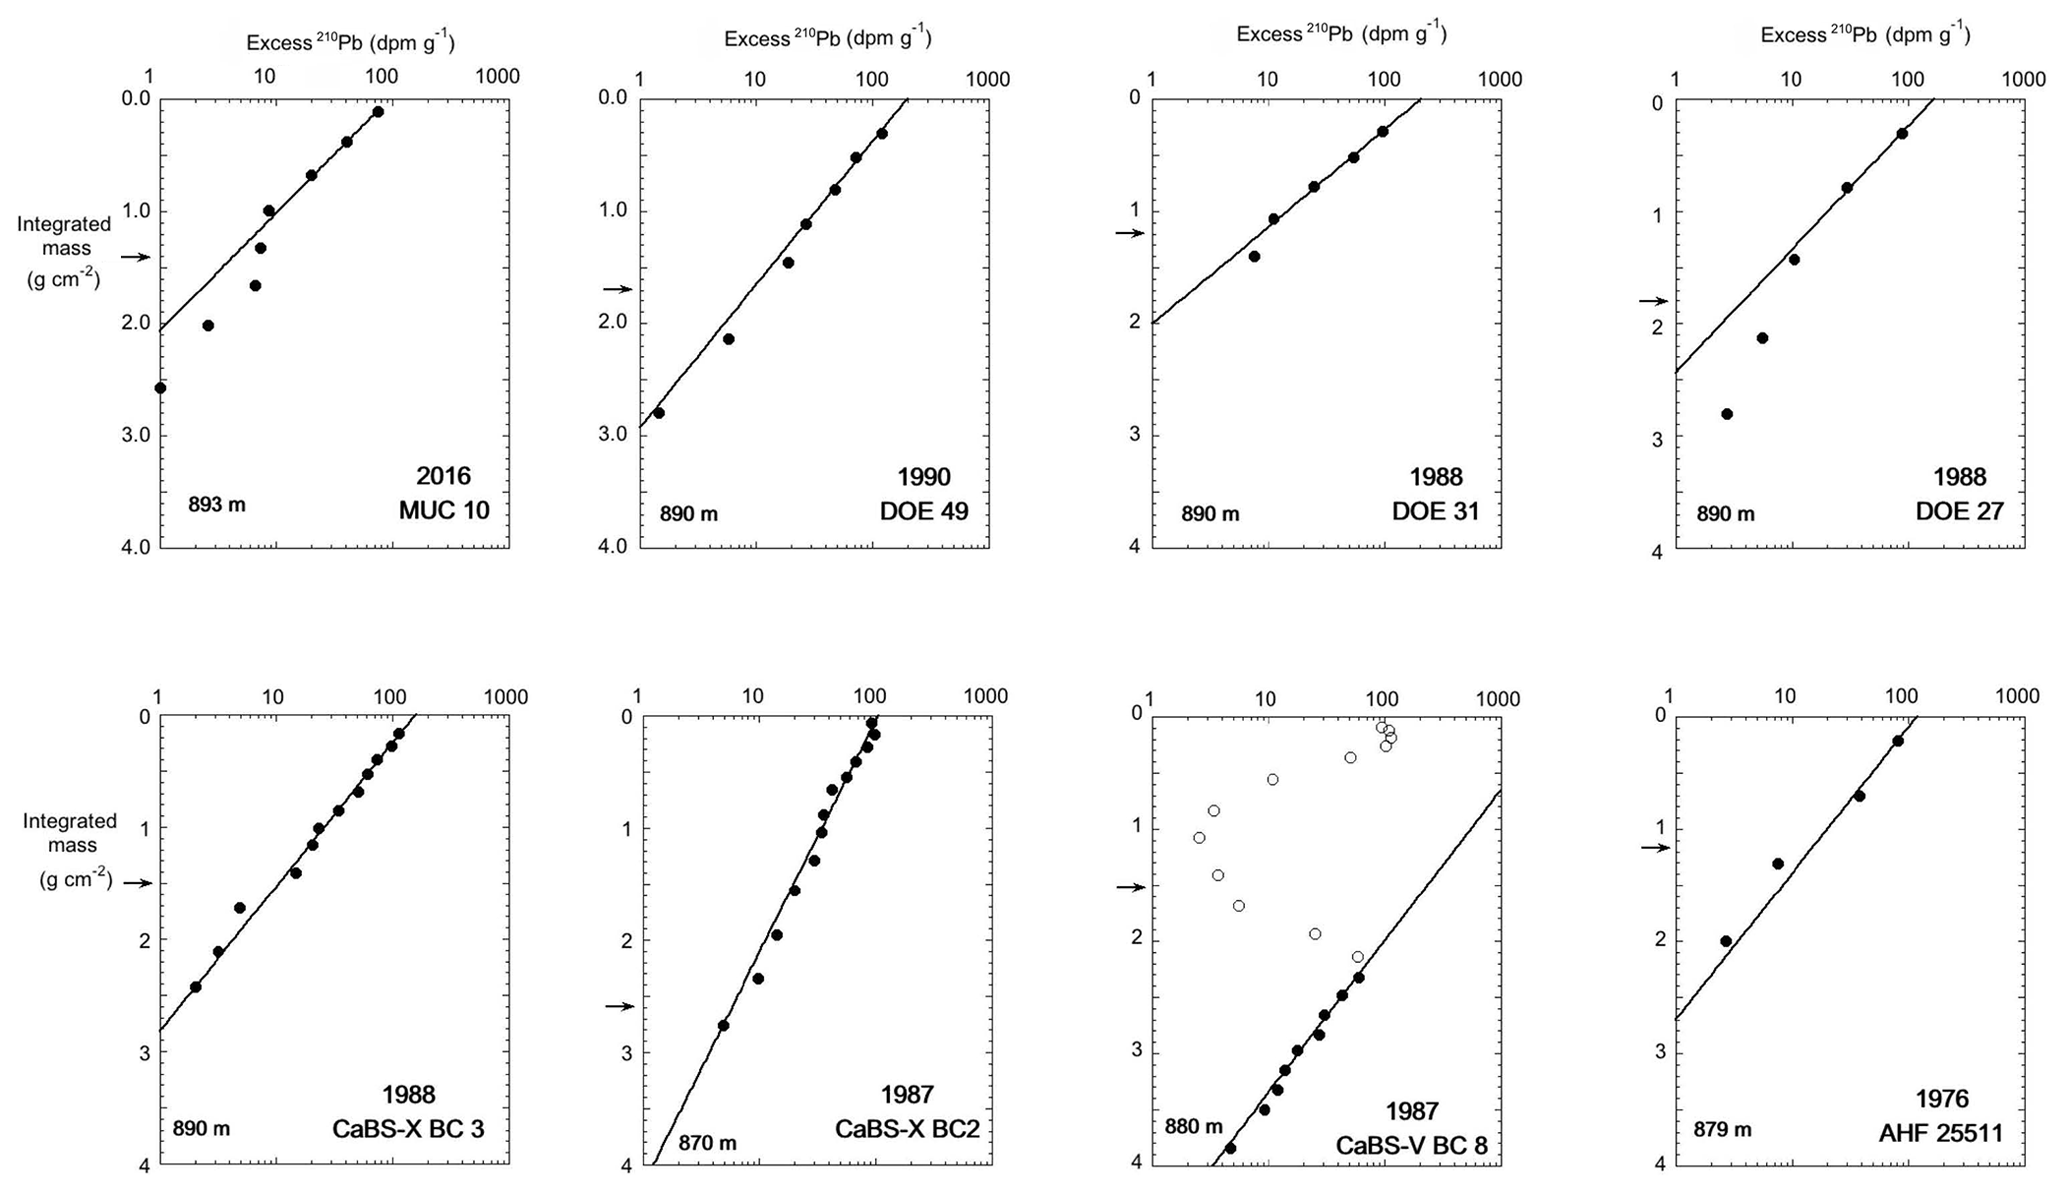
Figure 11Semi-log plot of excess 210Pb activity vs. integrated mass for 13 cores sampled in the Santa Monica Basin in the years 1974–2016. The linear fit to these plots yield slopes that define the mass accumulation rate (see Table 2). Arrows on the y axis indicate the integrated mass equivalence to 1900 CE.
We also compared 210Pb profiles in cores retrieved from water depths 870–900 m (Fig. 12) to those collected from deeper sites as to determine if a trend exists with water depth. These cores showed the same MAR as the deeper sites, although with more variation evidenced in the larger standard deviation of the mean (17.9±1.9 mg cm−2 yr−1). However, as with the deepest cores, we observed no systematic change as a function of year collected (Fig. S3).Much of the variability in MAR was driven by CaBS X BC2, which was collected at 870 m. Core CaBS V BC8 had a clear 210Pb minimum in the upper 10 cm and featured a “typical” 210Pb profile only below this depth. The minimum and the offset of the extrapolated fit for the deeper points from the surface values suggest rapid input of material with low excess 210Pb, most likely from a localized turbidite in this core. The eight cores collected from 870 to 900 m showed surface excess 210Pb that were similar to cores collected from sites > 900 m. Although cores from the shallower depth range averaged the same MAR as the deeper cores, the quality of the linear fit of excess 210Pb vs. integrated mass, as demonstrated by the average R2 value, was poorer for cores 870–900 m (average R2=0.90) compared to cores collected at depths of > 900 m (average R2=0.99), suggesting either episodic input of sediment with varying excess 210Pb or possibly minor episodic disturbances.
4.2 Changes in the areal extent of laminated sediments
Christensen et al. (1994) and Huh et al. (1989) documented the concentric areal expansion of laminated sediments throughout the floor of SMB starting about 400 yr BP. Both studies determined that the onset of anoxia began in the southeastern portion of the central basin, where the basin is deepest (> 900 m) and moved outward asymmetrically but in all directions (Fig. 13). Using the presence of fine laminations as a proxy for oxygen deficiency and establishing the onset of lamination by assignment of age, a “lateral” anoxic spreading rate of 50–80 m yr−1 was calculated (Christensen et al., 1994). Depending on the direction chosen, the rate of anoxia spreading in vertical space varied, from 0.06 m yr−1 up the eastern slope to 0.19 m yr−1 moving in a north-northwesterly direction (Fig. 13). This asymmetry may be attributed to the major circulation pattern of deep basin water, in which waters from the San Pedro Basin enter SMB from the southeast and travel counterclockwise. In such a flow, the eastern slope of the SMB would be bathed by overlying waters with slightly more oxygen than waters on the north-northwestern side of the basin. The overall expansion of anoxic waters may reflect both a reduction of oxygen in waters entering the basin, as well as increased oxygen consumption within deep basin waters. The latter could arise from either an increased rain rate of labile carbon or a reduction in water replacement rates.
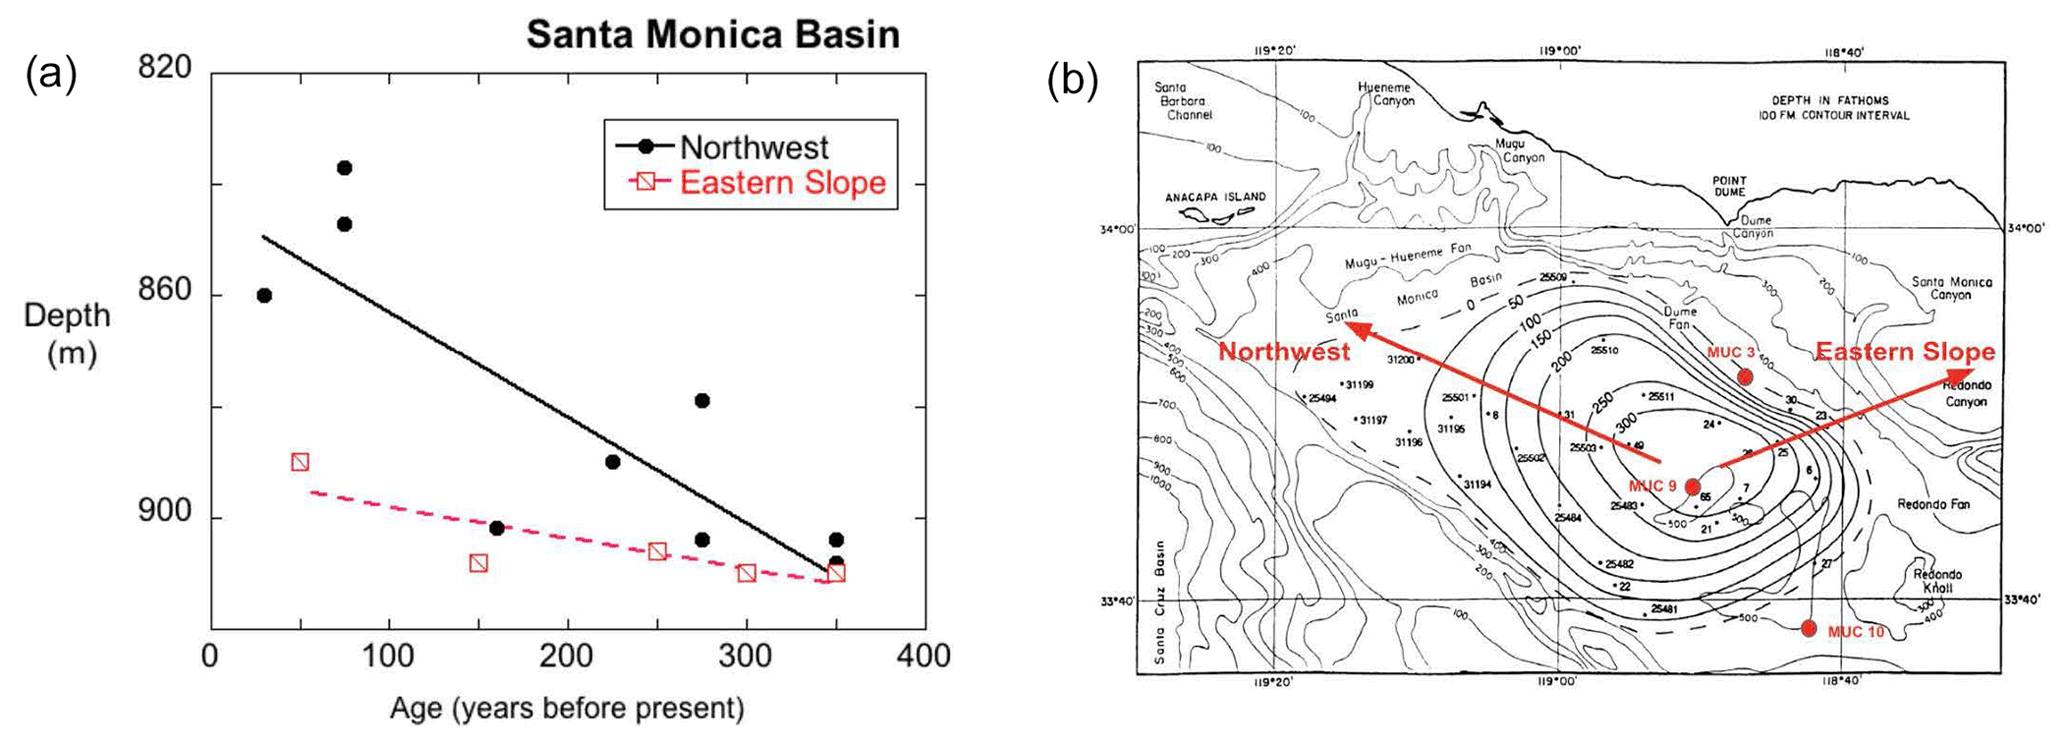
Figure 13Spreading of the laminated sediment area, defined as a change in depth over time for two transects. Panel (a) shows the spreading rate of laminated sediments as they progress upslope (shallower depths) moving toward the Recent. Panel (b) is modified from Christensen et al. (1994), based on their timescales, and shows the growth in areal extent of laminated sediments since 300 years ago. The location of three MUC cores obtained in 2016 are also shown (red circles). The expansion of laminated sediment accumulation has occurred more rapidly in a northwestern direction than in the eastern transect.
Only two of the 2016 cores analyzed in the present study showed sedimentary layering in X-radiographs (MUC 9 and MUC 10). The other cores from this study (near the SMB slope) had no laminations and were likely influenced by mixing. For the deepest core, MUC 9, there was clear evidence of finely laminated sediments in the top 15 cm (Fig. 6). MUC 10, which is located in the southern SMB, near the connection to San Pedro Basin, showed a banding (1–2 cm width) of sediments in the upper few centimeters of the core but no fine lamination, suggesting minimal bioturbation. Given MUC 10's location in relation to the spread of oxygen deficiency, the absence of finely laminated sediments in the upper few centimeters suggests that the spread of oxygen deficiency has not extended to this location. Furthermore, MUC 3 (777 m), which is right at the boundary of the zone of oxygen deficiency defined by Christensen et al. (1994), had no indications of laminations, and 210Pb clearly showed a mixed zone in the upper 4 cm (Fig. 7). These two MUC cores make it tempting to suggest the oxygen deficiency zone is contracting; however, we can conclude with confidence that the position of the laminated zone in SMB has not changed markedly since cores were last obtained and analyzed in the 1980s.
4.3 Changes in mass accumulation rates: a comparison of 210Pb and 14C methods
Interpretation of 210Pb and 14C profiles in terms of sediment accumulation rate rely on assumptions that the delivery of these radiotracers have been consistent and continuous and that the sediment has not been disturbed via mixing (typically bioturbation). The assumption of consistency is generally assumed to be true in basins that receive sediments via hemipelagic sedimentation, and the assumption of non-disturbance is supported by sediment fabric, as revealed by X-radiography (Fig. 6).
The similarity of 210Pb profiles in core MUC 9, which shows fine lamination structure in the top 8 cm, and core MUC 10, which shows coarser sediment banding, is evidence that some minor disturbance in the latter core may have obscured lamination structure, but the disturbance has been insufficient to change the 210Pb profile. Both of these cores yield similar sediment accumulation rates, ∼17 mg cm−2 yr−1, and show no evidence for a change in sedimentation rate over the lifetime of 210Pb, which is approximately 80–100 years. Because the Bruland (1974) core does not show any evidence of a change in sedimentation rate through the life of 210Pb, we can conclude that sedimentation has been constant in SMB since around the late 1800s to early 1900s. We find it striking that sediment accumulation offshore from an urban center has remained constant, even though the region has grown from a small town to the present 15+ million person megalopolis of Los Angeles.
While accumulation rates remained constant during the period of rapid population growth in Los Angeles, the 14C accumulation rates, not including those horizons that lie within turbidite deposits, define a sedimentation rate for the period ∼1500–1900 CE that is lower than that defined by 210Pb. In both MUC 9 and MUC 10 cores, 14C dated sediment horizons yield sediment accumulation rates of 9–12 mg cm−2 yr−1 compared to 17.1±0.6 derived from 210Pb profiles (Table 2). This trend of increasing sedimentation toward the Recent is opposite of what might have been predicted due to the trapping of sediment via flood-control engineering of the Los Angeles River. However, our data are consistent with the proposal made by Tomašových and Kidwell (2017), noting that sometime in the mid-to-late 1800s sediment delivery to the coastal zone of the SMB increased. Tomašových and Kidwell (2017) based their interpretation on the change in the SMB shelf ecosystem structure that occurred at that time. From the loss of a filter-feeding ecosystem from the SMB shelf environments, Tomašových and Kidwell (2017) infer an increase in fine sediment delivery to the SMB shelf.
The determinations of 14C sediment accumulation rates could be biased or incorrect if there has been a changing input of particulate organic matter (POC) to the SMB. In MUC 10 there is an obvious section of core where 14C age dates are old and δ13Corg values are light, relative to the trend defined by the other data. However, these two measurements are from a turbidite deposit (Fig. 10) and are consistent with the interpretation that such a deposit contains older, terrestrially derived (perhaps more refractory) particulate organic carbon (POC) (Meyers, 1994). MUC 9 may also show a minor influence from this turbidite, but the effect is subtle. A plot of δ13Corg vs. integrated mass of MUC 9 and MUC 10 show a trend to slightly lighter δ13Corg near the top, although the change is very small (Fig. 10). The 14C profiles for both cores appear to show slightly older sediments than expected, just above the 2 mass unit horizon, suggesting a change to additional input of older carbon associated with the modest change in δ13Corg. The changing trend could record a terrestrial source, but the data are not clear-cut. While there may have been a change in the source of carbon (and sediment) in the late 1800s, the data prior to this time indicates there has been a step-function change in sediment accumulation rate that took place sometime between the late 1800s to the early 1900s. A sensitivity calculation assuming a step-change reduction of 40 % in accumulation rate in 1930 (two half-lives before the Bruland, 1974, core) shows 210Pb has the sensitivity to resolve such a change (computed profile not shown). Consequently, the change in accumulation rate must have occurred prior to 1930.
It is possible that changes in carbon reservoir age or the age of waters upwelling in this region, instead of sedimentation rate, could explain the offset of 14C values down core. However, if the sedimentation rate determined from the excess 210Pb profile at MUC 9 is assumed constant down-core to a depth represented by 2–6 mass units, then 236 years would have elapsed during this interval (4 g cm−2 divded by 0.017 g cm−2 yr−1 is equal to 236 years). If the 210Pb MAR applies through this interval and the 14C values record changes in reservoir age and not sedimentation rate, the age for organic carbon (fixed at the surface ocean from dissolved inorganic carbon, DIC) would need to increase by 160 years, at a steady rate, over the time period represented by 2–6 mass units. While this cannot be dismissed, it would imply a higher upwelling rate in the past, and there seems to be no evidence for this.
Another explanation for the lack of 14C MAR and 210Pb MAR agreement is that there was a higher proportion of old terrestrial carbon reaching the sediments during the past. However, the lack of a significant change in δ13Corg through this interval makes this process an unlikely explanation. We think it most likely that an increase in MAR occurred somewhere in the late 1800s and propose that further 14C analysis of laminated sediments, preserved under low-oxygen conditions, is the best way to find further support for this conclusion.
A previous study that considered Holocene sediment accumulation in SMB (Romans et al., 2009) found that the hemipelagic sediment accumulation rate for the late Holocene averaged ∼10 mg cm−2 yr−1 (this rate determined from their linear sediment accumulation rate and the extrapolation of our porosity data to a depth of 2 m), although the turbidite accumulation rate was substantially greater. This is a value consistent with the MAR we found from the 14C dated section of our cores, i.e., only 150–300 years before present. Thus, it appears that hemipelagic sedimentation in SMB has been very consistent over the past millennia but has increased by ∼70 % through a stepwise change about 100–150 years ago.
4.4 Biological activity in low-oxygen environments
Only three cores analyzed for this study had macrofauna present, these were MUC 12 (508 m), MUC 8 (695 m) and MUC 11 (745 m). All three cores were collected from bottom waters with < 20 µM oxygen concentration and the deeper two sites have < 10 µM oxygen. The living annelid found in MUC 11 is evidence that macrofauna can be active and hence potentially act to bioturbate at low oxygen levels (< 5 µM).
A preponderance of sponge spicules was found in replicate cores from the location of MUC 8. This is also a site bathed in waters with < 5 µM oxygen. In addition to the core sectioned for biological inspection, a core that was X-radiographed shows the presence of a partially articulated demosponge within the sediment column at ∼8 cm depth (Morine, 2017). These sponges are not infaunal, thus the most plausible explanation for the high spicule abundance in these cores is that this sediment zone has been populated by sponges for > 100 years.
Prior to the work of Christensen et al. (1994), Malouta et al. (1981) mapped out the area of bioturbation throughout the SMB using X-radiographs of basin cores. Using disturbances in laminated sediments as a proxy for different levels of bioturbation, three different zones were assigned: completely disturbed laminae, partially disturbed laminae and fine laminae present. Completely disturbed laminae were cores that showed no laminations or banding and were usually found on the shelf and slopes of the SMB, typically shallower than 750 m. Partially disturbed laminae were characterized by some hints of banding and suggested minimal bioturbation. Lastly, finely laminated sediments were zones of no bioturbation and were located in the deep, central basin at depths greater than 900 m. The areas to which Malouta et al. (1981) assigned these zones of bioturbation correlate with our cores obtained in 2016, suggesting minimal changes in organism activity vs. depth during the last 40 years. Additionally, our work shows that laminae can be largely obscured, and yet a 210Pb profile from a slightly bioturbated core (MUC 10) can appear nearly indistinguishable from a profile from a well-laminated core (MUC 9).
A suite of cores was collected in 2016 to explore whether changes in the areal extent of laminated sediments and their mass accumulation rates have changed during recent decades. Only one core analyzed in 2016 showed finely laminated sediments in X-radiographs (MUC 9 at 907 m). Other cores showed centimeter-scale layering of sediments or no layering at all. The absence of finely laminated sediments in MUC 10 (893 m) and MUC 3 (777 m) suggest that the rate of oxygen deficiency spreading, as noted by Huh et al. (1989) and Christensen et al. (1994), has not increased remarkably since cores were last collected in the 1980s. It is possible that the rate of anoxic bottom water spreading has declined or even possibly reversed with a slightly shrinking area of laminated sediments. X-radiographs of laminations from cores collected in this study were compared to the different levels of bioturbation mapped out 40 years ago in the SMB. The zones of bioturbation correlate with cores collected in 2016, again suggesting minimal change in macrofaunal activity (assumed to be a proxy for bottom oxygen concentrations) during the last 40 years.
Through a summary of previously published profiles and new measurements of 210Pb in sediment cores from this study, a comparison of mass accumulation rate records in the central portion of SMB was examined in cores collected over a 42-year span. Mass accumulation rates for the deepest parts of the SMB basin (> 900 m) have been remarkably consistent since the late 1800s, averaging 17.1±0.6 mg cm−2 yr−1. At slightly shallower sites (870–900 m), accumulation rates showed a little more variability but yield the same accumulation rate, averaging 17.9±1.9 mg cm−2 yr−1. Excess 210Pb near the sediment–water interface was also consistent for all cores deeper than 870 m during the last 4 decades. The consistency of sedimentation rates, both for the past 40 years but also for the lifetime of 210Pb, ∼100 years, is remarkable given the changes that have occurred in the Los Angeles region over the past century.
Δ14C values between 7 and 20 cm depths suggest sediment accumulation rates were lower prior to the late 1800s. MUC 9 and MUC 10 reveal sedimentation rates of 8.6 and 12.0 mg cm−2 yr−1 prior to the late 1800s, which is 55 %–75 % of the rates determined for younger sediments using the excess 210Pb profiles. The slower accumulation rate for hemipelagic sediments also occurred during the late Holocene (Roman et al., 2009). The increase in MAR appears to be a step-function change, although the precision of the dating methods can only constrain the transition to somewhere between about 1850 and 1920. A possible explanation, offered by Tomašových and Kidwell (2017), is that sedimentation increased between 1850 and 1900 due to the rapid rise of cattle grazing and increased erosion. Why this increased rate remained high after urban development, and why it should have remained so constant subsequently, are unanswered questions, particularly following installation of debris basins that trapped a large portion of the sediment flux. Perhaps these basins largely captured coarse debris, while the fine sediment fraction that contributes to hemipelagic input has not been captured, but its input was augmented by cattle grazing and subsequent urban development.
Evidence of sedimentary change in the SMB during the last 40 years is astonishingly absent. Mass accumulation rates, laminated sediments, extent of bioturbation and % Corg have changed little during this time. The only parameter that appears to have clearly changed in the last 200 years is the sedimentation rate, which shows a step-function increase in the late 1800s to early 1900s.
A file containing all the 210Pb and 14C data will be posted and openly available on a website curated by USC Earth Sciences. Link will be posted shortly.
The supplement related to this article is available online at: https://doi.org/10.5194/bg-17-2381-2020-supplement.
NK, WMB, and DEH did most of the writing, data compilation, and interpretation. NK performed all the 210Pb isotope analyses. LM, SS, NR, and EP worked on sediment fabric, biological content, and solid-phase chemistry. MF and TWL provided 14C analyses and interpretations. SL and TT performed fieldwork collecting the water column profiles and cores and provided critical interpretations. WMB and TT were co-funded in support of this project.
The authors declare that they have no conflict of interest.
This article is part of the special issue “Ocean deoxygenation: drivers and consequences – past, present and future (BG/CP/OS inter-journal SI)”. It is not associated with a conference.
The work was supported by a NOAA Sea Grant (USC, award no. NA14OAR4170089) awarded to William Berelson and Tina Treude. The Petroleum Research Fund of the American Chemical Society provided funding to Timothy Lyons and Maria Figueroa. Tina Treude was further supported by a faculty research grant from the University of California Los Angeles.
This research has been supported by a NOAA Sea Grant (grant no. NA14OAR4170089) and the Petroleum Research Fund of the American Chemical Society (grant no. 57545-ND2).
This paper was edited by S. Wajih A. Naqvi and reviewed by Christopher Fuller and one anonymous referee.
Alexander, C. R. and Lee, H. J.: Sediment accumulation on the Southern California Bight continental margin during the twentieth century, Earth Science in the Urban Ocean, The Southern California Continental Borderland, edited by: Lee, H. J. and Normark W. R., GSA, 454, Book Chapter, https://doi.org/10.1130/2009.2454(2.4), 2009.
Alexander, C. R. and Venherm, C.: Modern sedimentary processes in the Santa Monica, California continental margin: sediment accumulation, mixing and budget, Mar. Environ. Res., 56, 177–204, https://doi.org/10.1016/s0141-1136(02)00330-6, 2003.
Algeo, T. J., Phillips, M., Jaminski, J., and Fenwick, M.: High-resolution X-radiography of laminated sediment cores, J. Sediment. Res., 64, 665–668, https://doi.org/10.1306/d4267e38-2b26-11d7-8648000102c1865d, 1994.
Appleby, P. G.: Chronostratigraphic Techniques in Recent Sediments, Tracking Environmental Change Using Lake Sediments, Developments in Paleoenvironmental Research, 1, 171–203, https://doi.org/10.1007/0-306-47669-x_9, 2001.
Benninger, L. K. and Krishnaswami, S.: Sedimentary processes in the inner New York Bight: Evidence from excess 210Pb and 239,240Pu, Earth Planet. Sc. Lett., 53, 158–174, https://doi.org/10.1016/0012-821x(81)90151-5, 1981.
Berelson, W. M.: Studies of water column mixing and benthic exchange of nutrients, carbon and radon in the southern California borderland, PhD Thesis, University of Southern California, Los Angeles, CA, 1985.
Berelson, W. M.: The flushing of two deep-sea basins, southern California borderland, Limnol. Oceanogr., 36, 1150–1166, https://doi.org/10.4319/lo.1991.36.6.1150, 1991.
Bograd, S. J., Castro, C. G., Lorenzo, E. D., Palacios, D. M., Bailey, H., Gilly, W., and Chavez, F. P.: Oxygen declines and the shoaling of the hypoxic boundary in the California Current, Geophys. Res. Lett., 35, LI2607, https://doi.org/10.1029/2008gl034185, 2008.
Booth, J. A. T., Woodson, C. B., Sutula, M., Micheli, F., Weisberg, S. B., Bograd, S. J., Steele, A., Schoen, J., and Crowder, L. B.: Patterns and potential drivers of declining oxygen content along the southern California coast, Limnol. Oceanogr., 59, 1127–1138, https://doi.org/10.4319/lo.2014.59.4.1127, 2014.
Breitburg, D., Levin, L. A., Oschlies, A., Grégoire, M., Chavez, F. P., Conley, D. J., Garcon, V., Gilbert, D., Isenesee, K., Jacinto, G. S., Limburg, K. E., Montes, I., Naqvi, S. W. A., Pitcher, G. C., Rabalais, N. N., Roman, M. R., Rose, K. A., Seibel, B., Teleszewski, M., Yasuhara, M., and Zhang, J.: Declining oxygen in the global ocean and coastal waters, Science, 359, 6371, https://doi.org/10.1126/science.aam7240, 2018.
Bruland, K. W., Bertine, K., Koide, M., and Goldberg, E. D.: History of metal pollution in southern California coastal zone, Environ. Sci. Technol., 8, 425–432, https://doi.org/10.1021/es60090a010, 1974.
Cheng, T., Hammond, D. E., Berelson, W. M., Hering, J. G., and Dixit, S.: Dissolution kinetics of biogenic silica collected from the water column and sediments of three Southern California borderland basins, Mar. Chem., 113, 41–49, https://doi.org/10.1016/j.marchem.2008.12.001, 2009.
Christensen, C. J., Gorsline, D. S., Hammond, D. E., and Lund, S. P.: Non-annual laminations and expansion of anoxic basin-floor conditions in Santa Monica Basin, California Borderland, over the past four centuries, Mar. Geol., 116, 399–418, https://doi.org/10.1016/0025-3227(94)90054-x, 1994.
Collins, L. E., Berelson, W., Hammond, D. E., Knapp, A., Schwartz, R., and Capone, D.: Particle fluxes in San Pedro Basin, California: A four-year record of sedimentation and physical forcing, Deep-Sea Res. Pt. I, 58, 898–914, https://doi.org/10.1016/j.dsr.2011.06.008, 2011.
Gorsline, D.: The geological setting of Santa Monica and San Pedro Basins, California Continental Borderland, Prog. Oceanogr., 30, 1–36, https://doi.org/10.1016/0079-6611(92)90008-n, 1992.
Hammond, D. E., Marton, R. A., Berelson, W. M., and Ku, T.-L.: Radium 228 distribution and mixing in San Nicolas and San Pedro Basins, southern California Borderland, J. Geophys. Res., 95, 3321, https://doi.org/10.1029/jc095ic03p03321, 1990.
Haskell, W. Z., Hammond, D. E., and Prokopenko, M. G.: A dual-tracer approach to estimate upwelling velocity in coastal Southern California, Earth Pl. Sc. Lett., 422, 138–149, https://doi.org/10.1016/j.epsl.2015.04.015, 2015.
Hickey, B. M.: Variability in two deep coastal basins (Santa Monica and San Pedro) off southern California, J. Geophys. Res., 96, 16689, https://doi.org/10.1029/91jc01375, 1991.
Huh, C.-A. L., Zahnle, D. F., Small, L. E., and Noshkin, V.: Budgets and behaviors of uranium and thorium series isotopes in Santa Monica Basin sediments, Geochim. Cosmochim. Ac., 51, 1743–1754, https://doi.org/10.1016/0016-7037(87)90352-8, 1987.
Huh, C.-A., Small, L. F., Niemnil, S., Finney, B. P., Hickey, B. M., Kachel, N. B., Gorsline, D. S., and Williams, P. M.: Sedimentation dynamics in the Santa Monica-San Pedro Basin off Los Angeles: radiochemical, sediment trap and transmissometer studies, Cont. Shelf Res., 10, 137–164, https://doi.org/10.1016/0278-4343(90)90027-j, 1990.
Kemp, Alan E. S.: Laminated Sediments as Palaeo-indicators, Geol. Soc. Lond. Spec. Publ., 116, 7–12, https://doi.org/10.1144/gsl.sp.1996.116.01.01, 1996.
Koivisto, E. and Saarnisto, M.: Conventional Radiography, Xeroradiography, Tomography, and Contrast Enhancement in the Study of Laminated Sediments. Preliminary Report, Geogr. Ann. A, 60, 55–61, https://doi.org/10.2307/520966, 1978.
Levin, L. A.: Oxygen minimum zone benthos: Adaptation and community response to hypoxia, Oceanogr. Mar. Biol., 41, 1–45, 2003.
Lynn, R. J. and Simpson, J. J.: The California Current system: The seasonal variability of its physical characteristics, J. Geophys. Res., 92, 12947, https://doi.org/10.1029/jc092ic12p12947, 1987.
Meyers, P. A.: Preservation of elemental and isotopic source identification of sedimentary organic matter, Chem. Geol., 114, 289–302, https://doi.org/10.1016/0009-2541(94)90059-0, 1994.
Malouta, D. S., Gorsline, D. N., and Thorton S. E.: Processes and Rates of Recent (Holocene) Basin Filling in an Active Transform Margin: Santa Monica Basin, California Continental Borderland, SEPM J. Sediment. Res., 5, 1077–1095, 1981.
Morine, L.: Laminations, Organic Carbon, and Carbonate Content as Indicators of Anoxic Zone Shifting in the Santa Monica Basin, Senior Thesis, University of Southern California, Los Angeles, CA, 2017.
Oldfield, F. and Appleby, P. G.: Empirical testing of 210Pb-dating models for lake sediments, edited by: Haworth, E. Y. and Lund, J. G., Lake Sediments and Environmental History, Leicester University Press, 93–124, 1984.
Quinn, W. H., Zopf, D. O., Short, K. S., and Kuo Yang, R. T. W.: Historical trends and statistics of the Southern Oscillation and E1 Nifio, and Indonesian droughts, Fish. Bull., 76, 663–678, 1978.
Robbins, J. A.: Geochemical and geophysical applications of radioactive lead, edited by: Nriagu, J. O., Biogeochemistry of Lead in the Environment, Elsevier Scientific, Amsterdam, 285–393, 1978.
Robbins, J. A. and Edgington, D.: Determination of recent sedimentation rates in Lake Michigan using Pb-210 and Cs-137, Geochim. Cosmochim. Ac., 39, 285–304, https://doi.org/10.1016/0016-7037(75)90198-2, 1975.
Romans, B. W., Normark, W. R., Mcgann, M. M., Covault, J. A., and Graham, S. A.: Coarse-grained sediment delivery and distribution in the Holocene Santa Monica Basin, California: Implications for evaluating source-to-sink flux at millennial time scales, Geol. Soc. Am. Bull., 121, 1394–1408, https://doi.org/10.1130/b26393.1, 2009.
Savrda, C. E. and Bottjer, D. J.: Development of a Comprehensive OxygenDeficient Marine Biofacies Model: Evidence from Santa Monica, San Pedro, and Santa Barbara Basins, California Continental Borderland, AAPG Bull., 68, 1179–1192, https://doi.org/10.1306/ad4616f1-16f7-11d7-8645000102c1865d, 1984.
Souza, V. L. B. D., Rodrigues, K. R. G., Pedroza, E. H., Melo, R. T. D., Lima, V. L. D., Hazin, C. A., Almeida, M. G. O. D., and Nascimento, R. K. D.: Sedimentation Rate and 210Pb Sediment Dating at Apipucos Reservoir, Recife, Brazil, Sustainability, 4, 2419–429, https://doi.org/10.3390/su4102419, 2012.
Stramma, L., Schmidtko, S., Levin, L. A., and Johnson, G. C.: Ocean oxygen minima expansions and their biological impacts, Deep-Sea Res. Pt. I, 57, 587–595, https://doi.org/10.1016/j.dsr.2010.01.005, 2010.
Stuiver, M. and Polach, H. A.: Discussion Reporting of 14C Data, Radiocarbon, 19, 355–363, https://doi.org/10.1017/s0033822200003672, 1977.
Subhas, A. V., Rollins, N. E., Berelson, W. M., Dong, S., Erez, J., and Adkins, J. F.: A novel determination of calcite dissolution kinetics in seawater, Geochim. Cosmochim. Ac., 170, 51–68, https://doi.org/10.1016/j.gca.2015.08.011, 2015.
Subhas, A. V., Adkins, J. F., Rollins, N. E., Naviaux, J., Erez, J., and Berelson, W. M.: Catalysis and chemical mechanisms of calcite dissolution in seawater, P. Natl. Acad. Sci. USA, 114, 8175–8180, https://doi.org/10.1073/pnas.1703604114, 2017.
Tomašových, A. and Kidwell, S. M.: Nineteenth-century collapse of a benthic marine ecosystem on the open continental shelf, P. Roy. Soc. B, 284, 20170328, https://doi.org/10.1098/rspb.2017.0328, 2017.