the Creative Commons Attribution 4.0 License.
the Creative Commons Attribution 4.0 License.
 | 06 May 2020
Phytoplankton growth and consumption by microzooplankton stimulated by turbulent nitrate flux suggest rapid trophic transfer in the oligotrophic Kuroshio
Toru Kobari
Taiga Honma
Daisuke Hasegawa
Naoki Yoshie
Eisuke Tsutsumi
Takeshi Matsuno
Takeyoshi Nagai
Takeru Kanayama
Fukutaro Karu
Koji Suzuki
Takahiro Tanaka
Xinyu Guo
Gen Kume
Ayako Nishina
Hirohiko Nakamura
The Kuroshio Current has been thought to be biologically unproductive because of its oligotrophic conditions and low plankton standing stocks. Even though vulnerable life stages of major foraging fishes risk being entrapped by frontal eddies and meanders and encountering low food availability, they have life cycle strategies that include growing and recruiting around the Kuroshio Current. Here we report that phytoplankton growth and consumption by microzooplankton are stimulated by turbulent nitrate flux amplified by the Kuroshio Current. Oceanographic observations demonstrate that the Kuroshio Current topographically enhances significant turbulent mixing and nitrate influx to the euphotic zone. Graduated nutrient enrichment experiments show that growth rates of phytoplankton and microheterotroph communities were stimulated within the range of the turbulent nitrate flux. Results of dilution experiments imply significant microzooplankton grazing on phytoplankton. We propose that these rapid and systematic trophodynamics enhance biological productivity in the Kuroshio.
- Article
(767 KB) - Full-text XML
-
Supplement
(232 KB) - BibTeX
- EndNote


The Kuroshio Current is the western boundary current of the North Pacific Subtropical Gyre (Qiu, 2001; Hu et al., 2015). The Kuroshio enters the East China Sea from the east of Taiwan and flows along the continental slope until it passes through the Tokara Strait into the western North Pacific (Fig. 1a). The Kuroshio has been thought to be biologically unproductive because ambient nutrient concentrations and plankton standing stocks in its waters are low (Guo, 1991; Hirota, 1995). In spite of such seemingly unproductive conditions, the Kuroshio in the East China Sea (ECS-Kuroshio) is adjacent to major spawning and nursery grounds of foraging species such as sardines (Watanabe et al., 1996), jack mackerel (Sassa et al., 2008), chub mackerel (Sassa and Tsukamoto, 2010), and common squid (Bower et al., 1999). Indeed, good fishing grounds have been found for various fishes and squid near the Kuroshio, and the catches from those grounds account for more than half of the total catch in Japanese waters (Saito, 2019). It is risky, however, for highly vulnerable early life stages of many foraging species to grow and recruit in the oligotrophic and unproductive waters of the ECS-Kuroshio (hereafter called the “Kuroshio Paradox”; Saito, 2019), even if the warm temperatures of the Kuroshio Current can enhance cellular metabolic processes and thereby stimulate growth. Conventional wisdom is that survival of these early stages is supported by the high plankton productivity on the continental shelf and in the Kuroshio front (Nakata et al., 1995). However, these areas of high productivity are limited in extent and spatiotemporally highly variable because the Kuroshio Current often meanders (Nakata and Hidaka, 2003). Coastal water masses are sometimes entrapped and transported into the Kuroshio and to more pelagic sites (Nakamura et al., 2006; Kobari et al., 2019). Use of waters in the vicinity of the oligotrophic Kuroshio as a nursery and feeding ground would therefore appear to be a risky strategy, unless there is a mechanism that enhances biological production in the Kuroshio.
There is increasing information about the community structure of phytoplankton and zooplankton in the Kuroshio. Phytoplankton standing stocks in the Kuroshio consist mainly of picoplankton and nanoplankton, and the predominant components are haptophytes, diatoms, and unicellular cyanobacteria like Prochlorococcus and Synechococcus (T. Hasegawa et al., 2019; Endo and Suzuki, 2019). Heterotrophic bacteria and calanoid copepods contribute to heterotrophic biomass in the Kuroshio, whereas microzooplankton biomass is relatively small (Kobari et al., 2019). Based on a mass balance model, Kobari et al. (2019) have concluded that mesozooplankton standing stocks in the Kuroshio are supported by microautotrophs and nanoautotrophs and microzooplankton. However, we have little understanding of how biogeochemical processes and trophodynamics support the plankton community in the Kuroshio.
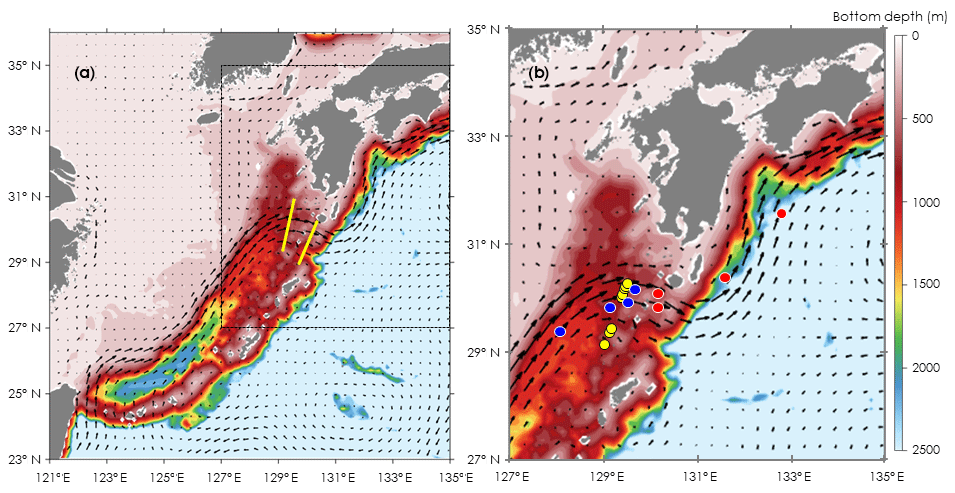
Figure 1Locations for oceanographic observations and onboard experiments in the Kuroshio Current of the East China Sea (ECS-Kuroshio). (a) Oceanographic observations by Deep SUNA V2 and TurboMAP-L (yellow lines). (b) Onboard experiments for phytoplankton and microzooplankton growth (EXPa: red and blue circles) and for microzooplankton grazing (EXPb: yellow circles). EXPa was conducted in the upstream (blue circles) and downstream Kuroshio (red circles) in the Tokara Strait. Current directions and velocities (arrows) are shown as monthly means during November 2016. Bottom depth (m) is indicated as colored contours.
In recent years, some mechanisms that supply nutrients to the oligotrophic waters of the Kuroshio have been identified. The Kuroshio nutrient stream characterized by an intense core of nutrient flux at subsurface contributes substantially to productivity in the euphotic zone of the Kuroshio in a manner similar to the contribution of the nutrient stream along the Gulf Stream (Komatsu and Hiroe, 2019). Turbulence around the Kuroshio appears to be an important mechanism that supplies nutrients via upward movement of deeper waters into the Kuroshio (Nagai et al., 2019a). Frontal disturbances also contribute to the supply of nutrients into the euphotic zone of the Kuroshio (Kuroda, 2019). Moreover, the island mass effect produced by the Kuroshio Current as it flows over the bottom topography of the Japanese archipelago induces an upward supply of nutrients (Hasegawa, 2019). These nutrient supplies have been hypothesized to stimulate biological productivity in the Kuroshio. Within the wide path of the Kuroshio, the supply of nutrients by these mechanisms can be particularly efficacious around the Tokara Strait because of the extensive frontal disturbances (Nakamura et al., 2006) and strong turbulence (Tsutsumi et al., 2017; Nagai et al., 2017, 2019b) in that area.
Here we report evidence of phytoplankton productivity and subsequent microzooplankton grazing stimulated by turbulence-induced nitrate fluxes in the Kuroshio Current. Oceanographic observations demonstrated a substantial nitrate flux caused by turbulent mixing in the Tokara Strait of the ECS-Kuroshio. Nutrient-amended bottle incubation experiments showed that the growth rates of phytoplankton, microheterotrophs, and the grazing rates of microzooplankton on phytoplankton were elevated within the area impacted by this turbulence-induced nitrate flux.
2.1 Onboard observations and experiments
All oceanographic observations and bottle incubations were done in the Kuroshio Current where it passes through the Tokara Strait. Samplings for nitrate concentrations and measurements of turbulent diffusivity were conducted at 14 stations along two transects across the Kuroshio Current (Fig. 1a) during cruises of the T/S Kagoshima-maru in November 2015.
The nitrate profiles were measured with a nitrate sensor (Deep SUNA V2) attached to an SBE 911plus conductivity–temperature–depth (CTD) system (Sea-Bird Electronics). Turbulent diffusivity was estimated from microstructure measurements made with a microstructure profiler (TurboMAP-L, JFE Advantech Co., Ltd.) and the equations of Osborn (1980). The profiler was deployed immediately after each CTD cast at the same station. The nitrate sensor was calibrated with measured nitrate concentrations (Fig. S1 in the Supplement). Because the precision of the nitrate sensor in this study was 0.37 mmol m−3 (estimated by D. Hasegawa et al., 2019), if we had calculated the vertical nitrate gradient from the raw data, then the noise level would have been too high to resolve the normal background nitrate stratification of O (10−1 mmol m−4). We therefore needed to average the sensor data vertically to reduce the level of noise. The bin-averaged vertical gradient of the sensor data can be written as follows:
where Cs is the nitrate concentration reported by the sensor, Cr is the real concentration, is the average vertical deployment speed of the sensor, f is the sampling frequency, and Δz is the average bin size. In this study f=1 Hz and m s−1. The second term on the right side of Eq. (1) indicates the expected precision of the bin-averaged vertical gradient of nitrate (see the detailed discussions in D. Hasegawa et al., 2019). In this study, we set Δz=10 m to resolve the likely vertical gradient with an expected imprecision of O (10−2 mmol m−4).
A total of 16 nitrate and turbulent diffusivity profiles were averaged at the stations that were studied during the KG1515 cruise of the T/S Kagoshima-maru across the Kuroshio path. The profiles of the gradients of the averaged nitrate concentrations and averaged turbulent diffusivity were then multiplied at each depth to calculate the average turbulent nitrate fluxes. Both parameters were binned and averaged within 10 m intervals. The vertical gradient of the averaged nitrate profile () and the averaged vertical diffusivity (Kz) were then multiplied at each depth (z) to estimate the area-averaged vertical turbulent nitrate flux () as follows:
In recent years, there has been a lively discussion about the importance of the diapycnal advective flux associated with the diffusive flux (e.g., Du et al., 2017). However, in the present study, we assumed that the important nutrient flux was the flux across the base of the euphotic zone, not the flux through the pycnocline, which can be broken down by turbulent mixing. In addition, because our study area included frontal regions, unlike the South China Sea where the Kuroshio flows over seamounts, density fluctuations could have been caused not only by turbulent mixing but also by advection and the movement of fronts. Accordingly, we focused our analysis on the vertical turbulent nutrient flux using Cartesian coordinates rather than on the diapycnal flux using isopycnal coordinates.
Table 1Location and environmental conditions at the stations in the ECS-Kuroshio where gradient enrichment (EXPa) and dilution experiments (EXPb) were conducted. Depth: sampling depth (m) of water samples for each experiment. WT: mean water temperature during the experiments (∘C). NUTso: nutrient concentrations (µmol L−1) at the beginning of each experiment. CHLo: chlorophyll a concentration (µgCHL L−1) at the beginning of the experiments. MiZo: microheterotroph standing stock at the beginning of each experiment (µgC L−1). DL: below the detection limit.
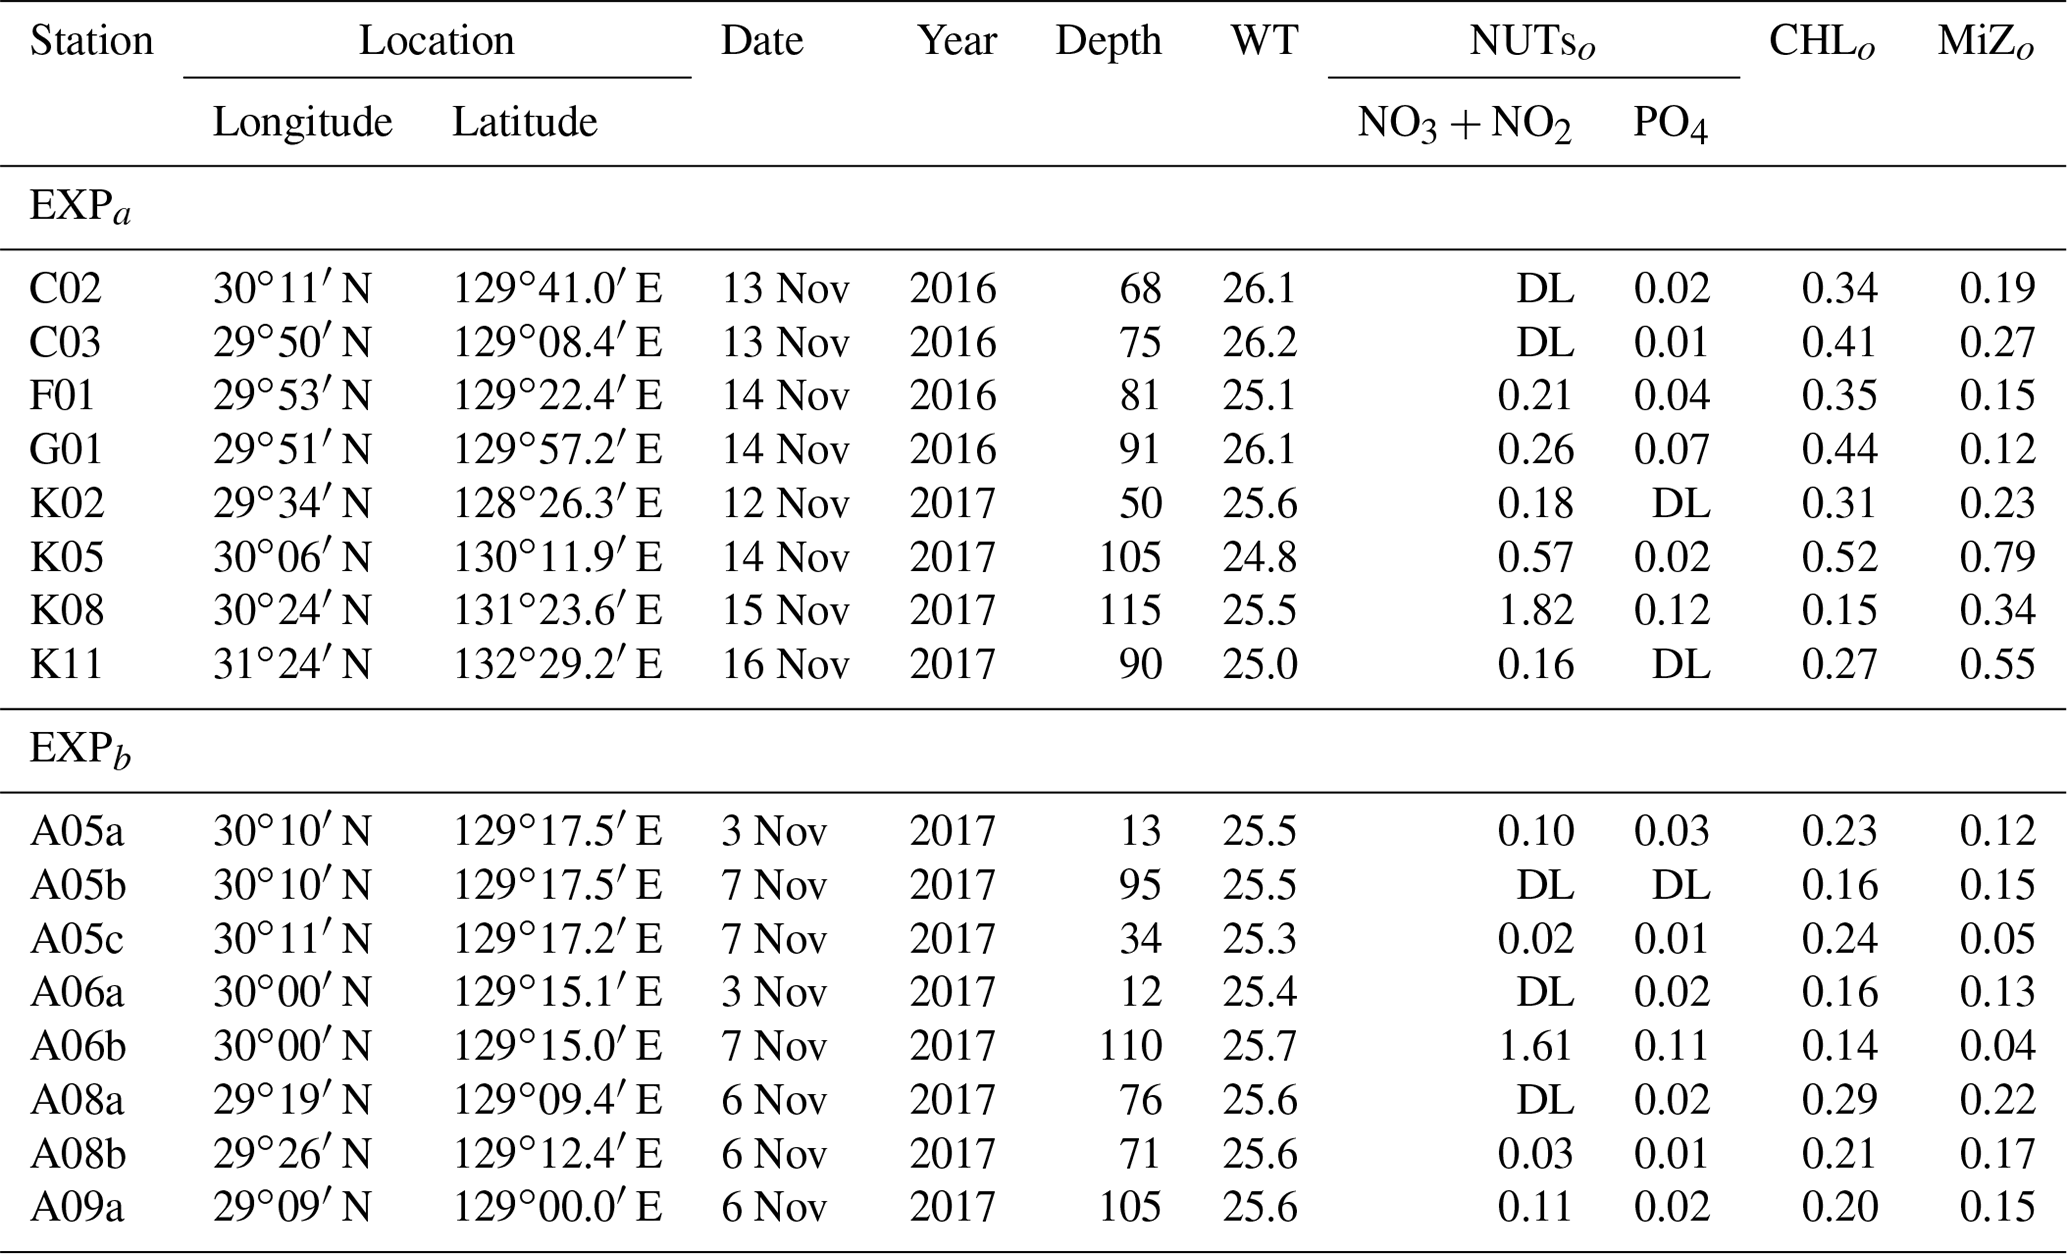
We performed two different types of bottle incubations. For phytoplankton and microheterotrophs, growth rates in response to in situ nitrate fluxes induced by turbulent mixing were estimated using bottle incubations with nutrient gradients (EXPa) at eight stations in November 2016 and November 2017. To estimate microzooplankton grazing rates on phytoplankton, dilution experiments (EXPb) following the methodology of Landry and Hasset (1982) were performed at eight stations in November 2017 (Fig. 1b, Table 1).
2.2 Experimental setup
Seawater samples for all experiments were obtained using 2.5 L Niskin-X bottles attached to a CTD profiler and carousel multisampling system (CTD-CMS: SBE 911plus, Sea-Bird Electronics). The samples were transferred by gravity filtration using a silicon tube with a nylon filter (0.1 mm mesh opening) into the incubation bottles for EXPa and EXPb.
The EXPa experiment was performed using duplicate 2.3 L polycarbonate bottles without added nutrients and with a mixture of nitrate (NaNO3) and phosphate (KH2PO4) in an atomic N:P ratio of 15:1. The nitrate concentrations were either 0 (control), 0.05, 0.15, 0.5, 0.75, 1.5, or 5 µmol L−1. If the turbulent nitrate influx at the subsurface chlorophyll maximum observed in the Tokara Strait (O: 0.788 mmol m−2 d−1; see Results) were continued for 5.3 d while the Kuroshio Current (0.33 m s−1, Zhu et al., 2017) passed through the Tokara Strait (150 km), then the phytoplankton in a 10 m thick layer could have consumed nitrate equivalent to a nitrate enrichment of 0.41 µmol L−1.
The EXPb experiment was conducted using triplicate 1.2 L polycarbonate bottles with microzooplankton as grazers and involved dilutions of the microzooplankton standing stocks in the original water samples so that the concentrations of microzooplankton equaled 1, 0.6, 0.3, or 0.1 times the concentration in the undiluted water. These treatment bottles were enriched with 3 µmol L−1 nitrate (NaNO3) and 0.2 µmol L−1 phosphate (KH2PO4) to promote phytoplankton growth. In addition, to evaluate nutrient limitation of phytoplankton growth, extra triplicate undiluted bottles were incubated without nutrient amendments.
All incubation bottles were soaked in 10 % HCl and rinsed with surface seawater at each station before use (Landry et al., 1995). All experimental bottles were incubated for 72 h for EXPa and 24 h for EXPb in a water bath with running surface seawater for temperature control and were covered by nylon mesh screening (i.e., screening with 5 mm openings) to reduce irradiance to 75 % of the surface irradiance. Phytoplankton growth in the incubation bottles might have been an overestimate of in situ growth because subsurface irradiance was lower than the irradiance in the incubation bottles.
2.3 Sample analysis
Chlorophyll a concentrations were determined at the beginning and end of the EXPa and EXPb incubations. Subsamples of 500–1000 mL were filtered through a nylon mesh (11 µm mesh opening: Millipore NY1104700) and a glass fiber filter (2 µm: Whatman GM / F; 0.7 µm: Whatman GF / F) for EXPa and through a glass fiber filter (GF / F) for EXPb at a pressure less than 20 kPa. Photosynthetic pigments were extracted overnight in N,N-dimethylformamide at −20 ∘C in the dark, and the chlorophyll a concentrations were determined with a fluorometer (Turner Designs 10AU or TD700). Size fractions were defined as pico for chlorophyll in phytoplankton smaller than 2 µm, nano for chlorophyll in phytoplankton between 2 and 11 µm in size, and micro for chlorophyll in phytoplankton larger than 11 µm.
Microsized heterotrophs in the incubation bottles at the beginning of EXPa and EXPb were examined. Subsamples of 500 mL were collected and fixed with 3 % acid Lugol's solution. We identified and counted three taxonomic groups of the microheterotroph community (naked ciliates, tintinnids, and copepod nauplii) with an inverted microscope (Leica Leitz DMRD). Some marine planktonic ciliates and flagellates are known to be mixotrophs (Gaines and Elbrächter, 1987), but we assumed naked ciliates and tintinnids to be heterotrophic in the present study. The sizes of cells or of individuals were measured, the biovolume was computed based on geometric shape, and the carbon content was estimated using conversion equations (Put and Stoecker, 1989; Verity and Langdon, 1984; Parsons et al., 1984).
Table 2Phytoplankton growth rate (d−1) derived from the gradient-enrichment experiments (EXPa) in the ECS-Kuroshio. Enriched nitrate concentrations (µmol L−1) are shown at the top of each column. A and B: duplicate bottles. Pico: chlorophyll smaller than 2 µm. Nano: chlorophyll between 2 and 11 µm. Micro: chlorophyll larger than 11 µm.
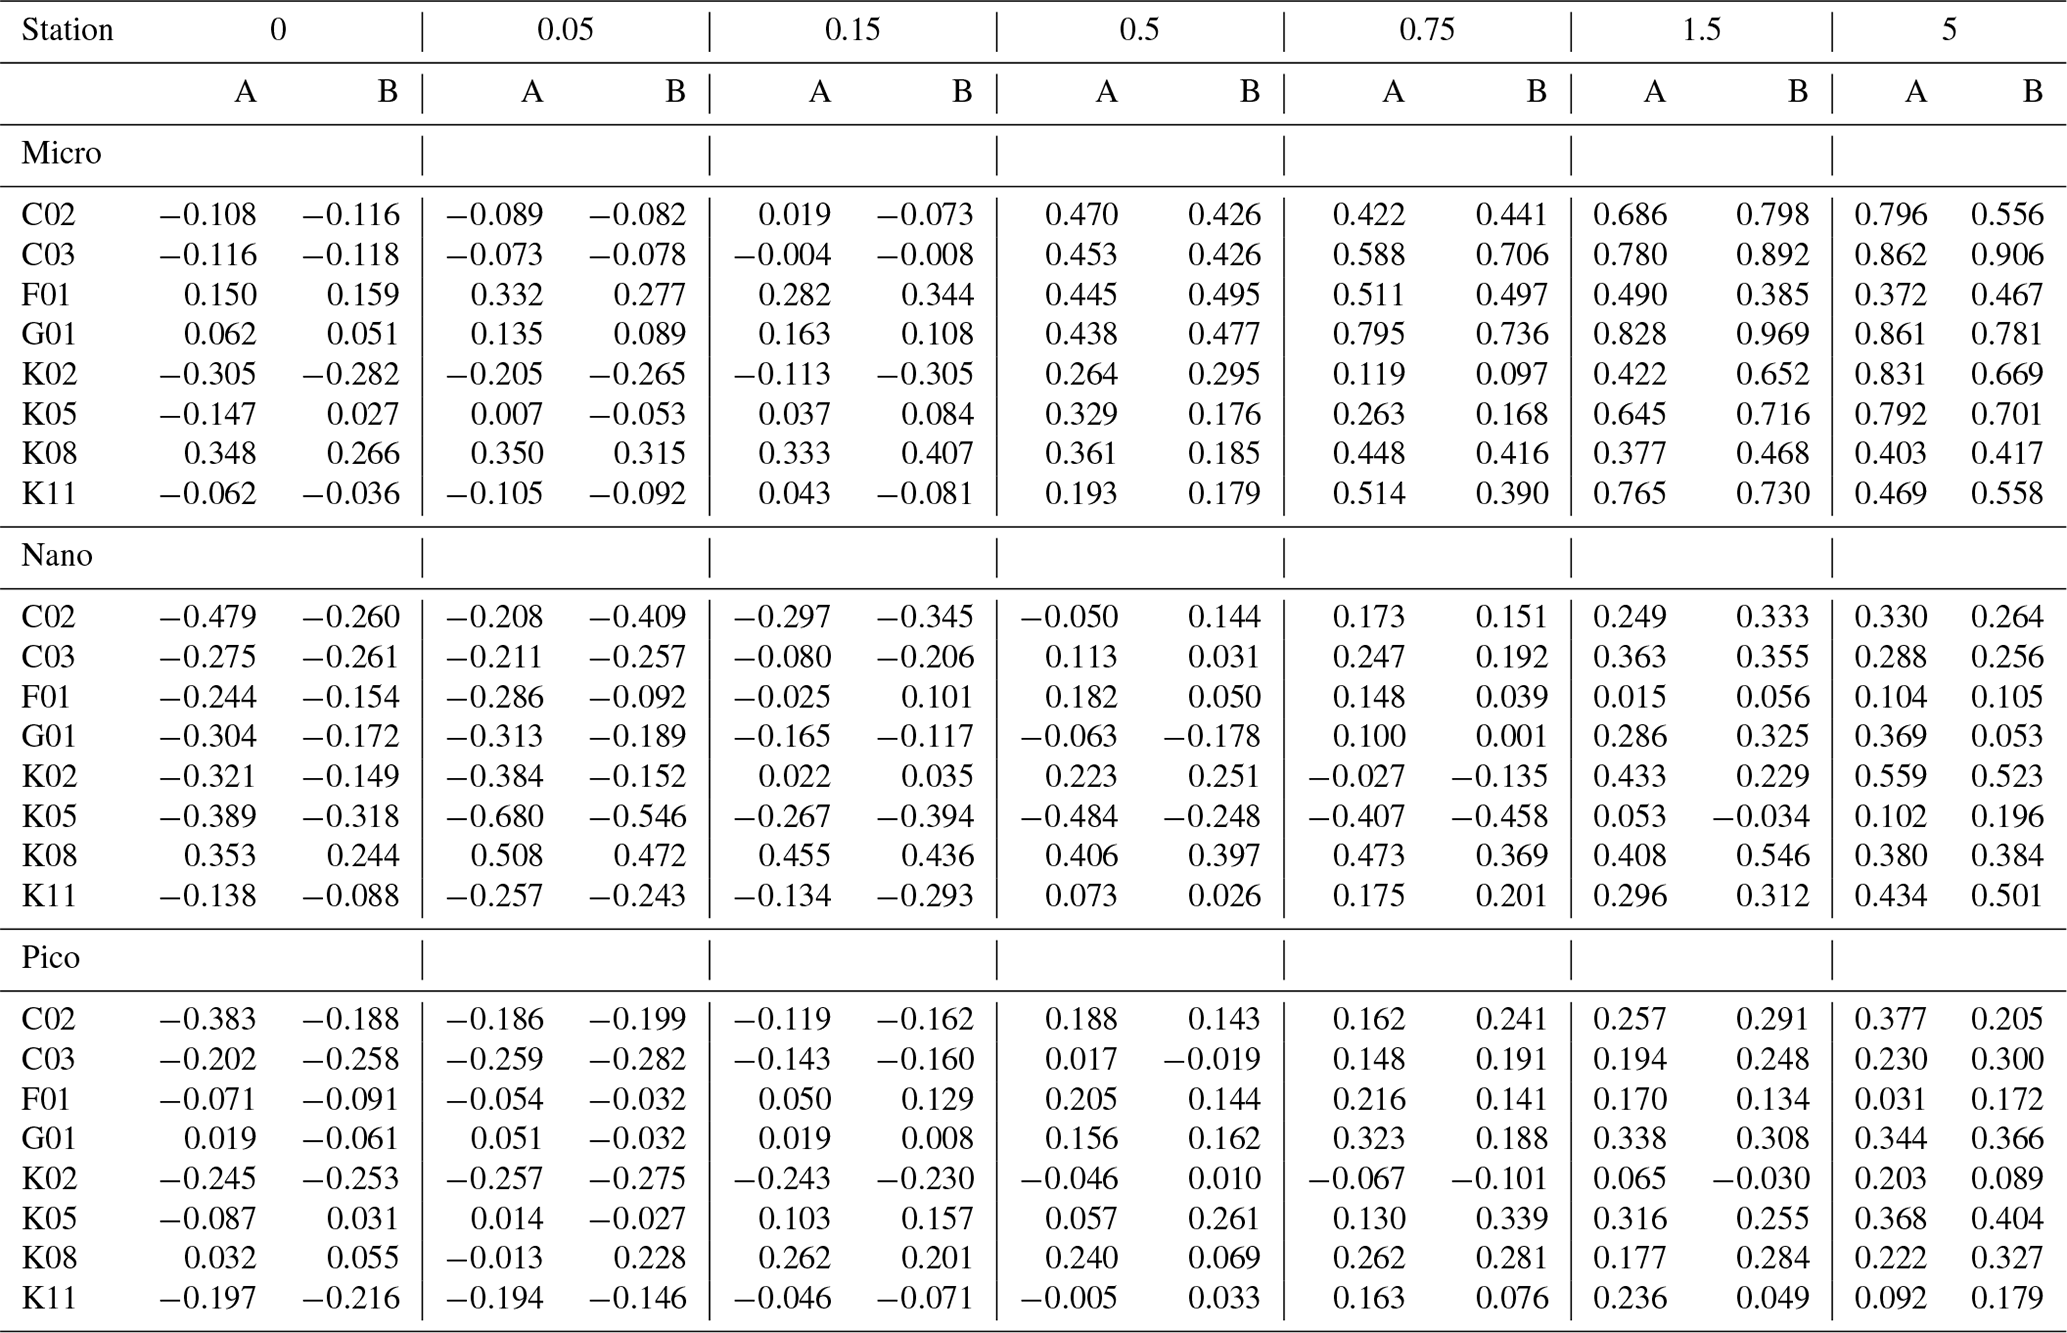
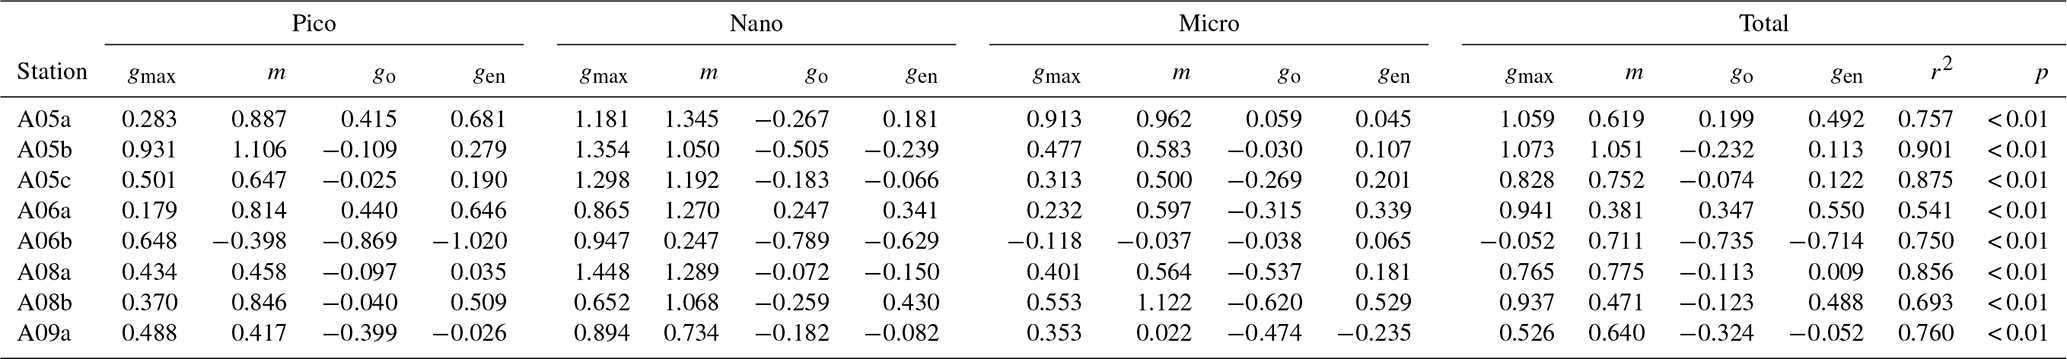
Table 3Parameters derived from the dilution experiments (EXPb) in the ECS-Kuroshio. gmax: maximum growth rate (d−1). m: mortality rate by microzooplankton grazing (d−1). go: net growth rate measured in the nonenriched and nondiluted bottles (d−1). gen: net growth rate measured in the enriched and nondiluted bottles (d−1). r2: coefficient of determination defined from the linear regression of the apparent growth rate of total chlorophyll a concentrations against dilution factors. p: p value. Pico: chlorophyll smaller than 2 µm. Nano: chlorophyll between 2 and 11 µm. Micro: chlorophyll larger than 11 µm. Total: total chlorophyll from pico to micro.
2.4 Rate calculations
Apparent growth rates (g: d−1) in the incubation bottles of EXPa and EXPb were calculated from size-fractionated chlorophyll a concentrations (µg L−1) or standing stocks (µg C L−1) of microheterotroph groups identified at the beginning (Co) and end (Ct) of the incubations period (t: d):
where Ct in the incubation bottles of EXPb can be calculated using the following equation (Landry et al., 1995):
where gmax and m are the maximum growth rate of size-fractionated phytoplankton (d−1) and their mortality rate by microzooplankton grazing (d−1), respectively. The maximum growth rate (gmax) and mortality rate were determined with a linear regression of the apparent growth rate (g) against dilution factors (X):
where m is the mortality rate in the undiluted water (X=1). All parameters derived from EXPa and EXPb are listed in Tables 2 and 3.
2.5 Data analysis
To quantify the sensitivity of phytoplankton growth rates to nutrient supply rates, we calculated the slopes of linear regressions of growth rates for the size-fractionated chlorophyll a concentrations versus the logarithms of the enriched nitrate concentrations. We then computed the Pearson correlation coefficient of these slopes to nitrate plus nitrite and phosphate concentrations and microzooplankton biomass at the beginning of each incubation. A one-way analysis of variance (ANOVA) with a post hoc Tukey honestly significant difference test was used to compare maximum growth rates, mortality rates, and net growth rates among the three size fractions.
3.1 Oceanographic observations
Turbulent diffusivity and nitrate concentrations were measured in order to estimate the vertical turbulent nitrate flux along the transects across the Kuroshio Current in the Tokara Strait, where a shallow ridge lies in the path of the Kuroshio. We obtained 16 pairs of vertical profiles of turbulent diffusivity and nitrate concentrations and estimated the averages and 95 % confidence intervals of the vertical profiles. The averaged chlorophyll a profile (Fig. 2a), which was recorded with a light-emitting diode fluorometer on a TurboMAP-L profiler, revealed a subsurface chlorophyll maximum (SCM) at 60 m, which was almost coincident with a sharp increase in the nitrate concentration (i.e., the top of the nitracline). Vertical diffusivity of O (10−4 m2 s−1, Fig. 2b) was higher at 70 m than at depths of 80–130 m. Just below the SCM peak, relatively high nitrate concentrations and vertical diffusivity induced vertical turbulent nitrate fluxes of O (1 mmol m−2 d−1, Fig. 2c).
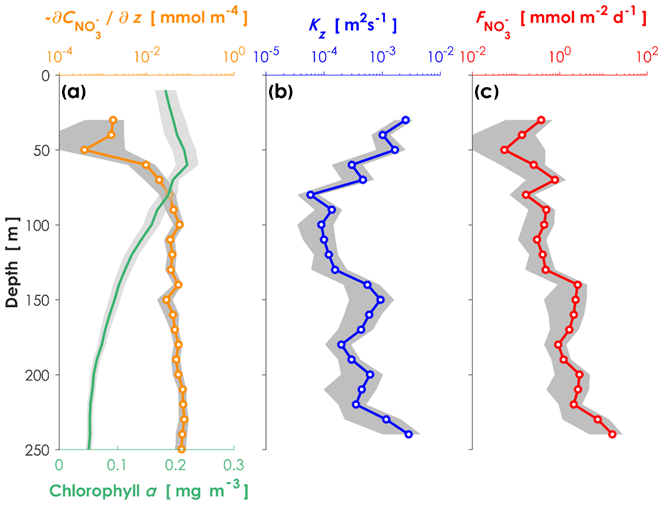
Figure 2Vertical profiles of environmental conditions in the Kuroshio Current. (a) Nitrate gradient curve (orange) and chlorophyll a concentrations (green) measured with a nitrate sensor (Deep SUNA V2) attached to an SBE 911plus CTD system. (b) Turbulent diffusivity measured with a TurboMAP-L (blue). (c) Calculated turbulent nitrate fluxes (red) in the ECS-Kuroshio. The shaded areas are the 95 % confidence intervals obtained by a bootstrap process.
3.2 Gradient-enrichment experiments (EXPa)
To evaluate how the turbulent nitrate fluxes measured in the Tokara Strait increased the standing stocks of phytoplankton and microheterotrophs in the Kuroshio, we conducted bottle incubations of the phytoplankton and microheterotroph communities enriched with different nutrient concentrations (EXPa). The total chlorophyll a concentrations at the beginning of EXPa averaged among the duplicate samples ranged from 0.15 to 0.52 µg L−1 (Table 1). The picofractions and nanofractions accounted for more than 80 % of the total chlorophyll a (Fig. 3a). All size-fractionated chlorophyll a declined or changed little toward the end of the incubations at nitrate enrichments < 0.15 µmol L−1, but it increased at enrichments > 0.5 µmol L−1.
At the beginning of the incubations, microheterotroph standing stocks averaged among the duplicate samples ranged from 0.12 to 0.79 µg C L−1 (Table 1). Naked ciliates accounted for 51 %–96 % of the microheterotrophic biomass in terms of carbon at the beginning of the incubations. Copepod nauplii were the second greatest contributor to the microheterotroph biomass because of their low abundance but large individual body mass; tintinnid ciliates were a minor component of the microheterotroph biomass. The standing stocks of all taxonomic groups in the microheterotroph category increased with increasing nitrate enrichment (Fig. 3b), but the patterns of increase in response to nutrient enrichment were less clear than was the case for the size-fractionated chlorophyll a concentrations.
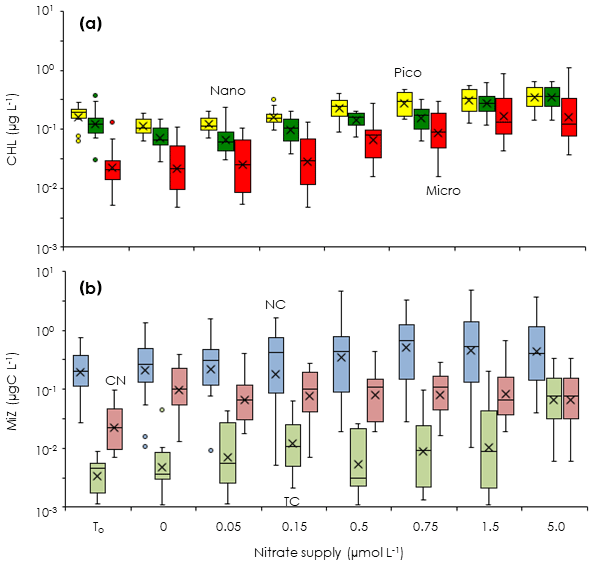
Figure 3Changes in phytoplankton and microsized heterotroph standing stocks during the gradient-enrichment experiments (EXPa). (a) Size-fractionated chlorophyll a concentrations (CHL). (b) Microheterotroph standing stocks (MiZ). To: at the beginning of the gradient-enrichment experiments. 0: no enrichment. 0.05 to 5.0 µmol L−1: enrichment. Box-and-whisker diagram at each nitrate concentration was compiled from the results conducted at the eight stations. Box represents first (bottom), second (bar), and third (top) quartiles, and cross marks are the average values. Whiskers indicate minimum and maximum values, and circles are outliers. Pico: chlorophyll smaller than 2 µm (yellow). Nano: chlorophyll between 2 and 11 µm (green). Micro: chlorophyll larger than 11 µm (red). NC: naked ciliates (light blue). TC: tintinnid ciliates (light green). CN: copepod nauplii (light pink).
Based on the changes of the standing stocks between the beginning and end of the incubations, we investigated the growth rates of the chlorophyll and microheterotrophs. The growth rates of all size-fractionated chlorophyll increased at higher concentrations of added nitrate (Fig. 4a). Growth rates were negative or close to zero for all size fractions at nitrate enrichments < 0.15 µmol L−1. However, the growth rates of the picosized and microsized chlorophyll were positive at nitrate enrichments > 0.5 µmol L−1, which were nearly equivalent to the concentrations associated with the turbulent nitrate fluxes observed in the Tokara Strait (see Sect. 2.2). Because microheterotroph growth rates varied among stations, the response of microheterotroph growth to the nutrient enrichments was ambiguous (Fig. 4b). Growth rates were positive for copepod nauplii at all nitrate enrichments and were higher for naked and tintinnid ciliates at higher nitrate enrichments. Thus, the standing stocks of phytoplankton and microheterotrophs were likely increased by additions of nitrate within the range of fluxes measured in the Tokara Strait.

Figure 4Changes in phytoplankton and microsized heterotroph growth rates in response to nitrate enrichments in the gradient-enrichment experiments (EXPa). (a) Growth rates (g: d−1) of size-fractionated chlorophyll. (b) Microheterotroph growth rates (g: d−1). 0: no enrichment. 0.05 to 5.0 µmol L−1: enrichment. Box-and-whisker diagram at each nitrate concentration is based on the results conducted at the eight stations. The symbols have the same meaning as in Fig. 3.
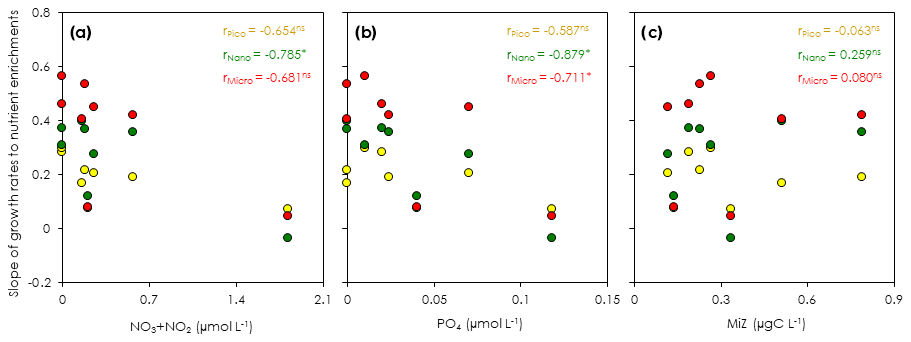
Figure 5Correlation of the regression slopes of phytoplankton growth rates to nutrient concentrations and microsized heterotroph biomass at the beginning of the gradient-enrichment experiments (EXPa). (a) Regression slopes of the size-fractionated phytoplankton growth versus the concentrations of nitrate (NO3) plus nitrite (NO2). (b) Regression slopes of the size-fractionated phytoplankton growth versus the phosphate concentrations (PO4). (c) Regression slopes of the size-fractionated phytoplankton growth versus the microheterotroph biomass (MiZ). r: Pearson correlation coefficient. Pico: chlorophyll smaller than 2 µm. Nano: chlorophyll between 2 and 11 µm. Micro: chlorophyll larger than 11 µm. *: p < 0.05. ns: not significant.
The slope of a linear regression of the growth rates of the size-fractionated chlorophyll and the logarithms of the nitrate enrichments for each incubation provided a metric of the sensitivity of phytoplankton growth rates to nutrient supplies. The steeper slopes at some stations in the upstream Kuroshio in the Tokara Strait compared to the slopes at other stations (Fig. S2) suggested that the apparent phytoplankton growth rates varied with nutrient concentrations or predatory impacts at the beginning of the incubations. To determine whether growth rates of the size-fractionated chlorophyll might have varied with initial nutrient concentrations (bottom-up control) or predator biomasses (top-down control) at the beginning of the experiments, we compared the slopes to the nitrate plus nitrite concentrations (Fig. 5a), phosphate concentrations (Fig. 5b), and microheterotroph biomasses (Fig. 5c) in the ambient seawater without enrichment. No significant correlation was found between the microheterotrophic biomass and the rate of change of any size-fractionated chlorophyll. In contrast, the fact that there was a negative correlation between the slopes for all size fractions and the nitrate plus nitrite or phosphate concentrations indicated that the stimulation of the phytoplankton growth rates by nutrients was greater for all chlorophyll size fractions under more oligotrophic conditions. Thus, the variations of phytoplankton growth rates were likely associated with nutrient concentrations at the beginning of the incubations.
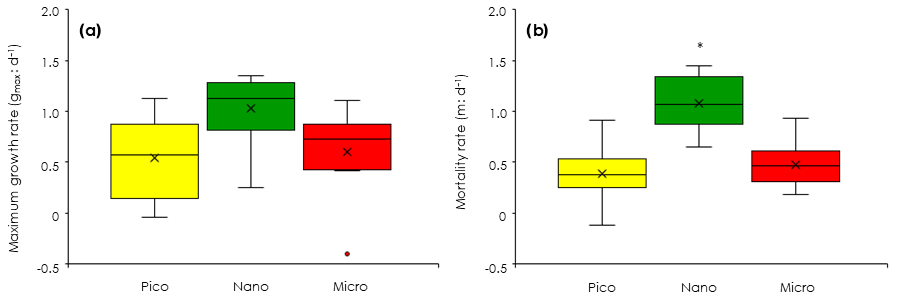
Figure 6Comparisons of phytoplankton growth and mortality rates among the three size-fractionated chlorophyll derived from the dilution experiments (EXPb). (a) Maximum growth rates (gmax). (b) Mortality rates by microzooplankton grazing (m). Box-and-whisker diagram at each nitrate concentration was compiled from the results conducted at the eight stations. Box represents first (bottom), second (bar) and third (top) quartiles, and cross marks are the average values. Whiskers indicate minimum and maximum values, and circles are outliers. Asterisk means significant difference among the three size fractions (ANOVA + Tukey, p < 0.05). Pico: chlorophyll smaller than 2 µm. Nano: chlorophyll between 2 and 11 µm. Micro: chlorophyll larger than 11 µm.
3.3 Dilution experiments (EXPb)
To evaluate how much each size-fractionated phytoplankton population was removed by microzooplankton grazing, we conducted dilution experiments concurrently with the gradient-enrichment experiments. The maximum growth rates (i.e., the intercepts of the regressions corresponding to X=0 in Eq. 5) were relatively high for the nanochlorophyll (Fig. 6a), but the differences were insignificant among the three size fractions (ANOVA, p > 0.05). These results indicated that the growth potential in the absence of microzooplankton grazing was similar for the nanosized chlorophyll compared with the picofractions and microfractions. In contrast, the slopes of the regressions are the mortality rates due to microzooplankton grazing, and the fact that they were significantly higher for the nanochlorophyll versus the picochlorophyll and microchlorophyll (ANOVA + Tukey, p < 0.05) indicated that the microzooplankton preferentially grazed on the nanochlorophyll.
To evaluate the impact of microzooplankton grazing on phytoplankton growth, we compared three different net growth rates: the observed net growth rates without enrichment (go), the net growth rates with enrichment (gen) in the undiluted bottles, and the net growth rates () estimated by subtracting the mortality rate (m) from the maximum growth rates (gmax). For all size-fractionated chlorophyll, the fact that go was lower than gen (Fig. 7) indicated that net growth rates were limited by nutrients. The values of gen and were comparable; i.e., there was no significant difference between the two (Welch's t test). These results implied that the gen of all size-fractionated chlorophyll could balance microzooplankton grazing mortality by growing at the maximum rate. In the case of the nanochlorophyll, the net growth rates were a bit low because the mortality rates due to microzooplankton grazing exceeded the maximum growth rates.

Figure 7Comparisons of phytoplankton net growth derived from the dilution experiments (EXPb) among the three different methods. go: observed net growth rates without enrichment in the nondiluted bottles. gen: observed net growth rates with enrichment in the nondiluted bottles. : estimated net growth rates subtracting the mortality rates (m) from the maximum growth rates (gmax). Box-and-whisker diagram at each nitrate concentration was compiled from the results conducted at the eight stations. Asterisk means significant difference between go and gen (Welch's t test, p < 0.05). The symbols have the same meaning as in Fig. 6.
The Kuroshio Current impinges on numerous shallow ridges with small islands and seamounts in the Tokara Strait. Several studies have pointed out that those steep topographic features stir and modify the water column through upwelling (Hasegawa et al., 2004, 2008) and turbulent mixing (Tsutsumi et al., 2017; Nagai et al., 2017). Compared with the turbulent nitrate fluxes reported in previous studies, the fluxes observed in the Tokara Strait were 1 order of magnitude higher than those reported in the Kuroshio Extension front (Kaneko et al., 2012, 2013; Nagai et al., 2017), which is greater than those at other oceanic sites, and equivalent to those at coastal sites (Cyr et al., 2015). The turbulent nitrate flux in the downstream Kuroshio Current near the Tokara Strait is similar in magnitude to our estimates (Nagai et al., 2019b). Because the Kuroshio Current runs steadily through the Tokara Strait, this nutrient supply induced by turbulent diffusivity is considered to be one of the mechanisms that enhance phytoplankton productivity, even under oligotrophic conditions in the Kuroshio Current.
Despite the large turbulent nitrate flux (O: 1 mmol m−2 d−1), the chlorophyll a concentrations in the area of the Tokara Strait impacted by the Kuroshio Current were as low as the values reported from nearby areas of the Kuroshio (Kobari et al., 2018, 2019) and oceanic sites in the North Pacific Ocean (Calbet and Landry, 2004). Based on the gradient-enrichment experiments, standing stocks and the growth rates of all size-fractionated phytoplankton increased at nitrate enrichments above 0.5 µmol L−1, which were equivalent to the concentrations produced by the observed turbulent nitrate flux. These results suggest that phytoplankton standing stocks and growth rates are stimulated by the magnitude of the observed turbulent nitrate flux.
In global comparisons, microzooplankton grazing has a significant impact on phytoplankton, particularly at oceanic sites (Calbet and Landry, 2004). Microzooplankton standing stocks in the Kuroshio Current as it passes through the Tokara Strait are lower than those on the continental shelf of the ECS (Chen et al., 2003) and might be removed by mesozooplankton predation (Kobari et al., 2019). The low microzooplankton standing stocks in the Kuroshio Current imply low microzooplankton grazing on phytoplankton. However, the dilution experiments demonstrated that phytoplankton mortality by microzooplankton grazing was high and equivalent to 41 %–122 % of the maximum growth rates of the phytoplankton, based on the ratio of the mortality rate to the maximum growth rates of total chlorophyll a (Table 2). Indeed, phytoplankton could likely balance microzooplankton grazing mortality by growing at maximum rates, particularly in the case of the nanophytoplankton (Fig. 7). These results from concurrently conducted experiments suggested that phytoplankton standing stocks are stimulated by turbulent nitrate fluxes and are then quickly removed by microzooplankton grazing, particularly in the case of nanophytoplankton. Taking into account the size range of prey for ciliates (Pierce and Turner, 1992) and copepod nauplii (Uye and Kasahara, 1983), microzooplankton grazing could be a major reason why phytoplankton do not attain high growth rates and standing stocks, even when their growth potential is high and they are sensitive to nutrient enrichments. The rapid transfer of the elevated phytoplankton production to microzooplankton might thus be a possible explanation for the low chlorophyll concentrations, even when there are large turbulent nitrate fluxes in the Kuroshio Current.
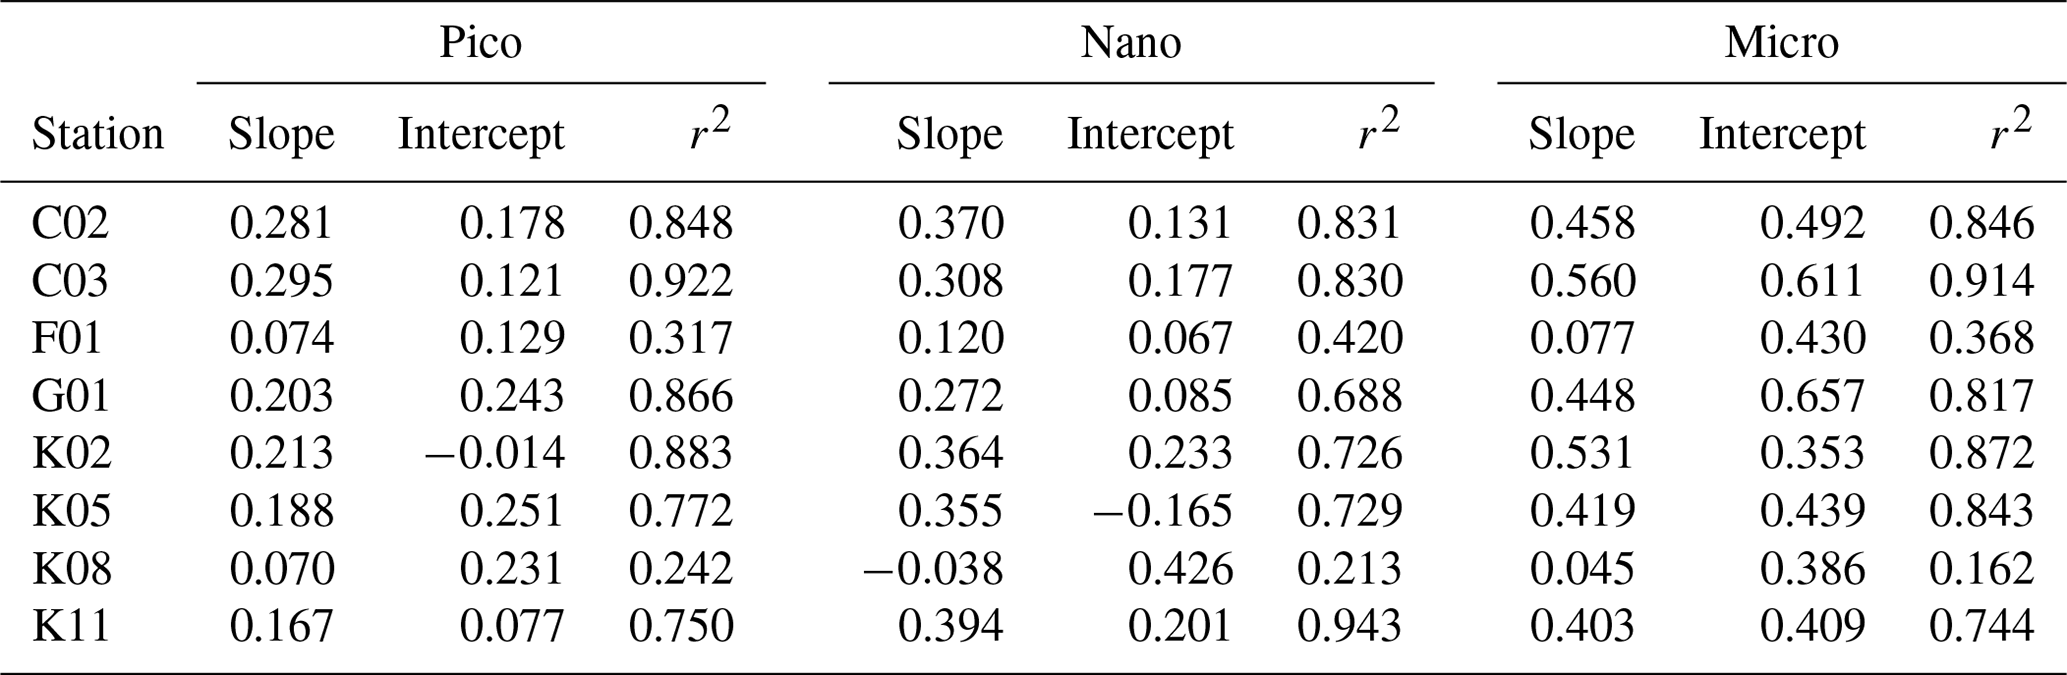
Table 4Parameters derived from relationship of phytoplankton growth rates against logarithmically transformed concentrations of enriched nitrate in the gradient-enrichment experiments (EXPa). Slope: sensitivity of phytoplankton growth rate to logarithmically transformed concentrations of enriched nitrate. Intercept: growth potential at the low nitrate concentration. r2: coefficient of determination defined from the linear regression of growth rate of size-fractionated chlorophyll a concentrations against logarithmically transformed concentrations of enriched nitrate. Pico: chlorophyll smaller than 2 µm. Nano: chlorophyll between 2 and 11 µm. Micro: chlorophyll larger than 11 µm.
The standing stocks and growth rates of all microheterotrophs were relatively high in the higher nitrate enrichments, but the patterns of increase were less clear than in the case of the phytoplankton. This difference was probably due to the large variations in the microheterotroph standing stocks among stations (Table 1) and slower growth than phytoplankton. Indeed, the lack of clarity of this pattern was remarkable for the copepod nauplii because of their relatively slow growth rates, lower abundance in the bottles, and larger individual body masses. In contrast, intraguild predation within microheterotroph communities might be another explanation for the ambiguous pattern of their standing stocks and growth rates. The growth rates of copepod nauplii were always higher than those of naked ciliates, especially when there was no or little nitrate supplied. The ratio of mean equivalent spherical diameter of body mass for copepod nauplii (88 µm) and naked ciliates (16 µm) was estimated to be 5:1, which is much different from a typical predator–prey mass ratio (i.e., 18:1, Hansen et al., 1994). Thus, it is unlikely that intraguild predation of copepod nauplii on naked ciliates would happen in the bottles. More importantly to the ambiguous pattern of the growth of the microheterotrophs, the results from the concurrently conducted experiments implied that phytoplankton productivity was stimulated by the turbulent nitrate flux and the phytoplankton rapidly grazed by microzooplankton, but standing stocks and growth rates of microheterotrophs were not elevated during 3 d in the Kuroshio Current. An increase in microheterotroph standing stocks and their trophic transfer to mesozooplankton might have been apparent further downstream in the Kuroshio Current.
There is increasing evidence that turbulence-induced nutrient fluxes promote phytoplankton growth in the open ocean (Kaneko et al., 2013; Nagai et al., 2017, 2019b). However, there is no experimental documentation for a response of the phytoplankton community to this nutrient supply or of subsequent trophic transfer in a planktonic food web. In the tropical and subtropical oceans, microzooplankton grazing has been thought to be a major source of phytoplankton mortality and has been shown to account for more than 75 % of phytoplankton daily growth (Calbet and Landry, 2004). Furthermore, strong trophic linkages are well known between microbes and metazoans through microzooplankton (Calbet and Landry, 1999; Calbet et al., 2001; Calbet and Saiz, 2005; Kobari et al., 2010). Our study has provided the first experimental evidence that phytoplankton standing stocks and growth rates are stimulated by turbulent nutrient fluxes and are rapidly grazed by microzooplankton. These results imply that biological productivity may be underestimated because of the apparently low nutrient concentrations and low phytoplankton biomass in the Kuroshio. Because of the strong turbulence amplified by the Kuroshio Current, phytoplankton productivity stimulated by nutrient fluxes and rapid trophic transfer to microzooplankton are likely to happen in the Tokara Strait and downstream. We therefore propose that undocumented biological productivity in the Kuroshio is sustained by these rapid and systematic trophodynamics. Such undocumented biological production, elevated by the rapid and systematic trophodynamics, may provide a good supply of food for the vulnerable stages of foraging fishes around the Kuroshio and thus explain part of the Kuroshio Paradox.
Data used in this paper are available at https://doi.org/10.6084/m9.figshare.12198486 (Kobari, 2020).
The supplement related to this article is available online at: https://doi.org/10.5194/bg-17-2441-2020-supplement.
ToK, DH, and NY conceived and designed the oceanographic observations and experiments. DH, HN, AN, ET, TM, and TN performed the oceanographic observations and turbulence measurements. ToK, TH, TaK, and FK performed the onboard experiments. ToK, TH, TaK, FK, NY, and KS analyzed the samples and data of the onboard experiments. DH and TT analyzed the data of oceanographic observations and turbulence measurements. ToK, GK, HN, and XG organized the research cruises.
The authors declare that they have no conflict of interest.
We thank the captains and crew of the T/S Kagoshima-maru for their help in oceanographic observations and sample collections.
This research has been supported by the Japan Society for the Promotion of Science (grant nos. 17K00522, 18H04920, and 15H05817) and the Ministry of Education, Culture, Sports, Science, and Technology in Japan (the Study of Kuroshio Ecosystem Dynamics for Sustainable Fisheries) (grant no. JPMXD0511102330).
This paper was edited by Minhan Dai and reviewed by Zhiyu Liu, Chih-hao Hsieh, and Naomi Harada.
Bower, J. R., Nakamura, Y., Mori, K., Yamamoto, J., Isoda, Y., and Sakurai, Y.: Distribution of Todarodes pacificus (Cephalopoda: Ommastrephidae) paralarvae near the Kuroshio off southern Kyushu, Japan, Mar. Biol., 135, 99–106, 1999.
Calbet, A. and Landry, M. R.: Mesozooplankton influences on the microbial food web: Direct and indirect trophic interactions in the oligotrophic open-ocean, Limnol. Oceanogr., 44, 1370–1380, 1999.
Calbet, A. and Landry, M. R.: Nunnery S. Bacteria-flagellate interactions in the microbial food web of the oligotrophic subtropical North Pacific, Aquat. Microb. Ecol., 23, 283–292, 2001.
Calbet, A. and Landry, M. R.: Phytoplankton growth, microzooplankton grazing, and carbon cycling in marine systems, Limnol. Oceanogr., 49, 51–57, 2004.
Calbet, A. and Saiz, E.: The ciliate-copepod link in marine ecosystems, Aquat. Microb. Ecol., 38, 157–167, 2005.
Chen, C. C., Shiah, F. K., Gong, G. C., and Chiang, K. P.: Planktonic community respiration in the East China Sea: importance of microbial consumption of organic carbon, Deep-Sea Res. Pt. II, 50, 1311–1325, 2003.
Cyr, F., Bourgault, D., and Galbraith, P. S.: Gosselin M. Turbulent nitrate fluxes in the Lower St. Lawrence Estuary, Canada, J. Geophys. Res., 120, 2308–2330, 2015.
Du, C., Liu, Z., Kao, S.-J., and Dai, M.: Diapycnal fluxes of nutrients in an oligotrophic oceanic regime: the South China Sea, Geophys. Res. Lett., 44, 11510–11518, 2017.
Endo, H. and Suzuki, K.: Spatial variations in community structure of haptophytes across the Kuroshio front in the Tokara Strait, in: Kuroshio Current, Physical, Biogeochemical and Ecosystem Dynamics, edited by: Nagai, T., Saito, H., Suzuki, K., and Takahashi, M., Geophysical Monograph 243, John Wiley & Sons, Hoboken, 207–221, 2019.
Gaines, G. and Elbrächter. M.: Heterotrophic nutrition, in: The biology of dinoflagellates, edited by: Taylor, F. J. R., Blackwell, Oxford, 224–268, 1987.
Guo, Y. J.: The Kuroshio, Part II. Primary production and phytoplankton, Oceanogr, Mar. Bio. Ann. Rev., 29, 155–189, 1991.
Hansen, B., Bjørnsen, P. K., and Hansen, P. J.: The size ratio between planktonic predators and their prey, Limnol. Oceanogr., 39, 395–403, 1994.
Hasegawa, D.: Island Mass Effect, in: Kuroshio Current, Physical, Biogeochemical and Ecosystem Dynamics, edited by: Nagai, T., Saito, H., Suzuki, K., and Takahashi, M., Geophysical Monograph 243, John Wiley & Sons, Hoboken, 163–174, 2019.
Hasegawa, D., Yamazaki, H., Lueck, R. G., and Seuront, L.: How islands stir and fertilize the upper ocean, Geophys. Res. Lett., 31, L16303, https://doi.org/10.1029/2004GL020143, 2004.
Hasegawa, D., Yamazaki, H., Ishimaru, T., Nagashima, H., and Koike, Y.: Apparent phytoplankton bloom due to island mass effect, J. Mar. Syst., 69, 238–246, 2008.
Hasegawa, D., Tanaka, T., Matsuno, T., Senjyu, T., Tsutsumi, E., Nakamura, H., Nishina, A., Kobari, T., Yoshie, N., Guo, X., Nagai, T., Okunishi, T., and Yasuda, I.: Measuring the vertical turbulent nitrate flux using sensors, Bull. Coast. Oceanogr., 57, 59–64, 2019.
Hasegawa, T., Kitajima S., and Kiyomoto Y.: Phytoplankton distribution in the Kuroshio region of the southern East China Sea in early spring, in: Kuroshio Current, Physical, Biogeochemical and Ecosystem Dynamics, edited by: Nagai, T., Saito, H., Suzuki, K., and Takahashi, M., Geophysical Monograph 243, John Wiley & Sons, Hoboken, 191–205, 2019.
Hirota, Y.: The Kuroshio, Part III. Zooplankton, Oceanogr. Mar. Biol., 33, 151–220, 1995.
Hu, D., Wu, L., Cai, W., Gupta, A. S., Ganachaud, A., Qiu, B., Gordon, A. L., Lin, X., Chen, Z., Hu, S., Wang, G., Wang, Q., Sprintall, J., Qu, T., Kashino, Y., Wang, F., William, S., and Kessler, W. S.: Pacific western boundary currents and their roles in climate, Nature, 522, 299–308, 2015.
Kaneko, H., Yasuda, I., Komatsu, K., and Itoh, S.: Observations of the structure of turbulent mixing across the Kuroshio, Geophys. Res. Lett., 39, L15602, https://doi.org/10.1029/2012GL052419, 2012.
Kaneko, H., Yasuda, I., Komatsu, K., and Itoh, S.: Observations of vertical turbulent nitrate flux across the Kuroshio, Geophys. Res. Lett., 40, 3123–3127, 2013.
Kobari, T.: Biogeosci17_Kobari.zip, Dataset, figshare, https://doi.org/10.6084/m9.figshare.12198486.v1, 2020.
Kobari, T., Mitsui, K., Ota, T., Ichinomiya, M., and Gomi, Y.: Response of heterotrophic bacteria to the spring phytoplankton bloom in the Oyashio region, Deep-Sea Res. Pt. II, 57, 1671–1678, 2010.
Kobari, T., Makihara, W., Kawafuchi, T., Sato, K., and Kume, G.: Geographic variability in taxonomic composition, standing stock, and productivity of the mesozooplankton community around the Kuroshio Current in the East China Sea, Fish. Oceanogr., 27, 336–350, 2018.
Kobari, T., Kobari, Y., Miyamoto, H., Okazaki, Y., Kume, G., Kondo, R., and Habano, A.: Variability in taxonomic composition, standing stock and productivity of the plankton community in the Kuroshio and its neighboring waters, in: Kuroshio Current, Physical, Biogeochemical and Ecosystem Dynamics, edited by: Nagai, T., Saito, H., Suzuki, K., and Takahashi, M., Geophysical Monograph 243, John Wiley & Sons, Hoboken, 223–243, 2019.
Komatsu, K. and Hiroe, Y.: Structure and impact of the Kuroshio nutrient stream, in: Kuroshio Current, Physical, Biogeochemical and Ecosystem Dynamics, edited by: Nagai, T., Saito, H., Suzuki, K., and Takahashi, M., Geophysical Monograph 243, John Wiley & Sons, Hoboken, 85–104, 2019.
Kuroda, H.: The Kuroshio-induced nutrient supply in the shelf and sloe region off the southern coast of Japan, in: Kuroshio Current, Physical, Biogeochemical and Ecosystem Dynamics, edited by: Nagai, T., Saito, H., Suzuki, K., and Takahashi, M., Geophysical Monograph 243, John Wiley & Sons, Hoboken, 137–146, 2019.
Landry, M. R. and Hasset, R. P.: Estimating the grazing impact of marine micro-zooplankton, Mar. Biol., 67, 283–288, 1982.
Landry, M. R., Kirshtein, J., and Constantinou, J.: A refined dilution technique for measuring the community grazing impact of microzooplankton with experimental tests in the central equatorial Pacific, Mar. Ecol.-Prog. Ser., 120, 53–63, 1995.
Nagai, T., Hasegawa, D., Tanaka, T., Nakamura, H., Tsutsumi, E., Inoue, R., and Yamashiro, T.: First evidence of coherent bands of strong turbulent layers associated with high-wavenumber internal-wave shear in the upstream Kuroshio, Sci. Rep., 7, 14555, https://doi.org/10.1038/s41598-017-15167-1, 2017.
Nagai, T., Clayton, S., and Uchiyama, Y.: Multiscale routes to supply nutrients through the Kuroshio nutrient stream, in: Kuroshio Current, Physical, Biogeochemical and Ecosystem Dynamics, edited by: Nagai, T., Saito, H., Suzuki, K., and Takahashi, M., Geophysical Monograph 243, John Wiley & Sons, Hoboken, 105–125, 2019a.
Nagai, T., Durán, G. S., Otero, D. A., Mori, Y., Yoshie, N., Ohgi, K., Hasegawa, D., Nishina, A., and Kobari, T.: How the Kuroshio Current delivers nutrients to sunlit layers on the continental shelves with aid of near-internal waves and turbulence, Geophys. Res. Lett., 46, 6726–6735, https://doi.org/10.1029/2019GL082680, 2019b.
Nakamura, H., Yamashiro, T., Nishina, A., and Ichikawa, H.: Time frequency variability of Kuroshio meanders in Tokara Strait, Geophys. Res. Lett., 33, L21605, https://doi.org/10.1029/2006GL027516, 2006.
Nakata, K. and Hidaka, K.: Decadal-scale variability in the Kuroshio marine ecosystem in winter, Fish. Oceanogr., 12, 234–244, 2003.
Nakata, K., Zenitani, H., and Inagake, D.: Differences in food availability for Japanese sardine larvae between the frontal region and the waters on the offshore side of Kuroshio, Fish. Oceanogr., 4, 68–79, 1995.
Osborn, T.: Estimates of the local rate of vertical diffusion from dissipation measurements, J. Phys. Oceanogr., 10, 83–89, 1980.
Parsons, T. R., Takahashi, M., an Hargrave, B.: Biological oceanographic processes, Pergamon Press, Oxford, 1984.
Pierce, R. W. and Turner, J. T.: Ecology of planktonic ciliates in marine food webs, Rev. Aquat. Sci., 6, 139–181, 1992.
Putt, M. and Stoecker, D. K.: An experimentally determined carbon:volume ration for marine “oligotrichous” ciliates from estuarine and coastal waters, Limnol. Oceanogr., 34, 1097–1103, 1989.
Qiu, B.: Kuroshio and Oyashio Currents, in: Encyclopedia of Ocean Sciences, edited by: Steele, J. H., Academic Press, New York, 358–369, 2001.
Saito, H.: The Kuroshio: its recognition, scientific activities and emerging issues, in: Kuroshio Current, Physical, Biogeochemical and Ecosystem Dynamics, edited by: Nagai, T., Saito, H., Suzuki, K., and Takahashi, M., Geophysical Monograph 243, John Wiley & Sons, Hoboken, 1–11, 2019.
Sassa, C. and Tsukamoto, Y.: Distribution and growth of Scomber japonicus and S. australasicus larvae in the southern East China Sea in response to oceanographic conditions, Mar. Ecol.-Prog. Ser., 419, 185–199, 2010.
Sassa, C., Tsukamoto, Y., Nishiuchi, K., and Konishi, Y.: Spawning ground and larval transport processes of jack mackerel Tranchurus japonicas in the shelf-break region of the southern East China Sea, Cont. Shelf. Res., 28, 2574–2583, 2008.
Tsutsumi, E., Matsuno, T., Lien, R. C., Nakamura, H., Senjyu, T., and Guo, X.: Turbulent mixing within the Kuroshio in the Tokara Strait, J. Geophys. Res.-Oceans, 122, 7082–7094, https://doi.org/10.1002/2017JC013049, 2017.
Uye, S. I. and Kasahara, S.: Grazing of various developmental stages of Pseudodiaptomus marinus (Copepoda: Calanoida) on naturally occurring particles, Bull. Plankton Soc. Japan, 30, 147–158, 1983.
Verity, P. G. and Langdon, C.: Relationships between lorica volume, carbon, nitrogen and ATP content of tintinnids in Narragansett Bay, J. Plankton Res., 6, 859–868, 1984.
Watanabe, Y., Zenitani, H., and Kimura, R.: Offshore expansion of spawning of the Japanese sardine, Sardinops melanostictus, and its implication for egg and larval survival, Can. J. Fish. Aquat. Sci., 53, 55–61, 1996.
Zhu, X. H., Nakamura, H., Dong, M., Nishina, A., and Yamashiro, T.: Tidal currents and Kuroshio transport variations in the Tokara Strait estimated from ferryboat ADCP data, J. Geophys. Res., 122, 2120–2142, 2017.