the Creative Commons Attribution 4.0 License.
the Creative Commons Attribution 4.0 License.
 | 03 Jul 2020
From fibrous plant residues to mineral-associated organic carbon – the fate of organic matter in Arctic permafrost soils
Sebastian Zubrzycki
Franz Buegger
Lena C. Zoor-Füllgraff
Gerrit Angst
Michael Dannenmann
Carsten W. Mueller
Permafrost-affected soils of the Arctic account for 70 % or 727 Pg of the soil organic carbon (C) stored in the northern circumpolar permafrost region and therefore play a major role in the global C cycle. Most studies on the budgeting of C storage and the quality of soil organic matter (OM; SOM) in the northern circumpolar region focus on bulk soils. Thus, although there is a plethora of assumptions regarding differences in terms of C turnover or stability, little knowledge is available on the mechanisms stabilizing organic C in Arctic soils besides impaired decomposition due to low temperatures. To gain such knowledge, we investigated soils from Samoylov Island in the Lena River delta with respect to the composition and distribution of organic C among differently stabilized SOM fractions. The soils were fractionated according to density and particle size to obtain differently stabilized SOM fractions differing in chemical composition and thus bioavailability. To better understand the chemical alterations from plant-derived organic particles in these soils rich in fibrous plant residues to mineral-associated SOM, we analyzed the elemental, isotopic and chemical composition of particulate OM (POM) and clay-sized mineral-associated OM (MAOM). We demonstrate that the SOM fractions that contribute with about 17 kg C m−3 for more than 60 % of the C stock are highly bioavailable and that most of this labile C can be assumed to be prone to mineralization under warming conditions. Thus, the amount of relatively stable, small occluded POM and clay-sized MAOM that currently accounts with about 10 kg C m−3 for about 40 % of the C stock will most probably be crucial for the quantity of C protected from mineralization in these Arctic soils in a warmer future. Using δ15N as a proxy for nitrogen (N) balances indicated an important role of N inputs by biological N fixation, while gaseous N losses appeared less important. However, this could change, as with about 0.4 kg N m−3 one third of the N is present in bioavailable SOM fractions, which could lead to increases in mineral N cycling and associated N losses under global warming. Our results highlight the vulnerability of SOM in Arctic permafrost-affected soils under rising temperatures, potentially leading to unparalleled greenhouse gas emissions from these soils.
- Article
(11123 KB) - Full-text XML
-
Supplement
(292 KB) - BibTeX
- EndNote


For several millennia, organic matter (OM) accrued in the remote soils of the Arctic, and only recently have researchers started to increasingly understand the importance of these cold soils for the global carbon (C) cycle and, thus, global climate (Ping et al., 2015). Estimates on the northern circumpolar soil organic carbon (SOC) stock within the first meter vary between 445 and 496 Pg (Tarnocai et al., 2009; Hugelius et al., 2014). These C-rich soils are changing from a C sink to a source due to global warming (Oechel et al., 1993; Parmentier et al., 2017). The Arctic is strongly affected by climate change with an increase in surface temperatures during the last 2 decades that has been more than twice as high as the global average (Meredith et al., 2019). In a warming Arctic, C is lost both via carbon dioxide and methane emissions and by lateral transport with water (Plaza et al., 2019). The C that is released from permafrost-affected soils due to anthropogenically accelerated thawing is assumed to further enhance global warming and thus trigger additional C release from permafrost, a phenomenon known as permafrost C feedback (Davidson and Janssens, 2006; Schuur et al., 2015).
An analysis of soils from 10 North American ecosystem types reaching from tropical forests to Arctic tundra demonstrated a pronounced longer turnover time for soil organic matter (SOM) in cold regions in comparison to other climate regions, as the C stabilization mechanisms clearly differ (Frank et al., 2012). In temperate soils, the main drivers for SOC sequestration are spatial inaccessibility (occlusion in soil aggregates), binding to mineral particles (organo-mineral associated OM) and intrinsic chemical recalcitrance of the OM itself (Six et al., 2002; von Lützow et al., 2006). Besides these specific mechanisms, environmental factors like waterlogging and low temperatures inhibit the turnover of OM in cold regions (Oades, 1988), with cryoturbation additionally supporting the conservation of SOM at greater soil depth and thus in the permafrost (Kaiser et al., 2007). These abiotic mechanisms fail as soon as permafrost collapses, which leads to an increased decomposition of OM (Turetsky, 2004; Plaza et al., 2019).
Already in 1982, Post et al. recognized a considerable variability in C stocks in tundra soils, which illustrates that gaining more knowledge about the biogeochemical cycling of C in permafrost soil needs to involve more analytical approaches that enable the assessment of possible mechanisms of C stabilization. Thus, besides the quantification of organic C (OC), there is a growing number of studies aiming to elucidate the chemical composition of SOM and the processes and mechanisms involved in C cycling and stabilization in permafrost-affected soils (inter alia Torn et al., 2013; Mueller et al., 2015; Strauss et al., 2017; Jongejans et al., 2018; Kuhry et al., 2020).
With ongoing warming, the active layers in cold regions deepen, and thus, microbial activity changes and the accessibility and bioavailability of OM in hitherto frozen soil layers increase (Mackelprang et al., 2011; Hultman et al., 2015). The depolymerization and ammonification as well as nitrification of the long-sequestered organic nitrogen (N) might also enhance mineral N availability in these permafrost-affected soils, leading to increased emissions of the highly potent greenhouse gas nitrous oxide (Elberling et al., 2010; Wilkerson et al., 2019). The importance of mechanisms restricting SOM decomposition in permafrost soils will possibly shift from climatic stabilization (Schmidt et al., 2011) to spatial inaccessibility and association with minerals (Harden et al., 2012; Mueller et al., 2015) with widely unknown consequences for the C stored in these soils.
Several studies estimated the vulnerability of C in permafrost soils to microbial decay from the chemical composition of bulk SOM (inter alia Herndon et al., 2015; Strauss et al., 2017; Tesi et al., 2016; Weiss and Kaal, 2018; Wild et al., 2016; Xue et al., 2016; Zimov et al., 2006). Yet, as SOM represents a continuum of a range of materials of different compositions, from fresh plant litter to highly altered compounds (Lehmann and Kleber, 2015) ruled by different stabilization regimes, the investigation of bulk SOM alone is insufficient. The use of more sophisticated approaches, separating SOM into different fractions, allows for a more detailed understanding of the stabilization mechanisms in soil (Golchin et al., 1994). So far, only few studies (inter alia Dao et al., 2018; Diochon et al., 2013; Dutta et al., 2006; Gentsch et al., 2015; Höfle et al., 2013; Mueller et al., 2015; Xu et al., 2009) used fractionation approaches to investigate the distribution and composition of OM pools in permafrost-affected soils (Ping et al., 2015), most of them focusing on the composition of specific fractions or using incubation experiments.
The objective of our study is to gain detailed insights into the chemical composition and stabilization mechanisms of SOM in Cryosols from the Siberian Lena River delta under present conditions; therefore, we used a physical fractionation approach to separate light organic particles and OM associated with minerals, i.e., particulate OM (POM; dominated by bits and pieces of plants and to a lesser extent microbial residues) and mineral-associated OM (MAOM). As it is known from temperate soils that POM and MAOM have different ecological functions and contribute differently to C and N storage and cycling, we expect that also in permafrost-affected soils, these soil C and N pools show marked differences in their chemical composition and thus vulnerability to climate change. Our two major hypotheses for the present work are that (1) SOM in permafrost-affected soils is mainly stored as POM resulting from a restricted decomposition due to climatic stabilization and that (2) larger POM is characterized by a high content of rather labile OM that mirrors the plant litter input, whereas smaller POM particles and MAOM resemble microbial transformed OM, independent of the original plant litter.
2.1 Site characteristics and soil sampling
Samoylov Island (72∘22′ N, 126∘30′ E) is located in one of the main channels of the Siberian Lena River delta, the largest delta of the Arctic. The island developed during the Holocene and belongs to one of three river terraces. While the western third of the island consists of an active floodplain, the eastern part is covered by ice-wedge polygonal tundra that is typical for this terrace (Boike et al., 2013). Located at 10 to 16 m a.s.l., the Holocene river terrace is rarely flooded, and its plant cover represents the characteristic wet sedge tundra vegetation (Zubrzycki et al., 2013). The dominant soils of the terrace are Cryosols according to the World Reference Base for Soil Resources (Zubrzycki et al., 2013; IUSS Working Group WRB, 2014) and Orthels and Turbels according to the US Department of Agriculture soil taxonomy (Soil Survey Staff, 2014). This terrace has recently been reported to be covered by about 40 % non-degraded polygonal tundra; 40 % collapsed polygons, slopes and water bodies; and 20 % of polygons that show different stages of degradation (Kartoziia, 2019). On the island, active-layer thickness varies around 50 cm, and the thawing period lasts approximately 129 days (Boike et al., 2013). The climate is Arctic, and the 30-year mean (1961–1990) of the closest meteorological station in Tiksi, about 110 km southeast, shows a mean annual air temperature of −13.5 ∘C with a large amplitude between the warmest (around 8 ∘C in July and August) and coldest (around −32 ∘C in January) months (Roshydromet, 2019). Precipitation is low on Samoylov Island, and, due to the different geographic setting within the river delta, it has a mean of 125 mm a−1, markedly lower than the 323 mm a−1 measured in Tiksi (Boike et al., 2013; Roshydromet, 2019).
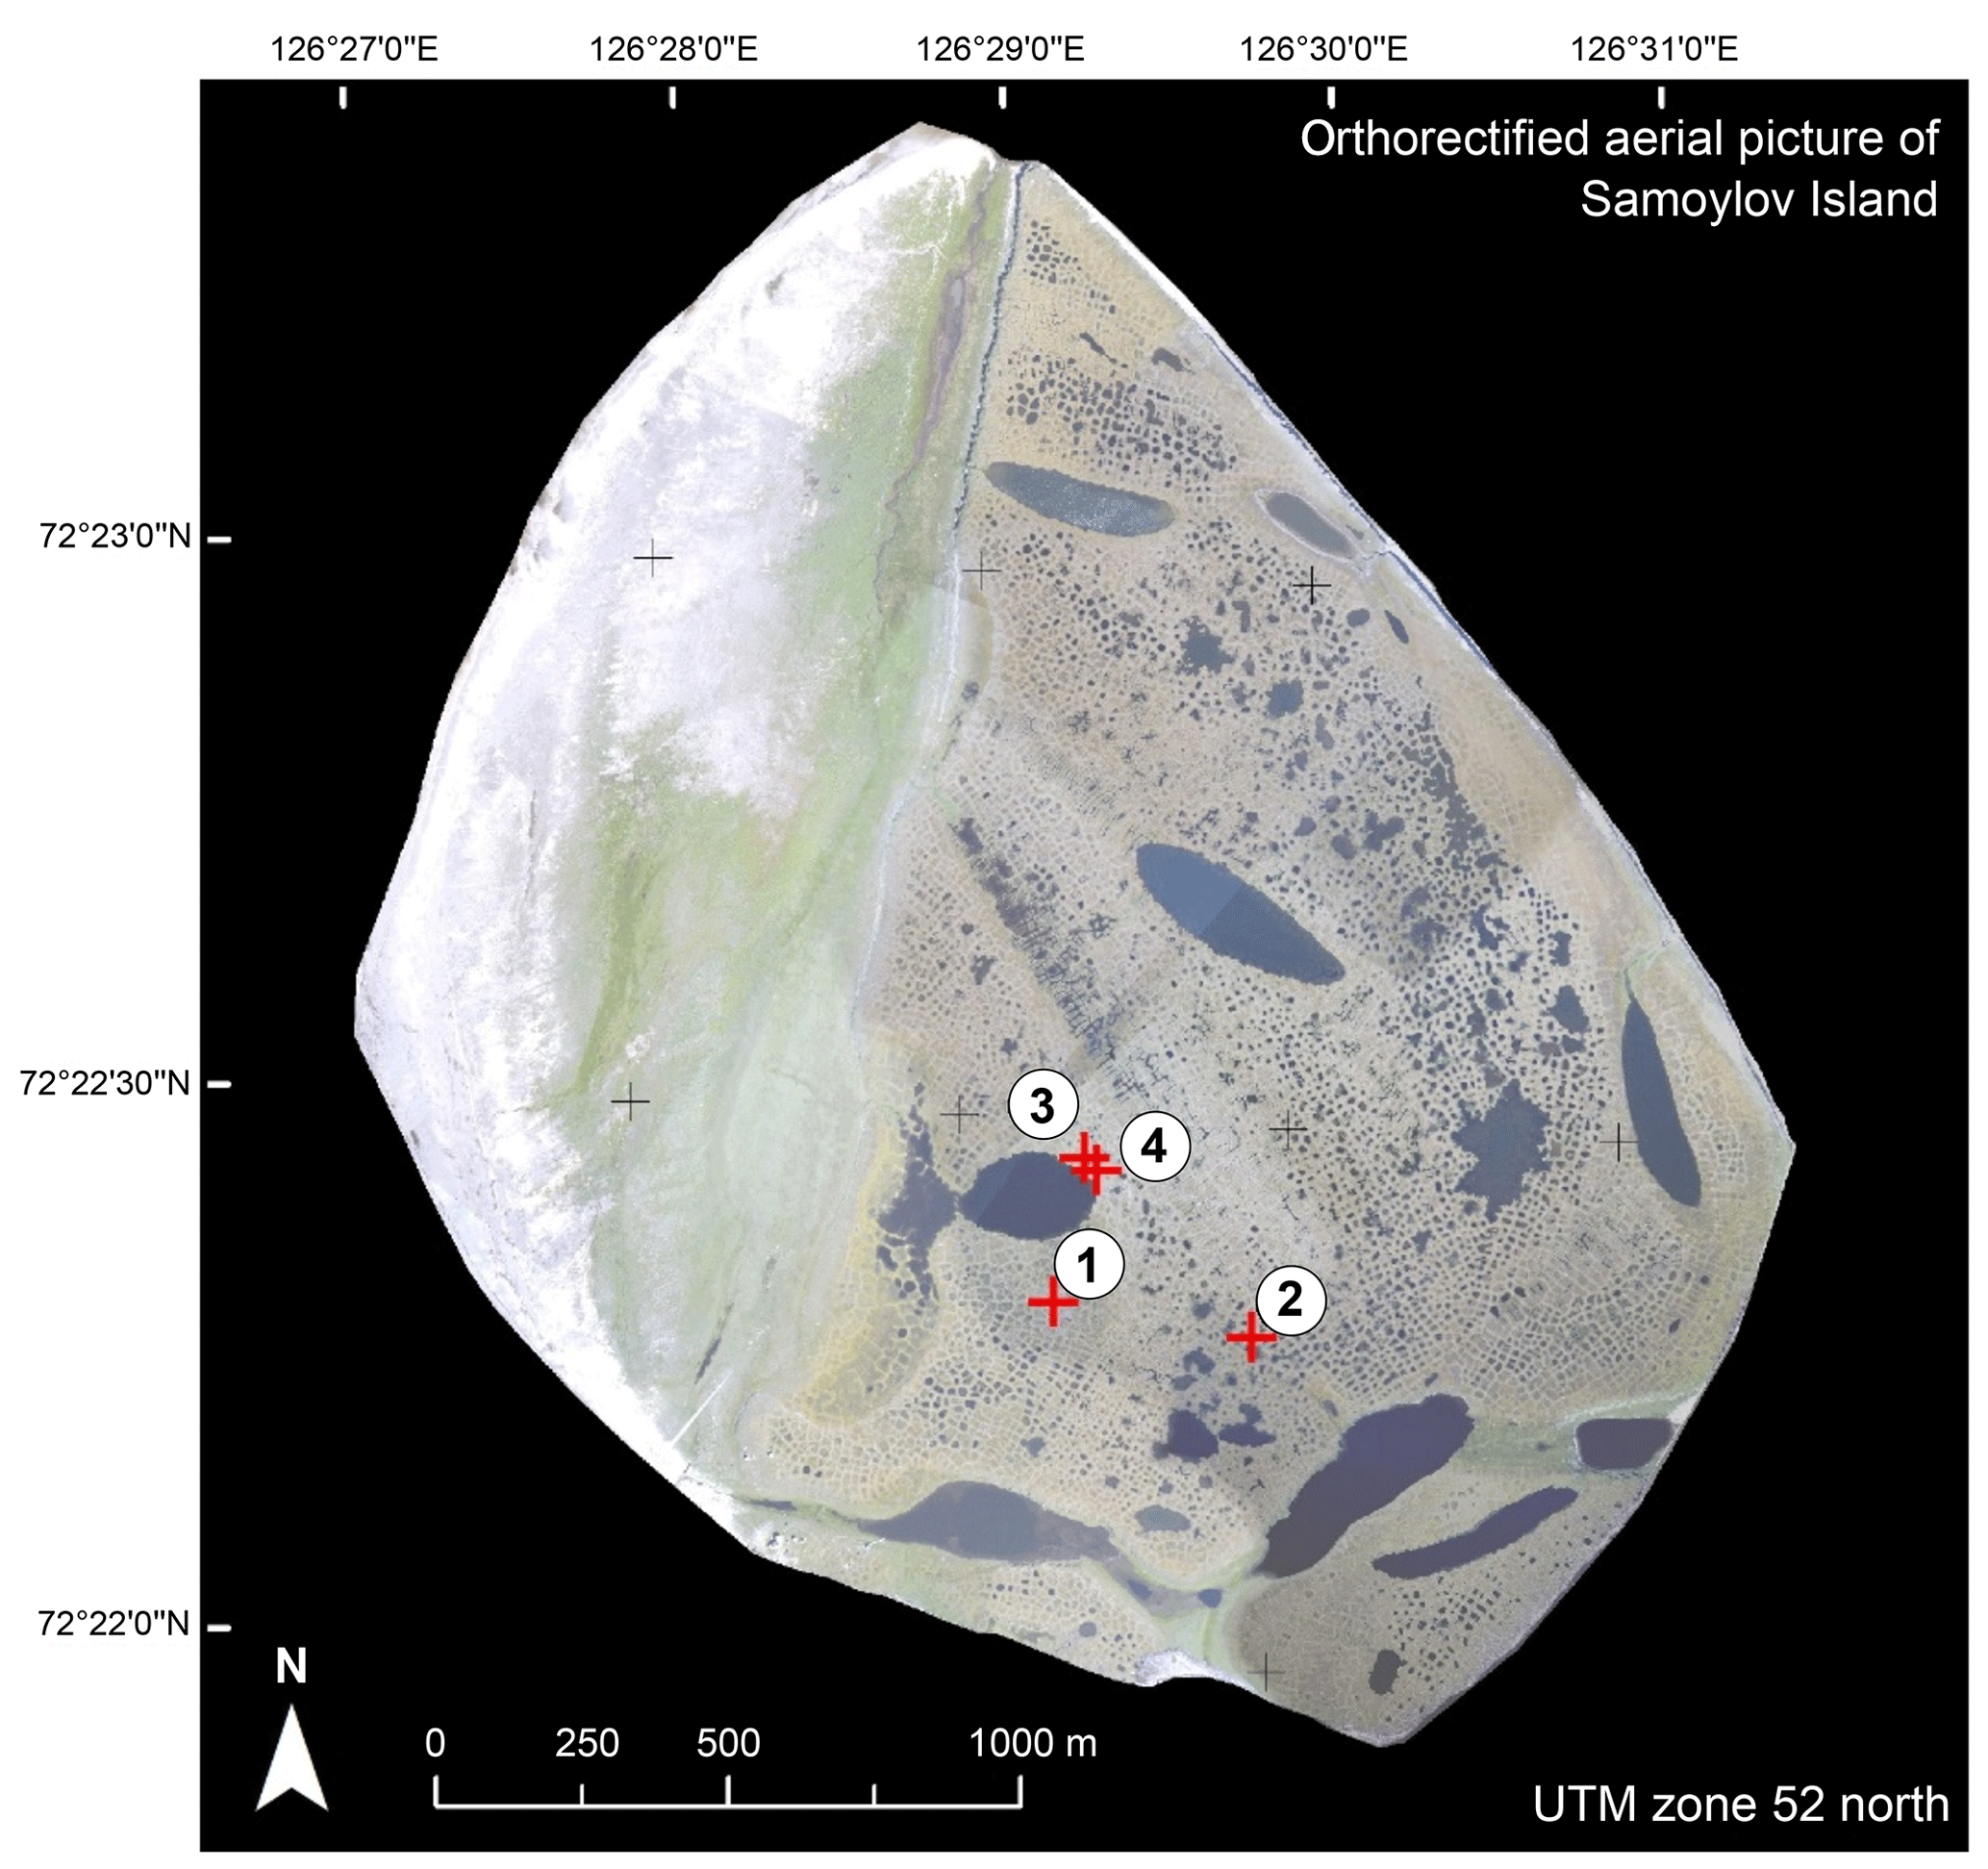
Figure 1In this aerial image of Samoylov Island, the separation between the floodplain in the west (with the white unvegetated sandy sediment) and the Holocene terrace in the eastern part (with blue–gray spots indicating shallow water and larger water bodies) is shown. Red crosses indicate the sampling sites, and the identification numbers of the cores are given (Boike et al., 2012).
We drilled four intact soil cores from ice-wedge polygon centers on the Holocene river terrace (Fig. 1; Boike et al., 2012) in April 2011 and May 2013 using a Snow, Ice and Permafrost Research Establishment coring auger (Jon's Machine Shop, Fairbanks, AK, USA) with a length of 1 m and a diameter of 76 mm with a STIHL BT 121 engine power head (Andreas Stihl AG and Co. KG, Waiblingen, Germany). A detailed description of the study area and the sampling of the soil cores can be found in Zubrzycki et al. (2013) and Zubrzycki (2013).
All bulk soil samples were slightly acidic with lowest pH values of 4.9 and highest of 6.6; electric conductivity (EC) ranged from 66 to 240 µ S cm−1 with a mean of 115 µ S cm−1, and bulk density varied from 0.2 to 0.9 g cm−3 around a mean of 0.5 g cm−3.
2.2 Geochemical properties of bulk soils, physical soil fractionation and chemical analyses of fractions
We separated the drilled cores according to visible mineral soil horizons in a frozen condition and subsequently thawed and dried them at 40 ∘C in an oven. Our analyses focused on 23 selected layers only, as shown in Table S1 in the Supplement.
The bulk soils were fractionated according to density and particle size, following the approach described by Mueller and Koegel-Knabner (2009). Due to the high amount of fibrous material in these Cryosols, some modifications of the procedure were necessary to yield mechanistically different SOM fractions. We unclenched 15 to 20 g – depending on the available amount of sample material – of each soil sample with forceps and gently saturated them with a sodium polytungstate solution with a density of 1.8 g cm−3 by slowly adding the salt solution with a pipette. After 12 h, to ensure a complete and gentle saturation, the floating free POM (fPOM; not embedded in stable aggregates; cf. Golchin et al., 1994) was collected using a vacuum system. The removal of the floating fPOM was repeated twice to ensure a high recovery, and the obtained fraction was subsequently washed over a sieve of 20 µm mesh size to remove excessive salt. Due to the highly fibrous nature of the fPOM, the washing step also yielded fine mineral particles, which adhered to the fPOM fibers. As the C and N contents and C∕N ratios of this mineral material were in the exact same range of the clay-sized MAOM fraction, we added it mathematically to this fraction for the calculation of the C stock. To separate occluded POM fractions (oPOM; incorporated in water-stable aggregates; cf. Golchin et al., 1994) from MAOM, the residual samples were subjected to ultrasonication (Bandelin Sonopuls HD 2200, Berlin, Germany) using a calibrated (Graf-Rosenfellner et al., 2018) energy input of 300 J mL−1 after the fPOM removal. On the lines of the fPOM fractions, oPOM was withdrawn using a vacuum system and washed salt-free over a sieve of 20 µm mesh size by repeated washing until the EC dropped below 2 µS cm−1. During the washing of the oPOM through a 20 µm sieve, we obtained the small oPOM (oPOMs) fraction representing a fine particulate light OM (Mueller et al., 2015, 2017). The remaining heavy residues, constituting the MAOM, were separated by wet sieving and sedimentation to obtain coarse and medium sand (>200 µm), fine sand (63–200 µm), coarse silt (20–63 µm), medium silt (6.3–20 µm), and fine silt and clay (<6.3 µm; further referred to as the clay-sized MAOM fraction). All SOM fractions were analyzed for total C and N contents in duplicate by dry combustion (EuroVector EuroEA3000 Elemental Analyzer, Pavia, Italy). After the analyses of each sample, for better clarity for the reader, C and N contents were calculated for the combined sand- and silt-sized fraction per each bulk soil sample. Due to the absence of carbonates (see pH values in Table S1), total C represents OC. Coarse fractions >20 µm were ball-milled and homogenized prior to C and N measurements. The bulk soil C and N contents were calculated from the sum of the physical fractions; C and N stocks for the SOM fractions were also calculated, and overall C and N stocks were projected to 1 m soil depth. The mass recovery rate after fractionation was >90 % in all samples. In addition, to reveal the microscale structure and illustrate possible source materials (microbial vs. plant origin) scanning electron microscope (SEM) images (JSM-7200F, JEOL, Freising, Germany) were obtained for representative POM fractions.
2.3 Stable isotope measurements
The abundance of 15N and 13C POM and clay-sized MAOM fractions were determined using an isotope ratio mass spectrometer (Delta V Advantage, Thermo Fisher, Dreieich, Germany) coupled to an elemental analyzer (EuroEA, Eurovector, Pavia, Italy). A lab standard (acetanilide) was used as a standard for every sequence in intervals, and different weights as well were used to quantify the isotope linearity of the system. The standard itself was calibrated against several suitable international isotope standards from the International Atomic Energy Agency (IAEA, Vienna, Austria) for both isotopes. The final correction of isotope values was achieved with several international isotope standards and other suitable laboratory standards that cover the range of δ15N and δ13C results. Results are given in delta values relative to air N2 for 15N and relative to Vienna Pee Dee Belemnite (V-PDB) for 13C (Werner and Brand, 2001).
2.4 13C nuclear magnetic resonance spectroscopy
We subjected all fPOM, oPOM, oPOMs and selected clay-sized MAOM fractions to 13C cross-polarization magic-angle spinning (CP-MAS) nuclear magnetic resonance (NMR) spectroscopy (Bruker DSX 200 spectrometer, Billerica, MA, USA). The 13C NMR spectra were recorded at 6800 Hz with an acquisition time of 0.01024 s. During a contact time of 1 ms, a ramped 1H pulse was applied to avoid Hartmann–Hahn mismatches. We executed measurements in 7 mm zirconium dioxide rotors with a delay time of 1.0 s for large POM fractions (fPOM and oPOM) and a reduced delay time of 0.4 s for oPOMs and clay-sized MAOM fractions. The acquired number of scans (NS) varied according to the examined fractions and the available sample material. For most of the large POM fractions, an NS between 3000 and 10 000 provided sufficient signal-to-noise ratios, while most of the oPOMs and clay-sized MAOM fractions required an NS of at least 10 000. Tetramethylsilane was equalized with 0 ppm as a reference for the chemical shifts. The spectra were integrated in different chemical-shift regions according to Beudert et al. (1989) with slight adjustments according to Mueller and Koegel-Knabner (2009): −10 to 45 ppm (alkyl C), 45 to 110 ppm (O∕N alkyl C), 110 to 160 ppm (aromatic C) and 160 to 220 ppm (carboxyl C); spinning sidebands were included. Based on these integrated-shift regions, we calculated the ratio of alkyl C and O∕N alkyl C (a ∕ o-a ratio) as a proxy for the degree of decomposition of plant residues according to Baldock et al. (1997). Furthermore, we calculated the ratio of the integrated chemical-shift regions 70 to 75 ppm (O alkyl C of carbohydrates) and 52 to 57 ppm (methoxyl C of lignin) according to Bonanomi et al. (2013), which provides another proxy for the decomposition stage of plant residues in relation to fresh plant source material (further referred to as 70–75 ∕ 52–57 ratio). To translate the NMR spectra into OM compound classes (carbohydrate, protein, lignin, lipid and carbonyl), we fitted the NMR data using the molecular mixing model (MMM) developed by Nelson and Baldock (Baldock et al., 2004; Nelson and Baldock, 2005). For the MMM fitting, we utilized the following chemical-shift regions: 0 to 45, 45 to 60, 60 to 95, 95 to 110, 110 to 145, 145 to 165 and 165 to 215 ppm. We applied the five-component MMM (without char) with N / C constraint.
2.5 Statistics
We plotted C∕N ratios and C and N concentrations against the N and C stable isotope ratios of SOM fractions using R to identify interrelations. The R software, RStudio and the packages “Rcmdr” (with the plugin “FactoMineR”), “Hmisc”, “Factoshiny” and “corrplot” were used for principal component analysis (PCA), correlation matrices and the compilation of plots (Lê et al., 2008; RStudio Team, 2016; R Development Core Team, 2017). We used PCA and correlation matrices to find correlations between the properties of different SOM fractions (fPOM, oPOM, oPOMs and clay-sized MAOM), namely C and N contents, decomposition proxies (C∕N ratio of bulk soils and of SOM fractions, a ∕ o-a ratio and 70–75 ∕ 52–57 ratio), stable isotopes and the results from the MMM.
3.1 Biogeochemical bulk soil properties and distribution of SOM fractions
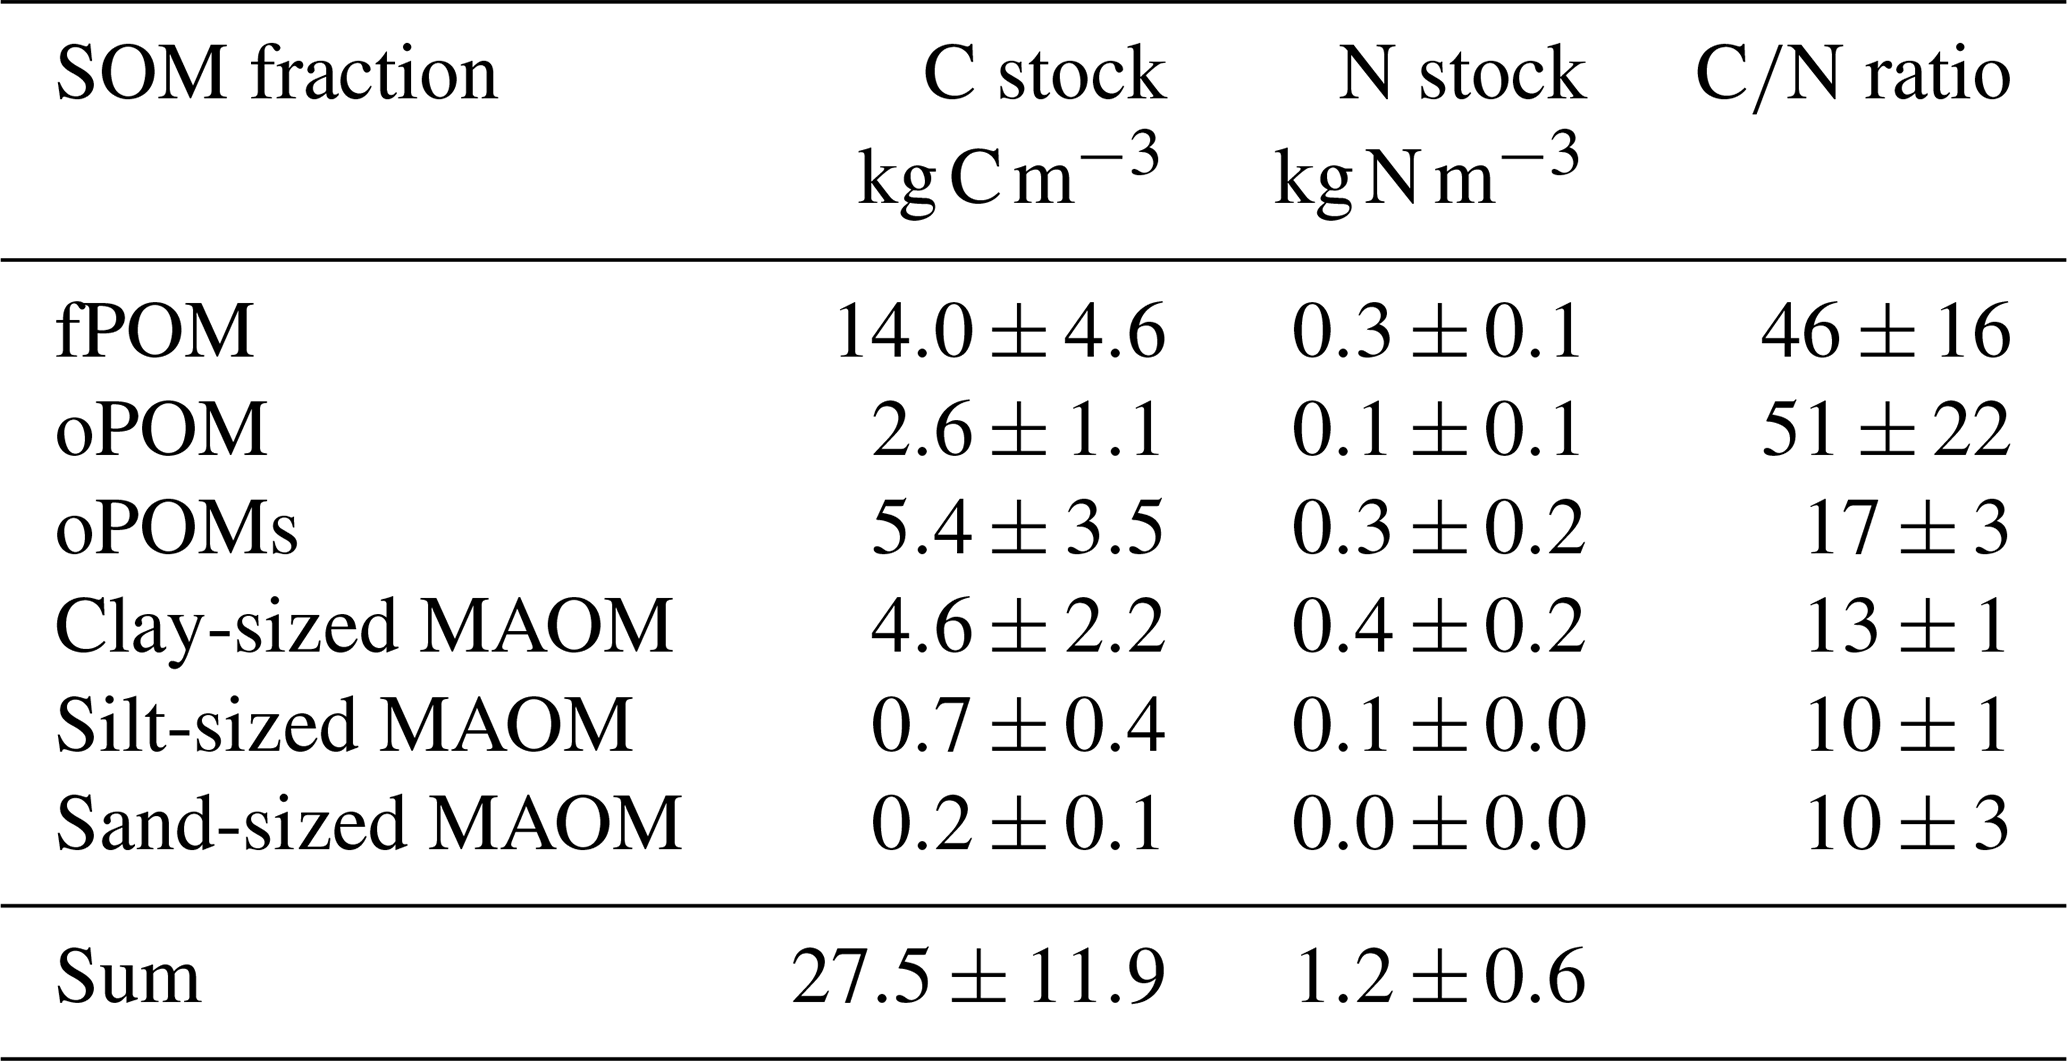
The bulk soil C contents over all cores and depth layers varied between 31.6 and 144.0 mg g−1. The content of total N ranged from 1.3 to 6.8 mg g−1 for all cores and depth layers. While the C∕N ratios ranged between 23 and 38 in three of the four cores, the values of the bulk soils of the fourth core were markedly lower (Table S1). The soil C stocks (projected to 1 m soil depth) ranged between 20.4 and 31.4 kg C m−3 with a mean of 27.5±11.8 kg C m−3; the N stocks varied between 0.7 and 1.9 kg N m−3 with a mean of 1.2±0.6 kg N m−3 (Table 1).
Table 1C and N stocks (projected to 1 m soil depth) and C∕N ratios of the SOM fractions. Given are mean values and the standard deviation of free (fPOM), occluded (oPOM) and small occluded (oPOMs) particulate organic matter and of different-sized mineral-associated organic matter (MAOM).
The mass distribution of POM fractions varied throughout all depth layers with proportions between 10.6 and 295.0 mg g−1 (fPOM), between 3.0 and 71.7 mg g−1 (oPOM), and between 3.9 and 267.2 mg g−1 (oPOMs). In particular, core 3 and 4 showed larger amounts of fPOM and oPOM material at greater depth in between layers dominated by MAOM (Table S1). The MAOM fractions ranged between 37.2 and 244.5 mg g−1 (clay-sized), between 182.4 and 479.3 mg g−1 (silt-sized), and between 79.0 and 591.5 mg g−1 (sand-sized).
3.2 Elemental composition of SOM fractions
The highest C contents were detected in the fPOM and oPOM fractions, with values ranging from 196.3 to 425.5 mg g−1 C for the fPOM and from 368.4 to 449.1 mg g−1 C for the oPOM fractions. Due to the highly fibrous structure of these Cryosols rich in plant residues, fractionation was challenging for some of the samples, leading to one outlier within the fPOM fractions and four outliers within the oPOM fractions. We defined outliers as the measurements laying outside the boxplots' whiskers, thus values lower than 1.5 times the interquartile range below the lower quartile and values higher than 1.5 times the interquartile range above the higher quartile. We excluded these fractions from further calculations, as we assume that they point to mineral particles, which we were not able to separate fully from the very fibrous POM structures. The C content of the oPOMs fractions ranged between 61.4 and 344.8 mg g−1 C, and the C contents of the clay-sized MAOM fractions ranged between 51.5 and 117.9 mg g−1 C, while silt- and sand-sized MAOM fractions showed the lowest C contents with 2.5 to 11.1 mg g−1 C and 0.7 to 3.1 mg g−1 C, respectively (Fig. 2a).
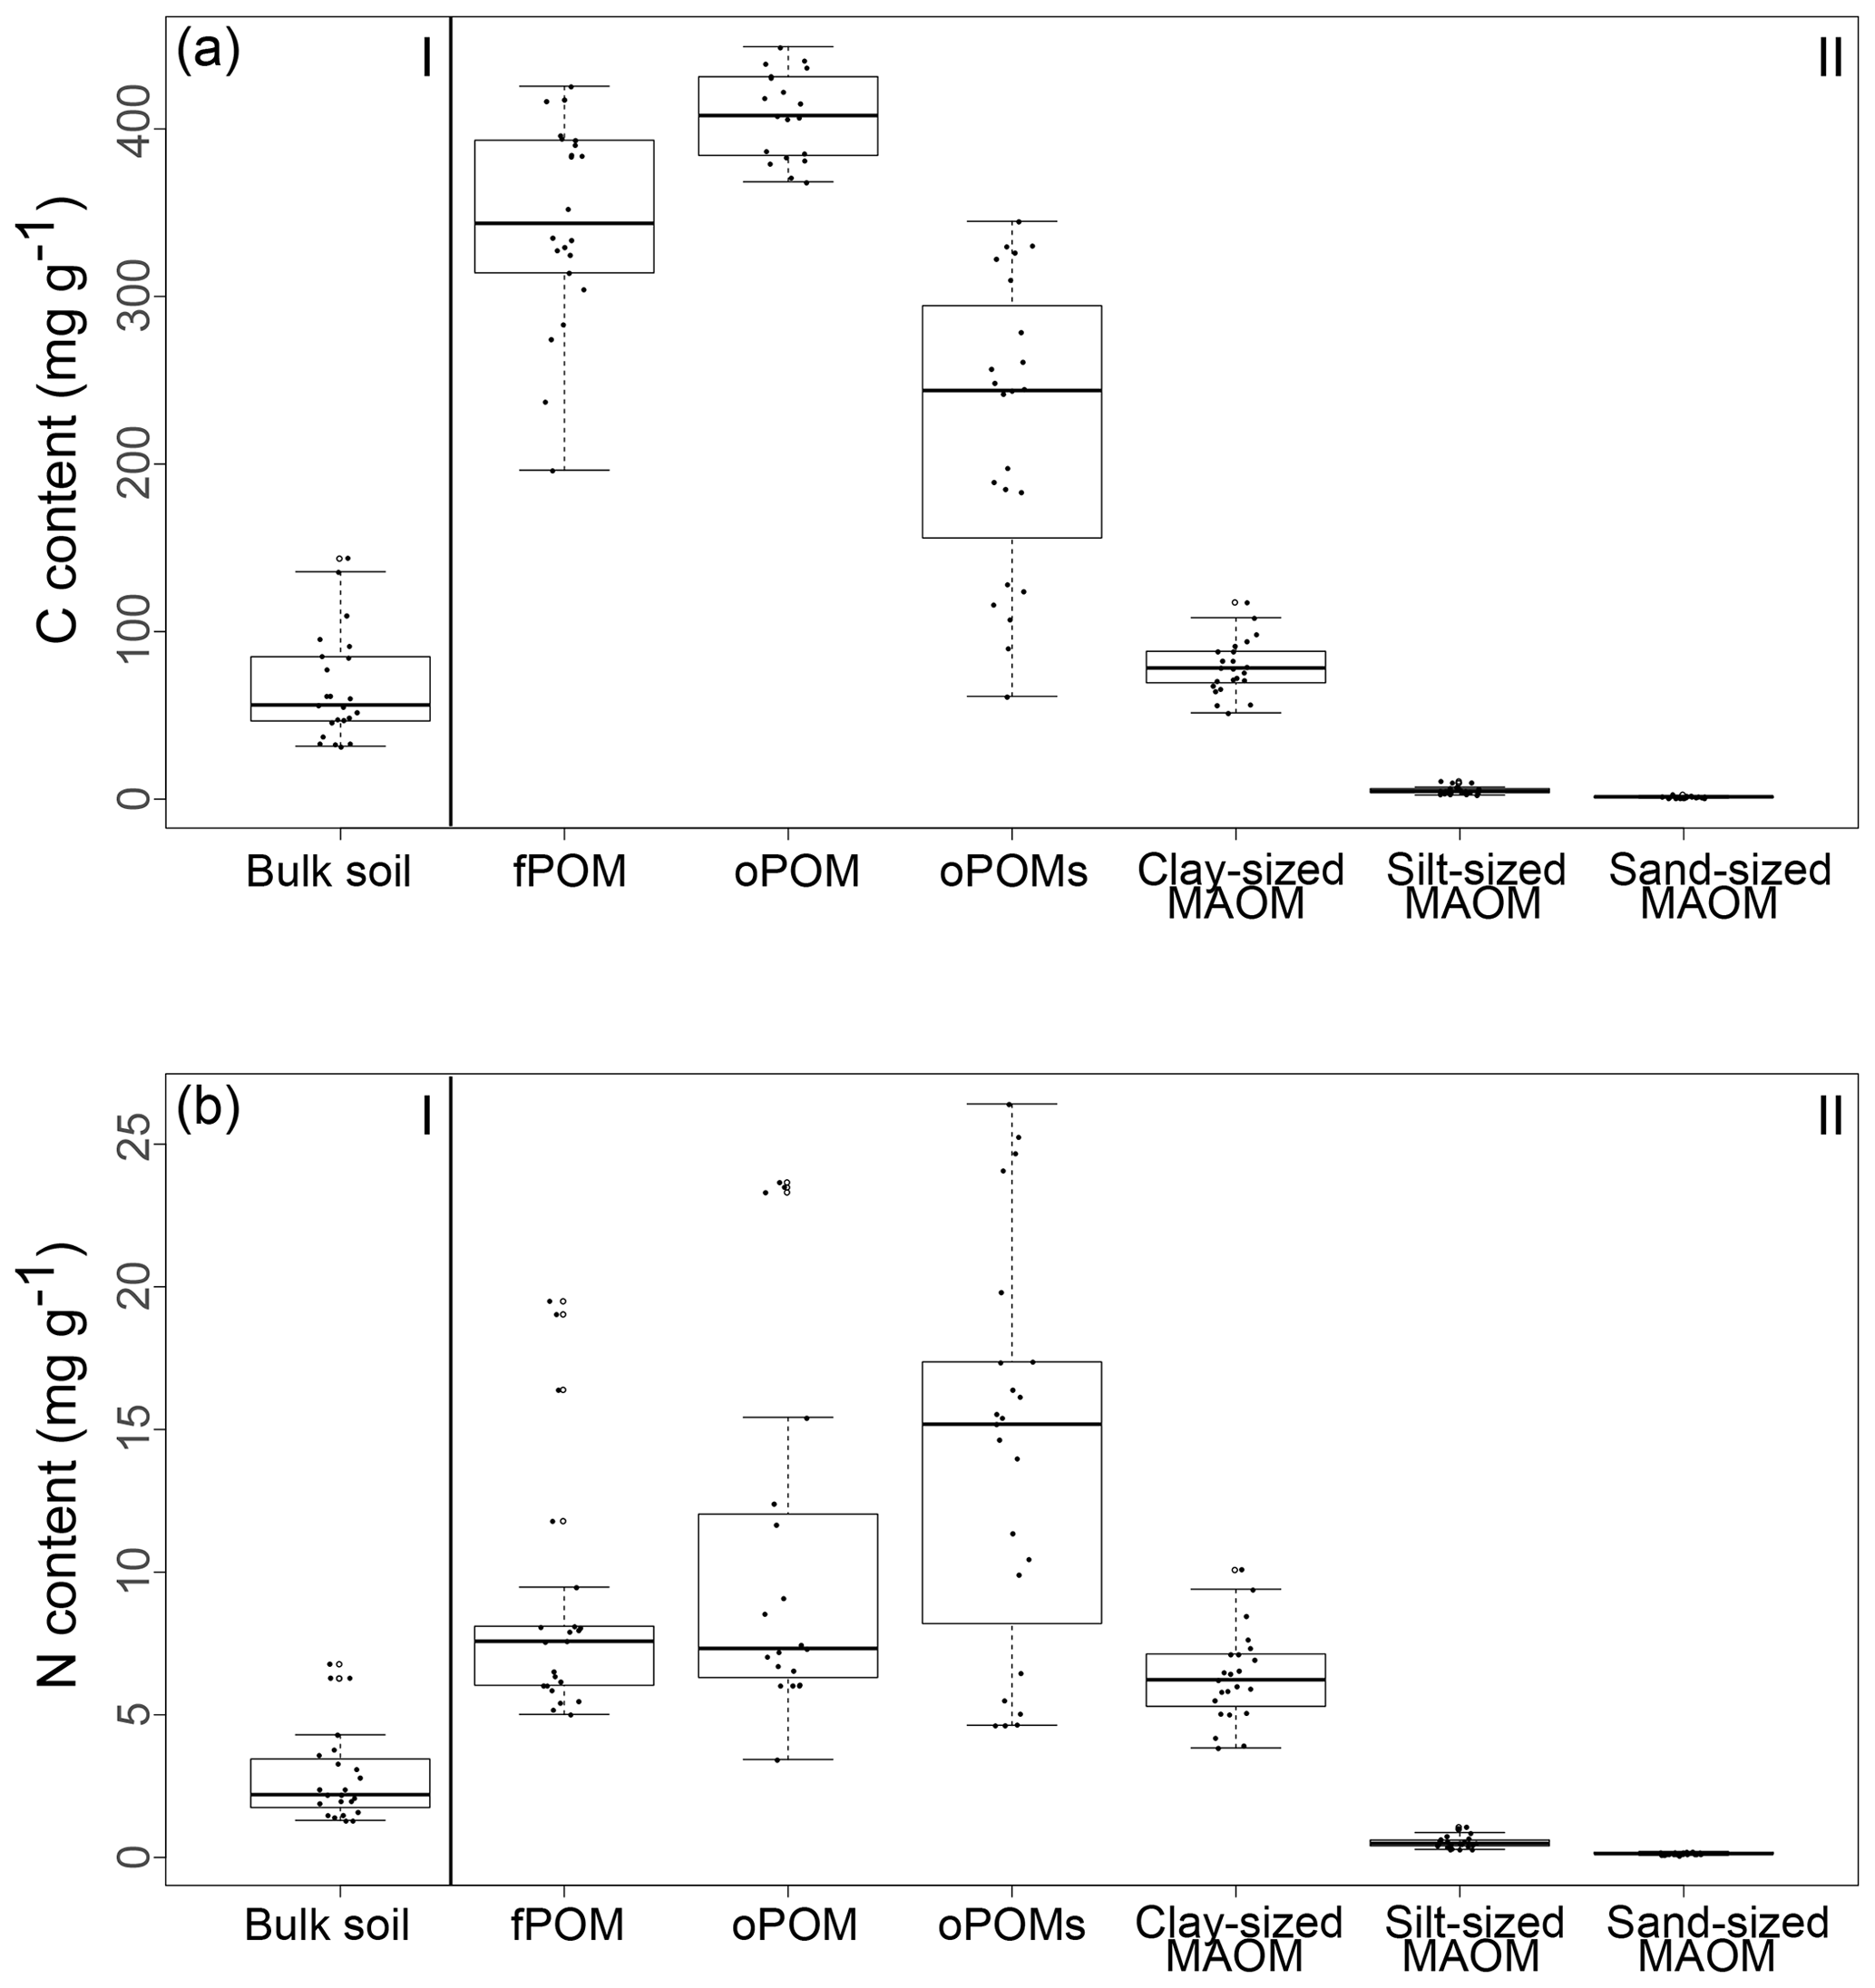
Figure 2The content (in mg g−1) of C (a) and N (b) of bulk soils (I) and SOM fractions (free particulate OM – fPOM, occluded particulate OM – oPOM, small occluded particulate OM – oPOMs – and clay-sized mineral-associated OM – MAOM) (II).
Results for the N content were 5.0 to 19.5 mg g−1 N for fPOM fractions, 3.4 to 23.7 mg g−1 N for oPOM fractions and slightly higher for oPOMs fractions with 4.6 to 26.4 mg g−1 N. The N contents of the clay-sized MAOM fractions ranged between 3.8 and 10.1 mg g−1 N, while silt- and sand-sized MAOM fractions contained markedly less N (Fig. 2b). Large POM fractions (fPOM and oPOM) showed a wide variation of C∕N ratios with values between 22 and 76 for fPOM and between 18 and 113 for oPOM. The values of the oPOMs fractions were clearly lower and had less variability with 13 to 25, while clay-sized MAOM fractions ranged between 11 and 16. The lowest C∕N ratios were present in silt- and sand-sized MAOM fractions with 8 to 12 and 6 to 19, respectively. Large POM fractions had not only the widest C∕N ratios compared to oPOMs and mineral-associated OM within each soil layer but also showed the largest variation (Fig. 3; Table S2).
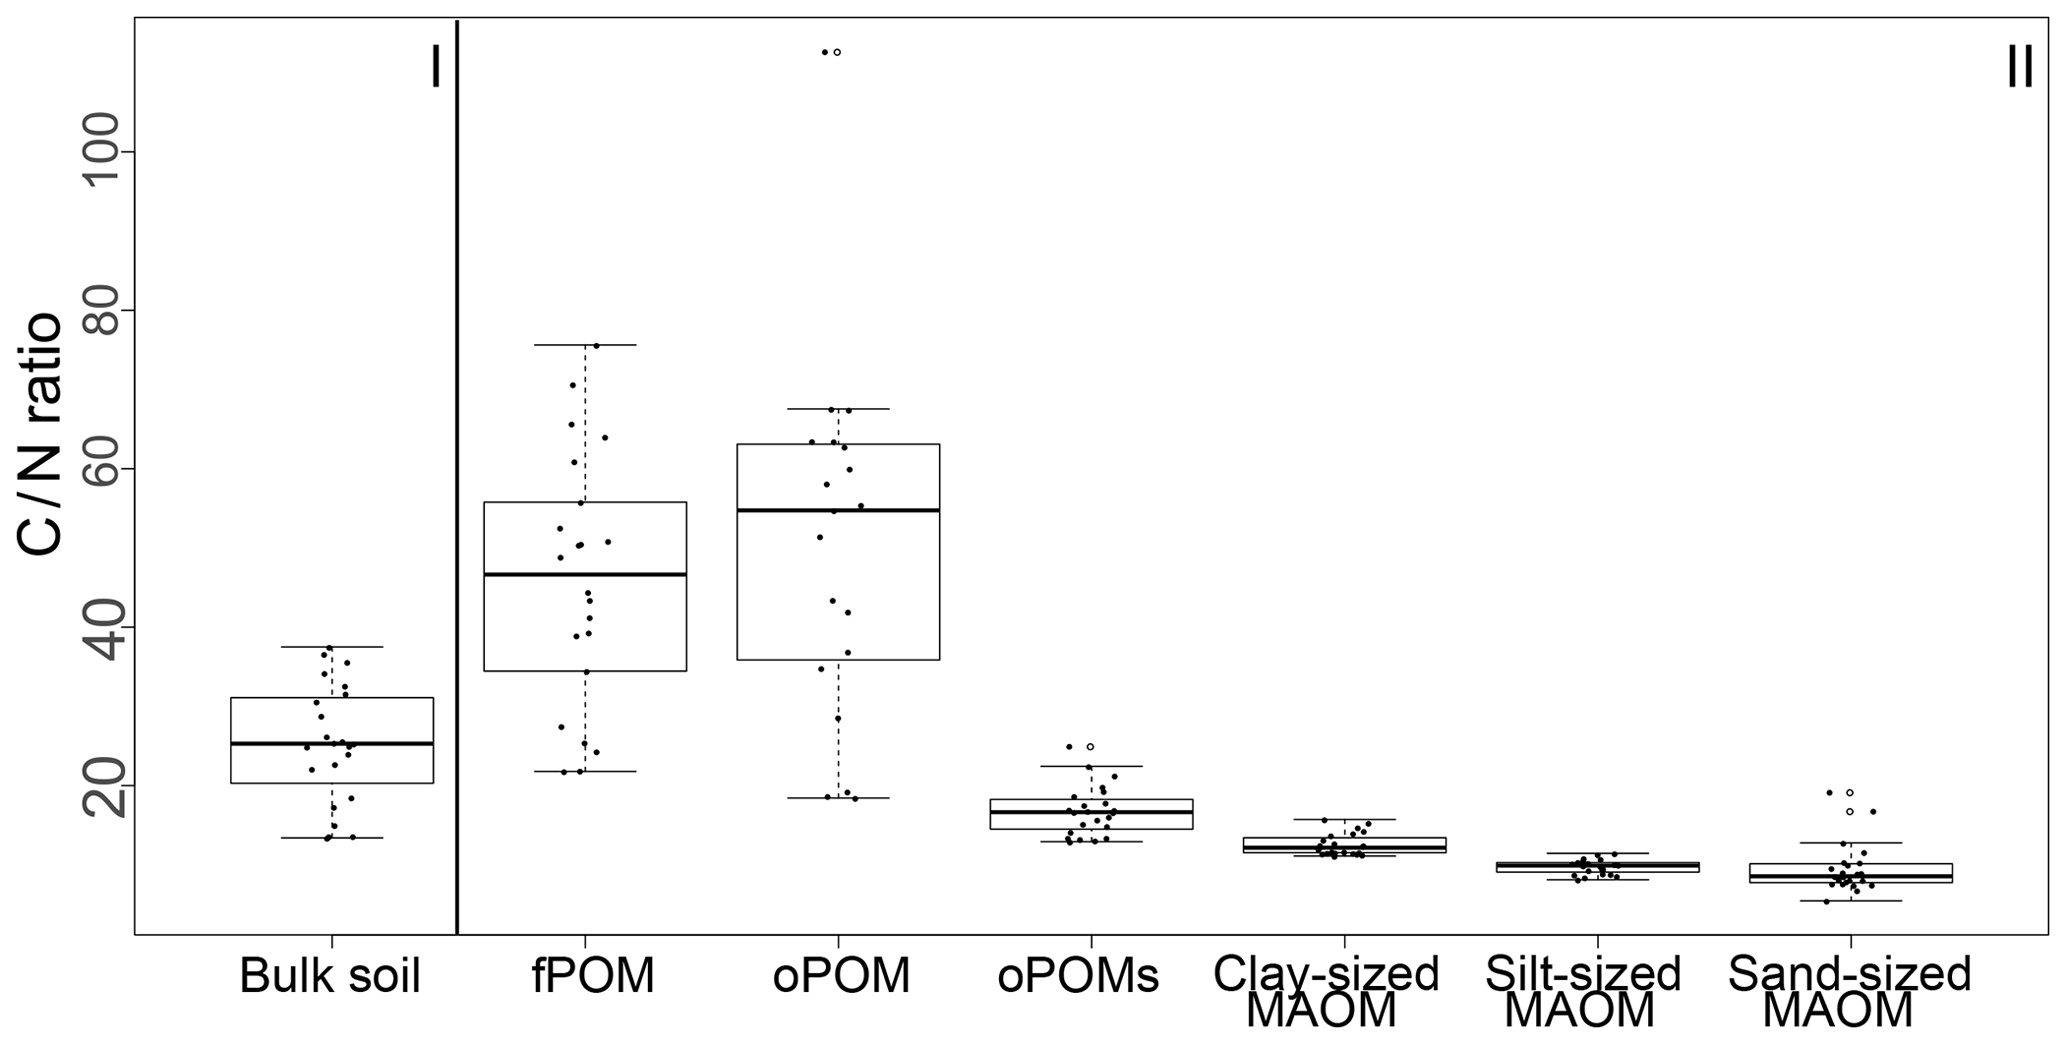
Figure 3C∕N ratios of bulk soils (I) and SOM fractions (free particulate OM – fPOM, occluded particulate OM – oPOM, small occluded particulate OM – oPOMs – and clay-sized mineral-associated OM – MAOM) (II).
The contribution of C and N weighted for the amount of each specific SOM fraction per soil layer showed a great variance in the amount of C and N stored either as POM or MAOM. For C, this ranged between 211.5 and 807.0 mg C per gram of bulk soil for the large POM fractions (fPOM and oPOM), between 13.7 and 479.7 mg C per gram of bulk soil for oPOMs, whereas the clay-sized MAOM ranged between 59.4 and 431.4 mg C per gram of bulk soil (Table S2).
Over all analyzed soil layers, POM fractions accounted for 80 % of the C stock (22.0±9.2 kg C m−3), while the MAOM fractions accounted for about 20 % (5.5±2.7 kg C m−3). Overall, the fPOM fractions dominated the C stock, with 14.0±4.6 kg C m−3 representing about half of the total C stock of all analyzed cores and layers. The occluded POM fractions contributed less with 2.6±1.1 kg C m−3 (oPOM) and 5.4±3.5 kg C m−3 (oPOMs). The share of the clay-sized MAOM fractions in the C stock was 4.6±2.2 kg C m−3, while silt- and sand-sized MAOM fractions played only a subordinate role (Table 1).
For the N stock, the contribution of the POM fractions sums up to about 60 % (0.7±0.4 kg N m−3) and that of the MAOM fractions to about 40 % (0.5±0.2 kg N m−3). The fPOM and oPOM fractions contributed differently to the stock with 0.3±0.1 kg N m−3 and 0.1±0.1 kg N m−3, respectively. The oPOMs and clay-sized MAOM fractions added similarly to the N stock with 0.3±0.2 kg N m−3 and 0.4±0.2 kg N m−3 but also showed the largest variation. Similar to C stocks, silt- and sand-sized MAOM fractions had a negligible share in the N stocks (Table 1).
Although overall the soil C and N storage was dominated by POM, the distribution of POM- vs. MAOM-related C and N varied greatly with depth, with some soil layers showing a dominance of MAOM for C and N storage (Table S2).
3.3 Isotopic composition of SOM fractions
For POM and clay-sized MAOM fractions, we analyzed the content of stable carbon (13C) and nitrogen (15N) isotopes. With respect to δ15N, the values differed little between all examined fractions: fPOM (−0.3 ‰ to 1.4 ‰), oPOM (0.2 ‰ to 2.4 ‰), oPOMs (0.0 ‰ to 2.9 ‰) and clay-sized MAOM (−0.4 ‰ to 3.4 ‰), with the latter showing the highest values (Table S2). With decreasing C∕N ratios, a clear trend towards more negative δ13C and lower δ15N values was demonstrated for all POM fractions (Fig. 4). As shown by PCA (Fig. 5), δ15N and δ13C showed positive dependencies with the C∕N ratios. As the deeper soil layers of core 4 were clearly dominated by MAOM with a narrow C∕N ratio, the overall δ15N (0.7 ‰) was lower compared to the other three cores.

Figure 4Natural abundance of δ13C and δ15N plotted against the C∕N ratios and the δ15N values plotted against the N content of SOM fractions (free particulate OM – fPOM, occluded particulate OM – oPOM, small occluded particulate OM – oPOMs – and clay-sized mineral-associated OM – MAOM): the values of δ13C (‰ relative to V-PDB) (a) and the values of δ15N (‰ relative to air N2) (b) in relation to the C∕N ratio (log-converted) of SOM fractions and δ15N (‰ relative to air N2) plotted against N content (in mg g−1) of the SOM fractions (c).
The δ13C values were similar for all fractions and the range of the values and their variability was similar for fPOM (−31.2 ‰ to −25.6 ‰), oPOM (−30.6 ‰ to −25.3 ‰), oPOMs (−31.5 ‰ to −25.0 ‰) and clay-sized MAOM (−31.8 ‰ to −24.1 ‰; Table S2). As for δ15N, also the δ13C values of the soil material of core 4 differed from those in the other cores showing clearly lower values. Thus, overall the differences between the cores were larger than the differences between the fractions. Also for the δ13C values, a relation to the C∕N ratios of all fractions was demonstrated. The C∕N ratios of the clay-sized MAOM asymptotically approached a limit when plotted over δ15N and δ13C, whereas the POM fractions showed a linear increase in the isotope content at higher C∕N ratios (Fig. 4).
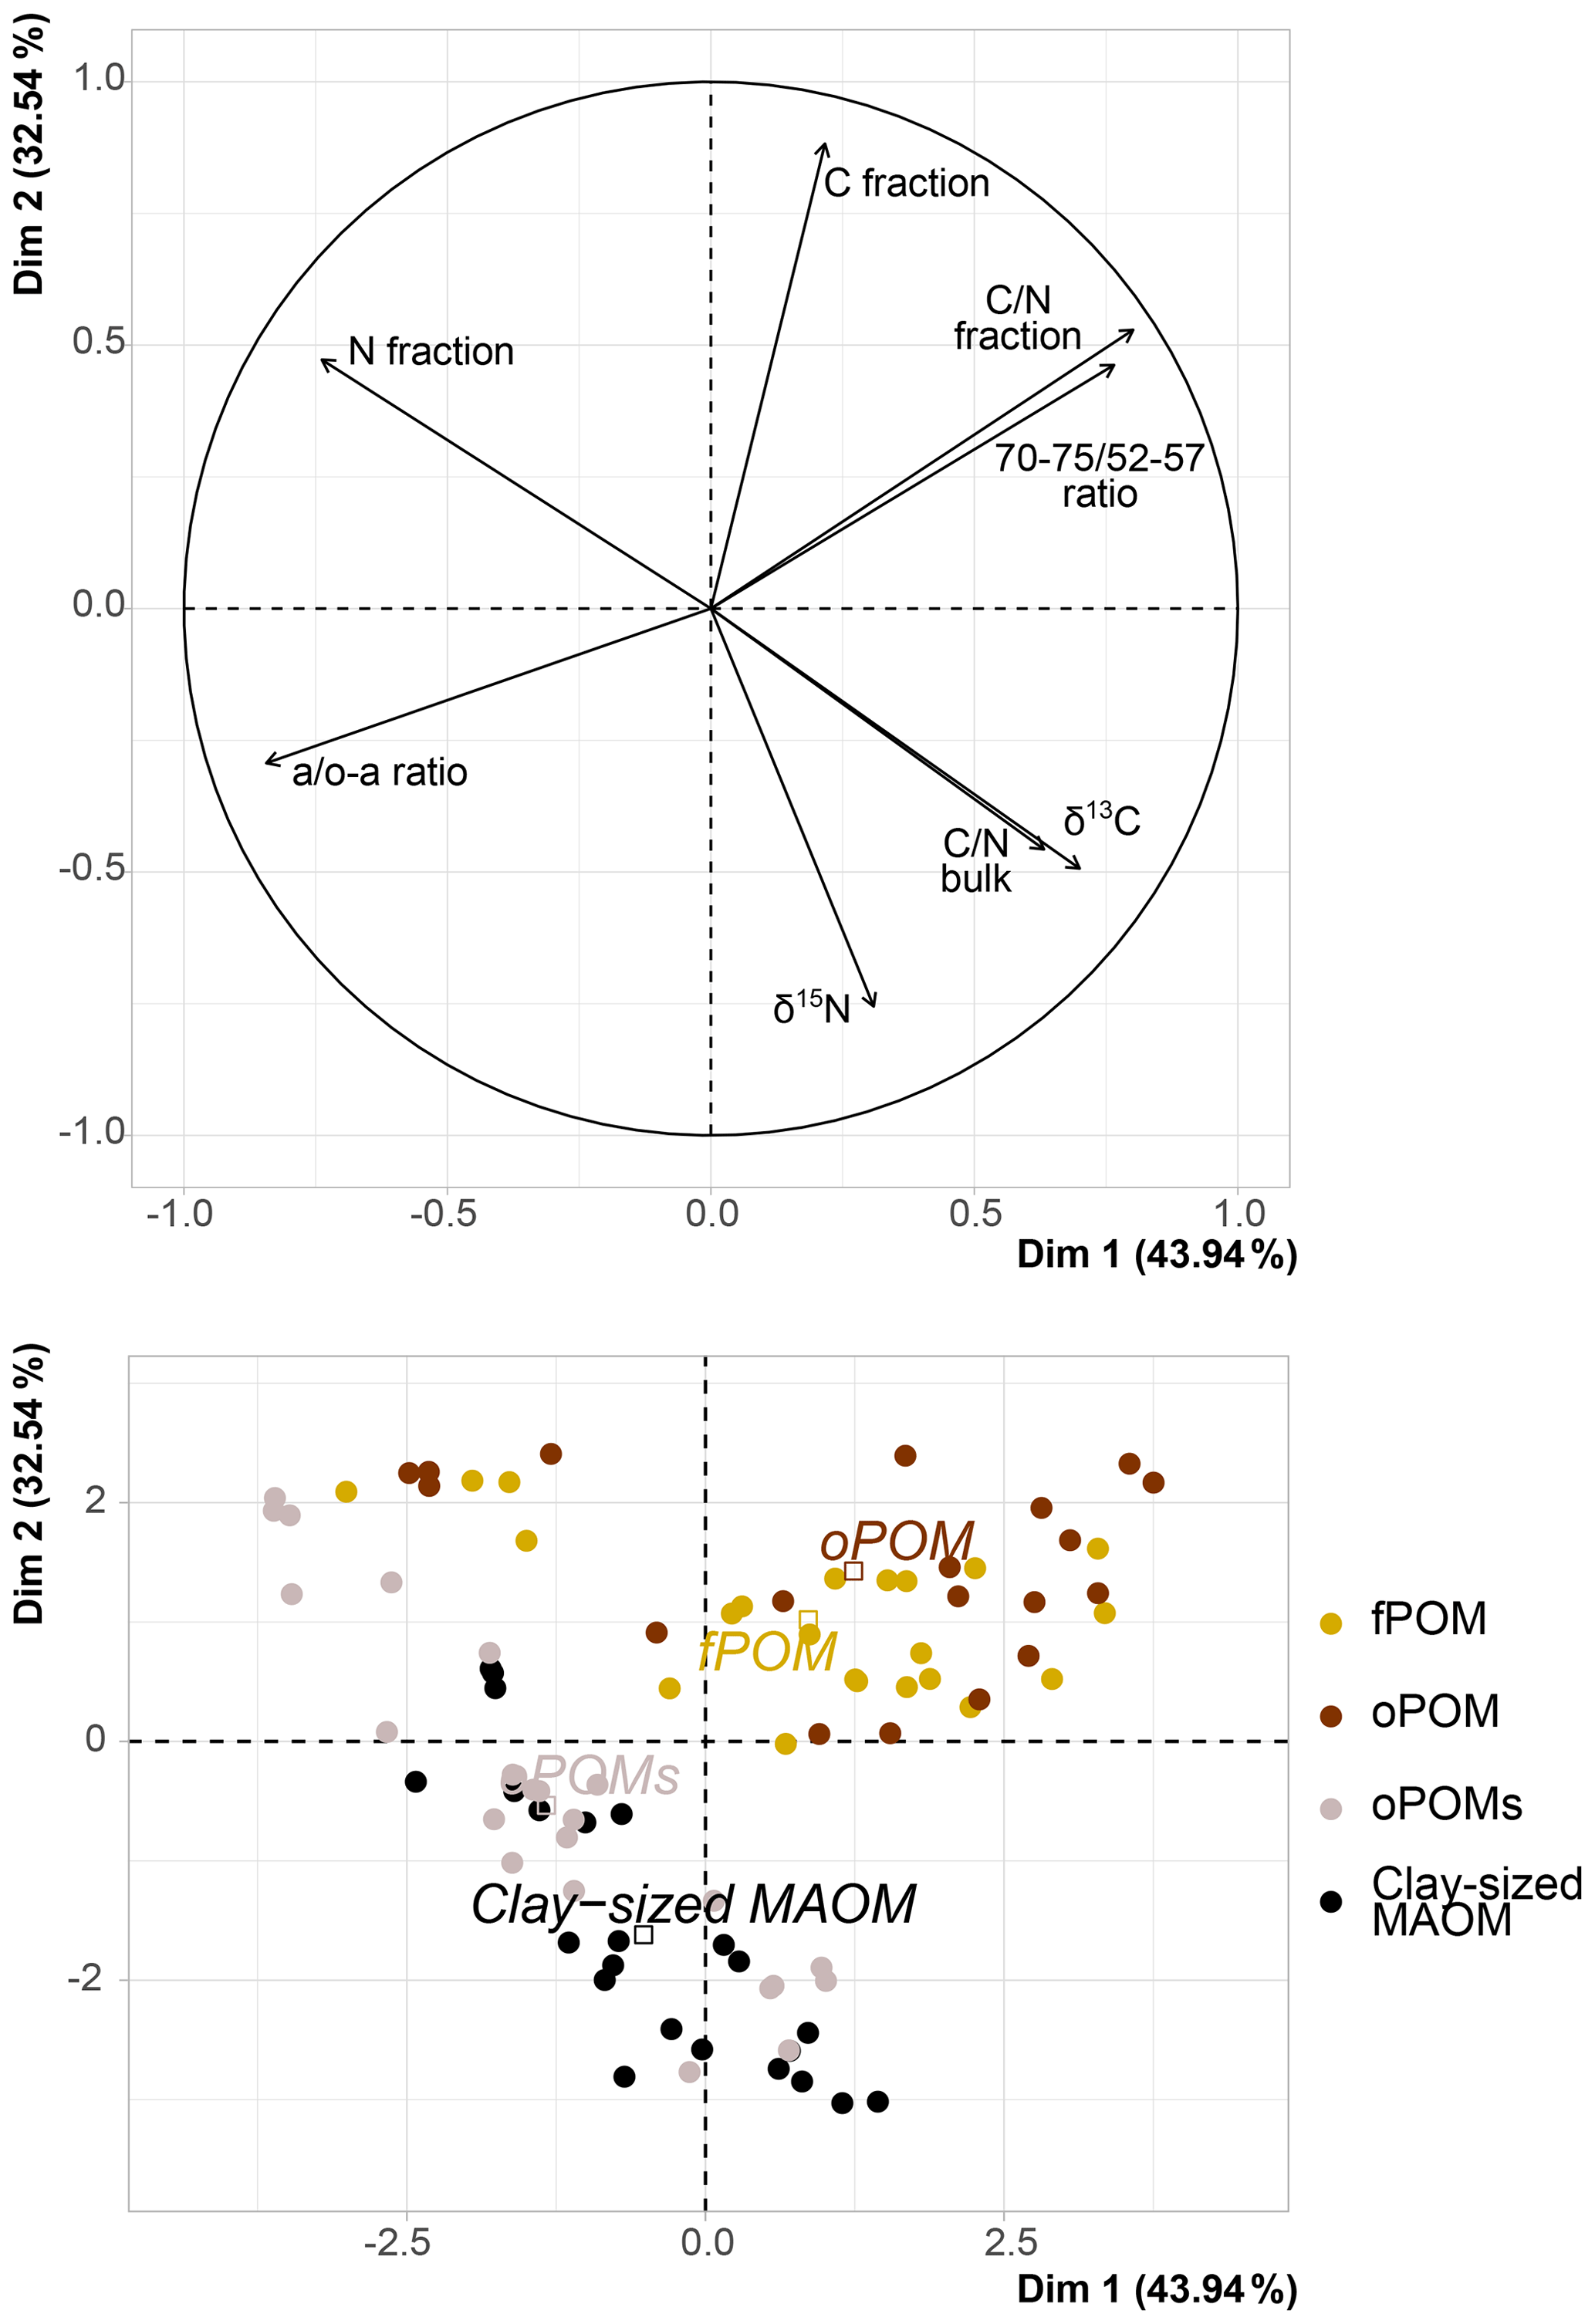
Figure 5Principal component analysis (PCA) of δ13C (‰ relative to V-PDB), δ15N (‰ relative to air N2), C and N content of the SOM fractions (free particulate OM – fPOM, occluded particulate OM – oPOM, small occluded particulate OM – oPOMs – and clay-sized mineral-associated OM – MAOM), C∕N ratio of fractions and of bulk soils, and 13C CP-MAS NMR-derived decomposition proxies (a ∕ o-a ratio and 70–75 ∕ 52–57 ratio). Dim: dimension.
3.4 13C NMR – the molecular level
The 13C CP-MAS NMR spectra of all examined SOM fractions showed dominant peaks in the region of O∕N alkyl C. The spectra of both large POM fractions were clearly dominated by the shouldered major peak around 70 ppm and a minor peak around 105 ppm. The integration of the spectra fortified the dominance of O∕N alkyl C with about 70 % in the fPOM (n=22) and oPOM (n=19) fractions (Table 2). In the regions of carboxyl and alkyl C, small peaks were present, with only a small hump being present in the region of aromatic C. The differences between the spectra of the fPOM and oPOM fractions (see Fig. S1 in the Supplement) and in their relative composition were only minor; even shoulders and minor side peaks were comparable in the majority of the samples. In contrast, spectra of the oPOMs (n=23) and clay-sized MAOM (n=10) fractions showed pronounced peaks around 30 ppm in the region of alkyl C and around 170 to 175 ppm in the region of carboxyl C. Throughout all samples, there was a shift from a high percentage of O∕N alkyl C in the large POM fractions to a higher percentage of aromatic and alkyl C in oPOMs and clay-sized MAOM fractions (Table 2).
Table 2Relative chemical composition of SOM fractions obtained by 13C CP-MAS NMR spectroscopy and decomposition proxies (a ∕ o-a ratio and 70–75 ∕ 52–57 ratio). Given are mean values and the standard deviation of free (fPOM), occluded (oPOM) and small occluded (oPOMs) particulate organic matter and of clay-sized mineral-associated organic matter (MAOM).
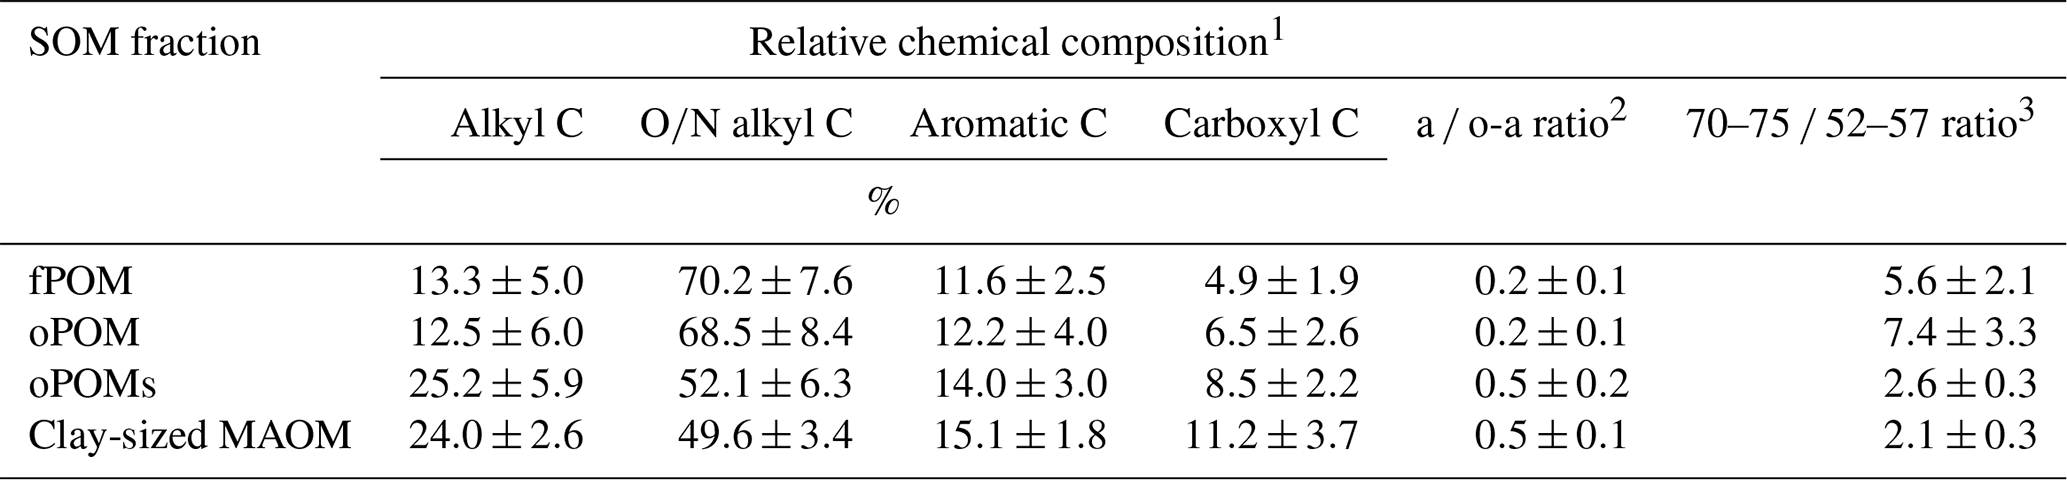
1 Relative chemical composition determined by the integration of the following chemical-shift regions: −10 to 45 ppm (alkyl C), 45 to 110 ppm (O∕N alkyl C), 110 to 160 ppm (aromatic C) and 160 to 220 ppm (carboxyl C). 2 Ratio of alkyl C and O∕N alkyl C according to Baldock et al. (1997). 3 Ratio of the chemical-shift regions 70 to 75 ppm and 52 to 57 ppm according to Bonanomi et al. (2013).
To get more differentiated information about the degree of decomposition of the OM, we calculated the a ∕ o-a ratio for the SOM fractions (Baldock et al., 1997). While fPOM and oPOM fractions revealed identically low values and relatively large standard deviations with 0.2±0.1, oPOMs and clay-sized MAOM showed clearly higher values with about 0.5. In addition to the a ∕ o-a ratio, we applied the 70–75 ∕ 52–57 ratio (Bonanomi et al., 2013) to the SOM fractions and received results consistent with the a ∕ o-a ratios: fPOM and oPOM showed high values, indicating a low degree of decomposition, while oPOMs and clay-sized MAOM showed very low values. With this ratio, the large POM fractions showed a considerable variance, while the deviation within oPOMs and clay-sized MAOM was marginal (Fig. 6). Figure 7 illustrates the close relation between the C∕N ratio of the SOM fractions and the NMR-derived decomposition proxies.
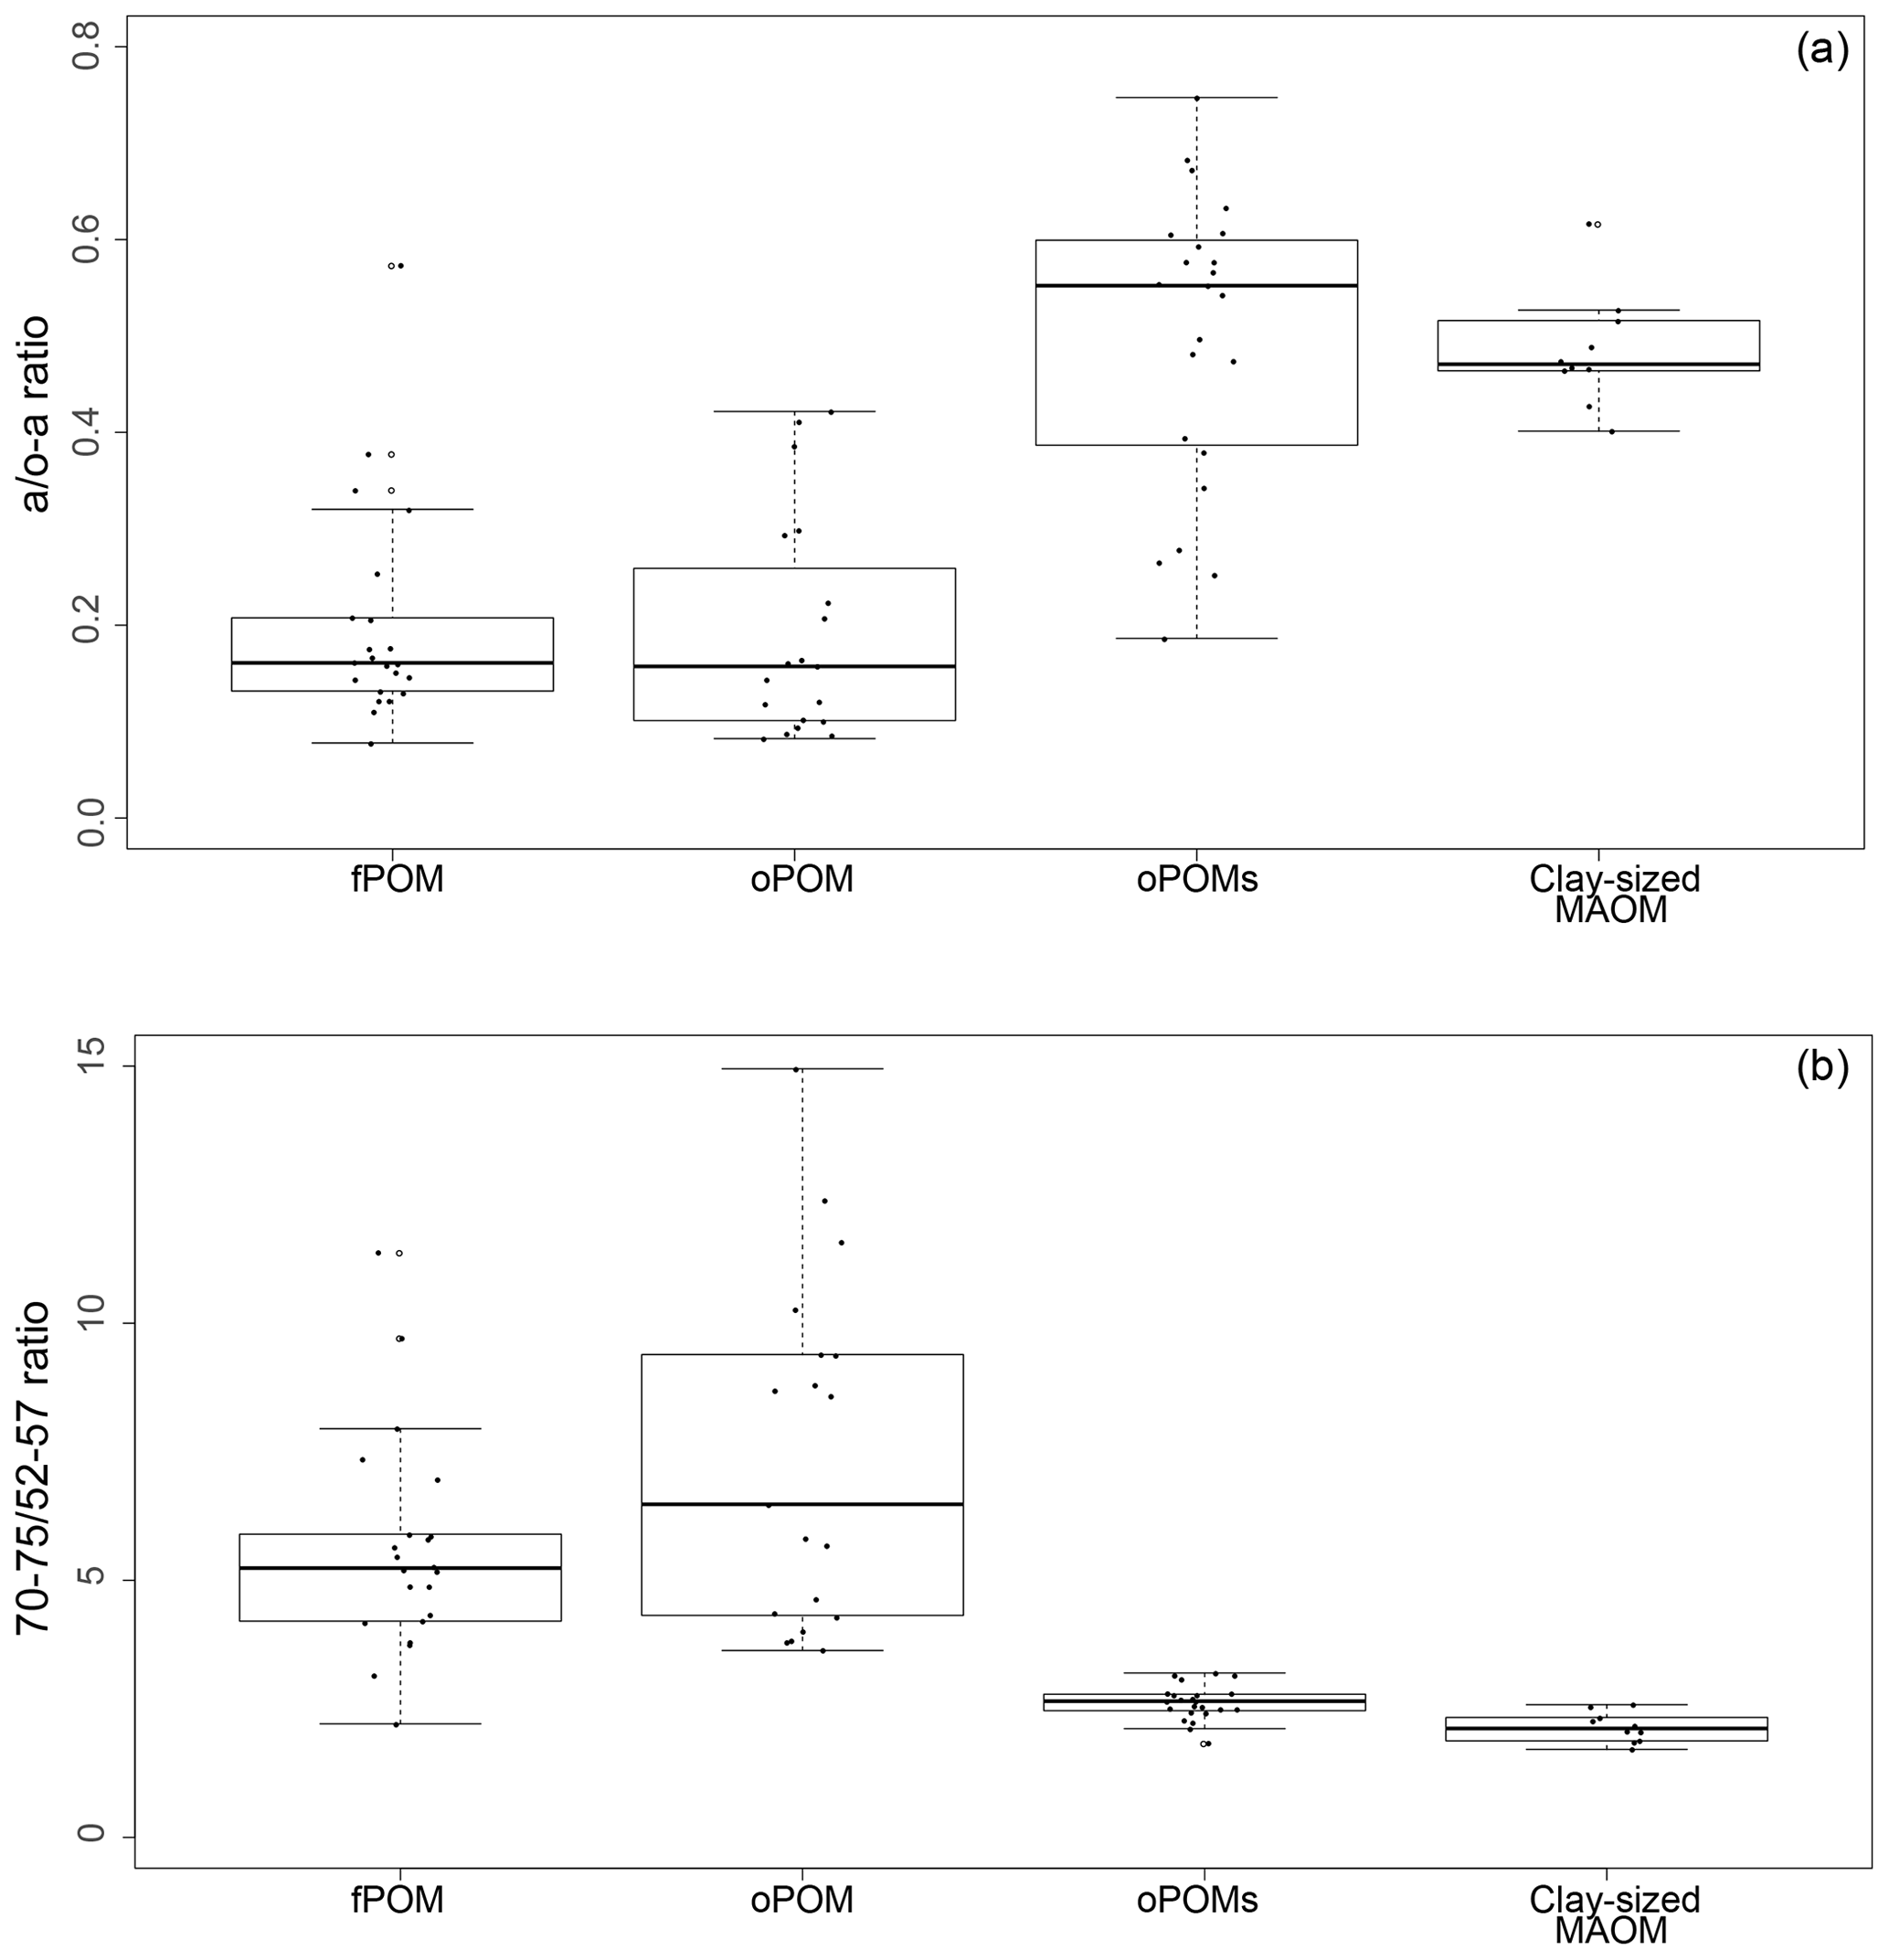
Figure 6Decomposition proxies obtained by 13C CP-MAS NMR spectroscopy for specific SOM fractions: both the a ∕ o-a ratio (a) and 70–75 ∕ 52–57 ratio (b) of SOM fractions demonstrate the similarity of large particulate OM fractions – free and occluded POM (fPOM and oPOM) – and the conjunctive characteristics of the small occluded particulate OM (oPOMs) fractions that links large POM fractions and the clay-sized MAOM fraction.
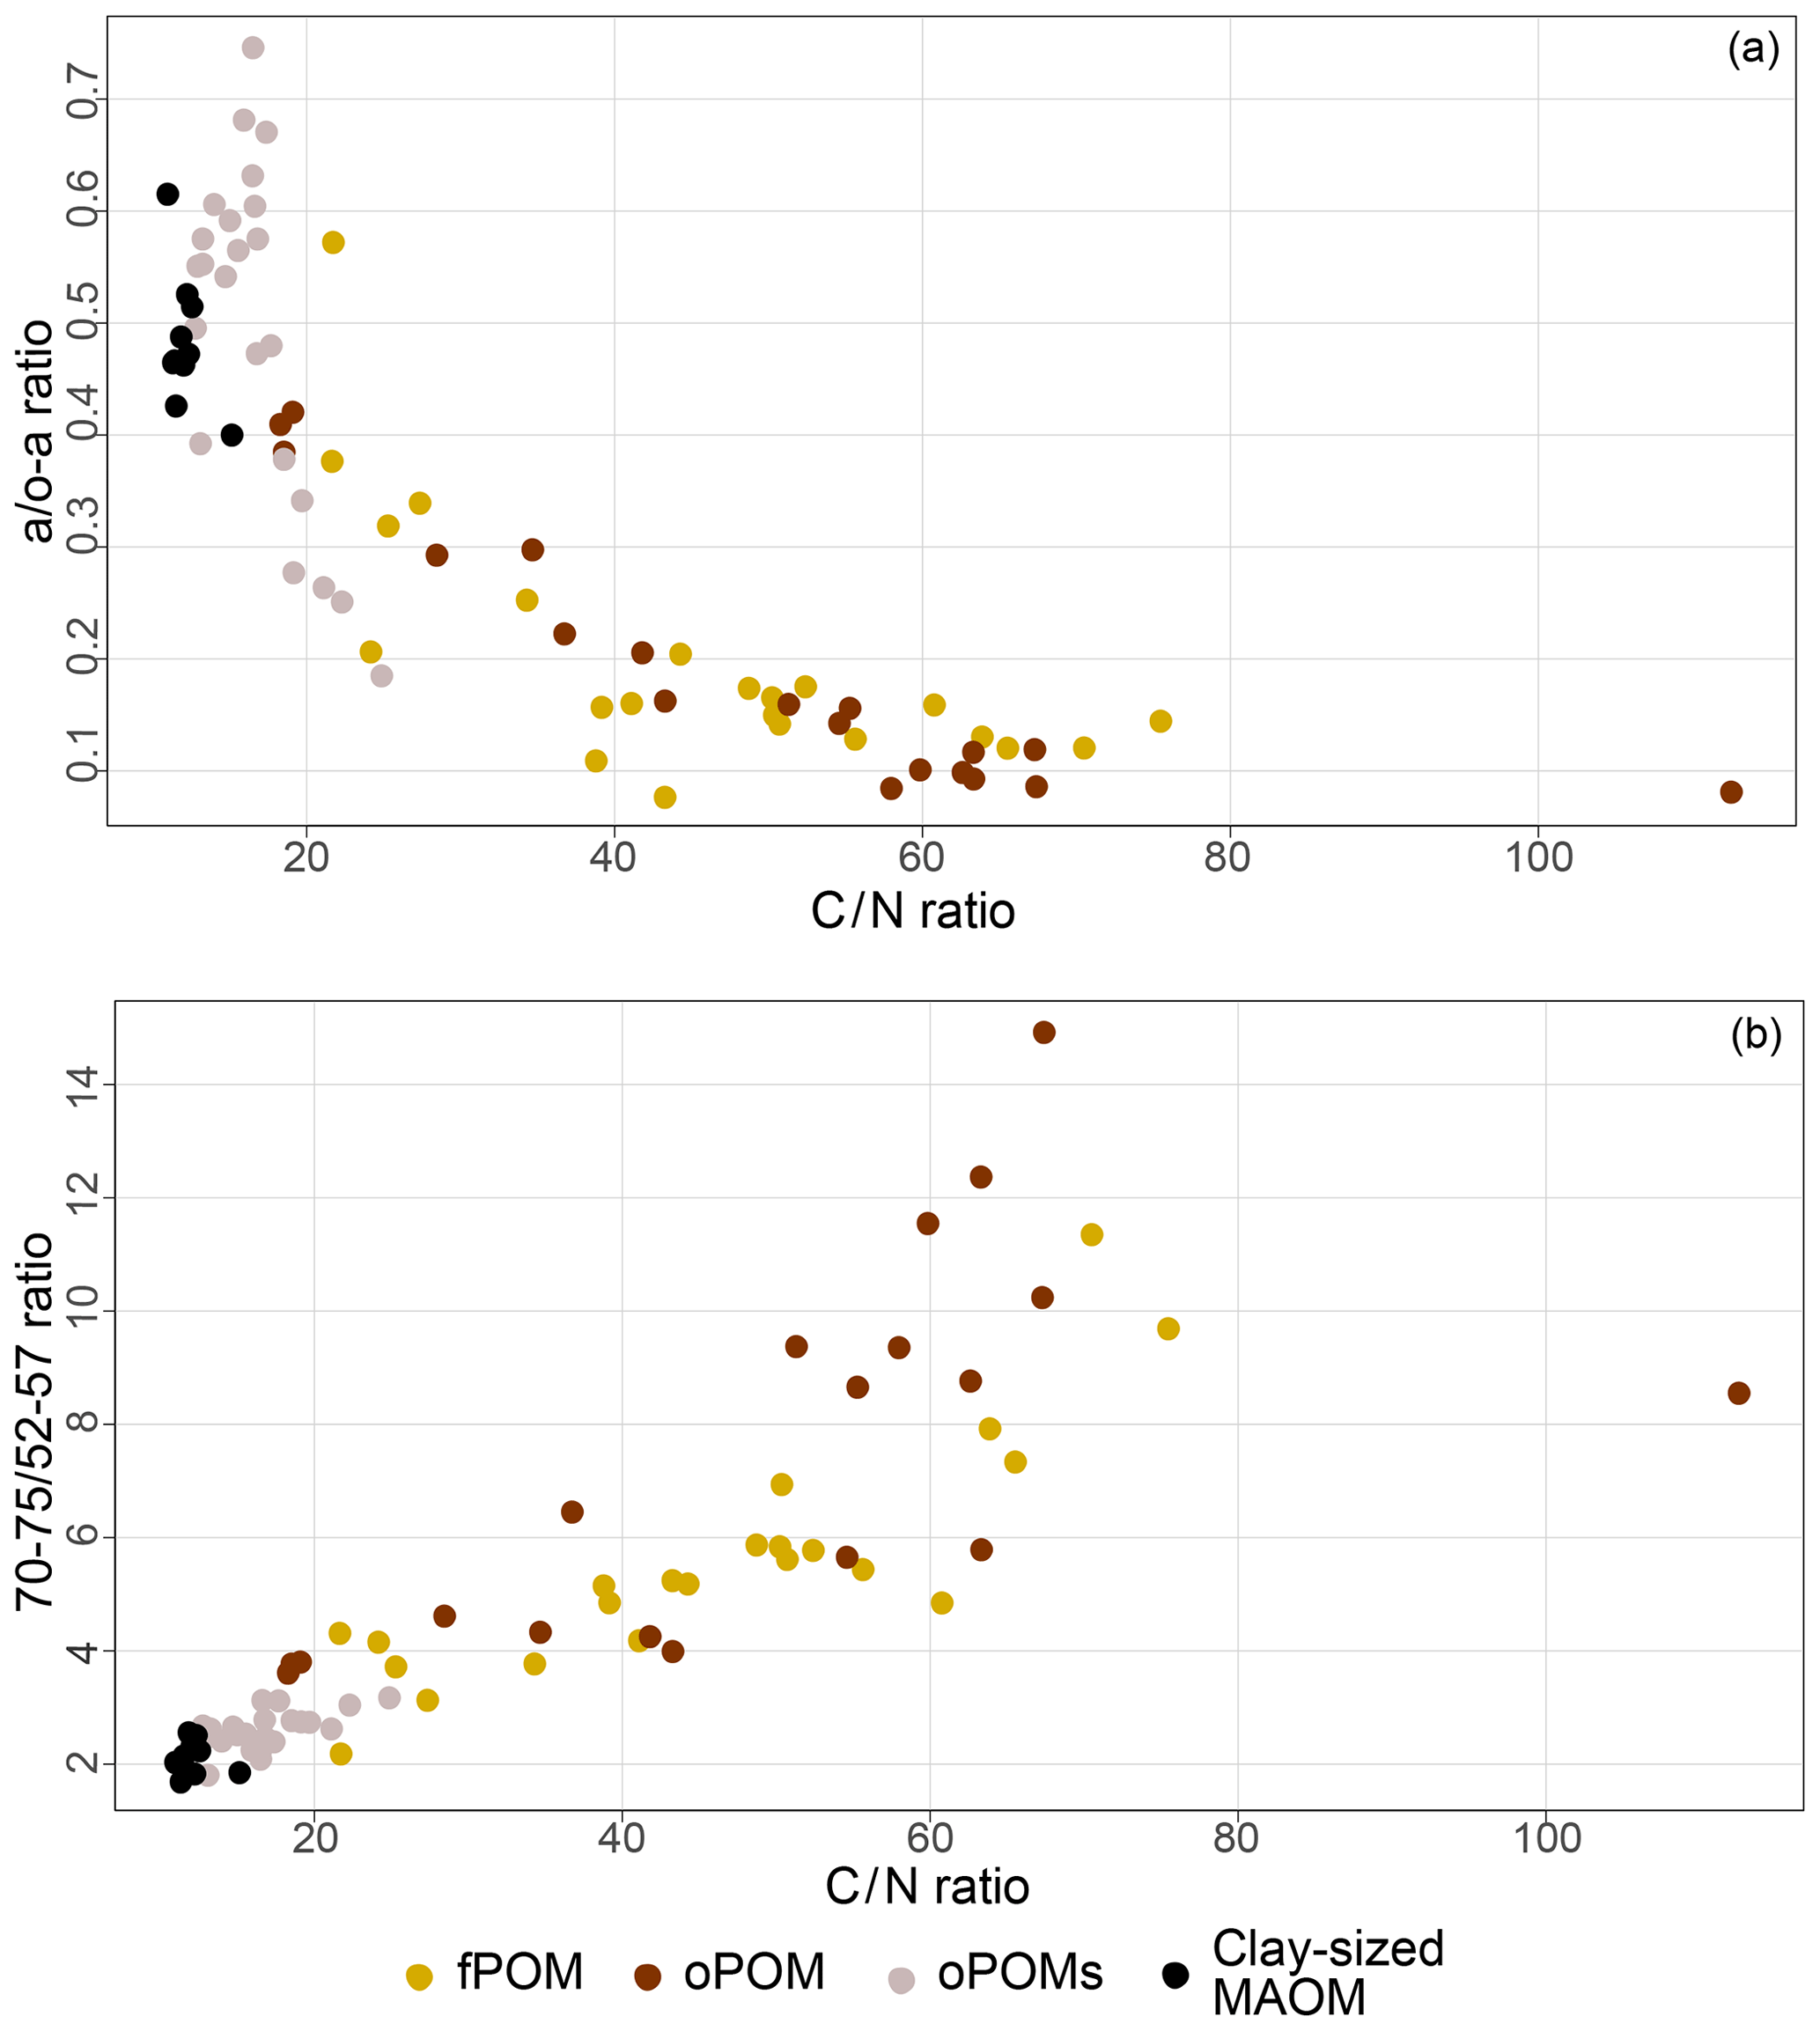
Figure 7Relation between decomposition proxies and the C∕N ratio of distinct SOM fractions: 13C CP-MAS NMR spectroscopy derived decomposition proxies for the a ∕ o-a ratio (a) and 70–75 ∕ 52–57 ratio (b) vs. the C∕N ratio for free particulate OM (fPOM), occluded particulate OM (oPOM), small occluded particulate OM (oPOMs) and clay-sized mineral-associated OM (MAOM).
By modeling the molecular composition of the SOM fractions using the MMM (Baldock et al., 2004; Nelson and Baldock, 2005), we obtained a clear differentiation between the large POM fractions (fPOM and oPOM) and small oPOM and clay-sized OM separates. The composition of the fPOM and oPOM fractions was rather similar: the percentage of carbohydrates (about 60 %) was highest, and at the same time, the contribution of lipids (about 8 %) was lowest in these fractions (Table 3). Overall, the composition of both large POM fractions was similar with slightly lower amounts of protein and slightly higher amounts of carbonyl in oPOM compared to fPOM. The usage of the MMM revealed once more clear differences between the large POM fractions and oPOMs and clay-sized MAOM. The latter fractions had a lower percentage of carbohydrates (about 40 %), whereas the percentage of protein and lipids was markedly higher. These fractions differed mainly in the proportion of protein and lipids, with clay-sized MAOM containing a larger proportion of protein but a smaller proportion of lipids (Table 3). The proportion of carbonyl was overall low with high deviations, while the percentage of lignin was rather constant throughout all four examined fractions.
The PCA executed on the examined fractions showed a slight correlation between the abundance of stable isotopes and NMR-derived decomposition proxies; yet, it confirmed the close relation between fPOM and oPOM and the positioning of oPOMs between large POM and clay-sized MAOM fractions (Fig. 5). The separation of the large POM fractions and oPOMs fractions provided correlation matrices with more details on the correlations (Fig. 8). While the PCA (Fig. 5) already hinted at this, the correlation matrices demonstrated that in the large POM fractions both δ15N and δ13C were slightly positively correlated with the 70–75 ∕ 52–57 ratio and negatively correlated with the a ∕ o-a ratio. The positive correlation between δ13C and the a ∕ o-a ratio was strong in the oPOMs fractions, and the negative correlation between δ13C and the 70–75 ∕ 52–57 ratio was more pronounced, whereas δ15N was not correlated with the 70–75 ∕ 52–57 ratio but negatively correlated with the a ∕ o-a ratio in the oPOMs fractions.
4.1 Cryoturbation determines bulk soil organic matter distribution
The projected mean C stock of 27.5±11.9 kg C m−3 corresponds to that reported in other studies from the Siberian Arctic (cf. Zubrzycki et al., 2014, where the authors demonstrated values between 6.6 and 48.0 kg C m−3 in their overview). Besides the large amount of sequestered C, a noteworthy amount of N is stored in permafrost-affected soils. Despite often being named as a decisive factor for plant growth in usually N-deficient tundra ecosystems (Weintraub and Schimel, 2005), soil N stocks strongly dominated by polymeric organic N might not be related to N availability for plants in the form of amino acids or mineral N. The values for N stocks of permafrost-affected soils reported by other authors (cf. Fuchs et al., 2018, and Zubrzycki et al., 2013, who demonstrated N stocks ranging between 1.1 and 2.2 kg N m−3) are similar to our results of 1.2±0.6 kg N m−3.
Table 3Results from the molecular mixing model with data obtained by 13C CP-MAS NMR spectroscopy and calculated according to the molecular mixing model by Baldock et al. (2004) and Nelson and Baldock (2005): five-component model (without char) with N / C constraint. Given are mean values and the standard deviation of free (fPOM), occluded (oPOM) and small occluded (oPOMs) particulate organic matter and of clay-sized mineral-associated organic matter (MAOM).
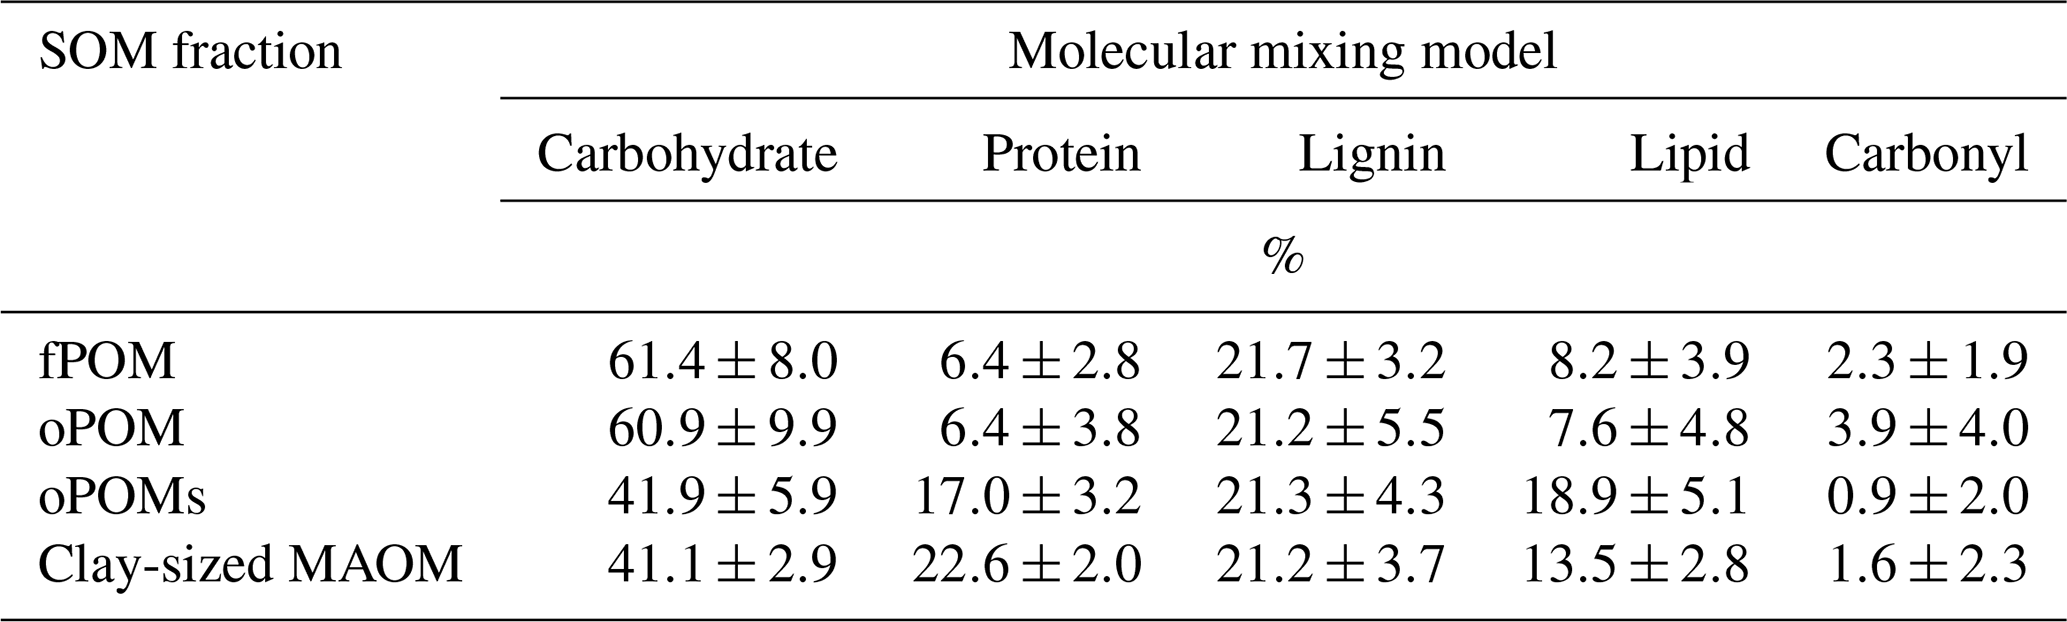

Figure 8Correlation matrices of POM fractions: the large POM (occluded particulate OM and free particulate OM) fractions (a) show different correlations compared to small occluded particulate OM fractions (b). The more intense the color and the smaller the ellipses are, the stronger the correlation is: blue indicates a positive correlation, and red indicates a negative correlation; the direction of ellipses is color-related.
The ample range of the bulk soil C∕N ratios points to a wide variance in composition and the degree of decay of SOM. The C∕N ratios notably differed both between the single depth layers and the overall soil cores. The variable bulk soil C∕N ratios with depth can be assigned to the translocation of fresh plant-derived OM from top- to subsoils by cryoturbation, leading to specific soil layers which also can contain so-called cryoturbated pockets rich in rather less decomposed OM with higher C∕N ratios (Kaiser et al., 2007; Krüger et al., 2014). Such an incorporation of OM in the subsoil is also confirmed by the high amounts of POM present in these depth increments dominated by rather fibrous plant residues. Between the analyzed cores, soils from three cores showed wider C∕N ratios indicative of the dominance of plant-derived OM, while the fourth core had lower C∕N ratios, pointing to a larger amount of microbial-derived OM. Generally, C∕N ratios decrease with ongoing decomposition (Kramer et al., 2003), as the proportion of microbial-derived OM with its characteristically low C∕N ratio increases after the depolymerization of plant-derived organic macromolecules. This goes along with the increased binding of microbial residues to mineral particle surfaces and thus OM becoming less bioavailable (Connin et al., 2001; Vitousek et al., 2002).
4.2 POM fractions dominate the C stock more strongly than the N stock
The large POM fractions (fPOM and oPOM) clearly dominated the C stocks (∼17 kg m−3) in the analyzed Cryosols, whereas small POM (oPOMs) and clay-sized MAOM represented slightly more than one third of the stored C (∼10 kg m−3). This nicely illustrates that rather large plant-derived fragments (see Fig. 9) dominate the C storage in these OM-rich Cryosols. Especially fPOM, mainly consisting of less decomposed plant material, largely contributes to both C and N stocks. However, in contrast to the C stocks, the oPOMs and clay-sized MAOM fractions act beside fPOM as major contributors to the N stock. A probably accelerated degradation of the fPOM fractions under continued warming could clearly alter the major contribution of the fPOM to the C stock. At the same time, the increased mineralization of fPOM could release vast amounts of N, which are assumed to further foster microbial OM mineralization. This would increase the importance of mineral N cycling such as microbial ammonification–immobilization turnover, compared to organic N cycling. As permafrost-affected soils are often waterlogged during the thawing season with changing oxygen availability and anoxic soil microsites, it can be assumed that in these soils nitrification and denitrification accelerate as well, thereby leading to associated increases in nitrous oxide emissions (Marushchak et al., 2011; Voigt et al., 2017). While a shift from aerobic to anaerobic conditions can hamper the overall decomposition of organic compounds, a shift from anaerobic to aerobic conditions, e.g., when a thawed Arctic soil is exposed to drying conditions, can accelerate decomposition (Keiluweit et al., 2017). With regard to consequences for the role of plants for C and N budgets, some studies point to more plant-available N leading to a changing flora and an increasing plant biomass that will possibly be able to counteract the soil C loss caused by thawing (Sistla et al., 2013; Keuper et al., 2017), while others question that gains in biomass will lead to a sufficient compensation for the loss in soil C (Salmon et al., 2016). No matter which of the predictions proves true, as the rather labile fPOM fractions store almost one third of the N in these soils, thawing will lead to a profound change in N budget and N cycling with presumably increasing N bioavailability and increasing importance of mineral N cycling (Voigt et al., 2017; Altshuler et al., 2019).
The C and N content, C∕N ratio, and decomposition proxies based on NMR spectra clearly group the particulate OM fractions into large POM (fPOM and oPOM) and small POM (oPOMs) (Table 1; Fig. 3). While the large POM fractions showed rather high C∕N ratios, the C∕N ratios of oPOMs were considerably lower. This demonstrates that oPOMs represent a discrete type of SOM consisting of smaller, more degraded organic fragments intimately connected with mineral particles, a presumption already made by Wagai et al. (2009) for small particulate OM. We assume that the distinct fibrous structure of the large POM fractions (see Fig. 9) drives the differentiation into large plant-derived, less decomposed POM and mostly microbial-dominated small POM in the studied permafrost-affected soils. The less decomposed fibrous fPOM and oPOM are hotspots for microbial activity and, thus, for the decay of these larger plant structures (Kuzyakov and Blagodatskaya, 2015). These hotspots for the formation of MAOM in Cryosols, plant residues in direct contact with silt- to clay-sized mineral particle surfaces, were already demonstrated on intact Cryosol cross sections using spectromicroscopic imaging (Mueller et al., 2017). The fibrous large POM provides a distinct network that entraps particles of smaller POM and MAOM and thereby retains especially the small POM fraction restricting its bioaccessibility. The particles of small OM (oPOMs) act as a linking element between the fresh less decomposed plant residues (fPOM and oPOM) and the clay-sized MAOM, to our knowledge a phenomenon not described before in permafrost-affected soils.
4.3 Isotopic composition demonstrates the fate of labile and recalcitrant organic compounds from POM to MAOM and the importance of biological N fixation
The δ13C values of all samples were well within the range of those obtained for SOM derived from plants with a C3 metabolism (Sharp, 2007). During the decomposition of plant-derived material, the changes in δ13C values are usually subtle and are determined by a variety of factors, especially by the composition of the original plant material (Ågren et al., 1996). Nevertheless, SOM compounds rich in presumably more recalcitrant macromolecules, like lignin or aromatic hydrocarbons, have lower δ13C values than labile compounds, like carbohydrates (Schmidt and Gleixner, 1997). Besides the δ13C value of the original plant litter input, soil δ13C values depend on several factors like climate, soil texture and major soil processes (Nel et al., 2018). We found clear positive correlations between the decomposition stage (a / o-a ratio, 70–75 ∕ 52–57 ratio and C∕N ratio) of the large POM fractions and δ13C (Fig. 8), which nicely illustrates the initial decomposition stage of the large POM with a relative dominance of labile OM rich in carbohydrates. This is supported by the negative correlation between δ13C and the rather recalcitrant lipids (aliphatic C based on NMR spectra) both in the large POM and oPOMs fractions (Fig. 8). This correlation reflects well the relative increase in aliphatic compounds with progressing decomposition (Benner et al., 1987), which corresponds to the fact that aliphatic compounds commonly show a lower 13C abundance (Schmidt and Gleixner, 1997). Thus, although we demonstrate clear mechanistic differences between large (fPOM and oPOM) and small POM (oPOMs) with respect to C sequestration, the decomposition in both OM pools follows the same fundamental principles. The positive correlation of δ13C in large and small POM with the bulk soil C∕N ratios demonstrates the dominance of the POM-C pool for the bulk soil C pool. Thus, the positive correlation between 13C and bulk soil C∕N reflects the larger amount of undecomposed plant residues in the large POM in some soil horizons, while it demonstrates an increased amount of aliphatic moieties in small POM for other soils horizons. Thus, the overall elemental composition of the bulk soils can directly be linked to the 13C isotopic composition of the fresh and more decomposed POM fractions.
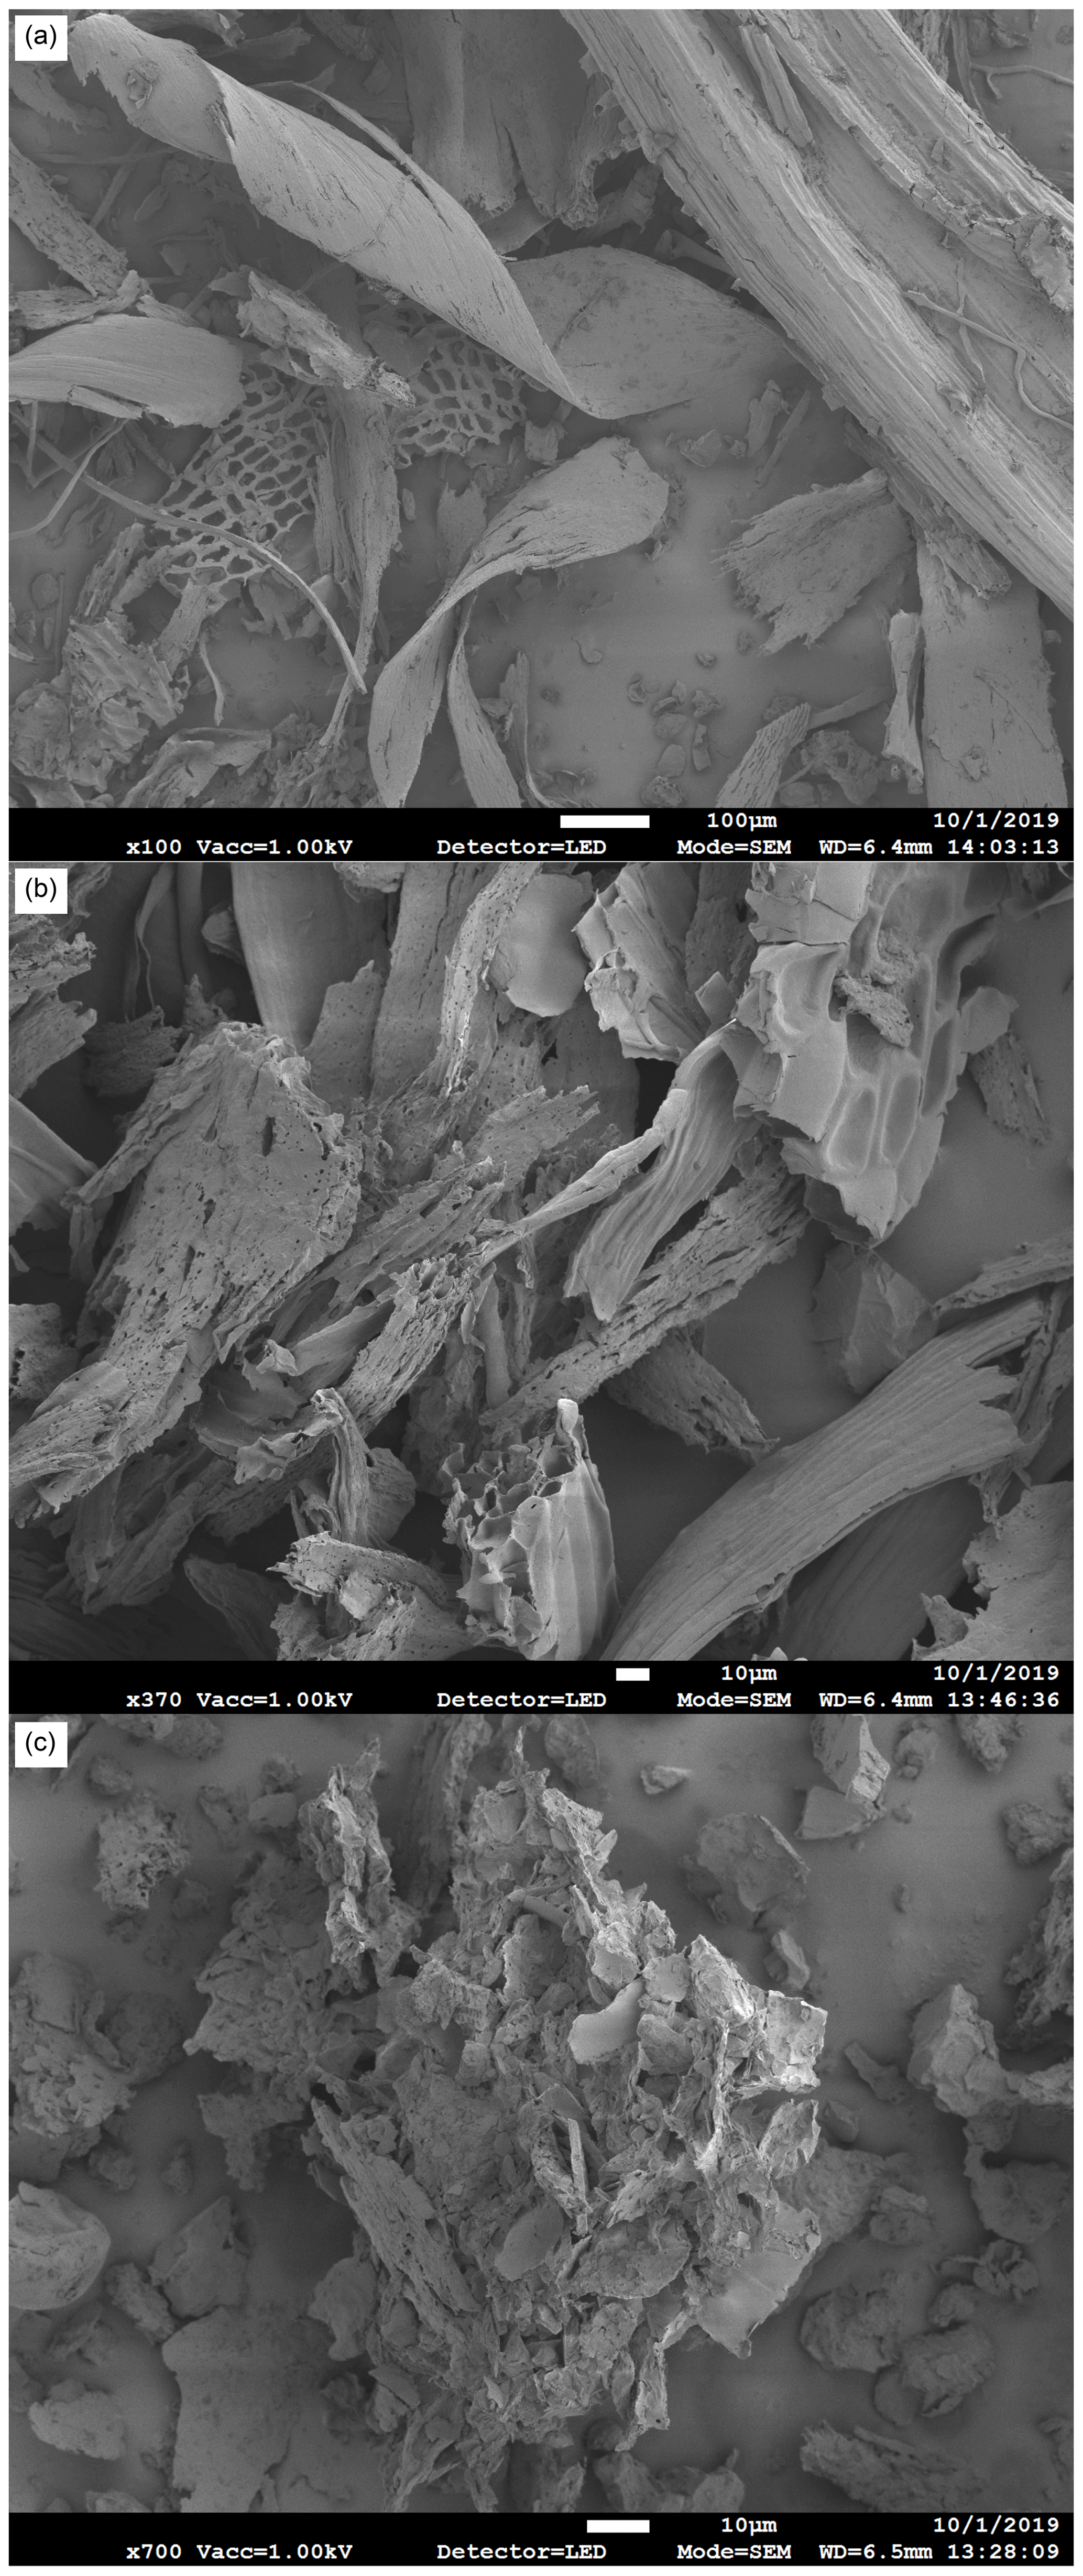
Figure 9Scanning electron micrographs of particulate organic matter fractions: while free particulate OM fraction (a) and occluded particulate OM fraction (b) consist mainly of larger particles of plant-derived litter with clearly visible cell structures and only minor indications for initial decomposition, the image of the small occluded particulate OM fraction (c) of the same sample clearly reveals the intricate association of small organic particles and silt- and clay-sized soil minerals.
In Arctic ecosystems, N2 fixation is known as the major N input into ecosystems (Granhall and Selander, 1973; Rousk et al., 2017, 2018) with N fixation rates between 1 and 29 , depending on which N2-fixing species (e.g., free-living or moss-associated cyanobacteria) is dominating (Rousk et al., 2017). Furthermore, Arctic soils are known to be dominated by organic N cycling rather than mineral N cycling (Hobbie and Hobbie, 2008), while atmospheric N deposition is low in this region (Hole et al., 2009). The soil δ15N values we found are consistent with δ15N values reported for bacterial N2 fixation as N source (Casciotti, 2009; Hoefs, 2015) but also similar to values reported for plant-litter-derived OM (Connin et al., 2001). Other studies reported stable or increasing δ15N values with advancing decomposition (e.g., Ågren et al., 1996; Connin et al., 2001). Increases in δ15N occur with enhanced decomposition, and N turnover is largely dependent on gaseous N loss processes, such as ammonia volatilization and nitrous oxide (N2O) and dinitrogen (N2) losses through nitrification and denitrification, as the highest isotope fractionation factors are reported for these processes, enriching the heavier 15N isotope in soil, while 14N is preferably lost to the atmosphere (Bedard-Haughn et al., 2003; Nel et al., 2018). By illustrating decreasing δ15N with increasing OM decomposition, our results seem to contradict this presumption. Therefore, we assume that biological N2 fixation is a decisive control of δ15N in the studied soils, as also recently shown for permafrost-affected soils of Tibet (Chang et al., 2017). Such a dominant role of biological N2 fixation in regulating δ15N requires that nitrification or denitrification and associated gaseous N losses as well as atmospheric inputs are not significant for the studied soils, which is in general agreement with the N cycle paradigm for the High Arctic (Schimel and Bennett, 2004).
4.4 Distinct differences in chemical composition from large POM to MAOM
By using NMR spectroscopy, we were able to differentiate further between large POM fractions (fPOM and oPOM) and oPOMs and clay-sized MAOM, which also allowed a nice clustering of these materials into distinctly different OM pools with respect to assumed bioavailability (see the representative example in Fig. S1). The NMR spectra of both large POM fractions were clearly dominated by a major peak around 70 ppm and a minor peak around 105 ppm, both relating to polysaccharides (Koelbl and Koegel-Knabner, 2004). This was well reflected by the calculated high amounts of carbohydrates, the high 70–75 ∕ 52–57 ratios and low a / o-a ratios, which all point to the rather labile undecomposed nature of the larger OM particles.
Based on both decomposition proxies pointing in the same direction, we assume a high potential bioavailability for both large POM fractions (fPOM and oPOM). Interestingly, when comparing the decomposition proxies between these two POM fractions per single soil layer (Table S3), they indicate a less pronounced decomposition for oPOM in most of the samples. These patterns deviate from what is commonly observed in temperate soils, i.e., an increased degree of decomposition with decreasing POM size and advancing aggregate occlusion (; Mueller and Koegel-Knabner, 2009). We assume that this demonstrates a reduced bioaccessibility (accessibility of OM by microorganisms and enzymes) of oPOM, which is encrusted by mineral particles, leading to a reduced degree of decomposition of the occluded as compared to the free POM. Thus, the initial microbial decomposition of the surfaces of fresh plant residues (fPOM) driven by microbial decay leads, in part, to the formation of oPOM due to the association with minerals glued to the POM surfaces by microbial residues (see Mueller et al., 2017), e.g., extracellular polymeric substances (Tisdall and Oades, 1982; Schimel and Schaeffer, 2012; Costa et al., 2018). We thus demonstrate soil structure formation in Cryosols as driven by microbial activity via the excretion of extracellular polymeric substances at POM surfaces leading to the stabilization of rather labile POM without necessarily leading to OM with high degrees of decomposition.
In contrast to the large POM fractions, the NMR spectra of oPOMs and clay-sized MAOM were dominated by peaks around 30 ppm representing long-chain structured aliphatic C derived for example from macromolecules like cutin or suberin (Koegel-Knabner, 2002). Irrespective of the high amount of alkyl C, the dominating group of compounds as calculated by the MMM were carbohydrates for both fractions, oPOMs and clay-sized MAOM (Table 3). Both fractions also showed distinct peaks around 170 to 175 ppm, representing partly esterified carboxyl groups and amide C that stems predominantly from proteins (Koelbl and Koegel-Knabner, 2004). Especially the clay-sized MAOM showed distinctly higher amounts of protein C (Table 3) compared to all POM fractions, which corroborates the preferential association of N-rich microbial residues at mineral surfaces (Kleber et al., 2007; Kopittke et al., 2018, 2020). This highlights the fact that the association of OM with mineral surfaces follows the same mechanisms as previously described for temperate soils (Kleber et al., 2007). In the specific context of the studied permafrost-affected soils, the oPOMs represented a kind of passage fraction. Although it clusters with the clay-sized MAOM in the PCA (Fig. 5), the small POM links to the large POM fractions as illustrated in Fig. 7. Thus, in contrast to the larger, relatively undecomposed plant residues, lipids and proteins contribute noteworthy to the oPOMs fractions and the fine MAOM of the clay-sized fraction. This clearly points to the increased amount of microbial-derived compounds in these fractions, as already stated above with respect to the C∕N ratio and δ15N. Thus, the MAOM in these soils is dominated by microbial-derived SOM rich in biologically fixed N. As demonstrated in the PCA and shown in Fig. 9, oPOMs is represented by degraded plant residues, fungal hyphae and amorphous material which can be assumed to mainly represent microbial necromass (Miltner et al., 2012). The PCA demonstrated that oPOMs represents a linking fraction between the initial plant residues of the large POM fractions and the microbial OM-dominated clay-sized MAOM (Fig. 5). However, it falls short to assume that all OM in POM fractions is fast-cycling and all MAOM is slow-cycling (Torn et al., 2013). Our results underline that the large and rather undecomposed POM fractions rich in carbohydrates might act as a highly bioavailable substrate in a warmer future. This means that when active layers deepen and the larger POM fractions become accessible to microorganisms, oPOMs and clay-sized MAOM may represent a C pool that is less bioavailable and thus presumably more persistent. Besides the demonstrated occlusion of particulate OM, we were able to show the quantitative importance of MAOM for the C storage in these High Arctic soils. Thus, the oPOMs and clay-sized MAOM representing altered and microbially transformed OM pools could gain importance regarding C storage under further thawing conditions in soils of the Arctic. Besides the importance for C sequestration, the high amount of biologically fixed N of MAOM may also be released and foster the microbial decay of the high amounts of C stored in larger POM fractions (Jilling et al., 2018).
Employing physical fractionation and molecular-level analyses, we show that the SOM fractions that contribute with about 17 kg C m−3 for more than 60 % of the C stocks in the investigated Arctic soils are presumably highly labile and vulnerable to environmental changes. In the face of global warming, most of this labile C, currently protected from decomposition by low temperatures, will be prone to mineralization, with severe consequences for the C stocks in Arctic soils. Our results clearly support our hypotheses that the major amount of C and N is stored as POM, with large POM resembling the composition of the initial plant litter. With increasing decomposition and, thus, decreasing size of the OM particles, the material gets microbially transformed, which leads to MAOM dominated by microbial residues, as indicated by C∕N ratios, 15N abundance and chemical composition. Organic C stored in small occluded POM and clay-sized MAOM that accounts with 10 kg C m−3 for about 40 % of the C stock currently will likely dominate the C pools, as it is less vulnerable to increased mineralization in Arctic soils in a warmer future. Small occluded POM was found to be acting as a transitional C pool between the larger POM fractions and MAOM, demonstrating the importance of the interfaces between particulate plant residues and the fine mineral fraction as hotspots for microbial activity and thus MAOM formation. Using δ15N as a proxy for N balances, we demonstrate the important role of N inputs by biological N fixation with an increasing contribution to organic matter N at a higher degree of decomposition, while gaseous N losses appear to be of minor importance. The large soil organic N stocks however might be at risk in future, as with about 0.4 kg N m−3 one third of the N is present in presumably bioavailable SOM fractions, which could lead to increases in mineral N cycling and associated N losses under the auspices of global warming.
The data that support the findings of this study are available from the corresponding author upon request.
The supplement related to this article is available online at: https://doi.org/10.5194/bg-17-3367-2020-supplement.
IP conducted analyses in the laboratory (elemental analysis and NMR measurements) and wrote the paper. SZ was responsible for the sampling and the selection of the respective cores. LCZF conducted analyses in the laboratory (fractionation, elemental analysis and NMR measurements). FB conducted stable isotope measurements. CWM developed the design of the study. IP, MD, GA and CWM were responsible for data evaluation and the interpretation of results. All authors discussed the data and results and contributed to the final form of the paper.
The authors declare that they have no conflict of interest.
We thank Maria Greiner for her assistance with the physical soil fractionation and the elemental analysis, Theresa Hautzinger for her support in the laboratory, and Stefanie Mayer for her support with statistical analyses in R.
This study was supported through the Cluster of Excellence “CliSAP” (no. EXC177), Universität Hamburg, funded through the German Research Foundation (DFG) and the BMBF project CARBOPERM (grant no.03G0836A). The analyses were partly supported by the DFG in the framework of the priority programme 1158 “Antarctic Research with Comparative Investigations in Arctic Ice Areas” (no. MU 3021/8). The work of Michael Dannenmann was supported through the DFG NIFROCLIM project (no. DA1217/4-1).
This paper was edited by Yakov Kuzyakov and reviewed by three anonymous referees.
Ågren, G. I., Bosatta, E., and Balesdent, J.: Isotope discrimination during decomposition of organic matter – a theoretical analysis, Soil Sci. Soc. Am. J., 60, 1121–1126, 1996.
Altshuler, I., Ronholm, J., Layton, A., Onstott, T. C., Greer, C. W., and Whyte, L. G.: Denitrifiers, nitrogen-fixing bacteria and N2O soil gas flux in high Arctic ice-wedge polygon cryosols, FEMS Microbiol. Ecol., 95, 1–12, https://doi.org/10.1093/femsec/fiz049, 2019.
Baldock, J. A., Oades, J. M., Nelson, P. N., Skene, T. M., Golchin, A., and Clarke, P.: Assessing the extent of decomposition of natural organic materials using solid-state 13C NMR spectroscopy, Aust. J. Soil Res., 35, 1061–83, https://doi.org/10.1071/S97004, 1997.
Baldock, J. A., Masiello, C. A., Gélinas, Y., and Hedges, J. I.: Cycling and composition of organic matter in terrestrial and marine ecosystems, Mar. Chem., 92, 39–64, https://doi.org/10.1016/j.marchem.2004.06.016, 2004.
Bedard-Haughn, A., Van Groenigen, J. W., and Van Kessel, C.: Tracing 15N through landscapes: Potential uses and precautions, J. Hydrol., 272, 175–190, https://doi.org/10.1016/S0022-1694(02)00263-9, 2003.
Benner, R., Fogel, M. L., Sprague, E. K., and Hodson, R. E.: Depletion of C in lignin and its implications for stable carbon isotope studies, Nature, 329, 708–710, https://doi.org/10.1038/329708a0, 1987.
Beudert, G., Kögel-Knabner, I., and Zech, W.: Micromorphological, wet-chemical and 13C NMR spectroscopic characterization of density fractionated forest soils, Sci. Total Environ., 81/82, 401–408, 1989.
Boike, J., Grüber, M., Langer, M., Piel, K., and Scheritz, M.: Orthomosaic of Samoylov Island, Lena Delta, Siberia, Alfred Wegener Inst. – Research Unit Potsdam, PANGAEA, https://doi.org/10.1594/PANGAEA.786073, 2012.
Boike, J., Kattenstroth, B., Abramova, K., Bornemann, N., Chetverova, A., Fedorova, I., Fröb, K., Grigoriev, M., Grüber, M., Kutzbach, L., Langer, M., Minke, M., Muster, S., Piel, K., Pfeiffer, E.-M., Stoof, G., Westermann, S., Wischnewski, K., Wille, C., and Hubberten, H.-W.: Baseline characteristics of climate, permafrost and land cover from a new permafrost observatory in the Lena River Delta, Siberia (1998–2011), Biogeosciences, 10, 2105–2128, https://doi.org/10.5194/bg-10-2105-2013, 2013.
Bonanomi, G., Incerti, G., Giannino, F., Mingo, A., Lanzotti, V., and Mazzoleni, S.: Litter quality assessed by solid state 13C NMR spectroscopy predicts decay rate better than C∕N and lignin ∕ N ratios, Soil Biol. Biochem., 56, 40–48, https://doi.org/10.1016/j.soilbio.2012.03.003, 2013.
Casciotti, K. L.: Inverse kinetic isotope fractionation during bacterial nitrite oxidation, Geochim. Cosmochim. Ac., 73, 2061–2076, https://doi.org/10.1016/j.gca.2008.12.022, 2009.
Chang, R., Wang, G., Yang, Y., and Chen, X.: Experimental warming increased soil nitrogen sink in the Tibetan permafrost, J. Geophys. Res.-Biogeo., 122, 1870–1879, https://doi.org/10.1002/2017JG003827, 2017.
Connin, S. L., Feng, X., and Virginia, R. A.: Isotopic discrimination during long-term decomposition in an arid land ecosystem, Soil Biol. Biochem., 33, 41–51, https://doi.org/10.1016/S0038-0717(00)00113-9, 2001.
Costa, O. Y. A., Raaijmakers, J. M., and Kuramae, E. E.: Microbial extracellular polymeric substances: Ecological function and impact on soil aggregation, Front. Microbiol., 9, 1–14, https://doi.org/10.3389/fmicb.2018.01636, 2018.
Dao, T. T., Gentsch, N., Mikutta, R., Sauheitl, L., Shibistova, O., Wild, B., Schnecker, J., Bárta, J., Čapek, P., Gittel, A., Lashchinskiy, N., Urich, T., Šantrůčková, H., Richter, A., and Guggenberger, G.: Fate of carbohydrates and lignin in north-east Siberian permafrost soils, Soil Biol. Biochem., 116, 311–322, https://doi.org/10.1016/j.soilbio.2017.10.032, 2018.
Davidson, E. A. and Janssens, I. A.: Temperature sensitivity of soil carbon decomposition and feedbacks to climate change, Nature, 440, 165–173, https://doi.org/10.1038/nature04514, 2006.
Diochon, A., Gregorich, E. G., and Tarnocai, C.: Evaluating the quantity and biodegradability of soil organic matter in some Canadian Turbic Cryosols, Geoderma, 202–203, 82–87, https://doi.org/10.1016/j.geoderma.2013.03.013, 2013.
Dutta, K., Schuur, E. A. G., Neff, J. C., and Zimov, S. A.: Potential carbon release from permafrost soils of Northeastern Siberia, Glob. Chang. Biol., 12, 2336–2351, https://doi.org/10.1111/j.1365-2486.2006.01259.x, 2006.
Elberling, B., Christiansen, H. H., and Hansen, B. U.: High nitrous oxide production from thawing permafrost, Nat. Geosci., 3, 332–335, https://doi.org/10.1038/ngeo803, 2010.
Frank, D. A., Pontes, A. W., and McFarlane, K. J.: Controls on soil organic carbon stocks and turnover among North American ecosystems, Ecosystems, 15, 604–615, https://doi.org/10.1007/s10021-012-9534-2, 2012.
Fuchs, M., Grosse, G., Strauss, J., Günther, F., Grigoriev, M., Maximov, G. M., and Hugelius, G.: Carbon and nitrogen pools in thermokarst-affected permafrost landscapes in Arctic Siberia, Biogeosciences, 15, 953–971, https://doi.org/10.5194/bg-15-953-2018, 2018.
Gentsch, N., Mikutta, R., Shibistova, O., Wild, B., Schnecker, J., Richter, A., Urich, T., Gittel, A., Šantrůčková, H., Bárta, J., Lashchinskiy, N., Mueller, C. W., Fuß, R., and Guggenberger, G.: Properties and bioavailability of particulate and mineral-associated organic matter in Arctic permafrost soils, Lower Kolyma Region, Russia, Eur. J. Soil Sci., 66, 722–734, https://doi.org/10.1111/ejss.12269, 2015.
Golchin, A., Oades, J. M., Skjemstad, J. O., and Clarke, P.: Study of free and occluded particulate organic matter in soils by solid state 13C CP/MAS NMR spectroscopy and scanning electron microscopy, Aust. J. Soil Res., 32, 285–309, 1994.
Graf-Rosenfellner, M., Kayser, G., Guggenberger, G., Kaiser, K., Büks, F., Kaiser, M., Mueller, C. W., Schrumpf, M., Rennert, T., Welp, G., and Lang, F.: Replicability of aggregate disruption by sonication – an inter-laboratory test using three different soils from Germany, J. Plant Nutr. Soil Sc., 181, 894–904, https://doi.org/10.1002/jpln.201800152, 2018.
Granhall, U. and Selander, H.: Nitrogen fixation in a Subarctic mire, Oikos, 24, 8–15, 1973.
Harden, J. W., Koven, C. D., Ping, C. L., Hugelius, G., David McGuire, A., Camill, P., Jorgenson, T., Kuhry, P., Michaelson, G. J., O'Donnell, J. A., Schuur, E. A. G., Tarnocai, C., Johnson, K., and Grosse, G.: Field information links permafrost carbon to physical vulnerabilities of thawing, Geophys. Res. Lett., 39, L15704, https://doi.org/10.1029/2012GL051958, 2012.
Herndon, E. M., Yang, Z., Bargar, J., Janot, N., Regier, T. Z., Graham, D. E., Wullschleger, S. D., Gu, B., and Liang, L.: Geochemical drivers of organic matter decomposition in Arctic tundra soils, Biogeochemistry, 126, 397–414, https://doi.org/10.1007/s10533-015-0165-5, 2015.
Hobbie, E. A. and Hobbie, J. E.: Natural abundance of 15N in nitrogen-limited forests and tundra can estimate nitrogen cycling through mycorrhizal fungi: A review, Ecosystems, 11, 815–830, https://doi.org/10.1007/s10021-008-9159-7, 2008.
Hoefs, J.: Stable isotope geochemistry, 7th Edn., Springer International Publishing, Cham, Heidelberg, New York, Dordrecht, London, 2015.
Höfle, S., Rethemeyer, J., Mueller, C. W., and John, S.: Organic matter composition and stabilization in a polygonal tundra soil of the Lena Delta, Biogeosciences, 10, 3145–3158, https://doi.org/10.5194/bg-10-3145-2013, 2013.
Hole, L. R., Christensen, J. H., Ruoho-Airola, T., Tørseth, K., Ginzburg, V., and Glowacki, P.: Past and future trends in concentrations of sulphur and nitrogen compounds in the Arctic, Atmos. Environ., 43, 928–939, https://doi.org/10.1016/j.atmosenv.2008.10.043, 2009.
Hugelius, G., Strauss, J., Zubrzycki, S., Harden, J. W., Schuur, E. A. G., Ping, C.-L., Schirrmeister, L., Grosse, G., Michaelson, G. J., Koven, C. D., O'Donnell, J. A., Elberling, B., Mishra, U., Camill, P., Yu, Z., Palmtag, J., and Kuhry, P.: Estimated stocks of circumpolar permafrost carbon with quantified uncertainty ranges and identified data gaps, Biogeosciences, 11, 6573–6593, https://doi.org/10.5194/bg-11-6573-2014, 2014.
Hultman, J., Waldrop, M. P., Mackelprang, R., David, M. M., McFarland, J., Blazewicz, S. J., Harden, J., Turetsky, M. R., McGuire, A. D., Shah, M. B., VerBerkmoes, N. C., Lee, L. H., Mavrommatis, K., and Jansson, J. K.: Multi-omics of permafrost, active layer and thermokarst bog soil microbiomes, Nature, 521, 208–212, https://doi.org/10.1038/nature14238, 2015.
IUSS Working Group WRB: World reference base for soil resources 2014. International soil classification system for naming soils and creating legends for soil maps, FAO, Rome, 2014.
Jilling, A., Keiluweit, M., Contosta, A. R., Frey, S., Schimel, J., Schnecker, J., Smith, R. G., Tiemann, L., and Grandy, A. S.: Minerals in the rhizosphere: Overlooked mediators of soil nitrogen availability to plants and microbes, Biogeochemistry, 139, 103–122, https://doi.org/10.1007/s10533-018-0459-5, 2018.
Jongejans, L. L., Strauss, J., Lenz, J., Peterse, F., Mangelsdorf, K., Fuchs, M., and Grosse, G.: Organic matter characteristics in yedoma and thermokarst deposits on Baldwin Peninsula, west Alaska, Biogeosciences, 15, 6033–6048, https://doi.org/10.5194/bg-15-6033-2018, 2018.
Kaiser, C., Meyer, H., Biasi, C., Rusalimova, O., Barsukov, P., and Richter, A.: Conservation of soil organic matter through cryoturbation in Arctic soils in Siberia, J. Geophys. Res.-Biogeo., 112, G02017, https://doi.org/10.1029/2006JG000258, 2007.
Kartoziia, A.: Assessment of the ice wedge polygon current state by means of UAV imagery analysis (Samoylov Island, the Lena Delta), Remote Sens., 11, 1627, https://doi.org/10.3390/rs11131627, 2019.
Keiluweit, M., Wanzek, T., Kleber, M., Nico, P., and Fendorf, S.: Anaerobic microsites have an unaccounted role in soil carbon stabilization, Nat. Commun., 8, 1771, https://doi.org/10.1038/s41467-017-01406-6, 2017.
Keuper, F., Dorrepaal, E., van Bodegom, P. M., van Logtestijn, R., Venhuizen, G., van Hal, J., and Aerts, R.: Experimentally increased nutrient availability at the permafrost thaw front selectively enhances biomass production of deep-rooting subarctic peatland species, Glob. Change Biol., 23, 4257–4266, https://doi.org/10.1111/gcb.13804, 2017.
Kleber, M., Sollins, P., and Sutton, R.: A conceptual model of organo-mineral interactions in soils: Self-assembly of organic molecular fragments into zonal structures on mineral surfaces, Biogeochemistry, 85, 9–24, https://doi.org/10.1007/s10533-007-9103-5, 2007.
Koegel-Knabner, I.: The macromolecular organic composition of plant and microbial residues as inputs to soil organic matter, Soil Biol. Biochem., 34, 139–162, 2002.
Koelbl, A. and Koegel-Knabner, I.: Content and composition of free and occluded particulate organic matter in a differently textured arable Cambisol as revealed by solid-state 13C NMR spectroscopy, J. Plant Nutr. Soil Sc., 167, 45–53, https://doi.org/10.1002/jpln.200321185, 2004.
Kopittke, P. M., Hernandez-Soriano, M. C., Dalal, R. C., Finn, D., Menzies, N. W., Hoeschen, C., and Mueller, C. W.: Nitrogen-rich microbial products provide new organo-mineral associations for the stabilization of soil organic matter, Glob. Change Biol., 24, 1762–1770, https://doi.org/10.1111/gcb.14009, 2018.
Kopittke, P. M., Dalal, R. C., Hoeschen, C., Li, C., Menzies, N. W., and Mueller, C. W.: Soil organic matter is stabilized by organo-mineral associations through two key processes: The role of the carbon to nitrogen ratio, Geoderma, 357, 113974, https://doi.org/10.1016/j.geoderma.2019.113974, 2020.
Kramer, M. G., Sollins, P., Sletten, R. S., and Swart, P. K.: N isotope fractionation and measures of organic matter alternation during decomposition, Ecology, 84, 2021–2025, 2003.
Krüger, J. P., Leifeld, J., and Alewell, C.: Degradation changes stable carbon isotope depth profiles in palsa peatlands, Biogeosciences, 11, 3369–3380, https://doi.org/10.5194/bg-11-3369-2014, 2014.
Kuhry, P., Bárta, J., Blok, D., Elberling, B., Faucherre, S., Hugelius, G., Jørgensen, C. J., Richter, A., Šantrůčková, H., and Weiss, N.: Lability classification of soil organic matter in the northern permafrost region, Biogeosciences, 17, 361–379, https://doi.org/10.5194/bg-17-361-2020, 2020.
Kuzyakov, Y. and Blagodatskaya, E.: Microbial hotspots and hot moments in soil: Concept and review, Soil Biol. Biochem., 83, 184–199, https://doi.org/10.1016/j.soilbio.2015.01.025, 2015.
Lê, S., Josse, J., and Husson, F.: FactoMineR: An R package for multivariate analysis, available at: http://factominer.free.fr/index.html (last access: 23 January 2020), 2008.
Lehmann, J. and Kleber, M.: The contentious nature of soil organic matter, Nature, 528, 60–68, https://doi.org/10.1038/nature16069, 2015.
Mackelprang, R., Waldrop, M. P., Deangelis, K. M., David, M. M., Chavarria, K. L., Blazewicz, S. J., Rubin, E. M., and Jansson, J. K.: Metagenomic analysis of a permafrost microbial community reveals a rapid response to thaw, Nature, 480, 368–371, https://doi.org/10.1038/nature10576, 2011.
Marushchak, M. E., Pitkämäki, A., Koponen, H., Biasi, C., Seppälä, M., and Martikainen, P. J.: Hot spots for nitrous oxide emissions found in different types of permafrost peatlands, Glob. Change Biol., 17, 2601–2614, https://doi.org/10.1111/j.1365-2486.2011.02442.x, 2011.
Meredith, M., Sommerkorn, M., Cassotta, S., Derksen, C., Ekaykin, A., Hollowed, A., Kofinas, G., Mackintosh, A., Melbourne-Thomas, J., Muelbert, M. M. C., Ottersen, G., Pritchard, H., and Schuur, E. A. G.: Polar regions, in: IPCC Special Report on the Ocean and Cryosphere in a Changing Climate, edited by: Pörtner, H.-O., Roberts, D. C., Masson-Delmotte, V., Zhai, P., Tignor, M., Poloczanska, E., Mintenbeck, K., Alegria, A., Nicolai, M., Okem, A., Petzold, J., Rama, B., and Weyer, N. M., Cambridge University Press, Cambridge, 2019.
Miltner, A., Bombach, P., Schmidt-Brücken, B., and Kästner, M.: SOM genesis: Microbial biomass as a significant source, Biogeochemistry, 111, 41–55, https://doi.org/10.1007/s10533-011-9658-z, 2012.
Mueller, C. W. and Koegel-Knabner, I.: Soil organic carbon stocks, distribution, and composition affected by historic land use changes on adjacent sites, Biol. Fert. Soils, 45, 347–359, https://doi.org/10.1007/s00374-008-0336-9, 2009.
Mueller, C. W., Rethemeyer, J., Kao-Kniffin, J., Löppmann, S., Hinkel, K. M., and Bockheim, J. G.: Large amounts of labile organic carbon in permafrost soils of northern Alaska, Glob. Change Biol., 21, 2804–2817, https://doi.org/10.1111/gcb.12876, 2015.
Mueller, C. W., Hoeschen, C., Steffens, M., Buddenbaum, H., Hinkel, K., Bockheim, J. G., and Kao-Kniffin, J.: Microscale soil structures foster organic matter stabilization in permafrost soils, Geoderma, 293, 44–53, https://doi.org/10.1016/j.geoderma.2017.01.028, 2017.
Nel, J. A., Craine, J. M., and Cramer, M. D.: Correspondence between δ13C and δ15N in soils suggests coordinated fractionation processes for soil C and N, Plant Soil, 423, 257–271, https://doi.org/10.1007/s11104-017-3500-x, 2018.
Nelson, P. N. and Baldock, J. A.: Estimating the molecular composition of a diverse range of natural organic materials from solid-state 13C NMR and elemental analyses, Biogeochemistry, 72, 1–34, https://doi.org/10.1007/s10533-004-0076-3, 2005.
Oades, J. M.: The Retention of organic matter in soils, Biogeochemistry, 5, 35–70, https://doi.org/10.1007/BF02180317, 1988.
Oechel, W. C., Hastings, S. J., Vourlitis, G., Jenkins, M., Riechers, G., and Grulke, N.: Recent change of Arctic tundra ecosystems from a net carbon dioxide sink to a source, Nature, 361, 520–523, https://doi.org/10.1038/361520a0, 1993.
Parmentier, F. J. W., Christensen, T. R., Rysgaard, S., Bendtsen, J., Glud, R. N., Else, B., van Huissteden, J., Sachs, T., Vonk, J. E., and Sejr, M. K.: A synthesis of the Arctic terrestrial and marine carbon cycles under pressure from a dwindling cryosphere, Ambio, 46, 53–69, https://doi.org/10.1007/s13280-016-0872-8, 2017.
Ping, C. L., Jastrow, J. D., Jorgenson, M. T., Michaelson, G. J., and Shur, Y. L.: Permafrost soils and carbon cycling, Soil, 1, 147–171, https://doi.org/10.5194/soil-1-147-2015, 2015.
Plaza, C., Pegoraro, E., Bracho, R., Celis, G., Crummer, K. G., Hutchings, J. A., Hicks Pries, C. E., Mauritz, M., Natali, S. M., Salmon, V. G., Schädel, C., Webb, E. E., and Schuur, E. A. G.: Direct observation of permafrost degradation and rapid soil carbon loss in tundra, Nat. Geosci., 12, 627–631, https://doi.org/10.1038/s41561-019-0387-6, 2019.
Post, W. M., Emanuel, W. R., Zinke, P. J., and Stangenberger, A. G.: Soil carbon pools and world life zones, Nature, 298, 156–159, https://doi.org/10.1038/298156a0, 1982.
R Development Core Team: R, available at: http://www.r-project.org (last access: 23 January 2020), 2017.
Roshydromet: World Weather Information Service, available at: http://www.worldweather.org/en/city.html?cityId=1040 (last access: 21 January 2020), 2019.
Rousk, K., Sorensen, P. L., and Michelsen, A.: Nitrogen fixation in the High Arctic: A source of “new” nitrogen?, Biogeochemistry, 136, 213–222, https://doi.org/10.1007/s10533-017-0393-y, 2017.
Rousk, K., Sorensen, P. L., and Michelsen, A.: What drives biological nitrogen fixation in High Arctic tundra: Moisture or temperature?, Ecosphere, 9, e02117, https://doi.org/10.1002/ecs2.2117, 2018.
RStudio Team: RStudio: Integrated Development Environment for R, available at: http://www.rstudio.com (last access: 18 November 2019), 2016.
Salmon, V. G., Soucy, P., Mauritz, M., Celis, G., Natali, S. M., Mack, M. C. and Schuur, E. A. G.: Nitrogen availability increases in a tundra ecosystem during five years of experimental permafrost thaw, Glob. Change Biol., 22, 1927–1941, https://doi.org/10.1111/gcb.13204, 2016.
Schimel, J. P. and Bennett, J.: Nitrogen mineralization: Challenges of a changing paradigm, Ecology, 85, 591–602, https://doi.org/10.1890/03-8002, 2004.
Schimel, J. P. and Schaeffer, S. M.: Microbial control over carbon cycling in soil, Front. Microbiol., 3, 348, https://doi.org/10.3389/fmicb.2012.00348, 2012.
Schmidt, H.-L. and Gleixner, G.: Carbon isotope effects on key reactions in plant metabolism and 13C-patterns in natural compounds, in: Stable Isotopes–The Integration of Biological, Ecological and Geochemical Processes, edited by: Griffiths, H., CRC Press, Oxford, 1997.
Schmidt, M. W. I., Torn, M. S., Abiven, S., Dittmar, T., Guggenberger, G., Janssens, I. A., Kleber, M., Kögel-Knabner, I., Lehmann, J., Manning, D. A. C., Nannipieri, P., Rasse, D. P., Weiner, S., and Trumbore, S. E.: Persistence of soil organic matter as an ecosystem property, Nature, 478, 49–56, https://doi.org/10.1038/nature10386, 2011.
Schuur, E. A. G., McGuire, A. D., Schädel, C., Grosse, G., Harden, J. W., Hayes, D. J., Hugelius, G., Koven, C. D., Kuhry, P., Lawrence, D. M., Natali, S. M., Olefeldt, D., Romanovsky, V. E., Schaefer, K., Turetsky, M. R., Treat, C. C., and Vonk, J. E.: Climate change and the permafrost carbon feedback, Nature, 520, 171–179, https://doi.org/10.1038/nature14338, 2015.
Sharp, Z.: Principles of stable isotope geochemistry, Pearson Education, Albuquerque, New Mexico, 2007.
Sistla, S. A., Moore, J. C., Simpson, R. T., Gough, L., Shaver, G. R., and Schimel, J. P.: Long-term warming restructures Arctic tundra without changing net soil carbon storage, Nature, 497, 615–617, https://doi.org/10.1038/nature12129, 2013.
Six, J., Conant, R. T., Paul, E. A., and Paustian, K.: Stabilization mechanisms of protected versus unprotected soil organic matter: Implications for C-saturation of soils, Plant Soil, 241, 155–176, https://doi.org/10.1023/A:1016125726789, 2002.
Soil Survey Staff: Keys to Soil Taxonomy, 12th Edn., USDA-Natural Resources Conservation Service, Washington, DC, 2014.
Strauss, J., Schirrmeister, L., Grosse, G., Fortier, D., Hugelius, G., Knoblauch, C., Romanovsky, V., Schädel, C., Schneider von Deimling, T., Schuur, E. A. G., Shmelev, D., Ulrich, M., and Veremeeva, A.: Deep Yedoma permafrost: A synthesis of depositional characteristics and carbon vulnerability, Earth-Sci. Rev., 172, 75–86, https://doi.org/10.1016/j.earscirev.2017.07.007, 2017.
Tarnocai, C., Canadell, J. G., Schuur, E. A. G., Kuhry, P., Mazhitova, G. and Zimov, S.: Soil organic carbon pools in the northern circumpolar permafrost region, Global Biogeochem. Cy., 23, GB2023, https://doi.org/10.1029/2008GB003327, 2009.
Tesi, T., Muschitiello, F., Smittenberg, R. H., Jakobsson, M., Vonk, J. E., Hill, P., Andersson, A., Kirchner, N., Noormets, R., Dudarev, O., Semiletov, I., and Gustafsson, Ö.: Massive remobilization of permafrost carbon during post-glacial warming, Nat. Commun., 7, 13653, https://doi.org/10.1038/ncomms13653, 2016.
Tisdall, J. M. and Oades, J. M.: Organic matter and water-stable aggregates in soils, J. Soil Sci., 33, 141–163, https://doi.org/10.1111/j.1365-2389.1982.tb01755.x, 1982.
Torn, M. S., Kleber, M., Zavaleta, E. S., Zhu, B., Field, C. B., and Trumbore, S. E.: A dual isotope approach to isolate soil carbon pools of different turnover times, Biogeosciences, 10, 8067–8081, https://doi.org/10.5194/bg-10-8067-2013, 2013.
Turetsky, M. R.: Decomposition and organic matter quality in continental peatlands: The ghost of permafrost past, Ecosystems, 7, 740–750, https://doi.org/10.1007/s10021-004-0247-z, 2004.
Vitousek, P. M., Hättenschwiler, S., Olander, L., and Allison, S.: Nitrogen and nature, Ambio, 31, 97–101, 2002.
Voigt, C., Marushchak, M. E., Lamprecht, R. E., Jackowicz-Korczyński, M., Lindgren, A., Mastepanov, M., Granlund, L., Christensen, T. R., Tahvanainen, T., Martikainen, P. J., and Biasi, C.: Increased nitrous oxide emissions from Arctic peatlands after permafrost thaw, P. Natl. Acad. Sci. USA, 114, 6238–6243, https://doi.org/10.1073/pnas.1702902114, 2017.
von Lützow, M., Kögel-Knabner, I., Ekschmitt, K., Matzner, E., Guggenberger, G., Marschner, B., and Flessa, H.: Stabilization of organic matter in temperate soils: Mechanisms and their relevance under different soil conditions – a review, Eur. J. Soil Sci., 57, 426–445, https://doi.org/10.1111/j.1365-2389.2006.00809.x, 2006.
Wagai, R., Mayer, L. M., and Kitayama, K.: Nature of the “occluded” low-density fraction in soil organic matter studies: A critical review, Soil Sci. Plant Nut., 55, 13–25, https://doi.org/10.1111/j.1747-0765.2008.00356.x, 2009.
Weintraub, M. N. and Schimel, J. P.: Nitrogen cycling and the spread of shrubs control changes in the carbon balance of Arctic tundra ecosystems, Bioscience, 55, 408–415, https://doi.org/10.1641/0006-3568(2005)055[0408:NCATSO]2.0.CO;2, 2005.
Weiss, N. and Kaal, J.: Characterization of labile organic matter in Pleistocene permafrost (NE Siberia), using thermally assisted hydrolysis and methylation (THM-GC-MS), Soil Biol. Biochem., 117, 203–213, https://doi.org/10.1016/j.soilbio.2017.10.001, 2018.
Werner, R. A. and Brand, W. A.: Referencing strategies and techniques in stable isotope ratio analysis, Rapid Commun. Mass Sp., 15, 501–519, https://doi.org/10.1002/rcm.258, 2001.
Wild, B., Gentsch, N., Capek, P., Diáková, K. K., Alves, R. J. E. E., Bárta, J. J. J., Gittel, A., Hugelius, G., Knoltsch, A., Kuhry, P., Lashchinskiy, N., Mikutta, R., Palmtag, J., Schleper, C., Schnecker, J., Shibistova, O., Takriti, M., Torsvik, V. L., Urich, T., Watzka, M., Šantrūcková, H., Guggenberger, G., Richter, A., Čapek, P., Diáková, K. K., Alves, R. J. E. E., Bárta, J. J. J., Gittel, A., Hugelius, G., Knoltsch, A., Kuhry, P., Lashchinskiy, N., Mikutta, R., Palmtag, J., Schleper, C., Schnecker, J., Shibistova, O., Takriti, M., Torsvik, V. L., Urich, T., Watzka, M., Šantrůčková, H., Guggenberger, G., and Richter, A.: Plant-derived compounds stimulate the decomposition of organic matter in Arctic permafrost soils, Sci. Rep., 6, 25607, https://doi.org/10.1038/srep25607, 2016.
Wilkerson, J., Dobosy, R., Sayres, D. S., Healy, C., Dumas, E., Baker, B., and Anderson, J. G.: Permafrost nitrous oxide emissions observed on a landscape scale using the airborne eddy-covariance method, Atmos. Chem. Phys., 19, 4257–4268, https://doi.org/10.5194/acp-19-4257-2019, 2019.
Xu, C., Guo, L., Dou, F., and Ping, C. L.: Potential DOC production from size-fractionated Arctic tundra soils, Cold Reg. Sci. Technol., 55, 141–150, https://doi.org/10.1016/j.coldregions.2008.08.001, 2009.
Xue, K., Yuan, M. M., Shi, Z. J., Qin, Y., Deng, Y., Cheng, L., Wu, L., He, Z., Van Nostrand, J. D., Bracho, R., Natali, S., Schuur, E. A. G., Luo, C., Konstantinidis, K. T., Wang, Q., Cole, J. R., Tiedje, J. M., Luo, Y., and Zhou, J.: Tundra soil carbon is vulnerable to rapid microbial decomposition under climate warming, Nat. Clim. Change, 6, 595–600, https://doi.org/10.1038/nclimate2940, 2016.
Zimov, S. A., Davydov, S. P., Zimova, G. M., Davydova, A. I., Schuur, E. A. G., Dutta, K., and Chapin, I. S.: Permafrost carbon: Stock and decomposability of a globally significant carbon pool, Geophys. Res. Lett., 33, L20502, https://doi.org/10.1029/2006GL027484, 2006.
Zubrzycki, S.: Organic Carbon Pools in Permafrost-Affected Soils of Siberian Arctic Regions, Universität Hamburg, 2013.
Zubrzycki, S., Kutzbach, L., Grosse, G., Desyatkin, A., and Pfeiffer, E.-M.: Organic carbon and total nitrogen stocks in soils of the Lena River Delta, Biogeosciences, 10, 3507–3524, https://doi.org/10.5194/bg-10-3507-2013, 2013.
Zubrzycki, S., Kutzbach, L., and Pfeiffer, E.-M.: Permafrost-affected soils and their carbon pools with a focus on the Russian Arctic, Solid Earth, 5, 595–609, https://doi.org/10.5194/se-5-595-2014, 2014.