the Creative Commons Attribution 4.0 License.
the Creative Commons Attribution 4.0 License.
 | 14 Jul 2020
Atmospheric deposition of organic matter at a remote site in the central Mediterranean Sea: implications for the marine ecosystem
Yuri Galletti
Silvia Becagli
Alcide di Sarra
Margherita Gonnelli
Elvira Pulido-Villena
Damiano M. Sferlazzo
Rita Traversi
Stefano Vestri
Chiara Santinelli
Atmospheric fluxes of dissolved organic matter (DOM) were studied for the first time on the island of Lampedusa, a remote site in the central Mediterranean Sea (Med Sea), between 19 March 2015 and 1 April 2017. The main goals of this study were to quantify total atmospheric deposition of DOM in this area and to evaluate the impact of Saharan dust deposition on DOM dynamics in the surface waters of the Mediterranean Sea. Our data show high variability in DOM deposition rates without a clear seasonality and a dissolved organic carbon (DOC) input from the atmosphere of 120.7 mmol DOC m−2 yr−1. Over the entire time series, the average dissolved organic phosphorus (DOP) and dissolved organic nitrogen (DON) contributions to the total dissolved pools were 40 % and 26 %, respectively. The data on atmospheric elemental ratios also show that each deposition event is characterized by a specific elemental ratio, suggesting a high variability in DOM composition and the presence of multiple sources. This study indicates that the organic substances transported by Saharan dust on Lampedusa mainly come from a natural sea spray and that Saharan dust can be an important carrier of organic substances even though the load of DOC associated with dust is highly variable. Our estimates suggest that atmospheric input has a larger impact on the Med Sea than on the global ocean. Further, DOC fluxes from the atmosphere to the Med Sea can be up to 6 times larger than total river input. Longer time series combined with modeling would greatly improve our understanding of the response of DOM dynamics in the Med Sea to the change in aerosol deposition pattern due to the effect of climate change.
- Article
(1761 KB) - Full-text XML
- BibTeX
- EndNote


The Mediterranean Sea (Med Sea) is the largest semienclosed basin and one of the most oligotrophic areas of the world's oceans. It is very sensitive to natural variations in the atmosphere–ocean interactions (Mermex group, 2011). Organic matter and nutrients of natural and anthropogenic origin are continuously exchanged between the ocean and the atmosphere, affecting biogeochemical cycles and the marine ecosystem. The Med Sea receives anthropogenic aerosols from the northern regions, which are characterized by the presence of important industrial sites, representing relevant sources of organic substances introduced to the atmosphere (Guerzoni and Chester, 1996). Industrial pollution can also originate from northern Africa, as shown in the work by Rodríguez et al. (2011). In addition, the Sahara desert is an intermittent source of mineral dust that can transport nutrients and organic carbon to the basin (Goudie and Middleton, 2001; Prospero et al., 2005; Vincent et al., 2016). Atmospheric deposition of nutrients (N and P) strongly influences the marine biogeochemical cycles of the Med Sea; it has therefore received increased attention in the last 30 years (Migon et al., 1989; Herut et al., 2002; Ridame and Guieu, 2002; Markaki et al., 2003, 2010; Pulido-Villena et al., 2008; Izquierdo et al., 2012; Djaoudi et al., 2018). Compared to inorganic nutrients, there are still very few data on the atmospheric deposition of dissolved organic carbon (DOC) to the surface ocean at both the local and global scale. Organic carbon can be removed from the atmosphere through wet and dry deposition (Iavorivska et al., 2016). At the global scale, wet deposition transfers about 306–580 Tg DOC yr−1 to the surface of the Earth (Willey et al., 2000; Kanakidou et al., 2012). These values correspond to almost half of the DOC delivered to the oceans by rivers annually (IPCC, 2014). Atmospheric deposition of organic carbon can therefore affect regional C cycling (Yan and Kim, 2012; Decina et al., 2018). In addition, the expected increase in ocean stratification due to global warming will enhance the impact of atmospheric inputs in the surface ecosystem (Kanakidou et al., 2012). The magnitude of atmospheric DOC inputs to open waters and the importance of its role in the carbon cycle highlight the need for a better and more robust estimation of DOC deposition.
In the last years, a few studies have reported data on atmospheric deposition of DOC to the Med Sea. Total (dry + wet) atmospheric deposition was studied in the northwestern Med Sea in 2006 (Pulido-Villena et al., 2008) and in 2015 (Djaoudi et al., 2018) with contrasting results. In the first study, the highest DOC flux was observed during a Saharan dust storm, suggesting a combination of heterogeneous reactions between organic matter and mineral dust in the troposphere. In the second study, a Saharan rain event coincided with a minimum in DOC input, suggesting little organic matter in aerosols (Djaoudi et al., 2018). These studies were conducted in coastal areas affected by human activities. Direct measurements of total OC (TOC) in rainwater were carried out on the island of Crete (Economou and Mihalopoulos, 2002). This study did not take into consideration dry deposition. None of the papers cited have studied atmospheric inputs at remote sites far away from possible pollution sources and/or large cities.
The main goals of this study are (1) to quantify total atmospheric deposition of DOC, dissolved organic nitrogen (DON), and dissolved organic phosphorus (DOP) on the island of Lampedusa, representative of the remote marine environment in the central Med Sea; (2) to investigate the contribution of natural and anthropogenic sources in atmospheric DOC; (3) and to estimate the impact of atmospheric deposition on the marine ecosystem.
2.1 Sampling site
Bulk atmospheric deposition (dry and wet) was collected at the Station for Climate Observations (35.52∘ N, 12.63∘ E), maintained by ENEA, the Italian National Agency for New Technologies, Energy and Sustainable Economic Development, on the island of Lampedusa, Italy (Fig. 1; http://www.lampedusa.enea.it/, last access: 14 November 2019).

Figure 1Sampling location (Lampedusa; 35.5∘ N, 12.6∘ E) and the total atmospheric deposition collector.
Lampedusa is located in an ideal position for the study of atmospheric DOC fluxes to the open Med Sea. It is flat and far from large islands and continental areas and from relevant pollutant sources. Precipitation shows a significant interannual variability and is concentrated in autumn and winter, with a maximum in October. Intense precipitation events, which are relatively infrequent, are generally associated with frontal passages and winds from the northern sectors. Very dry conditions characterize late spring and summer. Although it is a remote marine environment, influences from ship traffic emissions (Becagli et al., 2012, 2017), volcanic aerosols (Sellitto et al., 2017), forest fires (Pace et al., 2005), and regional pollution (Pace et al., 2006) have been documented.
In addition to deposition, PM10 (particulate matter with an aerodynamic equivalent diameter of less than 10 µm) amount and chemical composition analyses routinely performed on Lampedusa are used in this study.
2.2 Atmospheric deposition sampler
The sampler (Fig. 1) was positioned on the roof of the ENEA climatic station located on a 45 m a.s.l. plateau on the northeastern coast of Lampedusa. A total of 41 samples were collected every 15 d or immediately after strong rain or dust storm events between 19 March 2015 and 1 April 2017. Due to logistic constraints, nine sampling periods were longer than 20 d. The deposition sampler is similar to those successfully employed in previous studies (Pulido-Villena et al., 2008; Markaki et al., 2010; De Vicente et al., 2012). It is composed of a 10 L polycarbonate bottle, with a polyethylene funnel attached on the top; a 20 µM mesh covers the funnel stem in order to prevent contamination by insects or organic debris. For wet deposition, the amount of water in the sampler was weighted, transferred to 250 mL polycarbonate bottles, and immediately frozen. Dry deposition was sampled by rinsing the collector with 250 mL of ultrapure Milli-Q water, which was transferred into 250 mL polycarbonate bottles and immediately frozen. A detailed description of sampling periods, deposition types, and collected volumes is reported in Table 1.
Table 1Sampling period, type of deposition, and volume for the 41 samples collected on the island of Lampedusa.

For DOC, DON, and DOP analysis, samples were thawed and filtered through a sterile 0.2 µm nylon filter prewashed with 300 mL of ultrapure water to avoid any contamination. Filtered samples were frozen until the analysis. Before the analysis, samples were brought to room temperature (24 ∘C).
2.3 DOC analysis
DOC analysis was carried out on a Shimadzu TOC-VCSN, equipped with a quartz combustion column filled with 1.2 % Pt on alumina pillows of ∼2 mm diameter. Samples were first acidified with 2N HCl and bubbled for 3 min with CO2-free ultrahigh-purity air in order to remove the inorganic carbon. Replicate injections were performed until the analytical precision was lower than 1 %. A five-point linear calibration curve was determined with standard solutions of potassium hydrogen phthalate in the same concentration range as the samples (40–400 µM). The system blank was measured every day at the beginning and the end of analysis using low-carbon Milli-Q water (<3 µM C). Instrument accuracy was assessed every day by analyzing DOC consensus reference material (CRM), kindly provided by Dennis A. Hansell, with a nominal value of 41–44 µM (batch 15, lot no. 07-15; Hansell, 2005). The average DOC concentration in the CRM measured in our laboratory during the period of the analysis was 42.8±1.2 (n=15).
2.4 DOP and DON analysis
Twenty-six out of 41 samples were analyzed for DON and DOP. The samples were collected between 19 March 2015 and 3 November 2016.
DON was estimated by subtracting the dissolved inorganic nitrogen (DIN) from the total dissolved N (TDN). DIN and TDN were analyzed by the conventional automated colorimetric procedure (CACP) according to Aminot and Kérouel (2007) with an estimated limit of detection of 0.02 µM. TDN was analyzed after persulfate wet oxidation (Pujo-Pay et al., 1997).
DOP concentrations were determined by subtracting the inorganic form (soluble reactive phosphorus, SRP) from the total dissolved P. SRP was measured spectrophotometrically after Murphy and Riley (1962) with a limit of detection of 0.02 µM and an analytical precision of 7 % at 0.1 µM. Total dissolved P (TDP) was measured as SRP after UV digestion (Armstrong et al., 1966). The photooxidation technique included a 2 h UV treatment in a Metrohm® 705 UV digester with a digestion efficiency of 85±3 %, assessed on a 1 µM solution of β-glycerol-phosphate.
2.5 DOC, DON, and DOP fluxes
DOC, DON, and DOP fluxes were calculated using the following formula:
where X is the concentration measured in the sample (µM), V is the volume (L) of rain collected by the sampler or the volume of Milli-Q water (0.25 L) used to rinse the collector in case of dry deposition, A is the area of the funnel (0.1018 m2), and d is the length of the sampling period expressed in days.
2.6 Ion and metal content in the deposition samples
Soluble ions and metals were measured in samples filtered through quartz filters. These filters have low blank levels for metals and ions (Ca, Na, Al, and Pb) in both the soluble and particulate fraction. Immediately after filtration the samples were divided into two portions used for measurements of ionic and metal content, respectively. Samples for the determination of metal were spiked with 0.1 mL of subboiled distilled HNO3 to preserve the metals in their soluble form. Samples were kept refrigerated at +4 ∘C until the analysis. Ions were determined in solution by ion chromatography as reported in Becagli et al. (2011).
The particulate fraction of the deposition was extracted from the quartz filter through the solubilization procedure reported in the EU EN14902 (2005) for aerosol samples. The extraction procedure was performed in a microwave oven at 220 ∘C by subboiling distilled HNO3 and 30 % ultrapure H2O2 for 25 min.
Metals in both soluble and particulate fractions were measured by means of an inductively coupled plasma atomic emission spectrometer (ICP-AES; Varian 720-ES) equipped with an ultrasonic nebulizer (U5000 ATC, Cetac Technologies Inc.). Daily calibration standards (internal standard: 1 ppm Ge) were used for quantification.
2.7 PM10 analysis
PM10 is sampled on a daily basis on the island of Lampedusa (Becagli et al., 2013; Marconi et al., 2014; Calzolai et al., 2015) by using a low-volume dual-channel sequential sampler (HYDRA FAI Instruments) equipped with two PM10 sampling heads operating at a constant flow of 2.3 m3 h−1 in accord with the European rules for aerosol monitoring (UNI EN12341). Aerosol is collected in 47 mm diameter Teflon filters (Pall Gelman) with 2 µm nominal porosity but certified to have 99 % retention efficiency for 0.3 µm diameter particles. The PM10 mass was determined by weighting the Teflon filters before and after sampling with an analytical balance in controlled temperature (20±1 ∘C) and relative humidity (50±5 %) conditions. The estimated PM10 mass error is around 1 % at 30 µg m−3 in the routine sampling conditions. A quarter of each Teflon filter was extracted using Milli-Q water (about 10 mL, accurately evaluated by weighing) in an ultrasonic bath for 15 min, and the ionic content was determined by ion chromatography as for deposition samples (Becagli et al., 2011). Another quarter of the Teflon filter was used for the determination of metals in the atmospheric particles as described for the deposition samples.
2.8 Enrichment factor
In order to obtain information on dissolved organic matter (DOM) sources, DOM concentrations were compared to concentrations of Al and Na and to the enrichment factor for Pb, EF(Pb), in the deposition samples as markers of crustal, sea spray, and anthropic sources, respectively.
The enrichment factor (EF) with respect to crustal sources of Pb, V, and Ni was calculated by using Al as a marker for crustal aerosol. The following equation is used for EF calculation:
where (X∕Al)sample is the ratio between the metal X and Al concentrations in the sample, and (X∕Al)crust is the same ratio in the upper continental crust as reported in Henderson and Henderson (2009). By convention, elements with EF<10 are called “not enriched”, having a prevailing crustal source, whereas indicates a moderate enrichment, and EF>100 indicates that the element (“enriched”) has a prevailing anthropogenic source (e.g., Lai et al., 2017).
3.1 DOC atmospheric fluxes
Atmospheric fluxes of DOC ranged between 0.06 and 1.78 mmol C m−2 d−1, with high variability. The overall sampling lasted for 746 d. The deposition was lower than 0.2 mmol DOC m−2 d−1 (Fig. 2 and Table 2) in half of the sampling days (52 %).
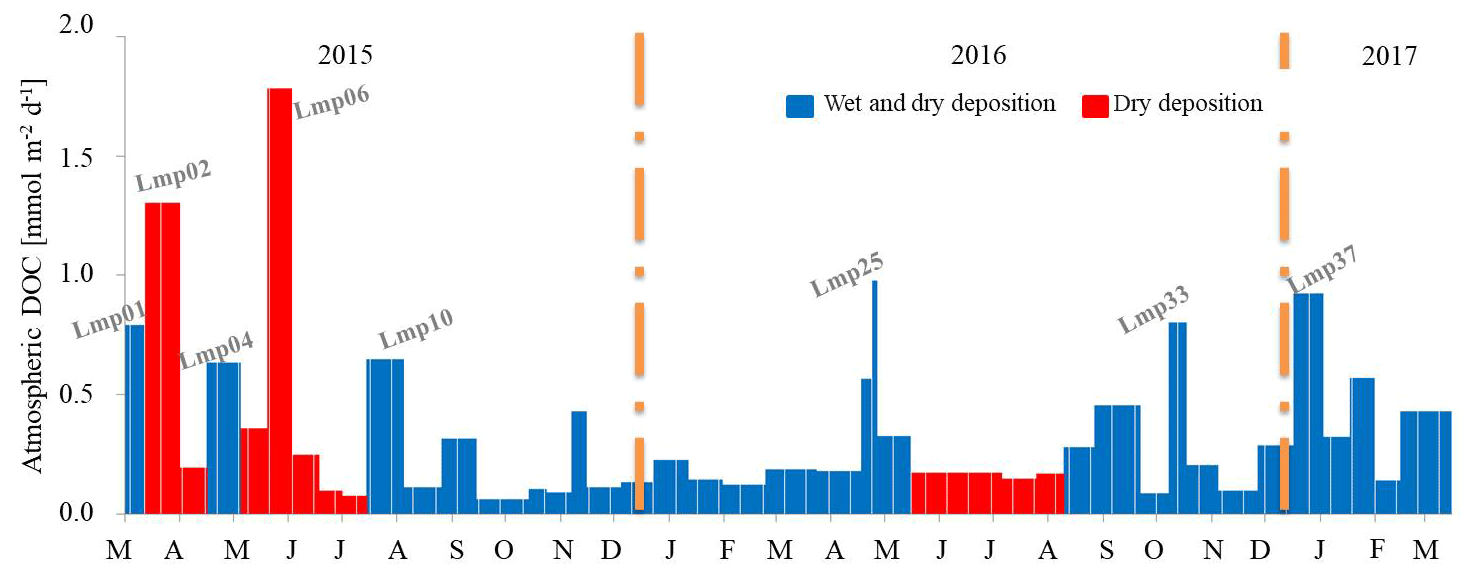
Figure 2Atmospheric DOC fluxes during the study period. The month abbreviation and tick marks correspond to the end of the corresponding month. The width of the bar refers to the length of the sampling period. Wet and dry deposition is indicated in blue; dry deposition is indicated in red.
Table 2Atmospheric fluxes of DOC, DON, TDN, DOP, and TDP on the island of Lampedusa.
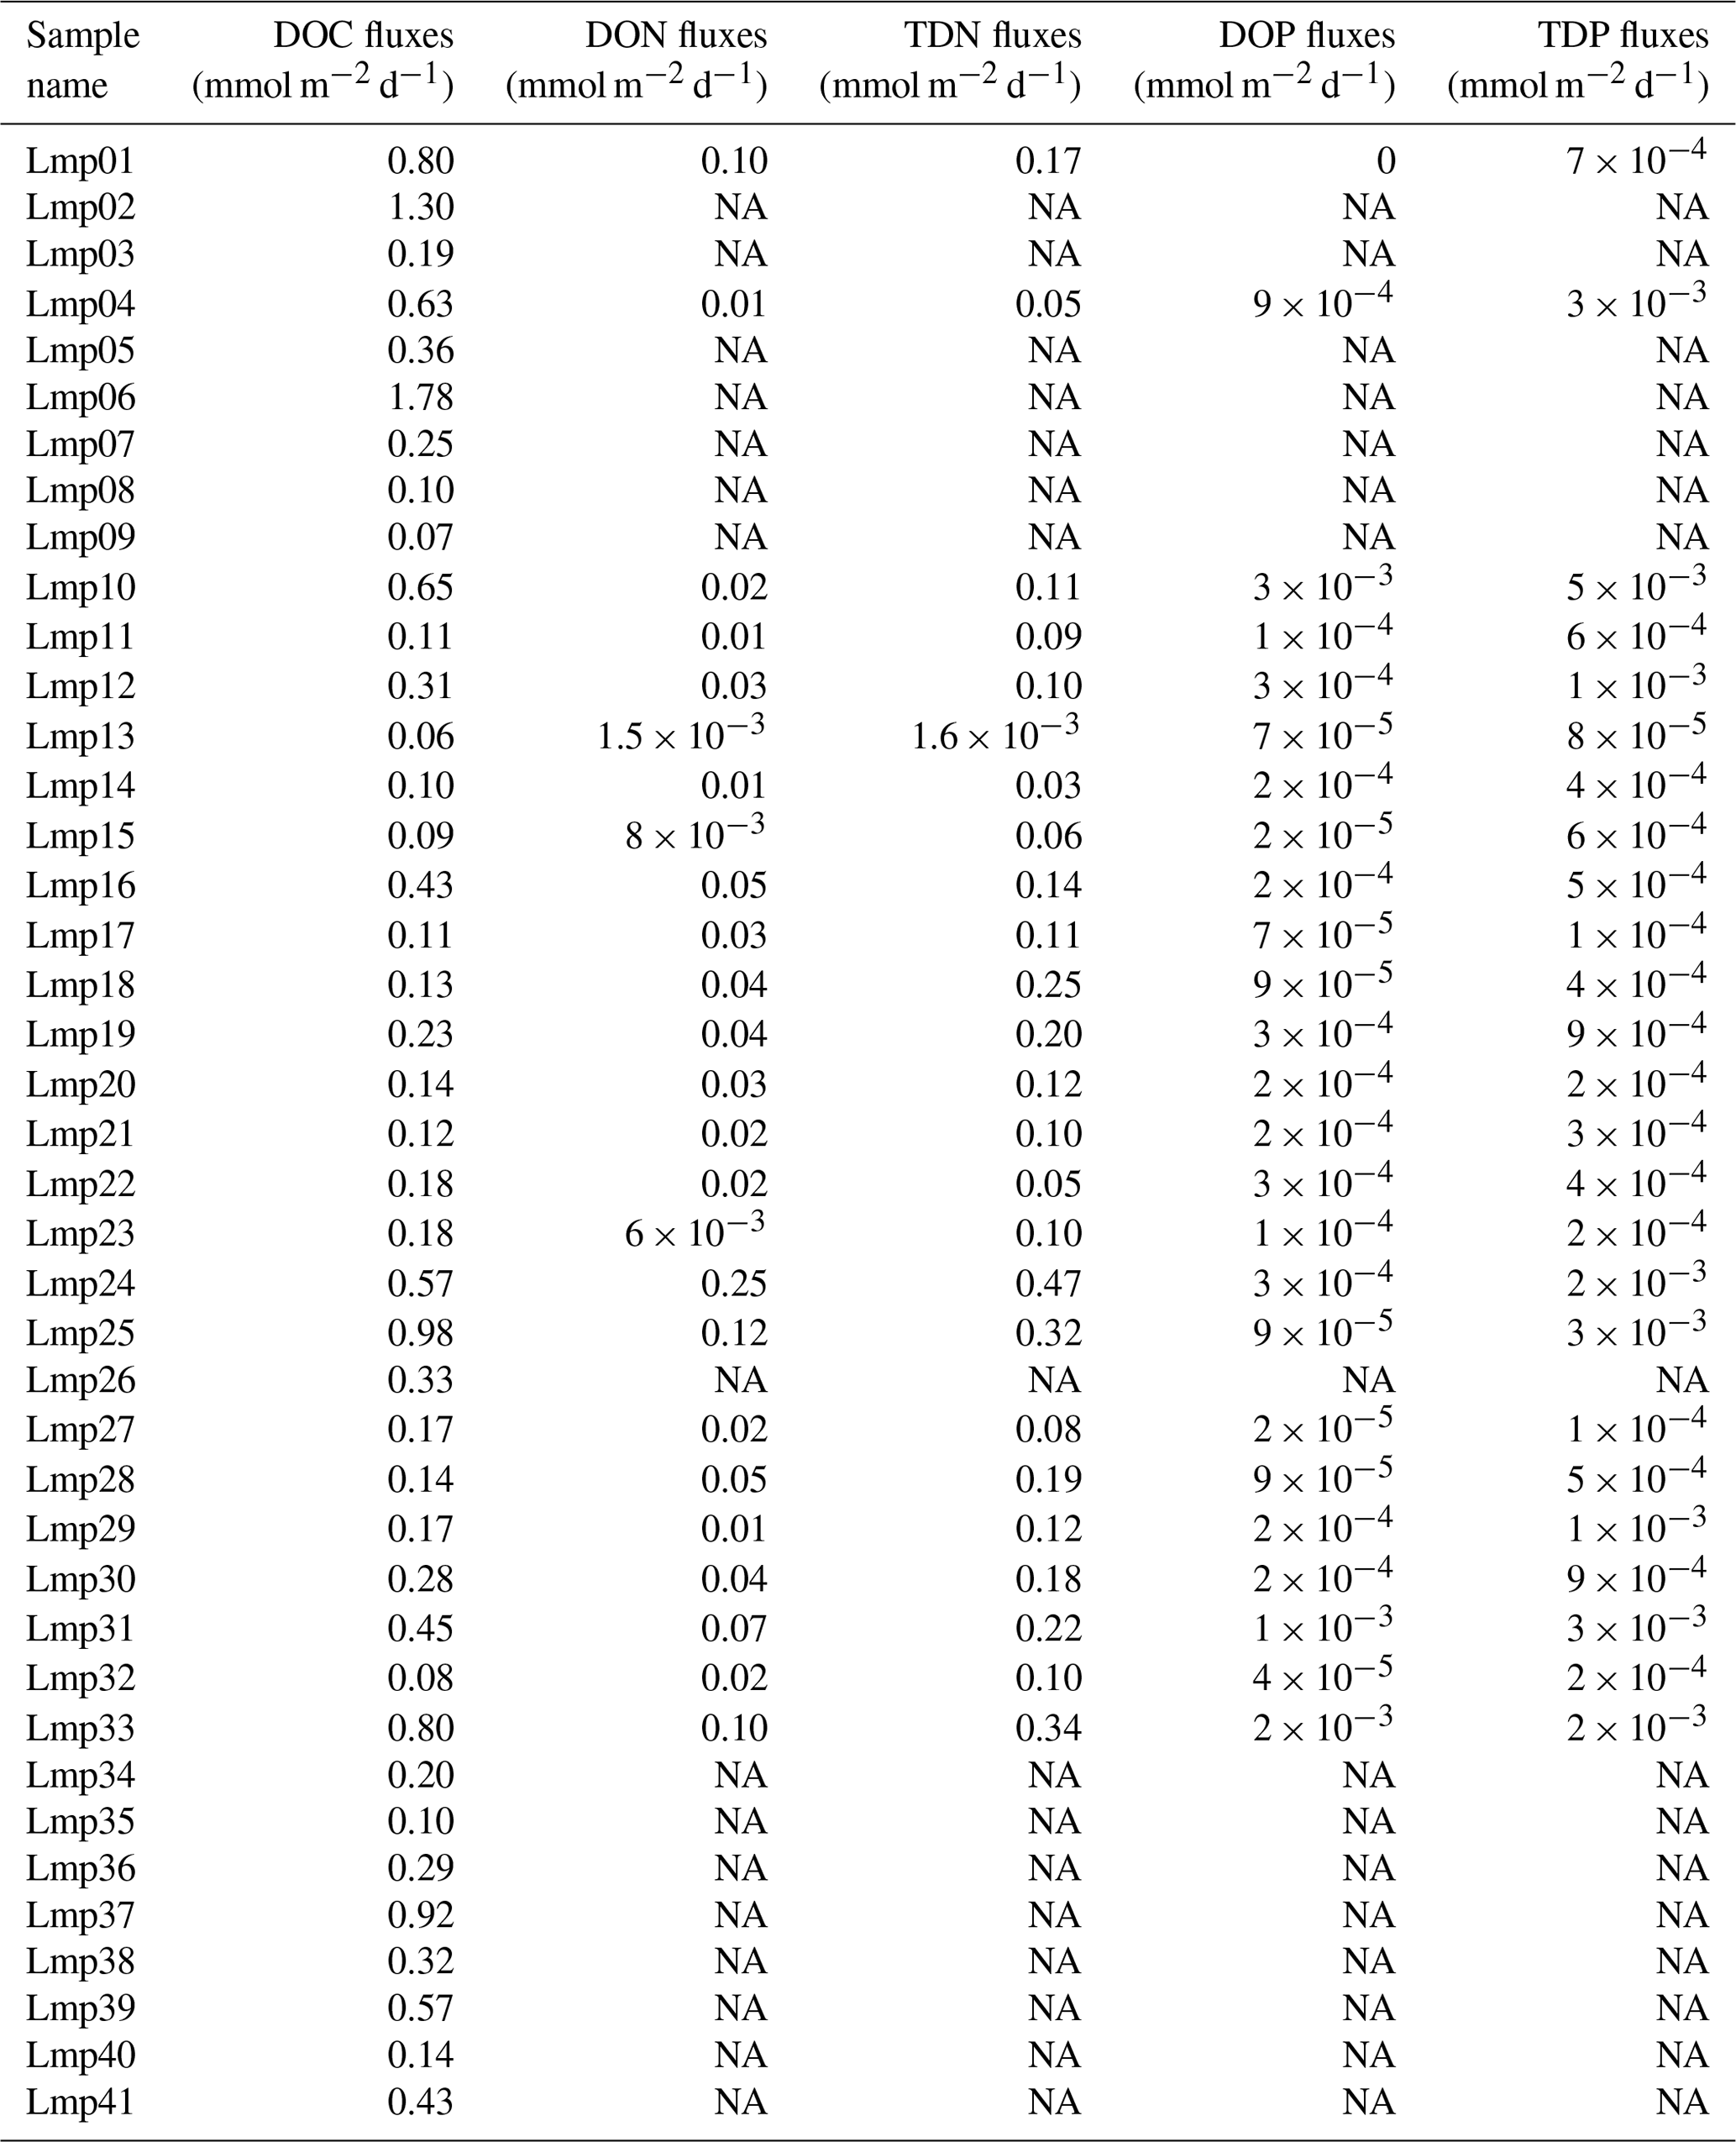
NA – not available.
In 2015, the lowest deposition rates (<0.1 mmol C m−2 d−1) were measured in July (Lmp09), October (Lmp13), and November (Lmp15). The highest deposition values (> 1.2 mmol C m−2 d−1) occurred between March and April (Lmp02) and in June (Lmp06). Both periods were characterized by dry deposition (Fig. 2 and Table 2). High DOC fluxes (>0.6 mmol C m−2 d−1) were, however, also observed in March (Lmp01), May (Lmp04), and at the end of July (Lmp10) in correspondence with periods dominated by wet deposition. In 2015, the annual rainfall was 360 mm, slightly higher than the average annual rainfall for the island of Lampedusa (325 mm with 42 d of rain; data from http://www.arpa.sicilia.it/ and http://www.eurometeo.com/italian/climate, last access: 10 June 2016).
In 2016, the DOC deposition rates were rather low and with less variability compared to the previous year. DOC fluxes ranged between 0.1 and 0.3 mmol C m−2 d−1 from January to May (Lmp18 to Lmp23) and from June to August (Lmp27 to Lmp30). The highest DOC fluxes (>0.8 mmol C m−2 d−1) were observed in May (Lmp25) and between October and November (Lmp33; Fig. 2 and Table 2). In 2016, the annual rainfall was 378 mm (data from the local meteorological station of the Lampedusa Atmospheric Observatory).
In 2017, DOC fluxes ranged between 0.14 and 0.92 mmol C m−2 d−1 from January to April (Lmp36 to Lmp41); these values are higher than those observed in the first 3 months of the previous year (Fig. 2 and Table 2).
Atmospheric fluxes of DOC in wet deposition were correlated with monthly precipitation rates (r2=0.47, p<0.05, n=12). The precipitation rate ranged between 2.9 and 88.5 mm during the study period (2015–2017).
A mean daily deposition of 0.33 mmol C m−2 d−1 was calculated, taking into consideration the 2 years (from March 2015 to April 2017), corresponding to an annual DOC flux of 120.7 mmol C m−2 yr−1.
3.2 DON, TDN, DOP, and TDP atmospheric fluxes
Dissolved nitrogen fluxes ranged between and 0.25 mmol DON m−2 d−1 and between and 0.47 mmol TDN m−2 d−1, respectively (Fig. 3 and Table 2). During most of the sampling period (93 %), DON deposition was lower than 0.1 mmol DON m−2 d−1. The main peaks were observed in March 2015 (Lmp01), in May (Lmp24 and Lmp25), and in October 2016 (Lmp33), coinciding with high DOC deposition (Fig. 3 and Table 2).
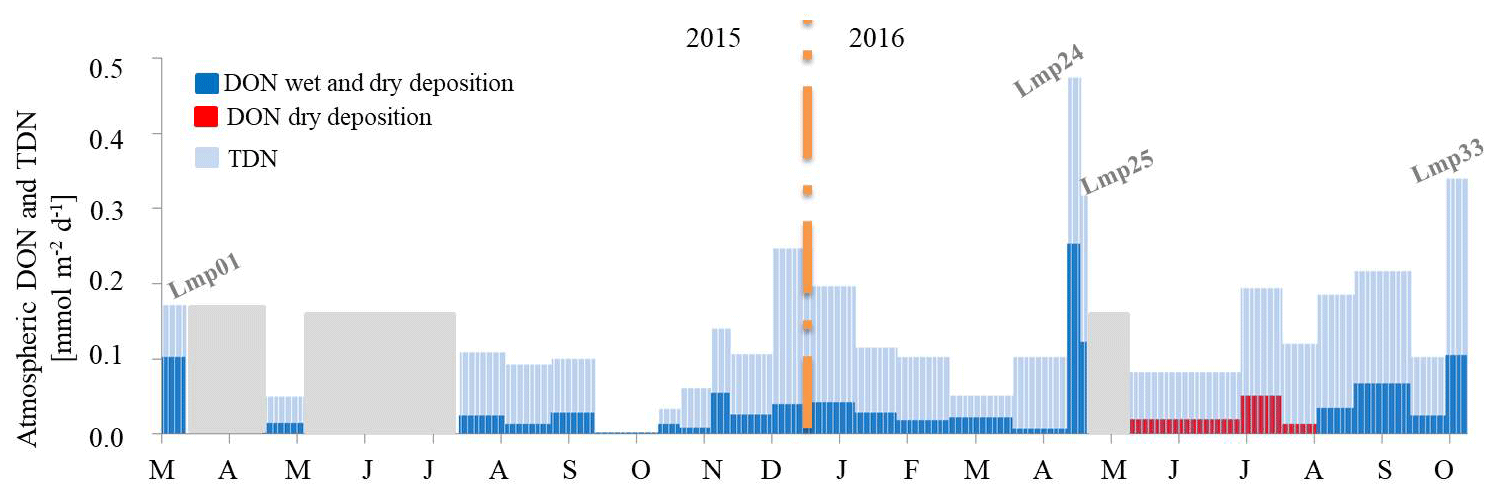
Figure 3Atmospheric DON and TDN deposition. Gray areas correspond to the periods with no data. The month abbreviation and tick marks correspond to the end of the corresponding month. The width of the bar refers to the length of the sampling period.
Dissolved phosphorus fluxes ranged between 0 and mmol DOP m−2 d−1 and between and mmol TDP m−2 d−1, respectively (Fig. 4 and Table 2). Between August 2015 and September 2016 (Lmp10–Lmp30) both DOP and TDP showed low fluxes. In 2015, atmospheric DOP and TDP showed the highest fluxes in May (Lmp04) and August (Lmp10). In 2016, the main peaks in DOP and TDP deposition were observed in October (Lmp31) and November (Lmp33). The four peaks in atmospheric DOP and TDP (Lmp04, Lmp10, Lmp31, and Lmp33) were responsible for 16 % of total depositions, coinciding with high DOC fluxes (Fig. 2). It is noteworthy that in March 2015 (Lmp01) and May 2016 (Lmp25), DOP fluxes were very low (0 and mmol DOP m−2 d−1, respectively; Table 2) despite high fluxes of DOC, DON, and TDP.
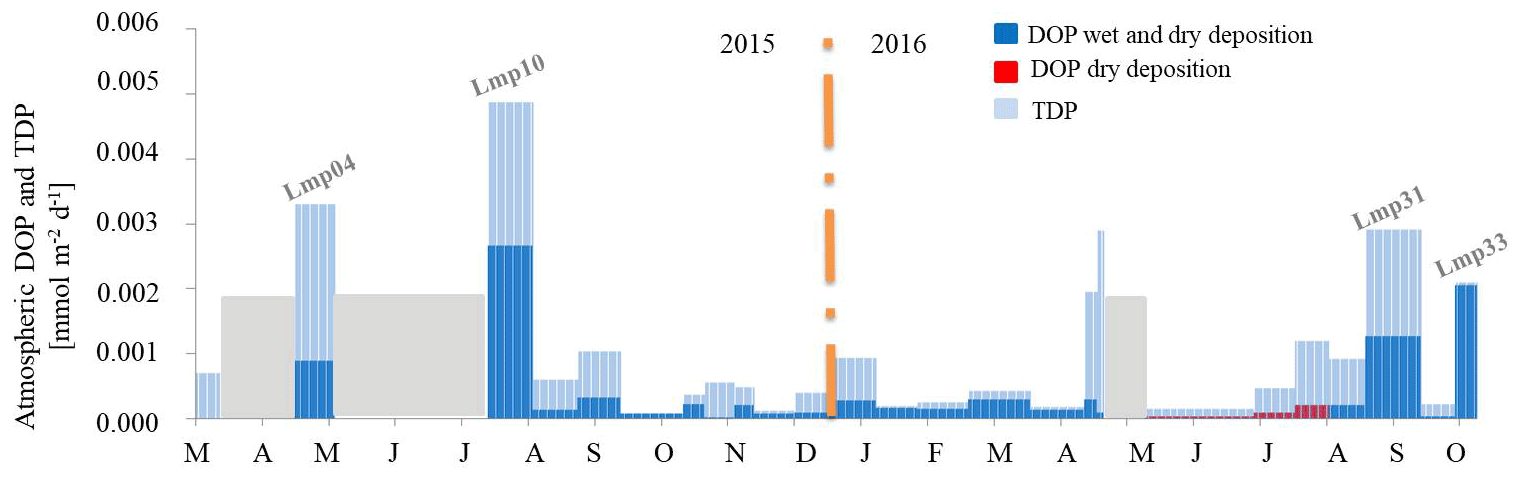
Figure 4Atmospheric DOP and TDP deposition. Gray areas correspond to the periods with no data. The month abbreviation and tick marks correspond to the end of the corresponding month. The width of the bar refers to the length of the sampling period.
The overall mean DON and DOP daily deposition rates were 0.032 mmol N m−2 d−1 and mmol P m−2 d−1, respectively, corresponding to annual fluxes of 11.61 mmol DON m−2 yr−1 and 0.14 mmol DOP m−2 yr−1, respectively.
It should be noted that these fluxes could be underestimated due to the missing samples in 2015 and 2016.
3.3 Elemental ratios in atmospheric DOM
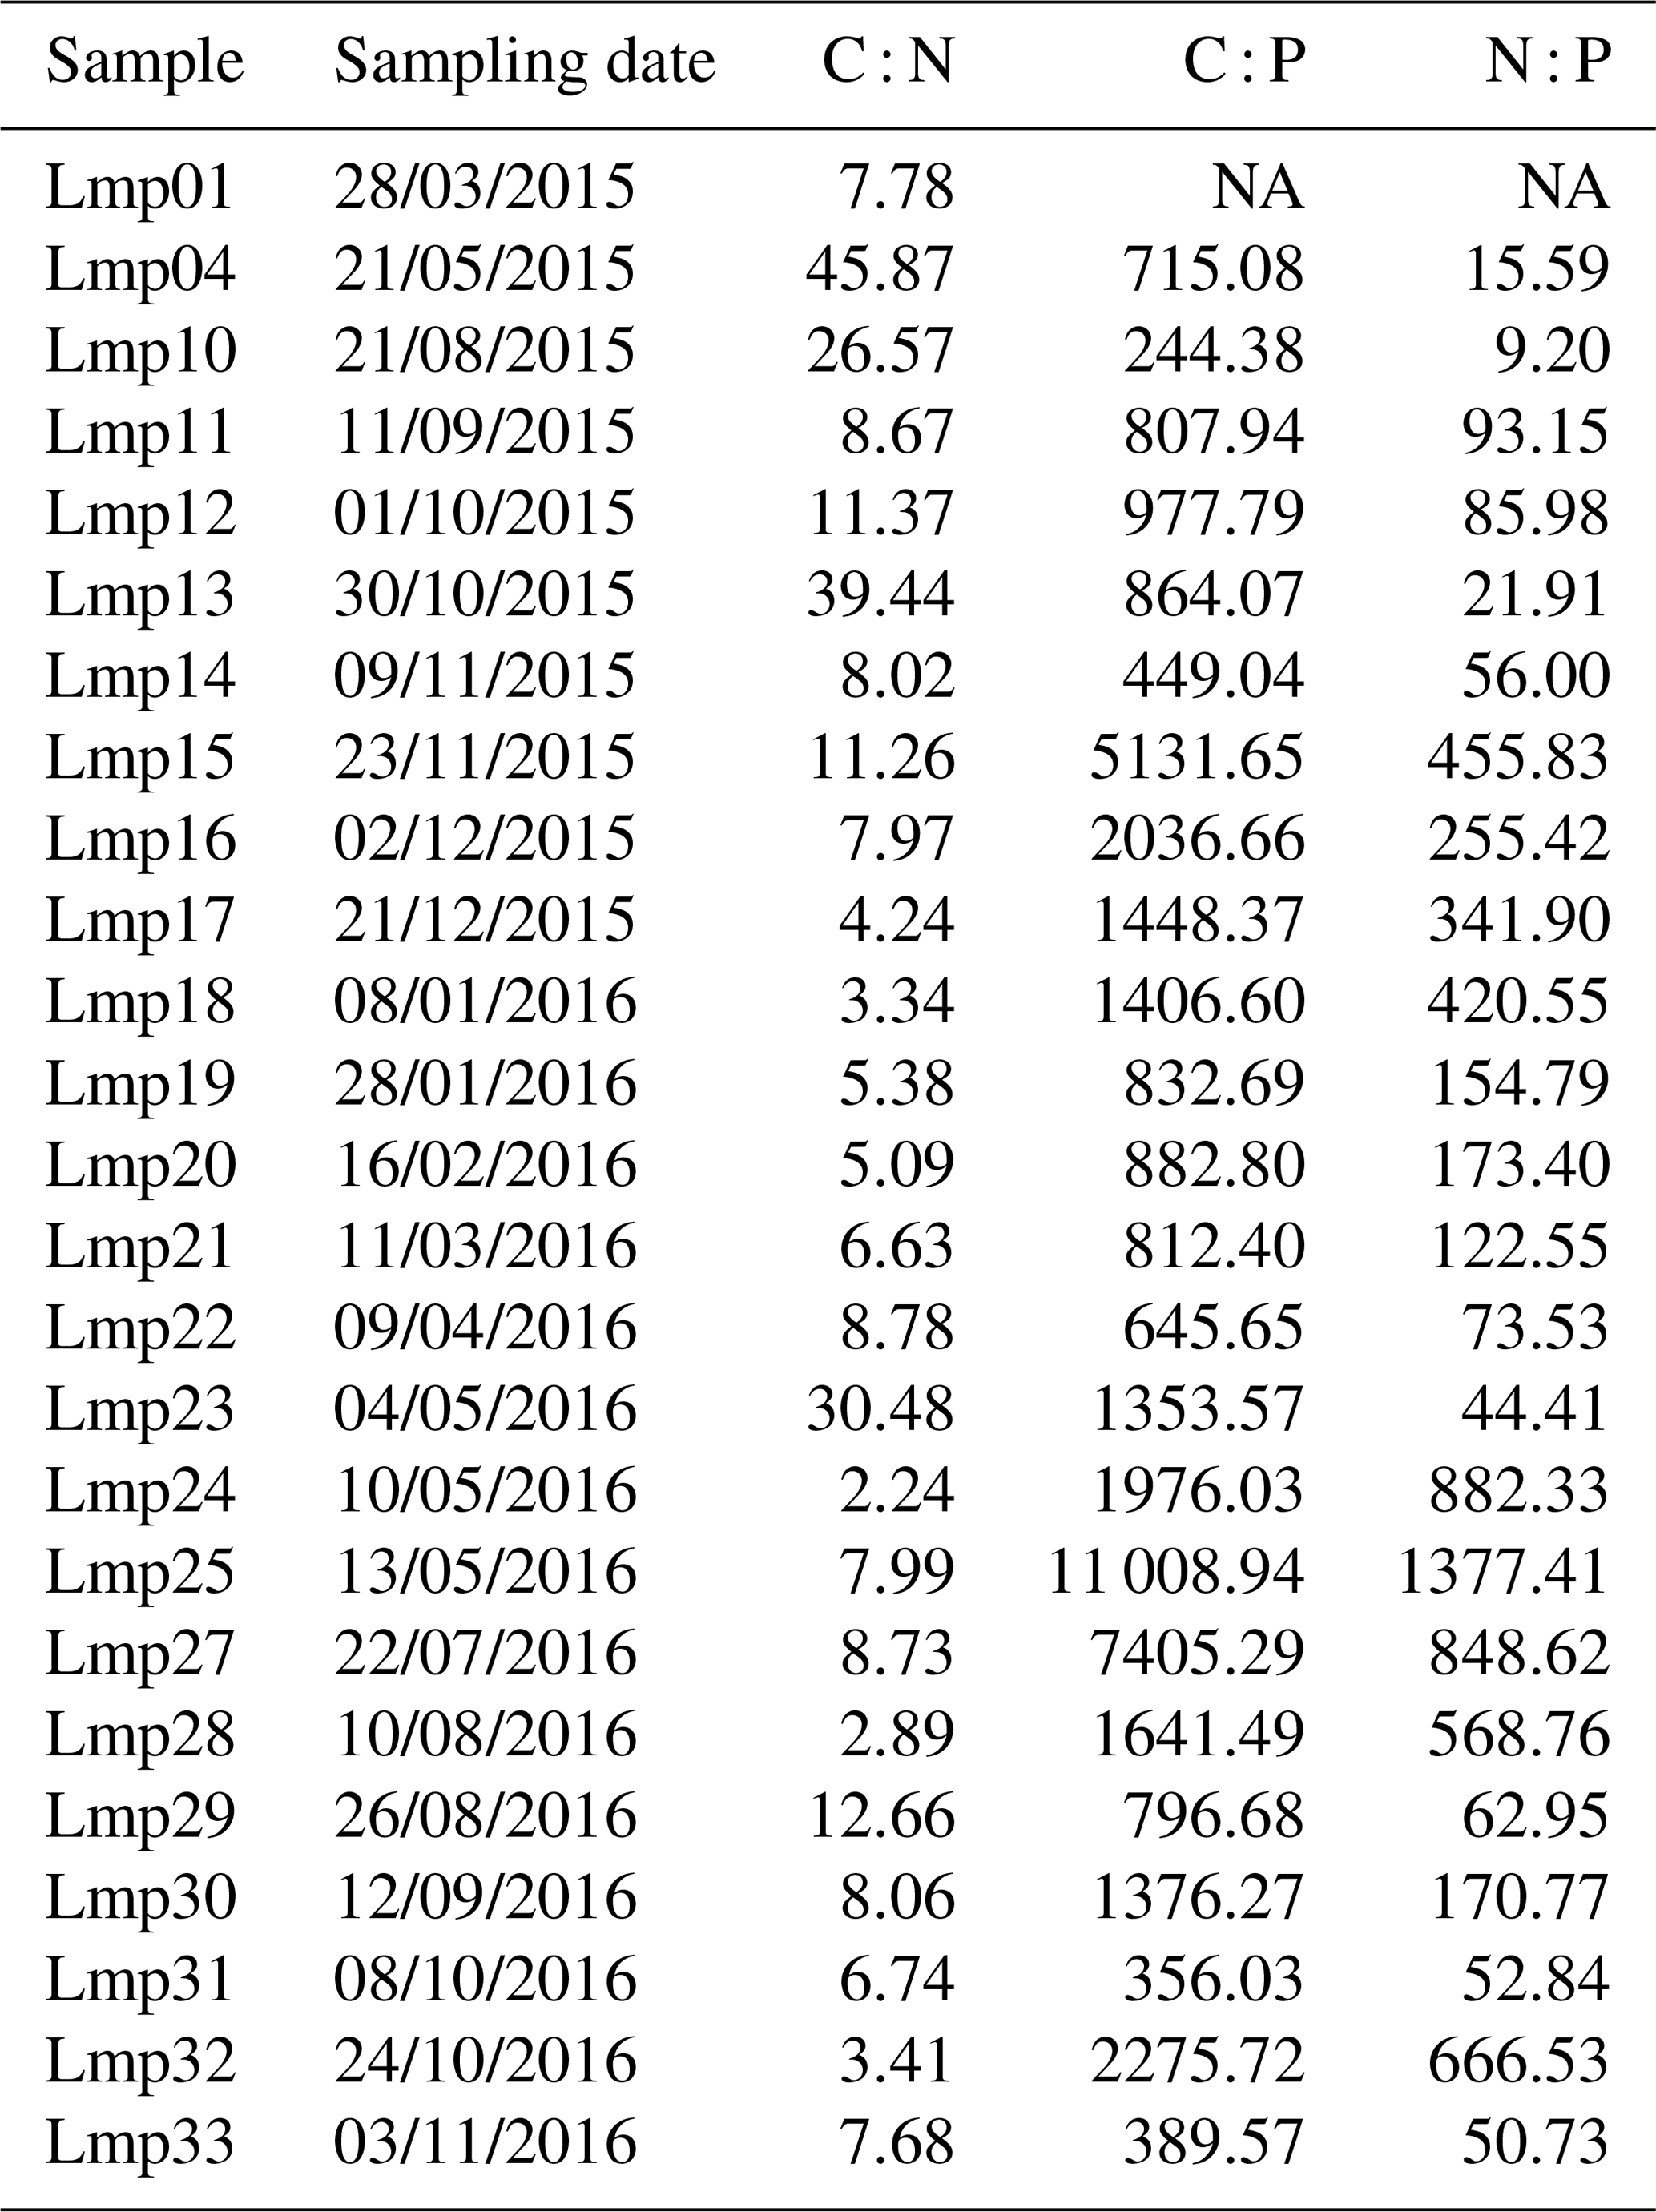
DOC : DON : DOP ratios showed a marked variability (Fig. 5 and Table 3). DOC : DON molar ratios ranged between 2.2 (Lmp24, May 2016) and 45.9 (Lmp04, May 2015; Fig. 5a). DOC : DOP molar ratios ranged between 244 (Lmp10, August 2015) and 11 008 (Lmp25, May 2016; Fig. 5b). DON : DOP ratios ranged between 9.2 (Lmp10, August 2015) and 1377 (Lmp25, May 2016; Fig. 5c). No clear seasonal cycle was observed, even if during autumn (November 2015 and October 2016) and late spring (May 2016) depositions were very low in P compared to the other two elements.
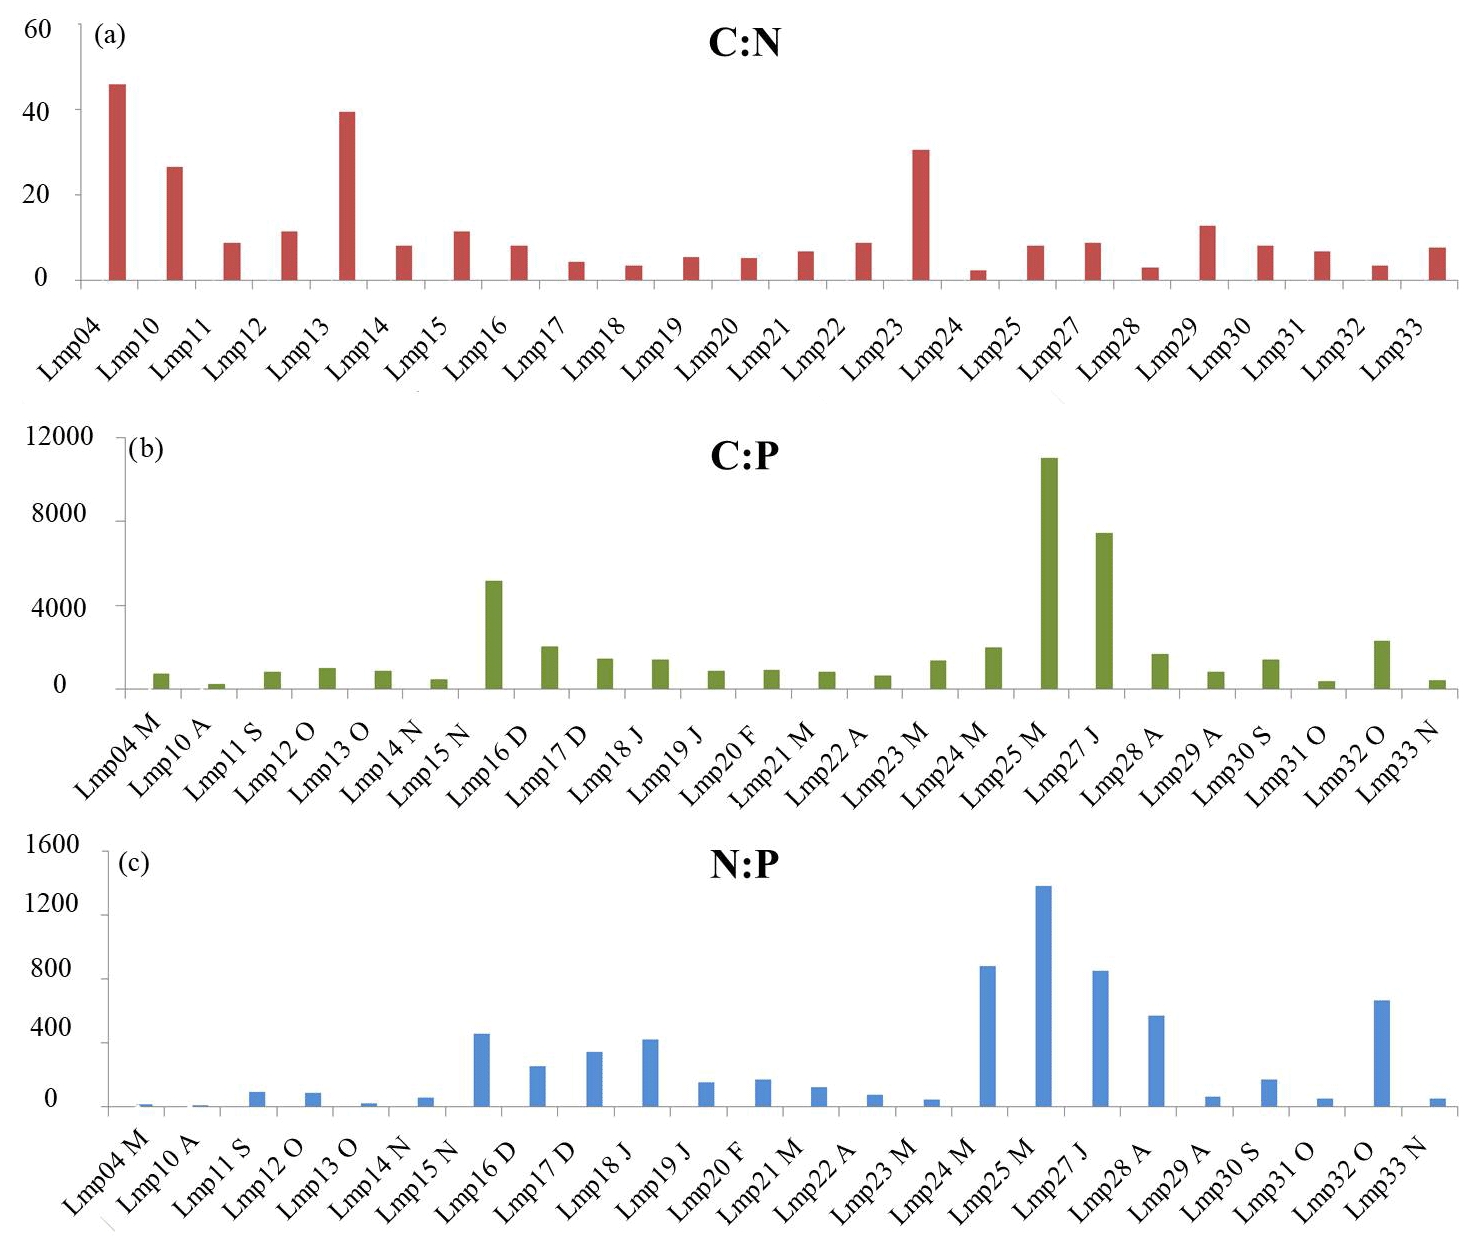
Figure 5Temporal evolution of C : N (a), C : P (b), and N : P (c) ratios in atmospheric deposition samples. The sample name and the initials of each month (from March, Lmp04, to November, Lmp33) are reported on the x axis.
3.4 The sources of atmospheric DOM
Previous works indicate that soluble fractions of V and Ni in aerosol samples are specific markers of anthropogenic sources for the area of Lampedusa (Becagli et al., 2012, 2017). During this study, samples did not show enrichment beyond 10, indicating that their source is mainly of crustal origin.
The DOC deposition was classified on the basis of the corresponding non-sea-salt (nss) Ca concentration in PM10 (following Marconi et al., 2014; Fig. 6). Saharan dust events are identified as those with nss Ca > 950 ng m−3. DOC deposition corresponding to an average nss Ca concentration larger than the threshold (950 ng m−3) is highlighted in red. DOC deposition corresponding to a Saharan dust event occurring on at least 1 d of the sampling period is indicated in yellow (Fig. 6). A detailed description of the most interesting deposition events is given below.
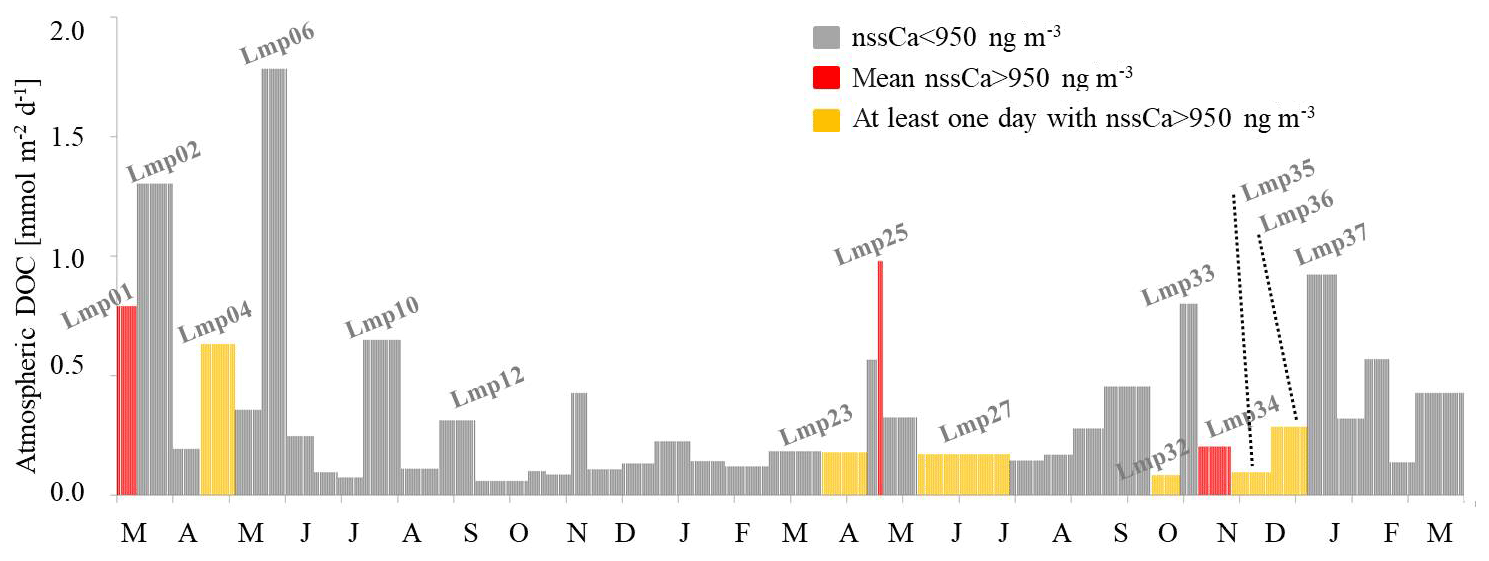
Figure 6Temporal dynamics in the dust deposition events during the sampling period, color-coded based on the contribution of non-sea-salt Ca (nss Ca). The month abbreviation and tick marks correspond to the end of the corresponding month. The width of the bar refers to the length of the sampling period.
The mean concentration of PM10 for Lmp01 (March 2015) was 50.1 µg m−3, with an average dust value of 18.2 µg m−3 (Table 4). This sample is dominated by crustal input as revealed by the values of nss Ca in the aerosol (1327.6 ng m−3) and the Al concentration in the deposition (both soluble and particulate; Fig. 7). In this sample EF(Pb) indicates a low contribution of anthropogenic sources. Na concentration in the deposition was 304 mg m−2 d−1 (Fig. 7).
Lmp02 (March–April 2015) is characterized by the second-highest DOC deposition, although no Saharan dust event occurred during this period (Figs. 6 and 7). The PM10 mean concentration was 29 µg m−3, and the average sea-salt aerosol value was 13.6 µg m−3 (Table 4) with a 47 % contribution to PM10. This sample was strongly affected by sea spray as indicated by the Na∕Al ratio, which was 60 times higher than in Lmp01.
Lmp04 (May 2015), sampled during a Saharan dust event, also showed high DOC input (Fig. 6), but the concentration of Al in the deposition was quite low (Fig. 7). The PM10 mean concentration was 26.4 µg m−3, and the average sea-salt in the aerosol was 8.8 µg m−3, contributing one-third to the total particulate matter. As for Lmp03, the ratio Na∕Al is quite high, suggesting that sea spray also dominated in this sample.
The mean PM10 concentration of Lmp06 (June 2015) was 23.3 µg m−3, with an average sea-salt aerosol concentration of 13.6 µg m−3 (Table 4). The average contribution of sea-salt aerosol to the particulate matter concentration was 27 %. The peculiar characteristic of this sample is the high concentration of soluble Al and low concentration of particulate Al in the deposition (Fig. 7). This feature is also observed in samples Lmp10 and Lmp12, both presenting quite high concentration of DOC in July and September 2015.
Lmp25 (May 2016) was characterized by a mean PM10 concentration of 133.7 µg m−3 and an average dust value of 42.5 µg m−3 (Table 4). This is the highest value of PM10 observed in the entire study and indicates the occurrence of a Saharan dust event. The average value of nss Ca was 4815.1 ng m−3, further supporting the occurrence of an intense Saharan dust event. The Saharan dust contribution for this sample is also revealed by the Al concentration (both soluble and particulate; Fig. 7).
Lmp33 (October–November 2016) and Lmp34 (November 2016) are indicative of the two possible sources of DOC: crustal and sea spray. Lmp33 shows a higher DOC concentration than Lmp34. The former is characterized by a very high Na concentration in the deposition, while Lmp34 is characterized by high crustal content (as revealed by the high concentration of Al; Fig. 7).
The fourth-highest DOC deposition of the entire study period (Lmp37) occurred in January 2017. Unfortunately no ancillary data were collected during this event.
Table 4The PM10, sea-salt aerosol, dust, and nss Ca mean values of the atmospheric total deposition.
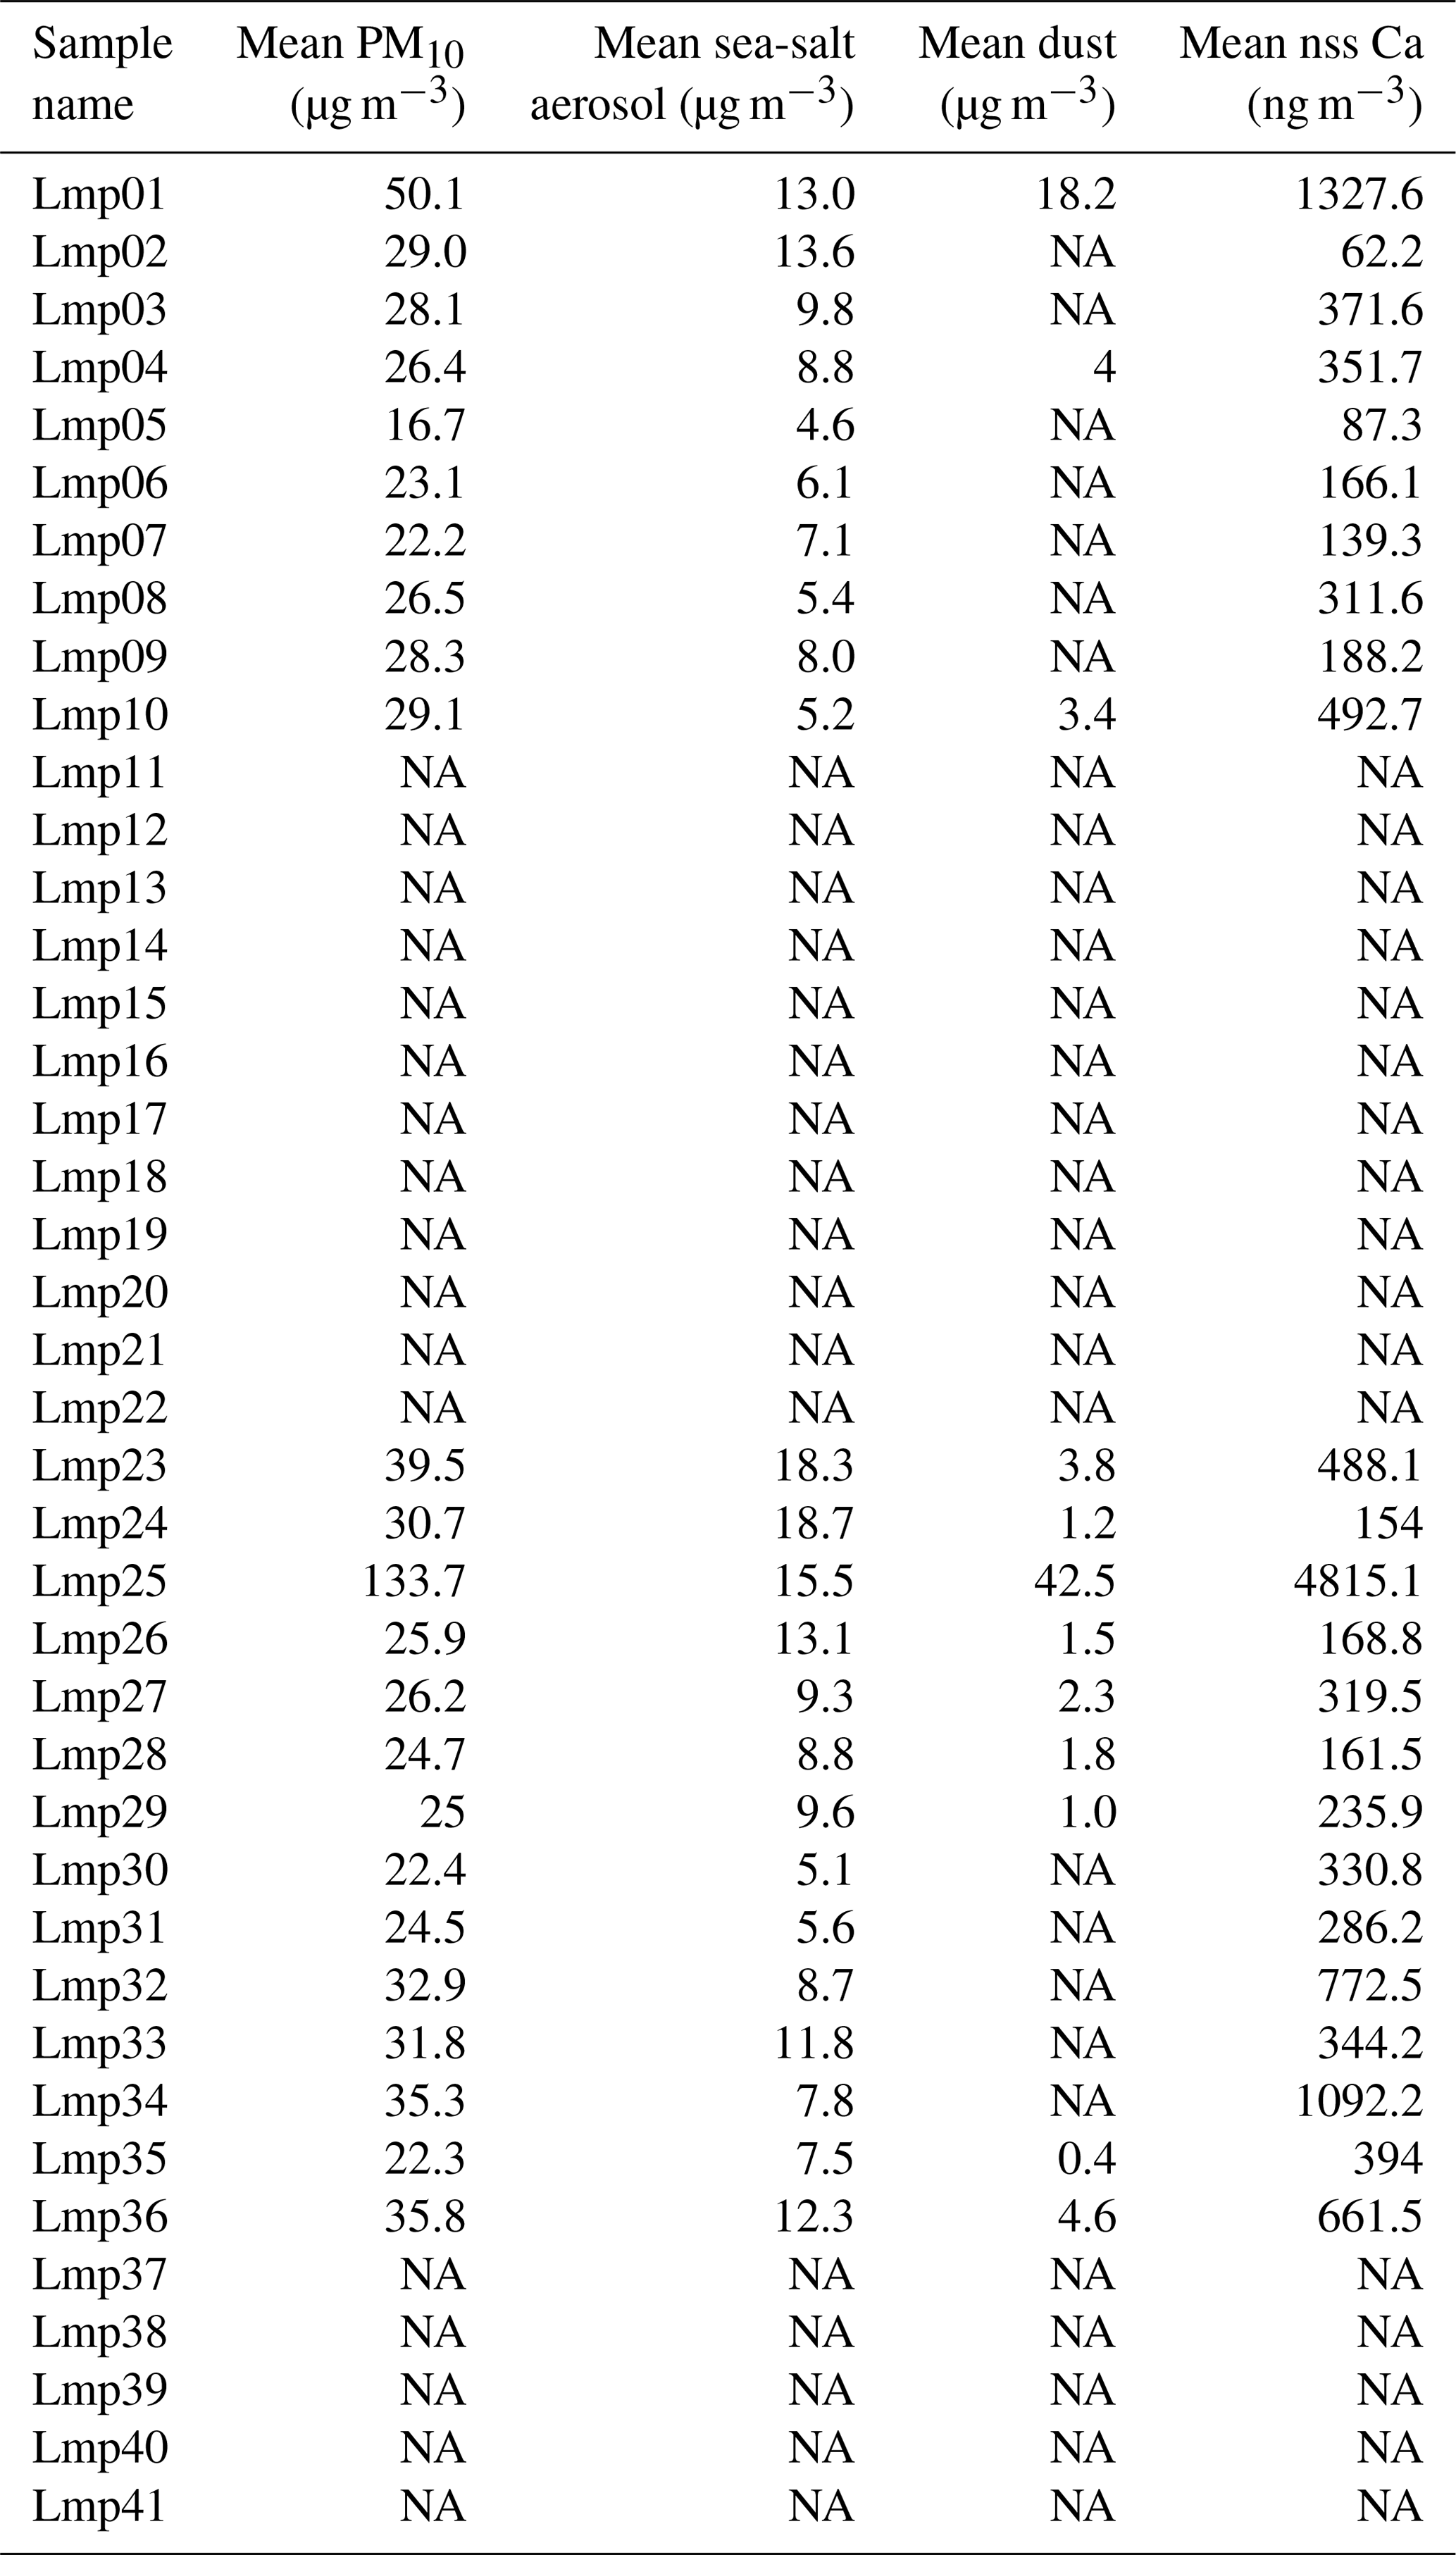
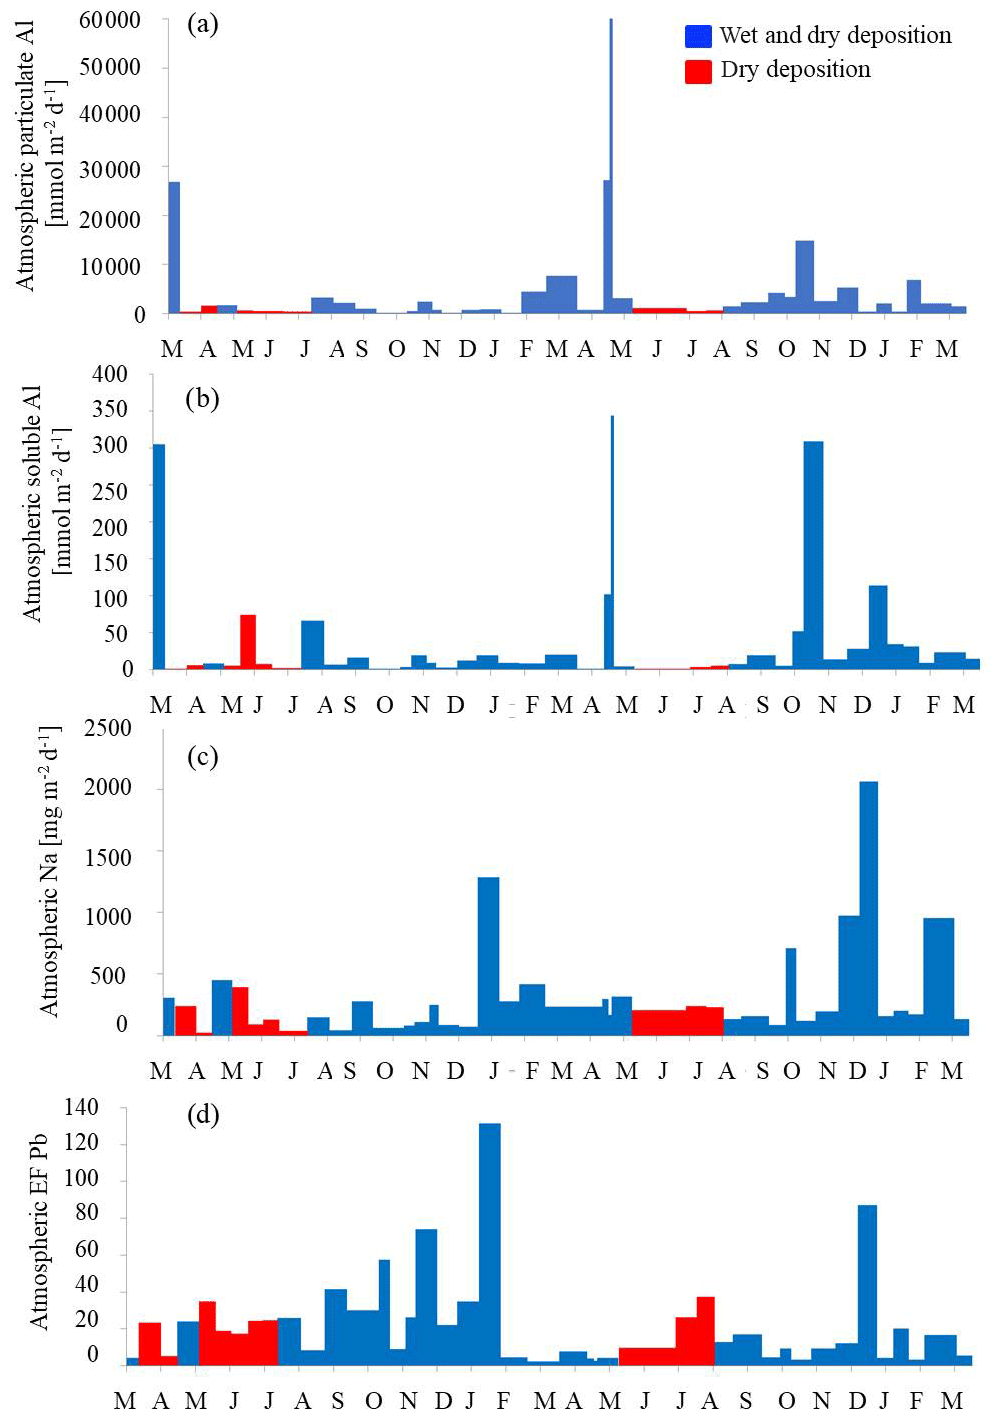
Figure 7Temporal dynamics of atmospheric particulate aluminum (a), soluble aluminum (b), soluble sodium (c), and the enrichment factor for lead (d). The month abbreviation and tick marks correspond to the end of the corresponding month. The width of the bar refers to the length of the sampling period.
4.1 DOC input from the atmosphere
The relationship between monthly precipitation rates and DOC fluxes confirmed the importance of rain events in the Med Sea (Djaoudi et al., 2018).
The total DOC annual input from the atmosphere (120.7 mmol C m−2 yr−1) found in this study is very close to that measured at Cap Ferrat peninsula (southern France) in 2006 (129 mmol C m−2 yr−1; Pulido-Villena et al., 2008) and in three lakes in the western Mediterranean basin (southern Spain, 153.3 mmol C m−2 yr−1 in 2005; De Vicente et al., 2012). This value is higher than deposition in the northwestern Med Sea (59 mmol C m−2 yr−1 in the Frioul archipelago, in the Bay of Marseille; Djaoudi et al., 2018). If the same sampling period is taken into consideration for both studies (from March 2015, the beginning of sampling on Lampedusa, to July 2016, the end of sampling in the Frioul archipelago), DOC input is 2 times higher on Lampedusa than in the Frioul archipelago. This variability is probably due to the different temporal and seasonal cycles of dry and wet deposition. In particular, the marked differences between the two sites could be influenced by the presence of a south–north-decreasing gradient in the intensity of the mineral dust deposition as proposed by Vincent et al. (2016). Our data also show high variability in DOC deposition rates without a clear seasonality. While in 2015 and 2016 the highest deposition rates were between spring and autumn, in 2017 the highest deposition rates were in winter. In addition, the two highest peaks observed in 2015 (Lmp02 and Lmp06, dry deposition) accounted together for 43 % of the annual DOC flux (52 mmol C m−2 yr−1). Depending on the origin and trajectories of the air masses, the atmosphere can carry significant amounts of DOC.
Assuming that the annual DOC flux from this study (120.7 mmol C m−2 yr−1) is valid for the whole Med Sea (area = 2.5×10¹² m2), we can estimate a total input of 3.64 Tg DOC yr−1. The global estimation for wet atmospheric DOC deposition is 306–580 Tg C yr−1, and the input to the global ocean ranges between 90 and 246 Tg C yr−1 (Willey et al., 2000; Kanakidou et al., 2012). The global dry deposition of organic carbon (OC) has been estimated to be 11 Tg C yr−1 (Jurado et al., 2008), leading to a total OC deposition to the oceans of 101–247 Tg C yr−1. The comparison of these estimates indicates that the Med Sea, with an area equivalent to only 0.7 % of the global oceans, receives 1.5 % to 4 % of the global atmospheric input of DOC.
It is noteworthy that our values are up to 6 times larger than the estimate of the total river input to the Med Sea (0.6–0.7 Tg DOC yr−1; Santinelli, 2015). These results confirm the leading role of atmosphere in the transport of allochthonous DOC to the Med Sea, as suggested recently by Santinelli et al. (2015) and Galletti et al. (2019).
A few episodes of Saharan outbreaks can strongly affect the annual dust flux, whereby a single outbreak can account for 40 %–80 % of the flux (Guerzoni et al., 1997). The most intense dust deposition events on Lampedusa generally display higher values in spring (March–June) and in autumn (Vincent et al., 2016; Bergametti et al., 1989; Loÿe-Pilot and Martin, 1996; Avila et al., 1997; Ternon et al., 2010). In this study, we show that although dust events can significantly contribute to the annual DOC fluxes, sea spray seems to be the dominant source of DOC in this area, which is in agreement with Mallet et al. (2019). The role of secondary organic aerosols as a source of organic matter in the Mediterranean Sea is well documented (Arndt et al., 2017; Michoud et al., 2017; Rinaldi et al., 2017) and could be relevant on Lampedusa. Finally, the correlation between monthly precipitation rates and DOC fluxes shows the importance of rain events as a source of DOC in the Med Sea, as proposed by Djaoudi et al. (2018).
4.2 Atmospheric DON and DOP input and elemental ratios
The annual DON flux (11.61 mmol N m−2 yr−1) observed on Lampedusa was lower than that measured in the Frioul archipelago (17.80 mmol N m−2 yr−1; Djaoudi et al., 2018). In the eastern Med Sea, Markaki et al. (2010) reported an annual DON flux of 18.49 mmol N m−2 yr−1, higher than that observed on Lampedusa. The comparison of our DOP deposition values (0.14 mmol P m−2 yr−1) with the few data reported in the literature shows that the fluxes on Lampedusa are markedly higher than those reported for the western Med Sea (0.07 mmol P m−2 yr−1, Djaoudi et al., 2018; 0.03 mmol P m−2 yr−1, Migon and Sandroni, 1999) but lower than those obtained by Violaki et al. (2018) for both the western (1.16 mmol P m−2 yr−1) and eastern (0.90 mmol P m−2 yr−1) Med Sea. The results from our study are very similar to those reported for the eastern Med Sea in 2001 and 2002 (0.15 mmol P m−2 yr−1; Markaki et al., 2010). Further, it is interesting to note that our DOP data are very similar to the TDP data reported for a rural coastal site in NE Spain in 2002–2003 (0.10–0.14 mmol P m−2 yr−1 in 17 months of sampling; Izquierdo et al., 2012).
Over the entire time series, the average DOP and DON contributions to TDP and TDN were 40 % and 26 %, respectively. These data confirm that a significant fraction of the dissolved P and N in the atmospheric deposition was in an organic form. These values are similar to those observed in previous studies in the Frioul archipelago (DOP: 40 %; DON: 25 %; Djaoudi et al., 2018) and in both the western and eastern Med Sea (DOP: 38 %; DON: 32 %; Markaki et al., 2010). The similarity among the depositions collected at the two sites (Lampedusa, in the central Med Sea, and the Frioul archipelago, in the northwestern Med Sea) suggests that the remote site of Lampedusa may be representative of DON and DOP deposition in the Med Sea, especially in the western basin.
The data on atmospheric elemental ratios show that each deposition event is characterized by a specific elemental ratio, suggesting a high variability in DOM composition and the presence of multiple sources. Djaoudi et al. (2018) observed an average value of DOC : DON : DOP molar ratios of 1228 : 308 : 1 in atmospheric DOM, collected in the northwestern Med Sea. In the surface Med Sea, the DOC : DON : DOP ratios range between 1050 : 84 : 1 in the western basin to 1560 : 120 : 1 in the eastern basin (Pujo-Pay et al., 2011). The average values observed in our atmospheric deposition time series (1909 : 292 : 1) indicate that atmospheric DOM is enriched in DOC and DON compared to marine DOM. This observation is also valid when comparing our values with those recently measured in marine samples collected at the MOOSE ANTARES offshore station (northwestern Med Sea; 1227 : 100 : 1; Djaoudi et al., 2018).
All the analyzed samples except for a few cases in summer 2016 are relative to dry + wet deposition (Table 1). Although the DON and DOP recorded during the dry period are generally on the low end of the measured range (Table 2), no information on the role played by wet or dry deposition in DON and DOP input to the Med Sea can be found at this stage due to the limited number of dry samples.
4.3 The contribution of Saharan dust to atmospheric fluxes of dissolved organic carbon
The input of Saharan dust can affect the chemistry of the Mediterranean aerosols and enrich the Med Sea with many elements (such as Co, Ni, and trace metals). Very few studies are available on the interactions between organic carbon and Saharan dust even though the organic material found in the troposphere is often associated with dust particles (Usher et al., 2003; Aymoz et al., 2004).
Our results show that Saharan dust events can represent a relevant, albeit intermittent, source of DOC to the central Med Sea. Focusing on the different peaks of DOC deposition, our results indicate that Lmp01, Lmp04, and Lmp25 are associated with a Saharan dust event and that aerosols were probably enriched with organic substances. We hypothesize that dust particles present in the aerosol adsorb organic molecules, facilitating their accumulation and transport (Usher et al., 2003). The role of Saharan dust in the transport of DOC is evident in Lmp25 (May 2016).
In addition, Lmp01 (end of March 2015), Lmp04 (May 2015), and Lmp25 (May 2016) show a seasonality that could be linked to the transport of pollen attached to desert particles in the spring events, and this pollen would contribute to atmospheric DOC input in spring (end of March–May). Pollen originating in Morocco was detected in southern Spain (Cabezudo et al., 1997), and various pollen types (Cannabis, Cupressus, Pinus, Platanus, and Sambucus) were observed in Cordoba (southern Spain) exclusively during African dust events (Cariñanos et al., 2004). This process would not occur in the other seasons (winter and autumn, with no pollen production).
If all the Saharan dust deposition events (red and yellow in Fig. 6) are taken into account, an input of 49.58 mmol DOC m−2 to Lampedusa can be estimated, representing ∼41 % of the total DOC flux for the entire sampling period. The strong dust events (red in Fig. 6) lead to a flux of 15.26 mmol DOC m−2, representing 13 % of the total flux. Each deposition event must be considered individually as DOC content depends on the aerosol load (Formenti et al., 2003; Aymoz et al., 2004).
Wet deposition is the main driver of Saharan dust deposition to the Med Sea. However, dry deposition can also be important (Guerzoni et al., 1997), and its relative contribution strongly depends on meteorological conditions and local emission (Inomata et at., 2009). Some models have estimated that wet deposition represents up to 75 %–95 % of total deposition (Iavorivska et al., 2016). While our results confirm the importance of wet deposition, they also stress the relevance of dry deposition (32 % of the total deposition during the entire sampling period), which appears to be the main contributor of DOC and of other chemical species to the remote site of Lampedusa, as suggested by Morales-Baquero et al. (2013).
It is also evident that Saharan dust input is not always associated with high DOC input, as seen in Lmp34, with a high concentration of dust but with a low DOC concentration. Conversely, several samples (for example Lmp02, Lmp33, and Lmp37) characterized by high concentrations of DOC do not show high crustal content. Indeed, high DOC deposition events seem to be often associated with sea spray transport, (Lmp02, Lmp10, Lmp12, Lmp33, and Lmp37; Fig. 6). Similarly, samples Lmp01, Lmp04, Lmp10, Lmp12, and especially Lmp25 also show a large contribution of sea spray aerosol, indicating a marine source for the DOC in these samples. This is a surprising result because other studies (e.g., Pace et al., 2006) have shown that clean marine-aerosol conditions are rare on Lampedusa.
Lmp23, Lmp27, Lmp32, Lmp35, and Lmp36 were not characterized by high DOC fluxes (Fig. 6) even if these sampling periods were characterized by at least one strong Saharan dust event (Fig. 6, in yellow). This observation supports the hypothesis that Saharan dust is not typically enriched with DOC, but it adsorbs organic molecules in the atmosphere and, depending on its route, can be enriched or not in DOC. The composition of sample Lmp34 further supports this hypothesis, with the third-highest average nss Ca value (1092.2 ng m−3) but with a DOC concentration (0.20 mmol DOC m−2 d−1) below the daily average flux of the entire sampling period (0.33 mmol DOC m−2 d−1; Fig. 6, Tables 2 and 4).
Lastly, it is interesting to note that samples characterized by high values of DOC never present high EF(Pb) values. Samples presenting EF(Pb) > 10 show very low DOC concentrations, indicating a small DOC contribution from anthropogenic aerosols on Lampedusa.
4.4 Implications for marine ecosystem
The measurements carried out on the island of Lampedusa clearly show that the atmosphere is an important source of allochthonous DOC for the central Med Sea. There is still little information on biological lability of atmospheric DOC; if it is biologically available, it can be used very quickly by marine prokaryotic heterotrophs, and it can be channeled into the food web, whereas if it is mainly recalcitrant, it can accumulate and be transported by water mass circulation.
A conceptual exercise can be made in order to give an estimate of the implications of DOM deposition for the marine ecosystem. According to D'Ortenzio et al. (2005), mixed-layer depth (MLD) ranges between 15 and 30 m close to the island of Lampedusa. Santinelli et al. (2012) observed an average mixed-layer DOC concentration of 60 µM in the same area in September 1999 and estimated a bacterial carbon demand (BCD) of 0.32 µM C d−1 (assuming a bacterial growth efficiency of 15 %), which represents the total amount of carbon needed to support the observed bacterial production. In September, the atmospheric DOC flux was 0.24 mmol C m−2 d−1 in 2015 and 0.38 mmol C m−2 d−1 in 2016. Dividing the atmospheric deposition by the average MLD (22.5 m; D'Ortenzio et al., 2005), we estimate that the atmospheric input contributes to a 0.011–0.017 µM DOC d−1 increase in the mixed layer. Assuming that the values of BCD observed in September 1999 (0.32 µM C d−1) are also valid for September 2015 and 2016 and that all the DOC coming from the atmosphere is labile, it could satisfy 3 %–5 % of the daily BCD. During summer the MLD varies between 10 and 15 m depth, with an average value of 12.5 m (D'Ortenzio et al., 2005). The DOC input from the atmosphere is expected to increase the DOC concentration in the mixed layer by 0.008–0.079 µM C d−1 from June to August 2015 and by 0.013–0.014 µM C d−1 from June to August 2016, supplying 3 %–25 % of the daily BCD, assuming similar DOC concentrations and bacterial activity as during September. Even if we are aware that these assumptions are hardly met, in particular the estimate of DOC input to the whole Med Sea, based on the data collected on Lampedusa we think that these calculations can give an idea of the relevant role that the atmospheric input of DOC can play in sustaining heterotrophic prokaryote productivity in the surface layer, particularly when the upper water column is strongly stratified.
The Mediterranean MLD seasonal variability is characterized by a basin scale deepening from November to March and an abrupt stratification in April, which is maintained throughout the summer and early autumn. Even if these estimates stress the potential role of atmospheric DOC in sustaining bacterial productivity in the surface ocean, a time series of BCD, MLD, and DOC concentrations in the surface layer, together with a network of stations for the quantification of atmospheric input of DOC in the different areas of the Med Sea, is mandatory in order to have an accurate estimate of the impact of atmospheric DOC on the functioning of the marine ecosystem. It should also be noted that a fraction of atmospheric DOC could be recalcitrant, and through transport to depth, it could play a key role in carbon sequestration. The refractory nature of a part of atmospheric DOM has been proposed by Sánchez-Pérez et al. (2016) based on 2-year time series data on fluorescent DOM (FDOM) deposition in the northwestern Med Sea (Barcelona coastal area, Spain). Their results show that atmospheric inputs induced changes in the quality of organic matter, increasing the proportion of FDOM substances in the DOM pool. Incubation experiments to investigate the biological lability of atmospheric DOC are also crucial to better understanding the impact of atmospheric deposition on marine ecosystems.
Finally, the occurrence of Saharan dust events opens interesting considerations on their impact on the marine environment. Previous studies have suggested that dust inputs can promote autotrophic production (Ridame and Guieu, 2002; Markaki et al., 2003). Instead, Pulido-Villena et al. (2008) experimentally found that heterotrophic bacteria can reduce the amount of C exported to deeper waters because a Saharan dust event would have induced the mineralization of 22 %–70 % of bioavailable DOC, changing carbon sequestration.
Our data show that atmospheric input has a larger impact on the Med Sea than on the global ocean, and DOC fluxes from the atmosphere to the Med Sea can be up to 6 times larger than riverine input.
Organic substances transported by Saharan dust on Lampedusa are primarily of natural origin, in particular from sea spray. Saharan dust can be an important carrier of organic substances. However, the load of DOC associated with dust is highly variable, and high DOC fluxes were also observed in the absence of dust deposition events.
Atmospheric C : N : P molar ratios indicate that DOM is enriched in DOC and DON with respect to marine DOM, and the contribution of atmospheric deposition to the marine DOM stoichiometry in the Med Sea could be relevant, in particular during stratified periods.
Further studies are needed to understand the link between atmospheric inputs and marine biogeochemistry. Data on stable carbon (δ13C) in atmospheric DOC would be crucial in order to gain information about its main sources. Incubation experiments should be carried out with aerosol both rich and poor in DOC in order to better understand how the microbial community can respond to dust input. Further studies are also needed to understand the link between aerosol origin and DOM concentration and quality and to comprehend the potential link between DOC and pollen during the spring. Lastly, longer time series combined with a modeling effort would provide a solid base to assess the response of DOM dynamics in the Med Sea to changes in aerosol deposition pattern due to the effect of climate change.
The dataset generated for this study is available on request from the corresponding author.
YG and CS conceived the study and the sampling design. YG, SB, and DMS collected the samples. YG, MG, SB, RT, and SV analyzed the samples. YG, CS, EPV, and AdS analyzed the data, and all authors assisted with data discussion and contributed to the revision and editing of the final manuscript. All authors are aware of and accept responsibility for this paper and have approved the final submitted manuscript.
The authors declare that they have no conflict of interest.
This article is part of the special issue “Atmospheric deposition in the low-nutrient–low-chlorophyll (LNLC) ocean: effects on marine life today and in the future (ACP/BG inter-journal SI)”. It is not associated with a conference.
The authors thank the analytical platform PACEM (Mediterranean Institute of Oceanography) for the analysis of organic and inorganic forms of nitrogen. Contributions from Lorenzo De Silvestri and Francesco Monteleone are gratefully acknowledged.
Part of this research was supported by the “Professionalità” project, funded by the Fondazione Banca del Monte di Lombardia.
This paper was edited by Christine Klaas and reviewed by two anonymous referees.
Armstrong, F. A. J., Williams, P. M., and Strickland, J. H.: Photo-oxidation of organic matter in sea water by ultra-violet radiation, analytical and other applications, Nature, 211, 481–483, https://doi.org/10.1038/211481a0, 1966.
Aminot, A. and Kérouel, R.: Dosage automatique des nutriments dans les eaux marines: méthodes en flux continu, Editions Quae, Ifremer, France, 188 pp., 2007.
Arndt, J., Sciare, J., Mallet, M., Roberts, G. C., Marchand, N., Sartelet, K., Sellegri, K., Dulac, F., Healy, R. M., and Wenger, J. C.: Sources and mixing state of summertime background aerosol in the north-western Mediterranean basin, Atmos. Chem. Phys., 17, 6975–7001, https://doi.org/10.5194/acp-17-6975-2017, 2017.
Avila, A., Queralt-Mitjans, I., and Alarcón, M.: Mineralogical composition of African dust delivered by red rains over northeastern Spain, J. Geophys. Res.-Atmos., 102, 21977–21996, https://doi.org/10.1029/97JD00485, 1997.
Aymoz, G., Jaffrezo, J.-L., Jacob, V., Colomb, A., and George, Ch.: Evolution of organic and inorganic components of aerosol during a Saharan dust episode observed in the French Alps, Atmos. Chem. Phys., 4, 2499–2512, https://doi.org/10.5194/acp-4-2499-2004, 2004.
Becagli, S., Ghedini, C., Peeters, S., Rottiers, A., Traversi, R., Udisti, R., Chiari, M., Jalba, A., Despiau, S., Dayan, U., and Temara, A.: MBAS (Methylene Blue Active Substances) and LAS (Linear Alkylbenzene Sulphonates) in Mediterranean coastal aerosols: sources and transport processes, Atmos. Environ., 45, 6788–6801, https://doi.org/10.1016/j.atmosenv.2011.04.041, 2011.
Becagli, S., Sferlazzo, D. M., Pace, G., di Sarra, A., Bommarito, C., Calzolai, G., Ghedini, C., Lucarelli, F., Meloni, D., Monteleone, F., Severi, M., Traversi, R., and Udisti, R.: Evidence for heavy fuel oil combustion aerosols from chemical analyses at the island of Lampedusa: a possible large role of ships emissions in the Mediterranean, Atmos. Chem. Phys., 12, 3479–3492, https://doi.org/10.5194/acp-12-3479-2012, 2012.
Becagli, S., Lazzara, L., Fani, F., Marchese, C., Traversi, R., Severi, M., di Sarra, A., Sferlazzo, D. M., Piacentino, S., Bommarito, C., Dayan, U., and Udisti, R.: Relationship between methanesulfonate (MS−) in atmospheric particulate and remotely sensed phytoplankton activity in oligo-mesotrophic central Mediterranean Sea, Atmos. Environ., 79, 681–688, https://doi.org/10.1016/j.atmosenv.2013.07.032, 2013.
Becagli, S., Anello, F., Bommarito, C., Cassola, F., Calzolai, G., Di Iorio, T., di Sarra, A., Gómez-Amo, J.-L., Lucarelli, F., Marconi, M., Meloni, D., Monteleone, F., Nava, S., Pace, G., Severi, M., Sferlazzo, D. M., Traversi, R., and Udisti, R.: Constraining the ship contribution to the aerosol of the central Mediterranean, Atmos. Chem. Phys., 17, 2067–2084, https://doi.org/10.5194/acp-17-2067-2017, 2017.
Bergametti, G., Dutot, A. L., Buat-Menard, P., Losno, R., and Remoudaki, E.: Seasonal variability of the elemental composition of atmospheric aerosol particles over the northwestern Mediterranean, Tellus B, 41, 353–361, https://doi.org/10.1111/j.1600-0889.1989.tb00314.x, 1989.
Cabezudo, B., Recio, M., Sánchez-Laulhé, J., Trigo, M. D. M., Toro, F. J., and Polvorinos, F.: Atmospheric transportation of marihuana pollen from North Africa to the southwest of Europe, Atmos. Environ., 31, 3323–3328, https://doi.org/10.1016/S1352-2310(97)00161-1, 1997.
Calzolai, G., Nava, S., Lucarelli, F., Chiari, M., Giannoni, M., Becagli, S., Traversi, R., Marconi, M., Frosini, D., Severi, M., Udisti, R., di Sarra, A., Pace, G., Meloni, D., Bommarito, C., Monteleone, F., Anello, F., and Sferlazzo, D. M.: Characterization of PM10 sources in the central Mediterranean, Atmos. Chem. Phys., 15, 13939–13955, https://doi.org/10.5194/acp-15-13939-2015, 2015.
Cariñanos, P., Galan, C., Alcázar, P., and Domínguez, E.: Airborne pollen records response to climatic conditions in arid areas of the Iberian Peninsula, Environ. Exp. Bot., 52, 11–22, https://doi.org/10.1016/j.envexpbot.2003.11.008, 2004.
Decina, S. M., Templer, P. H., and Hutyra, L. R.: Atmospheric inputs of nitrogen, carbon, and phosphorus across an urban area: Unaccounted fluxes and canopy influences, Earth's Future, 6, 134–148, https://doi.org/10.1002/2017EF000653, 2018.
de Vicente, I., Ortega-Retuerta, E., Morales-Baquero, R., and Reche, I.: Contribution of dust inputs to dissolved organic carbon and water transparency in Mediterranean reservoirs, Biogeosciences, 9, 5049–5060, https://doi.org/10.5194/bg-9-5049-2012, 2012.
Djaoudi, K., Van Wambeke, F., Barani, A., Hélias-Nunige, S., Sempéré, R., and Pulido-Villena, E.: Atmospheric fluxes of soluble organic C, N, and P to the Mediterranean Sea: Potential biogeochemical implications in the surface layer, Prog. Oceanogr., 163, 59–69, https://doi.org/10.1016/j.pocean.2017.07.008, 2018.
D'Ortenzio, F., Iudicone, D., de Boyer Montegut, C., Testor, P., Antoine, D., Marullo, S., Santoleri, R., and Madec, G.: Seasonal variability of the mixed layer depth in the Mediterranean Sea as derived from in situ profiles, Geophys. Res. Lett., 32, L12605, https://doi.org/10.1029/2005GL022463, 2005.
Economou, C. and Mihalopoulos, N.: Formaldehyde in the rainwater in the eastern Mediterranean: occurrence, deposition and contribution to organic carbon budget, Atmos. Environ., 36, 1337–1347, https://doi.org/10.1016/S1352-2310(01)00555-6, 2002.
Formenti, P., Elbert, W., Maenhaut, W., Haywood, J., Osborne, S., and Andreae, M. O.: Inorganic and carbonaceous aerosols during the Southern African Regional Science Initiative (SAFARI 2000) experiment: Chemical characteristics, physical properties, and emission data for smoke from African biomass burning, J. Geophys. Res.-Atmos., 108, 8488, https://doi.org/10.1029/2002JD002408, 2003.
Galletti, Y., Gonnelli, M., Retelletti Brogi, S., Vestri, S., and Santinelli, C.: DOM dynamics in open waters of the Mediterranean Sea: New insights from optical properties, Deep-Sea Res. Pt. I, 144, 95–114, https://doi.org/10.1016/j.dsr.2019.01.007, 2019.
Goudie, A. S. and Middleton, N. J.: Saharan dust storms: nature and consequences, Earth-Sci. Rev., 56, 179–204, https://doi.org/10.1016/S0012-8252(01)00067-8, 2001.
Guerzoni, S. and Chester, R. (Eds.): The impact of desert dust across the Mediterranean, Vol. 11, Springer Science & Business Media, the Netherlands, 1996.
Guerzoni, S., Molinaroli, E., and Chester, R.: Saharan dust inputs to the western Mediterranean Sea: depositional patterns, geochemistry and sedimentological implications, Deep-Sea Res. Pt. II, 44, 631–654, https://doi.org/10.1016/S0967-0645(96)00096-3, 1997.
Hansell, D. A.: Dissolved organic carbon reference material program, EOS T. Am. Geophys. Un., 86, 318–318, https://doi.org/10.1029/2005EO350003, 2005.
Henderson, P. and Henderson, G. M. (Eds.): The Cambridge Handbook of Earth Science Data, University Press, Cambridge, 2009.
Herut, B., Collier, R., and Krom, M. D.: The role of dust in supplying nitrogen and phosphorus to the South East Mediterranean, Limnol. Oceanogr., 47, 870–878, https://doi.org/10.4319/lo.2002.47.3.0870, 2002.
Iavorivska, L., Boyer, E. W., and DeWalle, D. R.: Atmospheric deposition of organic carbon via precipitation, Atmos. Environ., 146, 153–163, https://doi.org/10.1016/j.atmosenv.2016.06.006, 2016.
Inomata, Y., Igarashi, Y., Chiba, M., Shinoda, Y., and Takahashi, H.: Dry and wet deposition of water-insoluble dust and water-soluble chemical species during spring 2007 in Tsukuba, Japan, Atmos. Environ., 43, 4503–4512, https://doi.org/10.1016/j.atmosenv.2009.06.048, 2009.
IPCC: Climate change: mitigation of climate change, in: Contribution of working group III to the fifth assessment report of the intergovernmental panel on climate change, edited by: Edenhofer, O., Pichs-Madruga, R., Sokona, Y., Farahani, E., Kadner, S., Seyboth, K., Adler, A., Baum, I., Brunner, S., Eickemeier, P., Kriemann, B., Savolainen, J., Schlömer, S., von Stechow, C., Zwickel, T., and Minx, J. C., Cambridge University Press, Cambridge, 2014.
Izquierdo, R., Benítez-Nelson, C. R., Masqué, P., Castillo, S., Alastuey, A., and Àvila, A.: Atmospheric phosphorus deposition in a near-coastal rural site in the NE Iberian Peninsula and its role in marine productivity, Atmos. Environ., 49, 361–370, https://doi.org/10.1016/j.atmosenv.2011.11.007, 2012.
Jurado, E., Dachs, J., Duarte, C. M., and Simo, R.: Atmospheric deposition of organic and black carbon to the global oceans, Atmos. Environ., 42, 7931–7939, https://doi.org/10.1016/j.atmosenv.2008.07.029, 2008.
Kanakidou, M., Duce, R. A., Prospero, J. M., Baker, A. R., Benitez-Nelson, C., Dentener, F. J., Hunter, K. A., Liss, P. S., Mahowald, N., Okin, G. S., Sarin, M., Tsigaridis, K., Uematsu, M., Zamora, L. M., and Zhu, T.: Atmospheric fluxes of organic N and P to the global ocean, Global Biogeochem. Cy., 26, GB3026, https://doi.org/10.1029/2011GB004277, 2012.
Lai, A. M., Shafer, M. M., Dibb, J. E., Polashenski, C. M., and Schauer, J. J.: Elements and inorganic ions as source tracers in recent Greenland snow, Atmos. Environ., 164, 205–215, 2017.
Loÿe-Pilot, M. D. and Martin, J. M. (Eds.): Saharan dust input to the western Mediterranean: an eleven years record in Corsica, in: The impact of desert dust across the Mediterranean, 191–199, Springer, Dordrecht, 1996.
Mallet, M. D., D'Anna, B., Même, A., Bove, M. C., Cassola, F., Pace, G., Desboeufs, K., Di Biagio, C., Doussin, J.-F., Maille, M., Massabò, D., Sciare, J., Zapf, P., di Sarra, A. G., and Formenti, P.: Summertime surface PM1 aerosol composition and size by source region at the Lampedusa island in the central Mediterranean Sea, Atmos. Chem. Phys., 19, 11123–11142, https://doi.org/10.5194/acp-19-11123-2019, 2019.
Marconi, M., Sferlazzo, D. M., Becagli, S., Bommarito, C., Calzolai, G., Chiari, M., di Sarra, A., Ghedini, C., Gómez-Amo, J. L., Lucarelli, F., Meloni, D., Monteleone, F., Nava, S., Pace, G., Piacentino, S., Rugi, F., Severi, M., Traversi, R., and Udisti, R.: Saharan dust aerosol over the central Mediterranean Sea: PM10 chemical composition and concentration versus optical columnar measurements, Atmos. Chem. Phys., 14, 2039–2054, https://doi.org/10.5194/acp-14-2039-2014, 2014.
Markaki, Z., Oikonomou, K., Kocak, M., Kouvarakis, G., Chaniotaki, A., Kubilay, N., and Mihalopoulos, N.: Atmospheric deposition of inorganic phosphorus in the Levantine Basin, eastern Mediterranean: Spatial and temporal variability and its role in seawater productivity, Limnol. Oceanogr., 48, 1557–1568, https://doi.org/10.4319/lo.2003.48.4.1557, 2003.
Markaki, Z., Loÿe-Pilot, M. D., Violaki, K., Benyahya, L., and Mihalopoulos, N.: Variability of atmospheric deposition of dissolved nitrogen and phosphorus in the Mediterranean and possible link to the anomalous seawater N∕P ratio, Mar. Chem., 120, 187–194, https://doi.org/10.1016/j.marchem.2008.10.005, 2010.
Mermex group: White book of Mermex program, Prog. Oceanogr., 91, 97–166, https://doi.org/10.1016/j.pocean.2011.02.003, 2011.
Michoud, V., Sciare, J., Sauvage, S., Dusanter, S., Léonardis, T., Gros, V., Kalogridis, C., Zannoni, N., Féron, A., Petit, J.-E., Crenn, V., Baisnée, D., Sarda-Estève, R., Bonnaire, N., Marchand, N., DeWitt, H. L., Pey, J., Colomb, A., Gheusi, F., Szidat, S., Stavroulas, I., Borbon, A., and Locoge, N.: Organic carbon at a remote site of the western Mediterranean Basin: sources and chemistry during the ChArMEx SOP2 field experiment, Atmos. Chem. Phys., 17, 8837–8865, https://doi.org/10.5194/acp-17-8837-2017, 2017.
Migon, C. and Sandroni, V.: Phosphorus in rainwater: Partitioning inputs and impact on the surface coastal ocean, Limnol. Oceanogr., 44, 1160–1165, https://doi.org/10.4319/lo.1999.44.4.1160, 1999.
Migon, C., Copin-Montegut, G., Elegant, L., and Morelli, J.: Atmospheric input of nutrients to the coastal Mediterranean area, Biogeochemical implications, Oceanol. Acta, 12, 187–191, 1989.
Morales-Baquero, R., Pulido-Villena, E., and Reche, I.: Chemical signature of Saharan dust on dry and wet atmospheric deposition in the south-western Mediterranean region, Tellus B, 65, 18720, https://doi.org/10.3402/tellusb.v65i0.18720, 2013.
Murphy, J. and Riley, J. P.: A modified single solution method for the determination of phosphate in natural water, Anal. Chim. Acta, 27, 31–36, https://doi.org/10.1016/S0003-2670(00)88444-5, 1962.
Pace, G., Meloni, D., and di Sarra, A.: Forest fire aerosol over the Mediterranean basin during summer 2003, J. Geophys. Res., 110, D21202, https://doi.org/10.1029/2005JD005986, 2005.
Pace, G., di Sarra, A., Meloni, D., Piacentino, S., and Chamard, P.: Aerosol optical properties at Lampedusa (Central Mediterranean). 1. Influence of transport and identification of different aerosol types, Atmos. Chem. Phys., 6, 697–713, https://doi.org/10.5194/acp-6-697-2006, 2006.
Prospero, J. M., Blades, E., Mathison, G., and Naidu, R.: Interhemispheric transport of viable fungi and bacteria from Africa to the Caribbean with soil dust, Aerobiologia, 21, 1–19, https://doi.org/10.1007/s10453-004-5872-7, 2005.
Pujo-Pay, M., Conan, P., and Raimbault, P.: Excretion of dissolved organic nitrogen by phytoplankton assessed by wet oxidation and 15N tracer procedures, Mar. Ecol.-Prog. Ser., 153, 99–111, https://doi.org/10.3354/meps153099, 1997.
Pujo-Pay, M., Conan, P., Oriol, L., Cornet-Barthaux, V., Falco, C., Ghiglione, J.-F., Goyet, C., Moutin, T., and Prieur, L.: Integrated survey of elemental stoichiometry (C, N, P) from the western to eastern Mediterranean Sea, Biogeosciences, 8, 883–899, https://doi.org/10.5194/bg-8-883-2011, 2011
Pulido-Villena, E., Wagener, T., and Guieu, C.: Bacterial response to dust pulses in the western Mediterranean: Implications for carbon cycling in the oligotrophic ocean, Global Biogeochem. Cy., 22, GB1020, https://doi.org/10.1029/2007GB003091, 2008.
Ridame, C. and Guieu, C.: Saharan input of phosphate to the oligotrophic water of the open western Mediterranean Sea, Limnol. Oceanogr., 47, 856–869, https://doi.org/10.4319/lo.2002.47.3.0856, 2002.
Rinaldi, M., Gilardoni, S., Paglione, M., Sandrini, S., Decesari, S., Zanca, N., Marinoni, A., Cristofanelli, P., Bonasoni, P., and Ielpo, P.: Physico-chemical characterization of Mediterranean background aerosol at the Capogranitola observatory (Sicily), Geophys. Res. Abstr., EGU2017-3161, EGU General Assembly 2017, Vienna, Austria, 2017
Rodríguez, S., Alastuey, A., Alonso-Pérez, S., Querol, X., Cuevas, E., Abreu-Afonso, J., Viana, M., Pérez, N., Pandolfi, M., and de la Rosa, J.: Transport of desert dust mixed with North African industrial pollutants in the subtropical Saharan Air Layer, Atmos. Chem. Phys., 11, 6663–6685, https://doi.org/10.5194/acp-11-6663-2011, 2011.
Sánchez-Pérez, E. D., Marín, I., Nunes, S., Fernández-González, L., Peters, F., Pujo-Pay, M., Conan, P., and Marrasé, C.: Aerosol inputs affect the optical signatures of dissolved organic matter in NW Mediterranean coastal waters, Sci. Mar., 80, 437–446, https://doi.org/10.3989/scimar.04318.20B, 2016.
Santinelli, C.: DOC in the Mediterranean Sea, in: Biogeochemestry of Marine Dissolved Organic Matter, edited by: Hansell, D. A. and Carlson, C. A., 2nd Edn., Academic Press, San Diego, 579–608, https://doi.org/10.1016/B978-0-12-405940-5.00013-3, 2015.
Santinelli, C., Sempéré, R., Van Wambeke, F., Charriere, B., and Seritti, A.: Organic carbon dynamics in the Mediterranean Sea: An integrated study, Global Biogeochem. Cy., 26, GB4004, https://doi.org/10.1029/2011GB004151, 2012.
Santinelli, C., Follett, C., Brogi, S. R., Xu, L., and Repeta, D.: Carbon isotope measurements reveal unexpected cycling of dissolved organic matter in the deep Mediterranean Sea, Mar. Chem., 177, 267–277, https://doi.org/10.1016/j.marchem.2015.06.018, 2015.
Sellitto, P., Zanetel, C., di Sarra, A., Salerno, G., Tapparo, A., Meloni, D., Pace, G., Caltabiano, T., Briole, P., and Legras, B.: The impact of Mount Etna sulfur emissions on the atmospheric composition and aerosol properties in the central Mediterranean: a statistical analysis over the period 2000–2013 based on observations and Lagrangian modelling, Atmos. Environ., 148, 77–88, 2017.
Ternon, E., Guieu, C., Loÿe-Pilot, M.-D., Leblond, N., Bosc, E., Gasser, B., Miquel, J.-C., and Martín, J.: The impact of Saharan dust on the particulate export in the water column of the North Western Mediterranean Sea, Biogeosciences, 7, 809–826, https://doi.org/10.5194/bg-7-809-2010, 2010.
Usher, C. R., Michel, A. E., and Grassian, V. H.: Reactions on mineral dust, Chem. Rev., 103, 4883–4940, 2003.
Vincent, J., Laurent, B., Losno, R., Bon Nguyen, E., Roullet, P., Sauvage, S., Chevaillier, S., Coddeville, P., Ouboulmane, N., di Sarra, A. G., Tovar-Sánchez, A., Sferlazzo, D., Massanet, A., Triquet, S., Morales Baquero, R., Fornier, M., Coursier, C., Desboeufs, K., Dulac, F., and Bergametti, G.: Variability of mineral dust deposition in the western Mediterranean basin and south-east of France, Atmos. Chem. Phys., 16, 8749–8766, https://doi.org/10.5194/acp-16-8749-2016, 2016.
Violaki, K., Bourrin, F., Aubert, D., Kouvarakis, G., Delsaut, N., and Mihalopoulos, N.: Organic phosphorus in atmospheric deposition over the Mediterranean Sea: An important missing piece of the phosphorus cycle, Prog. Oceanogr., 163, 50–58, https://doi.org/10.1016/j.pocean.2017.07.009, 2018.
Willey, J. D., Kieber, R. J., Eyman, M. S., and Avery, G. B.: Rainwater dissolved organic carbon: concentrations and global flux, Global Biogeochem. Cy., 14, 139–148, https://doi.org/10.1029/1999GB900036, 2000.
Yan, G. and Kim, G.: Dissolved organic carbon in the precipitation of Seoul, Korea: Implications for global wet depositional flux of fossil-fuel derived organic carbon, Atmos. Environ., 59, 117–124, https://doi.org/10.1016/j.atmosenv.2012.05.044, 2012.